Smart CEI Moncloa: An IoT-based Platform for People Flow and Environmental Monitoring on a Smart University Campus


Abstract

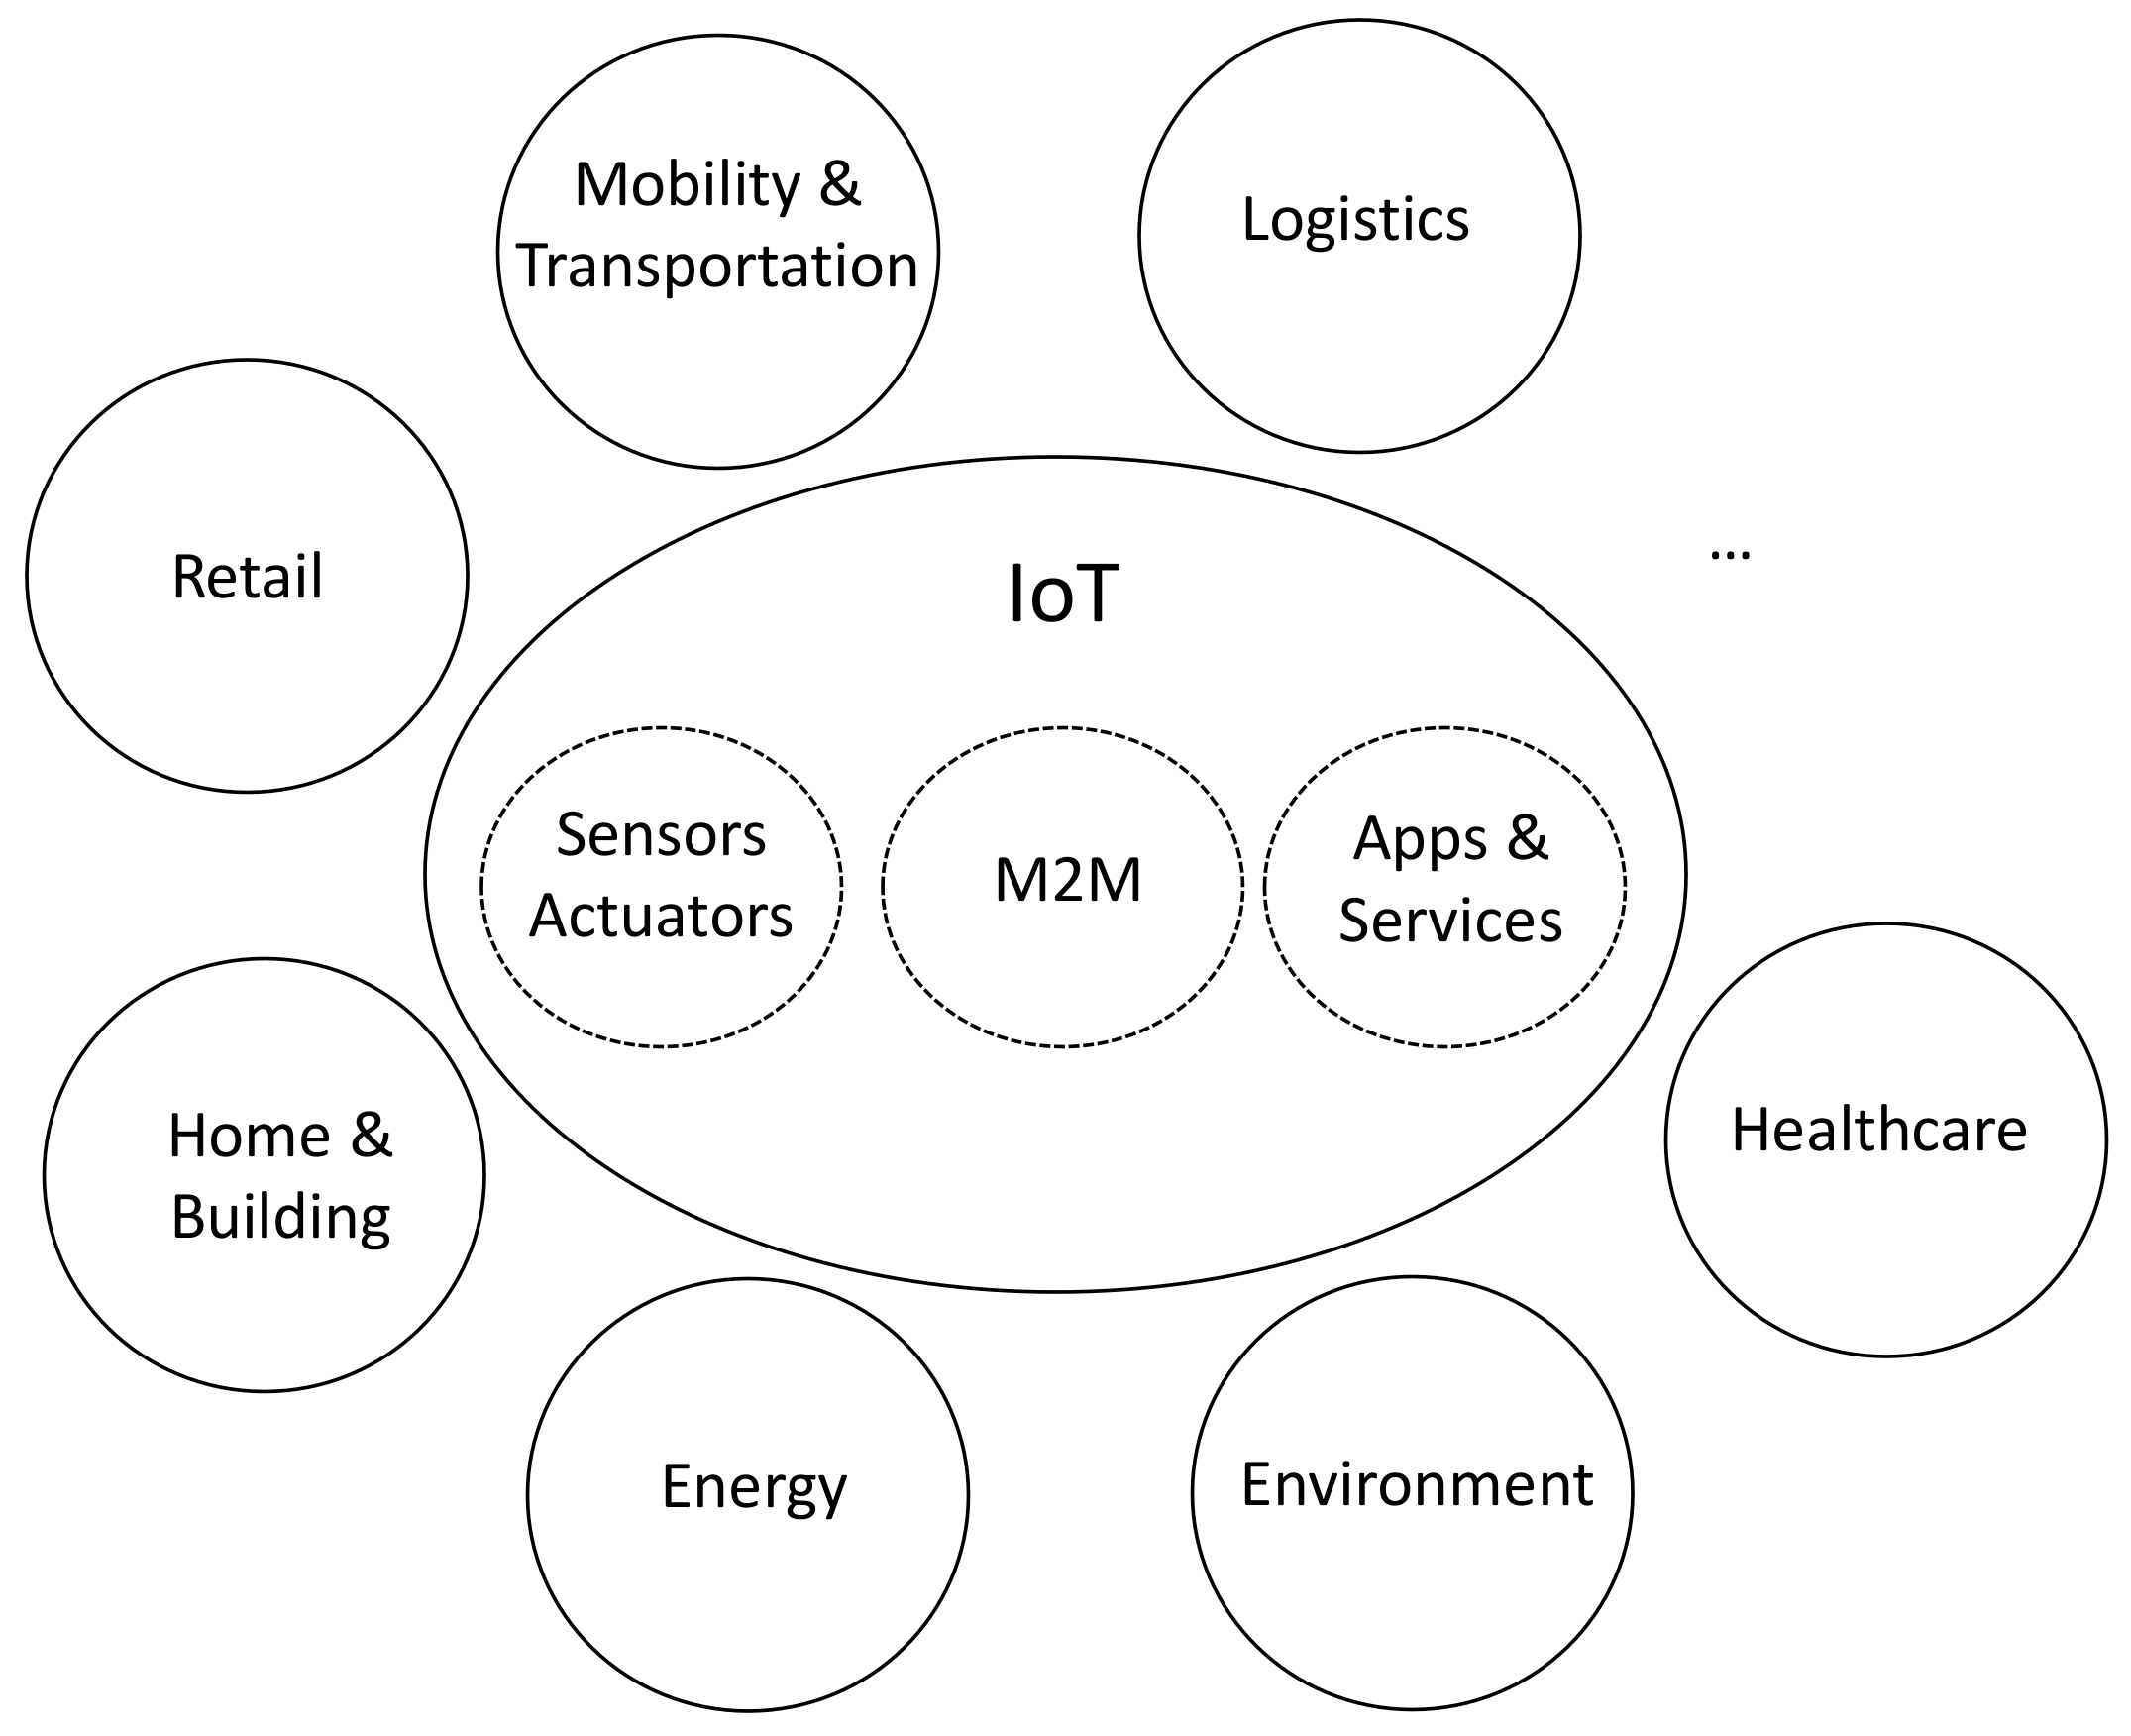
1. Introduction
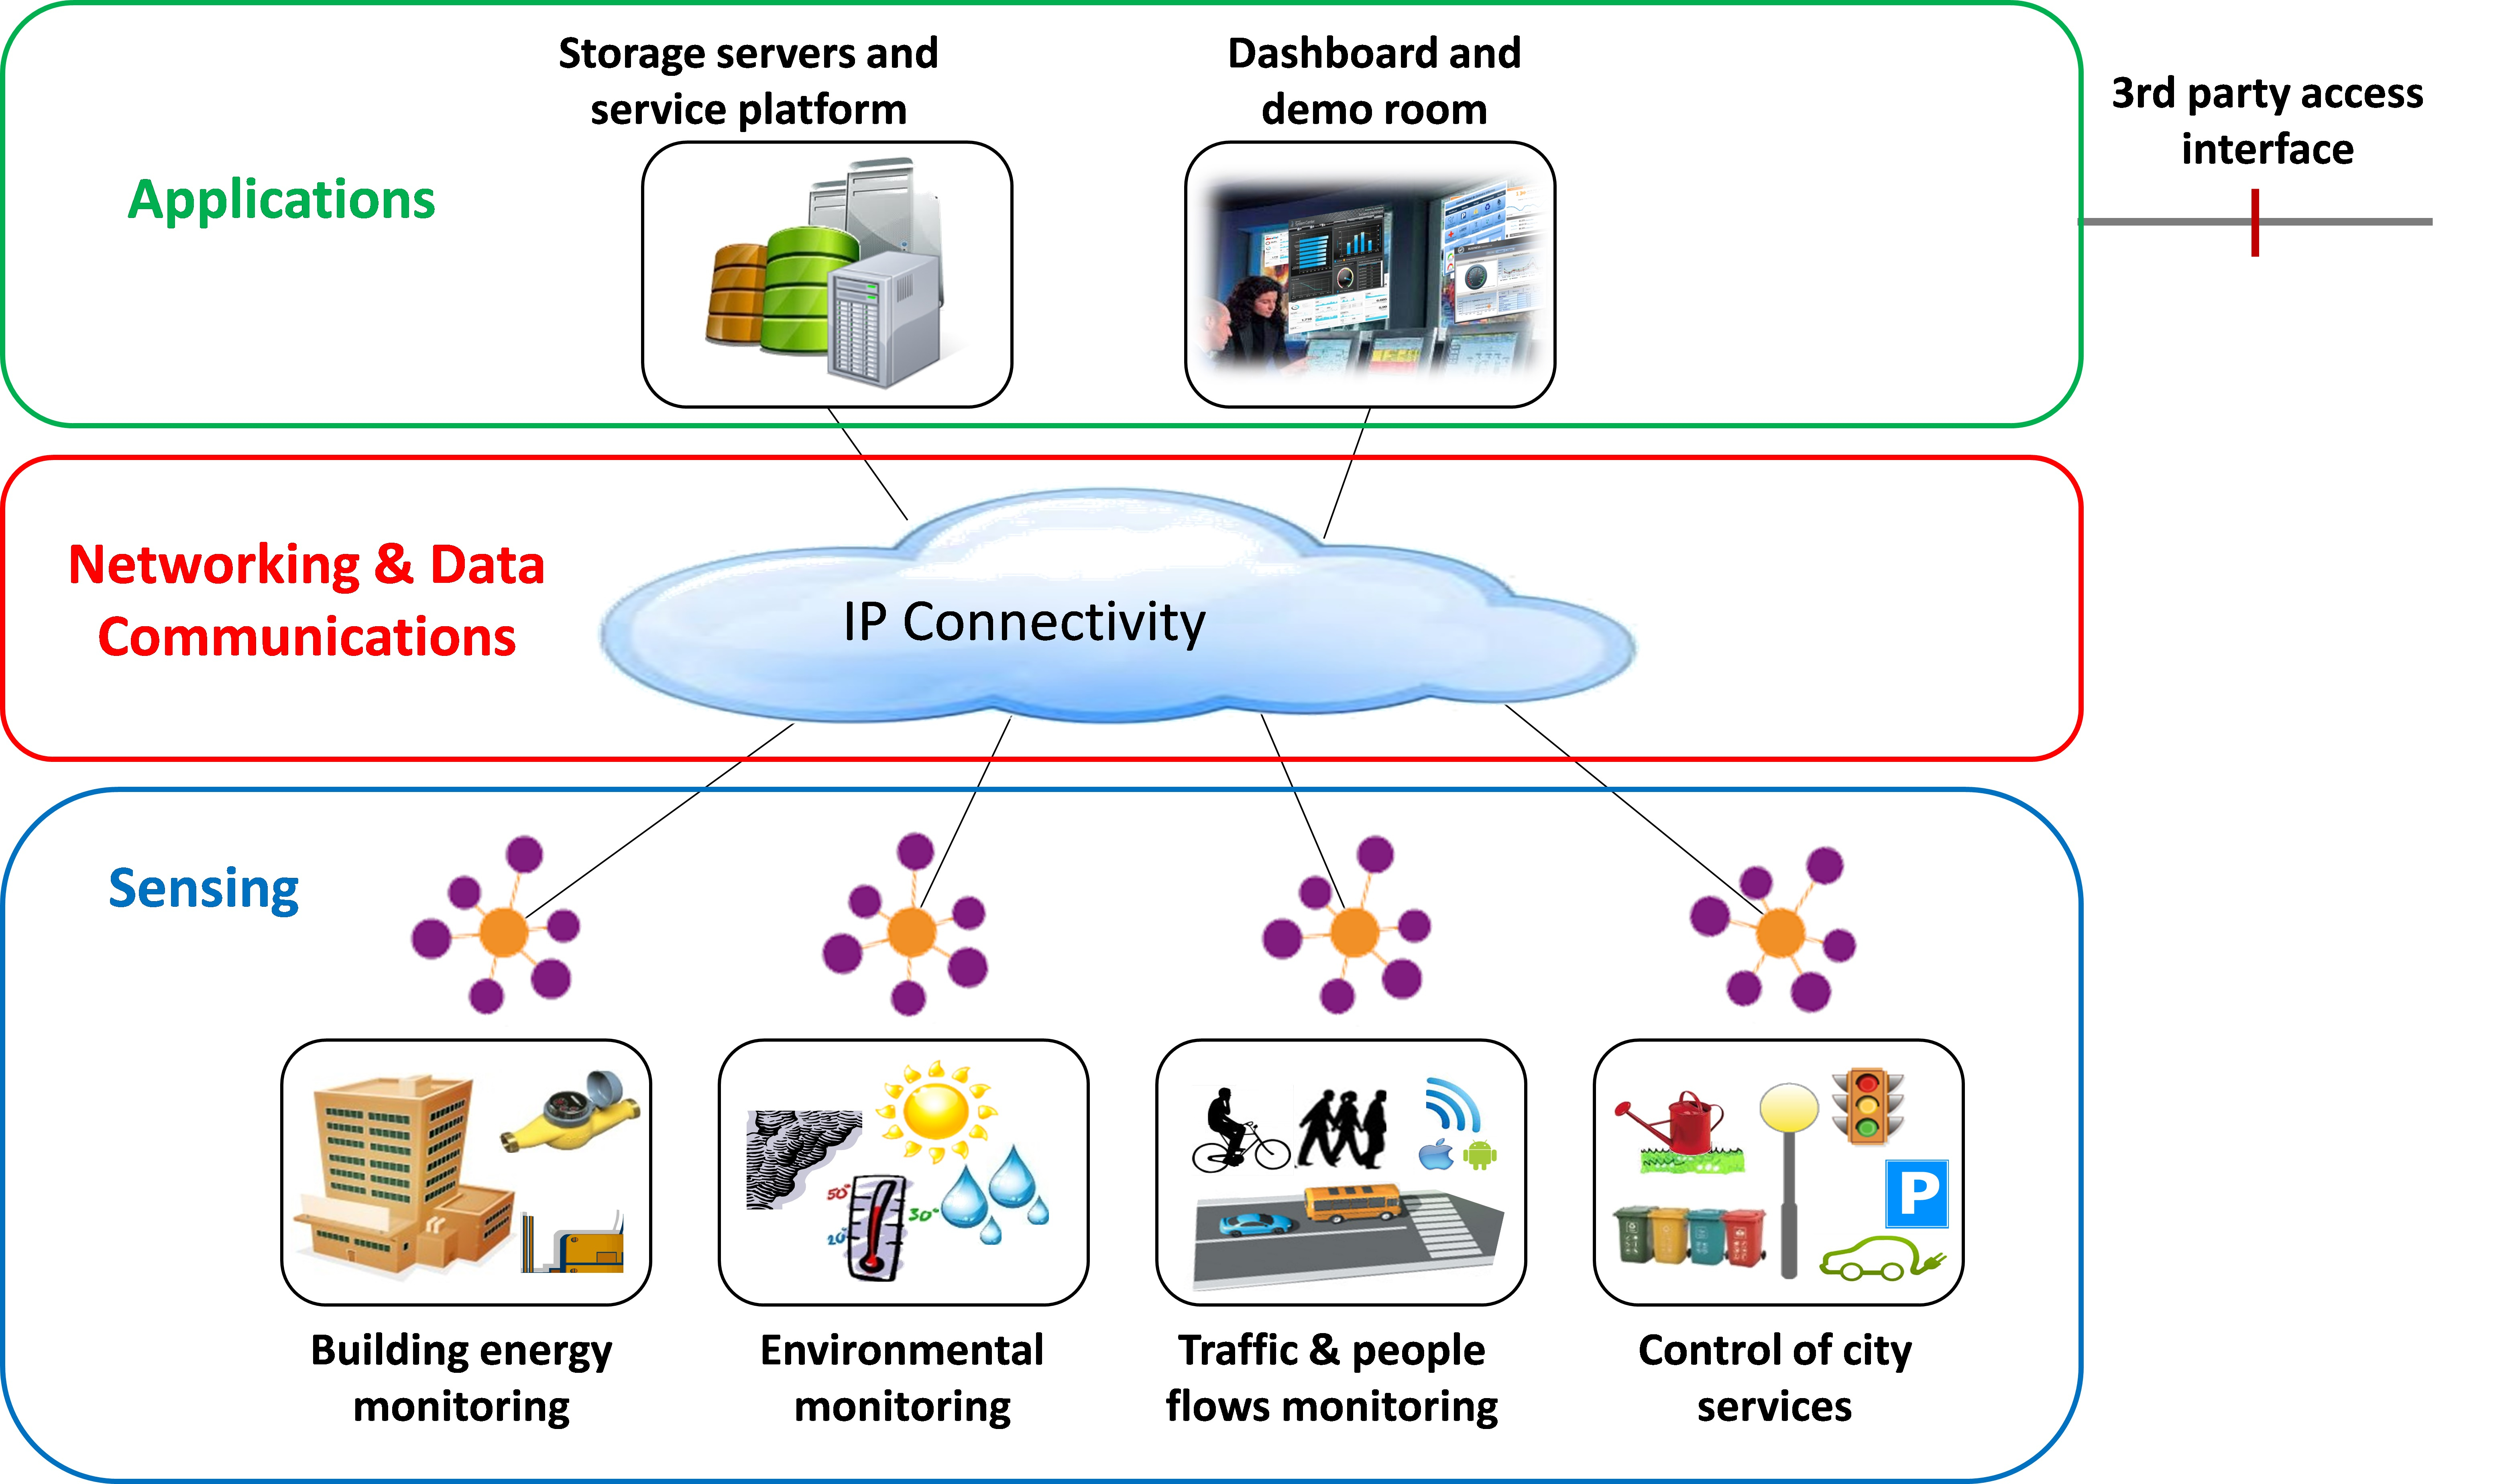
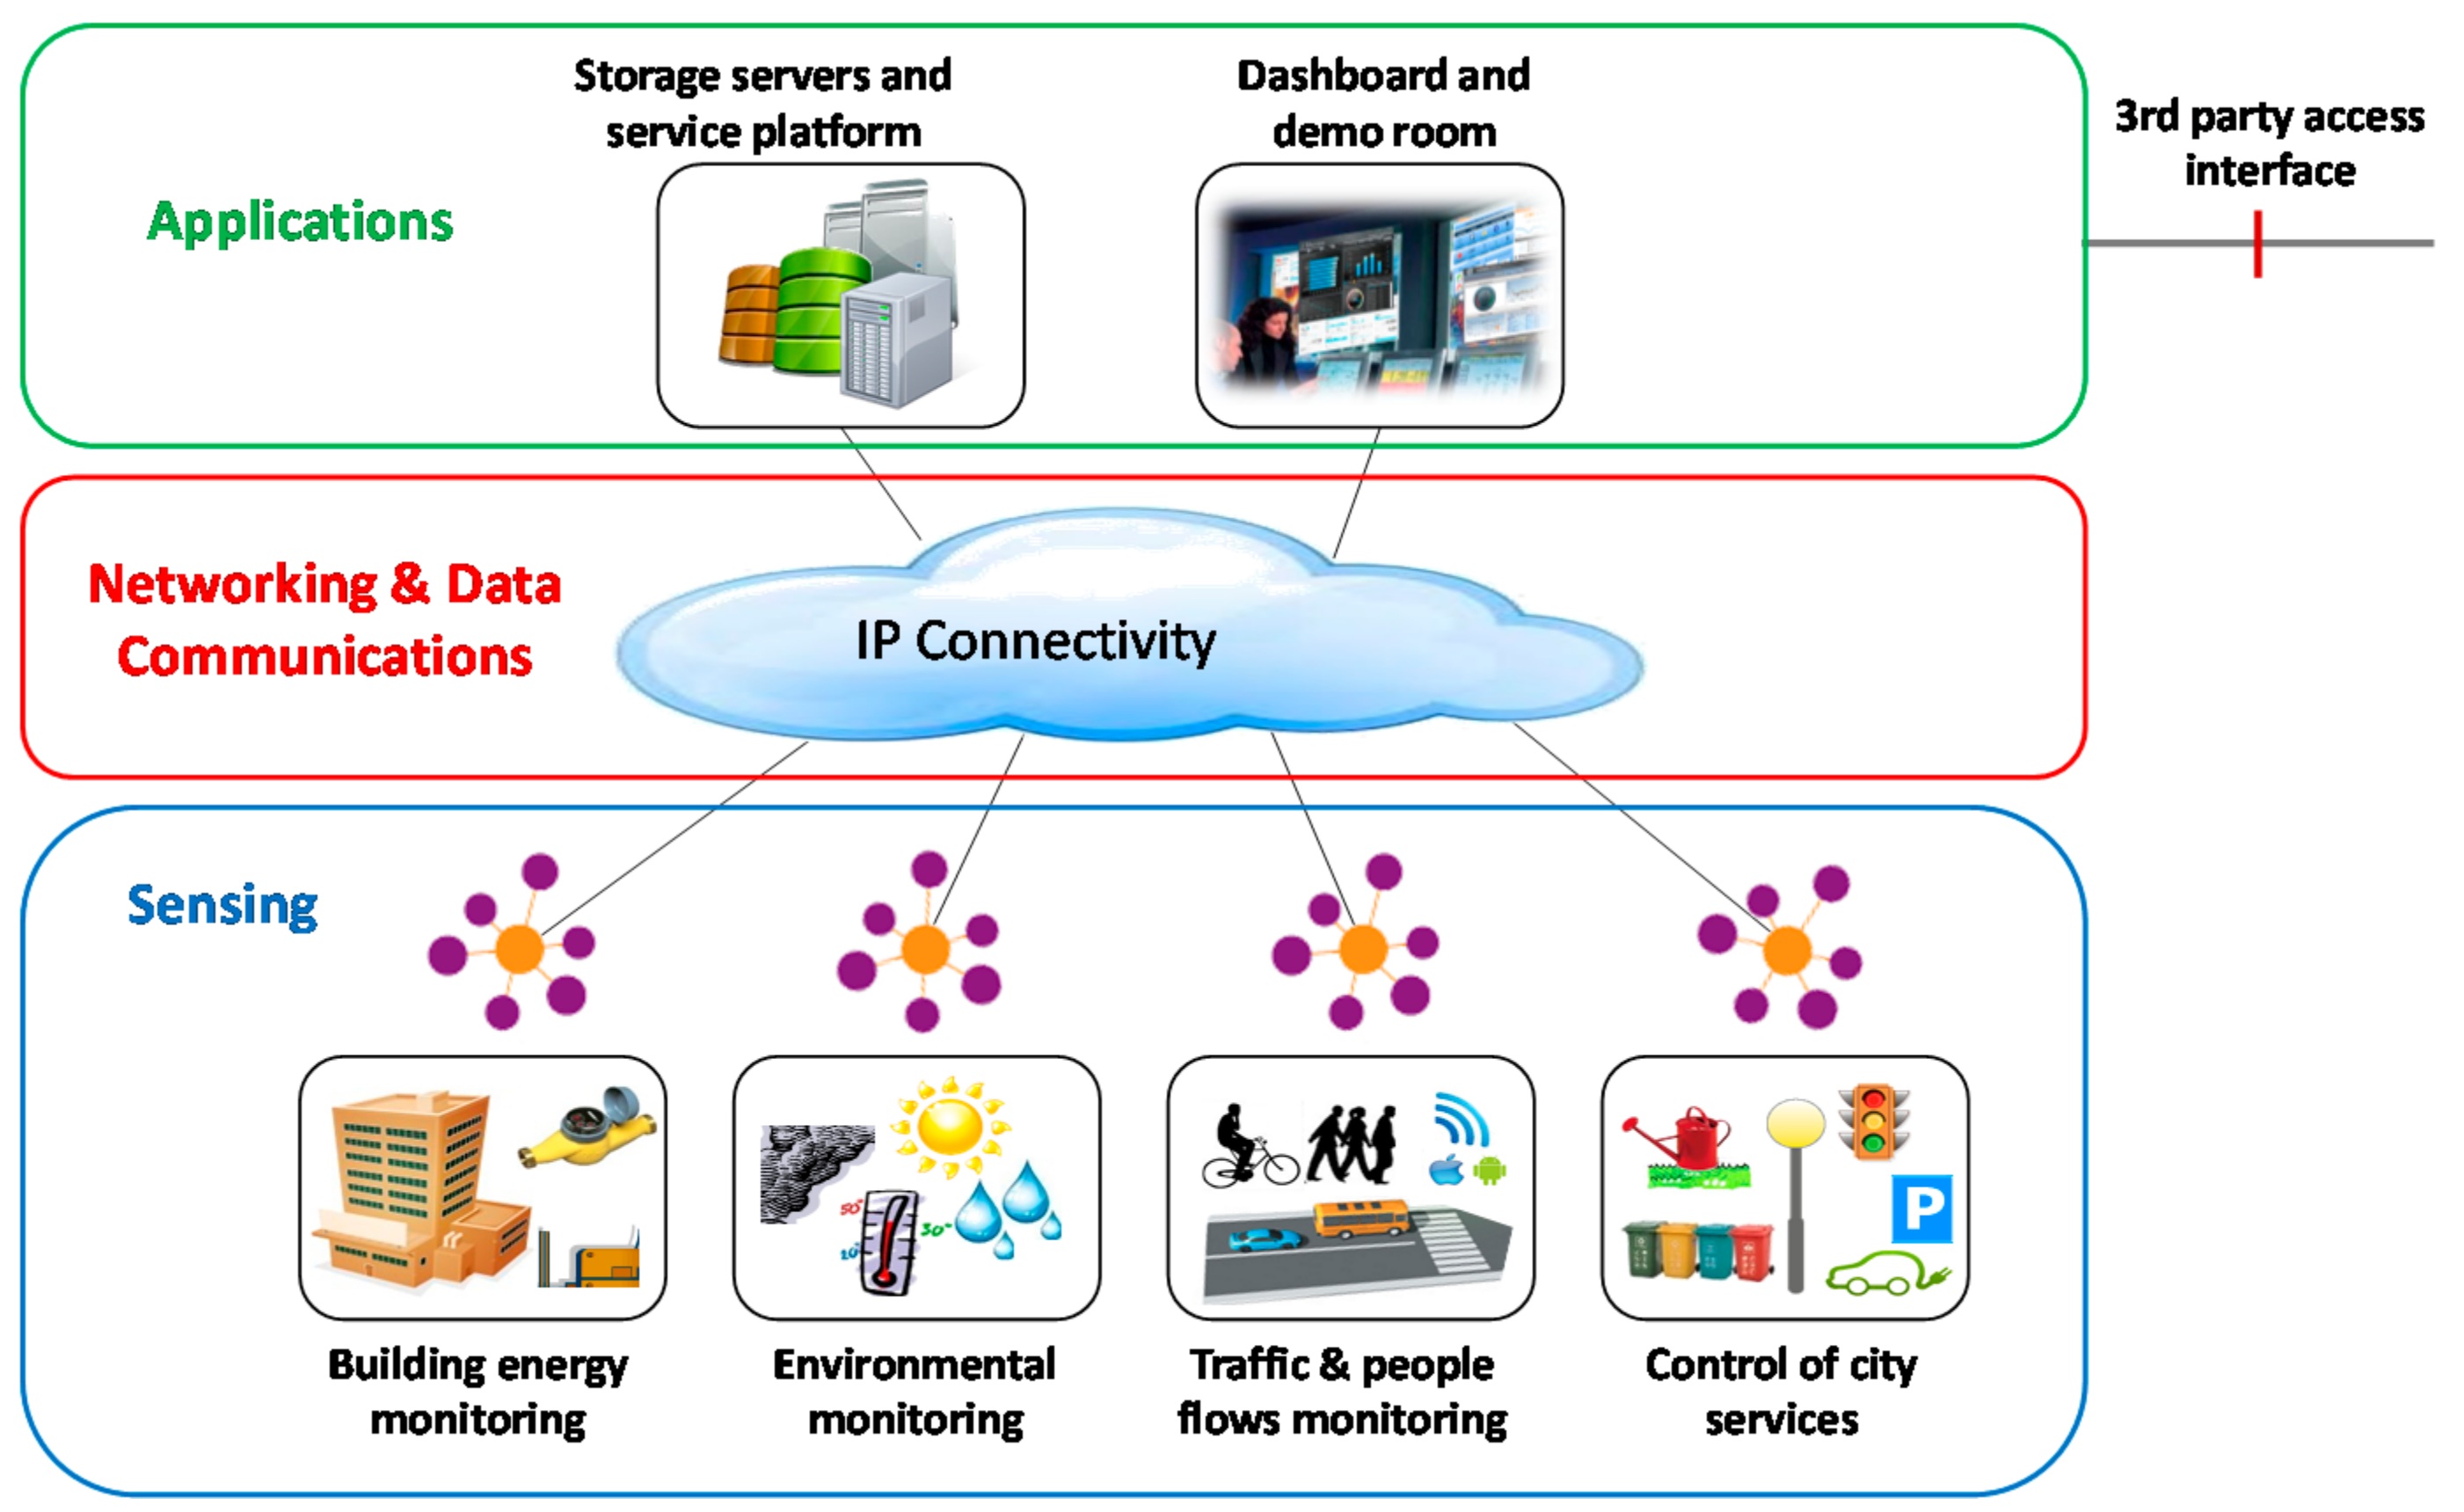
2. Architecture and Subsystem Design
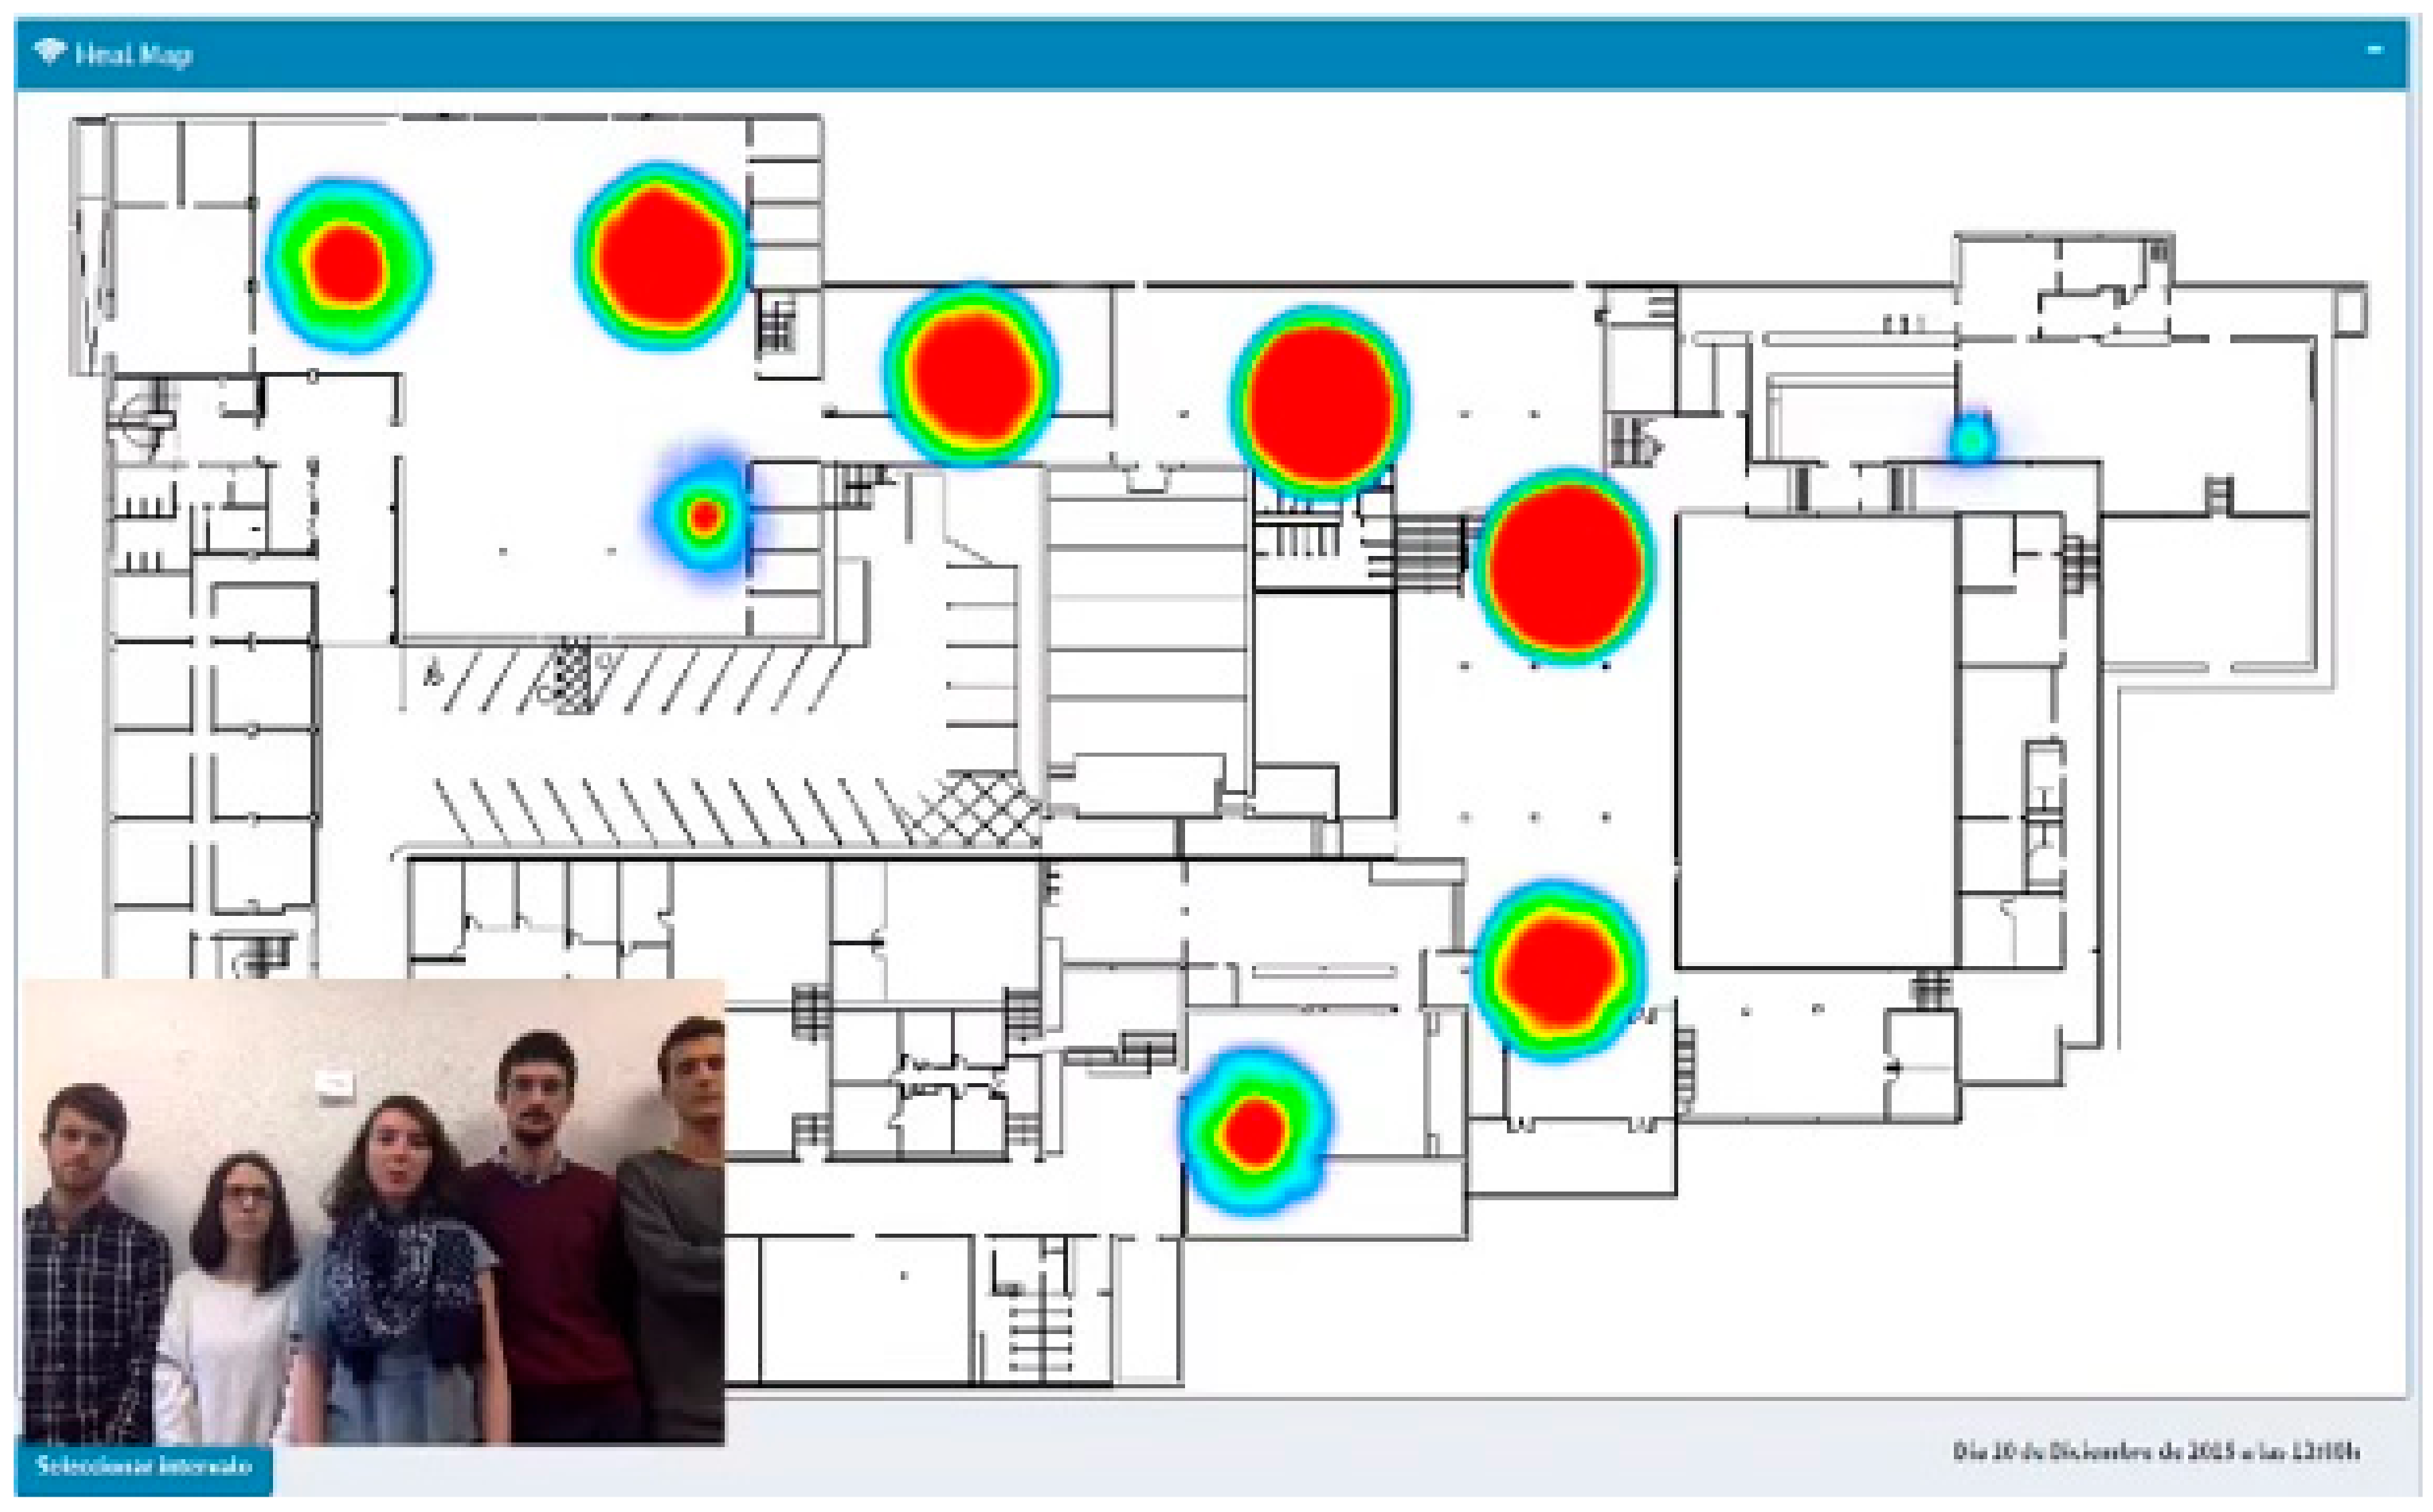
- People flow monitoring, which allows counting people and associated applications, such as movement pattern analysis, places with higher transit of people, stay time in relevant places, etc.
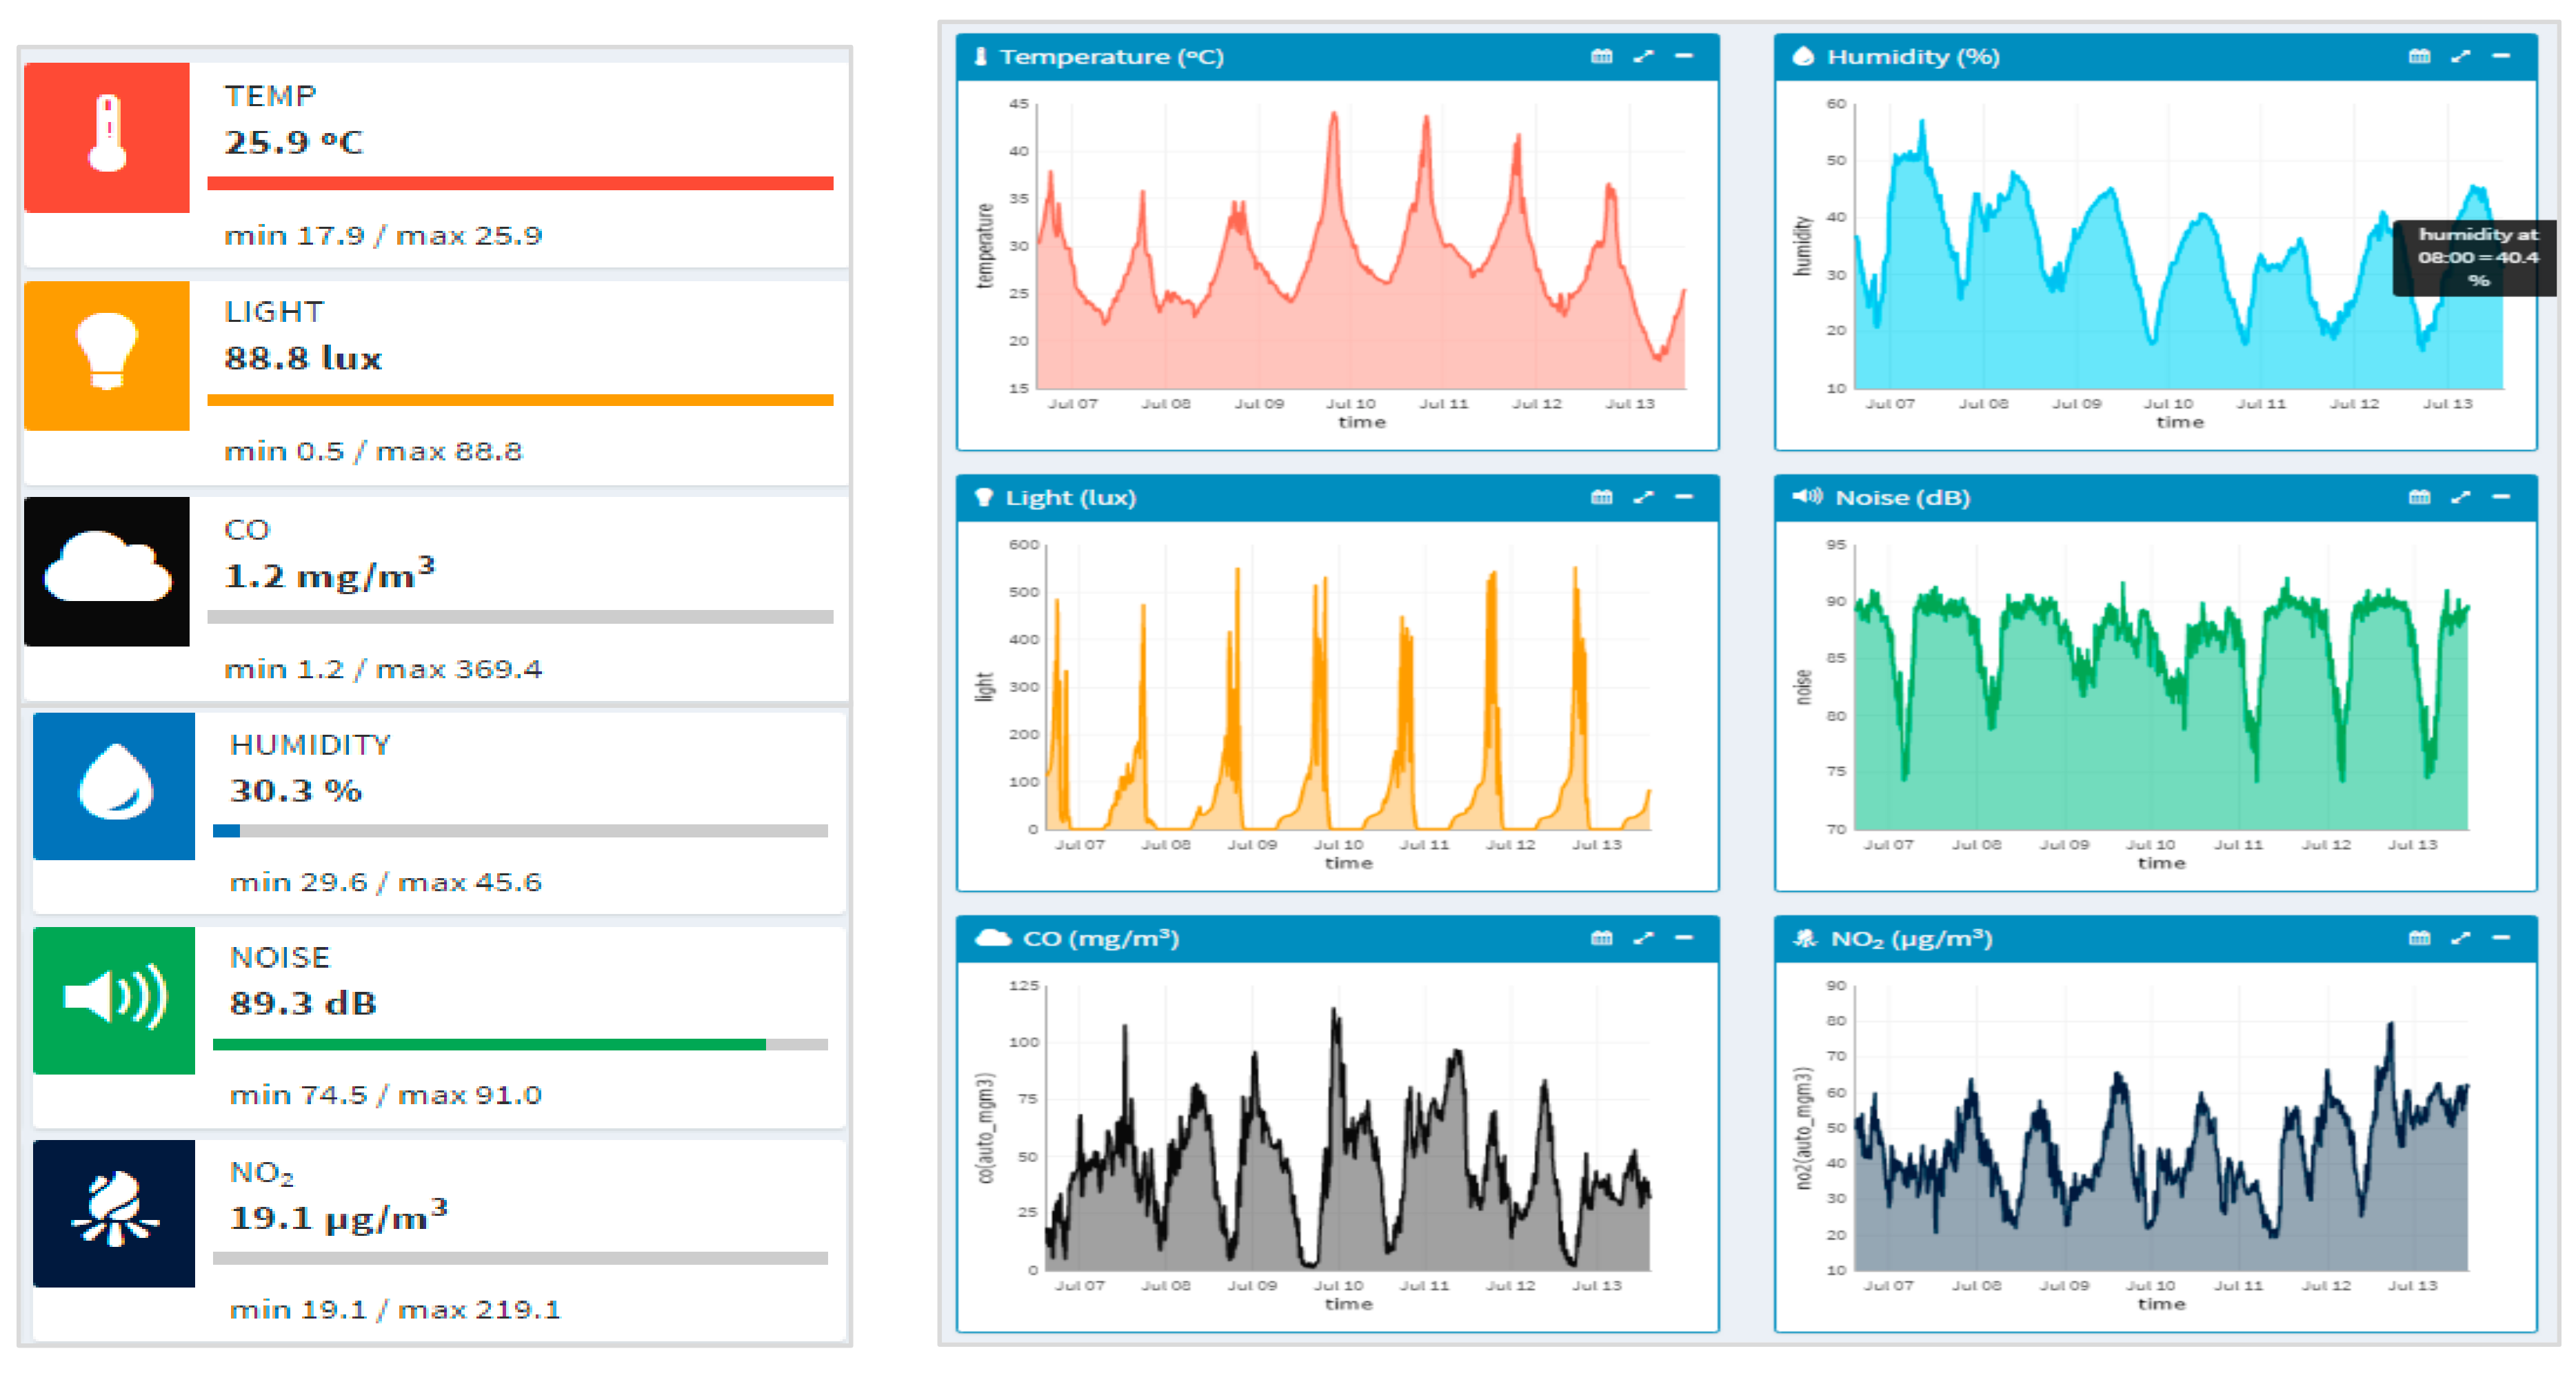
- Environmental monitoring, which allows analyzing several environmental parameters, such as temperature, humidity, light, noise level or air composition, both indoors and outdoors.
2.1. Sensing Layer
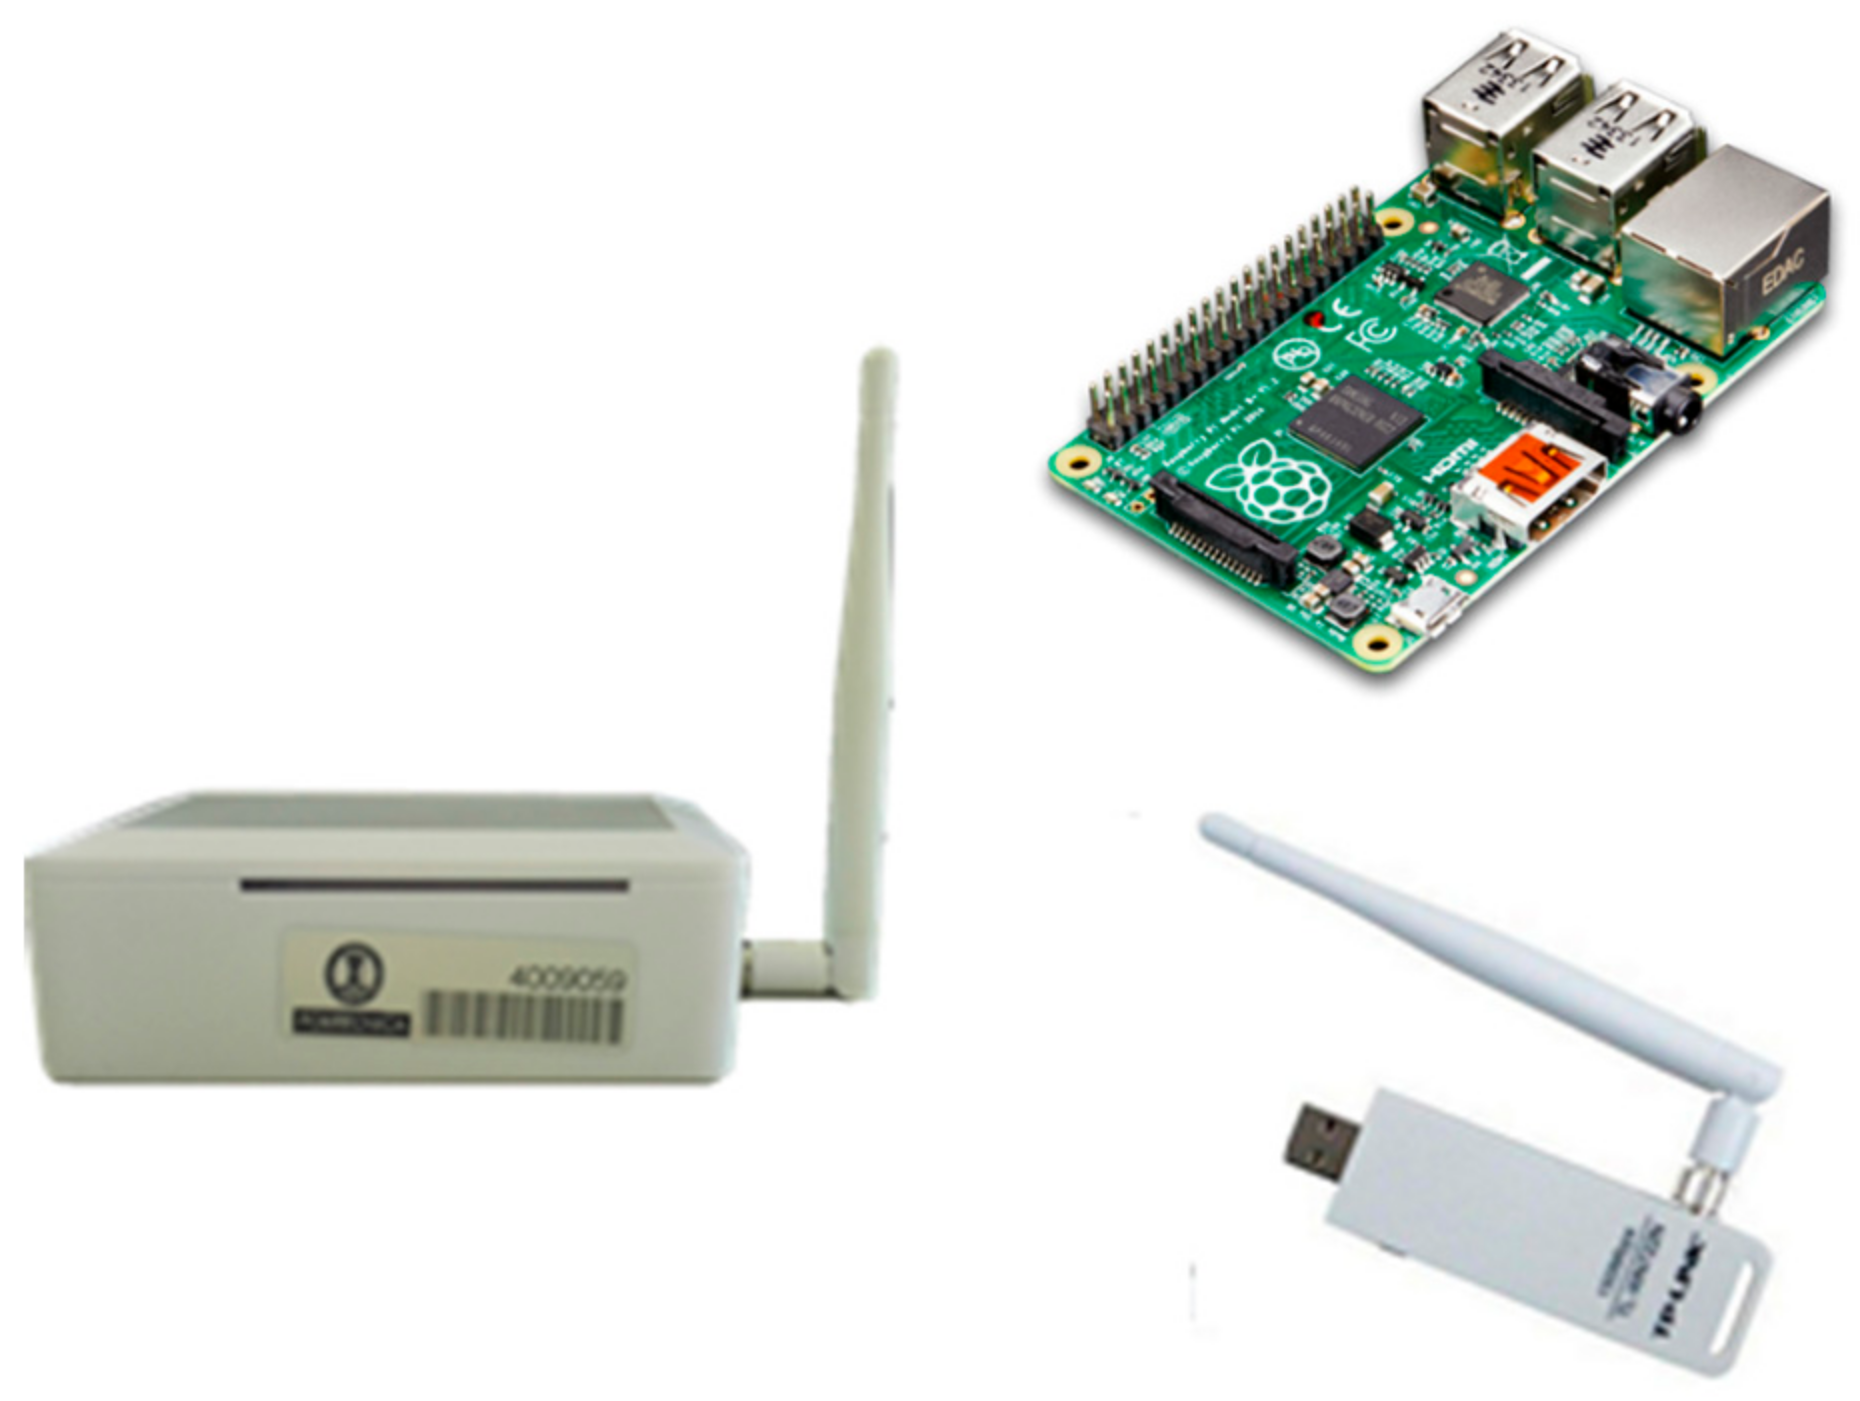
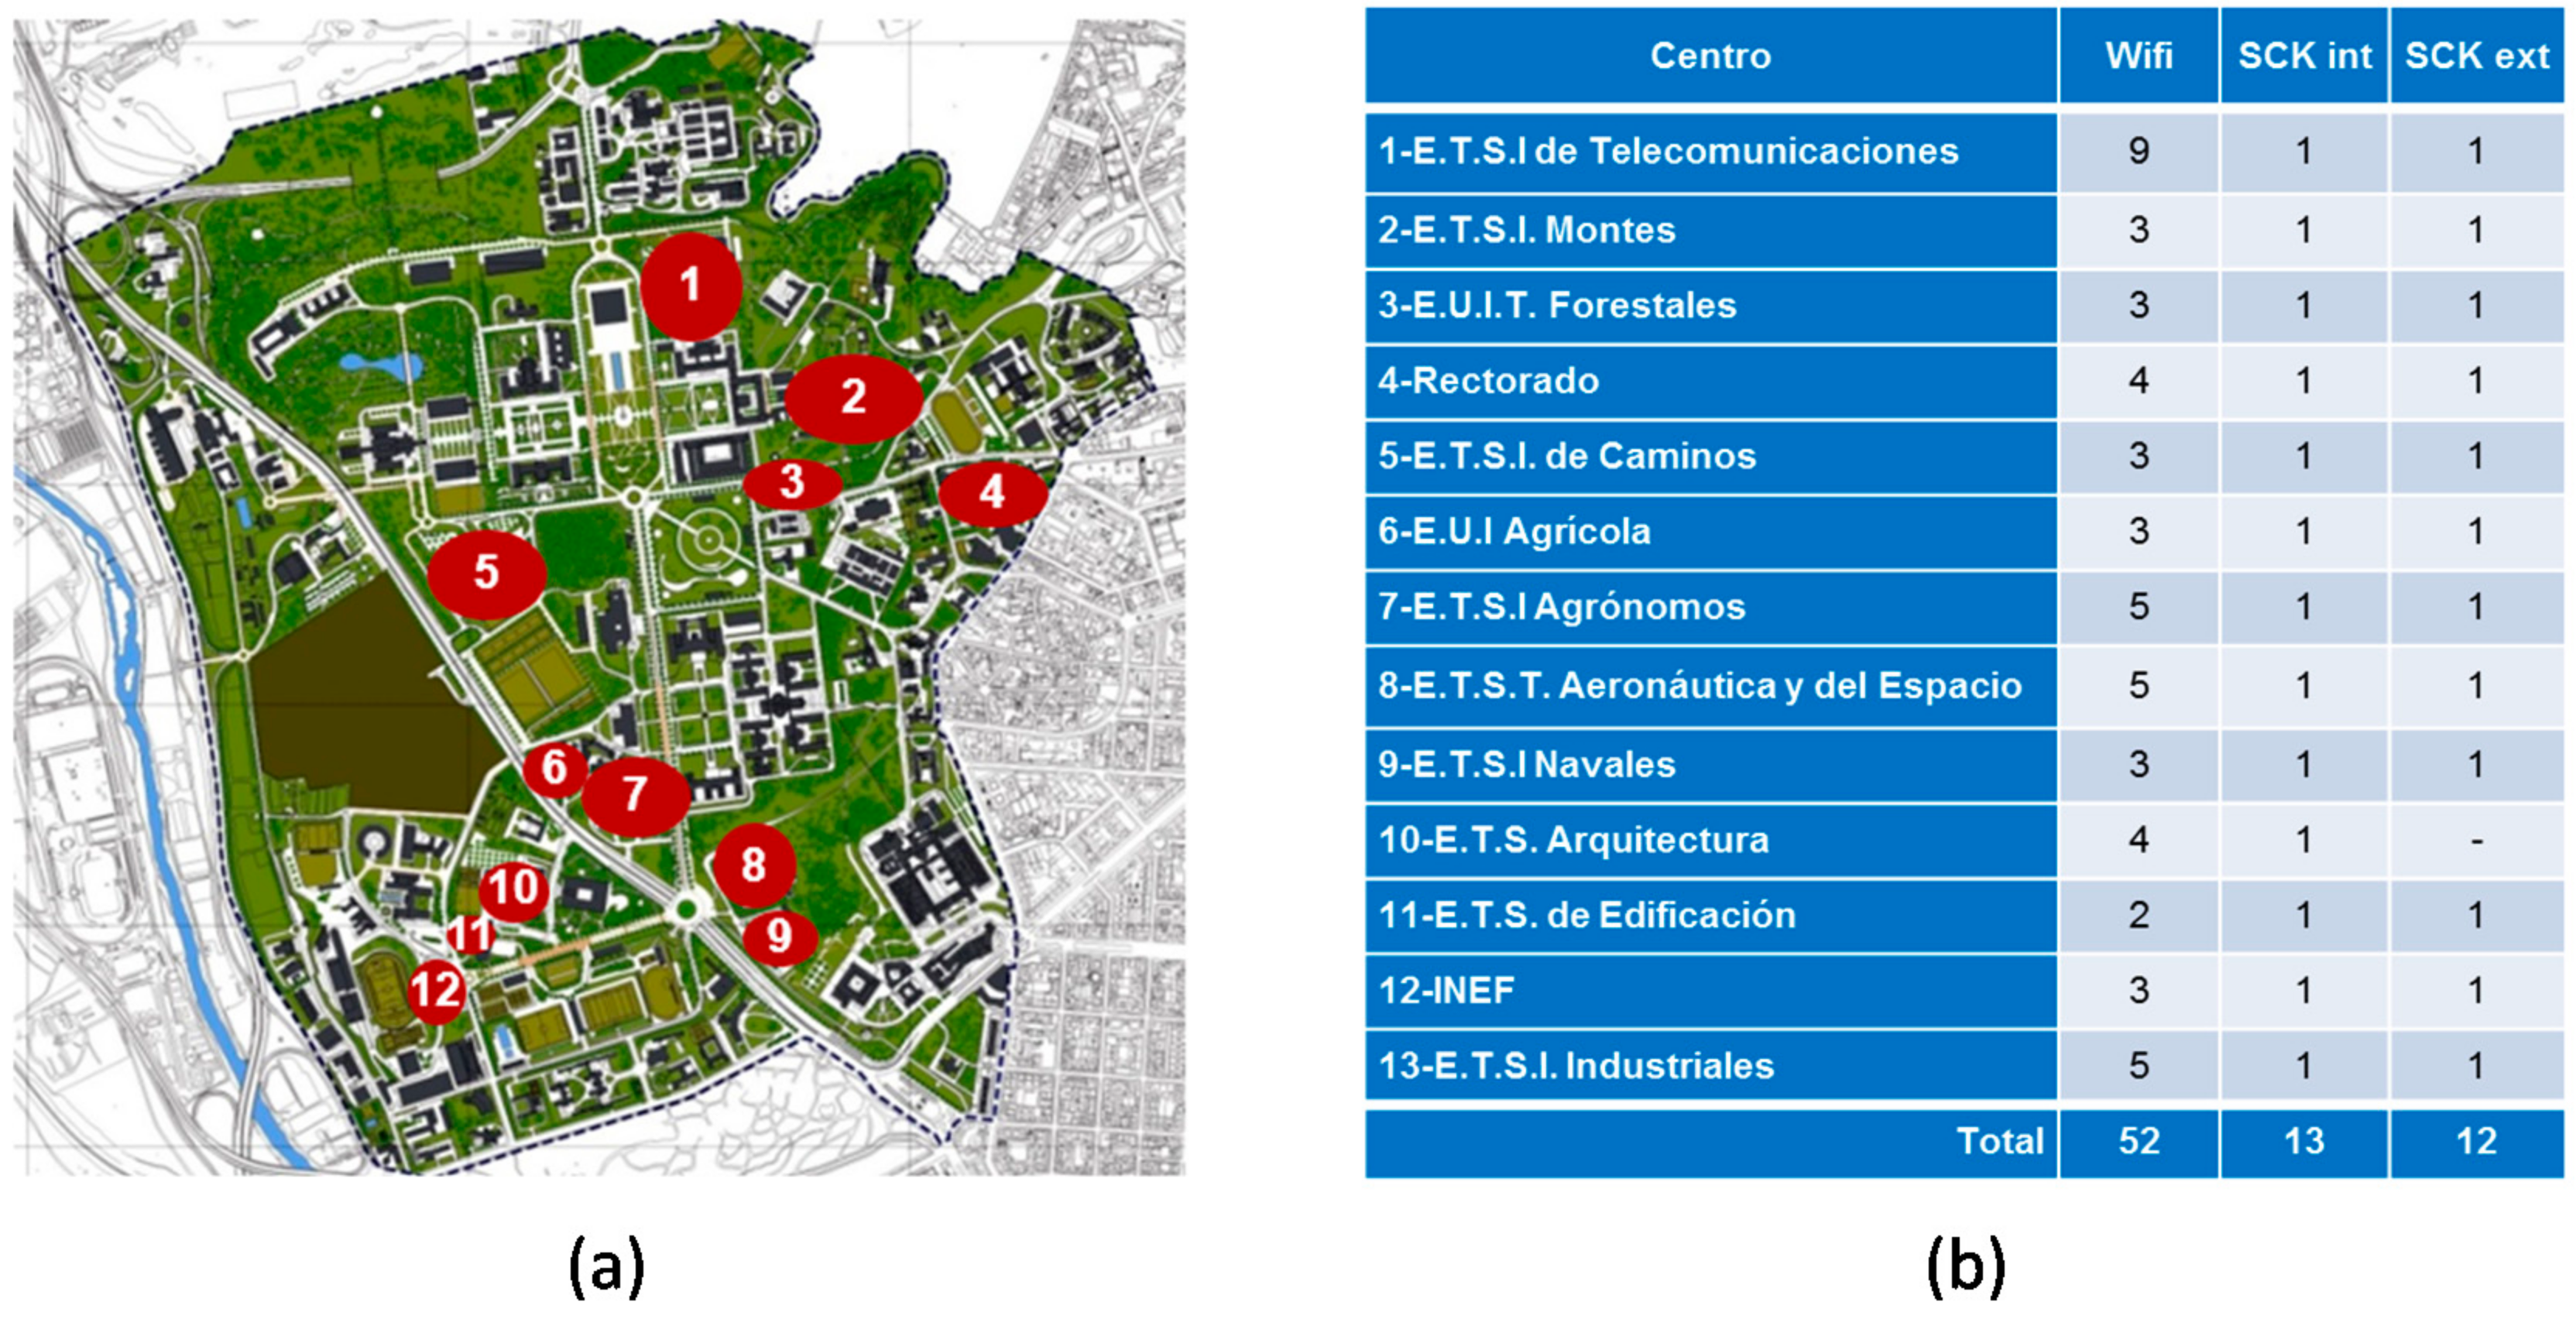
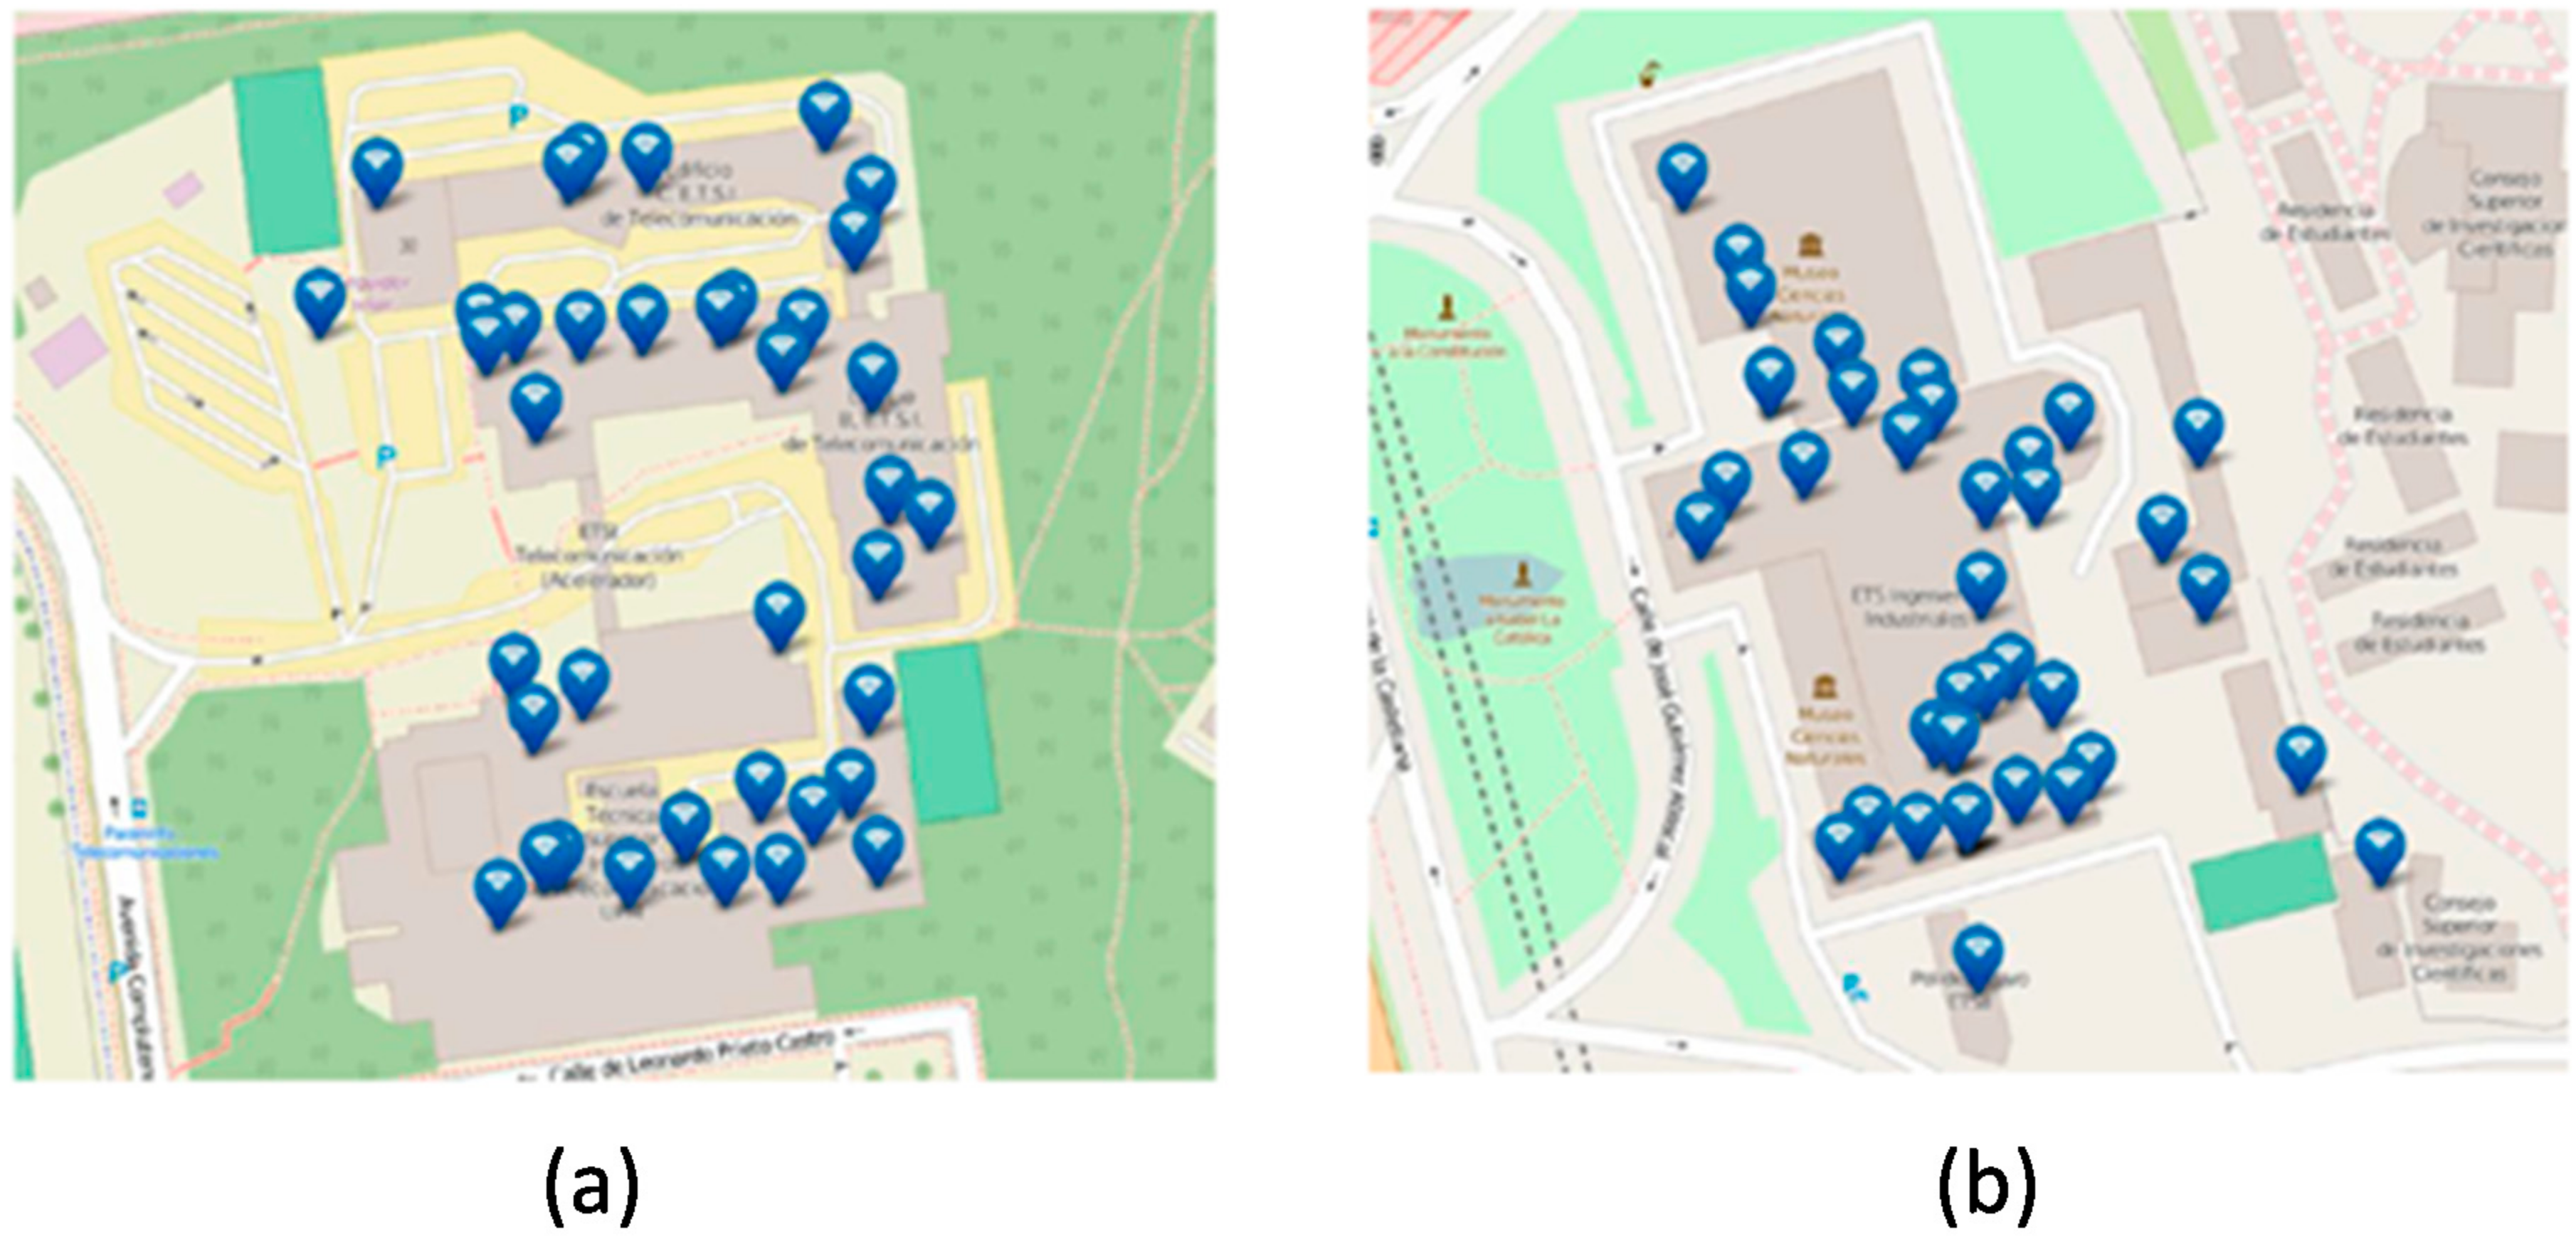
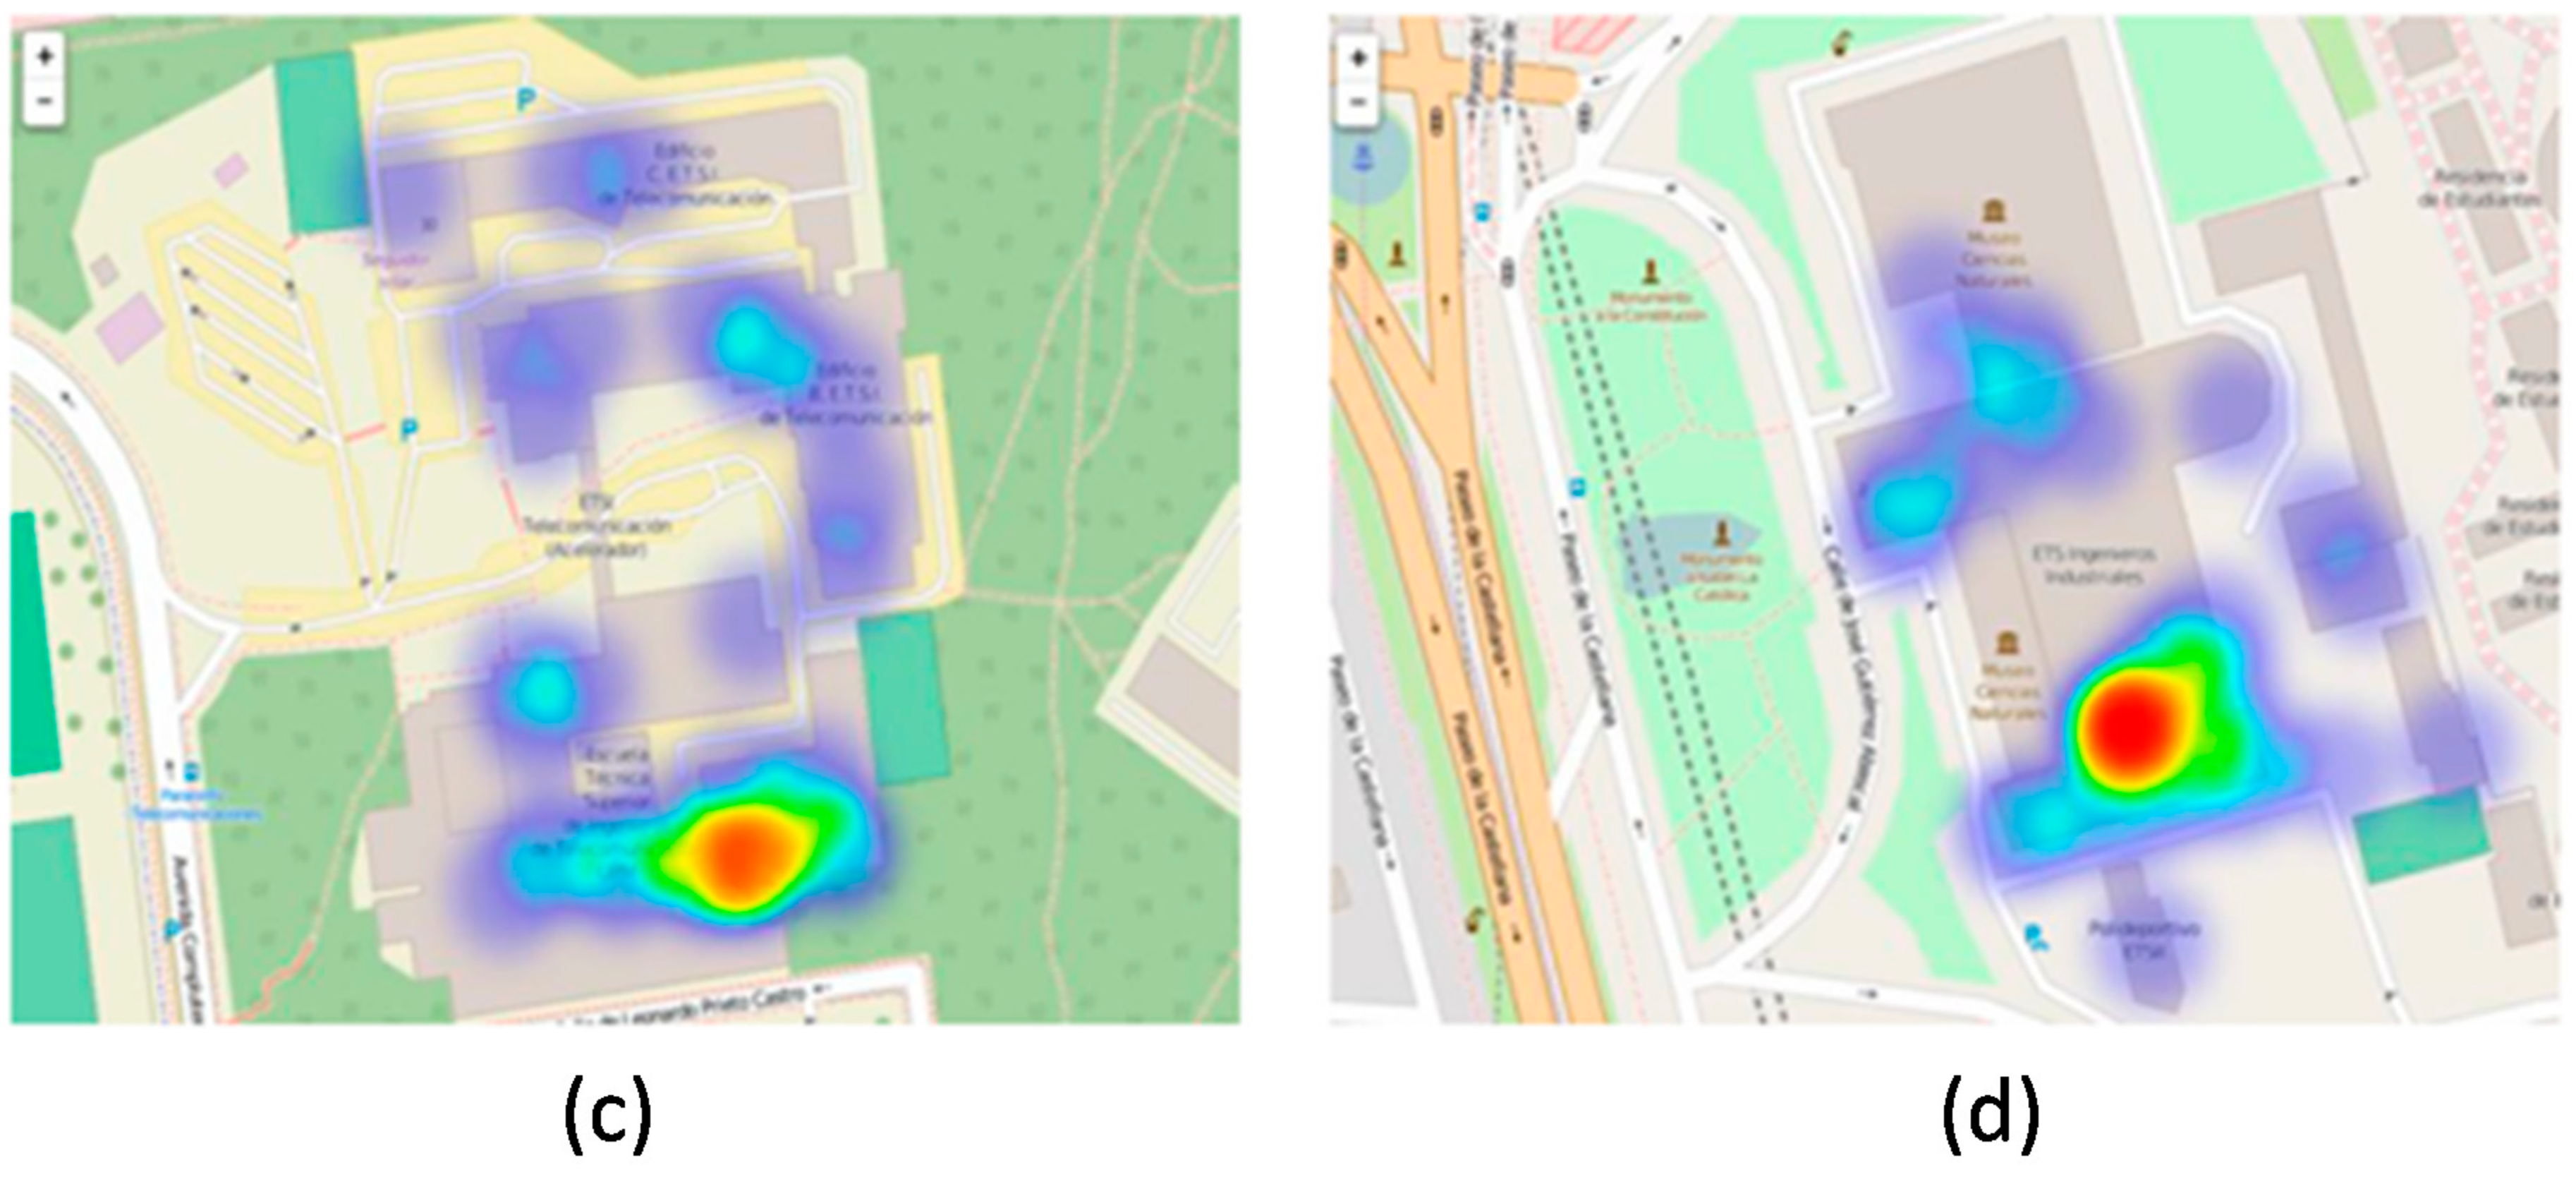
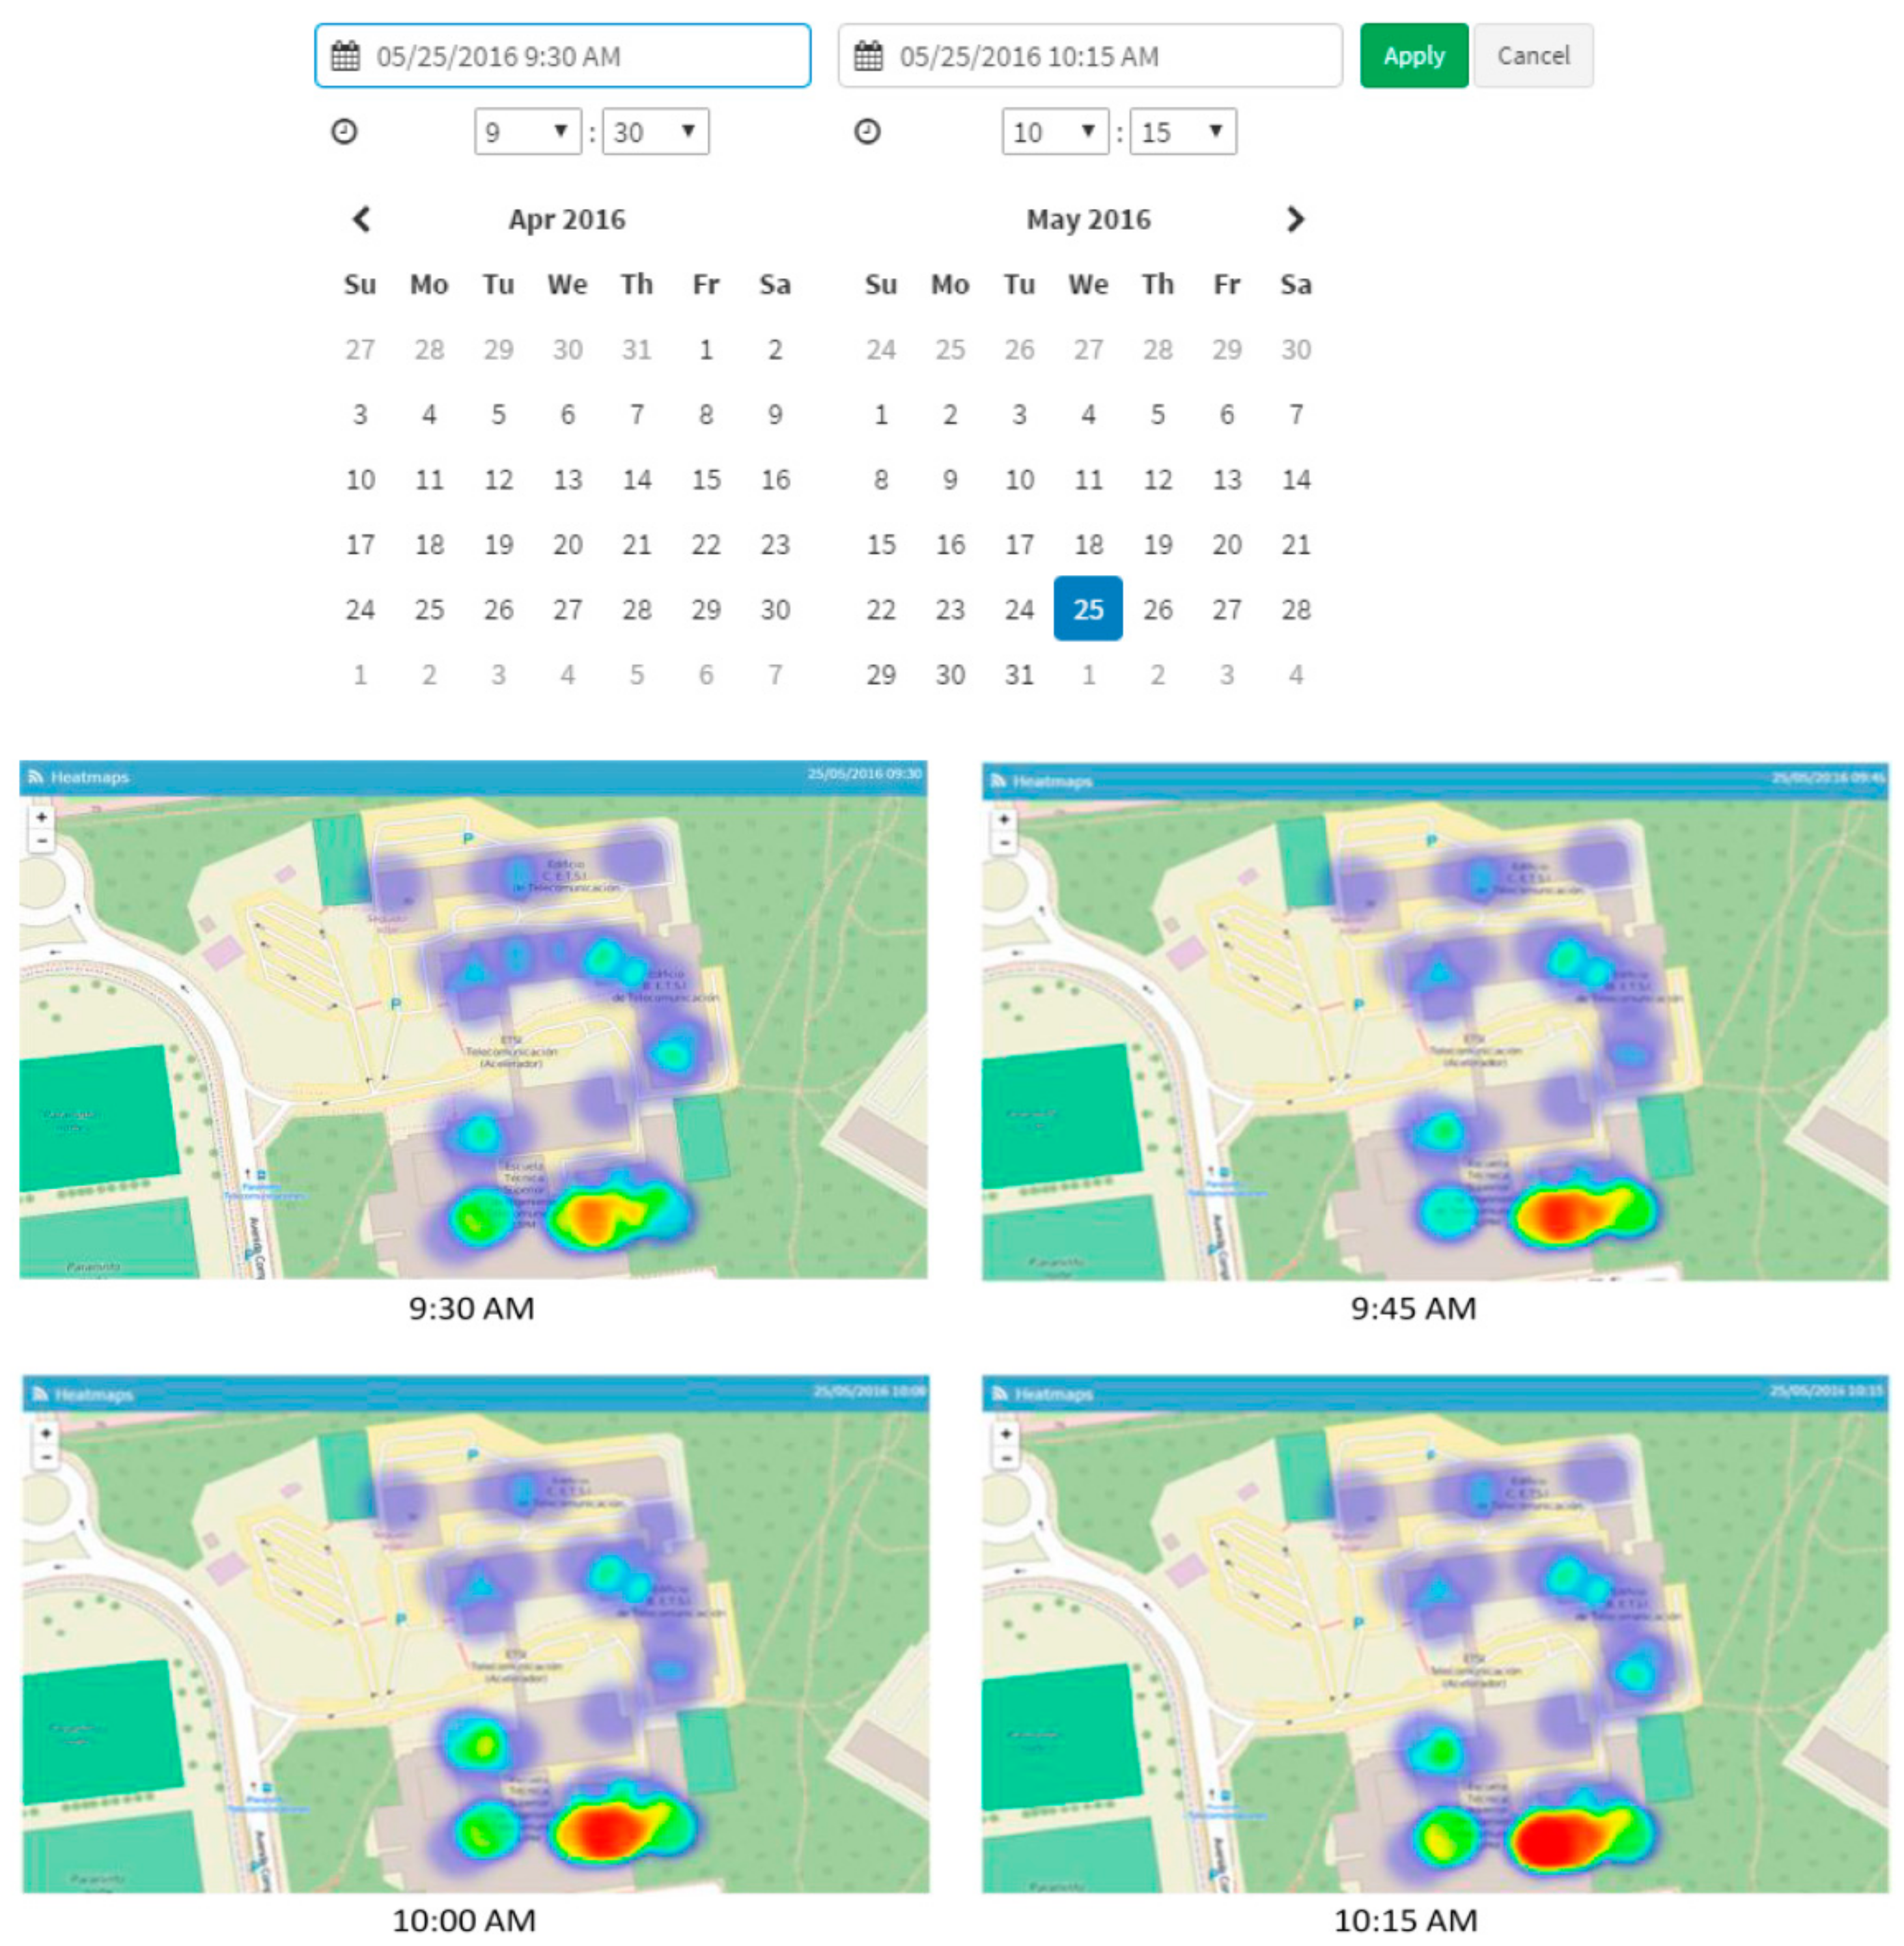
2.1.1. People Flow Monitoring Sensor Network
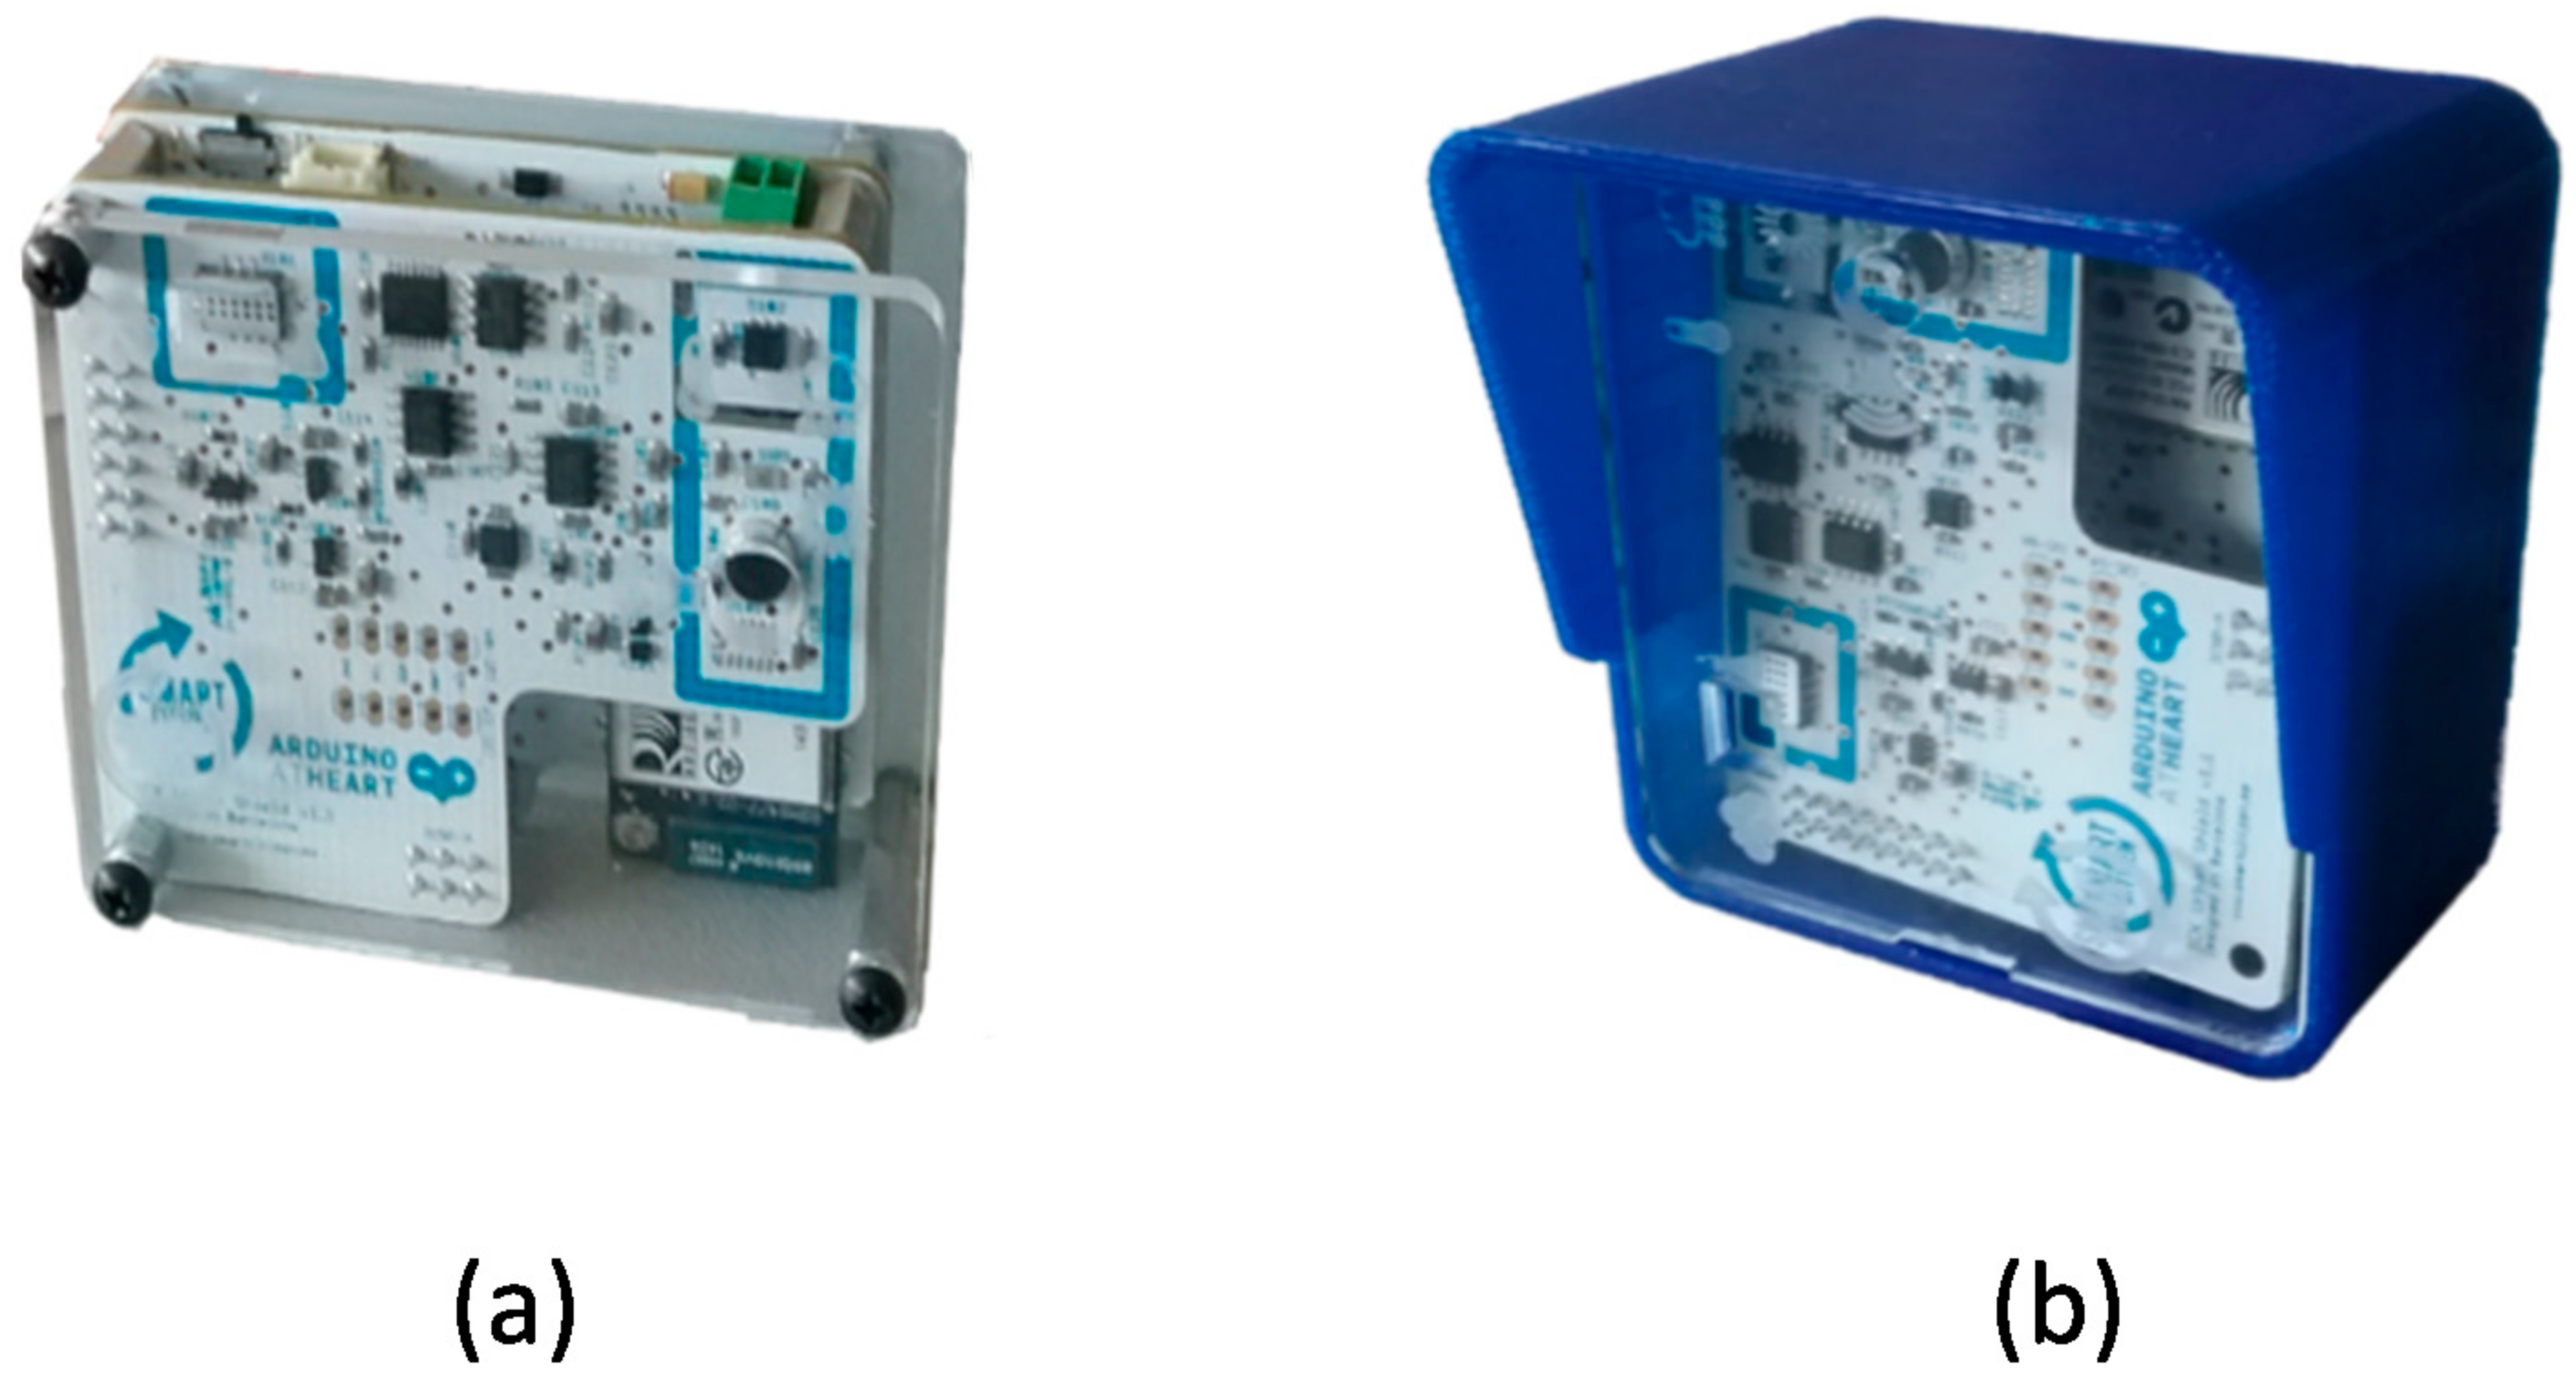
2.1.2. Environmental Monitoring Sensor Network
2.2. Networking and Data Communications Layer
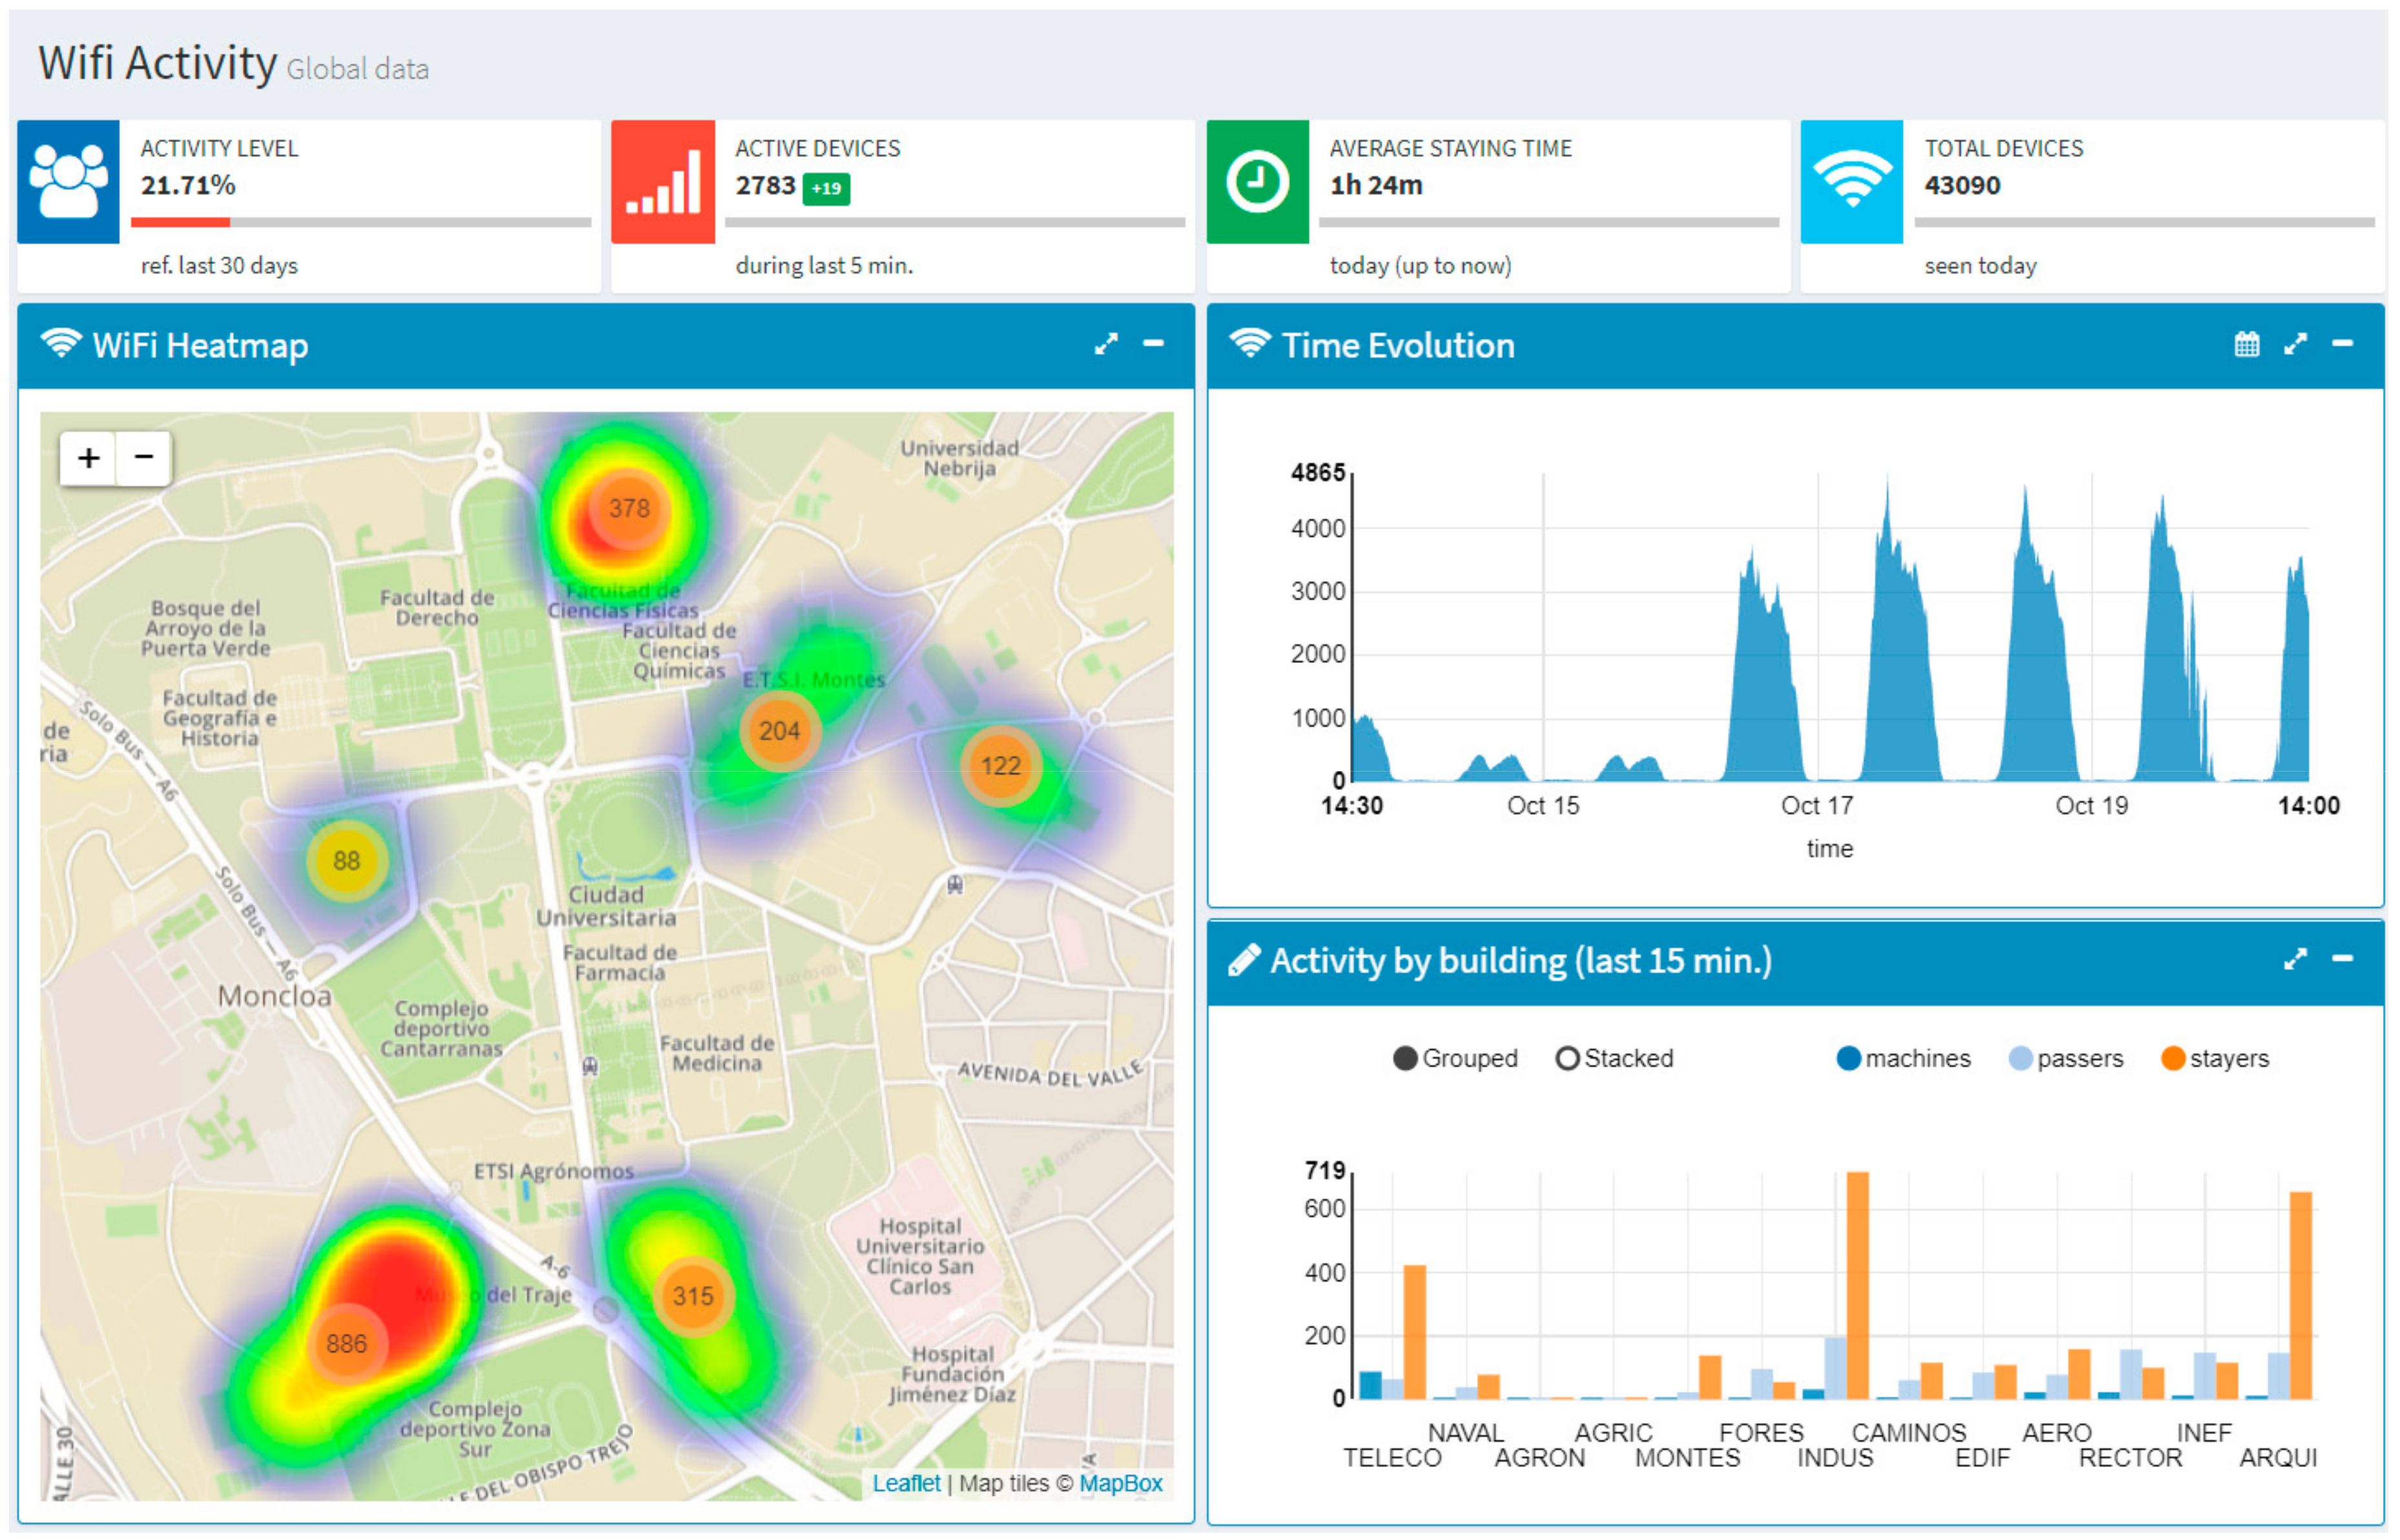
2.3. Application Layer
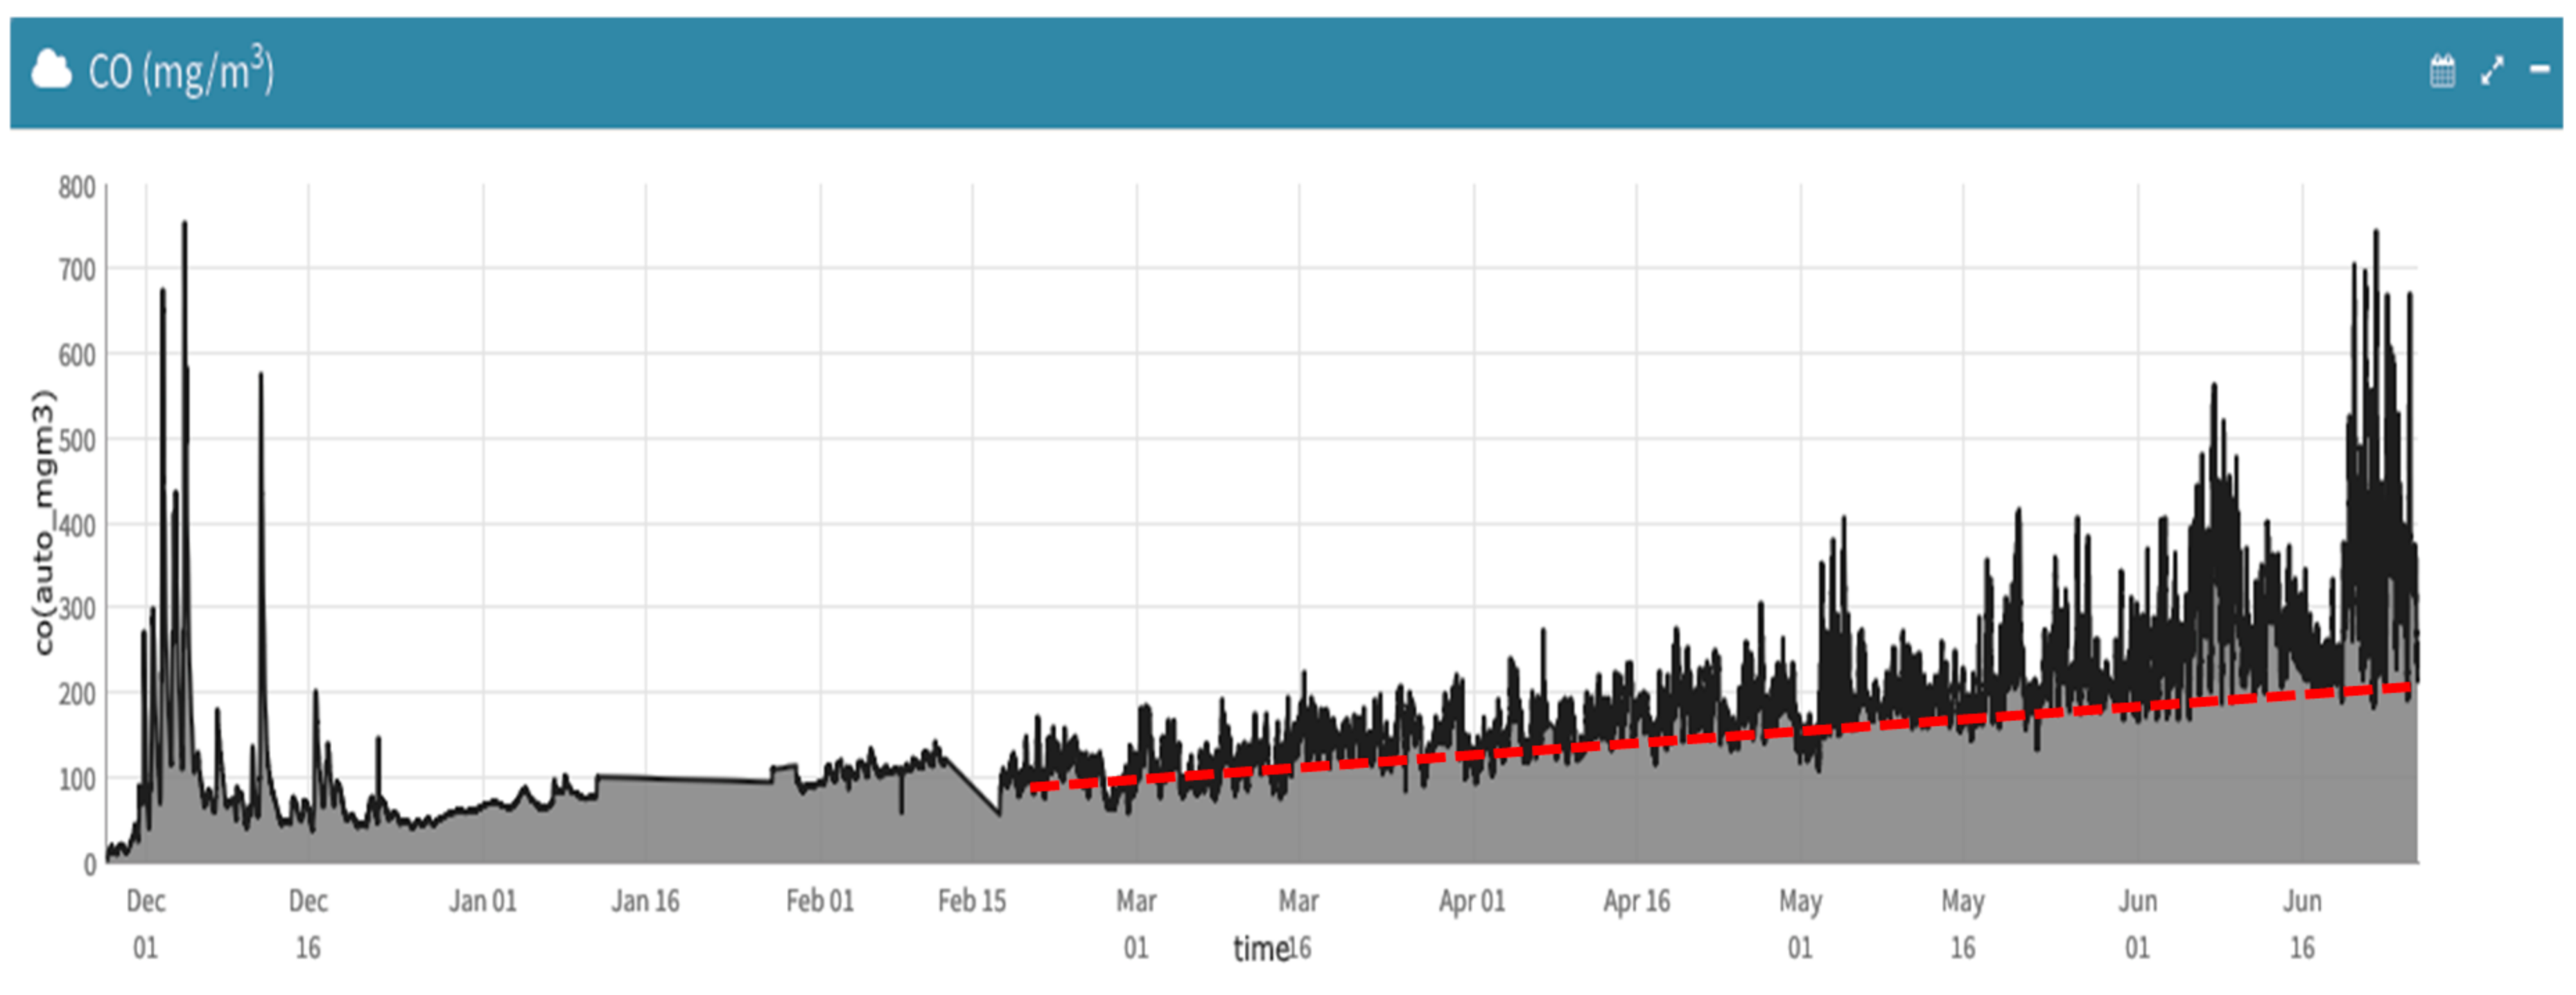
3. Overview of the Provided Data
4. Use Cases
4.1. Use Case 1: Smart Emergency Management Application
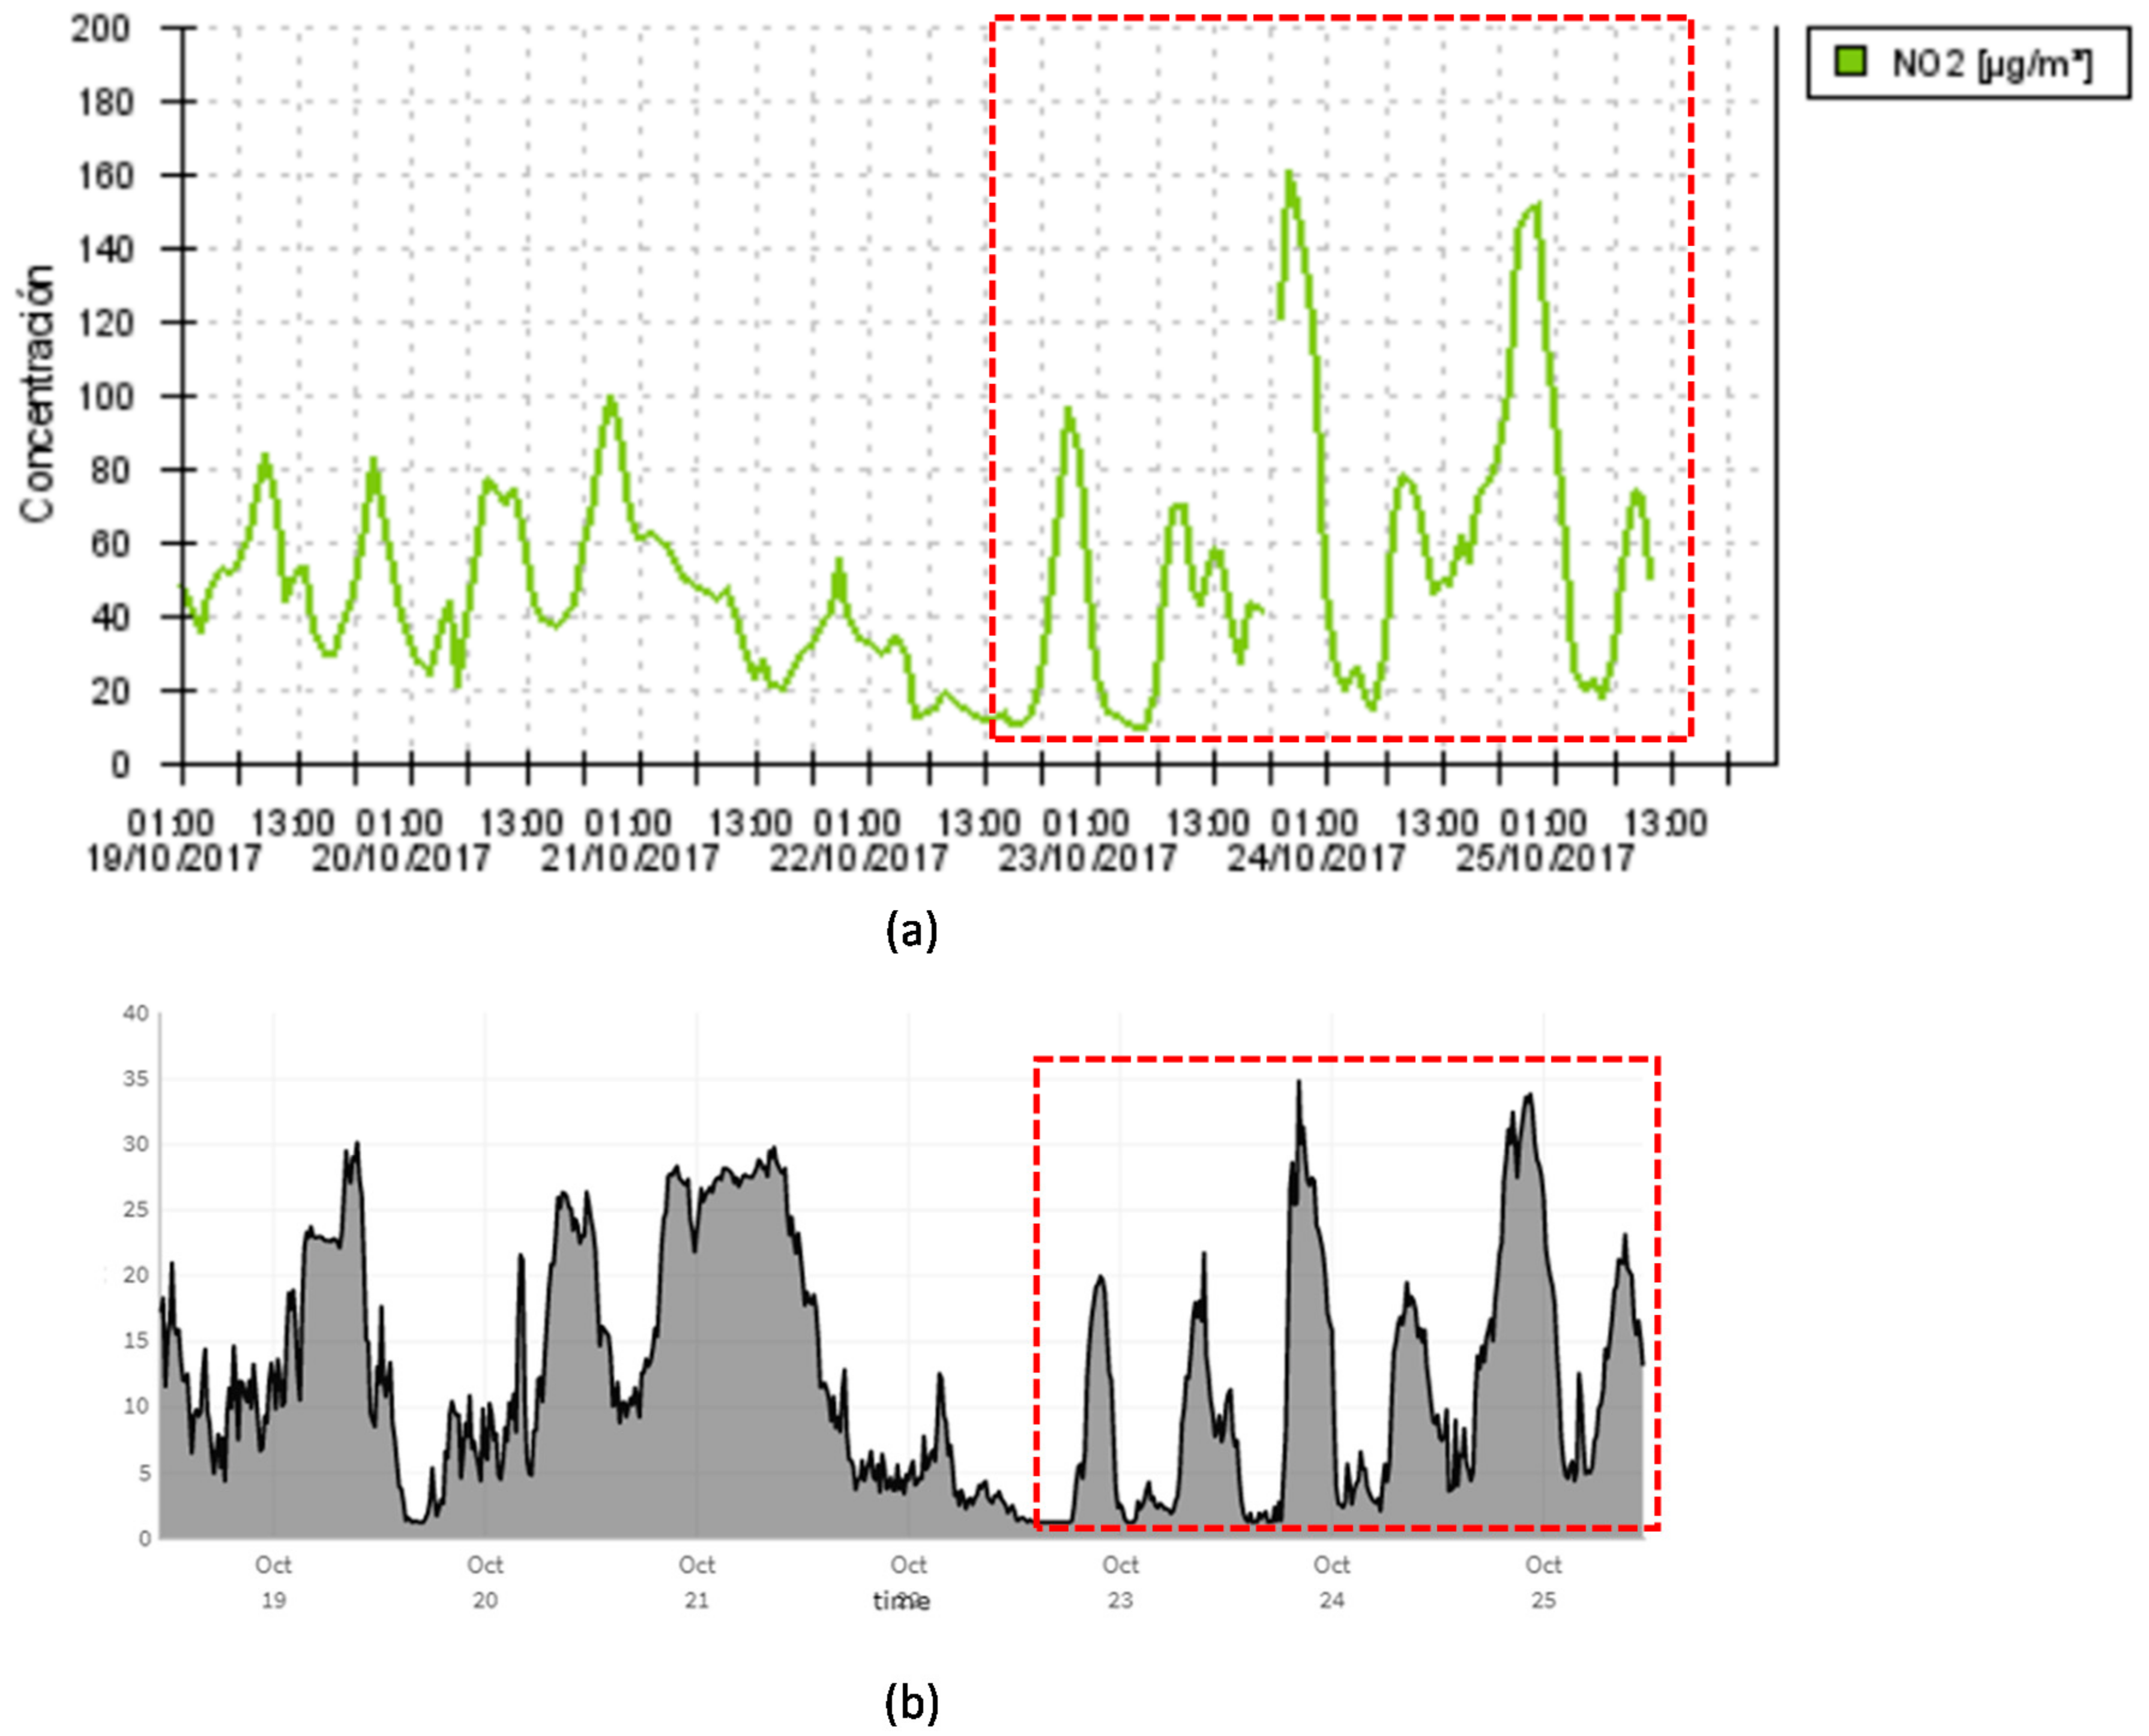
4.2. Use Case 2: Traffic Restriction Application
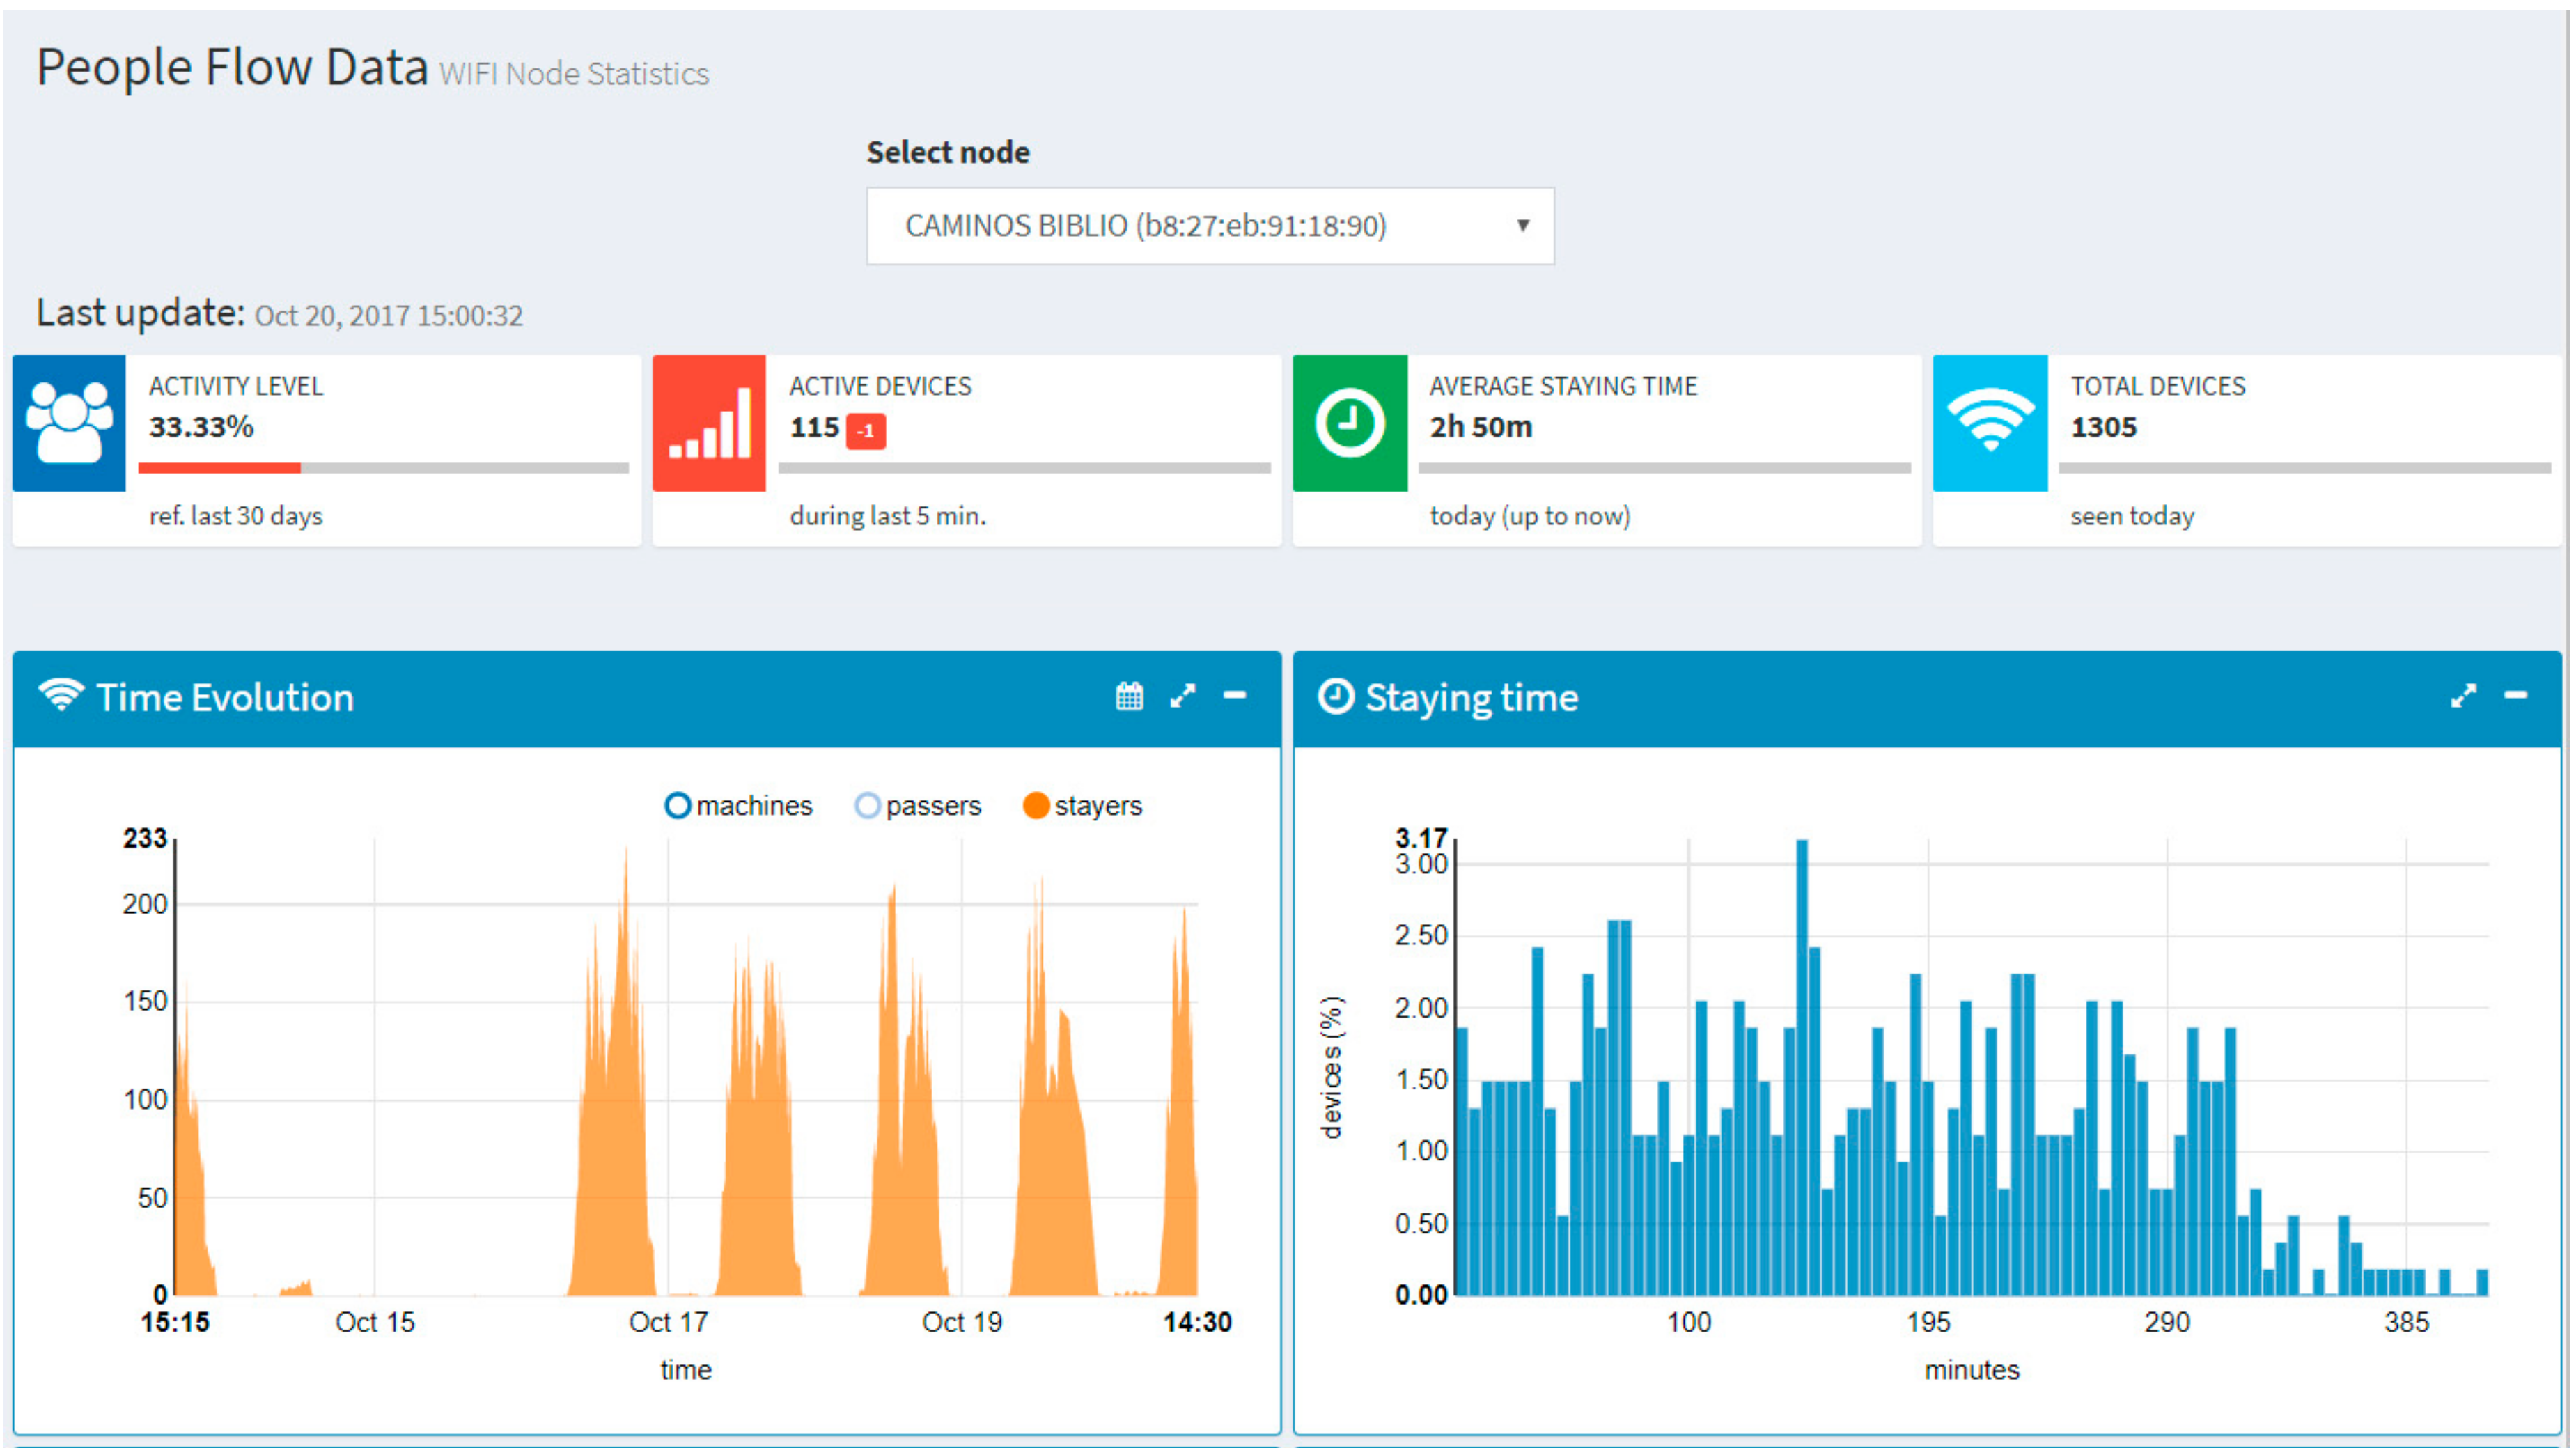
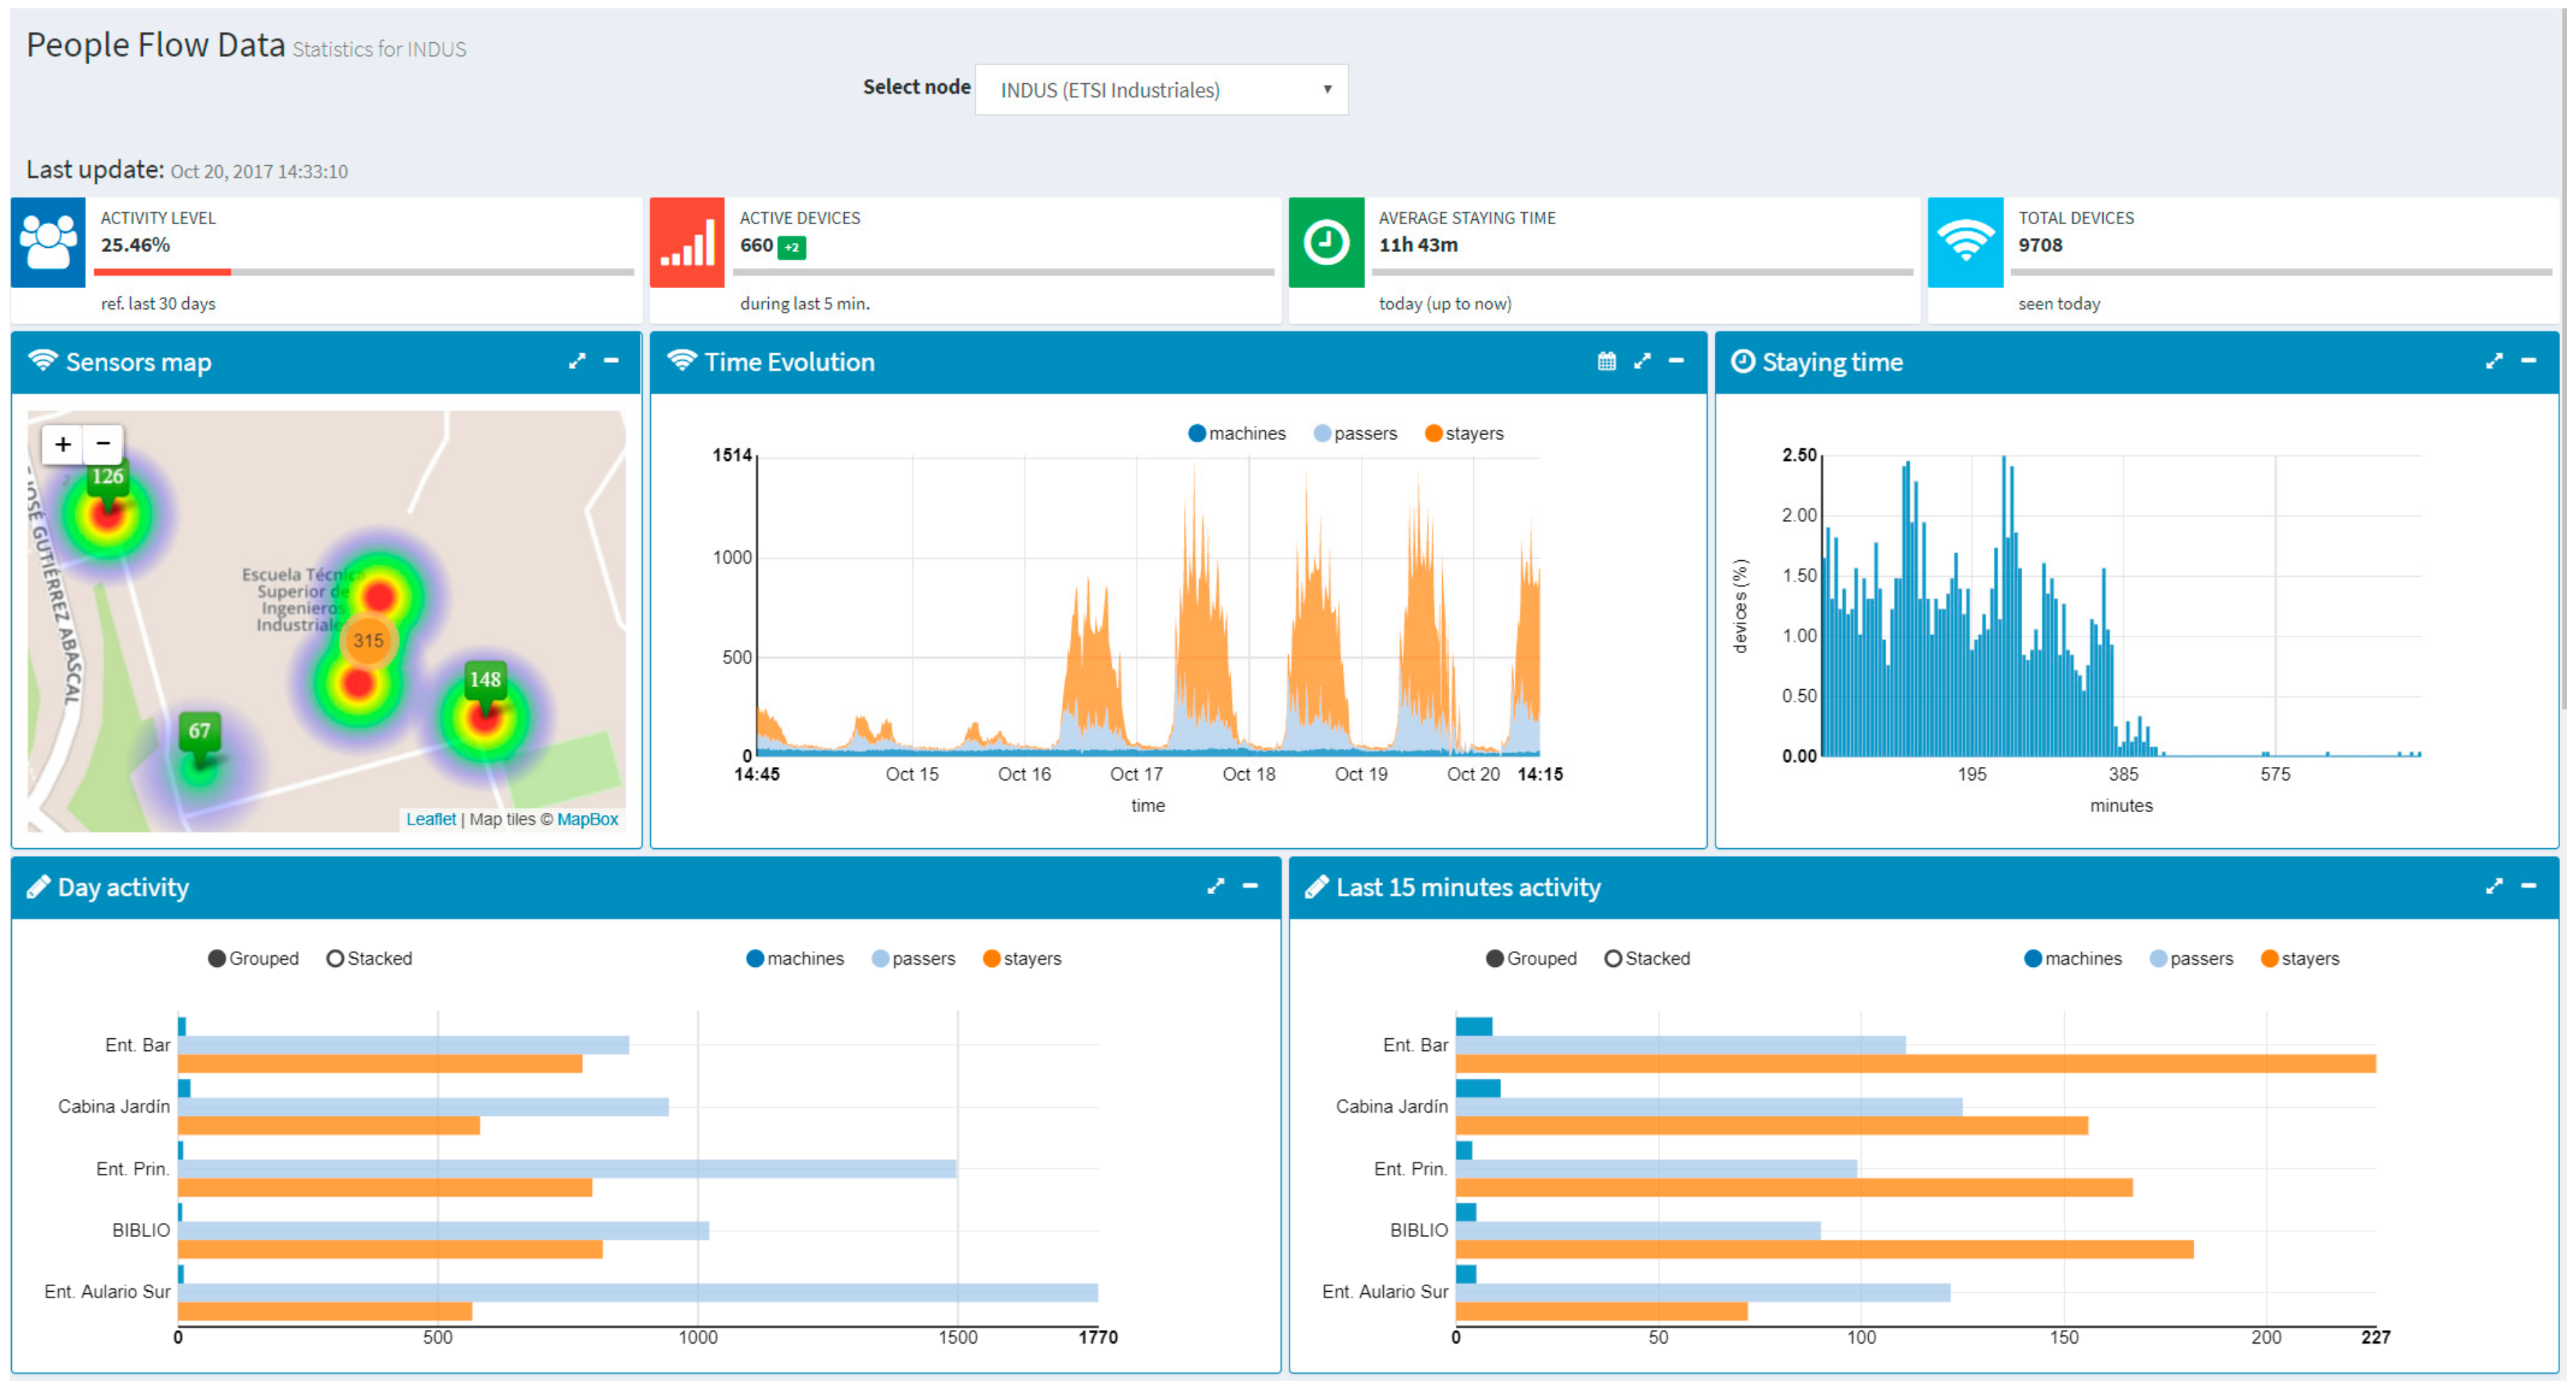
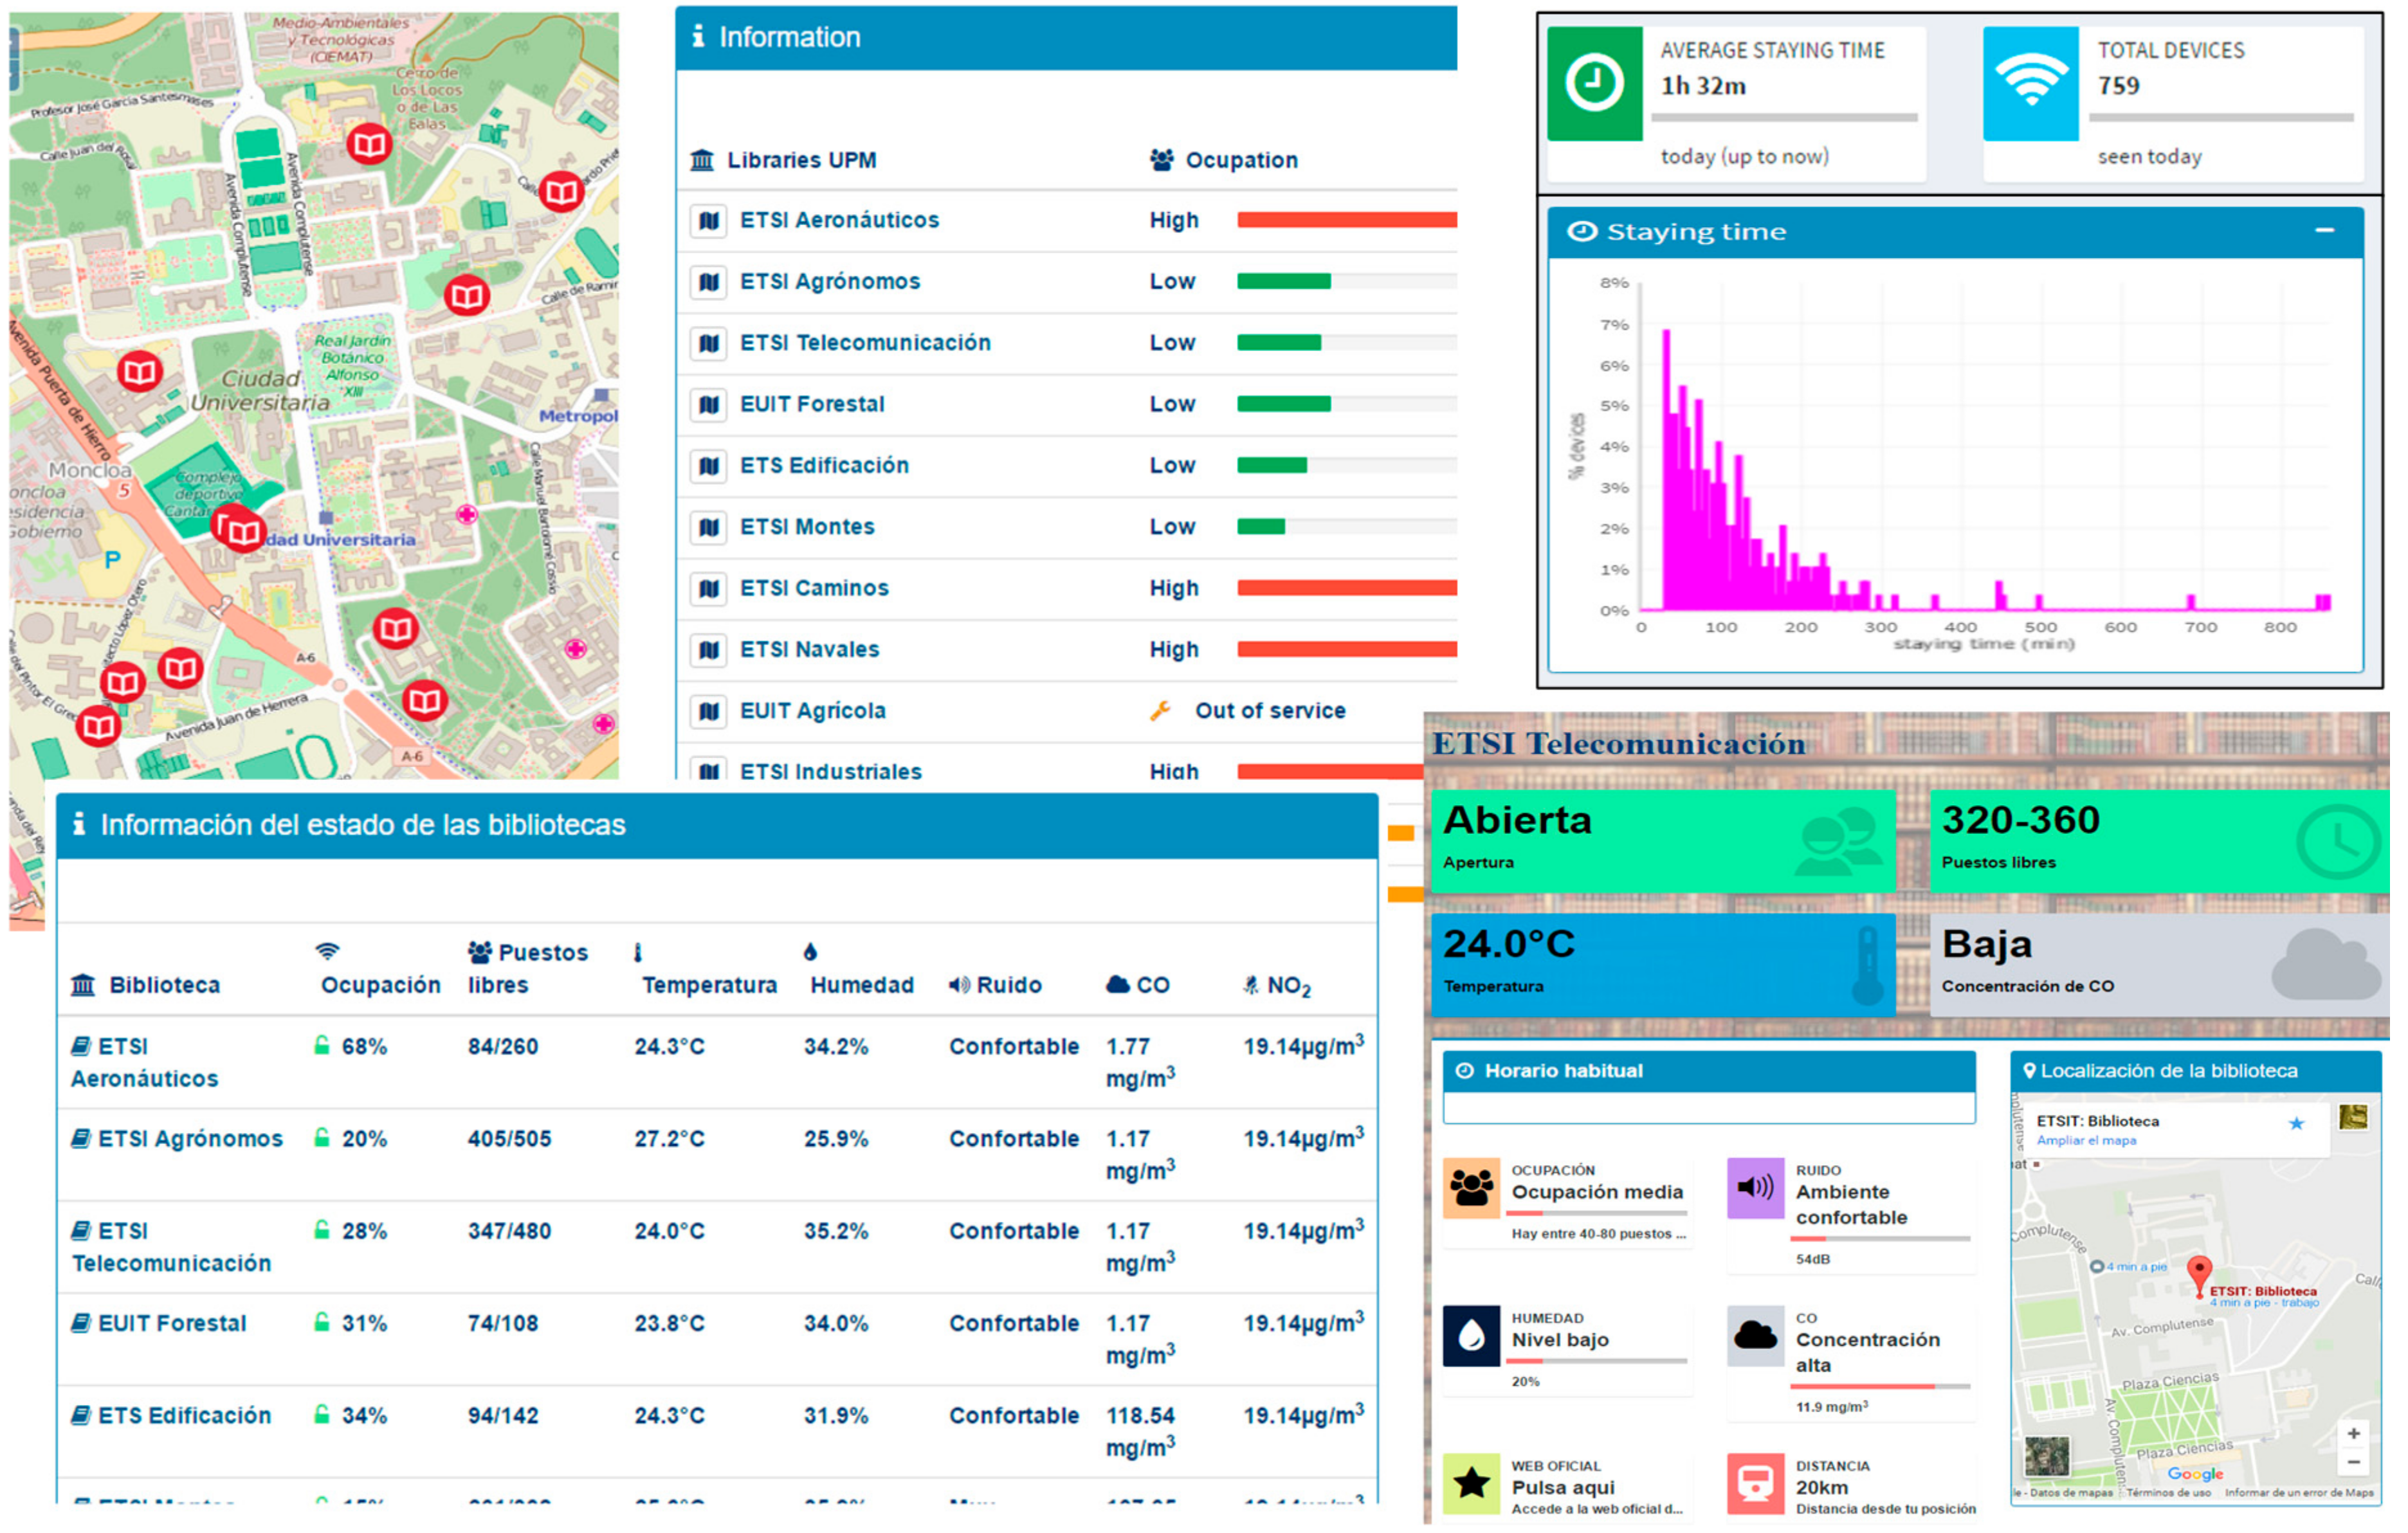
4.3. Use Case 3: Library Application
5. Discussion
6. Conclusions
Acknowledgments
Author Contributions
Conflicts of Interest
Abbreviations
| AI | Artificial Intelligence |
| AP | Access Point |
| API | Application Programming Interface |
| MAC | Medium Access Control |
| CEI | Campus of International Excellence |
| CoAP | Constrained Application Protocol |
| CSV | Comma Separated Value |
| D2D | Device-to-Device |
| DER | Distributed Energy Resources |
| ETSI | European Telecommunications Standards Institute |
| FTP | File Transport Protocol |
| GPS | Global Positioning System |
| HTTP | Hypertext Transfer Protocol |
| HVAC | Heating, Ventilation, and Air Conditioning |
| ICT | Information and Communications Technologies |
| IEEE | Institute of Electrical and Electronics Engineers |
| IP | Internet Protocol |
| IoT | Internet of Things |
| JSON | JavaScript Object Notation |
| LPWAN | Low Power Wide Area Network |
| LTE | Long Term Evolution |
| M2M | Machine-to-Machine |
| MEMS | Microelectromechanical Sensor |
| ML | Machine Learning |
| MQTT | Message Queuing Telemetry Transport |
| MSNP | Mobile Social Networks in Proximity |
| NB-IoT | Narrowband-IoT |
| OS | Operating System |
| QoS | Quality of Service |
| RWD | Responsive Web Design |
| SCK | Smart Citizen Kit |
| TCP | Transport Control Protocol |
| TLS | Transport Layer Security |
| UDP | User Datagram Protocol |
| UPM | Universidad Politécnica de Madrid |
| WLAN | Wireless Local Area Network |
| WPAN | Wireless Personal Area Network |
| XML | eXtensible Markup Language |
References
- Al-Fuqaha, A.; Guizani, M.; Mohammadi, M.; Aledhari, M.; Ayyash, M. Internet of Things: A Survey on Enabling Technologies, Protocols, and Applications. IEEE Commun. Surv. Tutor. 2015, 17, 2347–2376. [Google Scholar] [CrossRef]
- Zanella, A.; Bui, N.; Castellani, A.; Vangelista, L.; Zorzi, M. Internet of Things for Smart Cities. IEEE Internet Things J. 2014, 1, 22–32. [Google Scholar] [CrossRef]
- UPM City of the Future Initiative. Available online: http://blogs.upm.es/cityofthefuture-upm/en/initiative/ (accessed on 29 October 2017).
- Moncloa Campus of International Excellence. Available online: http://www.campusmoncloa.es/en/cei-campus-of-international-excellence.php (accessed on 29 October 2017).
- Minerva, R.; Biru, A.; Rotondi, D. Towards a definition of the IoT. IEEE Internet Initiative. 2015. Available online: https://iot.ieee.org/images/files/pdf/IEEE_IoT_Towards_Definition_Internet_of_Things_Revision1_27MAY15.pdf (accessed on 29 October 2017).
- IEEE P2413. Available online: http://grouper.ieee.org/groups/2413/ (accessed on 29 October 2017).
- Xu, L.D.; He, W.; Li, S. Internet of Things in Industries: A Survey. IEEE Trans. Ind. Inform. 2014, 10, 2233–2243. [Google Scholar] [CrossRef]
- OneM2M. Available online: http://www.onem2m.org/ (accessed on 29 October 2017).
- Dohler, M.; Boswarthick, D.; Alonso-Zárate, J. Machine-to-machine in smart cities & smart grids. In Proceedings of the IEEE Global Communications Conference Tutorial, Anaheim, CA, USA, 3–7 December 2012. [Google Scholar]
- Li, T.; Chang, H.; Wang, M.; Ni, B.; Hong, R.; Yan, S. Crowded Scene Analysis: A Survey. IEEE Trans. Circ. Syst. Video Technol. 2015, 25, 367–386. [Google Scholar] [CrossRef]
- El Mallah, J.; Carrino, F.; Khaled, O.A.; Mugellini, E. Crowd Monitoring. In Proceedings of the Third International Conference on Distributed, Ambient, and Pervasive Interactions, Los Angeles, CA, USA, 2–7 August 2015; Streitz, N., Markopoulos, P., Eds.; Springer: New York, NY, USA, 2015; Volume 9189, pp. 496–505. [Google Scholar] [CrossRef]
- Fernández-Ares, A.; Mora, A.M.; Arenas, M.G.; García-Sanchez, P.; Romero, G.; Rivas, V.; Castillo, P.A.; Merelo, J.J. Studying real traffic and mobility scenarios for a Smart City using a new monitoring and tracking system. Future Gener. Comput. Syst. 2017, 76, 163–179. [Google Scholar] [CrossRef]
- Alessandrini, A.; Gioia, C.; Sermi, F.; Sofos, I.; Tarchi, D.; Vespe, M. WiFi positioning and Big Data to monitor flows of people on a wide scale. In Proceedings of the 2017 European Navigation Conference (ENC), Lausanne, Switzerland, 9–16 May 2017; pp. 322–328. [Google Scholar] [CrossRef]
- Zhou, M.; Sui, K.; Ma, M.; Zhao, Y.; Pei, D.; Moscibroda, T. MobiCamp: A Campus-wide Testbed for Studying Mobile Physical Activities. In Proceedings of the 3rd International Workshop on Physical Analytics (WPA 2016), Singapore, 26 June 2016; ACM: New York, NY, USA, 2016; pp. 1–6. [Google Scholar] [CrossRef]
- Suciu, G.; Vochin, M.; Diaconu, C.; Suciu, V.; Butca, C. Convergence of software defined radio: WiFi, ibeacon and epaper. In Proceedings of the 2016 15th RoEduNet Conference: Networking in Education and Research, Bucharest, Romania, 7–9 September 2016; pp. 1–5. [Google Scholar] [CrossRef]
- Wi-Fi Tracking at London Underground. Available online: http://www.gizmodo.co.uk/2017/09/london-underground-wifi-tracking-heres-everything-we-learned-from-tfls-official-report/ (accessed on 29 October 2017).
- Wi-Fi Tracking in British Museums. Available online: http://www.gizmodo.co.uk/2017/04/exclusive-heres-what-museums-learn-by-tracking-your-phone/ (accessed on 29 October 2017).
- Wi-Fi Tracking at Helsinki Airport. Available online: http://www.telegraph.co.uk/travel/news/Big-Brother-airport-installs-worlds-first-real-time-passenger-tracking-system/ (accessed on 29 October 2017).
- Martin, J.; Mayberry, T.; Donahue, C.; Foppe, L.; Brown, L.; Riggins, C.; Rye, E.C.; Brown, D. A Study of MAC Address Randomization in Mobile Devices and When it Fails. arXiv, 2017; arXiv:1703.02874v2. [Google Scholar]
- Raspberry Pi. Available online: https://www.raspberrypi.org/ (accessed on 29 October 2017).
- Aircrack-ng. Available online: https://www.aircrack-ng.org/ (accessed on 29 October 2017).
- Kotsev, A.; Schade, S.; Craglia, M.; Gerboles, M.; Spinelle, L.; Signorini, M. Next Generation Air Quality Platform: Openness and Interoperability for the Internet of Things. Sensors 2016, 16, 403. [Google Scholar] [CrossRef] [PubMed]
- Shah, J.; Mishra, B. IoT enabled environmental monitoring system for smart cities. In Proceedings of the 2016 International Conference on Internet of Things and Applications (IOTA), Pune, India, 22–24 January 2016; pp. 383–388. [Google Scholar] [CrossRef]
- Brienza, S.; Galli, A.; Anastasi, G.; Bruschi, P. A Low-Cost Sensing System for Cooperative Air Quality Monitoring in Urban Areas. Sensors 2015, 15, 12242–12259. [Google Scholar] [CrossRef] [PubMed]
- MIT Tata Center Air Pollution Monitoring Using Low-Cost Sensors. Available online: https://tatacenter.mit.edu/portfolio/air-pollution-sensors/ (accessed on 29 October 2017).
- Ibrahim, M.; Elgamri, A.; Babiker, S.; Mohamed, A. Internet of things based smart environmental monitoring using the Raspberry-Pi computer. In Proceedings of the 2015 Fifth International Conference on Digital Information Processing and Communications (ICDIPC), Sierre, Switzerland, 7–9 October 2015; pp. 159–164. [Google Scholar] [CrossRef]
- Kelly, S.D.T.; Suryadevara, N.K.; Mukhopadhyay, S.C. Towards the Implementation of IoT for Environmental Condition Monitoring in Homes. IEEE Sens. J. 2013, 13, 3846–3853. [Google Scholar] [CrossRef]
- Smart Citizen. Available online: https://smartcitizen.me/ (accessed on 29 October 2017).
- Arduino. Available online: https://www.arduino.cc/ (accessed on 29 October 2017).
- MiCS-4514 Datasheet. Available online: http://files.manylabs.org/datasheets/MICS-4514.pdf (accessed on 29 October 2017).
- Lopez, G.; Moreno, J.I.; Amarıs, H.; Salazar, F. Paving the road toward Smart Grids through large-scale advanced metering infrastructures. Electr. Power Syst. Res. 2015, 120, 194–205. [Google Scholar] [CrossRef]
- Raza, U.; Kulkarni, P.; Sooriyabandara, M. Low Power Wide Area Networks: An Overview. IEEE Commun. Surv. Tutor. 2017, 19, 855–873. [Google Scholar] [CrossRef]
- Karagiannis, V.; Chatzimisios, P.; Vázquez-Gallego, F.; Alonso-Zarate, J. A Survey on Application Layer Protocols for the Internet of Things. Trans. IoT Cloud Comput. 2015, 1, 11–17. [Google Scholar]
- International Organization for Standardization. ISO/IEC 20922:2016 Information Technology—Message Queuing Telemetry Transport (MQTT) v3.1.1; International Organization for Standardization: Geneva, Switzerland, 2016. [Google Scholar]
- Shelby, Z.; Hartke, K.; Bormann, C. The Constrained Application Protocol (CoAP). RFC 7252, 2014. Available online: https://tools.ietf.org/html/rfc7252 (accessed on 29 October 2017).
- Mosquitto. Available online: https://mosquitto.org/ (accessed on 29 October 2017).
- Vanhoef, M.; Piessens, F. Key Reinstallation Attacks: Forcing Nonce Reuse in WPA2. In Proceedings of the ACM Conference on Computer and Communications Security, Dallas, TX, USA, 30 October–3 November 2017; Available online: https://www.krackattacks.com/ (accessed on 29 October 2017).
- Arduino Client for MQTT. Available online: https://pubsubclient.knolleary.net/ (accessed on 29 October 2017).
- Chen, F.; Deng, P.; Wan, J.; Zhang, D.; Vasilakos, A.V.; Rong, X. Data Mining for the Internet of Things: Literature Review and Challenges. Int. J. Distrib. Sen. Netw. 2015. [Google Scholar] [CrossRef]
- Mahdavinejad, M.S.; Rezvan, M.; Barekatain, M.; Adibi, P.; Barnaghi, P.; Sheth, A.P. Machine learning for Internet of Things data analysis: A survey. Digit. Commun. Netw. 2017. [Google Scholar] [CrossRef]
- Fekete, J.D. Visual Analytics Infrastructures: From Data Management to Exploration. Computer 2013, 46, 22–29. [Google Scholar] [CrossRef]
- Jensen, S.K.; Pedersen, T.B.; Thomsen, C. Time Series Management Systems: A Survey. IEEE Trans. Knowl. Data Eng. 2017, 29, 2581–2600. [Google Scholar] [CrossRef]
- Smart CEI Moncloa Dashboard. Available online: http://ceiboard.dit.upm.es/dashboard/ (accessed on 29 October 2017).
- Bootstrap. Available online: http://getbootstrap.com/ (accessed on 29 October 2017).
- D3.js (Data-Driven Documents). Available online: https://d3js.org/ (accessed on 29 October 2017).
- nvd3.js (Reusable charts for d3.js). Available online: http://nvd3.org/examples/index.html (accessed on 29 October 2017).
- leaflet.js. Available online: http://leafletjs.com/ (accessed on 29 October 2017).
- JavaScript Node.js. Available online: https://nodejs.org/en/ (accessed on 29 October 2017).
- Node Express.js. Available online: http://expressjs.com/es/ (accessed on 29 October 2017).
- Smart Emergency Management Application. Available online: http://cityofthefuture-upm.com/upm-students-awarded-by-telefonica-for-smart-city-emergency-management/ (accessed on 29 October 2017).
- Madrid City Council Air Quality Monitoring System. Available online: http://www.mambiente.munimadrid.es/sica/ (accessed on 29 October 2017).
- Library Application. Available online: http://ceiboard.dit.upm.es/smartcampus/biblio (accessed on 29 October 2017).
- Castell, N.; Dauge, F.R.; Schneider, P.; Vogt, M.; Lerner, U.; Fishbain, B.; Broday, D.; Bartonova, A. Can commercial low-cost sensor platforms contribute to air quality monitoring and exposure estimates? Environ. Int. 2017, 99, 293–302. [Google Scholar] [CrossRef] [PubMed]
- Atzori, L.; Iera, A.; Morabito, G. The Internet of Things: A survey. Comput. Netw. 2010, 54, 2787–2805. [Google Scholar] [CrossRef]
- Razzaque, M.A.; Milojevic-Jevric, M.; Palade, A.; Clarke, S. Middleware for Internet of Things: A Survey. IEEE Internet Things J. 2016, 3, 70–95. [Google Scholar] [CrossRef]
- Thread. Available online: http://threadgroup.org/ (accessed on 4 December 2017).
- OpenHAB. Available online: http://www.openhab.org/ (accessed on 4 December 2017).
- Sicari, S.; Rizzardi, A.; Miorandi, D.; Coen-Porisini, A. Dynamic Policies in Internet of Things: Enforcement and Synchronization. IEEE Internet Things J. 2017. [Google Scholar] [CrossRef]
- Sicari, S.; Rizzardi, A.; Miorandi, D.; Capiello, C.; Coen-Porisini, A. A secure and quality-aware prototypical architecture for the Internet of Things. Inf. Syst. 2016, 58, 43–55. [Google Scholar] [CrossRef]
- Wang, Y.; Wei, L.; Jin, Q.; Ma, J. Alljoyn Based Direct Proximity Service Development: Overview and Prototype. In Proceedings of the 2014 IEEE 17th International Conference on Computational Science and Engineering, Chengdu, China, 19–21 December 2014; pp. 634–641. [Google Scholar] [CrossRef]
- MongoDB. Available online: https://www.mongodb.com/ (accessed on 29 October 2017).


© 2017 by the authors. Licensee MDPI, Basel, Switzerland. This article is an open access article distributed under the terms and conditions of the Creative Commons Attribution (CC BY) license (http://creativecommons.org/licenses/by/4.0/).
Share and Cite
Alvarez-Campana, M.; López, G.; Vázquez, E.; Villagrá, V.A.; Berrocal, J. Smart CEI Moncloa: An IoT-based Platform for People Flow and Environmental Monitoring on a Smart University Campus. Sensors 2017, 17, 2856. https://doi.org/10.3390/s17122856
Alvarez-Campana M, López G, Vázquez E, Villagrá VA, Berrocal J. Smart CEI Moncloa: An IoT-based Platform for People Flow and Environmental Monitoring on a Smart University Campus. Sensors. 2017; 17(12):2856. https://doi.org/10.3390/s17122856
Chicago/Turabian StyleAlvarez-Campana, Manuel, Gregorio López, Enrique Vázquez, Víctor A. Villagrá, and Julio Berrocal. 2017. "Smart CEI Moncloa: An IoT-based Platform for People Flow and Environmental Monitoring on a Smart University Campus" Sensors 17, no. 12: 2856. https://doi.org/10.3390/s17122856
APA StyleAlvarez-Campana, M., López, G., Vázquez, E., Villagrá, V. A., & Berrocal, J. (2017). Smart CEI Moncloa: An IoT-based Platform for People Flow and Environmental Monitoring on a Smart University Campus. Sensors, 17(12), 2856. https://doi.org/10.3390/s17122856