Micro-Droplet Detection Method for Measuring the Concentration of Alkaline Phosphatase-Labeled Nanoparticles in Fluorescence Microscopy


Abstract
:1. Introduction
2. Methods
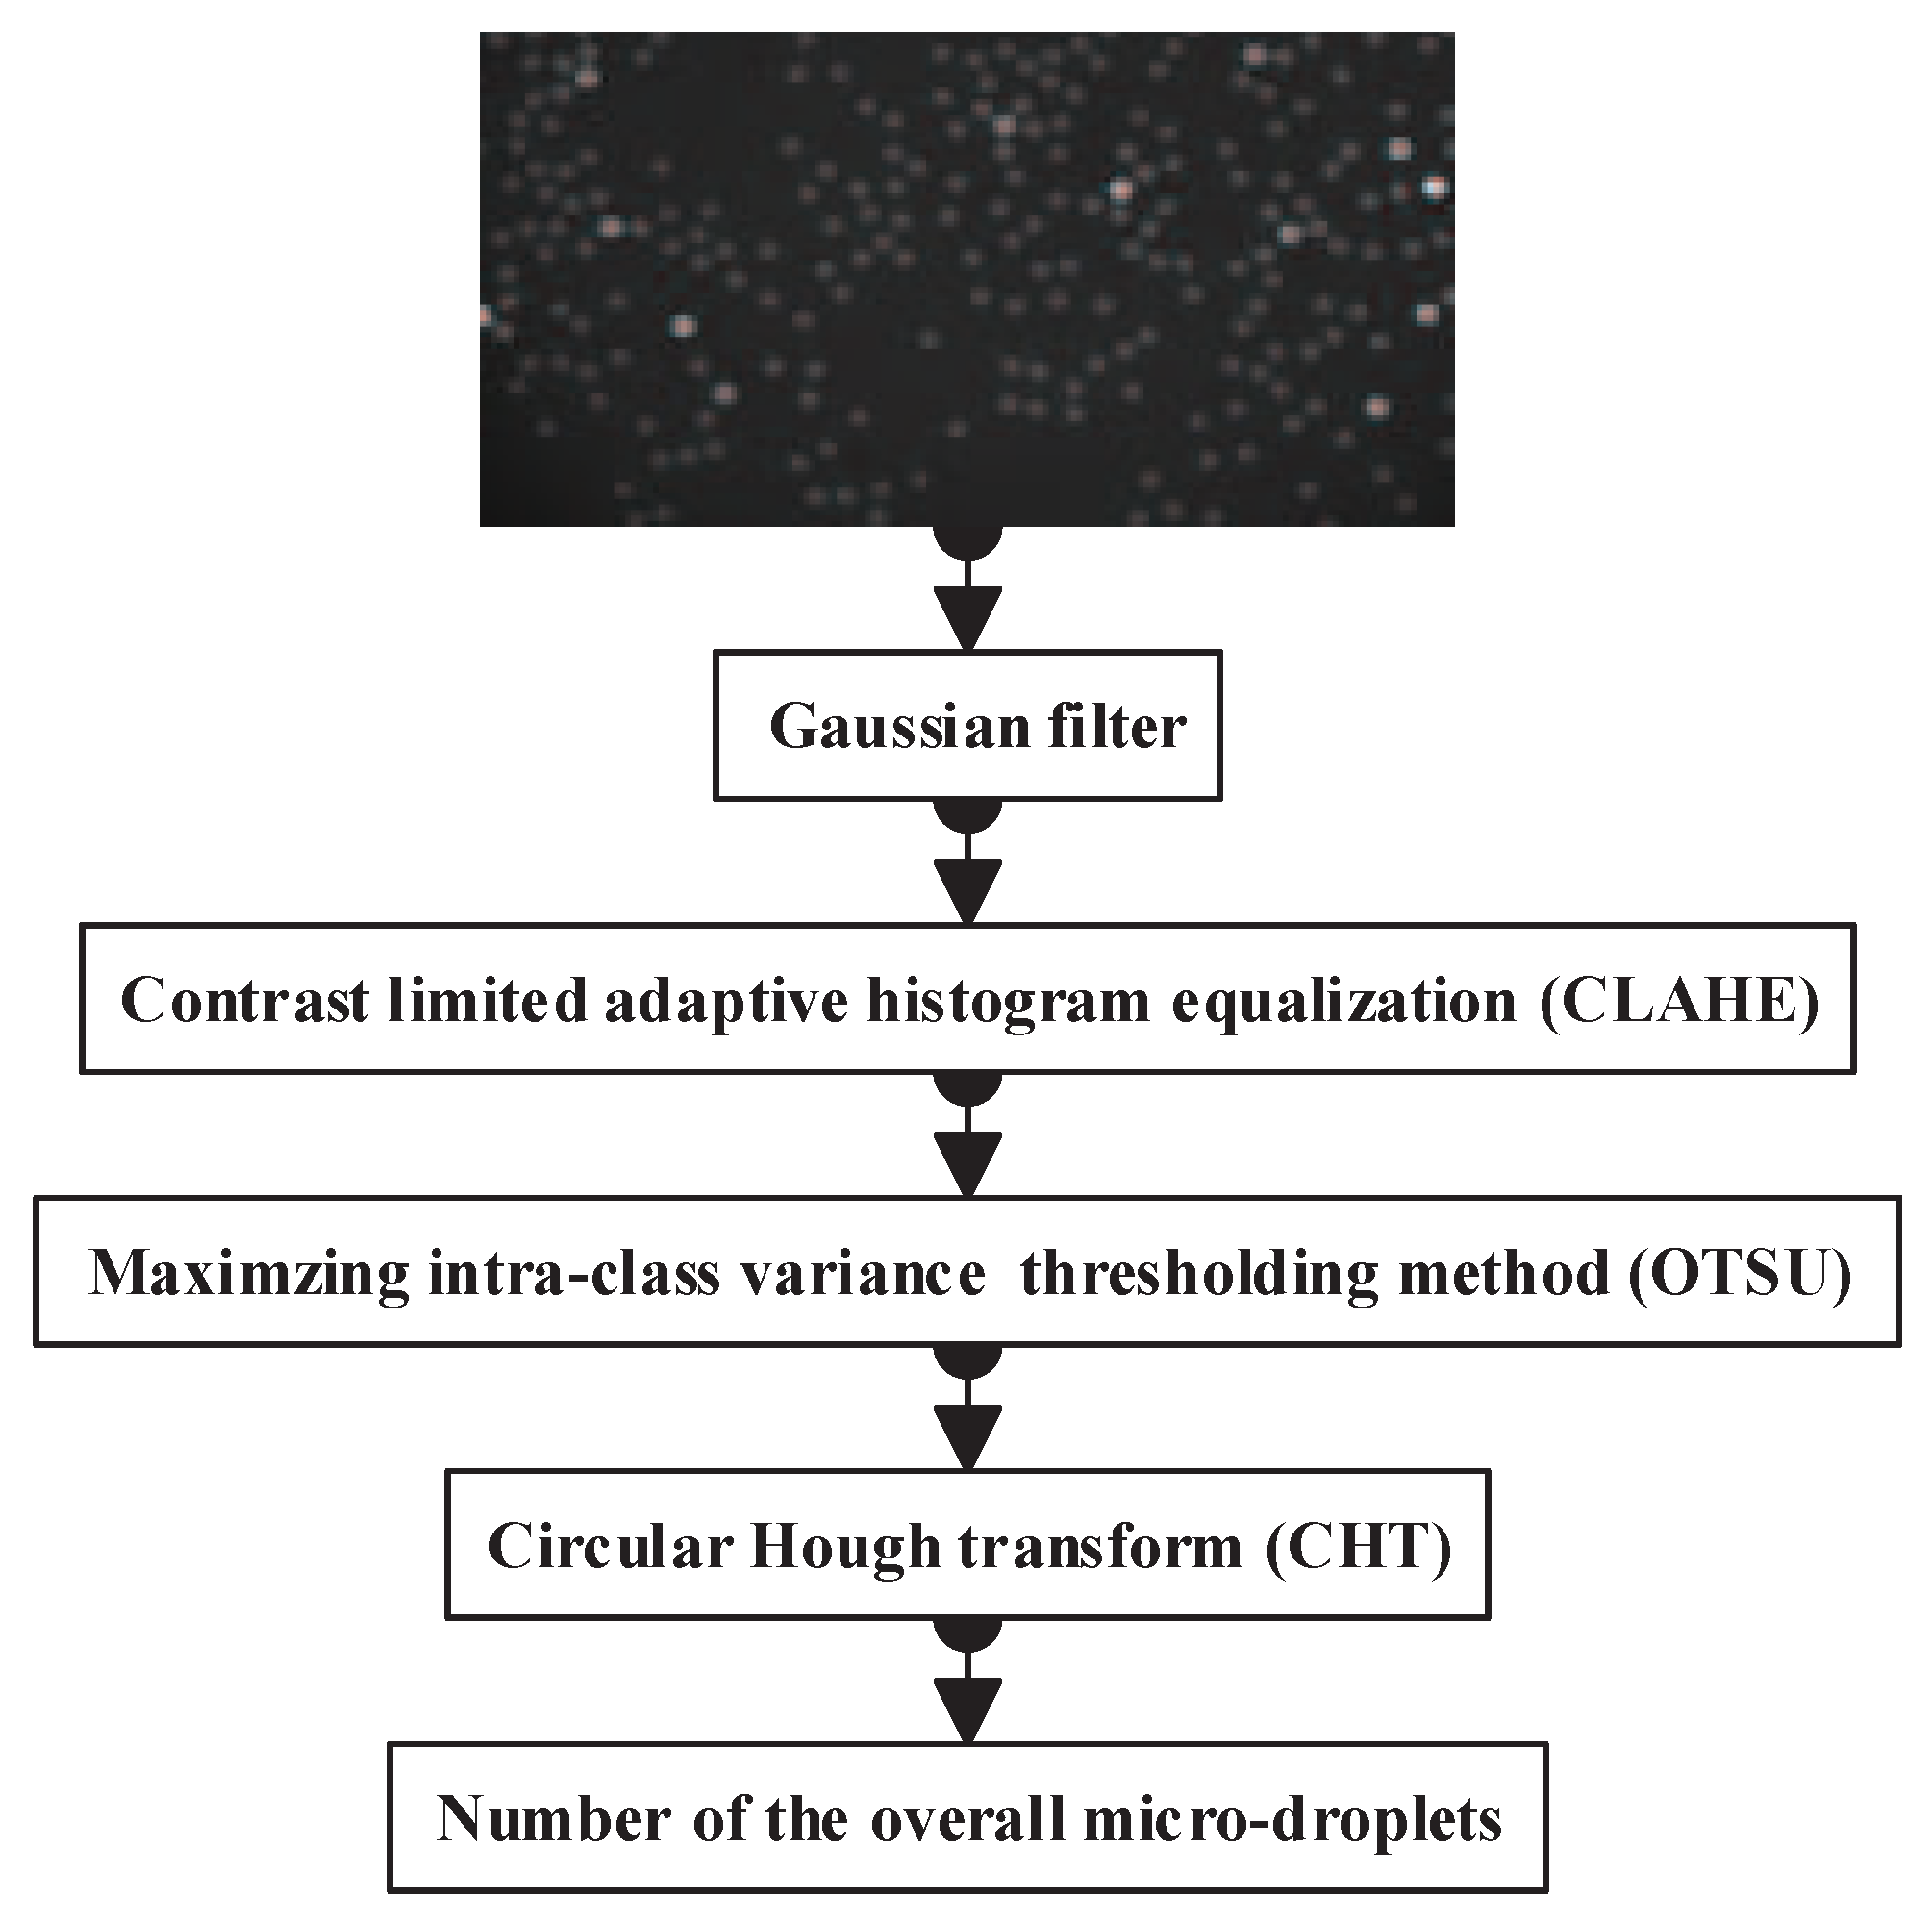
2.1. Overall Micro-Droplet Detection
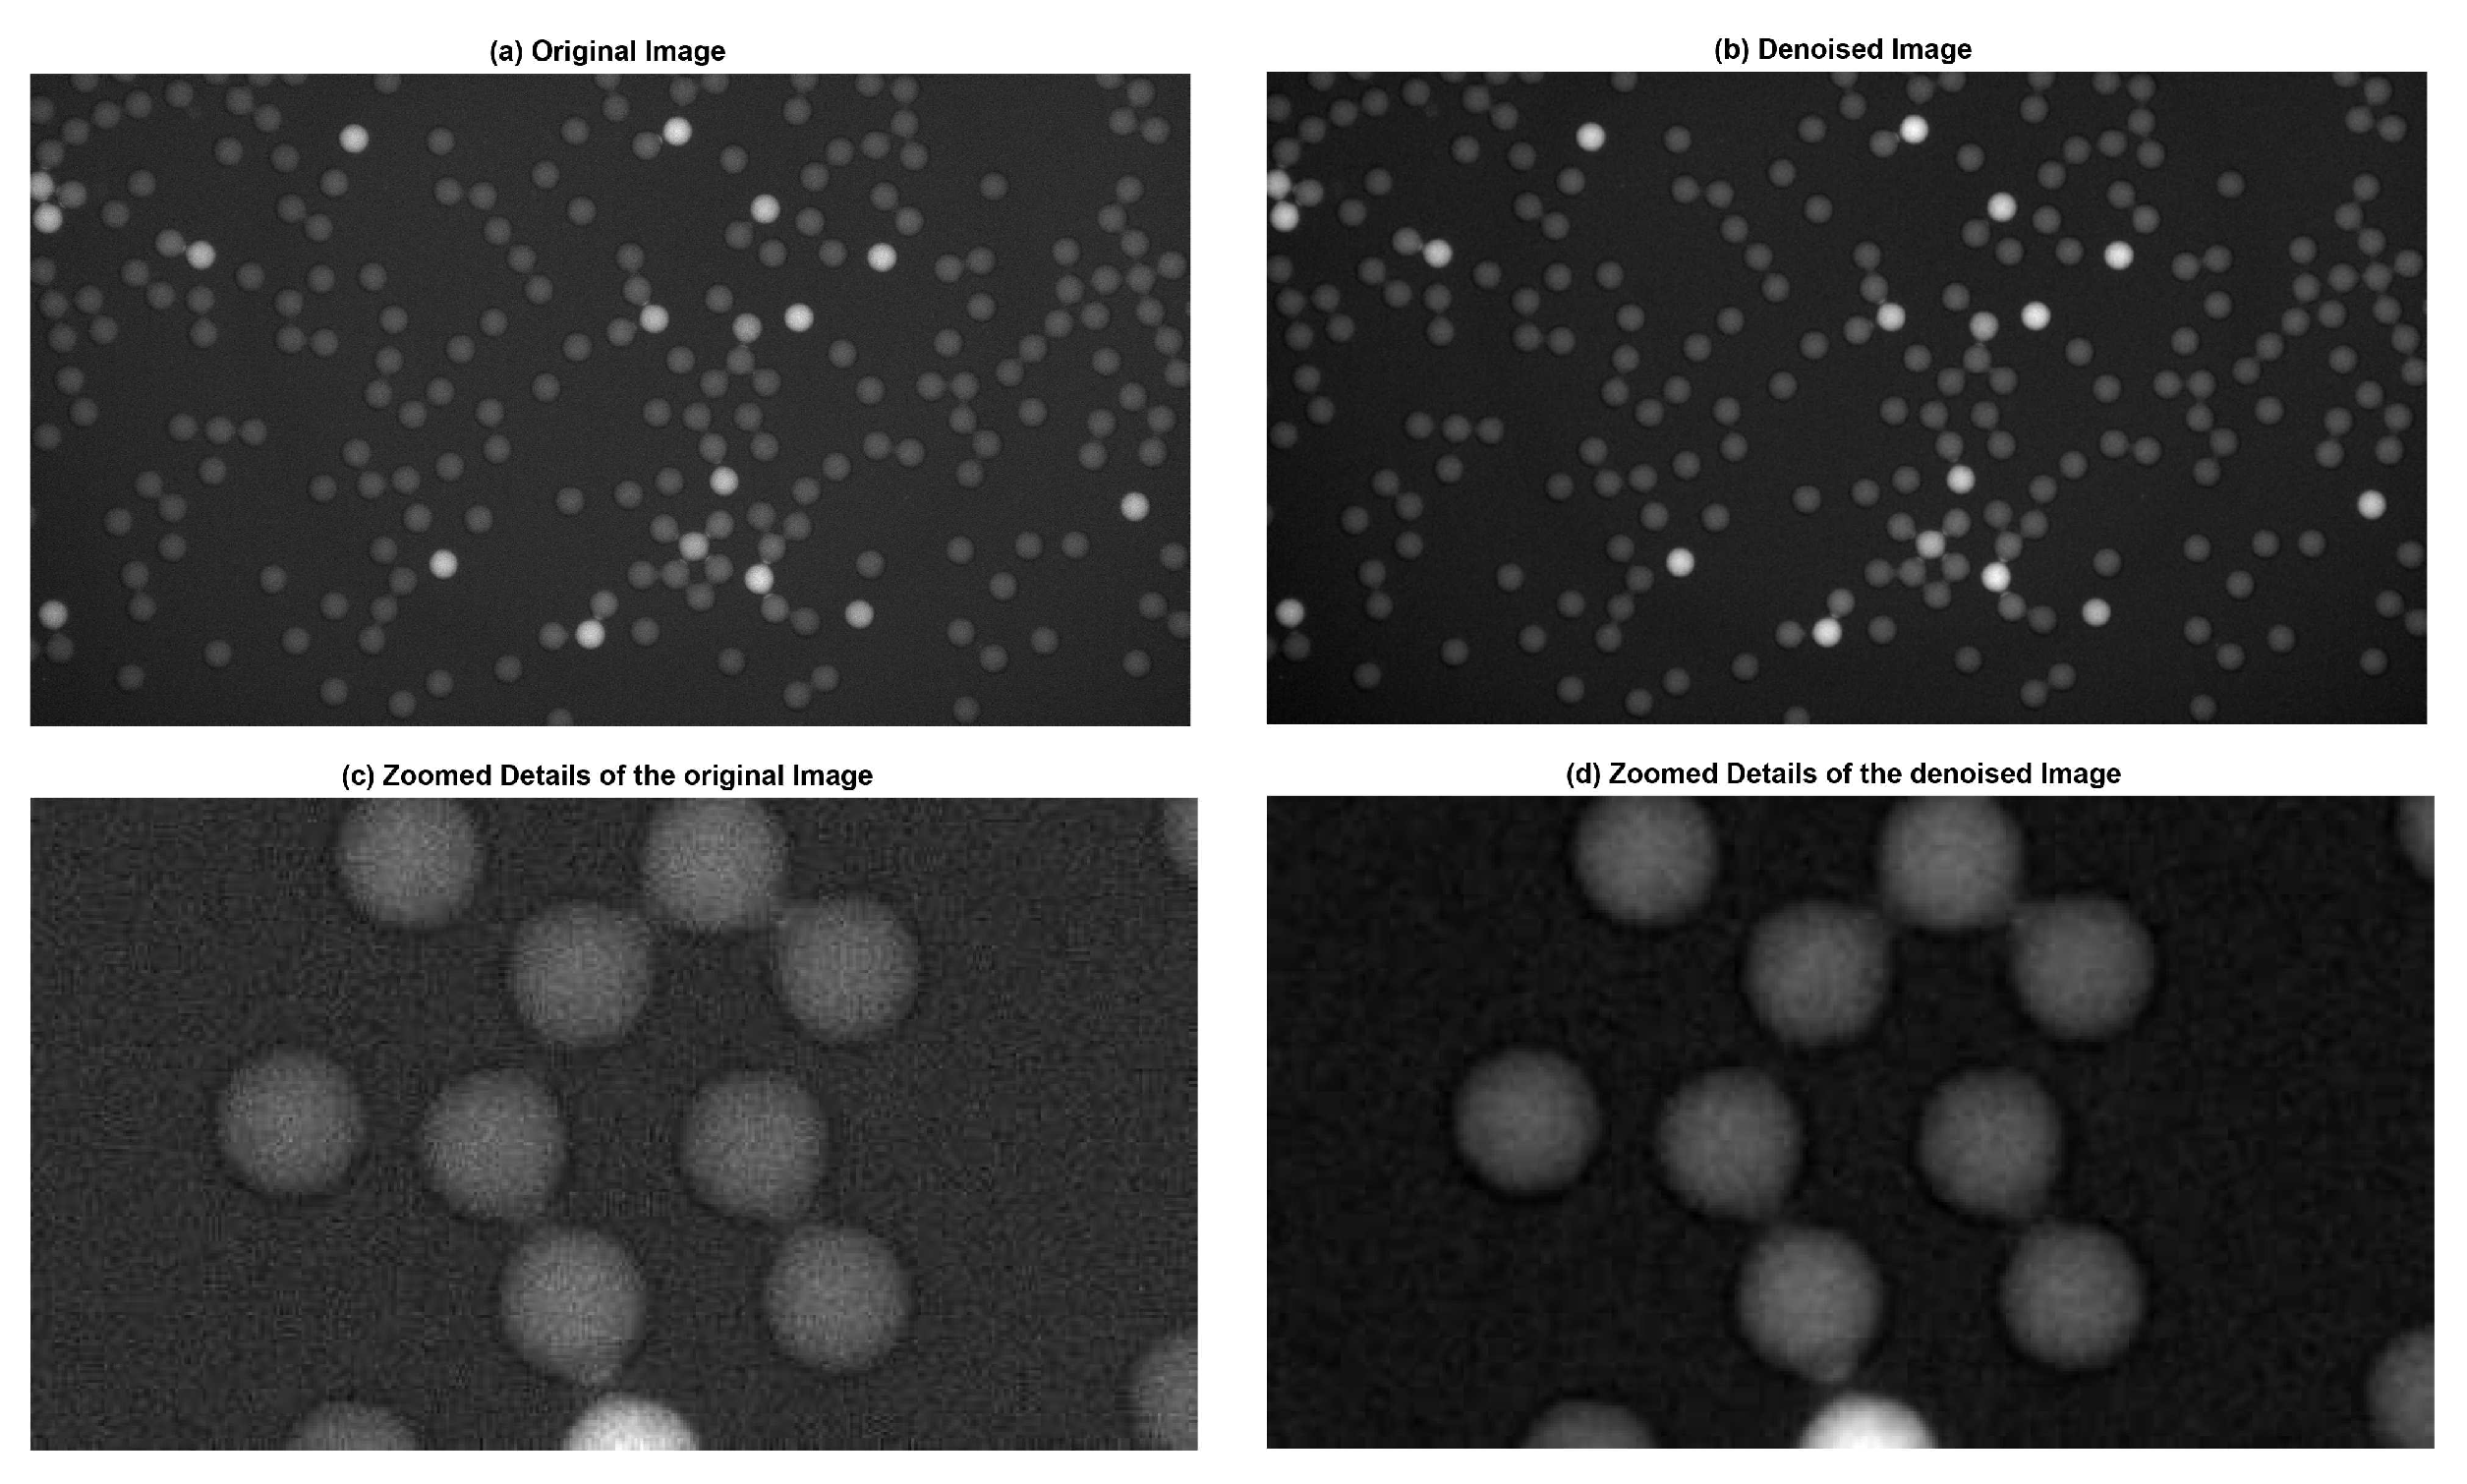
2.1.1. Noise Reduction with the Gaussian Filter
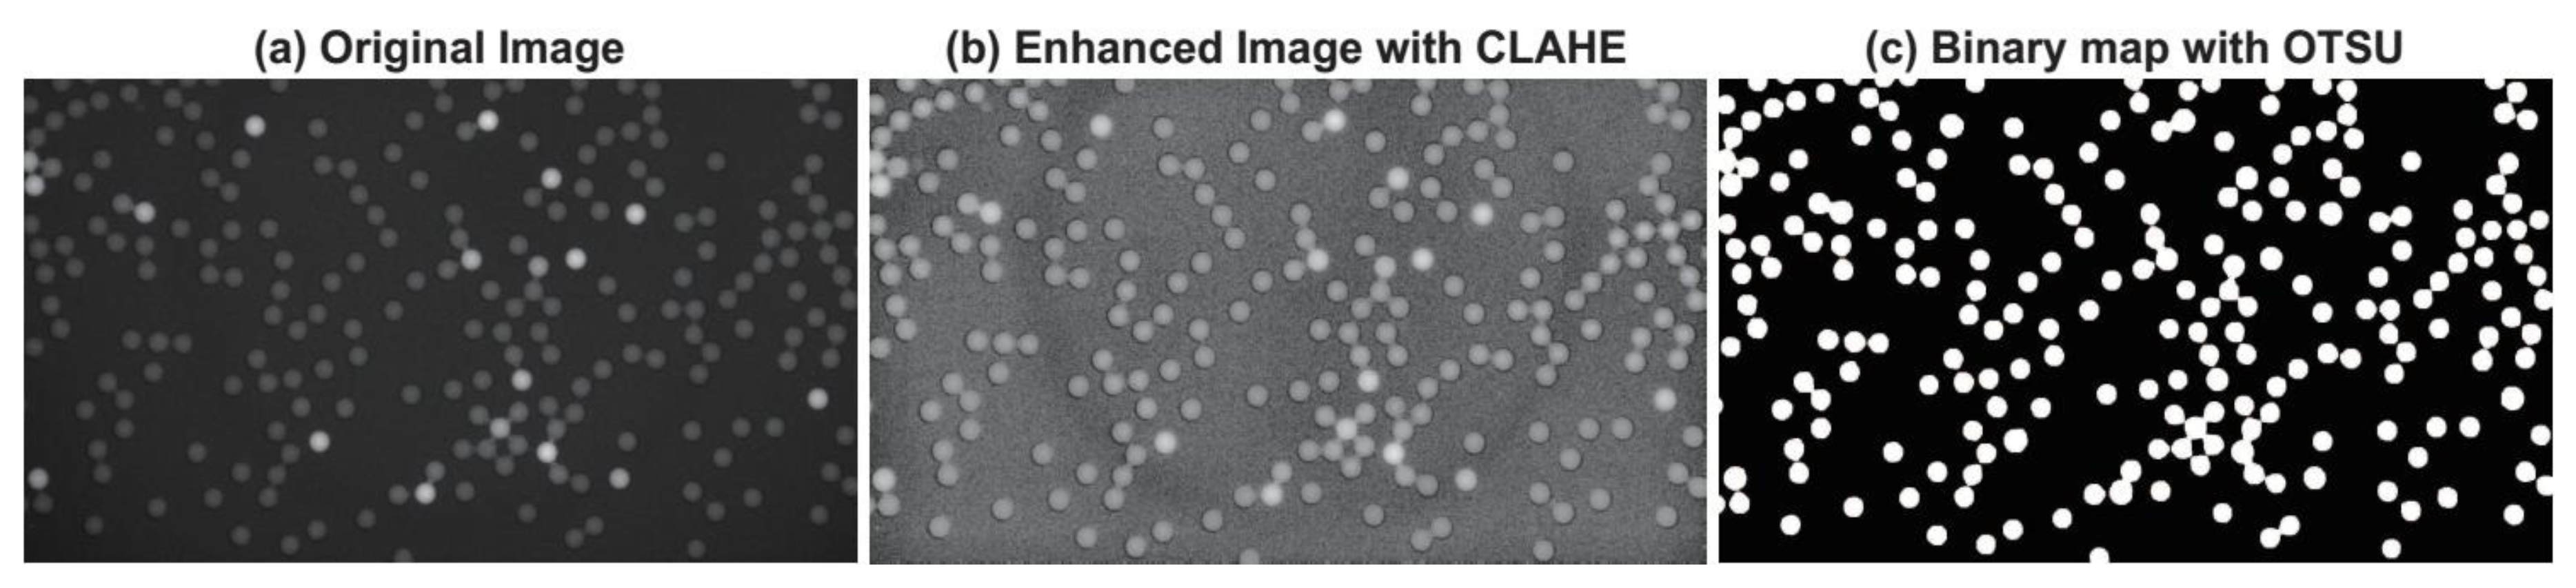
2.1.2. Contrast Limited Adaptive Histogram Equalization
2.1.3. Maximizing inter-class Variance Thresholding Method
2.1.4. Circle Detection via Circular Hough Transform
- Accumulator array computation:The edge detection is carried out on the binary map to get an edge image (L). The edge pixels of L are designated as candidate pixels and are allowed to cast ‘votes’ in the accumulator array A(a), which represents the weight of the circle with a fixed radius and the center of the circle. Here, . (a, b) represents the space location of pixels, and r is the radius of the expected circle. At the beginning, all the elements of A(a) are set to 0.
- Center and radius estimation:For every pixel x of the fluorescence image, we accumulate all the units of A(a) that satisfy the function . is the analytical expression of circle:Finally, the circular centers and radii are estimated by detecting the peaks in the accumulator array. We can get the number of micro-droplets by counting the centers of detected circles.
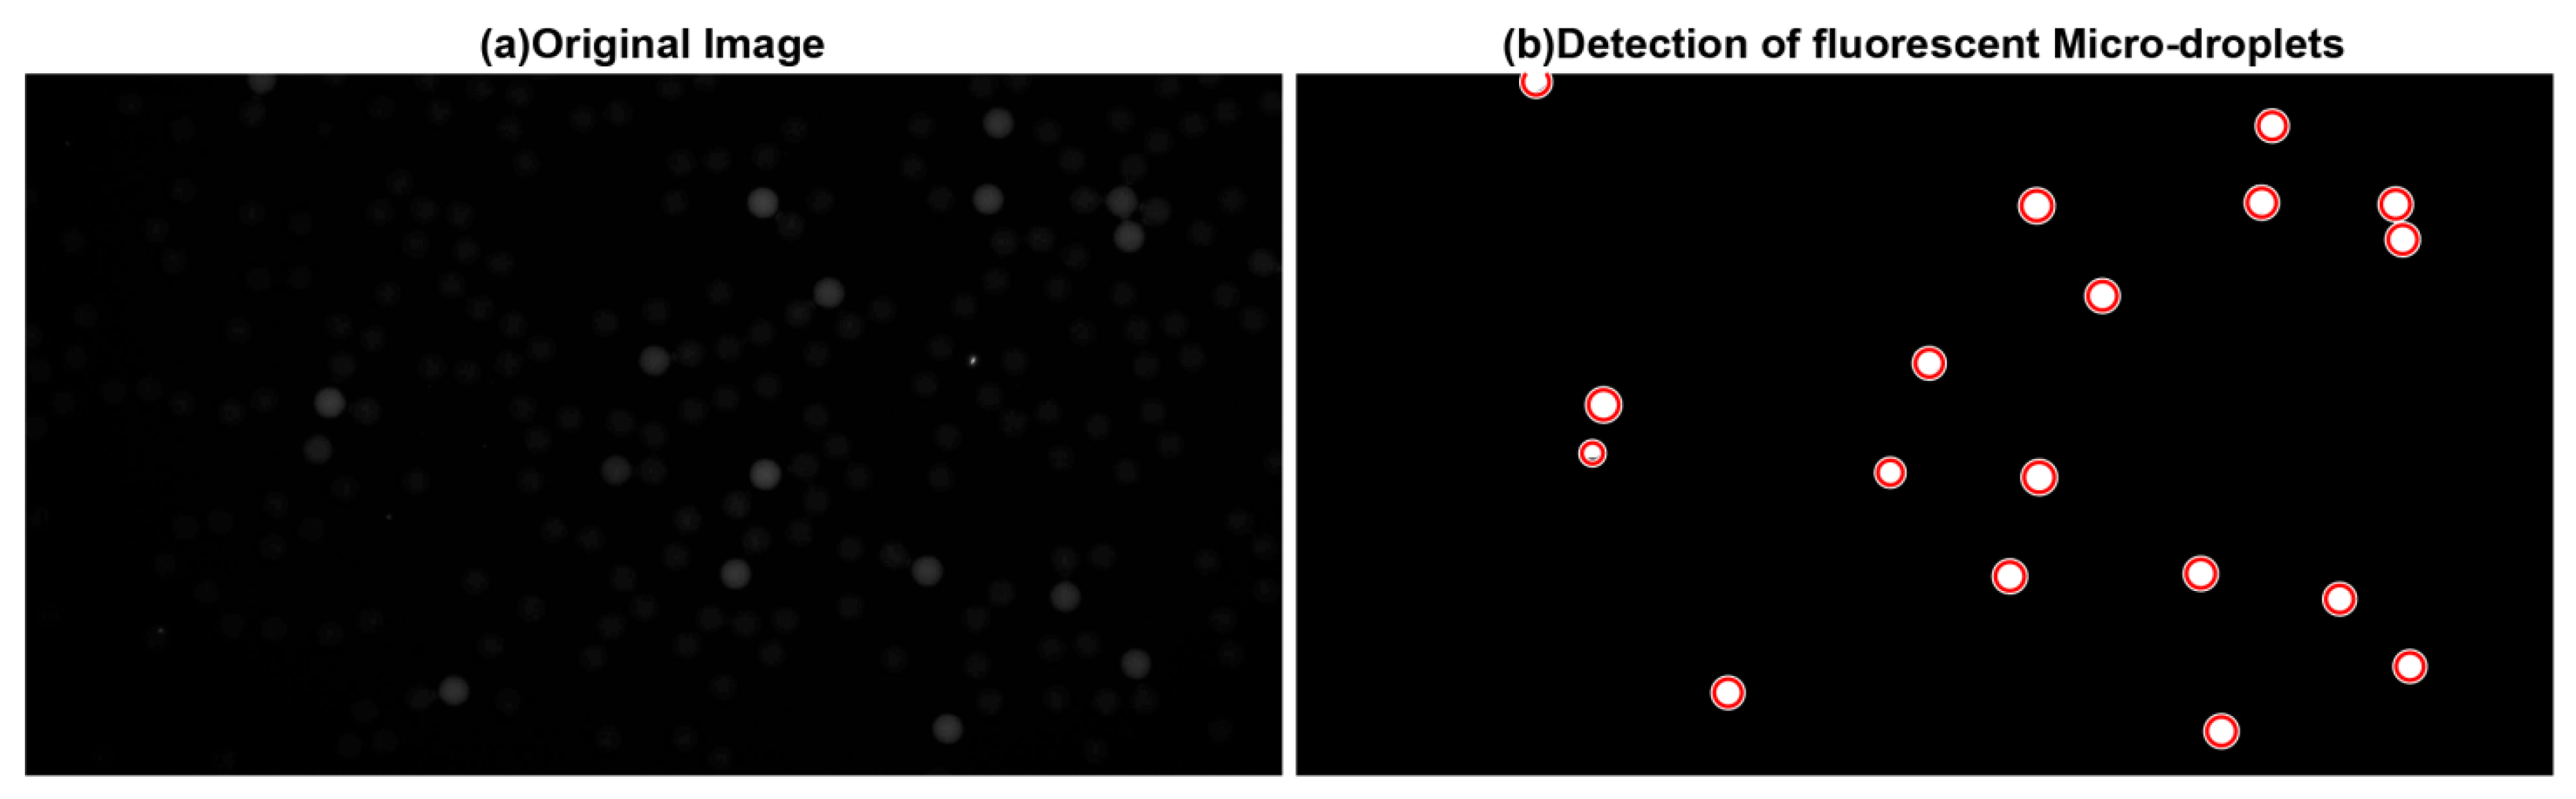
2.2. Fluorescent Micro-Droplet Detection
2.3. Measurement of AP-Labeled Nanoparticle Concentration
2.4. Evaluation
2.5. Code
3. Results
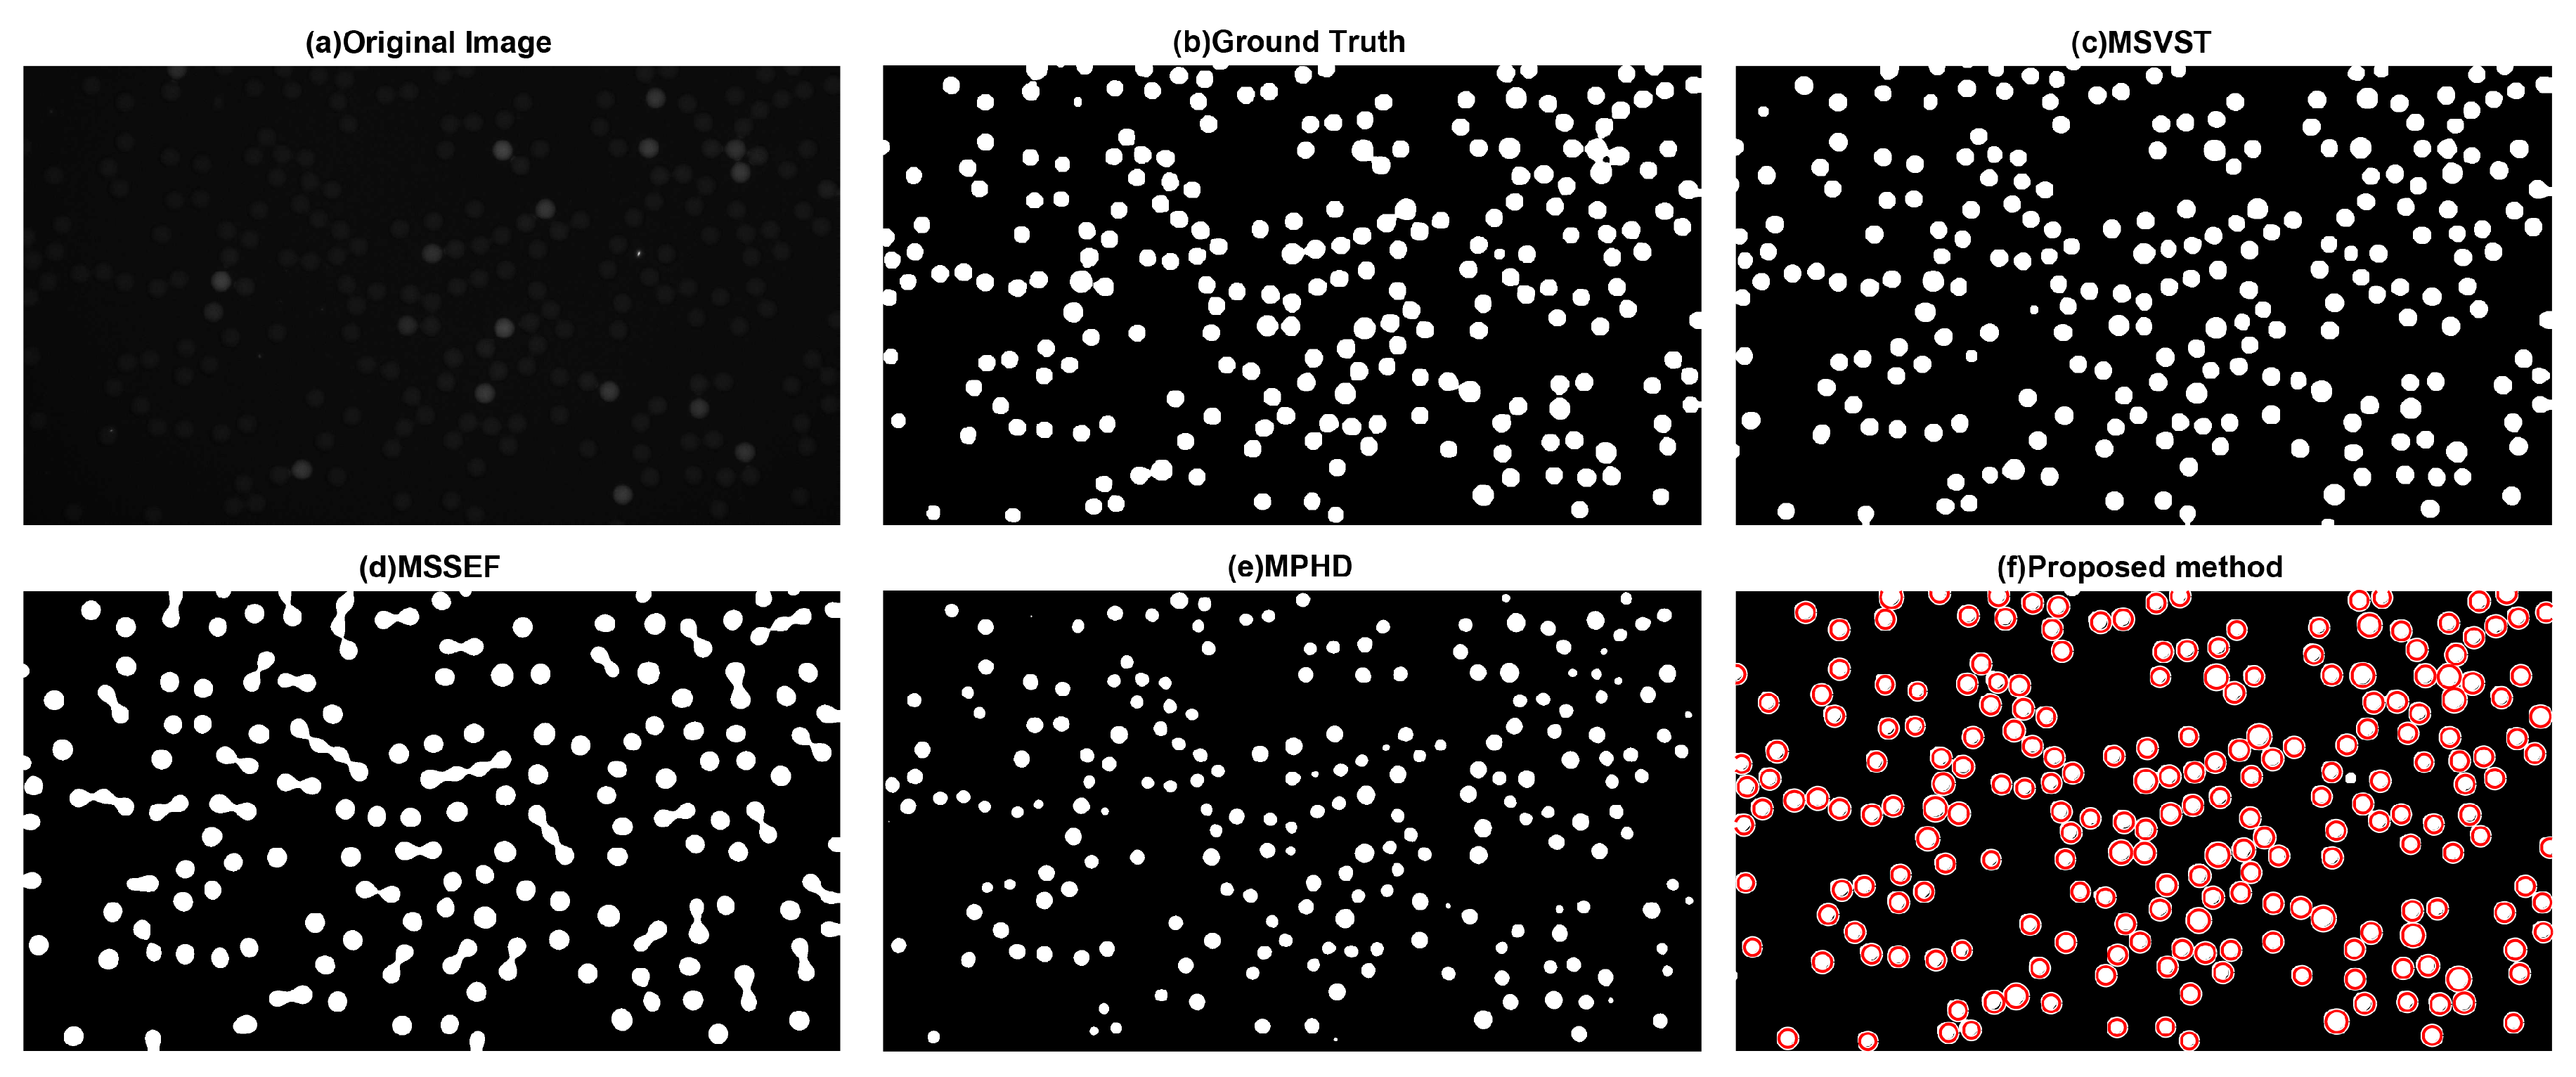
3.1. Overall Micro-Droplet Detection
3.1.1. Visual Evaluation
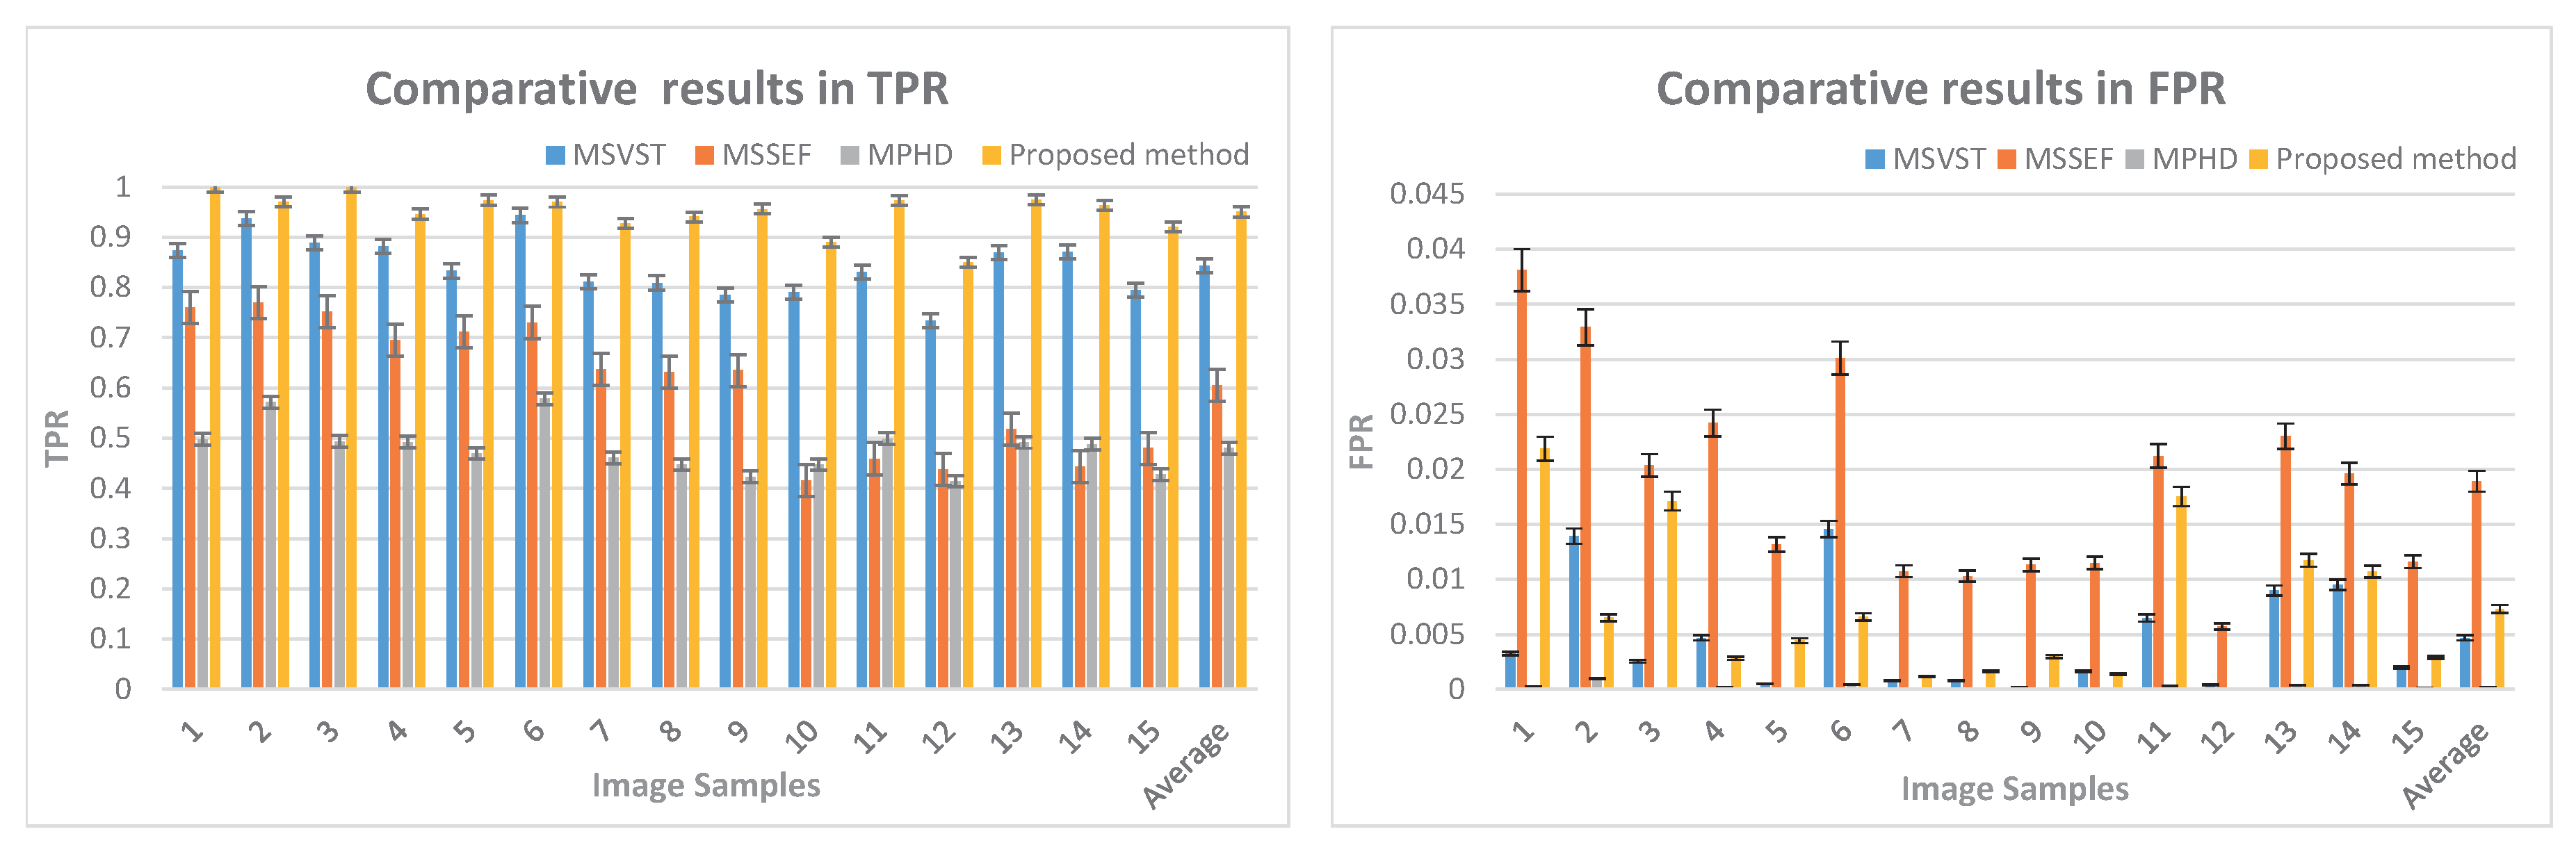
3.1.2. TPR and FPR
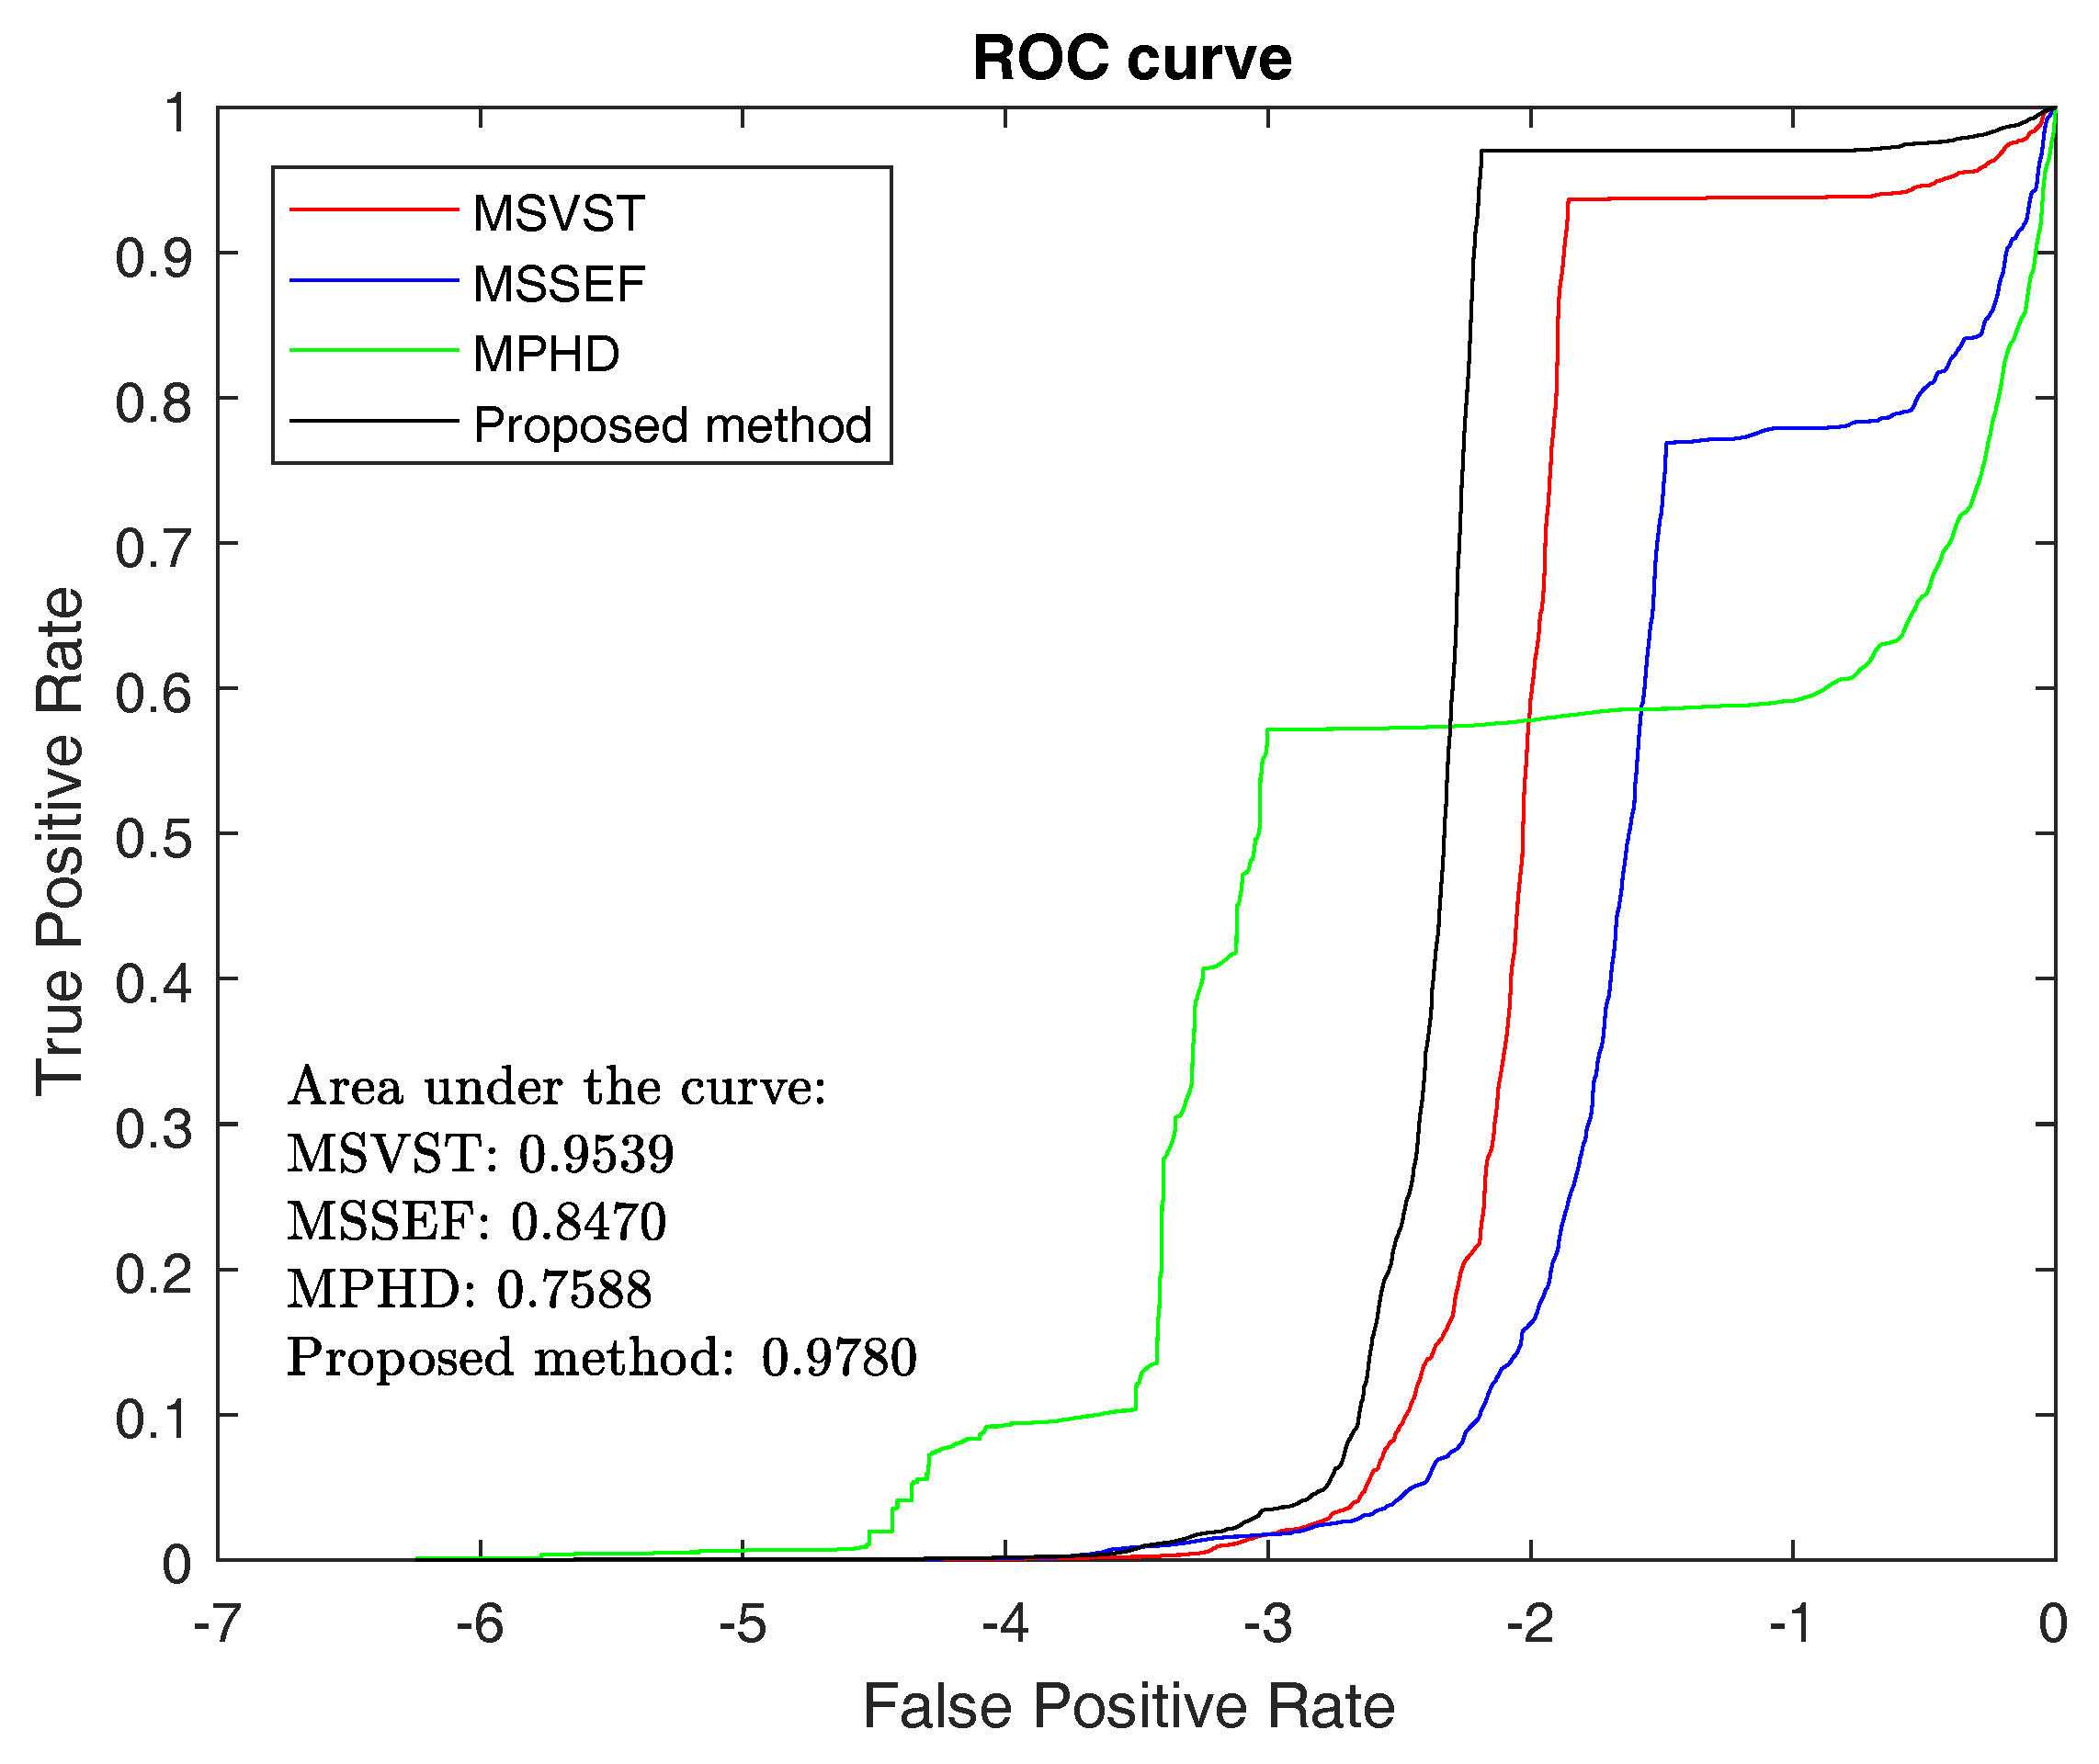
3.1.3. ROC and F-Measure
3.1.4. Detected Number of Overall Micro-Droplets
3.2. Fluorescent Micro-Droplet Detection
3.3. AP-Labeled Nanoparticle Concentration Measurement
4. Discussion
5. Conclusions
Acknowledgments
Author Contributions
Conflicts of Interest
References
- Nketia, T.; Sailem, H.; Rohde, G.; Machiraju, R.; Rittscher, J. Analysis of live cell images: Methods, tools and opportunities. Methods 2017, 115, 65–79. [Google Scholar] [CrossRef] [PubMed]
- Specht, E.A.; Braselmann, E.; Palmer, A.E. A Critical and Comparative Review of Fluorescent Tools for Live-Cell Imaging. Annu. Rev. Physiol. 2017, 79, 93–117. [Google Scholar] [CrossRef] [PubMed]
- Qiang, Y.; Lee, J.Y.; Bartenschlager, R.; Rohr, K. Colocalization analysis and particle tracking in multi-channel fluorescence microscopy images. In Proceedings of the 2017 IEEE 14th International Symposium on Biomedical Imaging (ISBI 2017), Melbourne, Australia, 18–21 April 2017; pp. 646–649. [Google Scholar]
- Rissin, D.M.; Kan, C.W.; Campbell, T.G.; Howes, S.C.; Fournier, D.R.; Song, L.; Piech, T.; Patel, P.P.; Chang, L.; Rivnak, A.J.; et al. Single-molecule enzyme-linked immunosorbent assay detects serum proteins at subfemtomolar concentrations. Nat. Biotechnol. 2010, 28, 595–599. [Google Scholar] [CrossRef] [PubMed]
- Basova, E.Y.; Foret, F. Droplet microfluidics in (bio)chemical analysis. Analyst 2015, 140, 22–38. [Google Scholar] [CrossRef] [PubMed]
- Joensson, H.N.; Andersson Svahn, H. Droplet Microfluidics—A Tool for Single-Cell Analysis. Angew. Chem. Int. Ed. 2012, 51, 12176–12192. [Google Scholar] [CrossRef] [PubMed]
- Rissin, D.M.; Walt, D.R. Digital concentration readout of single enzyme molecules using femtoliter arrays and Poisson statistics. Nano Lett. 2006, 6, 520–523. [Google Scholar] [CrossRef] [PubMed]
- Thompson, R.E.; Larson, D.R.; Webb, W.W. Precise nanometer localization analysis for individual fluorescent probes. Biophys. J. 2002, 82, 2775–2783. [Google Scholar] [CrossRef]
- Kervrann, C.; Sorzano, C.O.S.; Acton, S.T.; Olivo-Marin, J.C.; Unser, M. A guided tour of selected image processing and analysis methods for fluorescence and electron microscopy. IEEE J. Sel. Top. Signal Process. 2016, 10, 6–30. [Google Scholar] [CrossRef]
- Wiesmann, V.; Franz, D.; Held, C.; Munzenmayer, C.; Palmisano, R.; Wittenberg, T. Review of free software tools for image analysis of fluorescence cell micrographs. J. Microsc. 2015, 257, 39–53. [Google Scholar] [CrossRef] [PubMed]
- Arena, E.T.; Rueden, C.T.; Hiner, M.C.; Wang, S.; Yuan, M.; Eliceiri, K.W. Quantitating the cell: Turning images into numbers with ImageJ. Wiley Interdiscip. Rev.: Dev. Biol. 2017, 6. [Google Scholar] [CrossRef] [PubMed]
- Smal, I.; Loog, M.; Niessen, W.; Meijering, E. Quantitative comparison of spot detection methods in fluorescence microscopy. IEEE Trans. Med. Imaging 2010, 29, 282–301. [Google Scholar] [CrossRef] [PubMed]
- Zhang, B.; Fadili, M.J.; Starck, J.L.; Olivo-Marin, J.C. Multiscale variance-stabilizing transform for mixed-Poisson-Gaussian processes and its applications in bioimaging. In Proceedings of the 2007 14th IEEE International Conference on Image Processing (ICIP 2007), San Antonio, TX, USA, 16–19 September 2007; Volume 6, p. VI-233. [Google Scholar]
- Smal, I.; Niessen, W.; Meijering, E. A new detection scheme for multiple object tracking in fluorescence microscopy by joint probabilistic data association filtering. In Proceedings of the 2008 5th IEEE International Symposium on Biomedical Imaging: From Nano to Macro (ISBI 2008), Paris, France, 14–17 May 2008; pp. 264–267. [Google Scholar]
- Mallat, S.G. A theory for multiresolution signal decomposition: The wavelet representation. IEEE Trans. Pattern Anal. Mach. Intell. 1989, 11, 674–693. [Google Scholar] [CrossRef]
- Rezatofighi, S.H.; Hartley, R.; Hughes, W.E. A new approach for spot detection in total internal reflection fluorescence microscopy. In Proceedings of the 2012 9th IEEE International Symposium on Biomedical Imaging (ISBI 2012), Barcelona, Spain, 2–5 May 2012; pp. 860–863. [Google Scholar]
- Jaiswal, A.; Godinez, W.J.; Eils, R.; Lehmann, M.J.; Rohr, K. Tracking virus particles in fluorescence microscopy images using multi-scale detection and multi-frame association. IEEE Trans. Image Process. 2015, 24, 4122–4136. [Google Scholar] [CrossRef] [PubMed]
- Basset, A.; Boulanger, J.; Bouthemy, P.; Kervrann, C.; Salamero, J. SLT-LoG: A vesicle segmentation method with automatic scale selection and local thresholding applied to TIRF microscopy. In Proceedings of the 2014 IEEE 11th International Symposium on Biomedical Imaging(ISBI), Beijing, China, 29 April–2 May 2014; pp. 533–536. [Google Scholar]
- Basset, A.; Boulanger, J.; Salamero, J.; Bouthemy, P.; Kervrann, C. Adaptive spot detection with optimal scale selection in fluorescence microscopy images. IEEE Trans. Image Process. 2015, 24, 4512–4527. [Google Scholar] [CrossRef] [PubMed]
- Acosta, B.M.T.; Basset, A.; Bouthemy, P.; Kervrann, C. Multi-scale spot segmentation with selection of image scales. In Proceedings of the 2017 IEEE International Conference on Acoustics, Speech and Signal Processing (ICASSP), New Orleans, LA, USA, 5–9 March 2017; pp. 1912–1916. [Google Scholar]
- Traore, D.; Rietdorf, K.; Al-Jawad, N.; Al-Assam, H. Automatic Hotspots Detection for Intracellular Calcium Analysis in Fluorescence Microscopic Videos. In Annual Conference on Medical Image Understanding and Analysis; Springer: Cham, The Netherlands, 2017; pp. 862–873. [Google Scholar]
- Zuiderveld, K. Contrast limited adaptive histogram equalization. In Graphics Gems IV; Academic Press Professional, Inc.: New York, NY, USA, 1994; pp. 474–485. [Google Scholar]
- Otsu, N. A threshold selection method from gray-level histograms. IEEE Trans. Syst. Man Cybern. 1979, 9, 62–66. [Google Scholar] [CrossRef]
- Ghaye, J.; Kamat, M.A.; Corbino-Giunta, L.; Silacci, P.; Vergeres, G.; Micheli, G.; Carrara, S. Image thresholding techniques for localization of sub-resolution fluorescent biomarkers. Cytom. Part A 2013, 83, 1001–1016. [Google Scholar] [CrossRef] [PubMed]
- Bartell, L.R.; Bonassar, L.J.; Cohen, I. A watershed-based algorithm to segment and classify cells in fluorescence microscopy images. arXiv, 2017; arXiv:1706.00815. [Google Scholar]
- Acharya, V.; Kumar, P. Identification and Red Blood Cell Automated Counting from Blood Smear Images using Computer Aided System. Med. Biol. Eng. Comput. 2017. [Google Scholar] [CrossRef] [PubMed]
- Jain, R.; Kasturi, R.; Schunck, B.G. Machine Vision; McGraw-Hill: New York, NY, USA, 1995; Volume 5. [Google Scholar]
- Zhu, F.; Qin, B.; Feng, W.; Wang, H.; Huang, S.; Lv, Y.; Chen, Y. Reducing Poisson noise and baseline drift in X-ray spectral images with bootstrap Poisson regression and robust nonparametric regression. Phys. Med. Biol. 2013, 58, 1739. [Google Scholar] [CrossRef] [PubMed]


| Samples | MSVST | MSSEF | MPHD | The Proposed Method |
|---|---|---|---|---|
| Image1 | 0.9204 | 0.7414 | 0.6640 | 0.9231 |
| Image 2 | 0.9306 | 0.7889 | 0.7250 | 0.9674 |
| Image 3 | 0.9348 | 0.8127 | 0.6610 | 0.9597 |
| Image 4 | 0.9260 | 0.7678 | 0.6591 | 0.9656 |
| Image 5 | 0.9075 | 0.8038 | 0.6392 | 0.9770 |
| Image 6 | 0.9343 | 0.7737 | 0.7318 | 0.9677 |
| Image 7 | 0.8945 | 0.7607 | 0.6311 | 0.9604 |
| Image 8 | 0.8931 | 0.7564 | 0.6183 | 0.9663 |
| Image 9 | 0.8792 | 0.7569 | 0.5946 | 0.9721 |
| Image 10 | 0.8810 | 0.5775 | 0.6183 | 0.9402 |
| Image 11 | 0.8999 | 0.6082 | 0.6653 | 0.9655 |
| Image 12 | 0.8462 | 0.6044 | 0.5859 | 0.9186 |
| Image 13 | 0.9177 | 0.6545 | 0.6586 | 0.9707 |
| Image 14 | 0.9202 | 0.5954 | 0.6555 | 0.9692 |
| Image 15 | 0.8831 | 0.6368 | 0.5987 | 0.9551 |
| Average | 0.9046 | 0.7093 | 0.6471 | 0.9586 |
| Samples | True Number | MSVST | MSSEF | MPHD | The Proposed Method |
|---|---|---|---|---|---|
| Image1 | 161 | 163 | 93 | 152 | 161 |
| Image 2 | 222 | 232 | 142 | 202 | 222 |
| Image 3 | 221 | 223 | 142 | 202 | 221 |
| Image 4 | 223 | 227 | 135 | 198 | 222 |
| Image 5 | 219 | 224 | 149 | 202 | 218 |
| Image 6 | 229 | 235 | 152 | 210 | 229 |
| Image 7 | 250 | 255 | 150 | 236 | 249 |
| Image 8 | 239 | 245 | 149 | 224 | 240 |
| Image 9 | 245 | 246 | 141 | 224 | 245 |
| Image 10 | 381 | 393 | 155 | 350 | 381 |
| Image 11 | 372 | 383 | 159 | 348 | 372 |
| Image 12 | 381 | 386 | 175 | 345 | 381 |
| Image 13 | 347 | 356 | 166 | 320 | 349 |
| Image 14 | 414 | 422 | 175 | 371 | 412 |
| Image 15 | 358 | 365 | 164 | 325 | 357 |
| Samples | True Number | Detected Number of Fluorescent Micro-Droplets | Relative Error |
|---|---|---|---|
| Image1 | 21 | 21 | 0.00% |
| Image 2 | 18 | 18 | 0.00% |
| Image 3 | 18 | 18 | 0.00% |
| Image 4 | 16 | 17 | 6.25% |
| Image 5 | 13 | 13 | 0.00% |
| Image 6 | 24 | 24 | 0.00% |
| Image 7 | 27 | 27 | 0.00% |
| Image 8 | 26 | 26 | 0.00% |
| Image 9 | 9 | 9 | 0.00% |
| Image 10 | 36 | 36 | 0.00% |
| Image 11 | 28 | 28 | 0.00% |
| Image 12 | 30 | 30 | 0.00% |
| Image 13 | 33 | 35 | 6.06% |
| Image 14 | 32 | 32 | 0.00% |
| Image 15 | 31 | 31 | 0.00% |
| Samples | True AP-Labeled Nanoparticle Concentration (fM) | Test AP-Labeled Nanoparticle Concentration (fM) | Relative Error |
|---|---|---|---|
| Image1 | 16.4222 | 16.4222 | 0.00% |
| Image 2 | 9.9356 | 9.9356 | 0.00% |
| Image 3 | 9.9825 | 9.9825 | 0.00% |
| Image 4 | 8.7483 | 9.3610 | 7.00% |
| Image 5 | 7.1905 | 7.2246 | 0.47% |
| Image 6 | 13.0088 | 13.0088 | 0.00% |
| Image 7 | 13.4291 | 13.4862 | 0.43% |
| Image 8 | 13.5327 | 13.4730 | 0.44% |
| Image 9 | 4.3976 | 4.3976 | 0.00% |
| Image 10 | 11.6625 | 11.6625 | 0.00% |
| Image 11 | 9.1947 | 9.1947 | 0.00% |
| Image 12 | 9.6366 | 9.6366 | 0.00% |
| Image 13 | 11.7421 | 12.4174 | 5.75% |
| Image 14 | 9.4524 | 9.5002 | 0.51% |
| Image 15 | 10.6424 | 10.6736 | 0.29% |
© 2017 by the authors. Licensee MDPI, Basel, Switzerland. This article is an open access article distributed under the terms and conditions of the Creative Commons Attribution (CC BY) license (http://creativecommons.org/licenses/by/4.0/).
Share and Cite
Li, R.; Wang, Y.; Xu, H.; Fei, B.; Qin, B. Micro-Droplet Detection Method for Measuring the Concentration of Alkaline Phosphatase-Labeled Nanoparticles in Fluorescence Microscopy. Sensors 2017, 17, 2685. https://doi.org/10.3390/s17112685
Li R, Wang Y, Xu H, Fei B, Qin B. Micro-Droplet Detection Method for Measuring the Concentration of Alkaline Phosphatase-Labeled Nanoparticles in Fluorescence Microscopy. Sensors. 2017; 17(11):2685. https://doi.org/10.3390/s17112685
Chicago/Turabian StyleLi, Rufeng, Yibei Wang, Hong Xu, Baowei Fei, and Binjie Qin. 2017. "Micro-Droplet Detection Method for Measuring the Concentration of Alkaline Phosphatase-Labeled Nanoparticles in Fluorescence Microscopy" Sensors 17, no. 11: 2685. https://doi.org/10.3390/s17112685
APA StyleLi, R., Wang, Y., Xu, H., Fei, B., & Qin, B. (2017). Micro-Droplet Detection Method for Measuring the Concentration of Alkaline Phosphatase-Labeled Nanoparticles in Fluorescence Microscopy. Sensors, 17(11), 2685. https://doi.org/10.3390/s17112685