Structural Health Monitoring of Above-Ground Storage Tank Floors by Ultrasonic Guided Wave Excitation on the Tank Wall


Abstract
:1. Introduction
2. Related Work
2.1. Above-Ground Storage Tank Floor Inspection
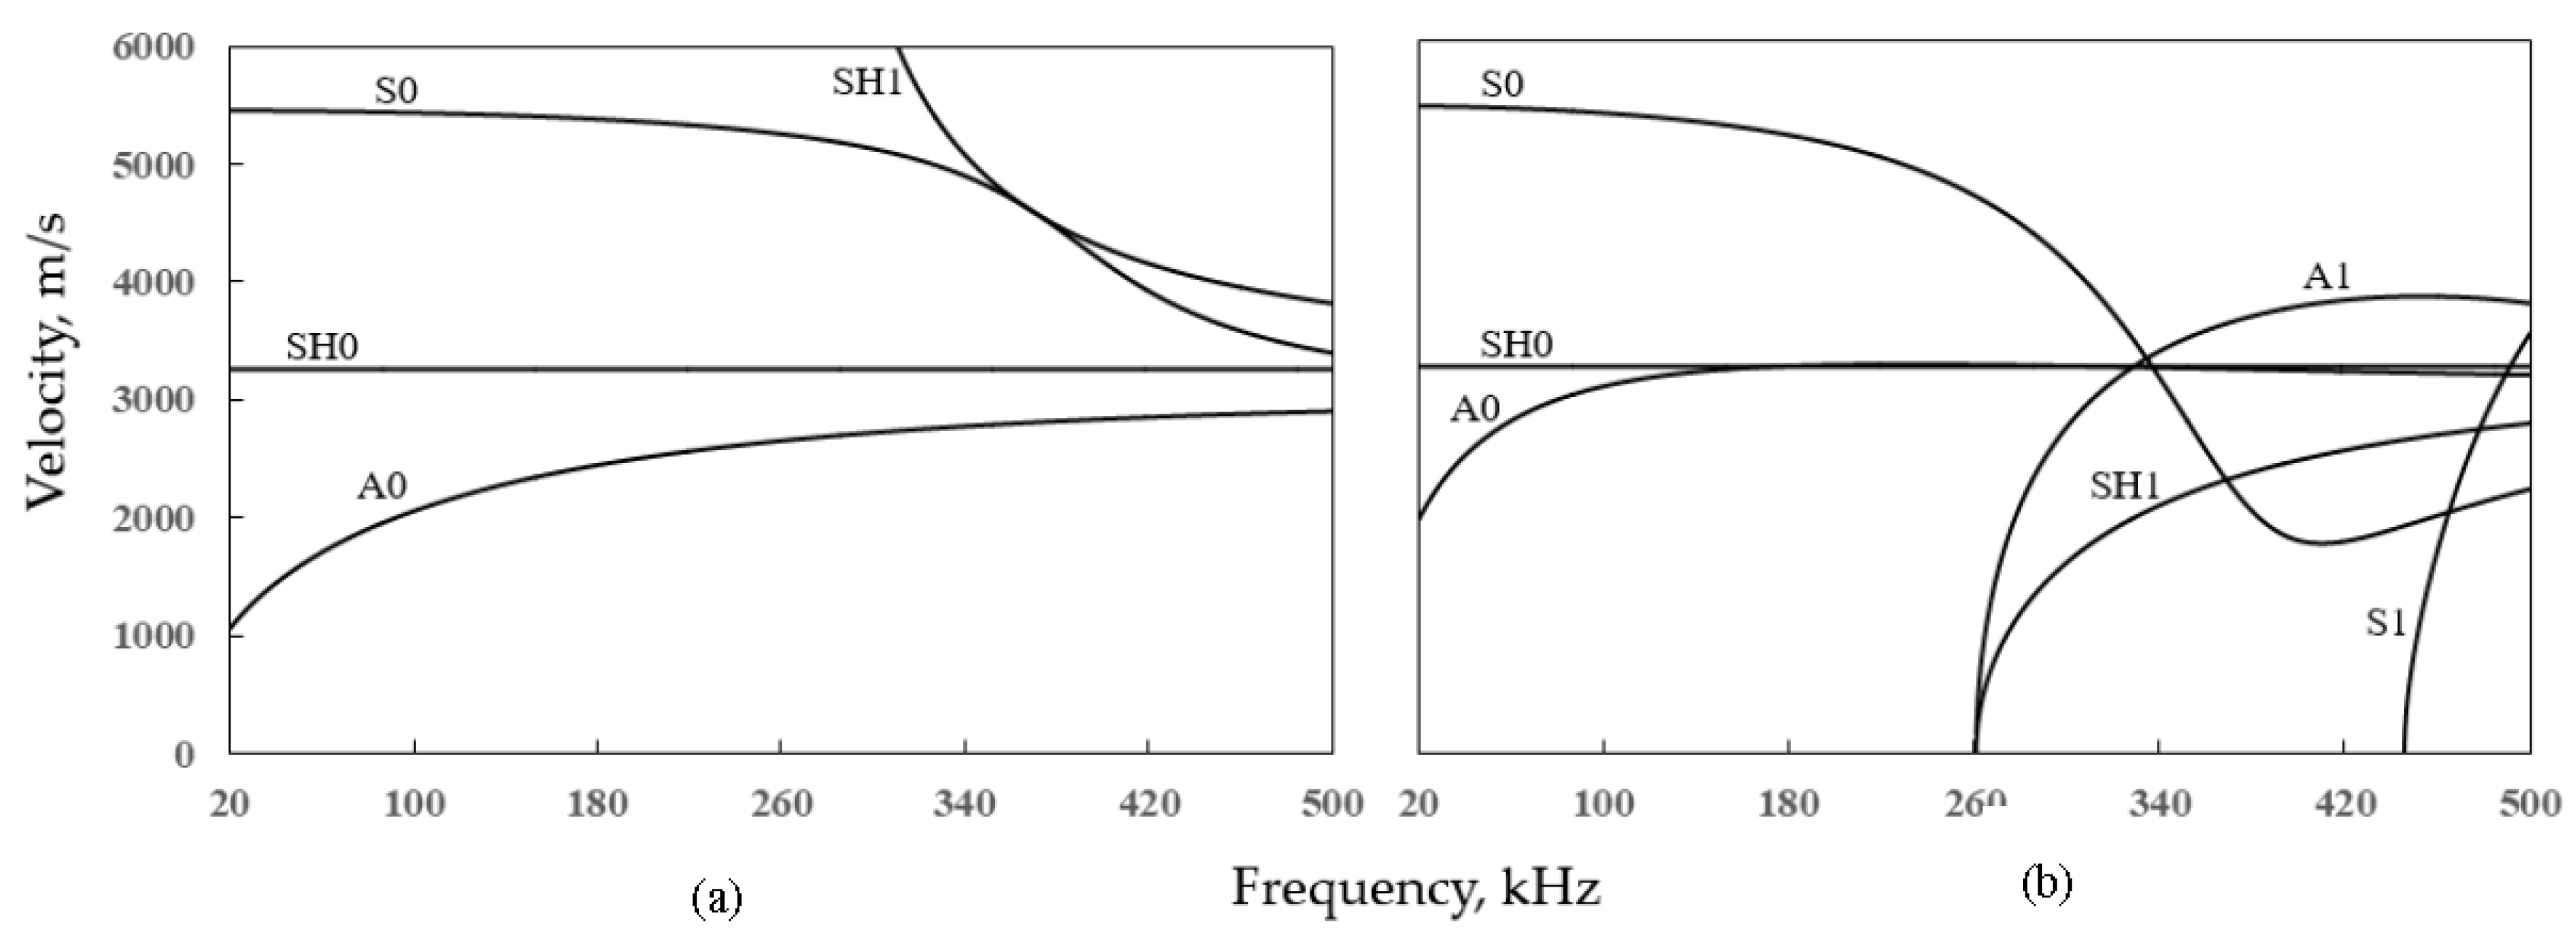
2.2. Dispersion Curve Calculation for Above-Ground Storage Tank
3. Numerical Investigation
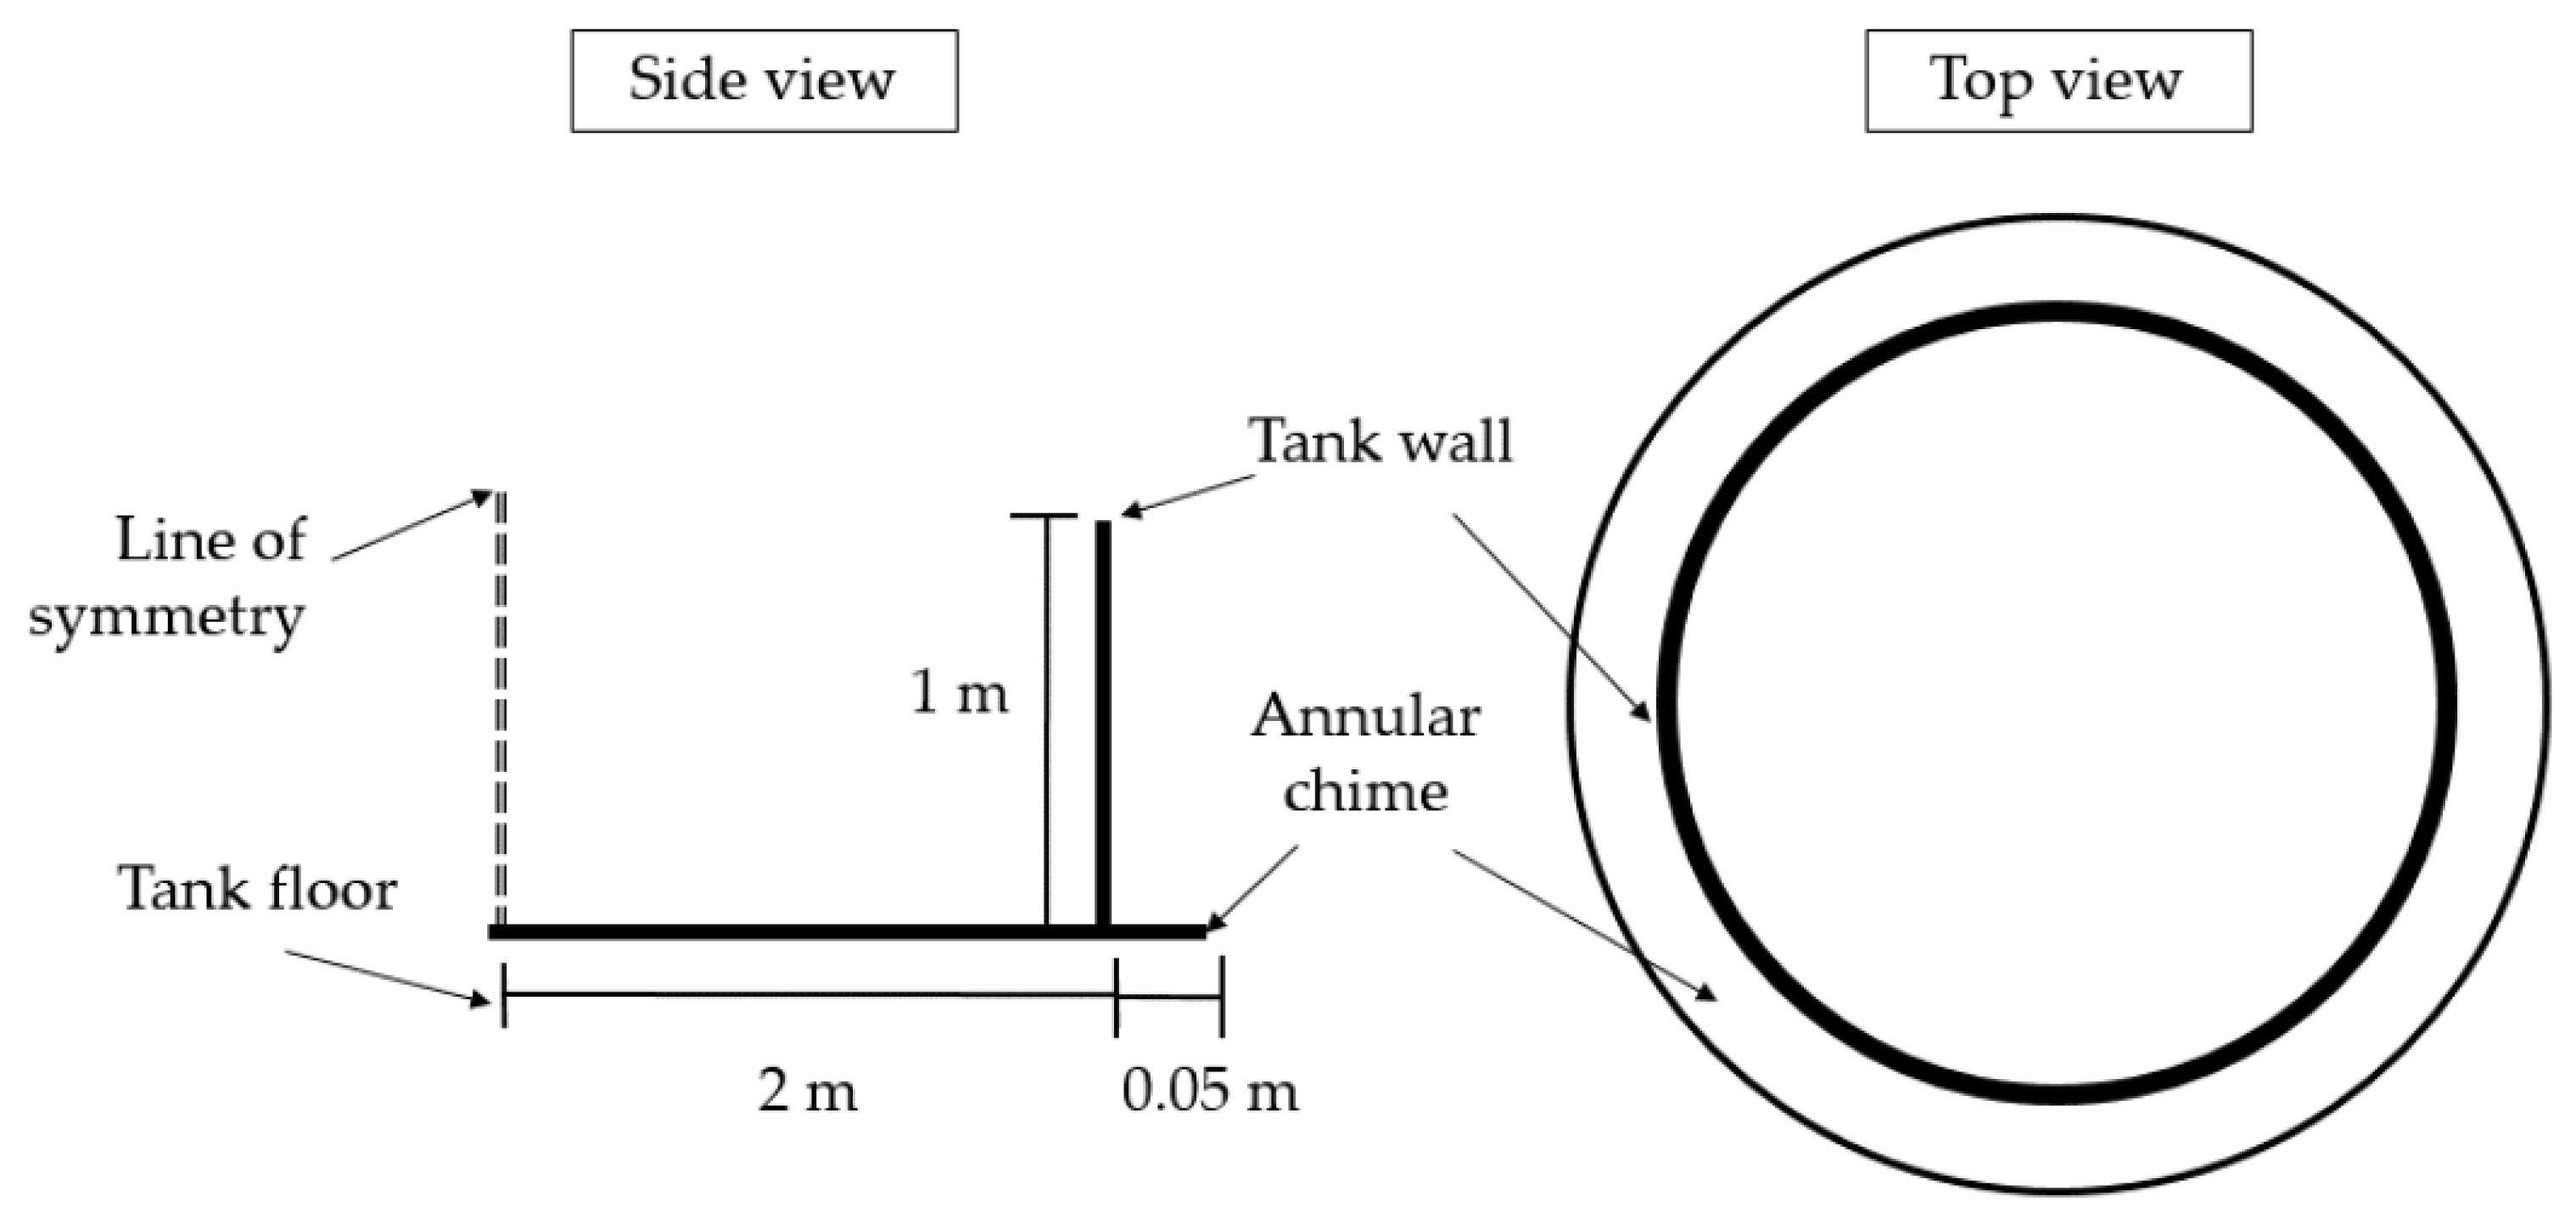
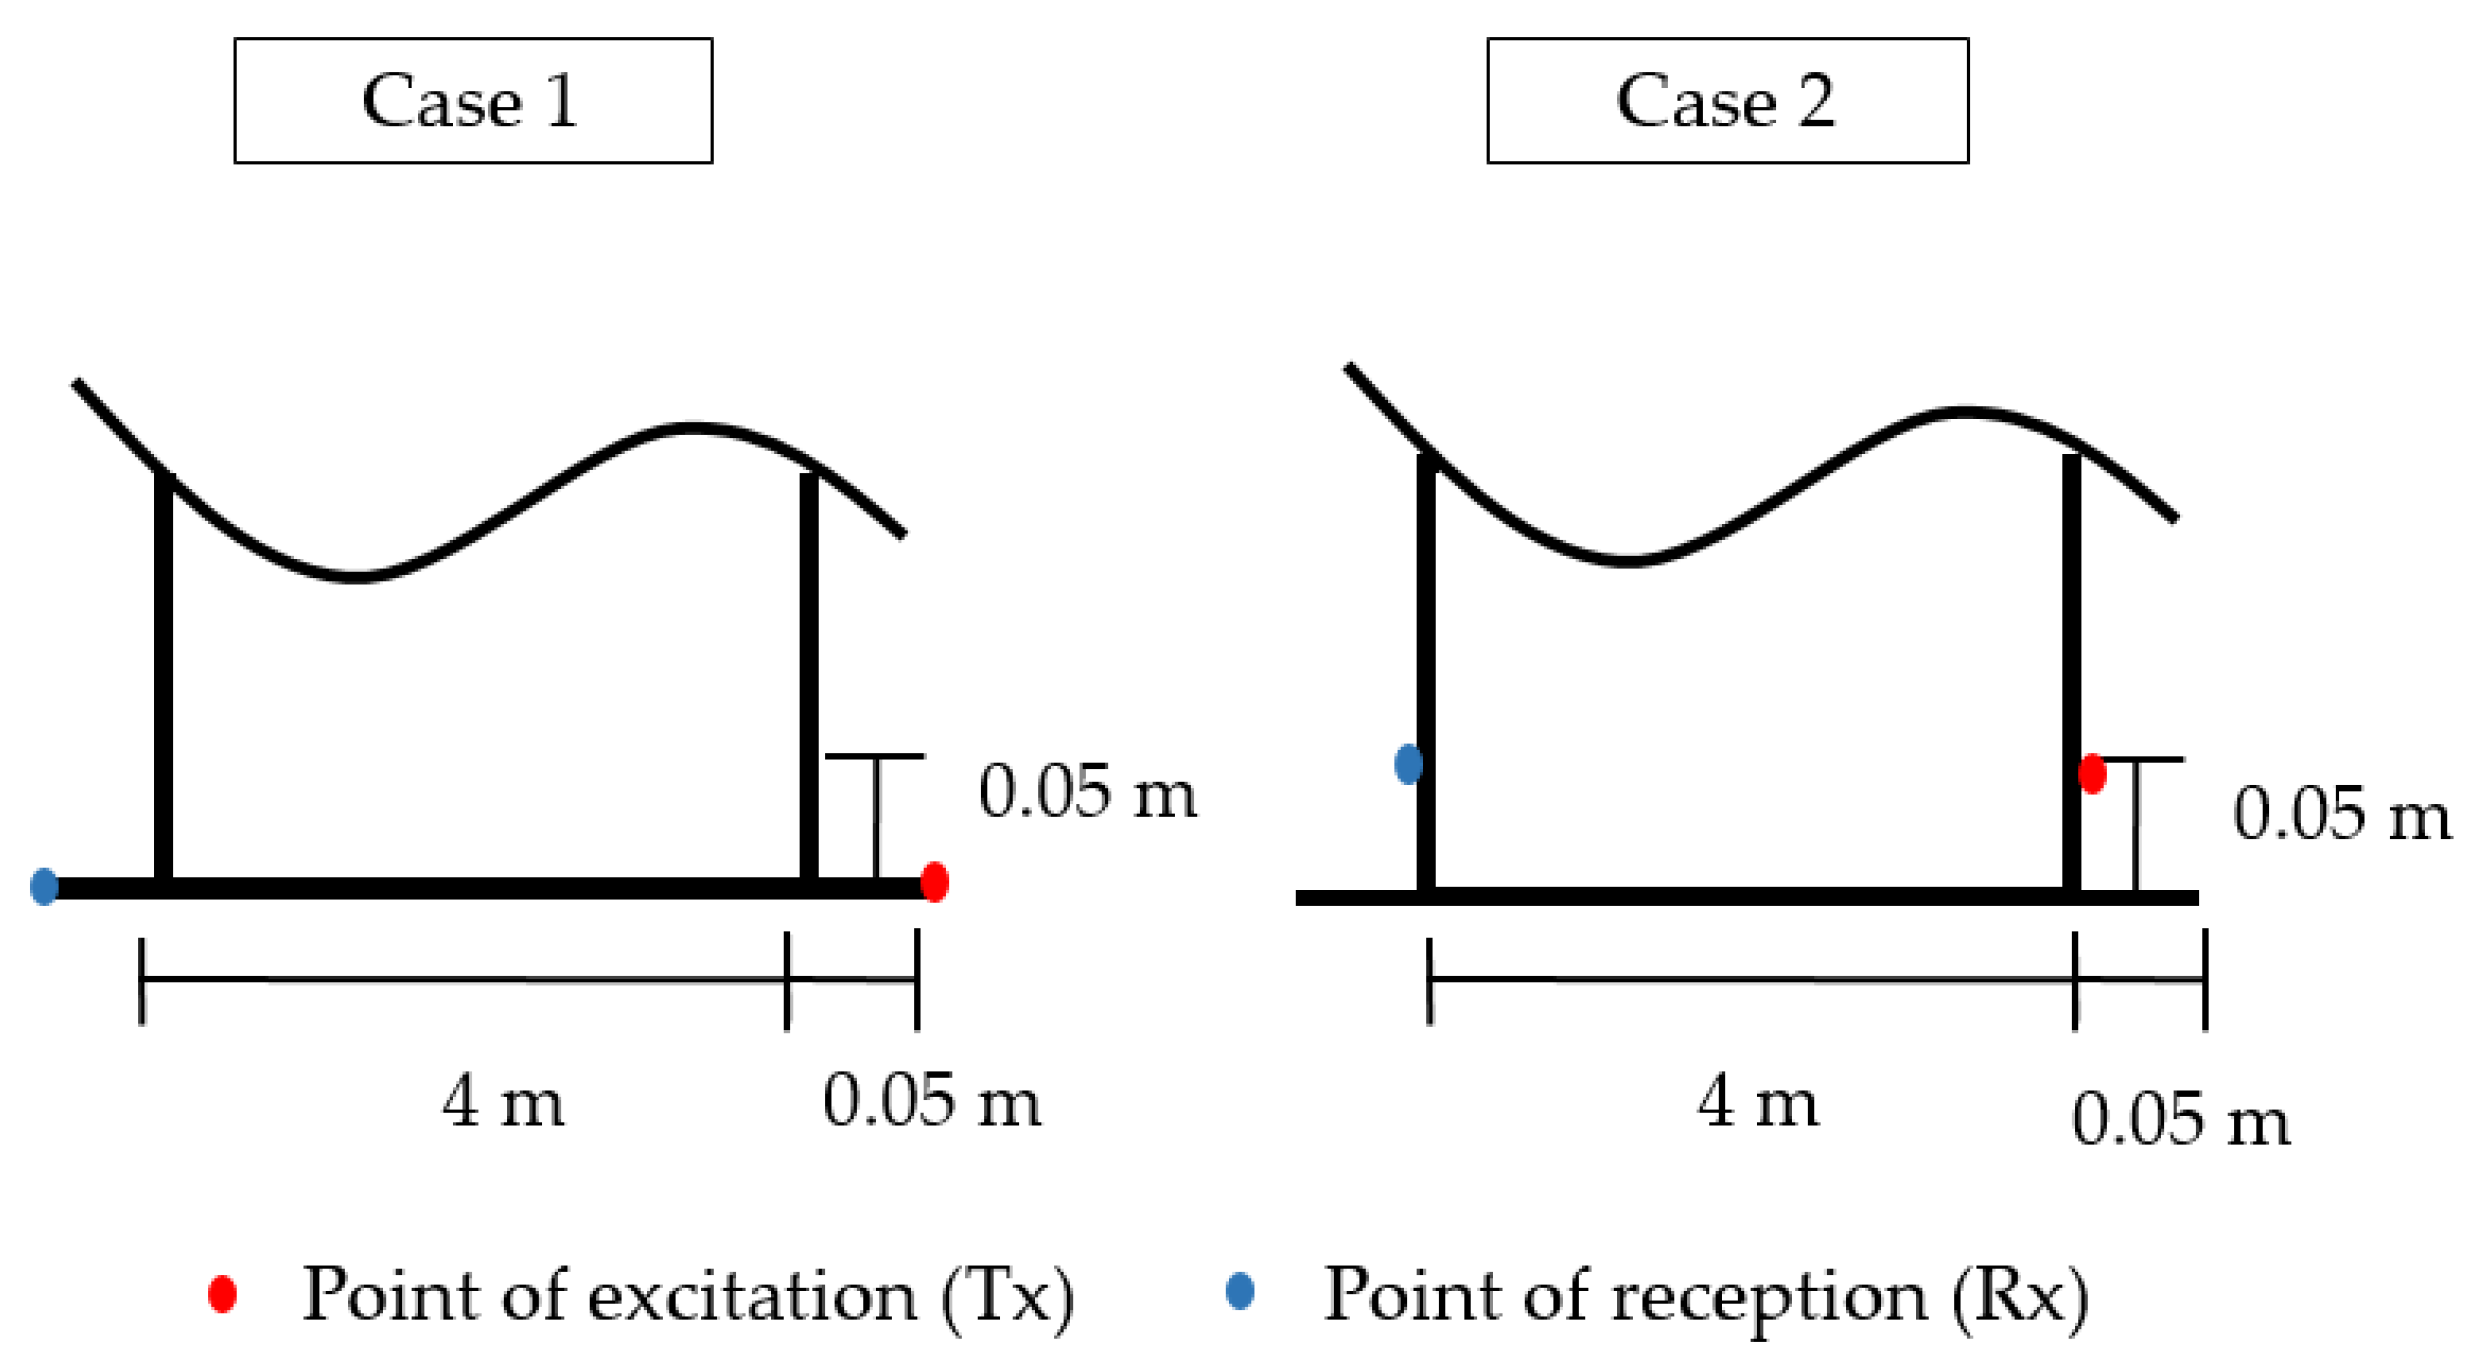
3.1. Numerical Simulation
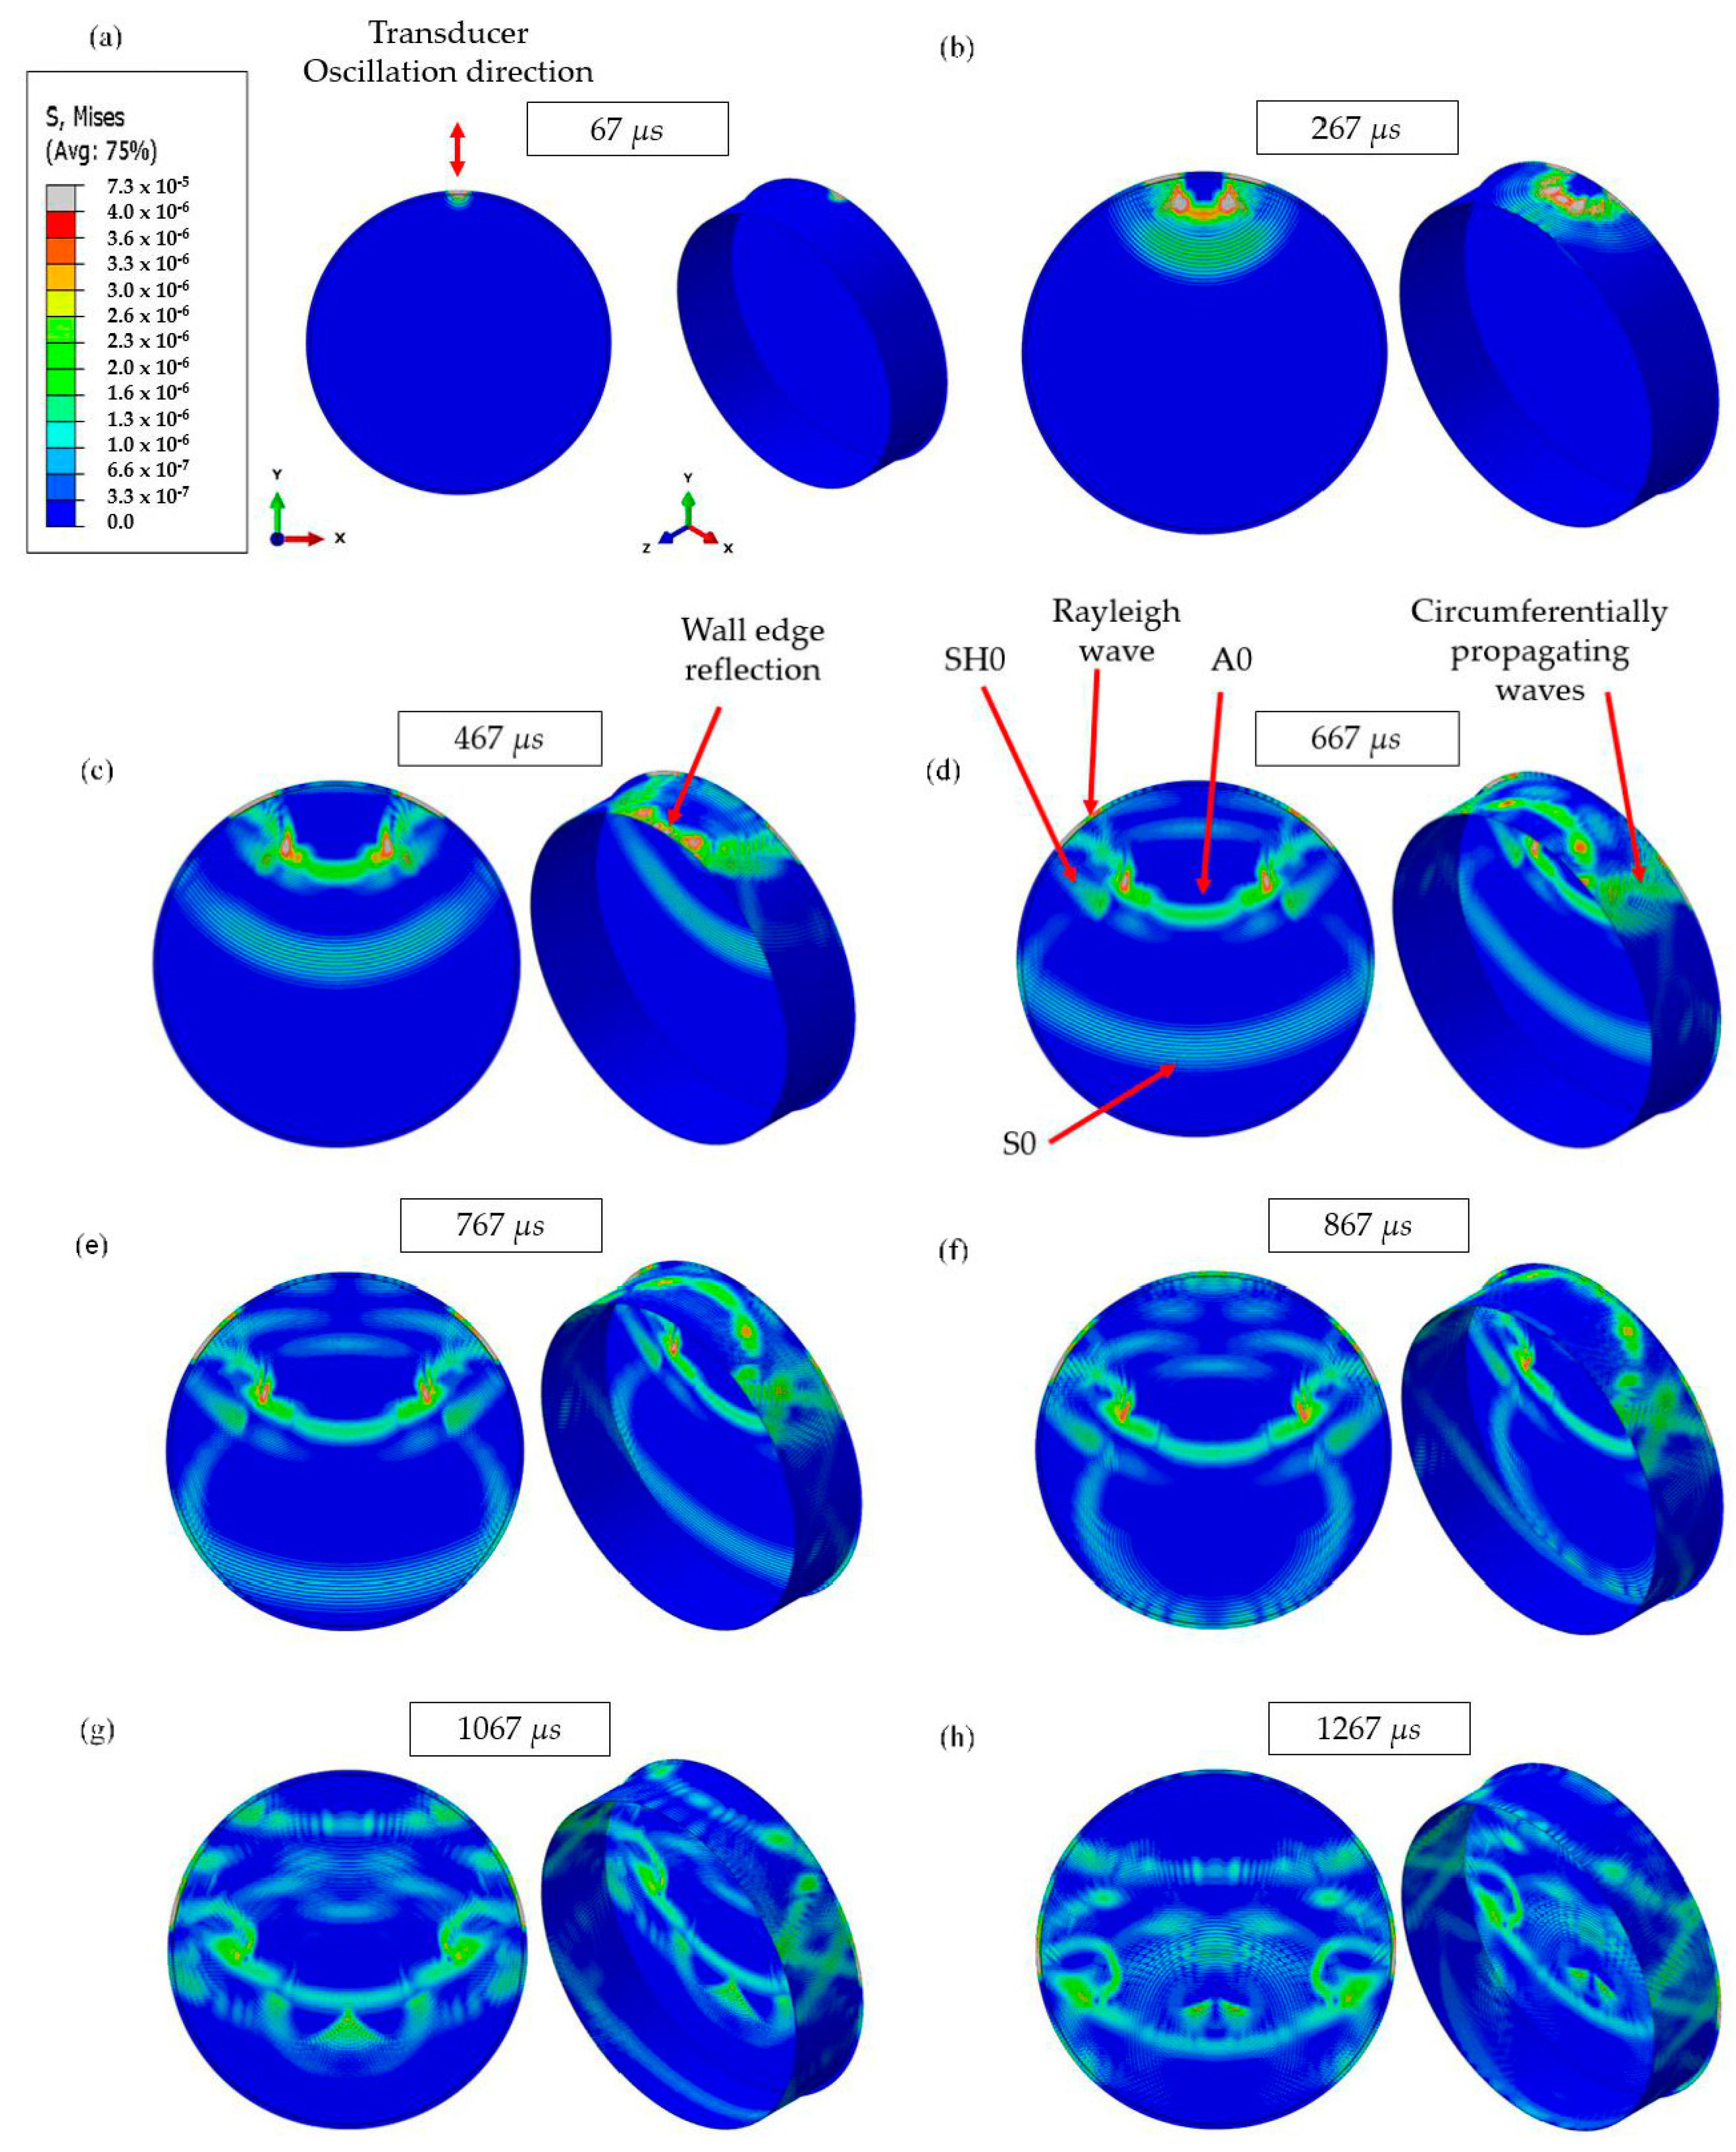
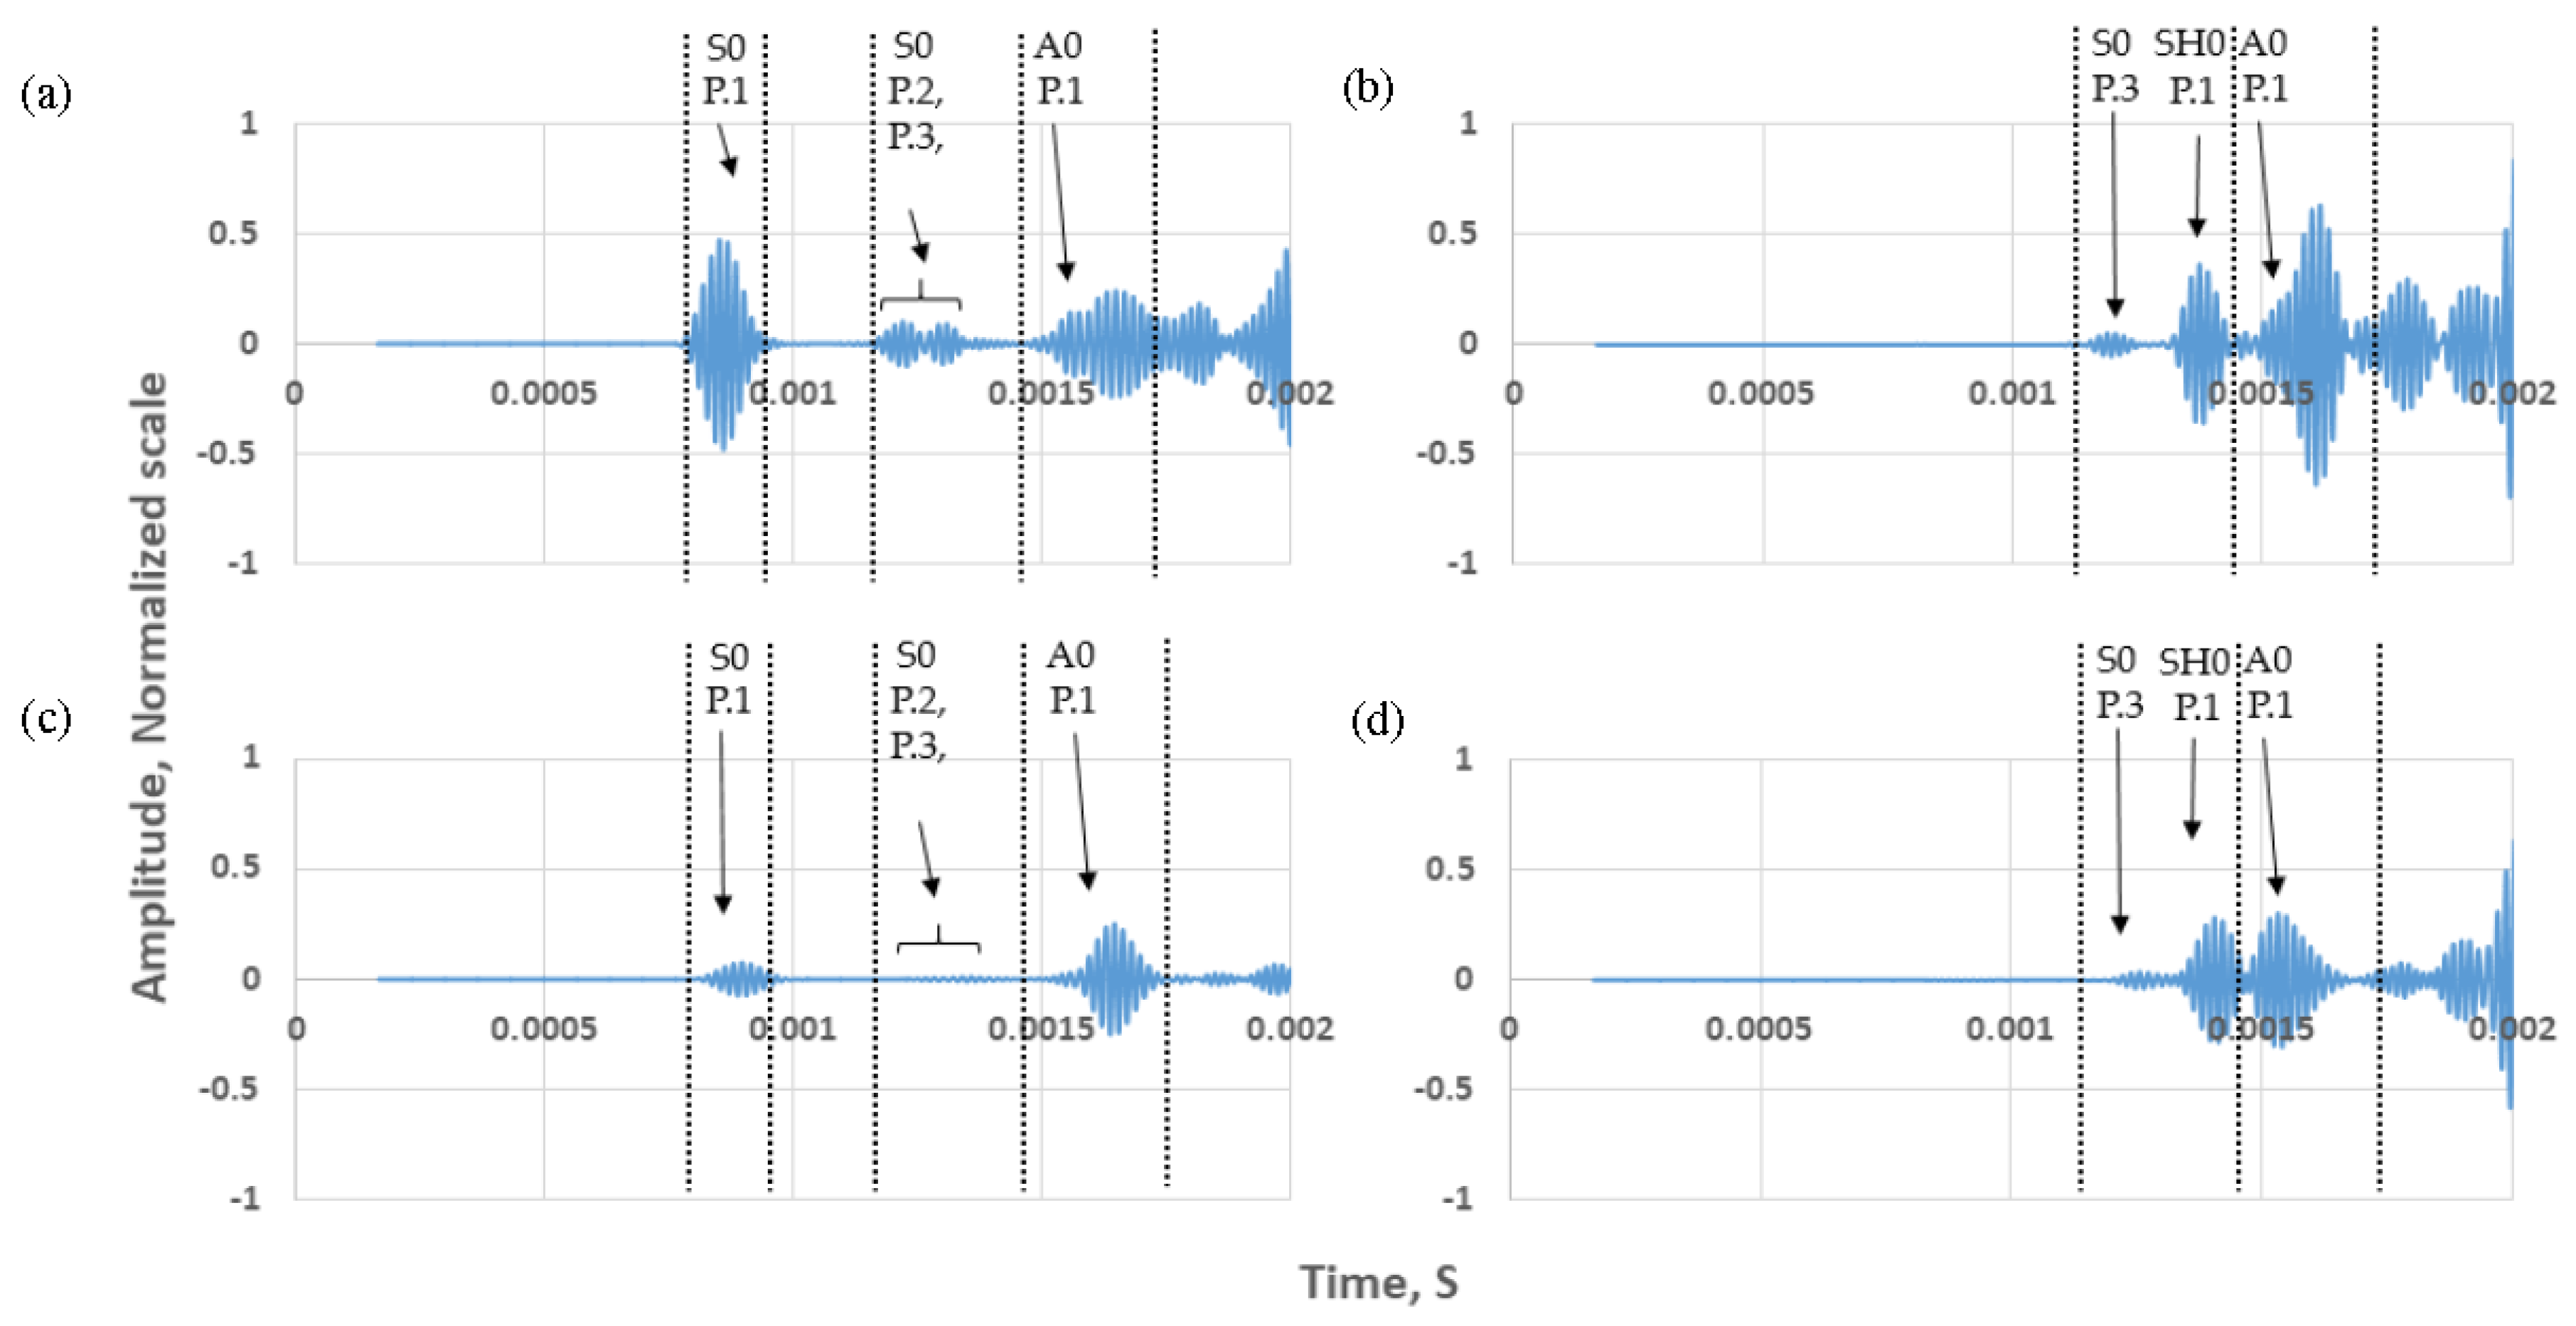
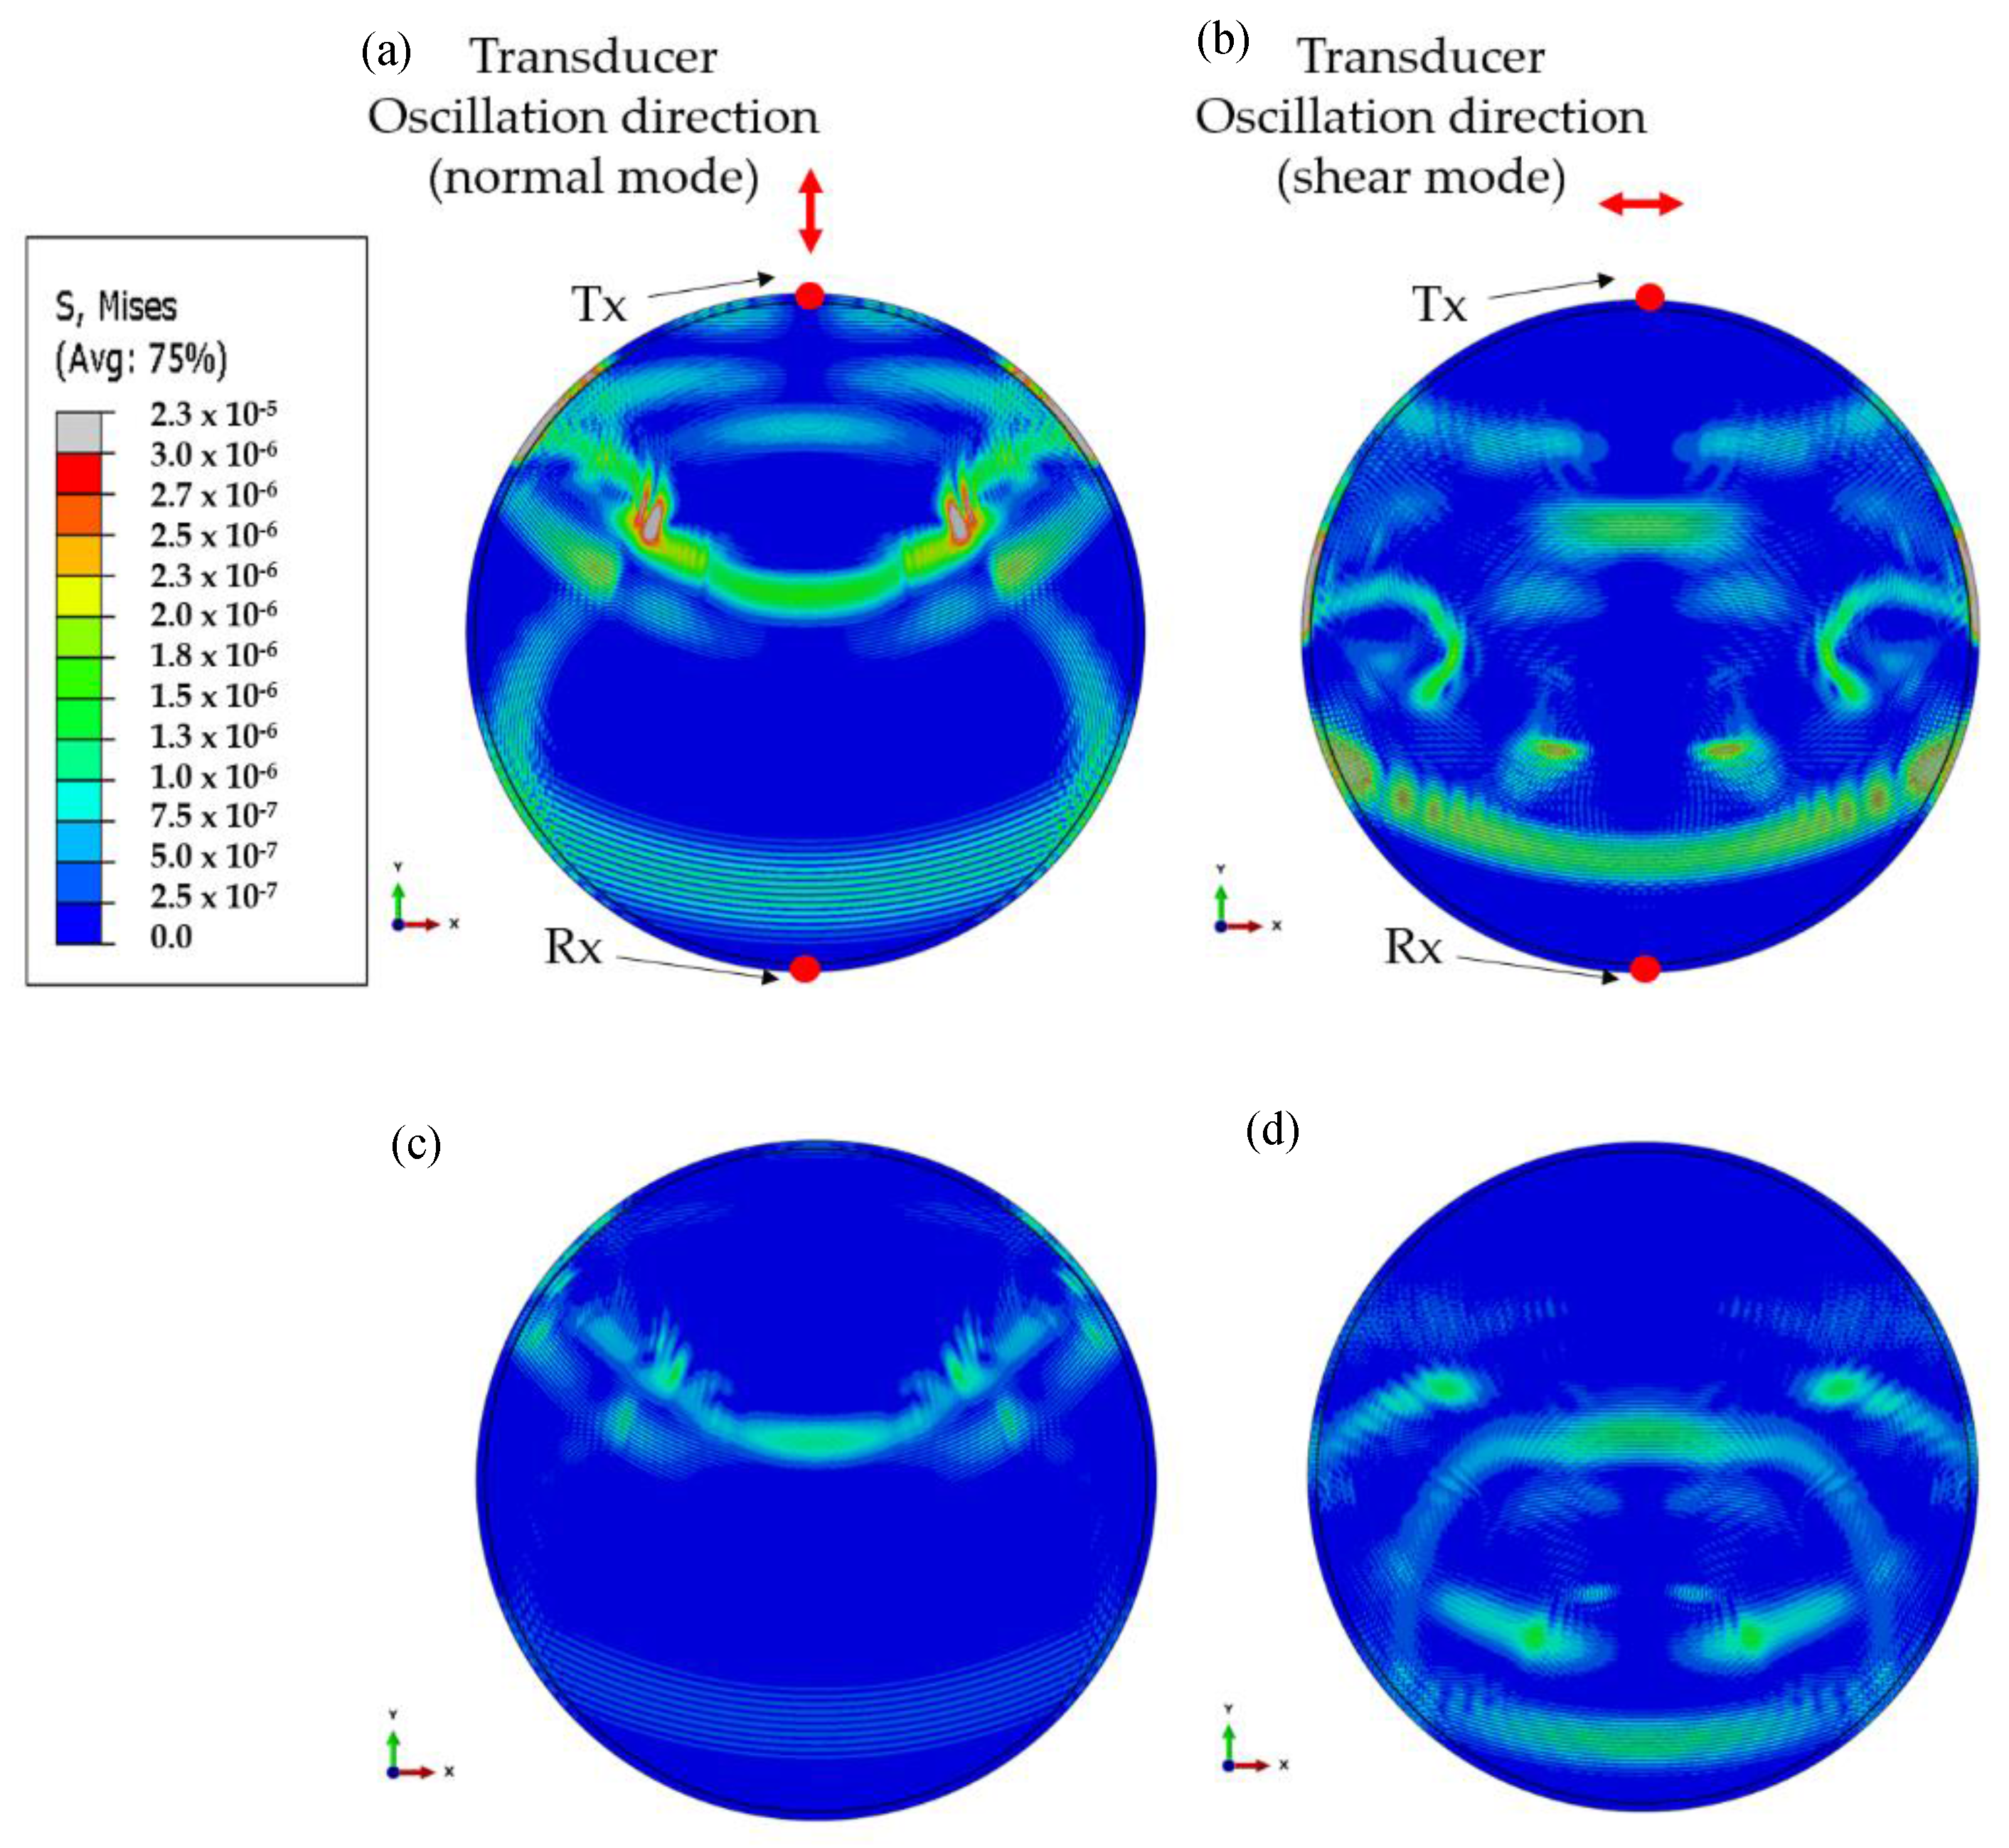
3.2. Numerical Results
4. Experimental Validation
5. Conclusions
Acknowledgments
Author Contributions
Conflicts of Interest
References
- Rose, J.L. Successes and challenges in ultrasonic guided waves for NDT and SHM. In Proceedings of the National Seminar & Exhibition on Non-Destructive Evaluation, Tiruchirappalli, India, 10–12 December 2009. [Google Scholar]
- Worlton, D.C. Ultrasonic Testing with Lamb Waves; Technical Report; General Electric Co., Hanford Atomic Products Operation: Richland, WA, USA, 1956. [Google Scholar]
- Igor’A, V. Rayleigh and Lamb waves: Physical Theory and Applications; Springer: New York, NY, USA, 2013; ISBN 978-1-4899-5683-5. [Google Scholar]
- Alleyne, D.N.; Cawley, P. The practical excitation and measurement of lamb waves using piezoelectric transducers. Rev. Prog. Quant. Nondestruct. Eval. 1994, 13, 181–188. [Google Scholar]
- Mudge, P.J.; Lank, A.M.; Alleyne, D.N. A long range method of detection of corrosion under insulation in process pipework. J. JSNDI 1997, 46, 314–319. [Google Scholar]
- Mažeika, L.; Kažys, R.; Raišutis, R.; Šliteris, R. Long-range Ultrasonic Non-destructive Testing of Fuel Tanks. In Proceedings of the 9th European Conference on NDT. DGZfP-Proceedings BB 103-CD, Berlin, Germany, 25–29 September 2006; pp. 1–8. [Google Scholar]
- Chang, J.I.; Lin, C. A study of storage tank accidents. J. Loss Prev. Process Ind. 2006, 19, 51–59. [Google Scholar] [CrossRef]
- Raišutis, R.; Kažys, R.; Mažeika, L.; Šliteris, R. Application of the ultrasonic transmission tomography for inspection of the petroleum tank floor. Ultragarsas Ultrasound 2007, 62, 26–32. [Google Scholar]
- Lowe, P.S.; Sanderson, R.M.; Boulgouris, N.V.; Haig, A.G.; Balachandran, W. Inspection of cylindrical stuctures using the first longitudinal guided wave mode in isolation for higher flaw sensitivity. IEEE Sens. J. 2016, 16, 706–714. [Google Scholar] [CrossRef]
- Anderson, M.T.; Kunerth, D.C.; Davidson, J.R. Nondestructive Examination Technologies for Inspection of Radioactive Waste Storage Tanks; Idaho National Engineering Laboratory Materials Physics Department: Idaho Falls, ID, USA, 1995.
- Smart Material Corp. Macro Fiber Composite—MFC. Smart Material Corp., 2003–2017. Available online: http://www.smart-material.com/MFC-product-main.html (accessed on 16 January 2017).
- Mažeika, L.; Kažys, R.; Raišutis, R.; Šliteris, R. Ultrasonic guided wave tomography for the inspection of the fuel tank floor. Int. J. Mater. Prod. Technol. 2007, 41, 128–139. [Google Scholar] [CrossRef]
- Rose, J.L. Standing on the Shoulders of Giants: An Example of Guided Wave Inspection. Mater. Eval. 2002, 60, 53–59. [Google Scholar]
- Yu, L.; Tian, Z. Case study of guided wave propagation in a one-side water-immersed steel plate. Case Stud. Nondestruct. Test. Eval. 2015, 3, 1–8. [Google Scholar] [CrossRef]
- Croxford, A.J.; Moll, J.; Wilcox, P.D.; Michaels, J.E. Efficient temperature compensation strategies for guided wave structural health monitoring. Ultrasonics 2010, 50, 517–528. [Google Scholar] [CrossRef] [PubMed]
- Feng, Z.; Wang, W.; Tong, W.; Yuan, K.; Han, Z.; Chen, Y. Storage tank floor and wall defect in-situ inspection with ultrasonic guided wave technique. In Proceedings of the 8th International Pipeline Conference, Calgary, AB, Canada, 27 September–1 October 2010; pp. 229–232. [Google Scholar]
- Lowe, M.J.S. Matrix techniques for modelling ultrasonic waves in multi-layered media. IEEE Trans. Ultrason. Ferroelectr. Freq. Control 1995, 47, 525–542. [Google Scholar] [CrossRef]
- Duan, W.; Kirby, R. A numerical model for the scattering of elastic waves from a non-axisymmetric defect in a pipe. Finite Elem. Anal. Des. 2015, 100, 28–40. [Google Scholar] [CrossRef]
- Duan, W.; Kirby, R.; Mudge, P.; Gan, T. A one dimensional numerical approach for computing the eigenmodes of elastic waves in buried pipelines. J. Sound Vib. 2016, 384, 177–193. [Google Scholar] [CrossRef]
- Towfighi, S.; Kundu, T.; Ehsani, M. Elastic wave propagation in circumferential direction in anisotropic cylindrical curved plates. J. Appl. Mech. 2002, 69, 283–291. [Google Scholar] [CrossRef]
- Gravenkamp, H.; Birk, C.; Song, C. Computation of dispersion curves for embedded waveguides using dashpot boundary condition. J. Acoust. Soc. Am. 2014, 135, 1127–1138. [Google Scholar] [CrossRef] [PubMed]
- Mace, B.R.; Duhamel, D.; Brennan, M.J.; Hinke, L. Finite element prediction of wave motion in structural waveguides. J. Acoust. Soc. Am. 2005, 117, 2835–2843. [Google Scholar] [CrossRef] [PubMed]
- Mazzotti, M.; Bartoli, I.; Marzani, A.; Viola, E. A 2.5D boundary element formulation for modeling damped waves in arbitrary cross-section waveguides and cavities. J. Comput. Phys. 2013, 248, 363–382. [Google Scholar] [CrossRef]
- Duan, W.; Kirby, R.; Mudge, P. On the scattering of elastic waves from a non-axisymmetric defect in a coated pipe. Ultrasonics 2016, 65, 228–241. [Google Scholar] [CrossRef] [PubMed]
- Abaqus-SIMULIA. 2013. Available online: http://abaqus.software.polimi.it/v6.13/books/stm/default.htm (accessed on 4 November 2017).
- Lowe, P.S.; Sanderson, R.; Boulgouris, N.V.; Gan, T. Hybrid active focusing with adaptive dispersion for higher defect sensitivity in guided wave inspection of cylindrical structures. Nondestruct. Test. Eval. 2016, 31, 219–234. [Google Scholar] [CrossRef]
- Alleyne, D.N.; Lowe, M.J.S. The reflection of guided waves from circumferencial notches in the pipe. ASME J. 1998, 65, 635–641. [Google Scholar] [CrossRef]
- Haig, A.G.; Sanderson, R.M.; Mudge, P.J.; Balachandran, W. Macro-fibre composite actuators for the transduction of Lamb and horizontal shear ultrasonic guided waves. Insight-Non-Destruct. Test. Cond. Monit. 2013, 55, 72–77. [Google Scholar] [CrossRef]
- Wilcox, P.; Lowe, M.J.S.; Cawley, P. Mode and transducer selection for long range lamb wave inspection. J. Intell. Mater. Syst. Struct. 2001, 12, 553–565. [Google Scholar] [CrossRef]
- Lowe, P.S.; Sanderson, R.; Pedram, K.; Boulgouris, N.V.; Mudge, P. Inspection of pipelines using the first longitudinal guided wave mode. Phys. Procedia 2015, 70, 338–342. [Google Scholar] [CrossRef]


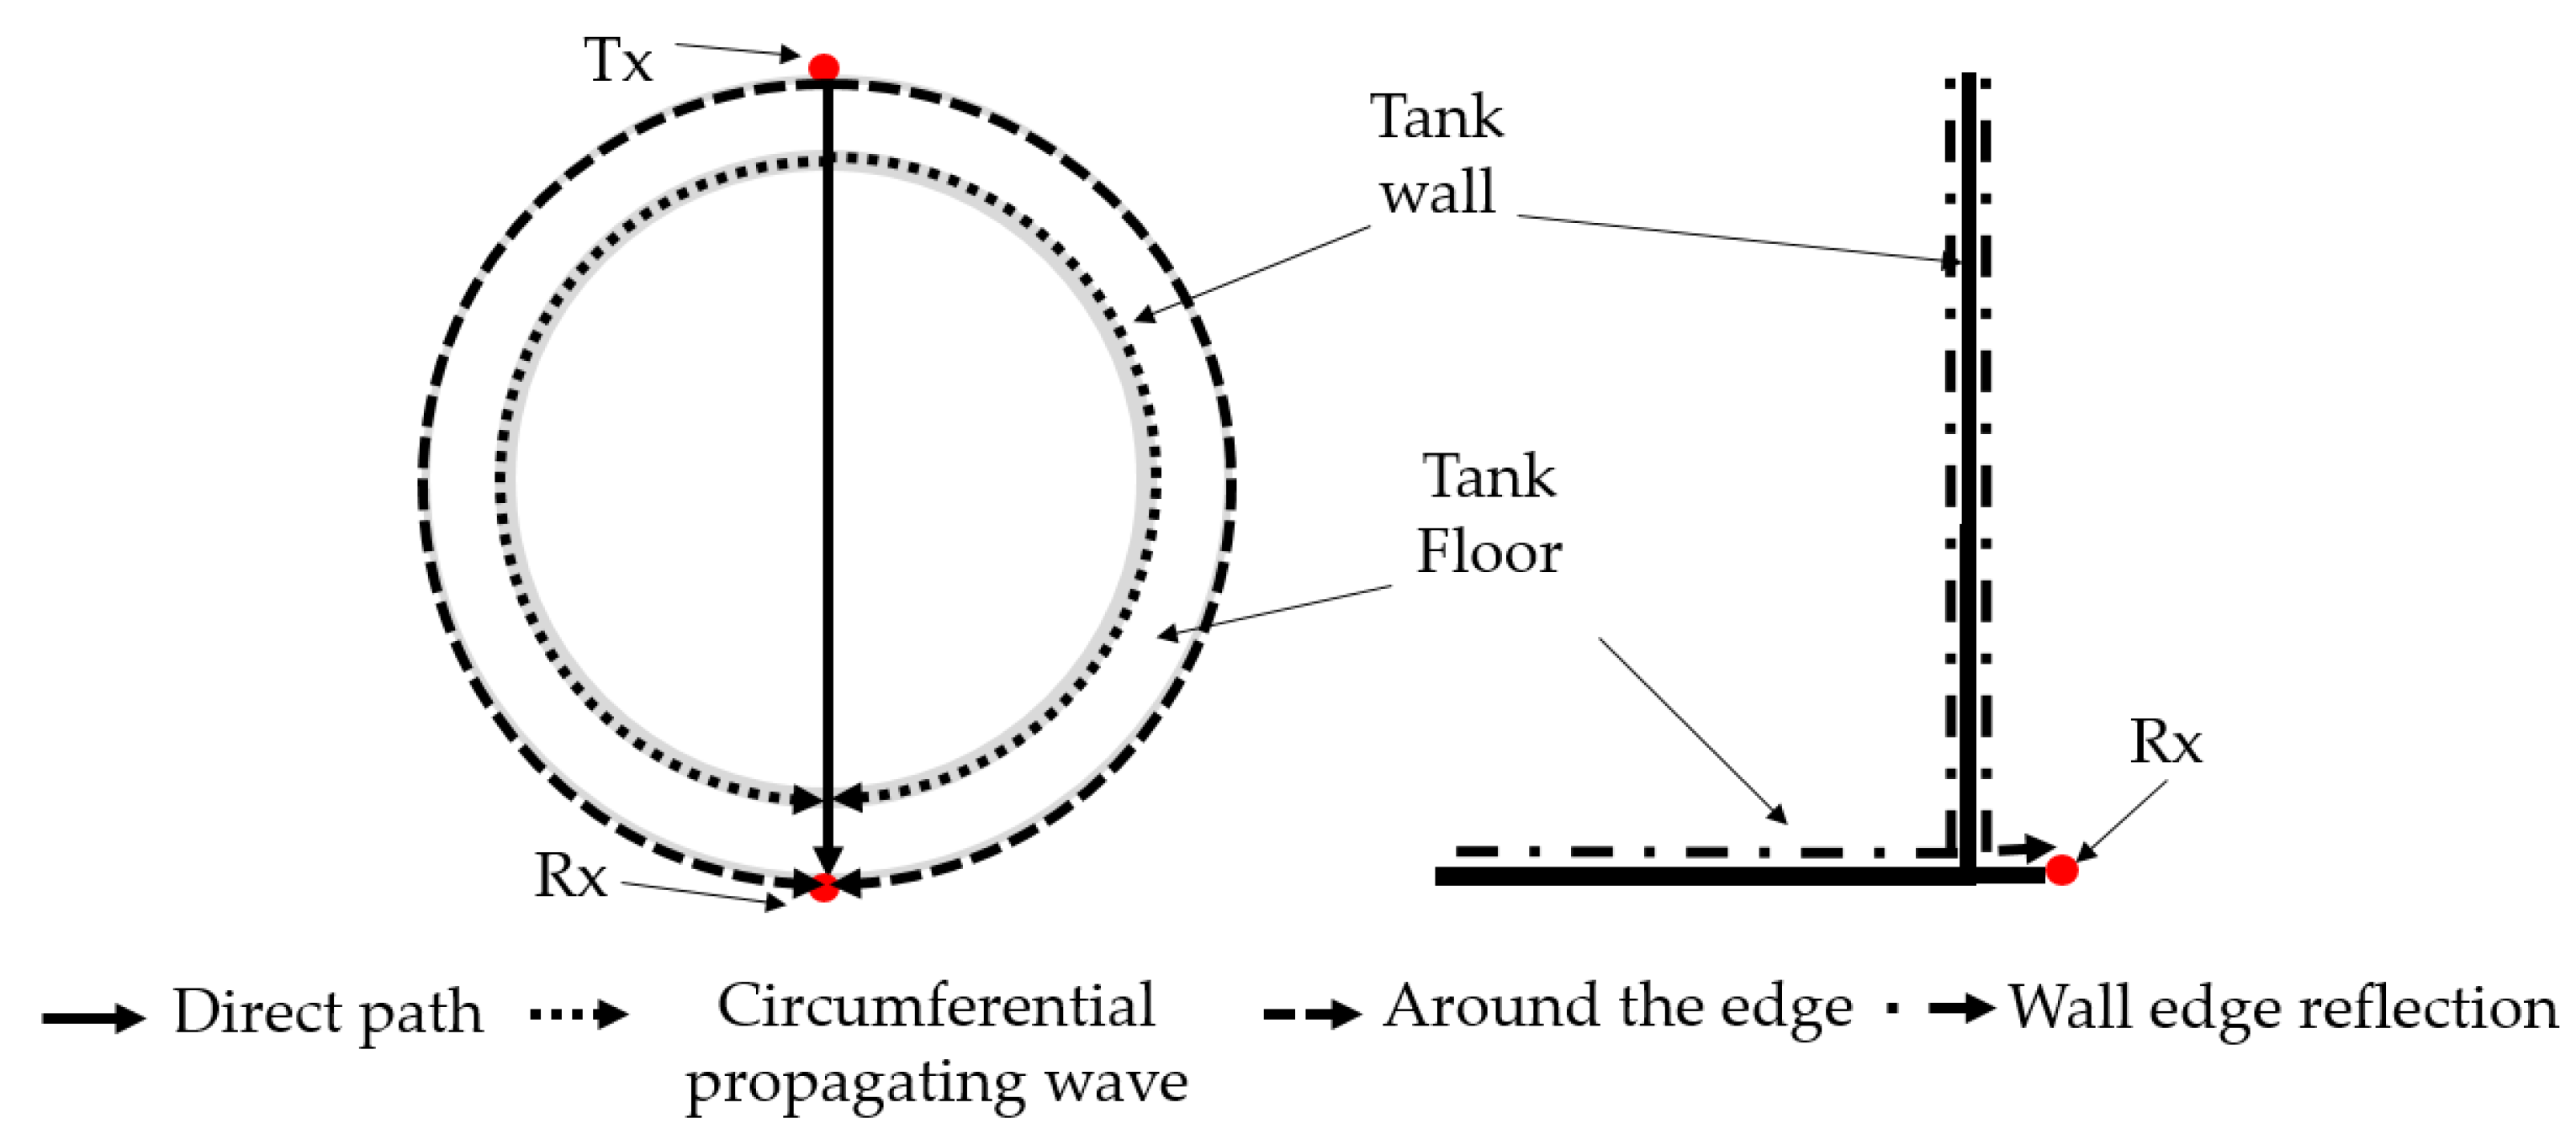
| Path ID | Path | Distance (m) | ToA 1 |
|---|---|---|---|
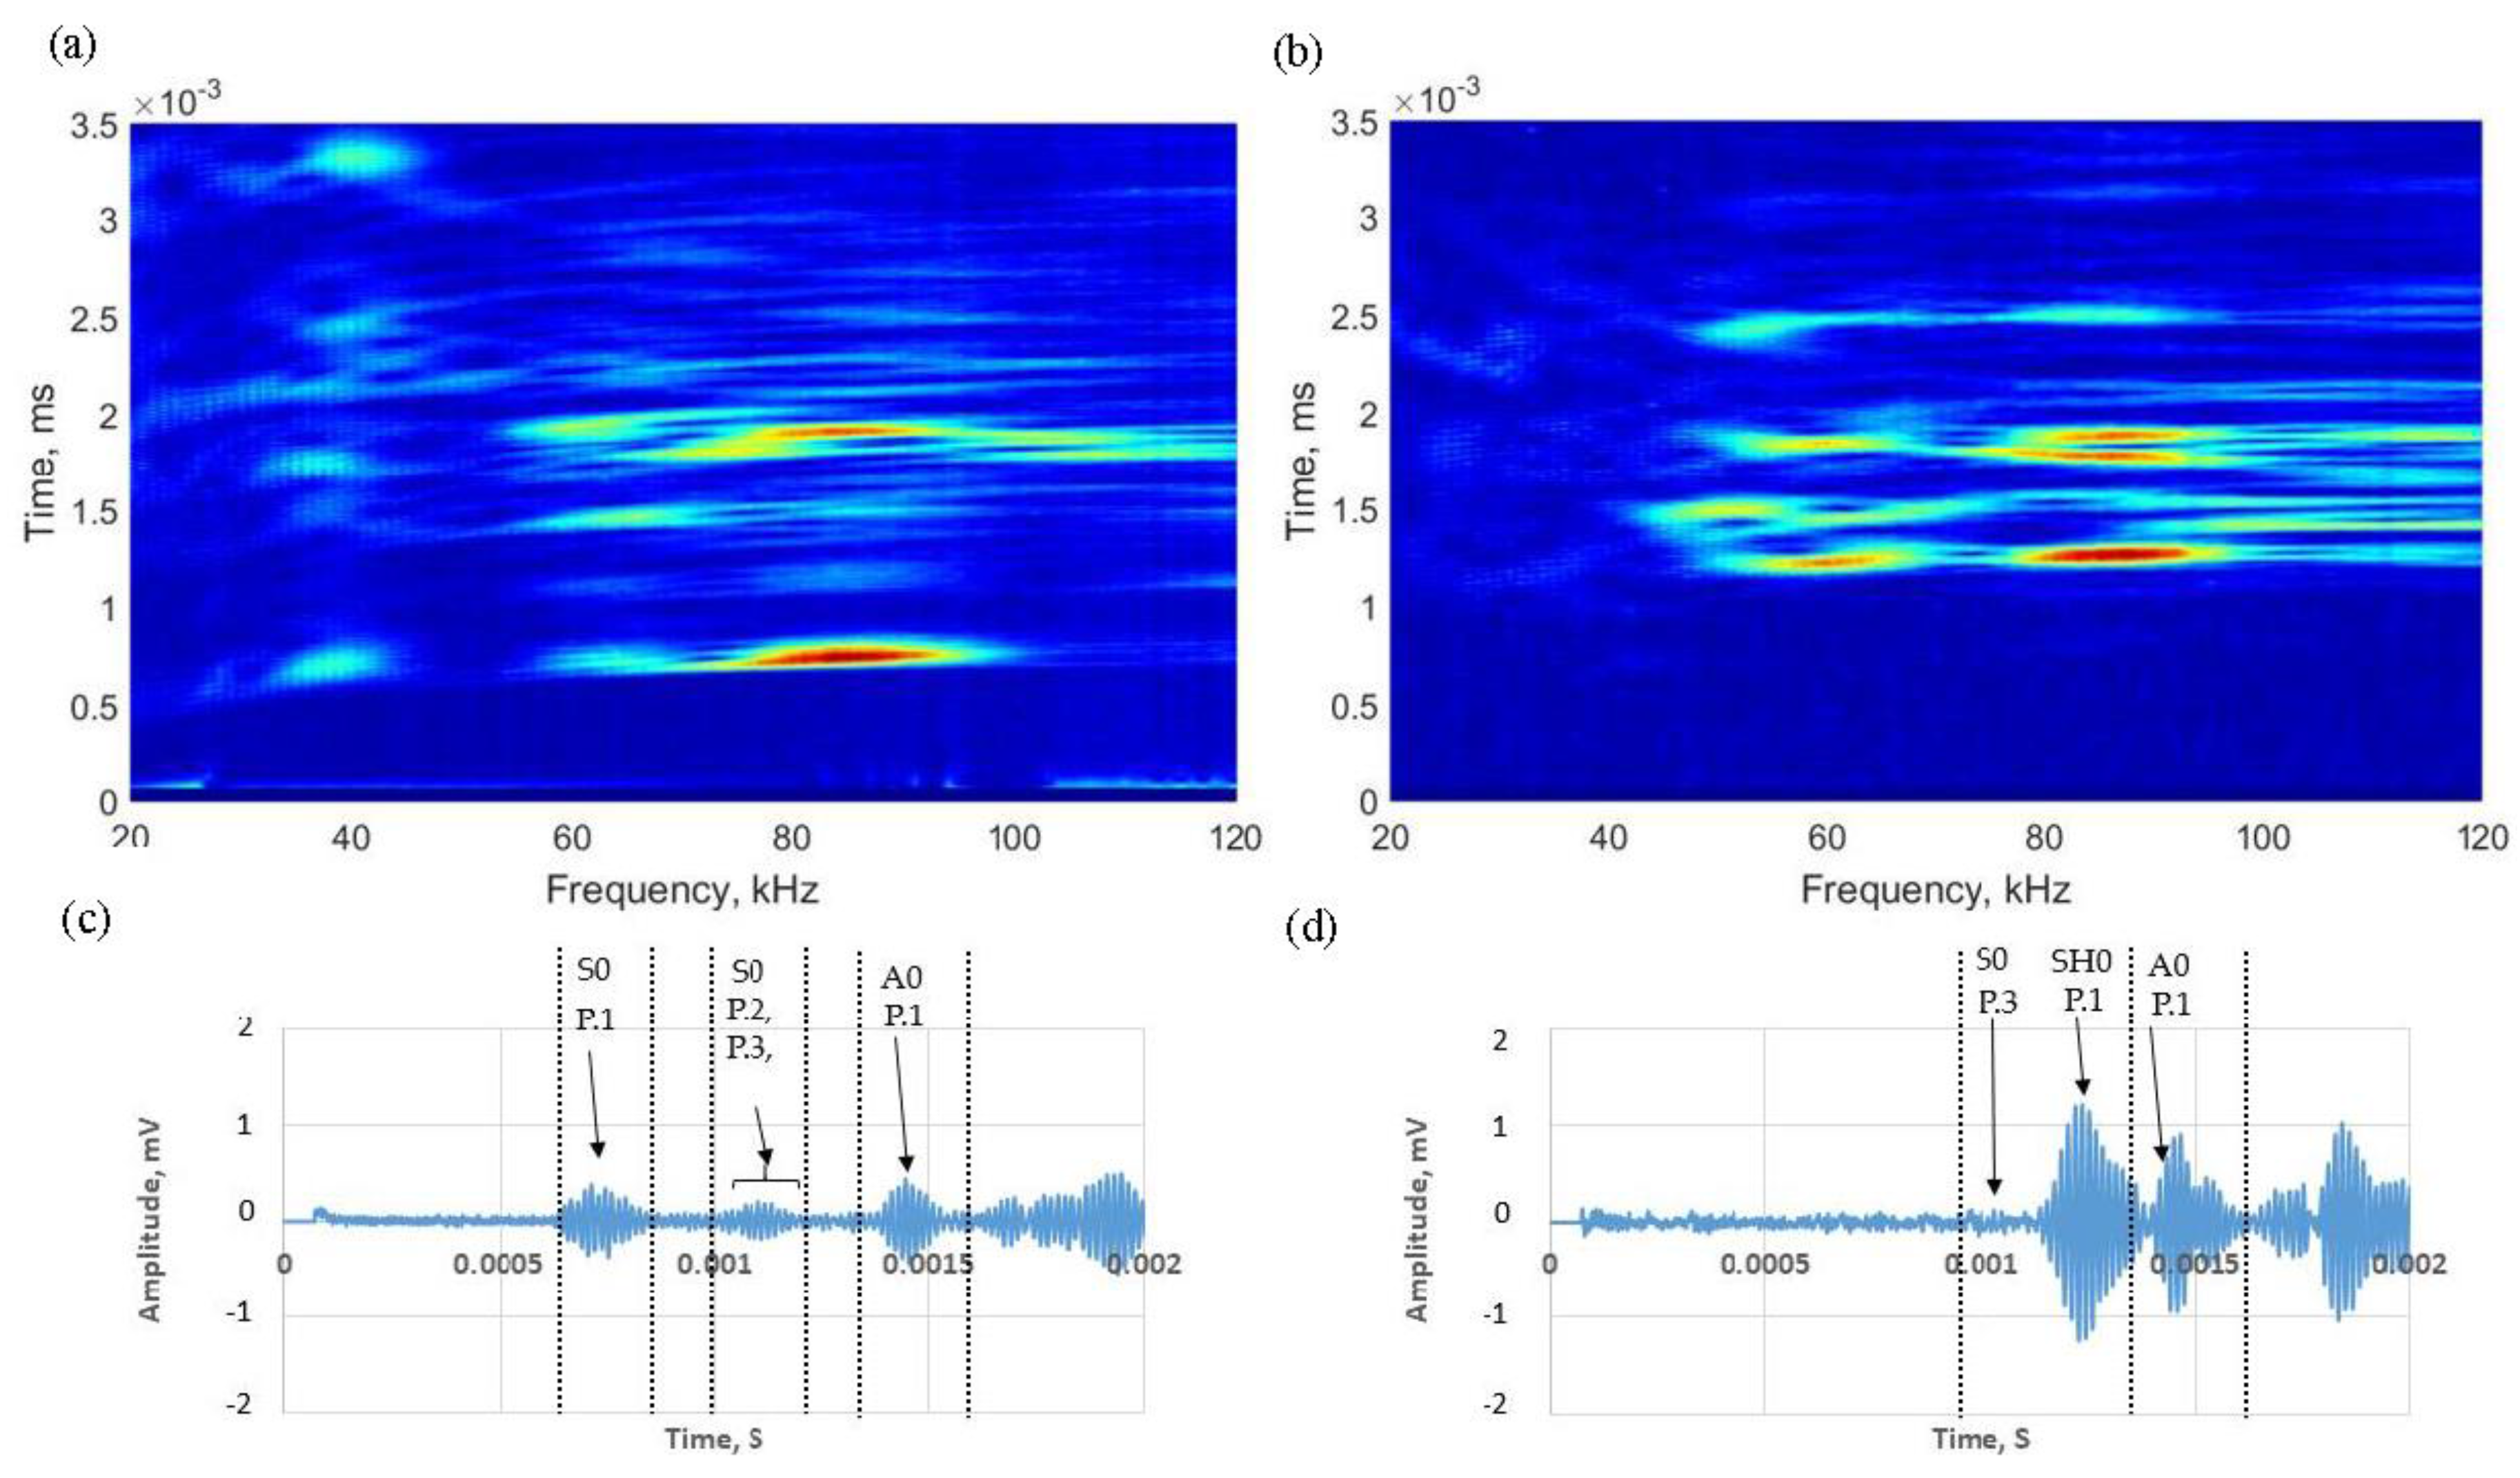
| P.1 | Direct path | 4.1 | S0—759 µs |
| SH0—1281 µs | |||
| A0—1576 µs | |||
| P.2 | Wall edge reflection | 6.1 | S0—1138 µs |
| SH0—1921 µs | |||
| A0—2365 µs | |||
| P.3 | Circumferential propagating waves | 6.3 | S0—1166 µs |
| P.4 | Around the edge (Rayleigh wave) | 6.5 | 2241 µs |
| Case | Mode of Interest | Mode of Excitation | Normalized Amplitude |
|---|---|---|---|
| 1 | S0 | Tank floor | 0.43 |
| 2 | S0 | Tank wall | 0.05 |
| 1 | SH0 | Tank floor | 0.33 |
| 2 | SH0 | Tank wall | 0.25 |
| Frequency (kHz) | SNR (dB) | Variation (dB) | SNR (dB) | Variation (dB) | ||
|---|---|---|---|---|---|---|
| Case 1-S0 | Case 2-S0 | Case 1-SH0 | Case 2-SH0 | |||
| 40 | 16.5 | 5 | −11.5 | 8.4 | 13.8 | 5.4 |
| 45 | 9.2 | 1.4 | −7.8 | 13.7 | 21.1 | 7.4 |
| 50 | 8.1 | 0.4 | −7.7 | 15.9 | 17.4 | 1.5 |
| 55 | 8.9 | 0.9 | −8 | 19.1 | 16.9 | −2.2 |
| 60 | 13.1 | 1.9 | −11.2 | 18.1 | 12.4 | −5.7 |
| 65 | 18.9 | 1.5 | −17.4 | 17.6 | 9.3 | −8.3 |
| 70 | 17.5 | 4.2 | −13.3 | 11.1 | 6.4 | −4.7 |
| Frequency (kHz) | Theoretical (µs) | Numerical (µs) | Experimental (µs) | Theoretical to Numerical Error (%) | Theoretical to Experimental Error (%) |
|---|---|---|---|---|---|
| S0 | 759 | 776 | 723 | 2.2 | 4.7 |
| SH0 | 1281 | 1299 | 1242 | 1.4 | 3 |
| A0 | 1576 | 1593 | 1533 | 1 | 2.7 |
© 2017 by the authors. Licensee MDPI, Basel, Switzerland. This article is an open access article distributed under the terms and conditions of the Creative Commons Attribution (CC BY) license (http://creativecommons.org/licenses/by/4.0/).
Share and Cite
Lowe, P.S.; Duan, W.; Kanfoud, J.; Gan, T.-H. Structural Health Monitoring of Above-Ground Storage Tank Floors by Ultrasonic Guided Wave Excitation on the Tank Wall. Sensors 2017, 17, 2542. https://doi.org/10.3390/s17112542
Lowe PS, Duan W, Kanfoud J, Gan T-H. Structural Health Monitoring of Above-Ground Storage Tank Floors by Ultrasonic Guided Wave Excitation on the Tank Wall. Sensors. 2017; 17(11):2542. https://doi.org/10.3390/s17112542
Chicago/Turabian StyleLowe, Premesh S., Wenbo Duan, Jamil Kanfoud, and Tat-Hean Gan. 2017. "Structural Health Monitoring of Above-Ground Storage Tank Floors by Ultrasonic Guided Wave Excitation on the Tank Wall" Sensors 17, no. 11: 2542. https://doi.org/10.3390/s17112542
APA StyleLowe, P. S., Duan, W., Kanfoud, J., & Gan, T.-H. (2017). Structural Health Monitoring of Above-Ground Storage Tank Floors by Ultrasonic Guided Wave Excitation on the Tank Wall. Sensors, 17(11), 2542. https://doi.org/10.3390/s17112542