Article

A High Stability Time Difference Readout Technique of RTD-Fluxgate Sensors

1
College of Instrumentation & Electrical Engineering, Jilin University, No. 938 Ximinzhu Street, Changchun 130026, China
2
College of Information Technology and Media, Beihua University, No. 3999 East Binjiang Road, Jilin 132013, China
*
Author to whom correspondence should be addressed.
Sensors 2017, 17(10), 2325; https://doi.org/10.3390/s17102325
Submission received: 4 September 2017 / Revised: 28 September 2017 / Accepted: 9 October 2017 / Published: 12 October 2017
(This article belongs to the Section Physical Sensors)

Abstract

:
The performance of Residence Times Difference (RTD)-fluxgate sensors is closely related to the time difference readout technique. The noise of the induction signal affects the quality of the output signal of the following circuit and the time difference detection, so the stability of the sensor is limited. Based on the analysis of the uncertainty of the RTD-fluxgate using the Bidirectional Magnetic Saturation Time Difference (BMSTD) readout scheme, the relationship between the saturation state of the magnetic core and the target (DC) magnetic field is studied in this article. It is proposed that combining the excitation and induction signals can provide the Negative Magnetic Saturation Time (NMST), which is a detection quantity used to measure the target magnetic field. Also, a mathematical model of output response between NMST and the target magnetic field is established, which analyzes the output NMST and sensitivity of the RTD-fluxgate sensor under different excitation conditions and is compared to the BMSTD readout scheme. The experiment results indicate that this technique can effectively reduce the noise influence. The fluctuation of time difference is less than ±0.1 μs in a target magnetic field range of ±5 × 10⁴ nT. The accuracy and stability of the sensor are improved, so the RTD-fluxgate using the readout technique of high stability time difference is suitable for detecting weak magnetic fields.

1. Introduction

The fluxgate sensor has been widely used in geomagnetic observation, space magnetic field measurement, and other fields due to its high sensitivity, small size, and low power consumption, etc. [1,2,3,4,5]. The RTD-fluxgate sensor developed by Bruno Andò, et al., using the hysteresis saturation phenomenon of soft magnetic material, can detect magnetic fields through the corresponding relationship between the residence times difference of the induction pulse signal and the target magnetic field [6,7,8], and has the advantages of a simple detection procedure, strong anti-interference ability, easy miniaturization, and digitization, etc. It has attracted more attention in the fields of national defense military and geomagnetic prospecting [9,10,11]. However, the noise of the induction signal makes the time difference read uncertain, seriously affecting the accuracy of RTD-fluxgate sensor measurements [12,13].
The quality of the induction signal is closely related to variations in the dynamic permeability of the magnetic core [14,15]. To reduce the effects of noise, an effective approach is utilized with a 2714A annealed core with a sharp hysteresis loop and low coercive field [16,17]. Because the induction pulse signal corresponds to the state of magnetic saturation, Bruno Andò, et al. read the time difference between the peak points of the induction pulse signal to measure the target magnetic field [18,19]. As a result of the sensitivity of the RTD-fluxgate unit to repetitive magnetization, magnetic core noise, electronic circuit noise, and environment interference, it is difficult to locate the peak points accurately [20,21,22]. Wang Y.Z., et al. read the time difference by using the threshold which is set slightly lower than the peak value of the induction signal [23]. Although the error of locating the peak points can be avoided, the threshold has to be set. Even in this case, the magnetic noise and electrical noise cause the transverse instability of the induction signal, resulting in the uncertainty of the time difference readout. Lu S.B., et al. fitted the pulse curve by using the data near the peak value of positive and negative output pulse, and depending on the time of three adjacent peaks to calculate the residence time difference which measure the target magnetic field [24]. The method does not need to consider the influence of the threshold set on the output performance of the sensors, however, the accuracy of curve fitting is limited due to noise interference existing in the induction signal. In order to reduce the influence of noise on time difference reading, several approaches for filtering the induction signal are introduced [25,26]. Although the method can reduce the noise intensity, it is mainly aimed at detecting the amplitude of the signal. After filtering, there is a certain degree of distortion in the induction signal which causes the time difference reading error. Therefore, the induction signal filtering is limited to time difference reading. According to RTD-fluxgate detection theory, the large deviation in the output time difference can be caused by output signal noise. If the induction signal is used individually to read time difference, the noise effects cannot be avoided.
In order to improve the accuracy and stability of RTD-fluxgate sensors and reduce the noise that produces uncertainties in the estimation of the residence times, the relationship between the state of the magnetic core and the target magnetic field is studied. On the basis of analyzing the working principle of the RTD-fluxgate sensor, in this paper, a new method of time difference reading between the excitation signal passing through the zero point as a reference time and the negative output pulse is proposed, that is, the excitation signal and the output pulse signal are combined to read the negative magnetic saturation time ΔTNMST as the detection quantity to measure the target magnetic field. A mathematical model of the sensor output response between the ΔTNMST and (DC) target magnetic field Hx is established under a triangular excitation signal. It is analyzed that ΔTNMST and sensitivity SNMST change with the variation of the amplitude and frequency of the excitation current. The theoretical and experimental comparison between the NMST and the BMSTD readout strategy is presented and discussed. The results show that this method can reduce the influence of the output pulse noise effects on the readout technique.
The rest of this paper is organized as follows. Section 2 presents the working principle of RTD-fluxgate sensor in the case of triangular signal excitation. The influence of the output induction signal noise on the time difference readout strategy is analyzed. In Section 3, the NMST readout strategy is introduced and the uncertainty of the method is calculated. By using the NMST readout strategy, the mathematical model of the sensor output response is established and the variation of ΔTNMST and SNMST with different excitation conditions is analyzed. In Section 4, experiments are investigated to check the performance of the NMST readout strategy compared to the BMSTD readout strategy. Section 5 concludes the whole paper and the results are presented.

2. Working Principle of RTD-Fluxgate Sensors and Stability Analysis of Time Difference Detection

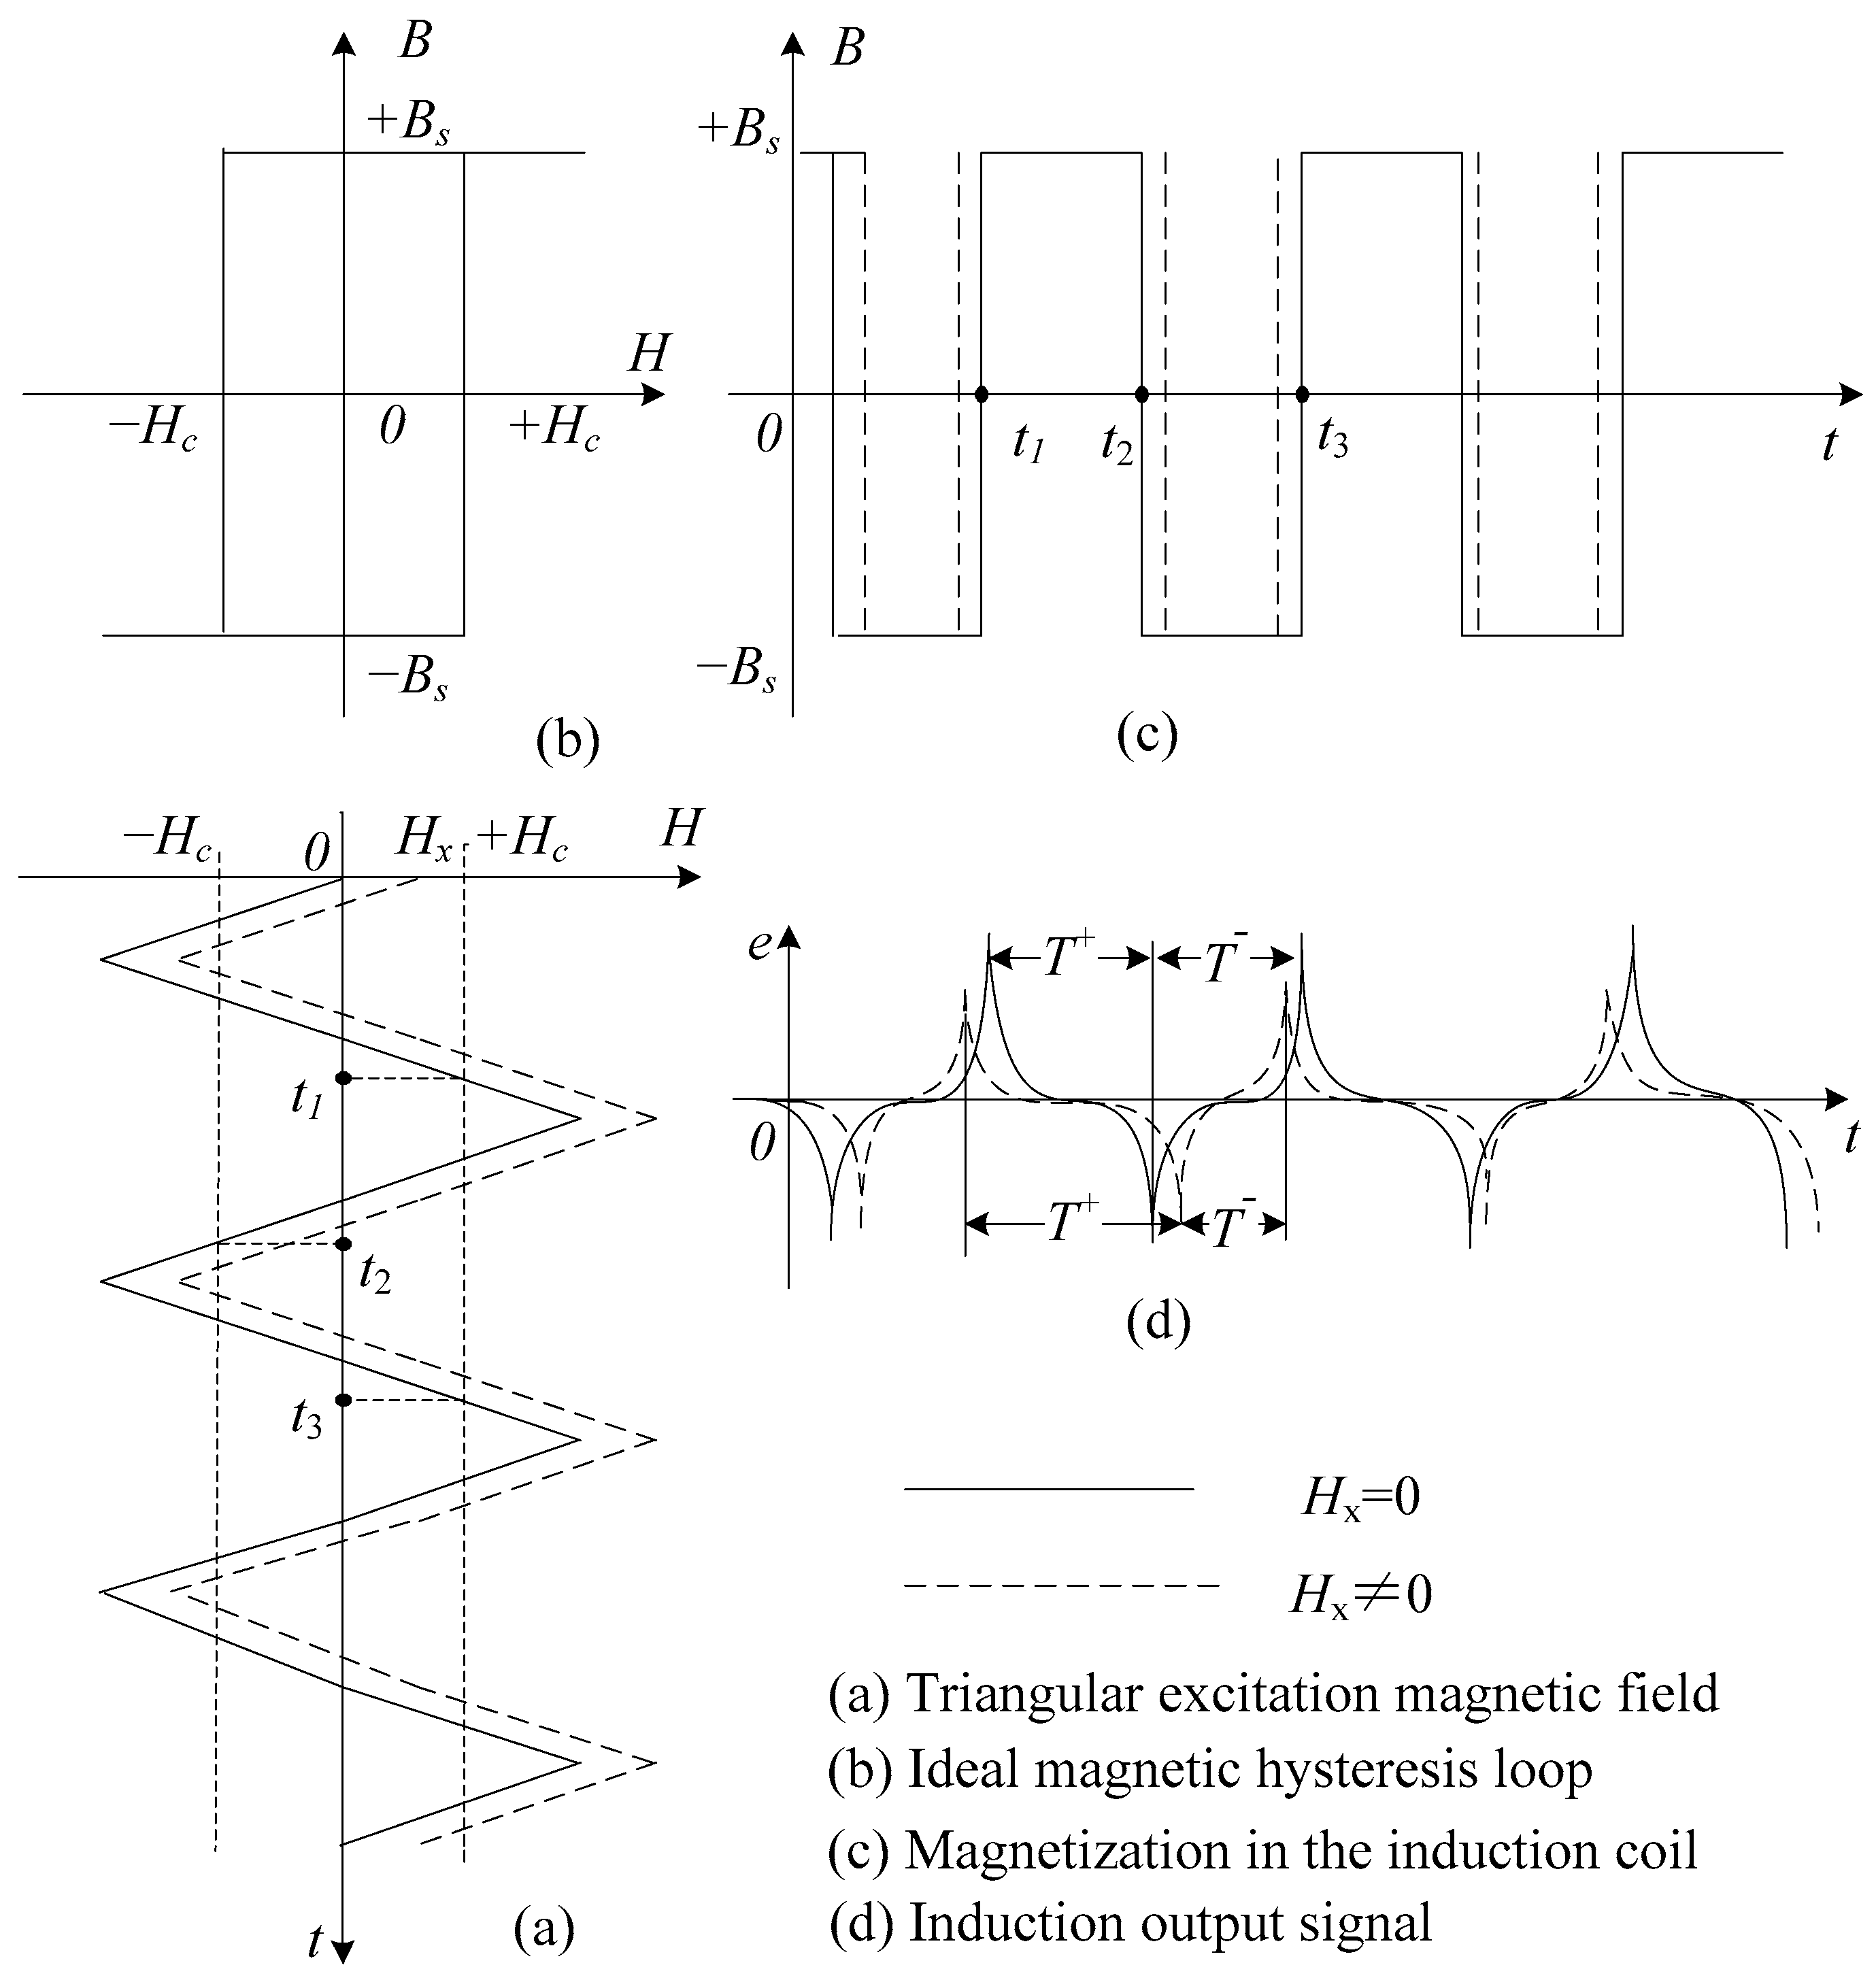
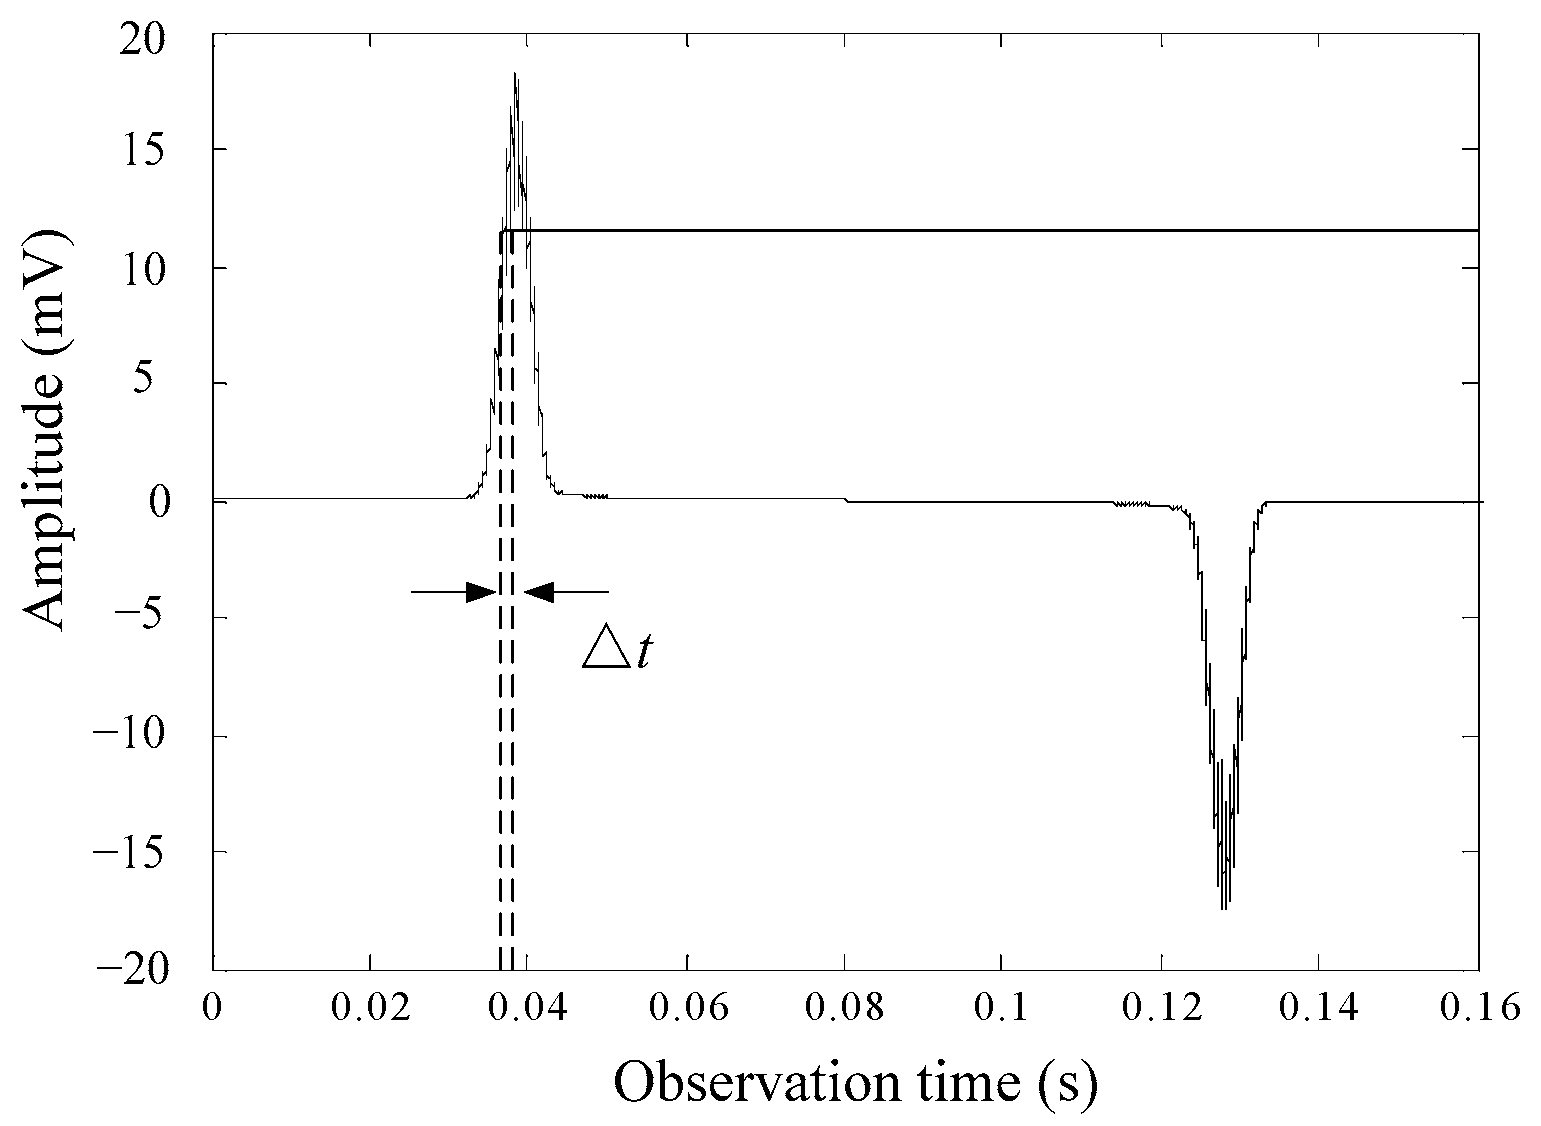
2.1. Working Principle of RTD-Fluxgate Sensors under Triangular Excitation Signal

The magnetic core of the sensor is magnetized by a periodically alternating triangular magnetic field to the states of two-way over-saturation, as is shown in Figure 1a. The ideal hysteresis loop of the magnetic core is shown in Figure 1b. The magnetization produced in the induction coil is shown in Figure 1c. If a target magnetic field Hx exists along the axis of the sensor, the residence times of the magnetic core in positive and negative saturation states are different. Because the time interval between the positive and negative pulse of induction signal T+ is not equal to the time interval between the negative pulse and the next positive pulse T, a time difference between them exists. We may obtain the values of Hx by detecting the bidirectional magnetic saturation time difference △T = T+T of the output pulse signal which relates to the states [8,27,28,29], as is shown in Figure 1d.
In this article, the case of triangular excitation is considered. The triangular excitation is assumed to have amplitude and period equal to Hm and Te, respectively. The expression is as follows:
H e ( t ) = { α t N T e T e 4 < t < N T e + T e 4 α ( t T e 2 ) N T e + T e 4 < t < N T e + 3 T e 4
As is shown in Figure 1a, when the excitation field He(t) reaches saturation of magnetic core, the times are t1, t2 and t3. At period Te of the induction signal, it is straightforward to calculate the residence times T+ and T:
T + = t 2 t 1 = 2 H x α + T e 2
T = t 3 t 2 = 2 H x α + T e 2
The output response of the RTD-fluxgate under the triangular excitation field is expressed as shown in Equation (4):
Δ T = T + T = 4 H x α = 4 H x 4 H m f e = H x H m f e
The sensitivity of the RTD-fluxgate can be estimated:
S = Δ T H x = 4 α = 1 H m f e

2.2. Stability Analysis of BMSTD Readout Technology

Adoping the detection method using the induction output signal’s hysteresis shape and timing, that is, counting the low and high levels formed after the signal is amplified and then made in to shapes, the RTD-fluxgate can read ΔT. According to the method, when the excitation condition and the core material are determined, the stability of the time difference measurement is only related to the readout technology. Generally, the output signal is not smooth, and there is transverse instability because of electrical noise, magnetic noise, etc. As is shown in Figure 2, the trigger position of the output signal varies because of the noise, eventually leading to fluctuation of the time difference.
It is assumed that in an ideal case, the induction output signal does not have noise interference. The time of the first positive pulse appears as t1, the time of the first negative pulse appears as t2, and the second positive pulse appears as t3. The presence of magnetic and electrical noise affect the estimation of three transition times, so the corresponding actual transition times are t 1 , t 2 , t 3 , respectively. As is observed in Figure 3, the solid line represents the ideal output residence times, and the dotted line represents the actual output residence times when influenced by noise. The tnoise is an uncertainty product due to noise in the estimation of the residence times. ΔT is expressed as follows:
Δ T = T + T = ( t 2 t 1 ) ( t 3 t 2 ) = 2 t 2 t 1 t 3
The magnetic noise is not related to the electrical noise in the detection system, therefore, the uncertainty of ΔT is affected by noise, which is described in Equation (7):
γ 4 ( γ m 2 2 + γ e 2 2 ) + ( γ m 1 2 + γ e 1 2 ) + ( γ m 3 2 + γ e 3 2 )
In Equation (7), γ represents the total noise of ΔT, γmi represents the magnetic noise of transition time ti, and γei represents the electrical noise of transition time ti. Assuming the same uncertainty value for each ti, it is possible to write the following expression:
γ 6 ( γ m i 2 + γ e i 2 )
By using the BMSTD readout scheme, three transition times need to be estimated. Because each transition time is affected by noise, the uncertainties of ΔT are fairly large. In view of the situation above, in order to minimize the influence of noise on the detection and reduce the uncertainty of the time difference, the readout technology needs to be improved.

3. The Mathematical Output Response Model of the NMST Readout Technique and Stability Analysis

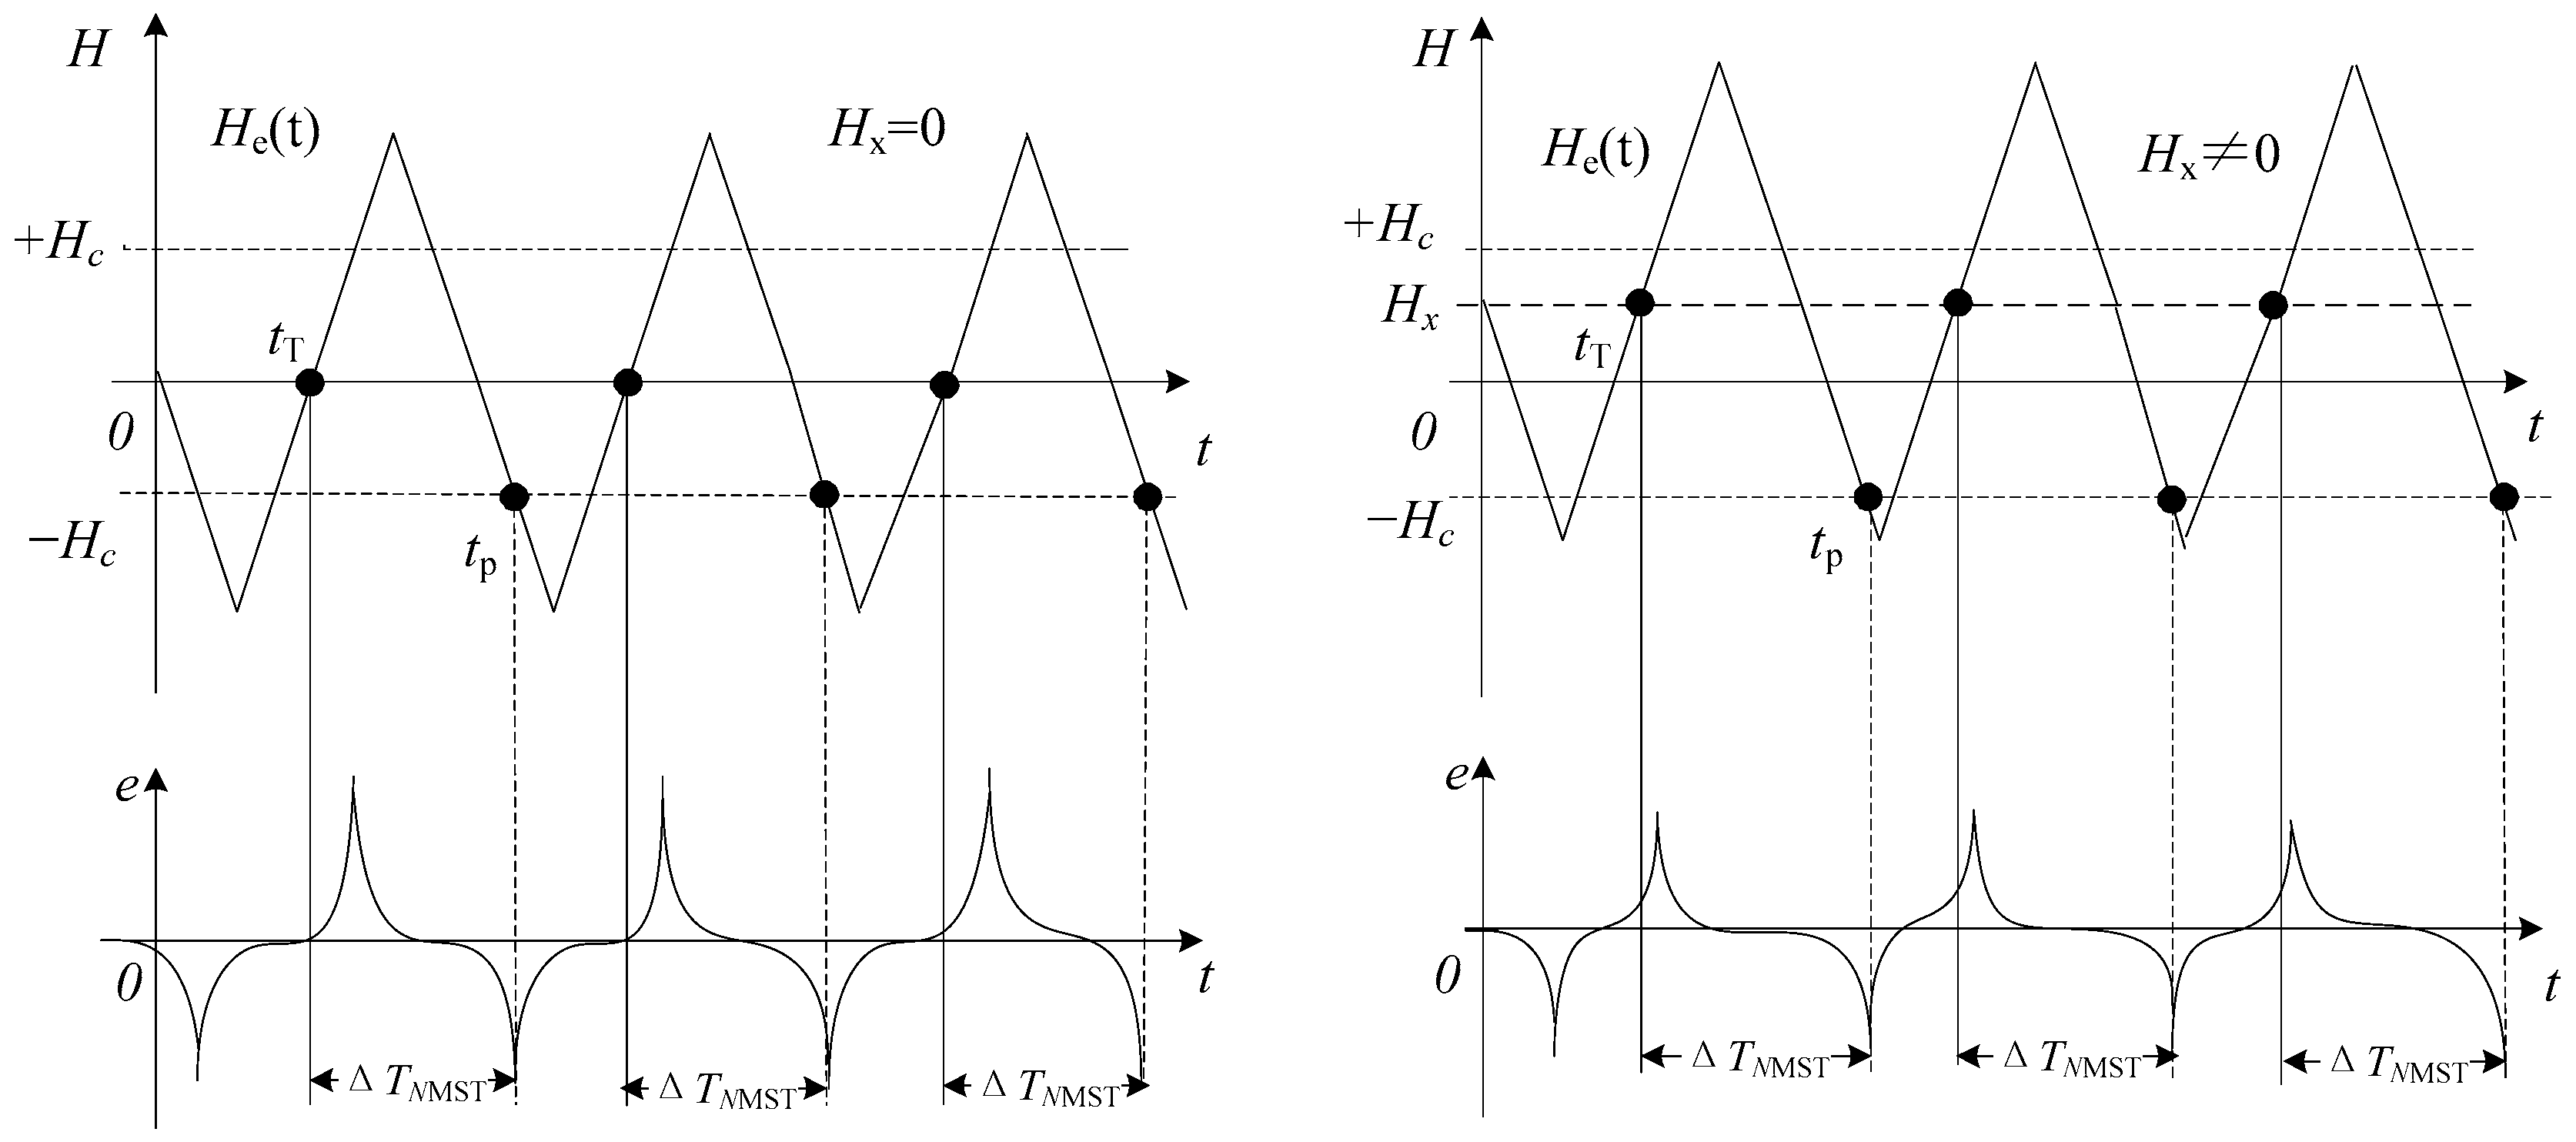
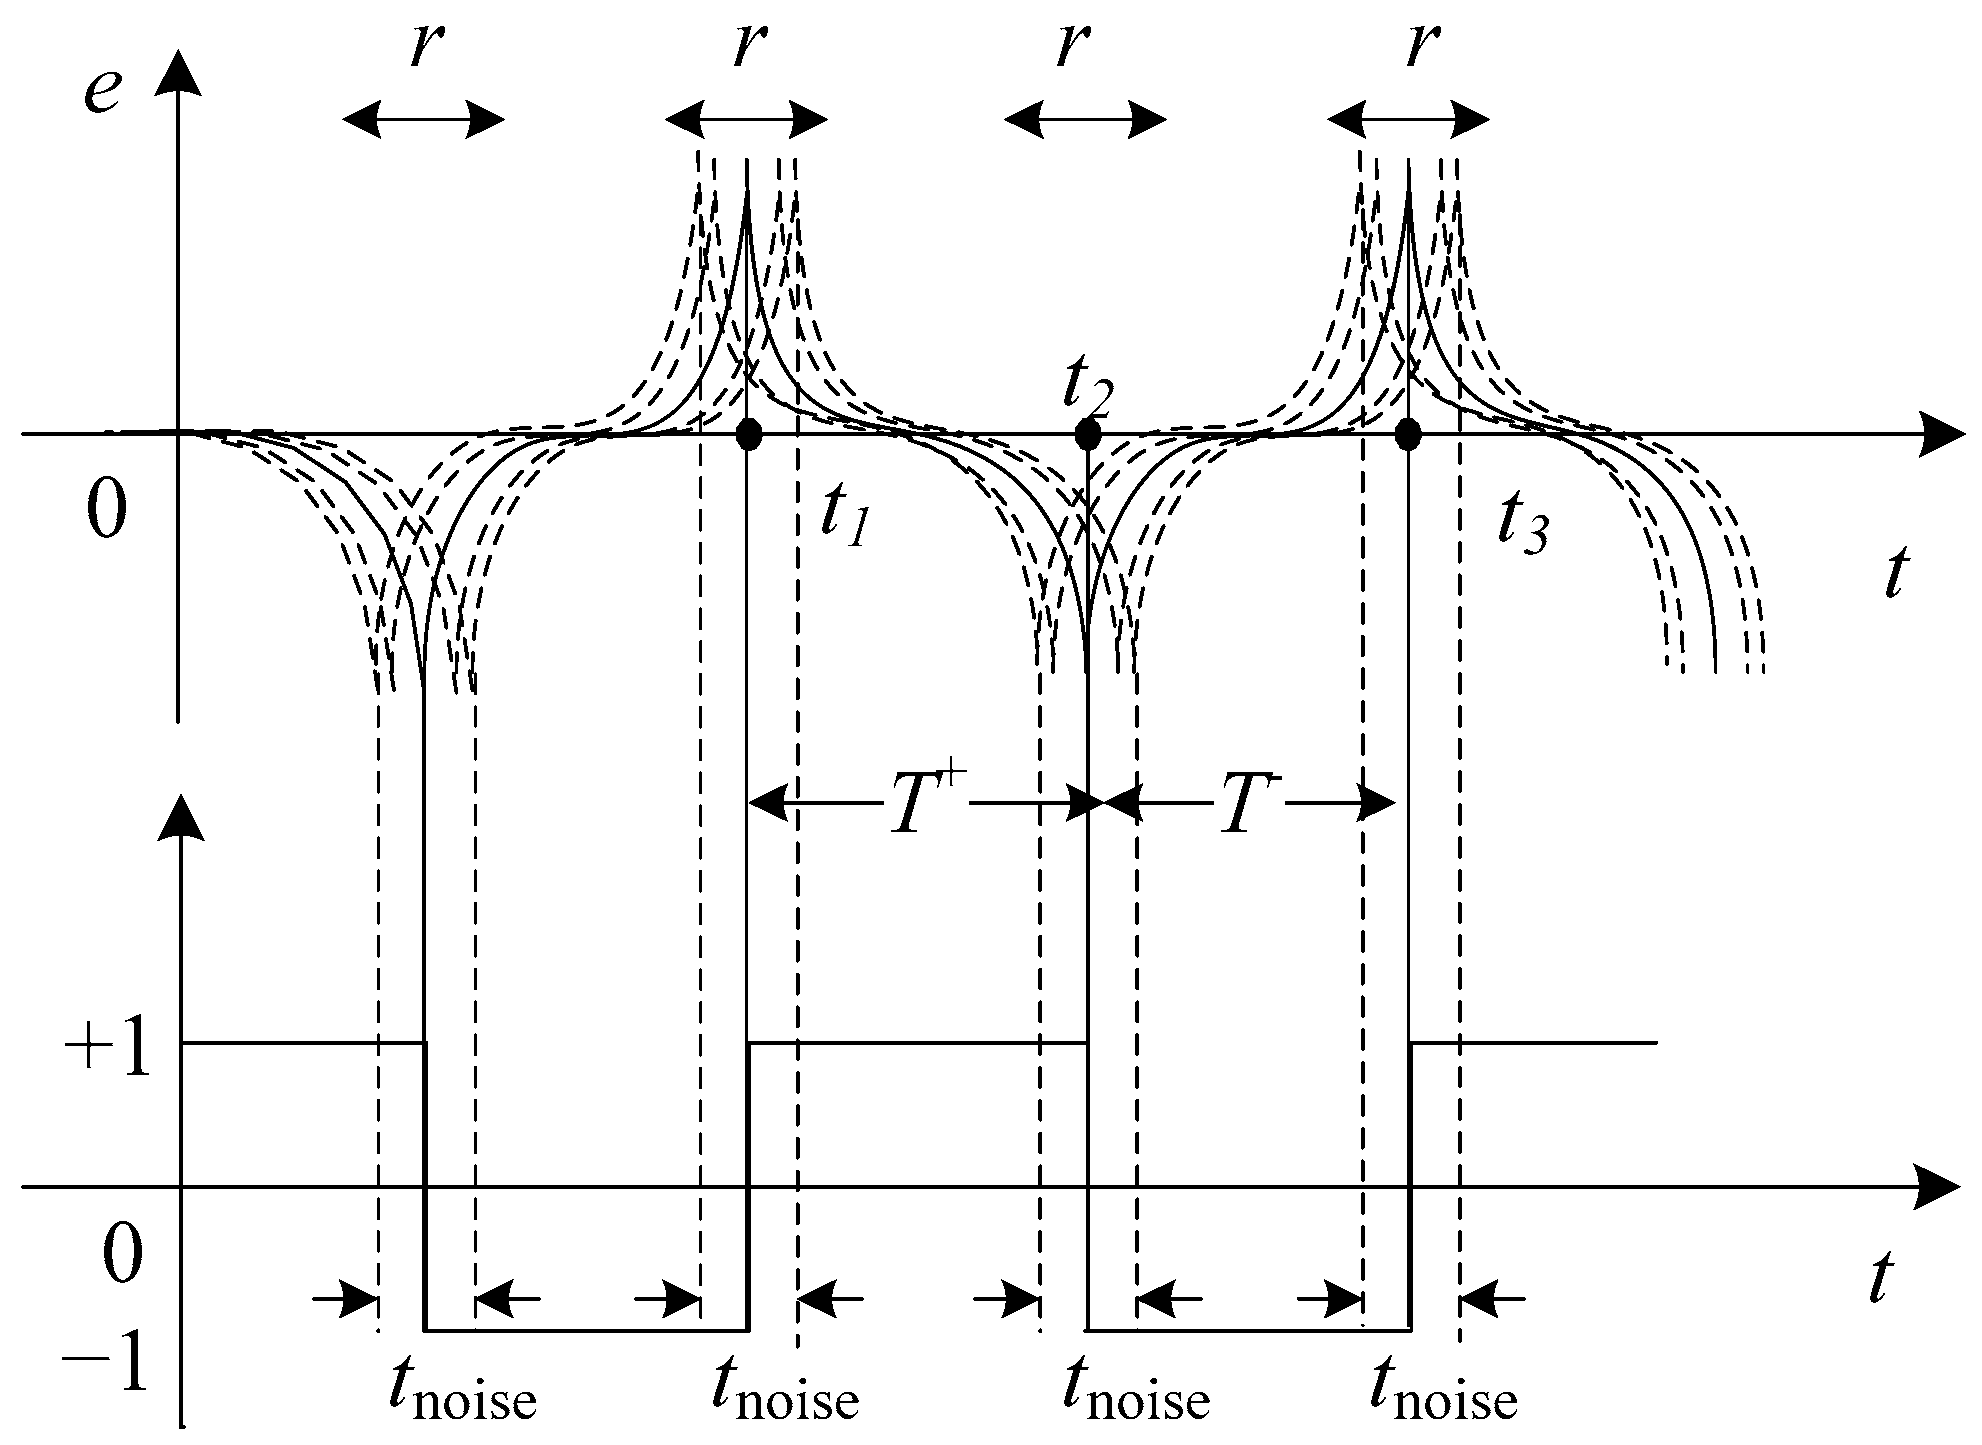
3.1. The NMST Readout Technique and the Mathematical Output Response Model

If a target magnetic field Hx exists, the time when the soft magnetic material reaches the positive and negative saturation states will change. The time when the soft magnetic material reaches two steady points of the double-well potential are different. The Hx directly affects the time when the magnetic core reaches the positive and negative saturation states. Therefore, the time of magnetic core saturation is equivalent to the bidirectional magnetic saturation time difference, ΔT, which can be considered as the detection quantity to measure Hx.
In this paper, however, we also present a different way to process the excitation and induction signals to get information on the target field. This readout strategy is quite similar to the BMSTD scheme except for the use of a reference time. It is known when the excitation signal passes through the zero point, and so the transition time is used as reference time. The method of reading the time difference between the reference time and the negative output pulse is proposed, that is, the excitation signal and induction signal are combined to read the negative magnetic saturation time, ΔTNMST, to detect the Hx. As is shown in Figure 4, when the magnetic core becomes saturated, an output pulse signal is generated on the induction coil; the transition time when the excitation signal amplitude is zero is used as the reference time, tT, and when the applied magnetic field exceeds the coercive field, −Hc, the induced voltage produces a negative pulse at tP. The relationship between the triangular excitation field He(t) expressed by Equation (1) and the target field Hx is as follows:
t T : α t T = 0
t P : H x α ( t p T e 2 ) = H c
Deduced by Equations (9) and (10):
t T = 0
t p = ( H c + H x ) / α + T e 2
The time difference ΔTNMST between tP and tT is defined to negative magnetic saturation time, which is given by:
Δ T N M S T = t p t T
When using the NMST readout strategy, the output response of the RTD-fluxgate is as follows:
Δ T N M S T = t p t T = ( H c + H x ) 4 H m f e + T e 2
The sensitivity expression for the NMST strategy obtained by using similar calculations is shown in Equation (15):
S N M S T = Δ T N M S T H x = 1 α = T e 4 H m = 1 4 H m f e
When Hx and the coercive field Hc of the magnetic core are fixed, the relationship between ΔTNMST and He(t) is as shown in Figure 5. When the amplitude Hm and the frequency f of the excitation magnetic field are smaller, the ΔTNMST is greater.
According to Equation (15), the variation tendency of the sensitivity of the RTD-fluxgate SNMST, obtained by using the NMST readout strategy, is shown in Figure 6.
From the figure above, when using the NMST readout technology, the SNMST of RTD-fluxgate is inversely proportional to the excitation magnetic field’s amplitude Hm and frequency f. Therefore, when the excitation circuit structure does not need changing, the sensitivity of the RTD-fluxgate is improved by reducing the excitation magnetic field amplitude Hm and the frequency f, and at the same time, the power consumption is cut down. But, according to the working principle of RTD-fluxgate, the magnetic core of the sensitive unit needs to achieve bidirectional oversaturation, so the excitation magnitude of Hm should at least saturate the core and the excitation frequency f is too low, which will lead to a smaller range of the measured magnetic field and a worse effect of the induction output signal. Therefore, the excitation parameters can be determined according to the actual measurement conditions.

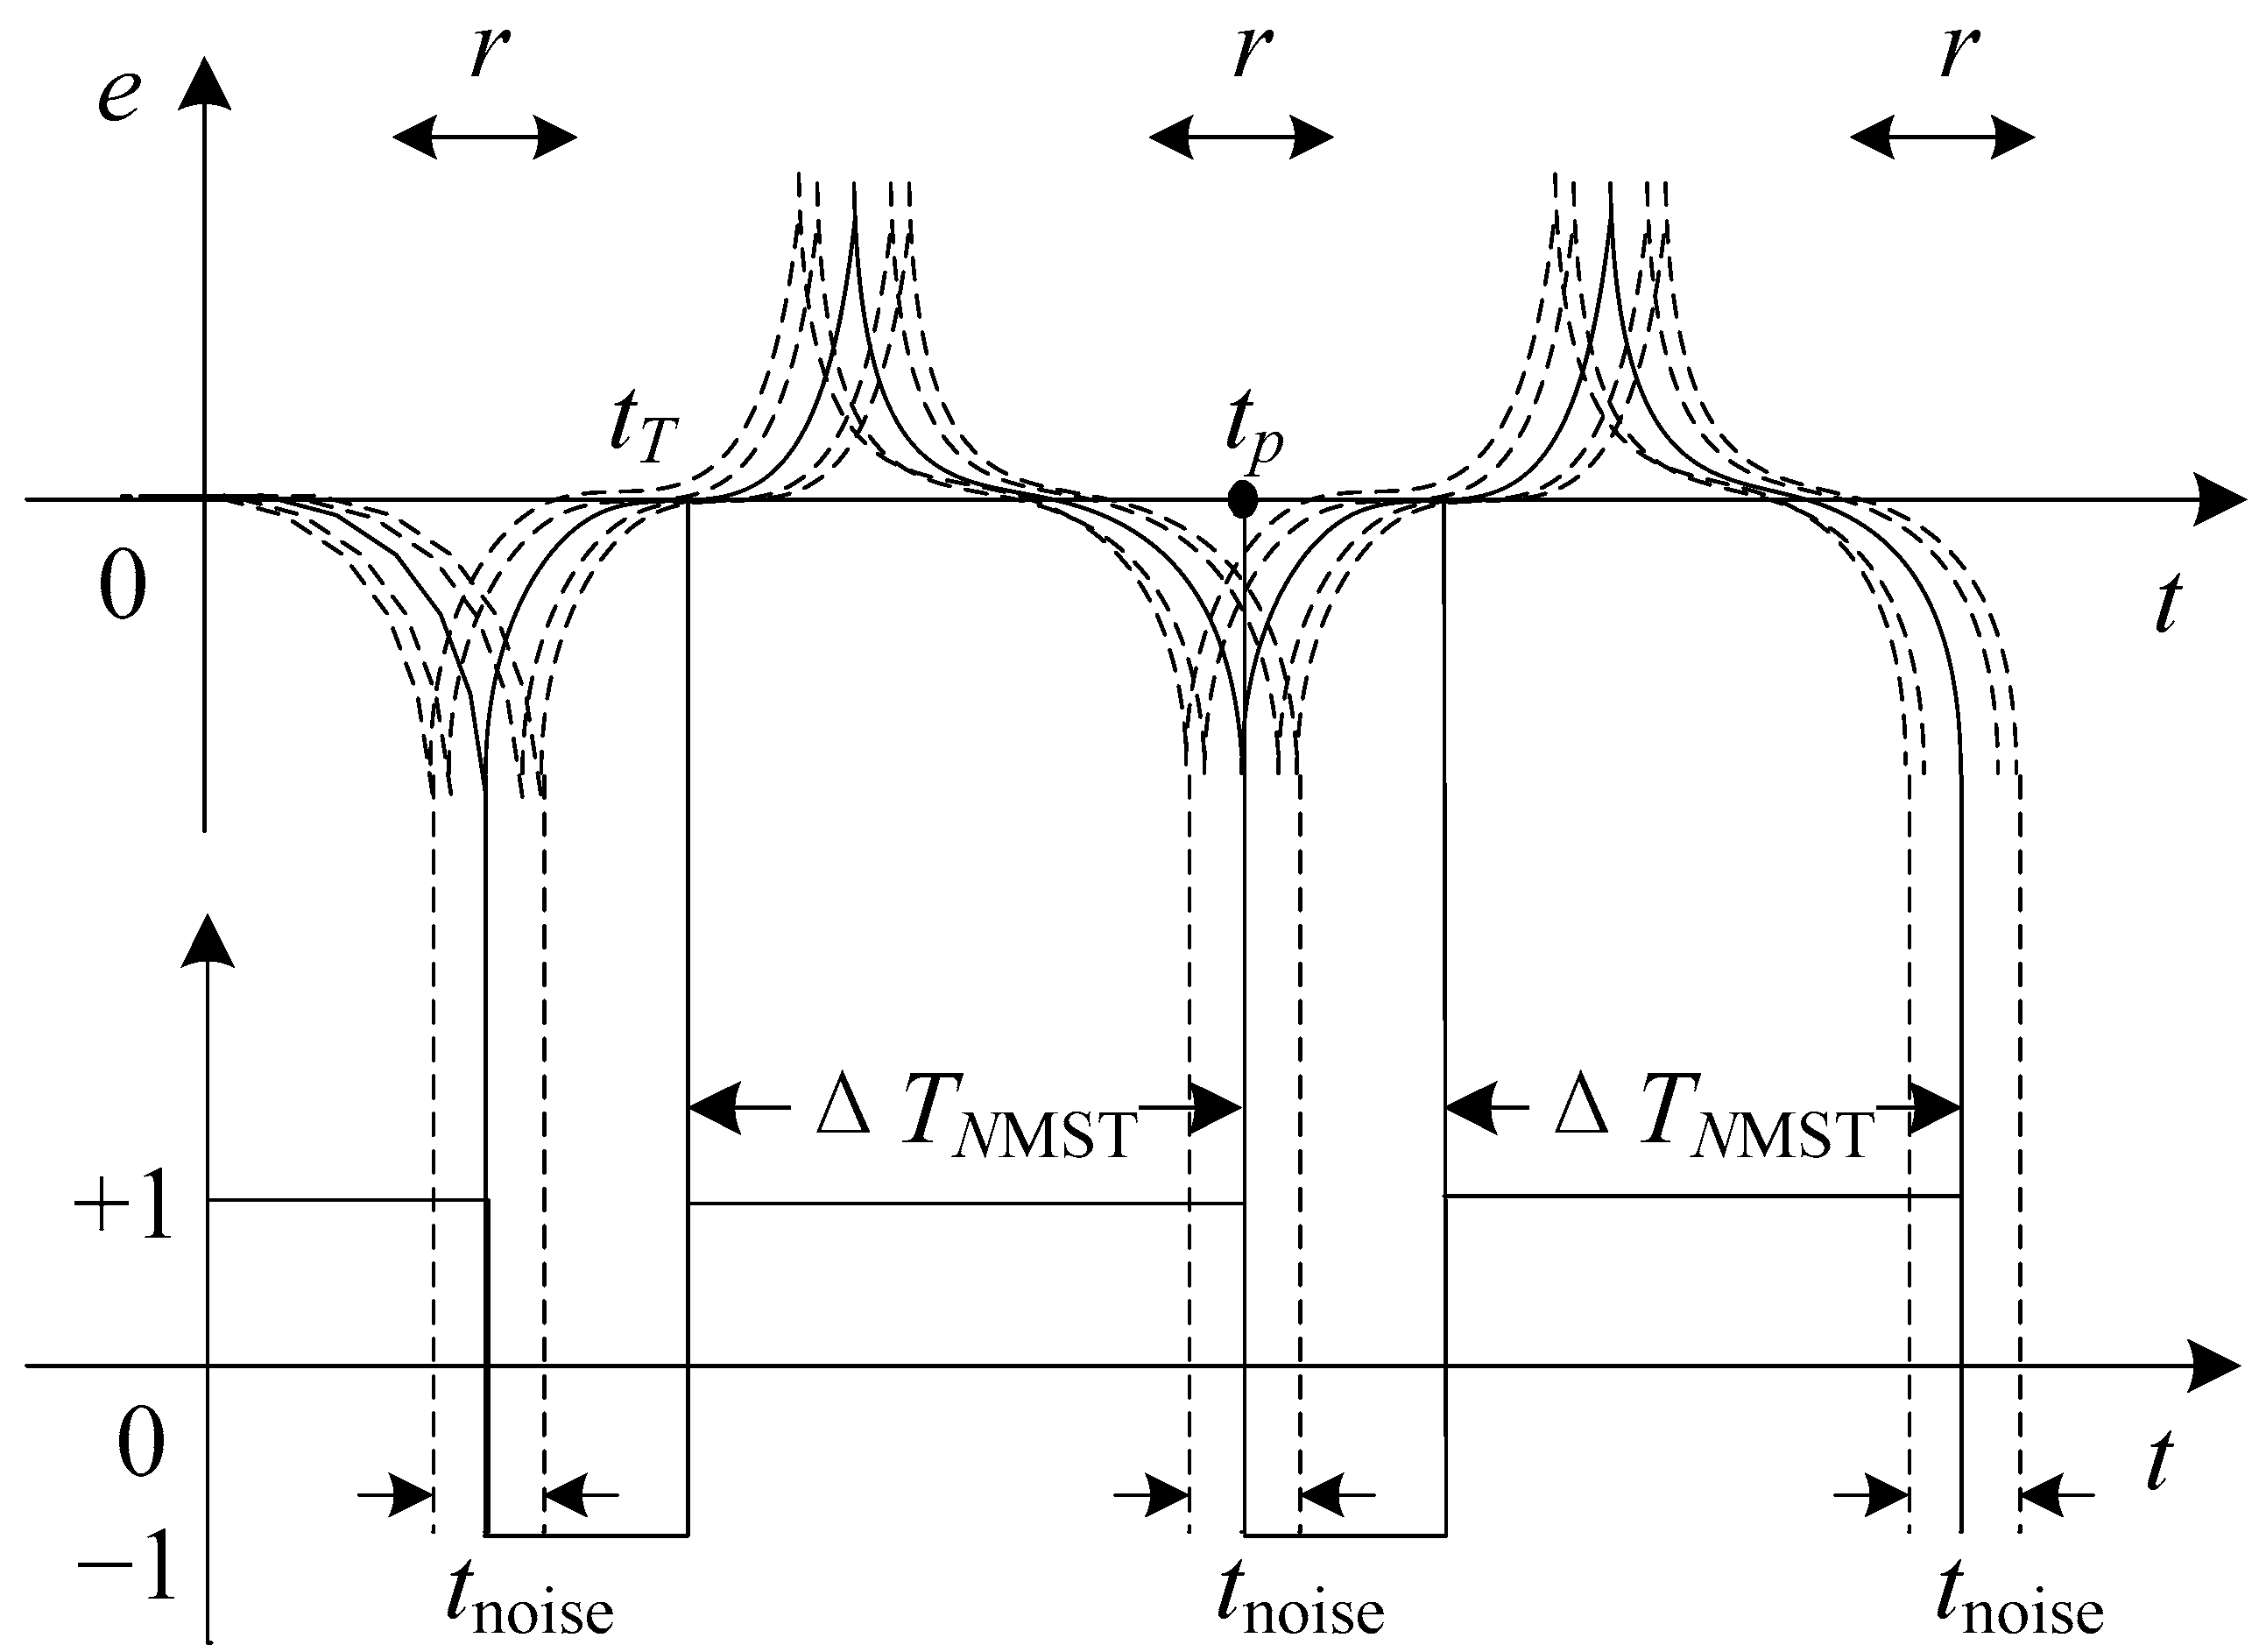
3.2. Stability Analysis of NMST Readout Technology

When using the NMST readout scheme, the excitation signal is generated by the signal generator. The reference time tT does not need measuring, therefore tT can be obtained accurately. As is observed in Figure 7, in the ideal condition, because the output signal does not have noise interference, the time of the first negative pulse appears at tp and the corresponding actual transition time is tp’. The solid line represents the ideal output residence times and the dotted line represents the actual output residence times influenced by noise. An expression about ΔTNMST actually measured is as follows:
Δ T N M S T = t p t T
Because of the known tT, the noise affects the ΔTNMST at the transition time tp′. In this case, the presence of noise affects only the estimation of one transition time (the reference time being assumed to be noiseless) instead of three such times in the BMSTD strategy. The uncertainty of ΔTNMST affected by the noise is as follows:
γ N M S T γ m i 2 + γ e i 2
Based on analysis of theory, the relationship between the NMST and BMSTD readout schemes affected by noise is shown in the Equation (18). The NMST readout scheme can reduce the influence of noise on reading the time difference. Therefore, reading ΔTNMST to measure Hx can improve the stability of the time difference.
γ N M S T = 1 6 γ

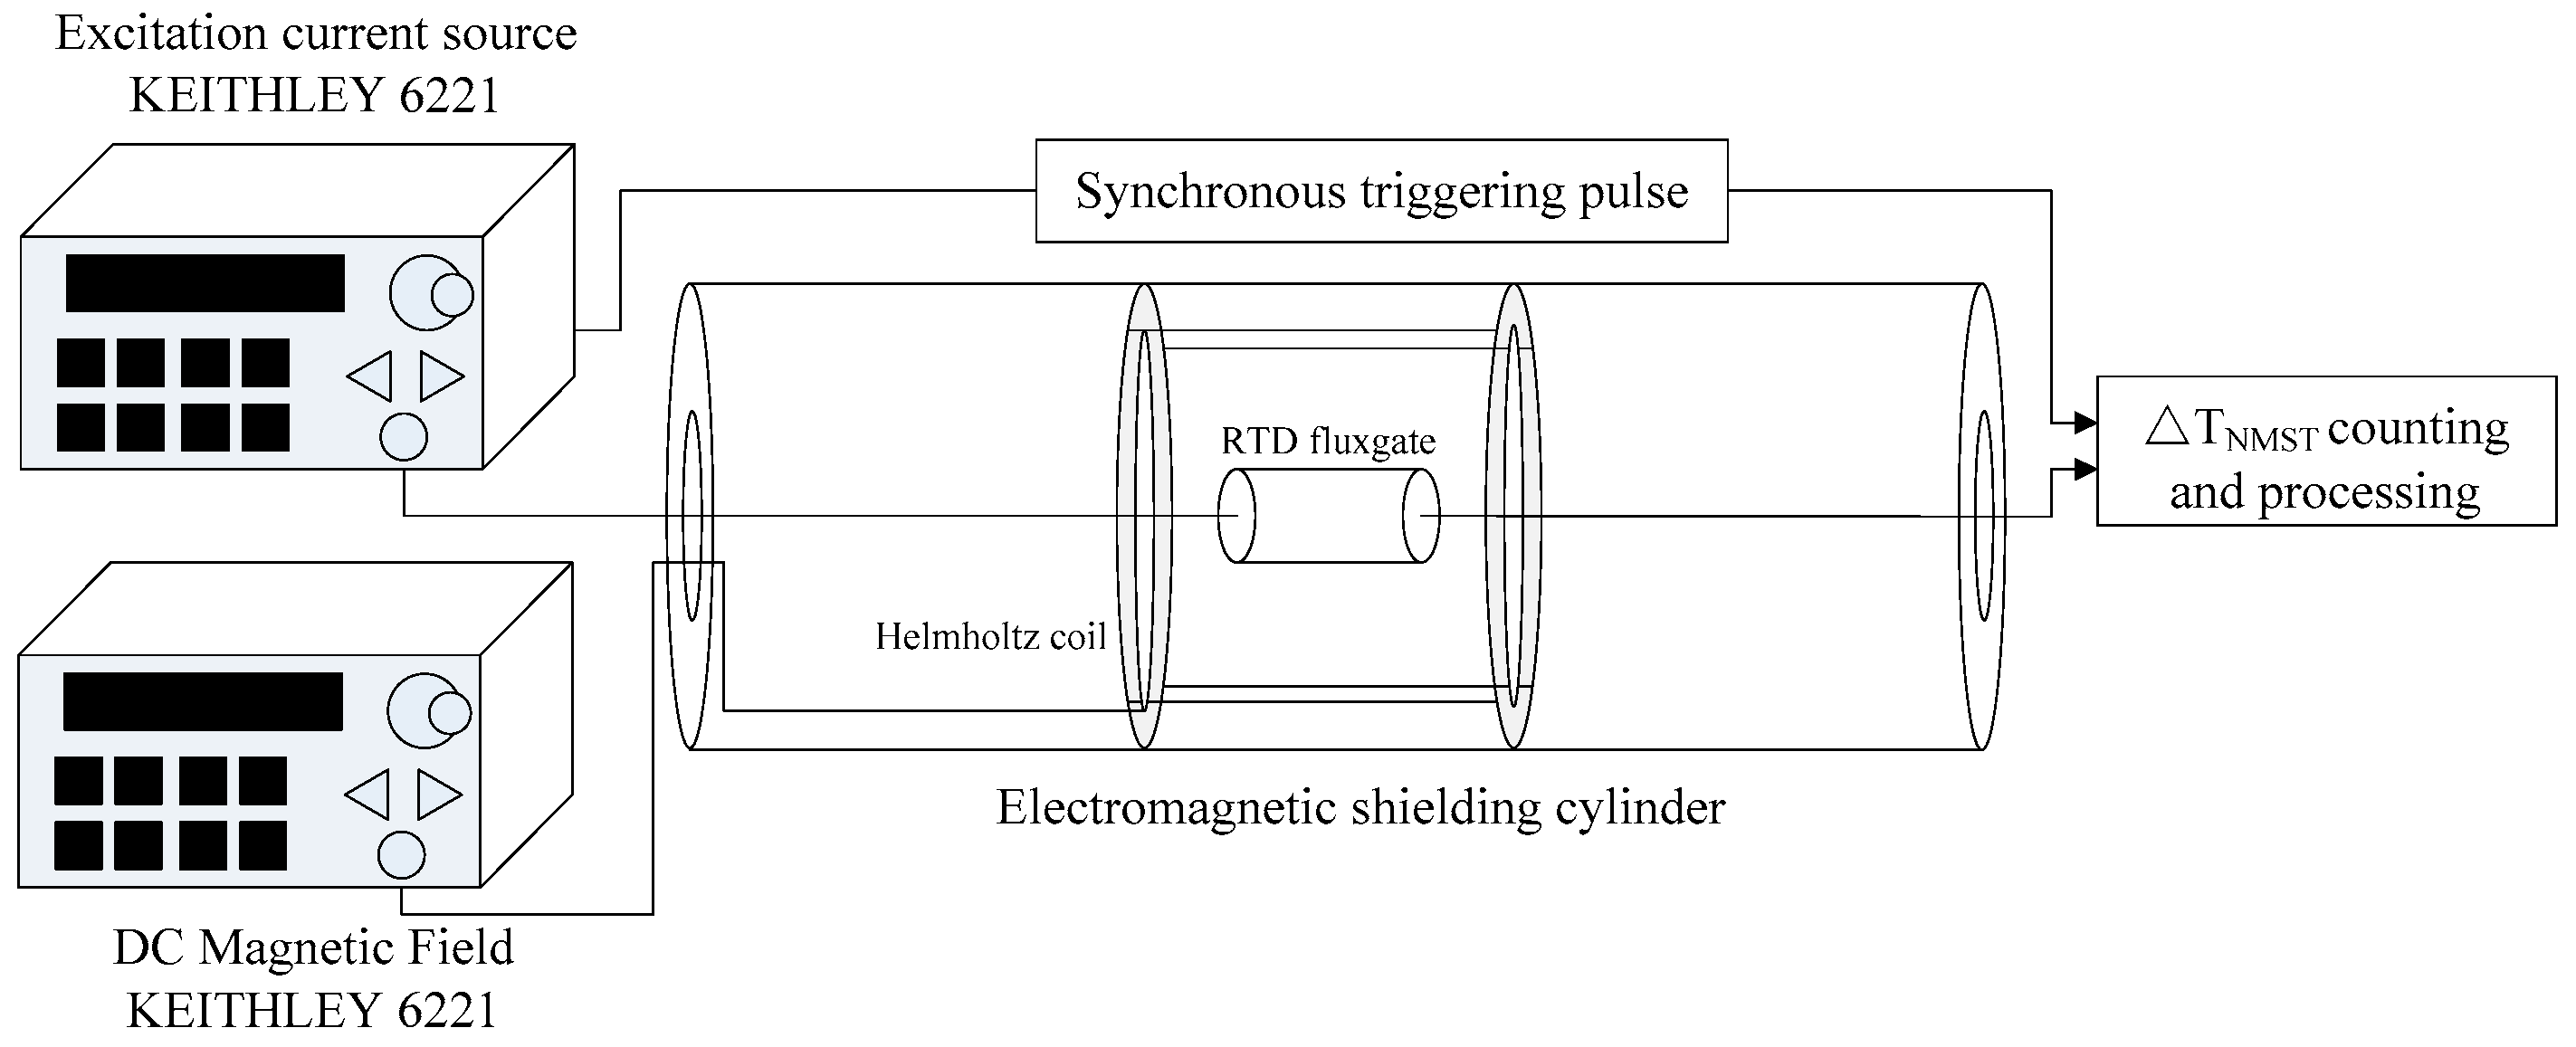
4. Experiments and Preliminary Results

The experimental instruments are shown in Figure 8. The RTD-fluxgate sensor is made by the Key laboratory of geophysical exploration equipment, Ministry of Education (Jilin University) and included two parts: the sensitive unit and the signal detection circuit. The sensitive unit consists of an excitation coil, magnetic core, and induction coil. The core adopts a co-based amorphous ribbon which is 0.8 mm in width, 0.025 mm in thickness, and 100 mm in length. The core is placed inside the non-magnetic framework. The excitation coil is symmetrically twined on both ends of the non-magnetic framework with the same number of turns, and the induction coil is twined in the middle. The excitation coil and induction coil are 100 turns and 1000 turns, respectively, using 0.1 mm enameled copper wires. The induction signal is amplified and rectified in the signal detection circuit, and then the rectangular signal is input to the time difference counting and processing part which is made up of Field Programmable Gate Array (FPGA) and STM32 microcontroller. In the magnetic shielding room made of multilayer silicon steel, the Helmholtz coil is placed in the middle of the multilayer electromagnetic shielding cylinder made of permalloy. The RTD-fluxgate is laid in the center of the loop, which can be considered as a homogeneous magnetic field. Two precision current sources of KEITHLEY 6221 are utilized in the experiment to excite the Helmholtz coil for generating a DC target magnetic field and drive the excitation coil of the RTD-fluxgate. The experimental measurement schematic diagram is shown in Figure 9.
The excitation coil of the sensitive unit generates a triangular excitation magnetic field. The induced voltage generated by the induction coil passes through the instrumentation amplifier circuit, the second level amplifier circuit, the addition circuit, and the shaping circuit, obtaining a rectangular signal which carries the information of the Hx. The signal is input to the CH1 channel of FPGA logic signal processor. Regulating the excitation current source generates a synchronous triggering pulse. When the excitation voltage amplitude is zero, the trigger point is set. The synchronous trigger pulse is input to the CH2 channel of FPGA. FPGA uses two channel signals to count the number of time points when the counting frequency fc is 100 MHz. The time points N is transmitted into ΔTNMST which is sent to STM32 for storage.
(1)
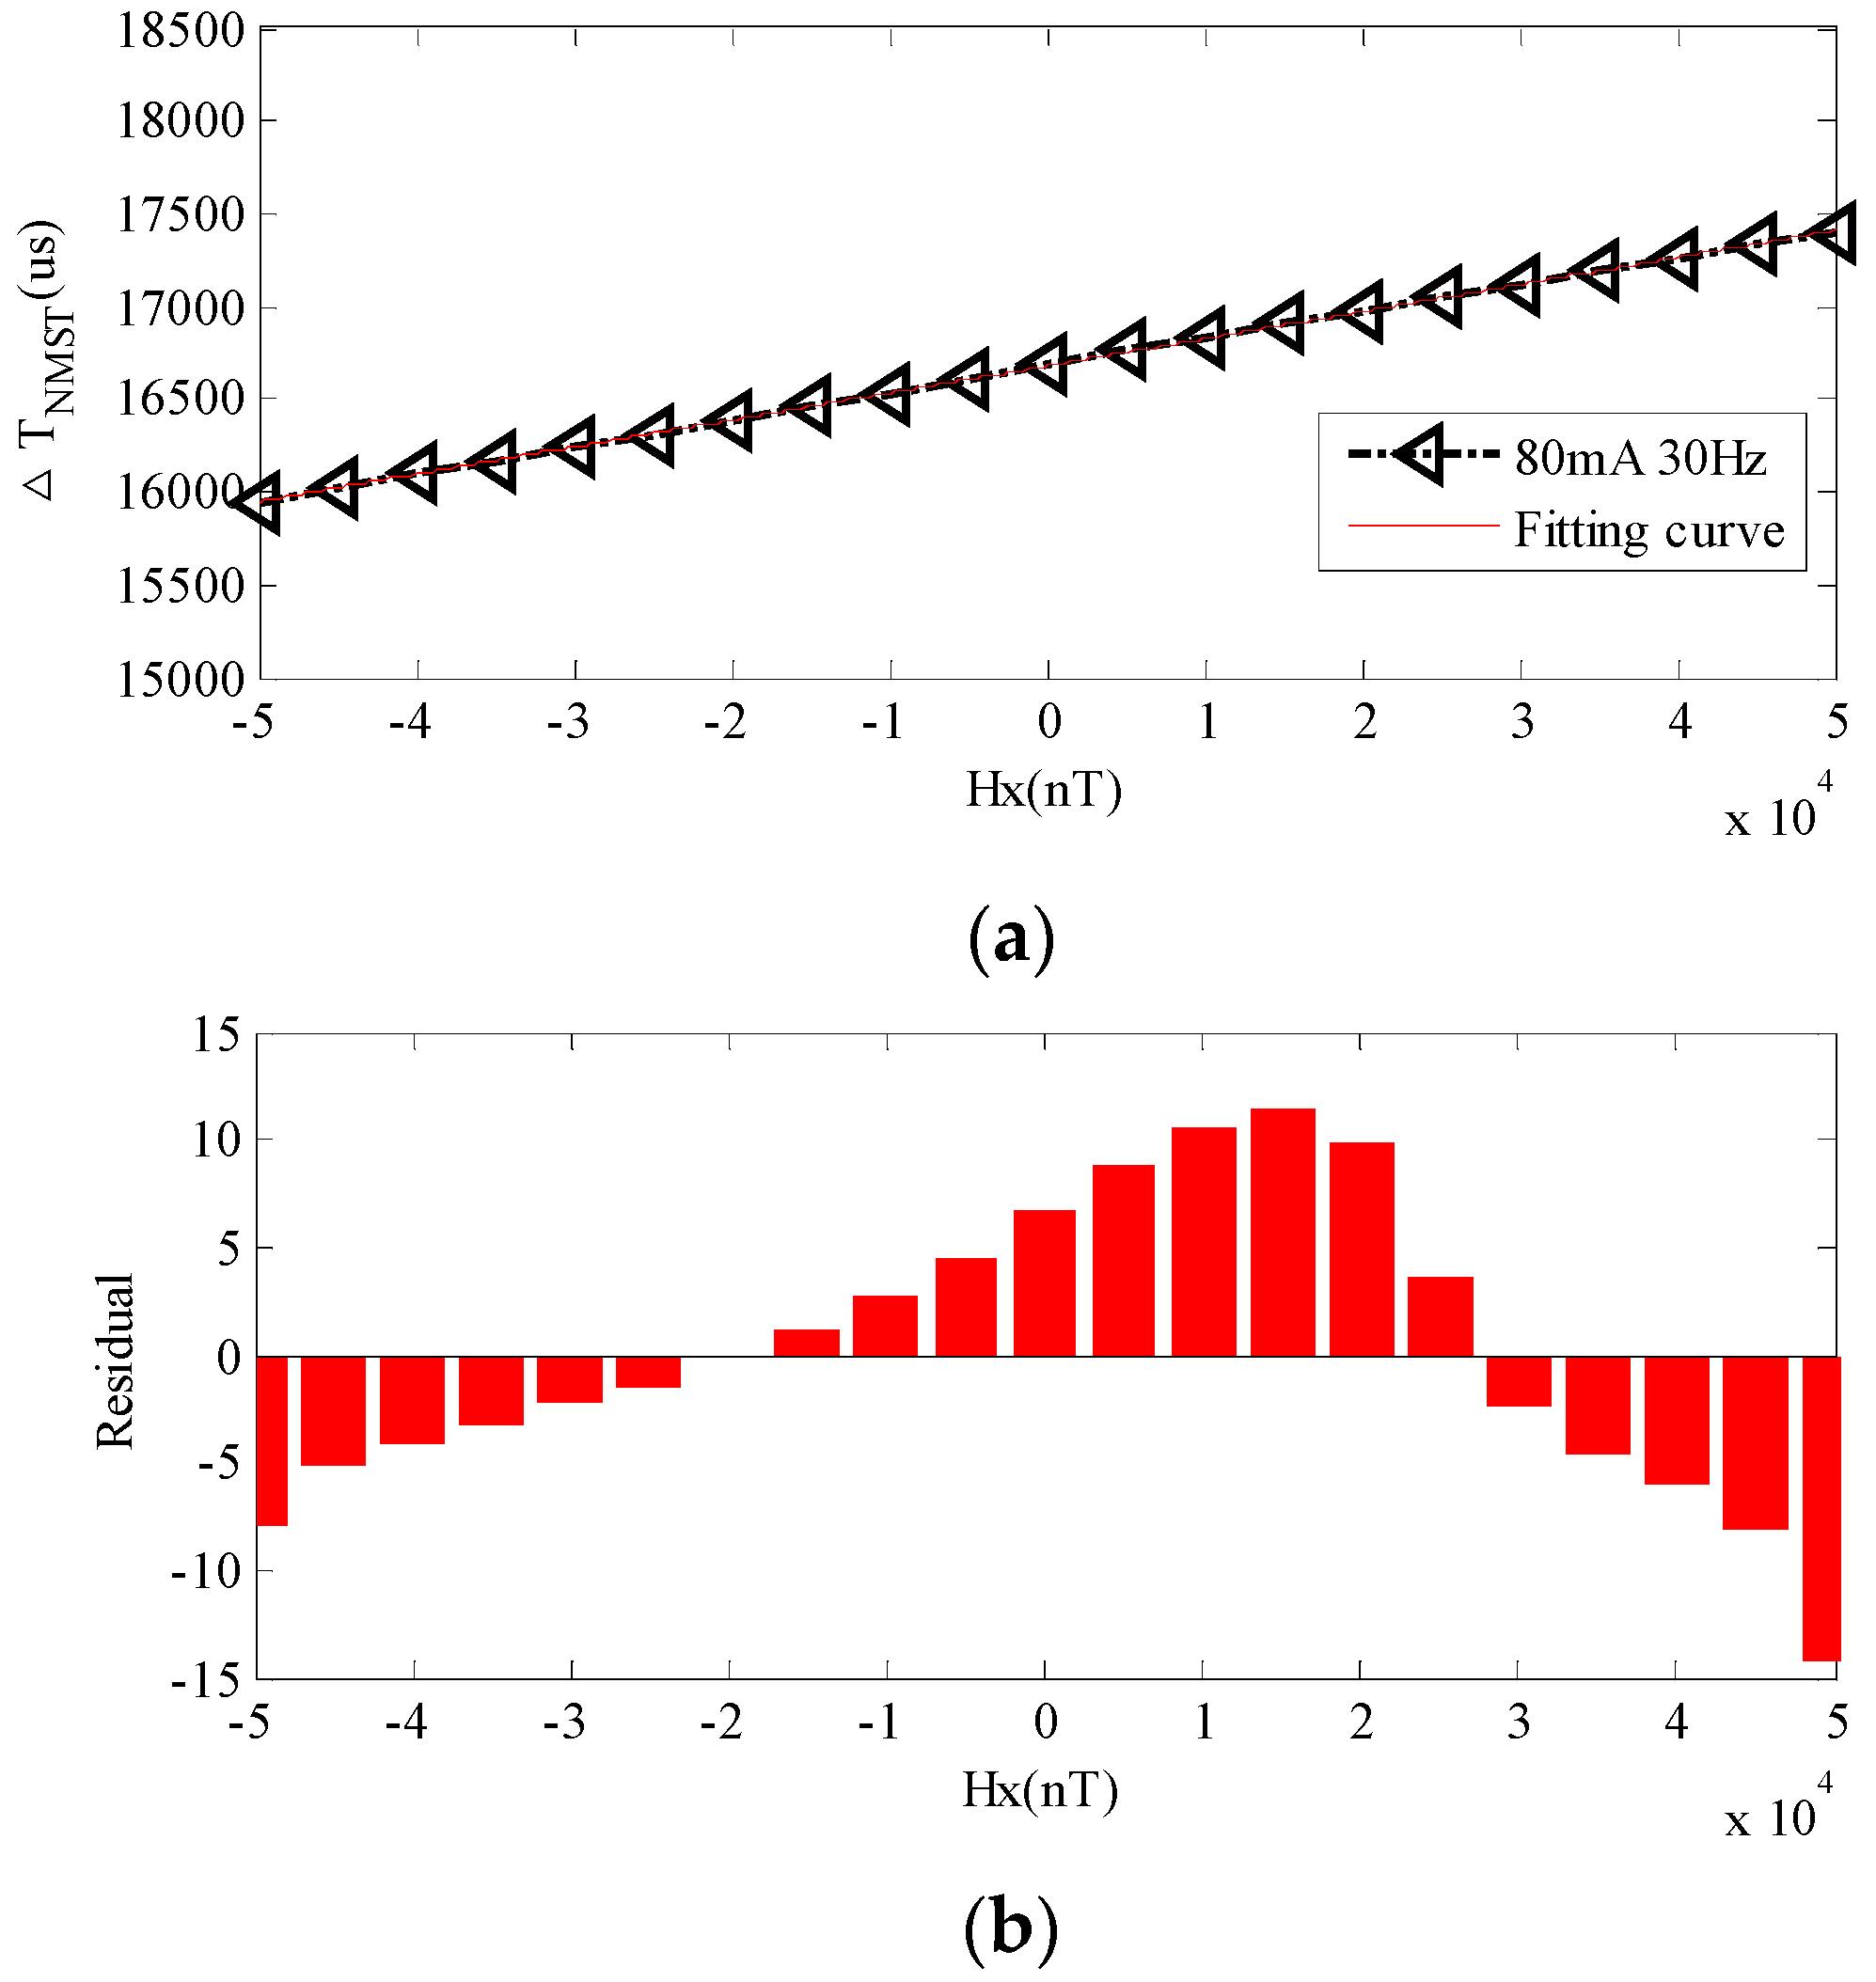
Relationship between the Hx and ΔTNMST
(a)
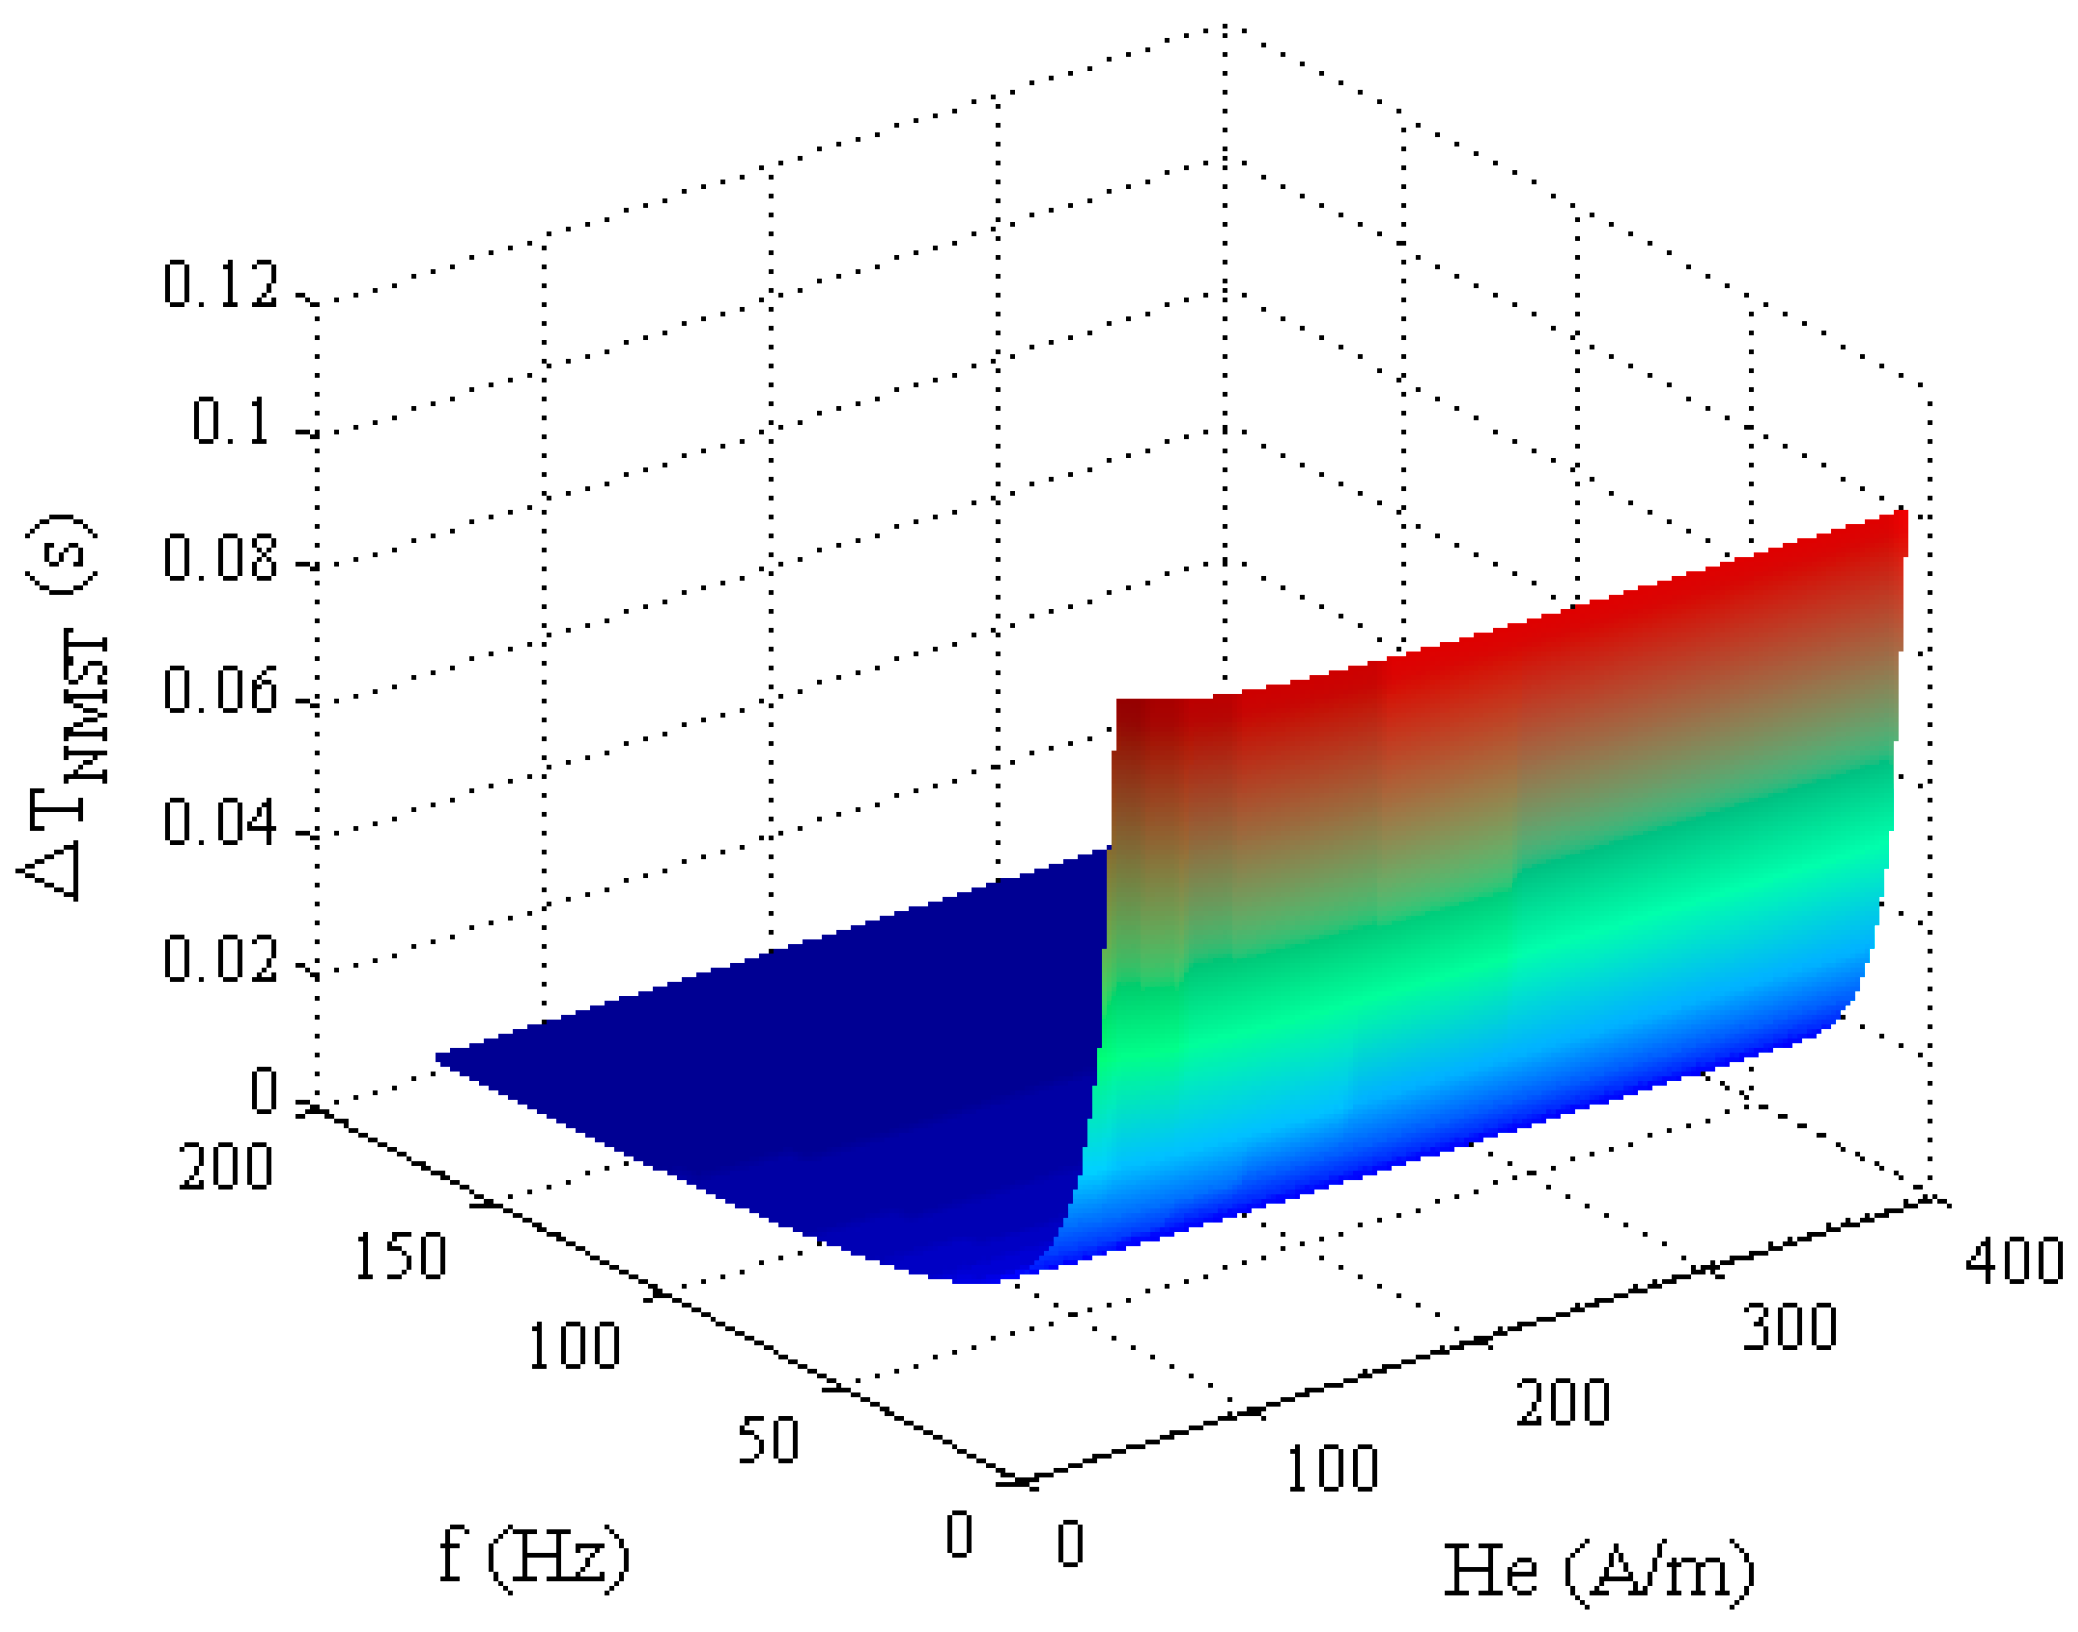
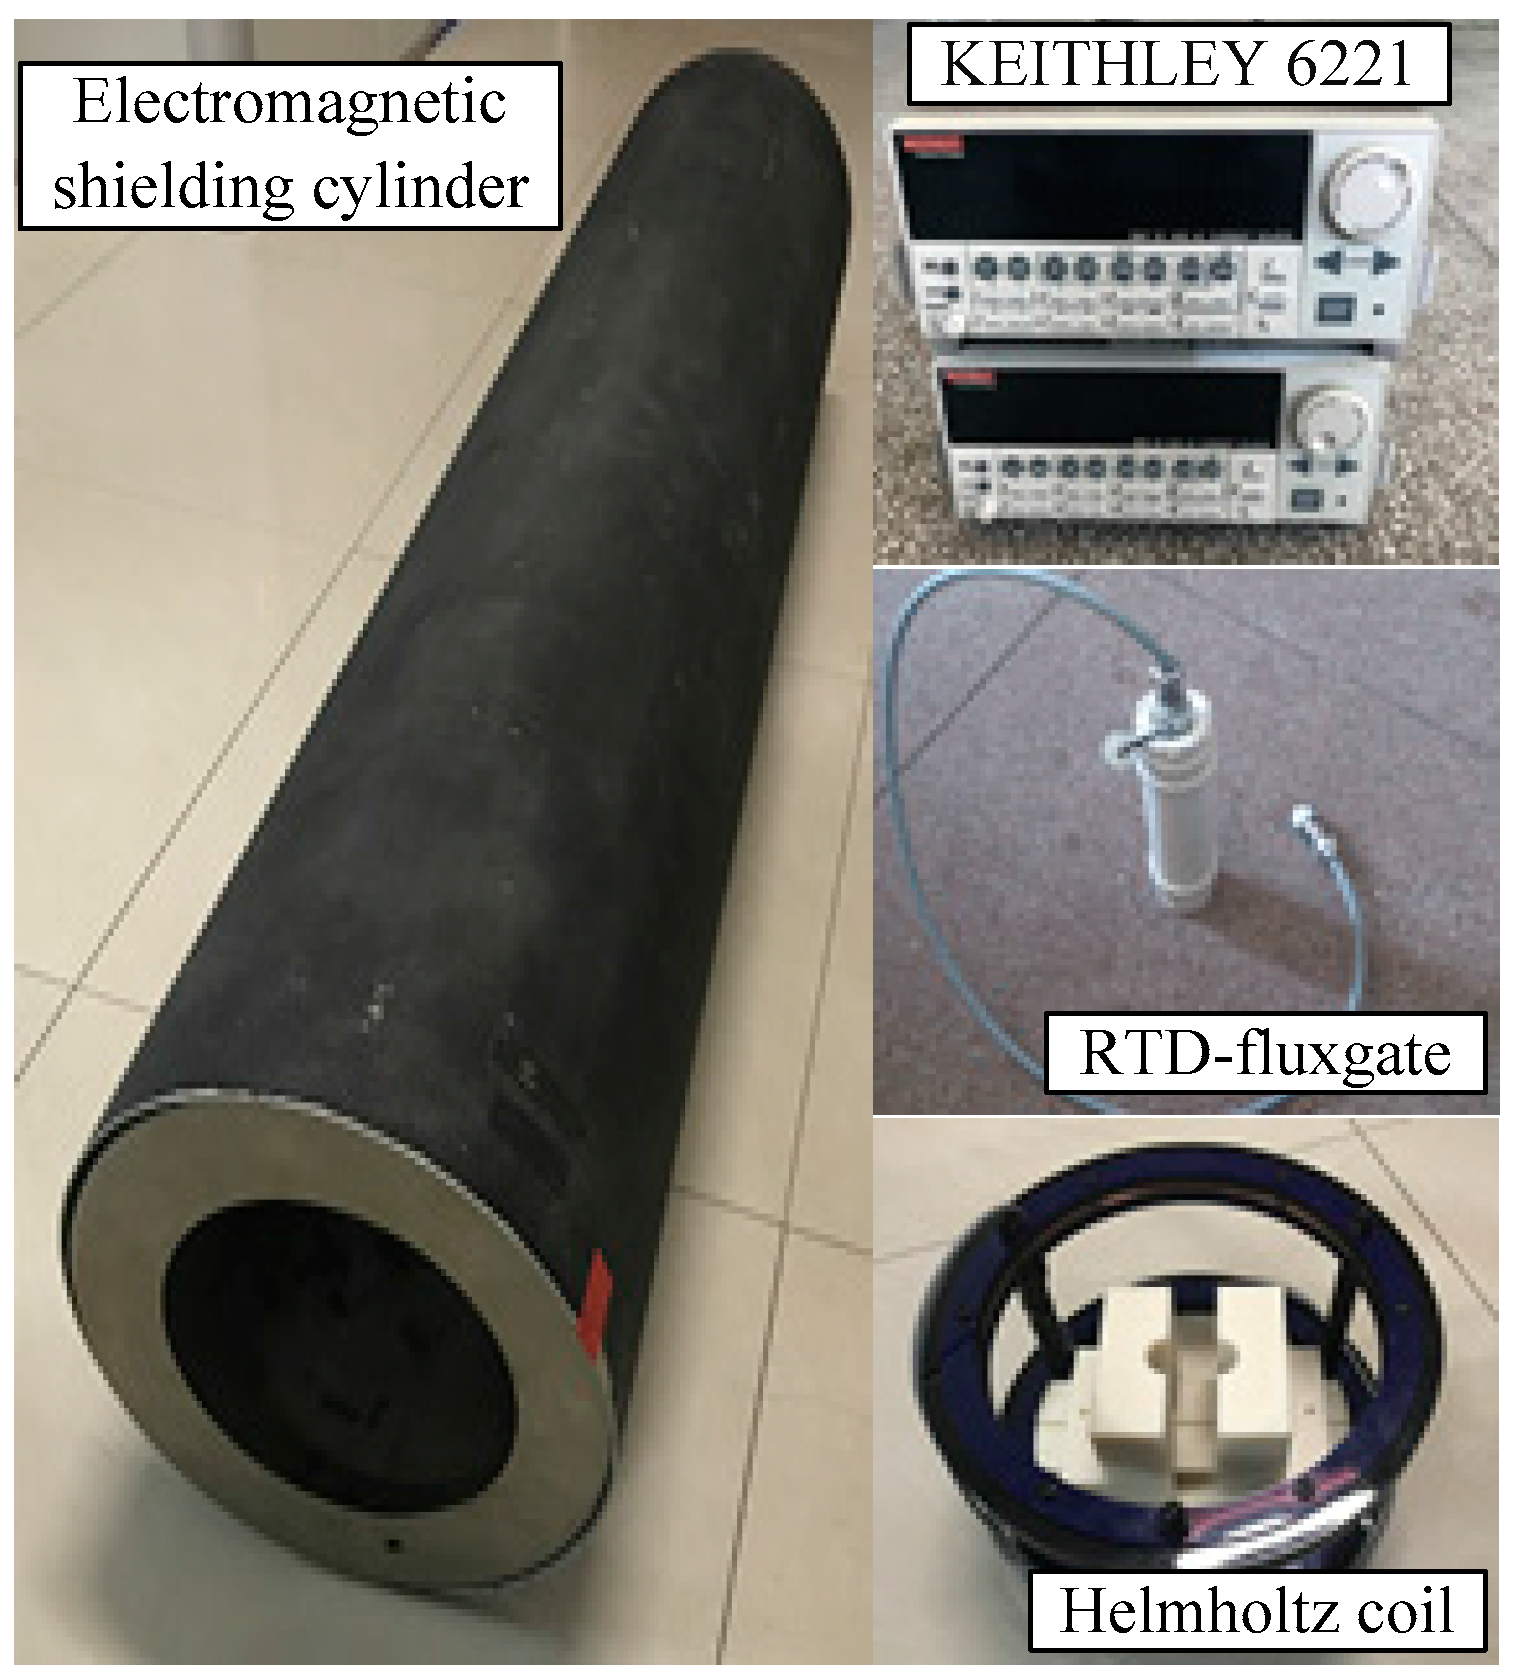
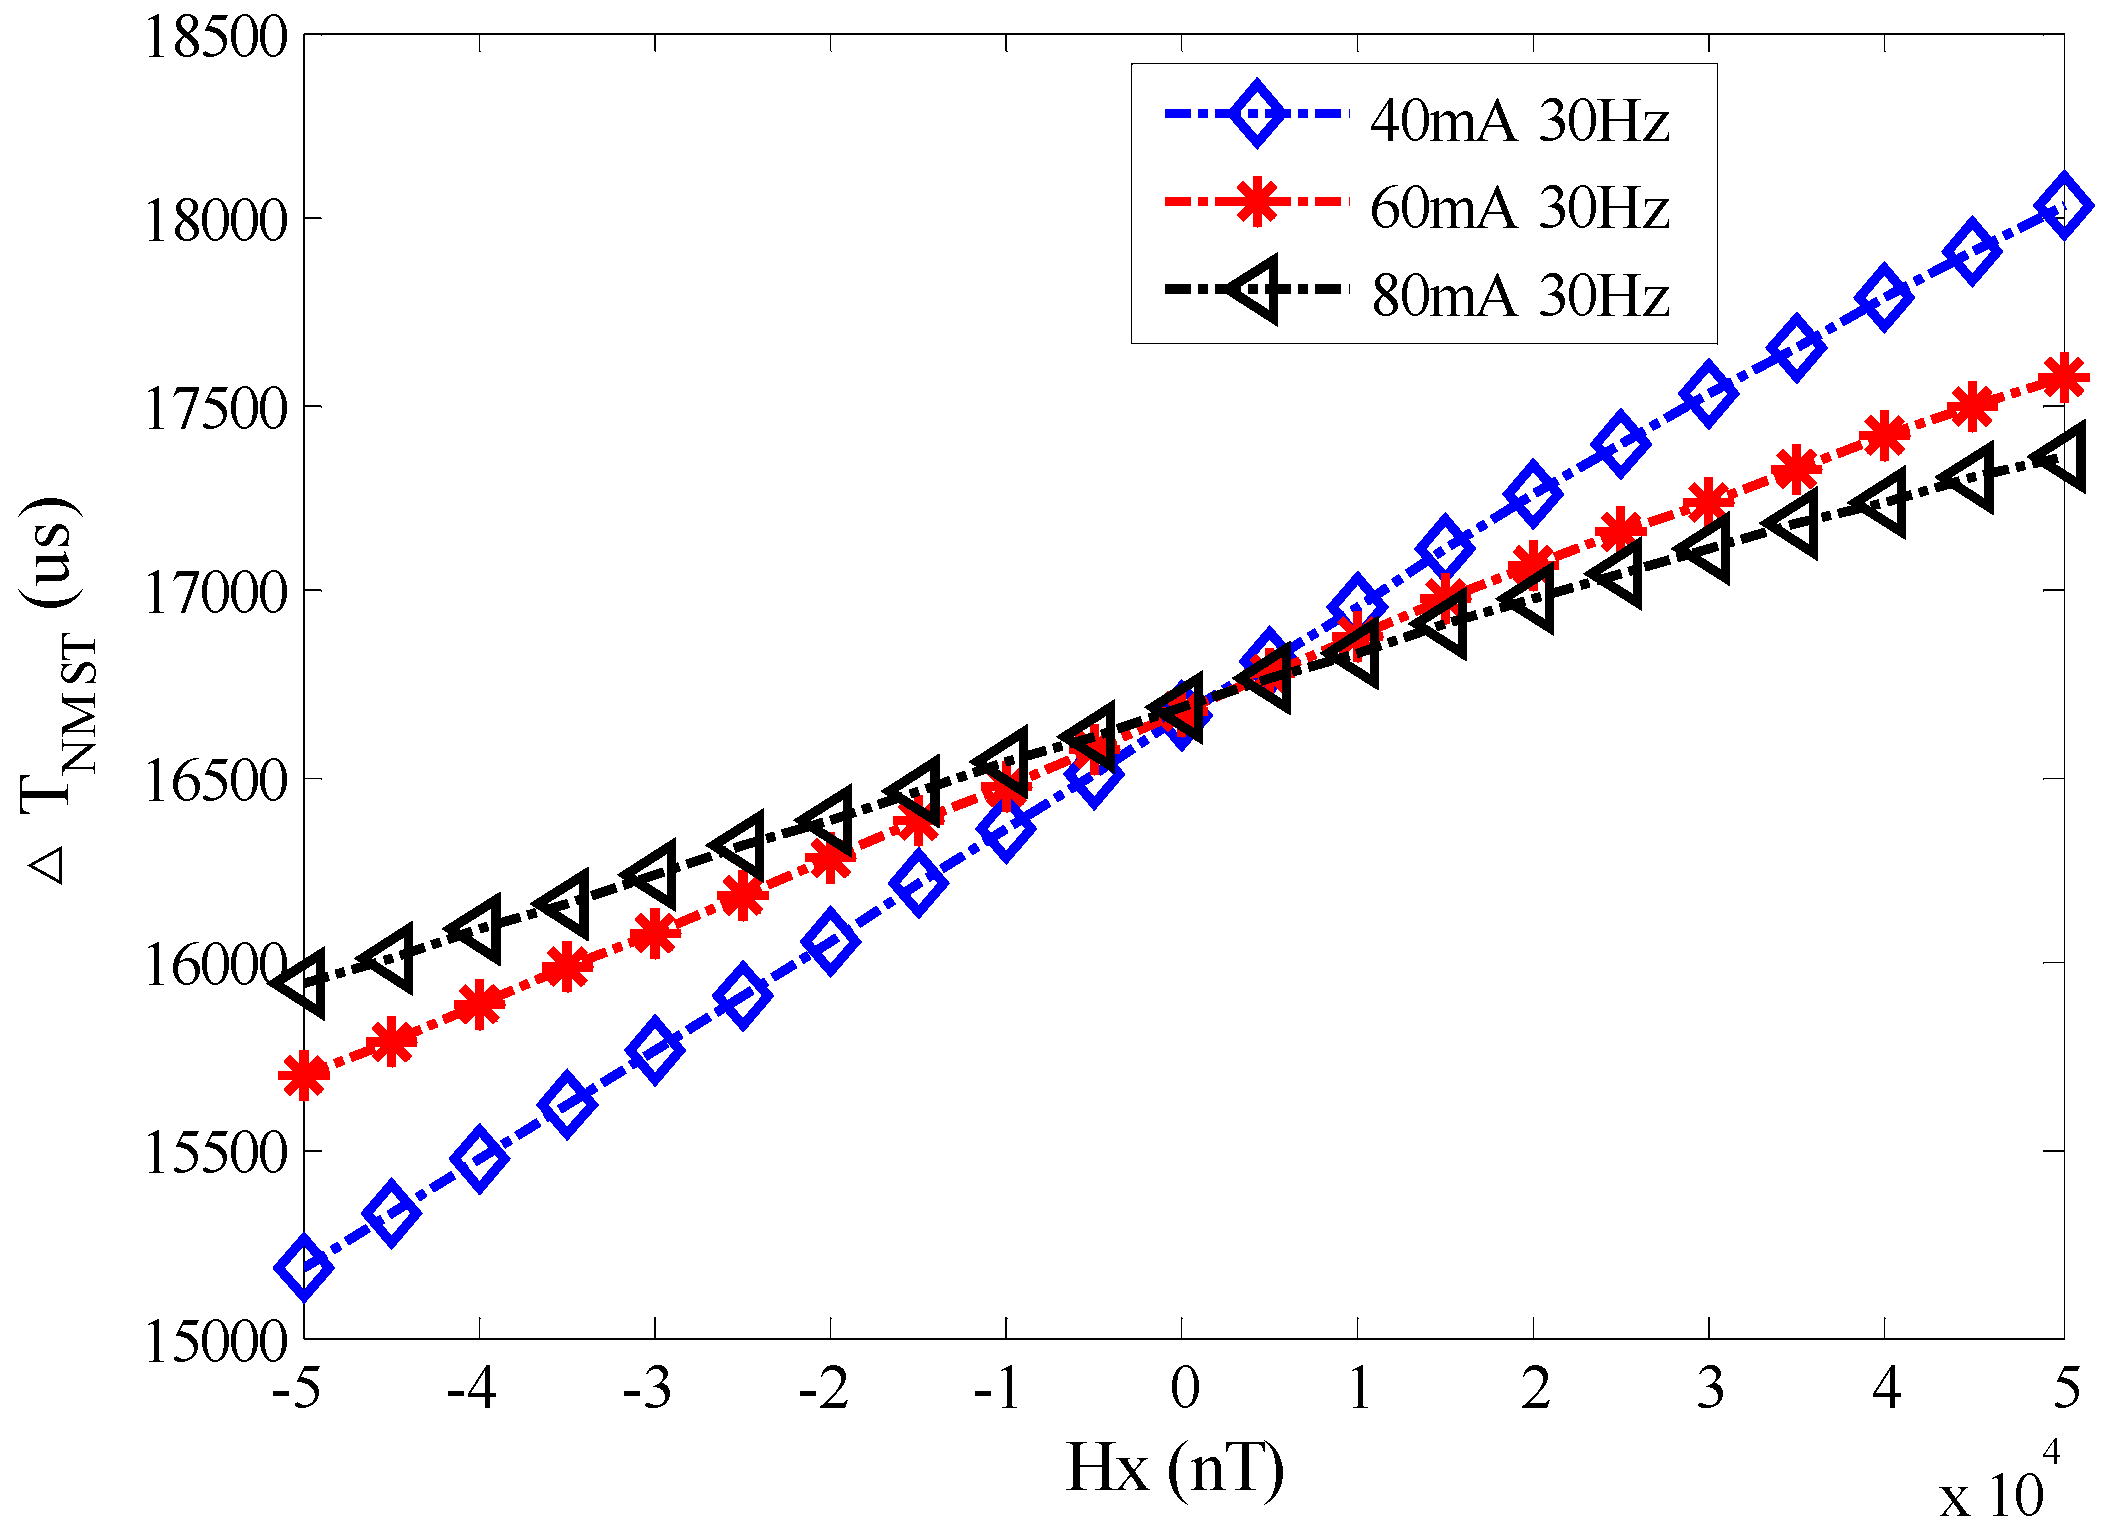
The experiments are performed in the following conditions of different triangular excitation magnetic fields (excitation current from 40 mA to 80 mA with a 20 mA interval and excitation frequency at 30 Hz) and a range of Hx from −5 × 10⁴ nT to 5 × 10⁴ nT with a 5 × 10³ nT interval. Figure 10 shows the output time difference, ΔTNMST, of the RTD-fluxgate which are actually measured with different excitation currents.
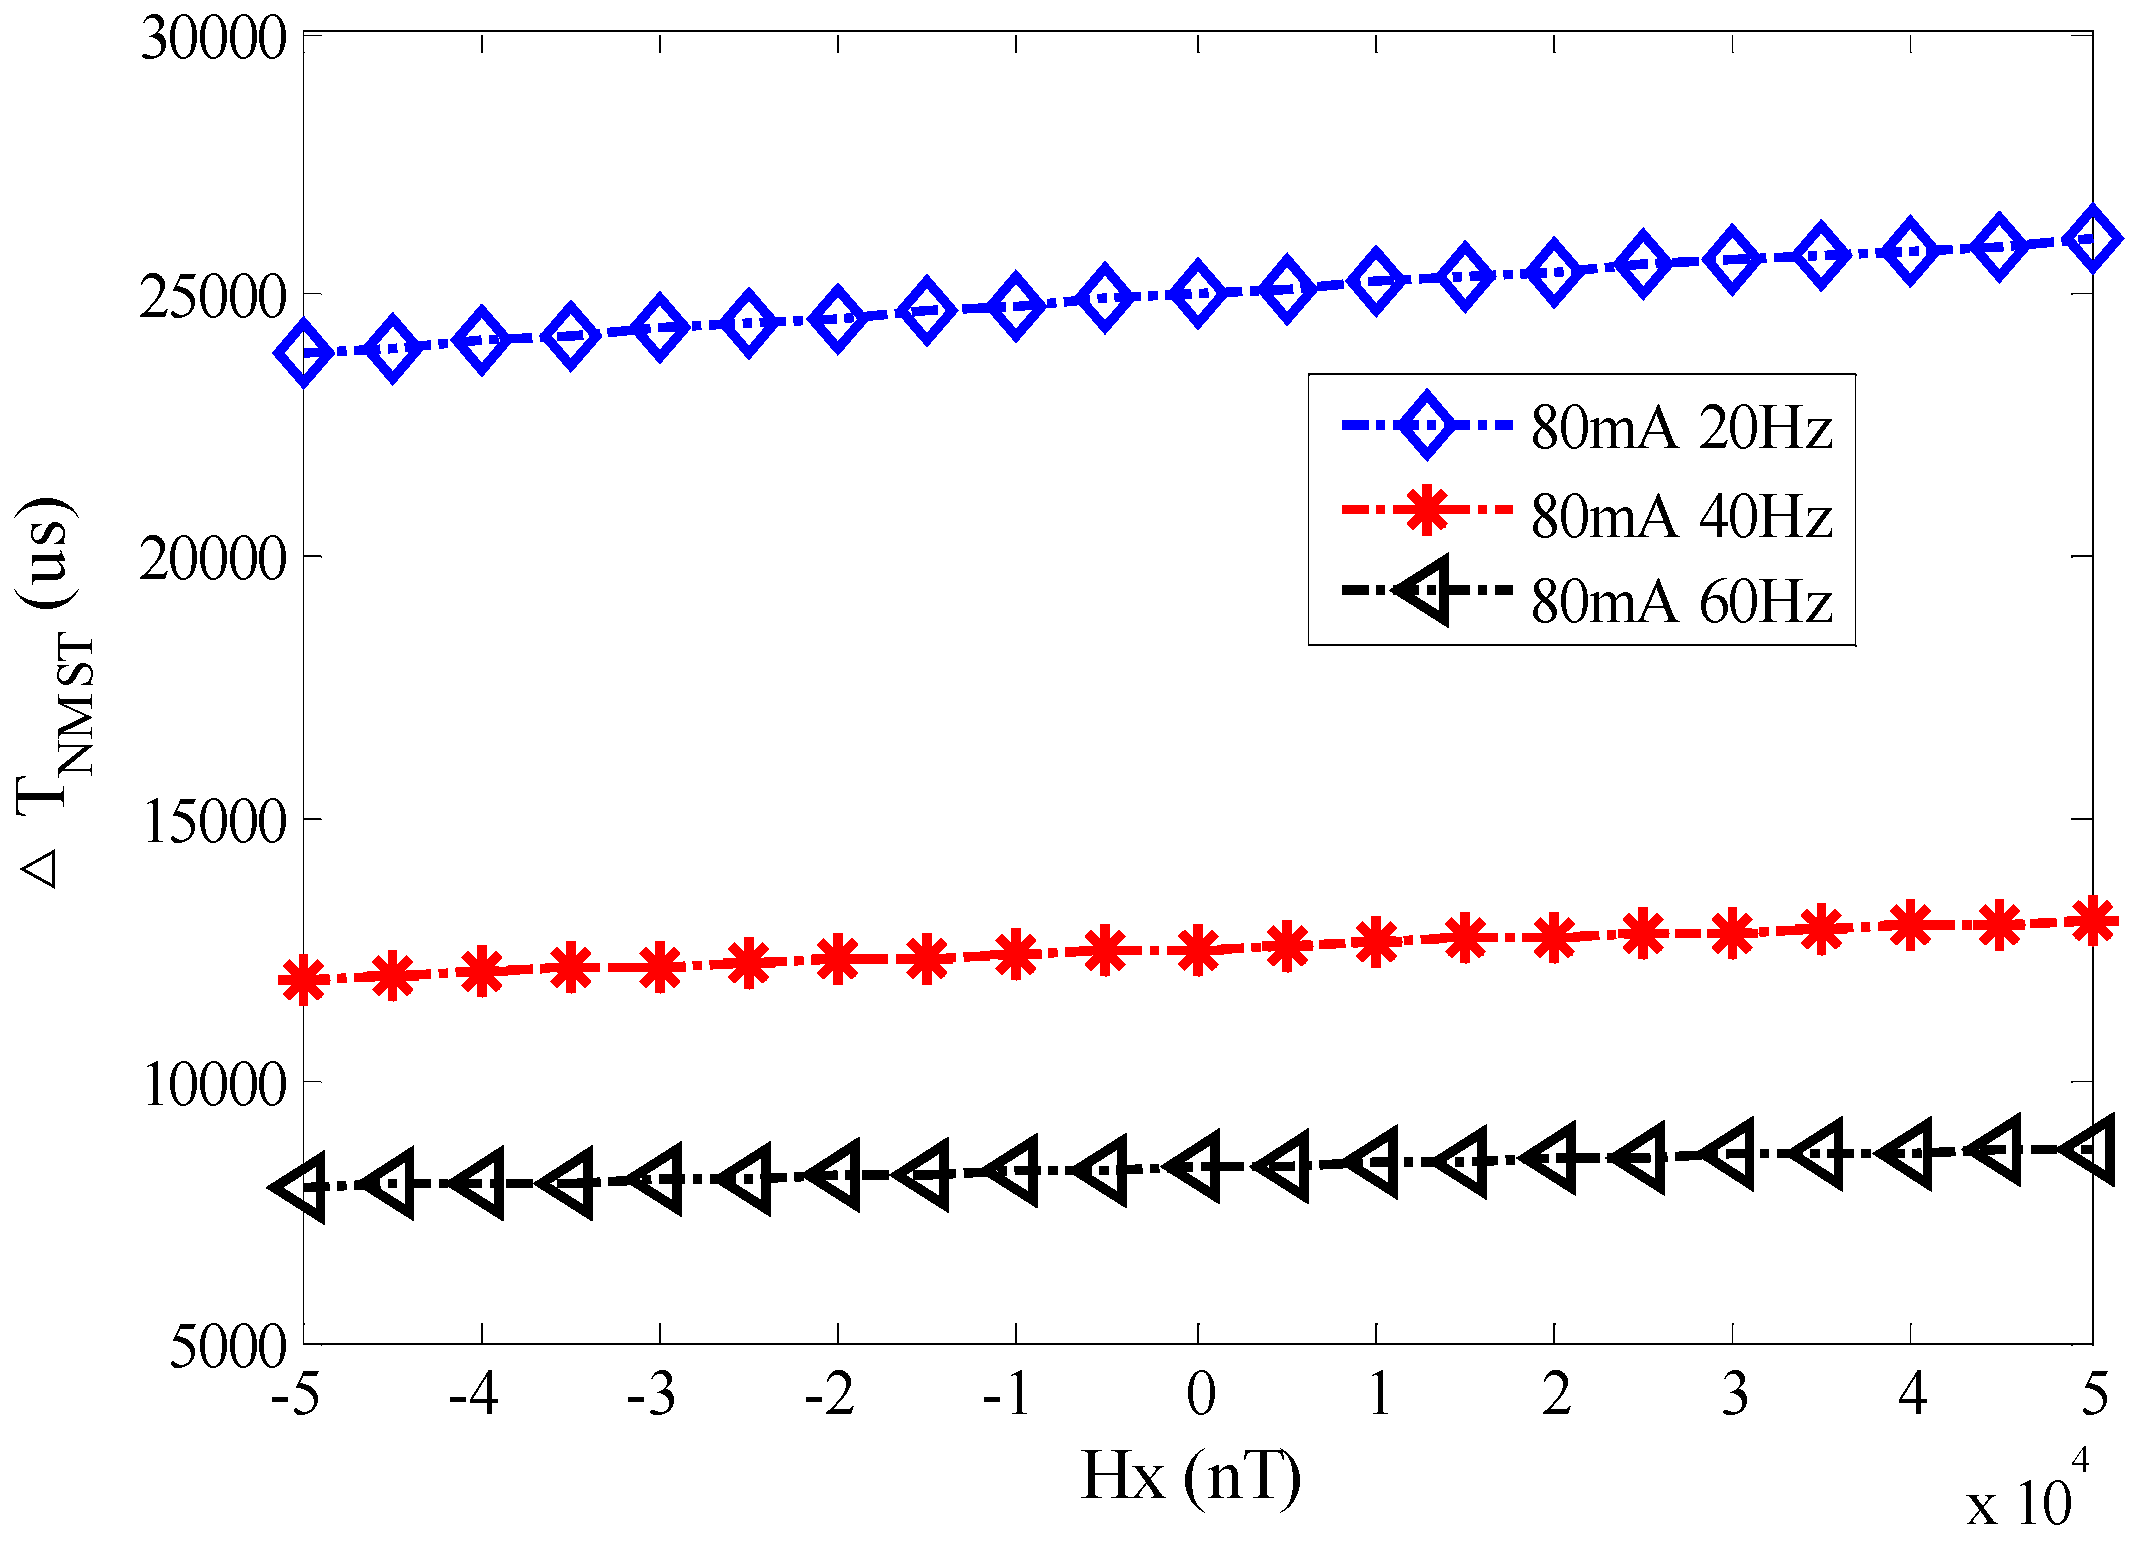
From the figure above, the measured ΔTNMST and Hx are linear. The linear regression technique (least square method) is used to fit the ΔTNMST curve. Assuming the linear fitting polynomial is y = ax + b (a ≠ 0) by using n data (xi, yi) (I = 1, 2, … n), the sum of the deviation square between data points and the fitted curve is shown in below:
d 2 = i = 1 n [ y i ( a x i + b ) ] 2
One of the curves in Figure 10 is taken to illustrate the concept. When d2 = min(d2), the fitting curves between ΔTNMST1 and Hx with excitation current I1 = 80 mA and excitation frequency f = 30 Hz are presented Equation (20). The fitting linear deviations are shown in Figure 11, which shows that the linear deviations are mainly concentrated at both ends and center, so it is in accordance with the regulation of the linear sensor. The sum of the relative deviations square is 0.0573 and the RTD-fluxgate possesses good linearity in the whole range of measurement.
ΔTNMST1 = 0.0144 × Hx + 1.67 × 10⁴
By using the same method, the fitting curves between ΔTNMST and Hx with different excitation currents I2 = 60 mA and I3 = 40 mA are as follows:
ΔTNMST2 = 0.0191 × Hx + 1.67 × 10⁴
ΔTNMST3 = 0.0289 × Hx + 1.67 × 10⁴
From the Equations above, the sensitivities of different excitation currents are SNMST1 = 0.0144 μs/nT, SNMST2 = 0.0191 μs/nT and SNMST3 = 0.0289 μs/nT. When the excitation amplitude Hm is smaller, the sensitivity SNMST is greater.
(b)
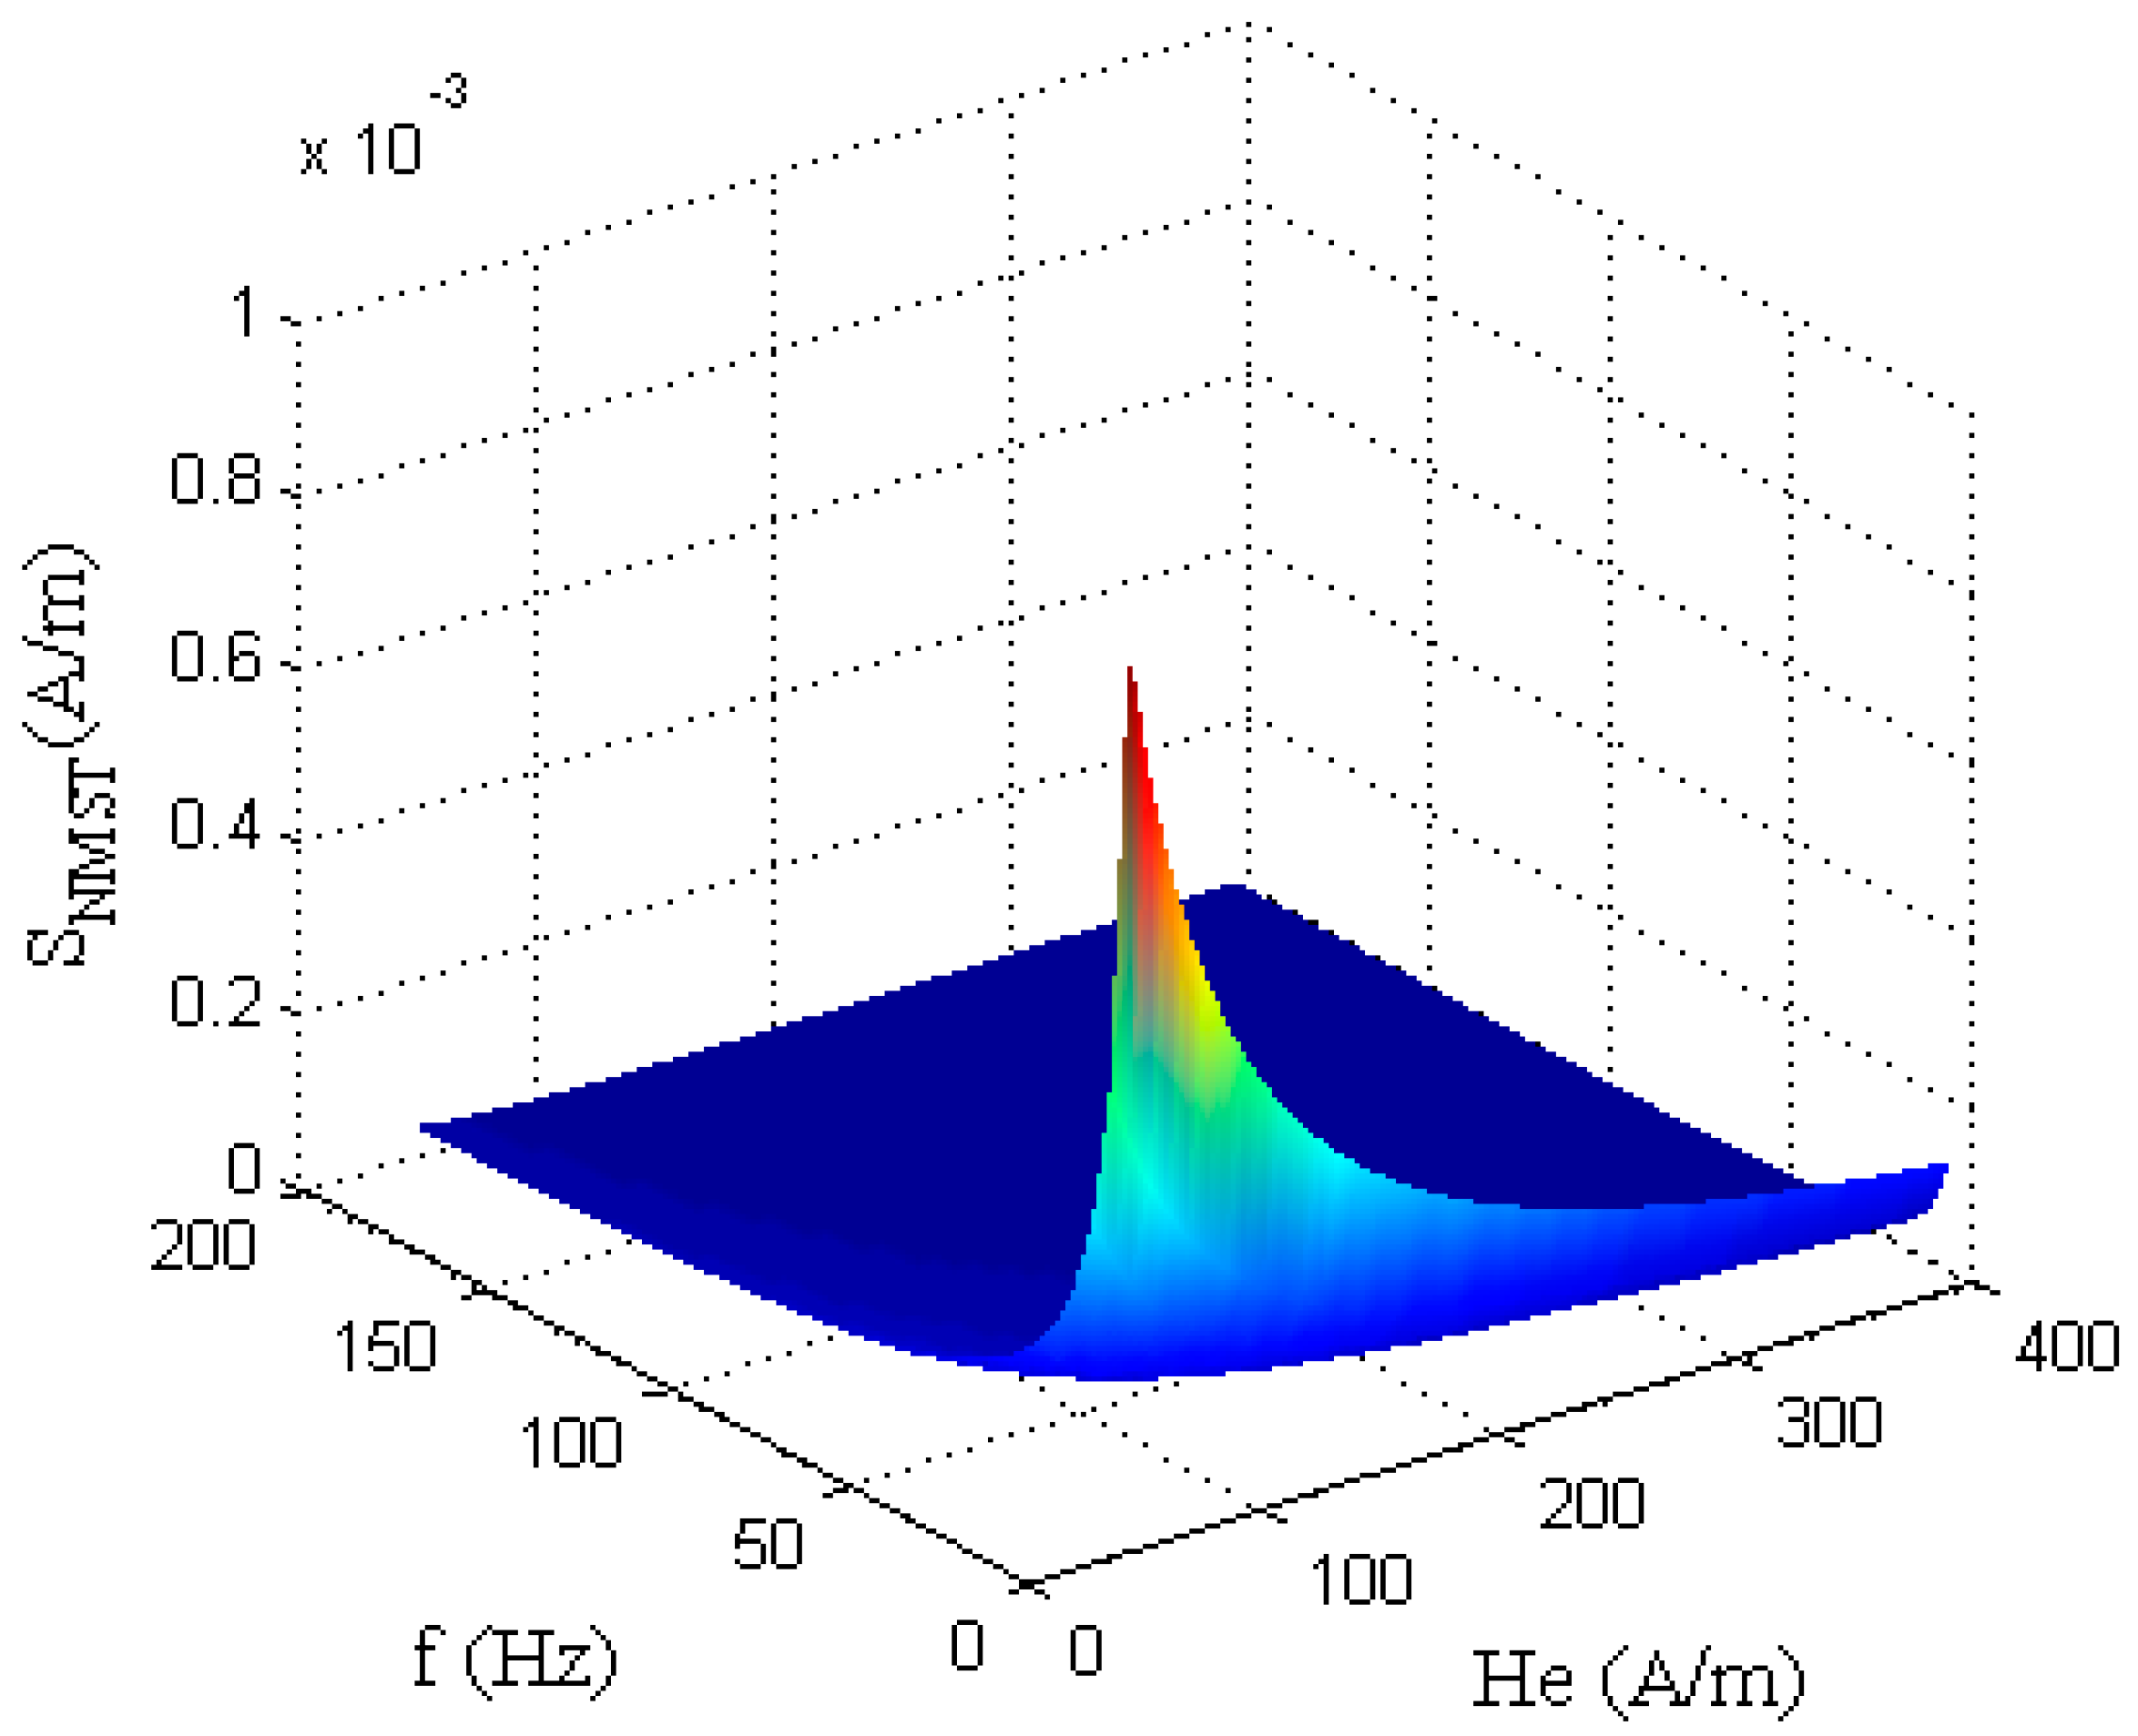
When the excitation current is 80 mA, the excitation frequency changes from 20 Hz to 60 Hz with a 20 Hz interval. Hx is the same as mentioned above. Figure 12 shows the output time difference ΔTNMST of the RTD-fluxgate which is actually measured with different excitation frequencies.
According to the least square fitting method, the fitting curves between ΔTNMST and Hx with different excitation frequencies, f1 = 20 Hz, f2 = 40 Hz, and f3 = 60 Hz, are as follows:
ΔTNMST1 = 0.0218 × Hx + 2.50 × 10⁴
ΔTNMST2 = 0.0109 × Hx + 1.25 × 10⁴
ΔTNMST3 = 0.0074 × Hx + 8.34 × 10³
From the Equations above, the sensitivities of different excitation frequencies are SNMST1 = 0.0218 μs/nT, SNMST2 = 0.0109 μs/nT, and SNMST3 = 0.0074 μs/nT. When the excitation frequency f is smaller, the sensitivity SNMST is greater. In Figure 10 and Figure 12, the experimental results validate that the sensitivity SNMST is inversely proportional to the amplitude Hm and frequency f of the excitation magnetic field.
(2) Stability Analysis
Analysis was performed under the conditions of an excitation magnetic field with parameters I = 80 mA, f = 60 Hz, and Hx = 25,000 nT. To compare the stability of the two readout methods effectively, the time of observation is 60 s. The fluctuations in time difference by using the NMST and BMSTD readout methods are shown in Figure 13 and Figure 14, respectively. Because the observation time is longer, the data of time difference fluctuations are larger. We only present the data of 3 s among 60 s in Table 1.
As is illustrated in Figure 13 and Figure 14, by using the NMST readout scheme, the standard deviation of ΔTNMST is 1.086 μs and the fluctuation of ΔTNMST is 5.780 μs. By using the BMSTD readout scheme, the standard deviation of ΔT is 1.465 μs and the fluctuation of ΔT is 7.559 μs. The comparison between the two readout methods indicates that the standard deviation and the fluctuation of the time difference are reduced by 36% and 32%, respectively, by adopting the NMST readout scheme.
In order to process the time difference dynamically in real time, in this paper, the variable coefficient Pauta criterion and equal-weight endpoint smoothing are combined to form a hybrid time difference processing algorithm. The specific procedure is as follows:
a
Every n ΔTNMST forms an array Ni, and then the mean N i ¯ and variance σi of each array need calculating in turn.
b
The amount of effective data after processing is more than 3/4 times of the amount of data before processing. When |ΔTNMST(i−1)n+j N i ¯ | > i, ΔTNMST(i−1)n+j is considered as gross error, therefore, the value is replaced by the mean of the array; when |ΔTNMST(i−1)n+j N i ¯ | < i, this value is reserved. A new time difference array N’ = N1 + N2 + … Ni is formed.
c
At the initial point of the new data sequence N’, 50 consecutive data points are processed with equal weight endpoints at a time through the equation Δ T N M S T k = 1 l i = 0 l 1 Δ T N M S T ( k + i ) , k = 1, 2, 3, …, n × I − l + 1. In this paper, the sequence N’ is processed twice.
After hybrid algorithm processing, the standard deviation of ΔTNMST is reduced to 0.044 μs and the fluctuation is reduced to 0.170 μs, as is shown in Figure 15.

5. Conclusions

On the basis of the working principle of RTD-fluxgate sensors, the influence of the induction signal noise on the time difference reading is analyzed. A readout method is proposed in which the excitation and induction signals are combined to read the negative magnetic saturation time. A mathematical model of the RTD-fluxgate sensor output response between ΔTNMST and Hx is established. The NMST readout scheme, which is proposed in this paper, is compared with the BMSTD readout scheme. The experimental results validate the effectiveness of the readout method. The standard deviation and the fluctuation of the time difference are reduced by 36% and 32%, respectively. This technique of RTD-fluxgate sensor usage can reduce the noise influence and improve the stability of time difference measurement. After ΔTNMST is processed by the time difference hybrid algorithm, the fluctuation can be stabilized within ±0.1 μs, so the accuracy of RTD-fluxgate measurement is improved further. The NMST readout method is suitable for RTD-fluxgate detection of weak magnetic fields.

Acknowledgments

This work was supported by the National Natural Science Foundation of China (Grant No. 41274183). The authors would like to thank the Key Laboratory of Geo-Exploration Instrumentation (Jilin University) Ministry of Education for their additional assistance.

Author Contributions

The work presented here was carried out in collaboration between all authors. All authors contributed to the manuscript.

Conflicts of Interest

The authors declare no conflict of interest.

References

  1. Andò, B.; Baglio, S.; Bulsara, A.R.; Trigona, C. Design and characterization of a microwire fluxgate magnetometer. Sens. Actuators A Phys. 2009, 151, 145–153. [Google Scholar] [CrossRef]
  2. David, C.; Marina, D.-M.; Lucas, P.; Claudio, A. Small fluxgate magnetometers: Development and future trends in Spain. Sensors 2010, 10, 1859–1870. [Google Scholar]
  3. Paperno, E.; Weiss, E.; Plotkin, A. Tube-core orthogonal fluxgate operated in fundamental mode. IEEE Trans. Magn. 2008, 44, 4018–4021. [Google Scholar] [CrossRef]
  4. Lu, C.C.; Huang, J.; Chiu, P.K.; Chiu, S.L.; Jeng, J.T. High-sensitivity low-noise miniature fluxgate magnetometers using a flip chip conceptual design. Sensors 2014, 14, 13815–13829. [Google Scholar] [CrossRef] [PubMed]
  5. Wang, Y.Z.; Li, J.J.; Chen, S.Y.; Shi, H.Y. Sensitivity Enhancement for coupled core fluxgate magnetometer utilizing negative state feedback. In Proceedings of the 2016 Tenth International Conference on Sensing Technology, Nanjing, China, 11–13 November 2016; pp. 1–5. [Google Scholar]
  6. Andò, B.; Baglio, S.; Bulsara, A.R.; Sacco, V. RTD Fluxgate: A Low-Power nonlinear device to sense weak magnetic fields. IEEE Instrum. Meas. Mag. 2005, 8, 64–73. [Google Scholar] [CrossRef]
  7. Bulsara, A.R.; Seberino, C.; Gammaitoni, L.; Karlsson, M.F.; Lundqvist, B.; Robinson, J.W.C. Signal detection via residence-time asymmetry in noisy bistable devices. Phys. Rev. E 2003, 67. [Google Scholar] [CrossRef] [PubMed]
  8. Andò, B.; Baglio, S.; Malfa, S.L.; Trigona, C.; Bulsara, A.R. Experimental investigations on the spatial resolution in RTD-fluxgates. In Proceedings of the IEEE Instrumentation and Measurement Technology Conference, Singapore, 5–7 May 2009; pp. 1542–1545. [Google Scholar]
  9. Andò, B.; Baglioa, S.; Sacco, V.; Bulsara, A.R.; In, V. PCB fluxgate magnetometers with a residence times difference readout strategy: The Effects of Noise. IEEE Trans. Instrum. Meas. 2008, 57, 19–24. [Google Scholar] [CrossRef]
  10. Nikitin, A.; Stocks, N.G.; Bulsara, A.R. Bistable sensors based on broken symmetry phenomena: The residence time difference vs. the second harmonic method. Eur. Phys. J. Spec. Top. 2013, 222, 2583–2593. [Google Scholar] [CrossRef]
  11. Wang, Y.Z.; Wu, S.J.; Zhou, Z.Z.; Cheng, D.F.; Pang, N.; Wang, Y.X. Research on the dynamic hysteresis loop model of the residence times difference (RTD)-fluxgate. Sensors 2013, 13, 11539–11552. [Google Scholar] [CrossRef] [PubMed]
  12. Andò, B.; Baglio, S.; Sacco, V.; Bulsara, A.; In, V. Noise effects in RTD fluxgate. IEEE Sens. J. 2005, 4, 935–938. [Google Scholar]
  13. Nikitin, A.; Stocks, N.G.; Bulsara, A.R. Signal detection via residence times statistics: Noise-mediated minimization of the measurement error. Phys. Rev. E 2003, 68. [Google Scholar] [CrossRef] [PubMed]
  14. Jiang, W.J.; Shi, Y.B.; Zhao, W.J.; Wang, X.X. Parameters identification of fluxgate magnetic core adopting the biogeography-based optimization algorithm. Sensors 2016, 16, 979–991. [Google Scholar] [CrossRef] [PubMed]
  15. Andò, B.; Baglio, S.; Bulsara, A.R.; Caruso, V.; In, V.; Sacco, V. Investigate the optimal geometry to minimize the demagnetizing effect in RTD-fluxgate. In Proceedings of the Instrumentation and Measurement Technology Conference, Sorrento, Italy, 24–27 April 2006; pp. 2175–2178. [Google Scholar]
  16. Andò, B.; Baglio, S.; Bulsara, A.R.; Sacco, V.; Savalli, N. Investigation on optimal materials selection in RTD-fluxgate design. In Proceedings of the IEEE Instrumentation and Measurement Technology Conference, Ottawa, ON, Canada, 16–19 May 2005; pp. 1261–1265. [Google Scholar]
  17. Lu, C.C.; Huang, J. A 3-axis miniature magnetic sensor based on a planar fluxgate magnetometer with an orthogonal fluxguide. Sensors 2015, 15, 14727–14744. [Google Scholar] [CrossRef] [PubMed]
  18. Andò, B.; Baglio, S.; Bulsara, A.R.; Sacco, V. “Residence times difference” fluxgate magnetometers. IEEE Sens. J. 2005, 5, 895–904. [Google Scholar] [CrossRef]
  19. Andò, B.; Ascia, A.; Baglio, S.; Bulsara, A.R.; In, V.; Pitrone, N.; Trigona, C. Residence times difference fluxgate magnetometer for magnetic biosensing. Am. Inst. Phys. 2008, 139. [Google Scholar] [CrossRef]
  20. Ubizskii, S.B.; Pavlyk, L.P. The pendulum-like fluxgate magnetic field sensor. Sens. Actuators A 2008, 141, 440–446. [Google Scholar] [CrossRef]
  21. Lo, C.H. Modeling the effects of nanosized precipitates on magnetic hysteresis and Barkhausen effect signal. J. Appl. Phys. 2012, 111. [Google Scholar] [CrossRef]
  22. Jiles, D.C. Frequency dependence of hysteresis curves in conducting magnetic materials. J. Appl. Phys. 1994, 10, 5849–5855. [Google Scholar] [CrossRef]
  23. Wang, Y.Z.; Wu, S.J.; Lu, H.; Cheng, D.F.; Chen, C.; Pang, N.; Wan, Y.X.; Zhou, Z.J.; Chen, S.Y. Output performance optimization for RTD fluxgate sensor based on dynamic permeability. Sci. China Inf. Sci. 2016, 59, 112213–112226. [Google Scholar] [CrossRef]
  24. Sun, X.Y.; Liu, S.B.; Liu, S.W. A method for residence times difference fluxgate detection. Chin. J. Sens. Actuators 2013, 26, 1202–1205. [Google Scholar]
  25. Pang, N.; Cheng, D.F.; Wang, Y.Z.; Wu, S.J.; Qu, W.L. Research on sensitive unit Barkhausen noise processing of residence times difference fluxgate. Chin. J. Sci. Instrum. 2015, 36, 2594–2601. [Google Scholar]
  26. Jiang, C.D.; Lin, J.; Duan, Q.M.; Sun, S.Q.; Tian, B.F. Statistical stacking and adaptive notch filter to remove high-level electromagnetic noise from MRS measurements. Surf. Geophys. 2011, 9, 459–468. [Google Scholar] [CrossRef]
  27. Lu, H.; Cheng, D.F.; Wang, Y.Z.; Zhao, L.X. A Study on the stochastic resonance model of time-difference fluxgate system with feedback control. Acta Electron. Sin. 2012, 40, 1701–1704. [Google Scholar]
  28. Lu, H.; Cheng, D.F.; Zhan, L.X. The research on the residence times difference fluxgate model. In Proceedings of the International Conference on Electronics Communications and Control, Ningbo, China, 9–11 September 2011; pp. 4023–4027. [Google Scholar]
  29. Andò, B.; Baglio, S.; Sacco, V.; Bulsara, A.R. Effects of driving mode and optimal material selection on a residence times difference-based fluxgate magnetometer. IEEE Trans. Instrum. Meas. 2005, 54, 1366–1373. [Google Scholar] [CrossRef]
Figure 1. Schematic diagram of residence times difference (RTD)-fluxgate working principle.
Sensors 17 02325 g001
Figure 2. Noise affects the induction output signal.
Sensors 17 02325 g002
Figure 3. Noise effects in the bidirectional magnetic saturation time difference (BMSTD) readout.
Sensors 17 02325 g003
Figure 4. Diagram of the negative magnetic saturation time NMST readout strategy.
Sensors 17 02325 g004
Figure 5. The relationship between ΔTNMST and He(t).
Sensors 17 02325 g005
Figure 6. The relationship between SNMST and He(t).
Sensors 17 02325 g006
Figure 7. Noise effects in the NMST readout scheme.
Sensors 17 02325 g007
Figure 8. Experimental instruments.
Sensors 17 02325 g008
Figure 9. Experimental measurement schematic diagram.
Sensors 17 02325 g009
Figure 10. The curve between Hx and ΔTNMST with different excitation currents.
Sensors 17 02325 g010
Figure 11. Fitting linearity deviations of ΔTNMST1 with I1 = 80 mA and f = 30 Hz. (a) Fitting curve of ΔTNMST1 ; (b) Deviations of ΔTNMST1.
Sensors 17 02325 g011
Figure 12. The curve between Hx and ΔTNMST with different excitation frequencies.
Sensors 17 02325 g012
Figure 13. The fluctuation of ΔTNMST by using the NMST readout scheme.
Sensors 17 02325 g013
Figure 14. The fluctuation of ΔT by using the BMSTD readout scheme.
Sensors 17 02325 g014
Figure 15. The ΔTNMST and fluctuation after processing by the hybrid algorithm. (a) ΔTNMST after hybrid algorithm processing; (b) The fluctuation of ΔTNMST after hybrid algorithm processing.
Sensors 17 02325 g015
Table 1. Time difference fluctuations of 3 s by using two readout methods.
Time (s)Fluctuations of ΔTNMST (μs)Fluctuations of ΔT (μs)Time (s)Fluctuations of ΔTNMST (μs)Fluctuations of ΔT (μs)
36.10.8840.71937.60.882−0.158
36.2−0.755−1.22137.71.2150.219
36.30.9130.18037.80.2833.219
36.42.364−1.64237.90.7840.678
36.50.136−2.06138.01.2510.459
36.61.765−1.27538.10.403−1.949
36.71.443−0.23938.20.672−0.648
36.8−0.992−0.33438.3−2.1980.197
36.90.7481.55238.4−1.016−1.426
37.0−0.095−0.36738.51.474−0.968
37.10.3342.29238.6−0.228−2.057
37.2−0.4550.78838.71.563−3.038
37.3−1.1070.19938.80.486−1.587
37.40.895−1.47638.91.040−1.955
37.50.4830.17739.00.335−3.651

