
Concurrent Reflectance Confocal Microscopy and Laser Doppler Flowmetry to Improve Skin Cancer Imaging: A Monte Carlo Model and Experimental Validation

 , , and
Abstract
:1. Introduction
2. Methodology
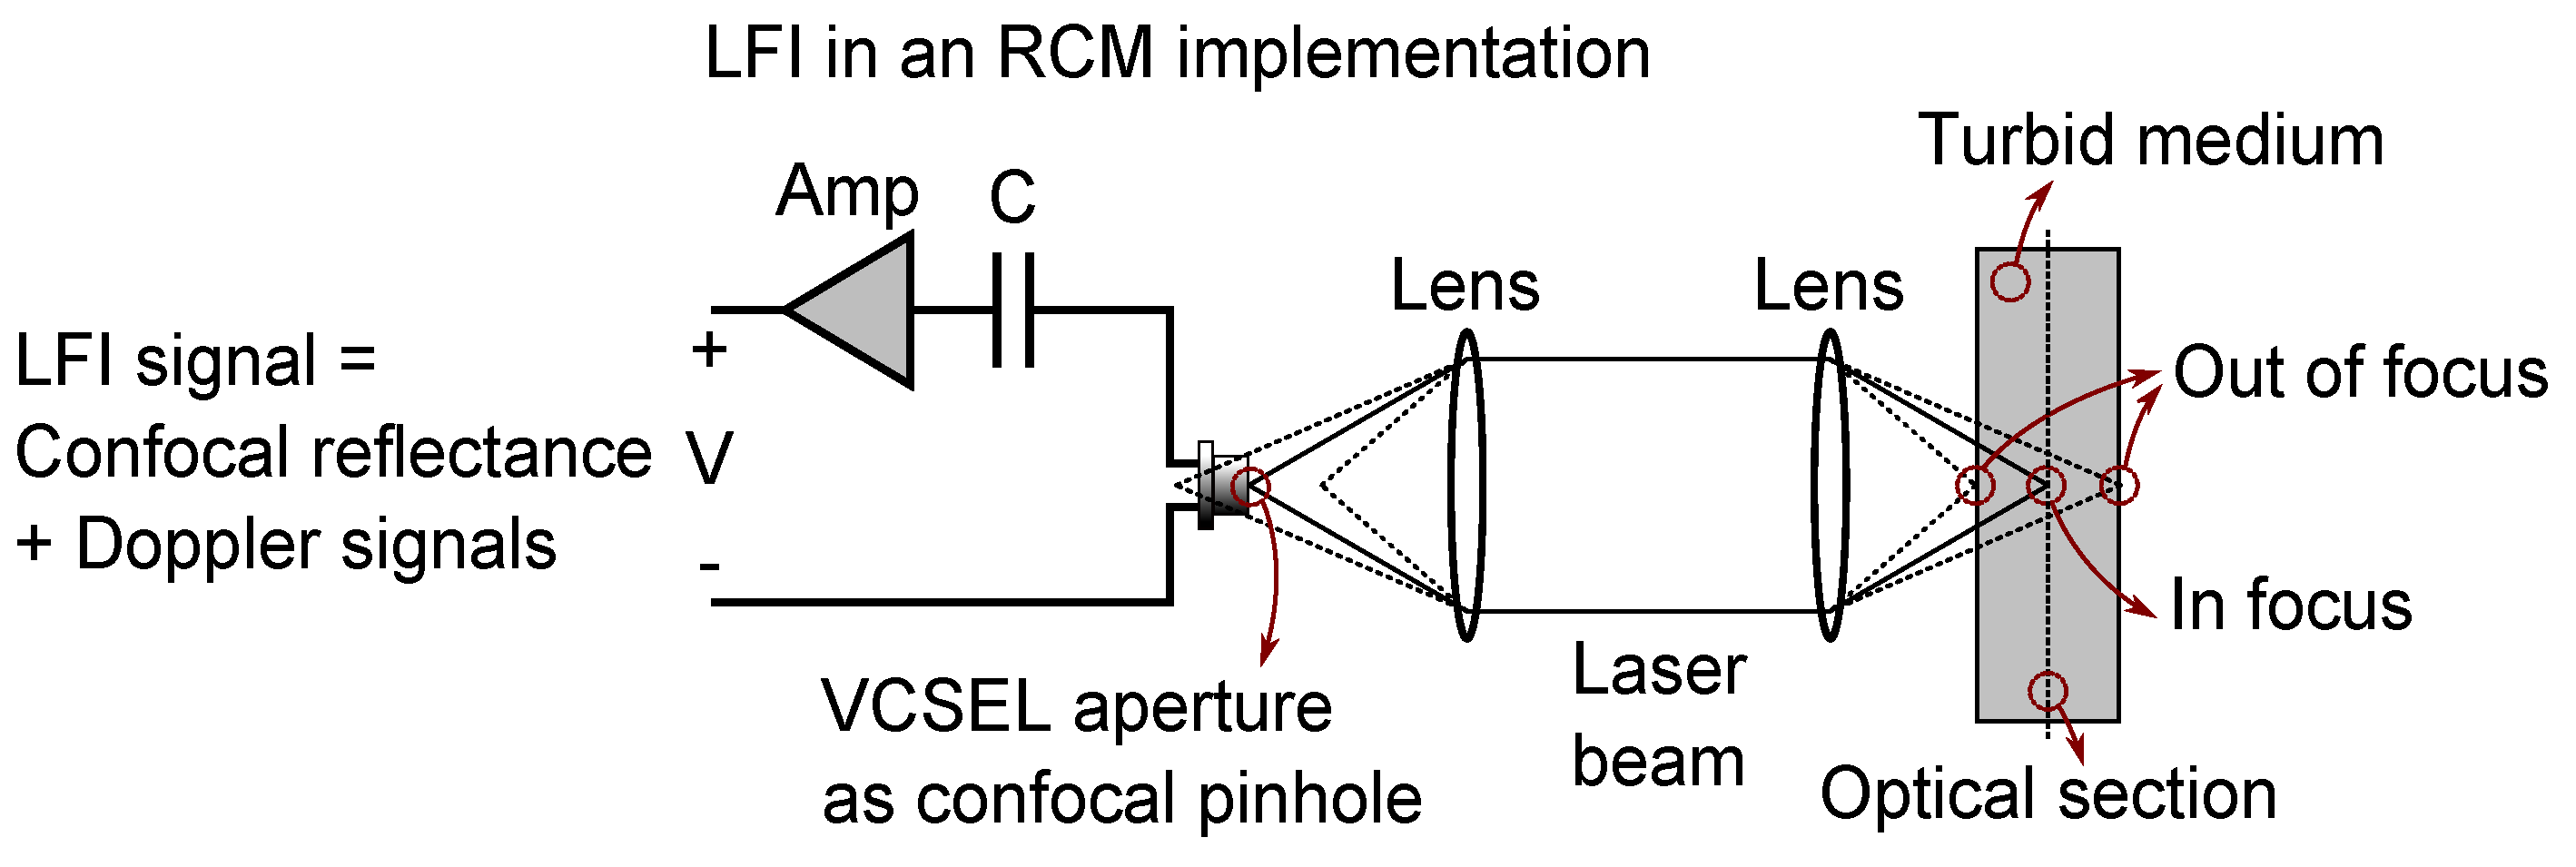
2.1. Confocal Laser Feedback Interferometry
2.2. Laser Doppler Flowmetry
2.3. Monte Carlo Simulation
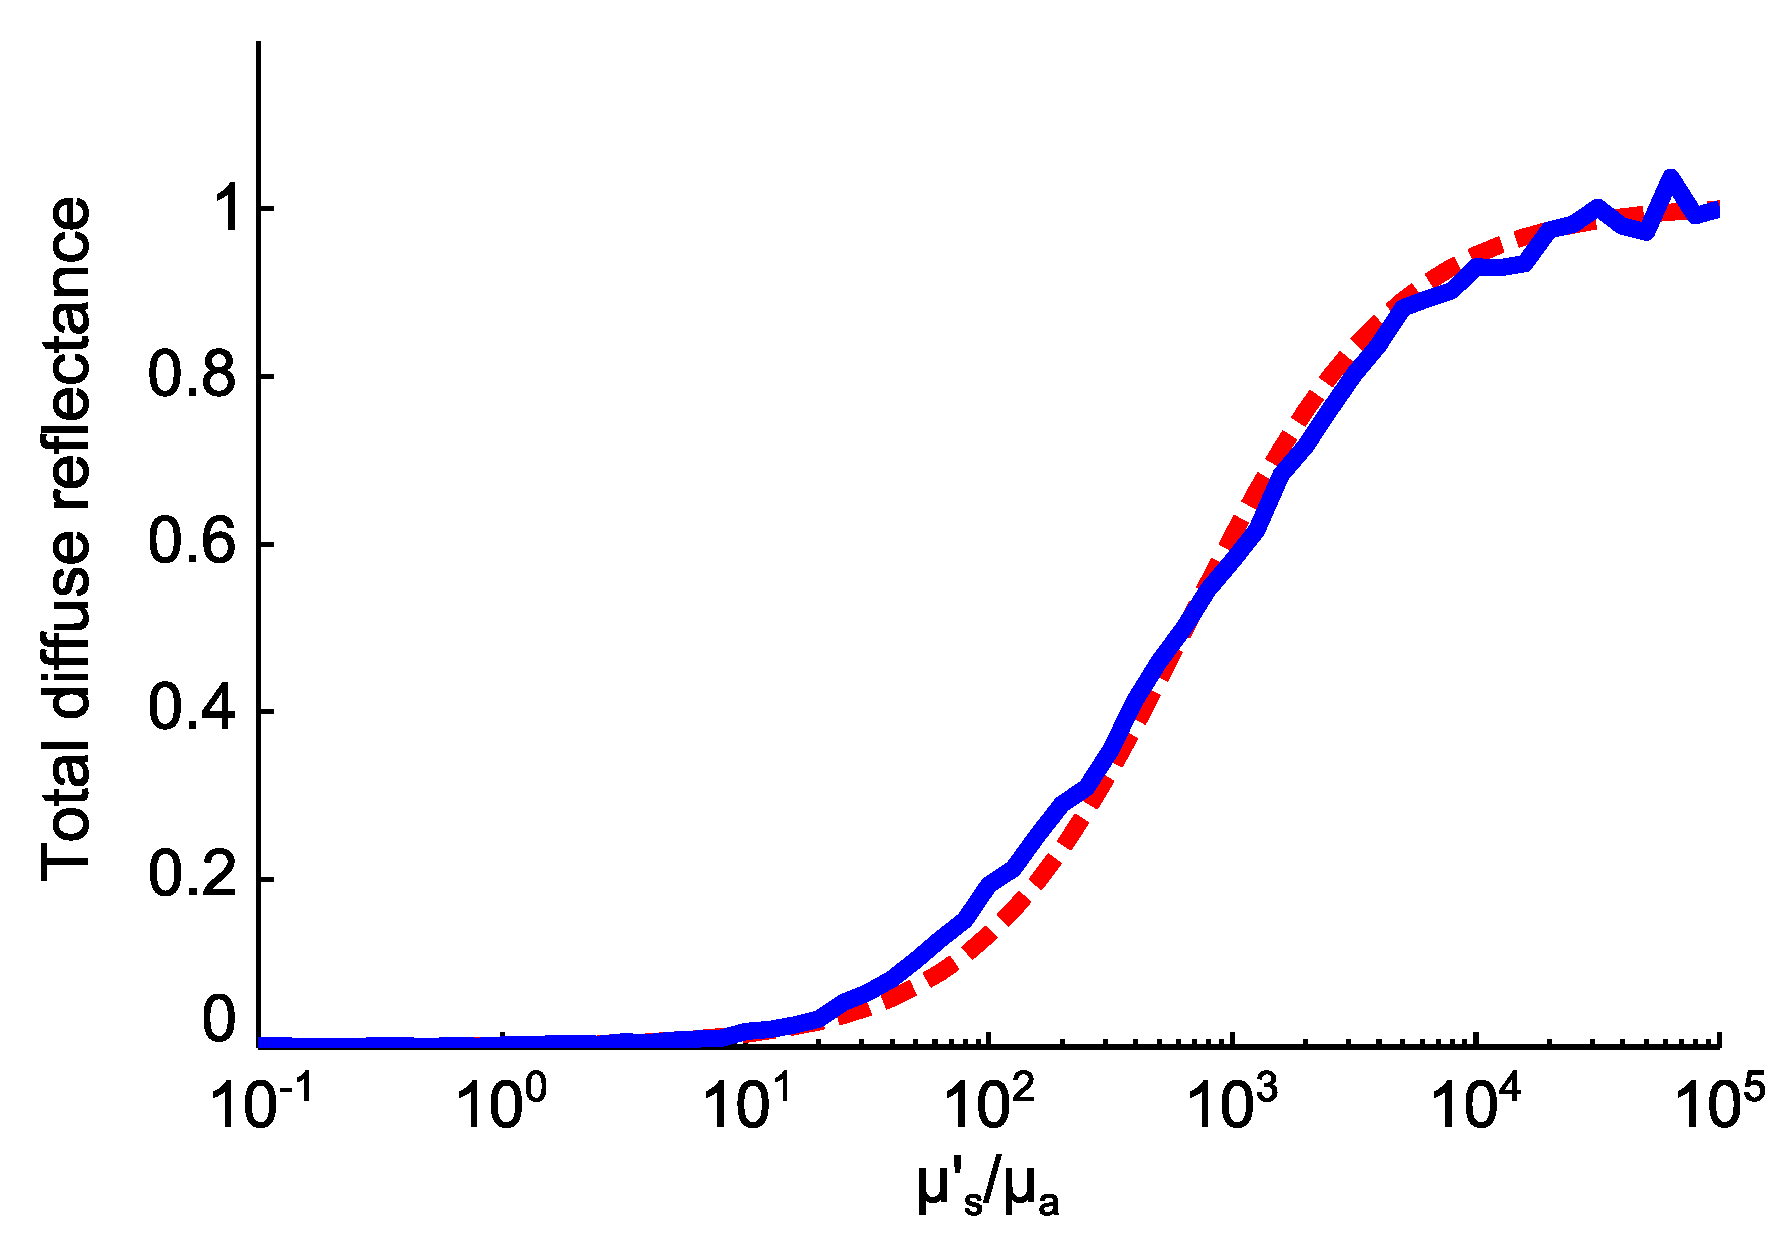
3. Simulation Setup and Results
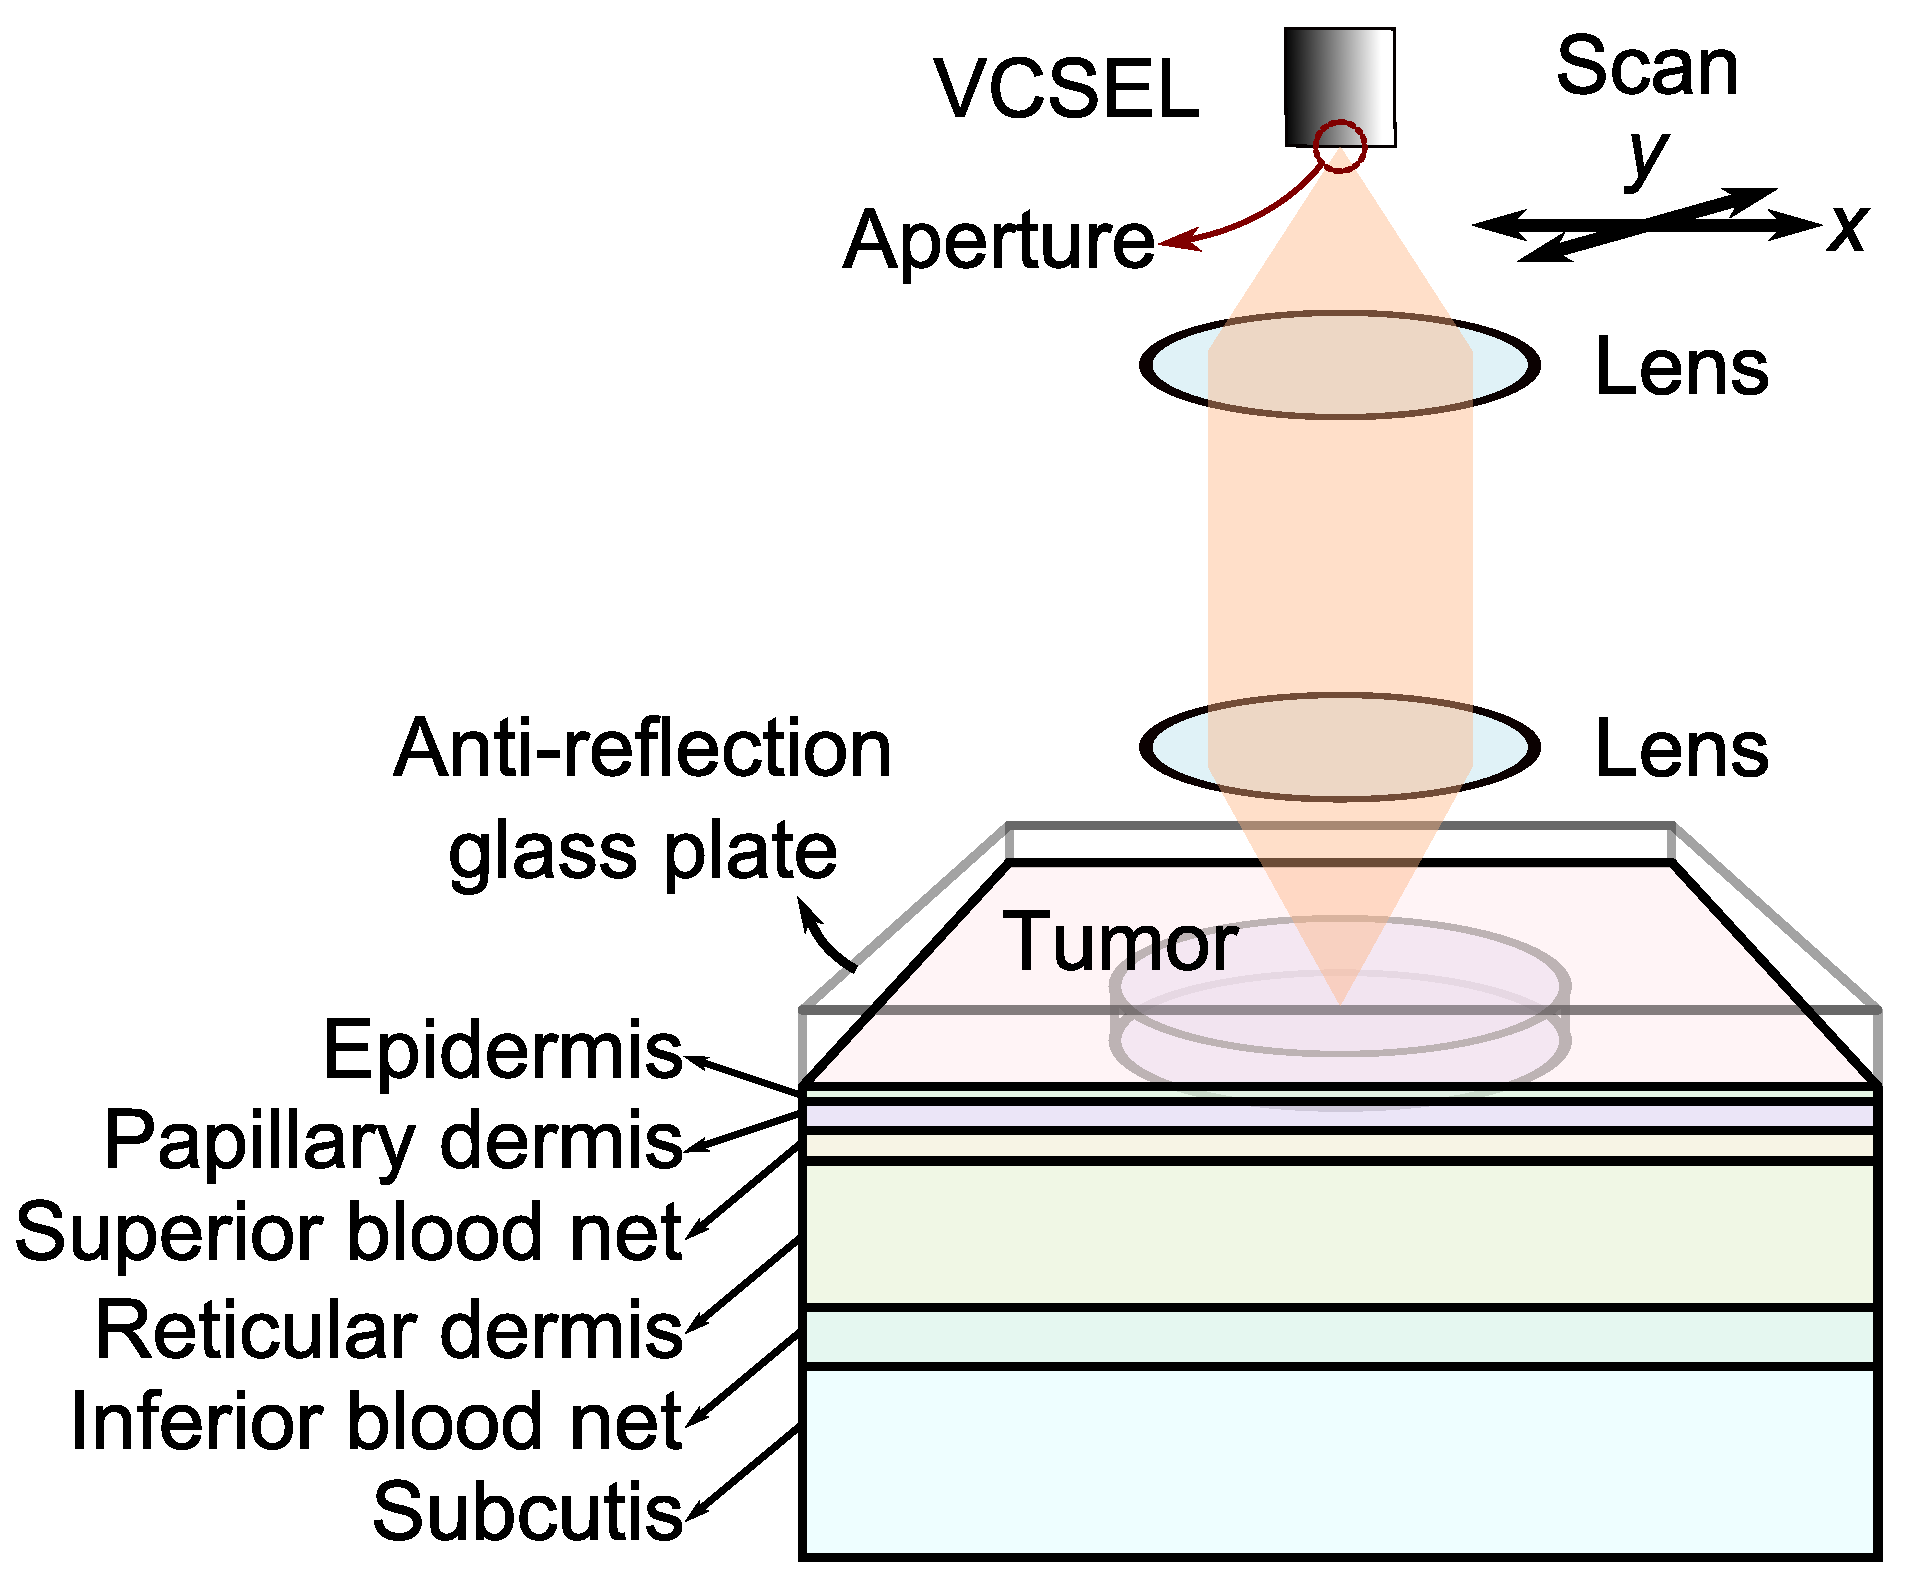
3.1. Setup
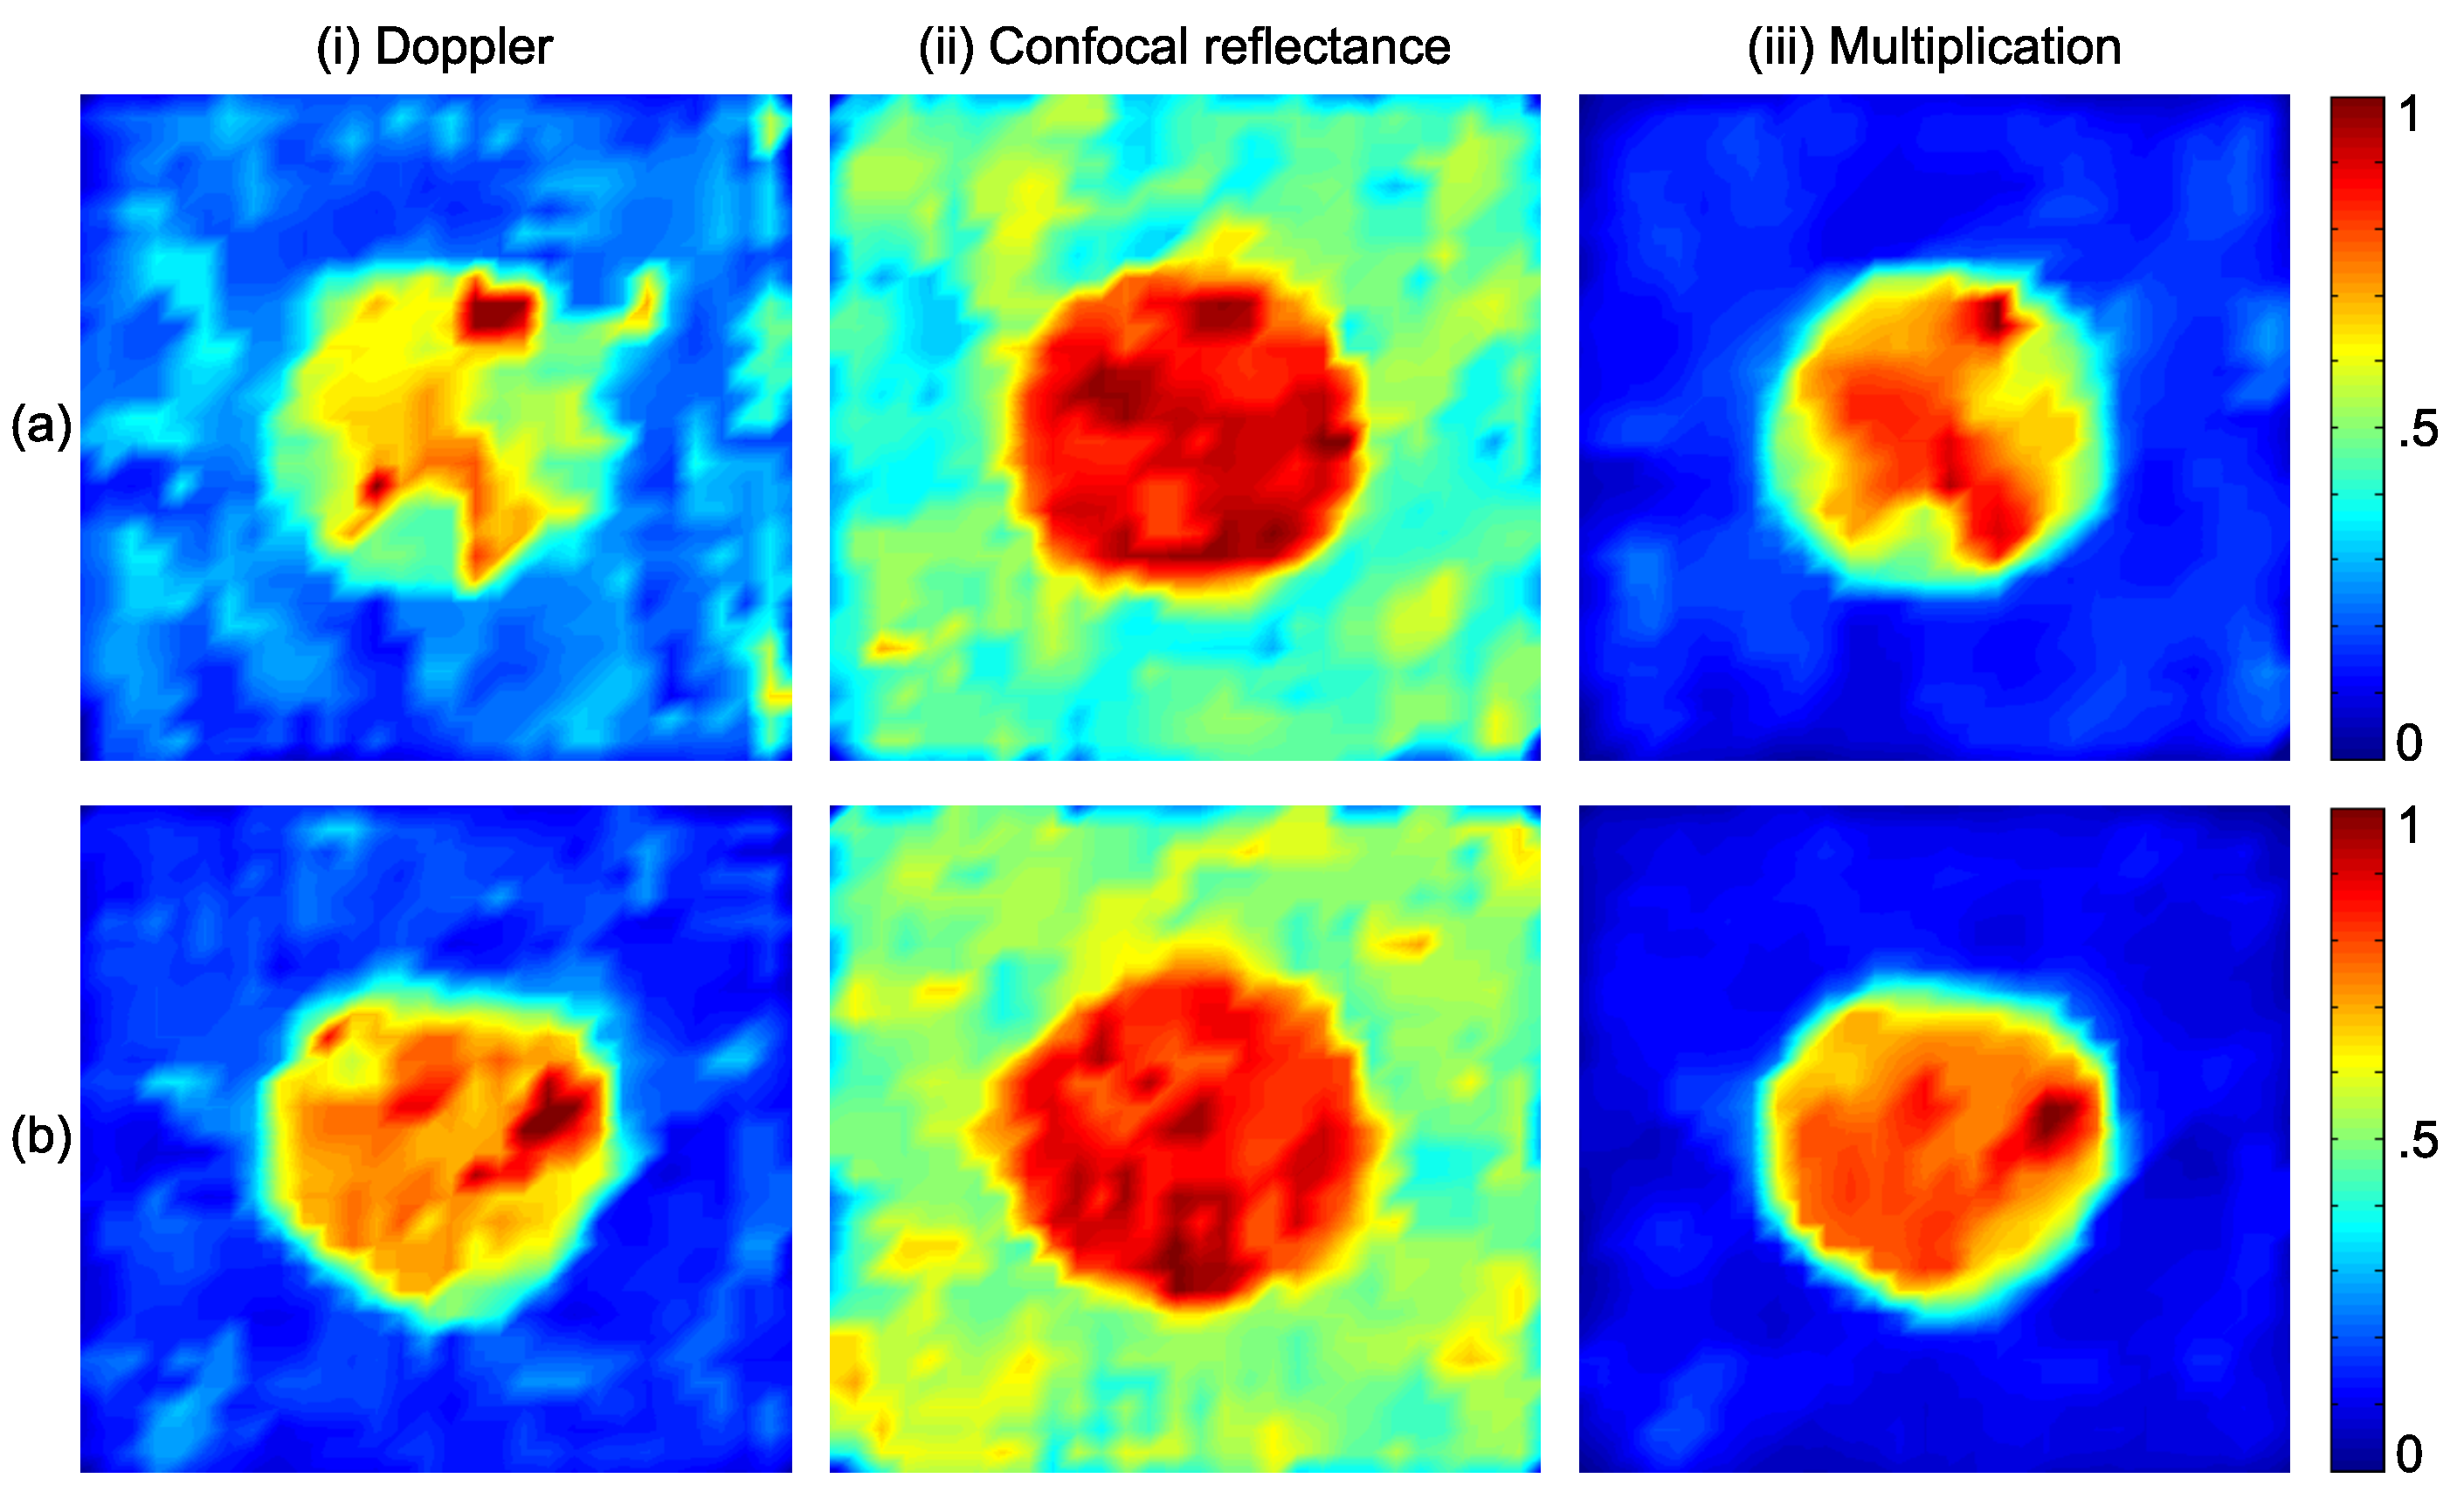
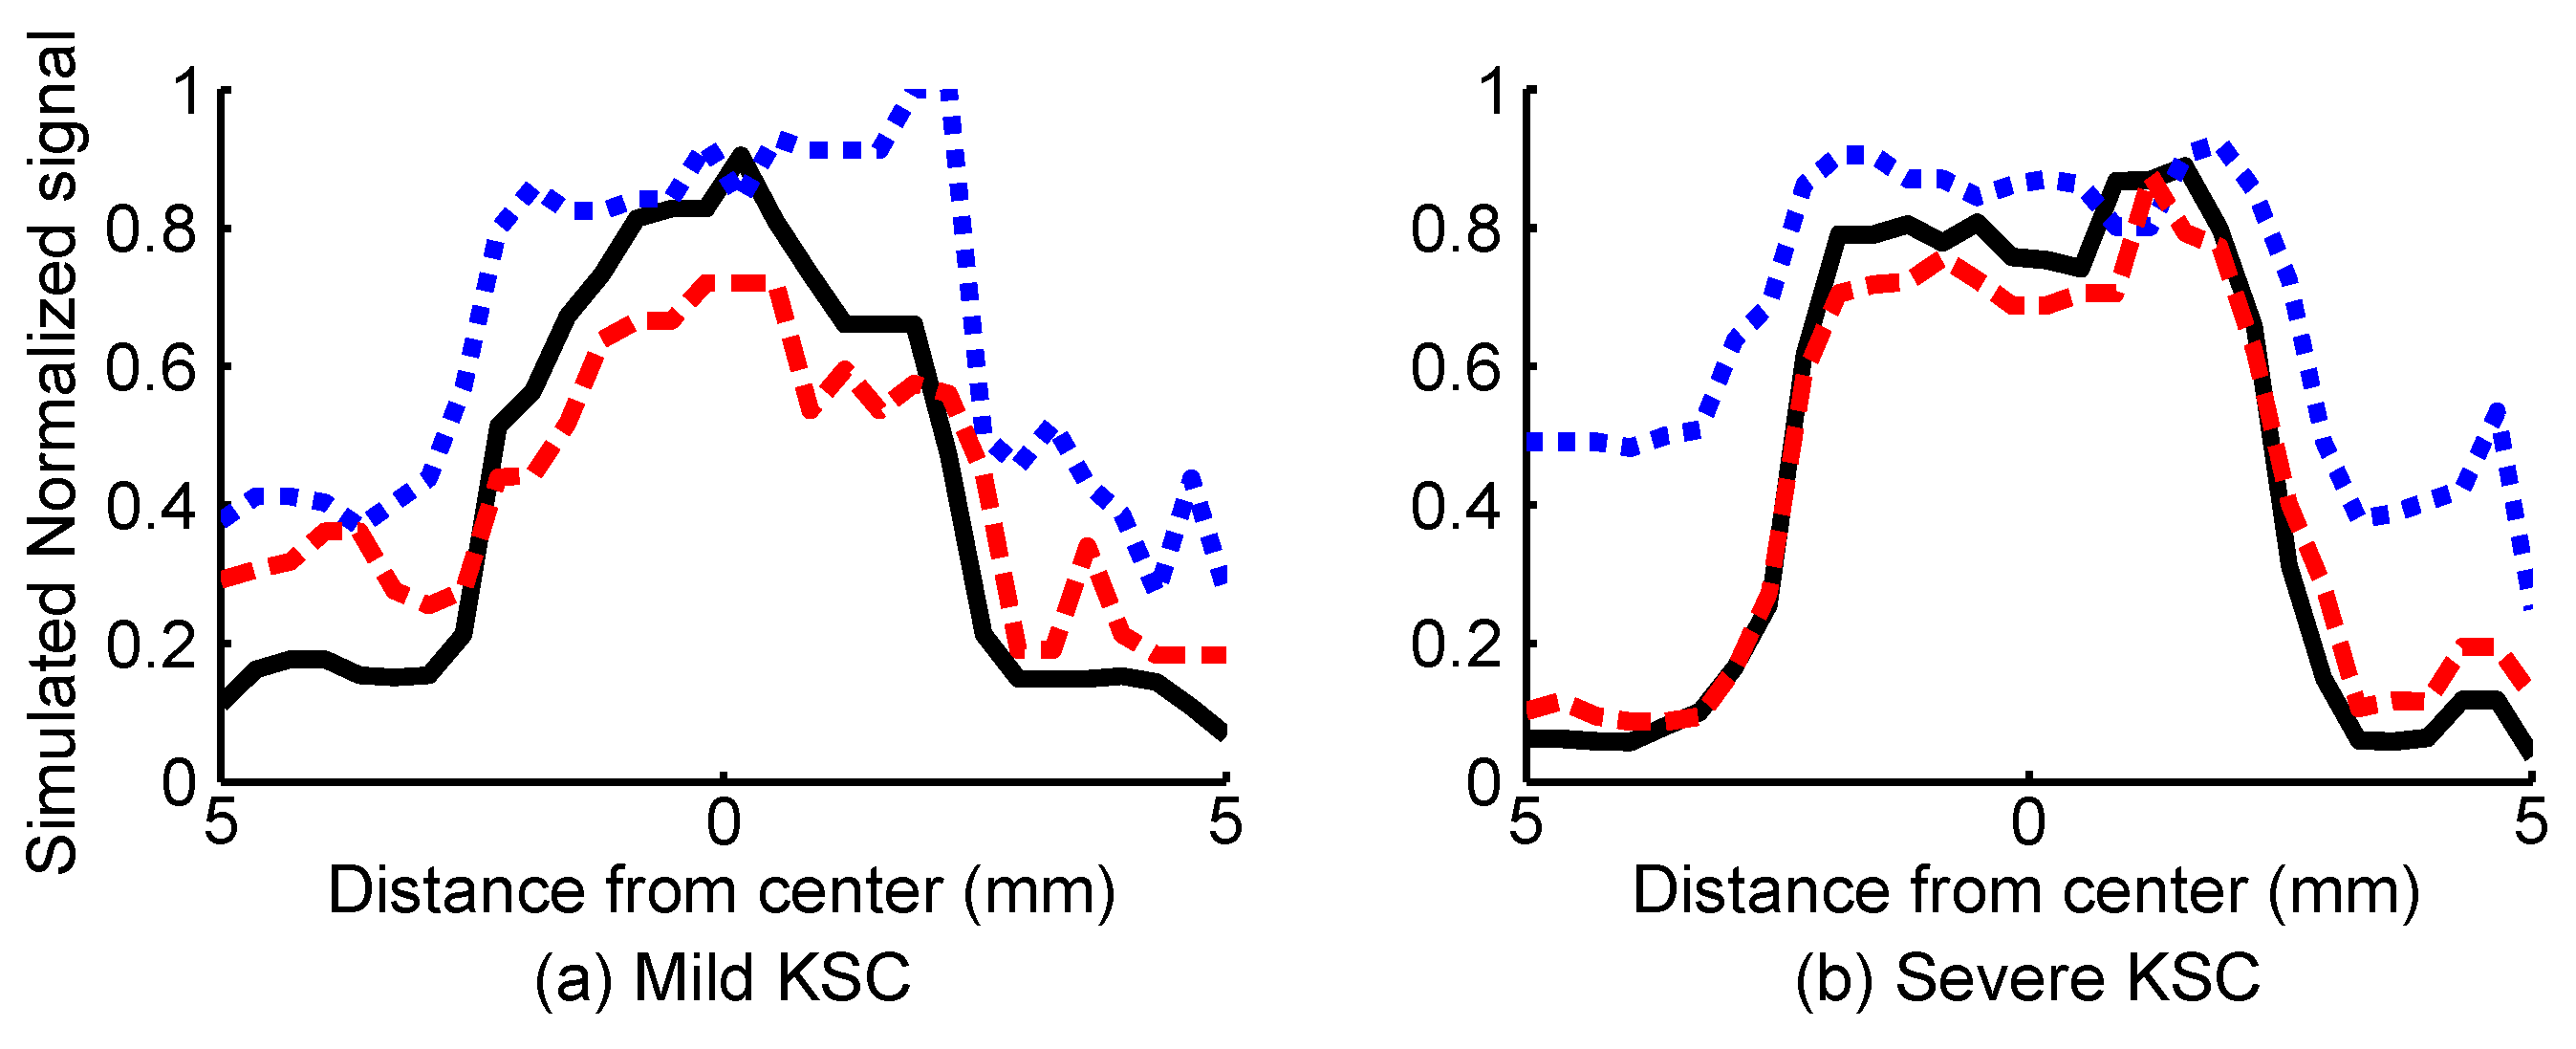
3.2. Results
4. Experimental Validation
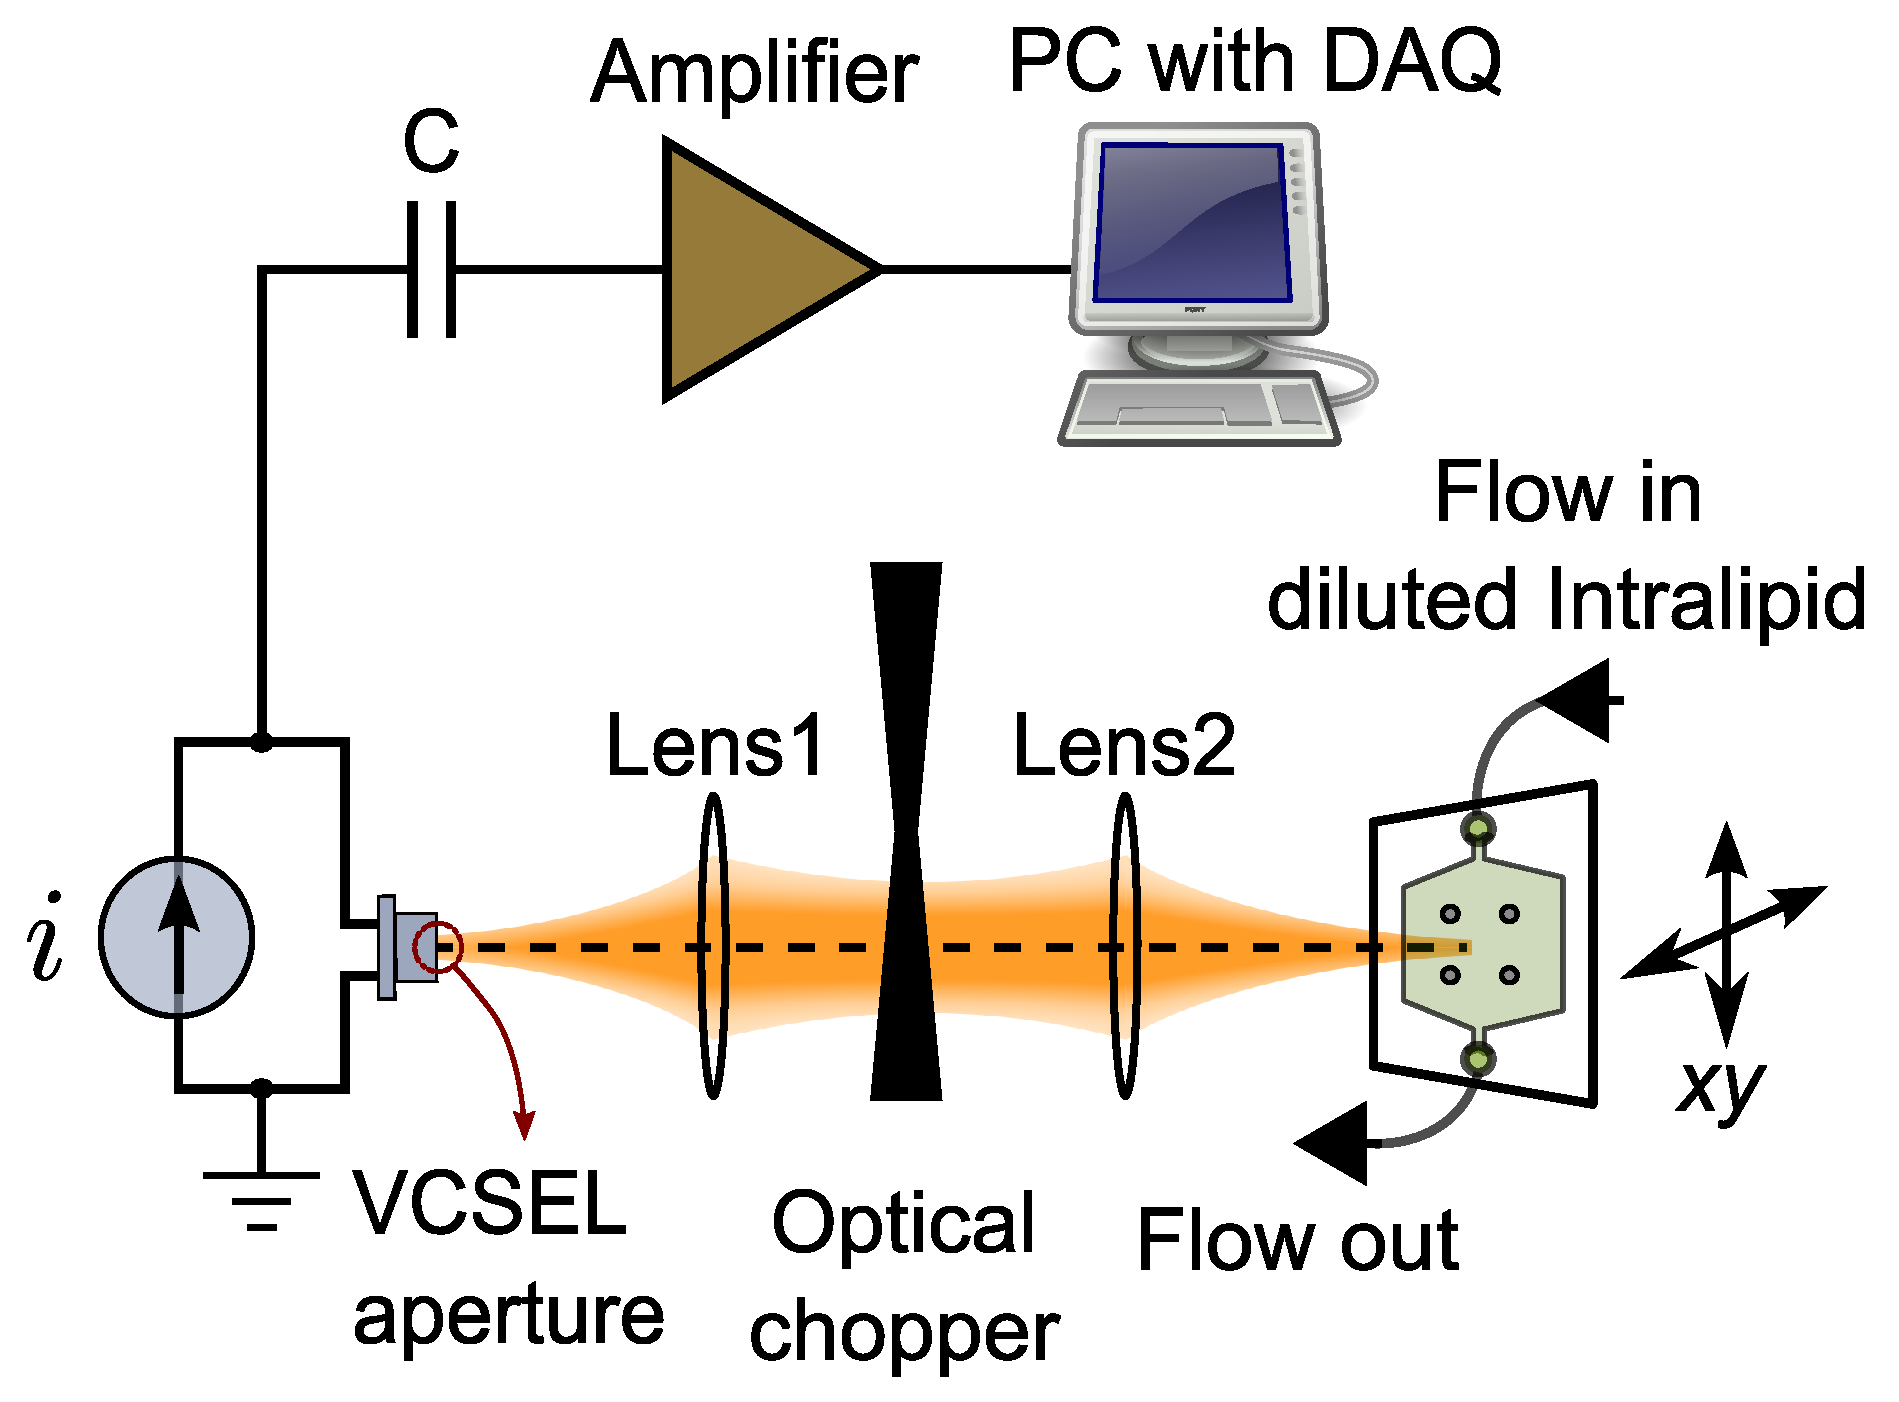
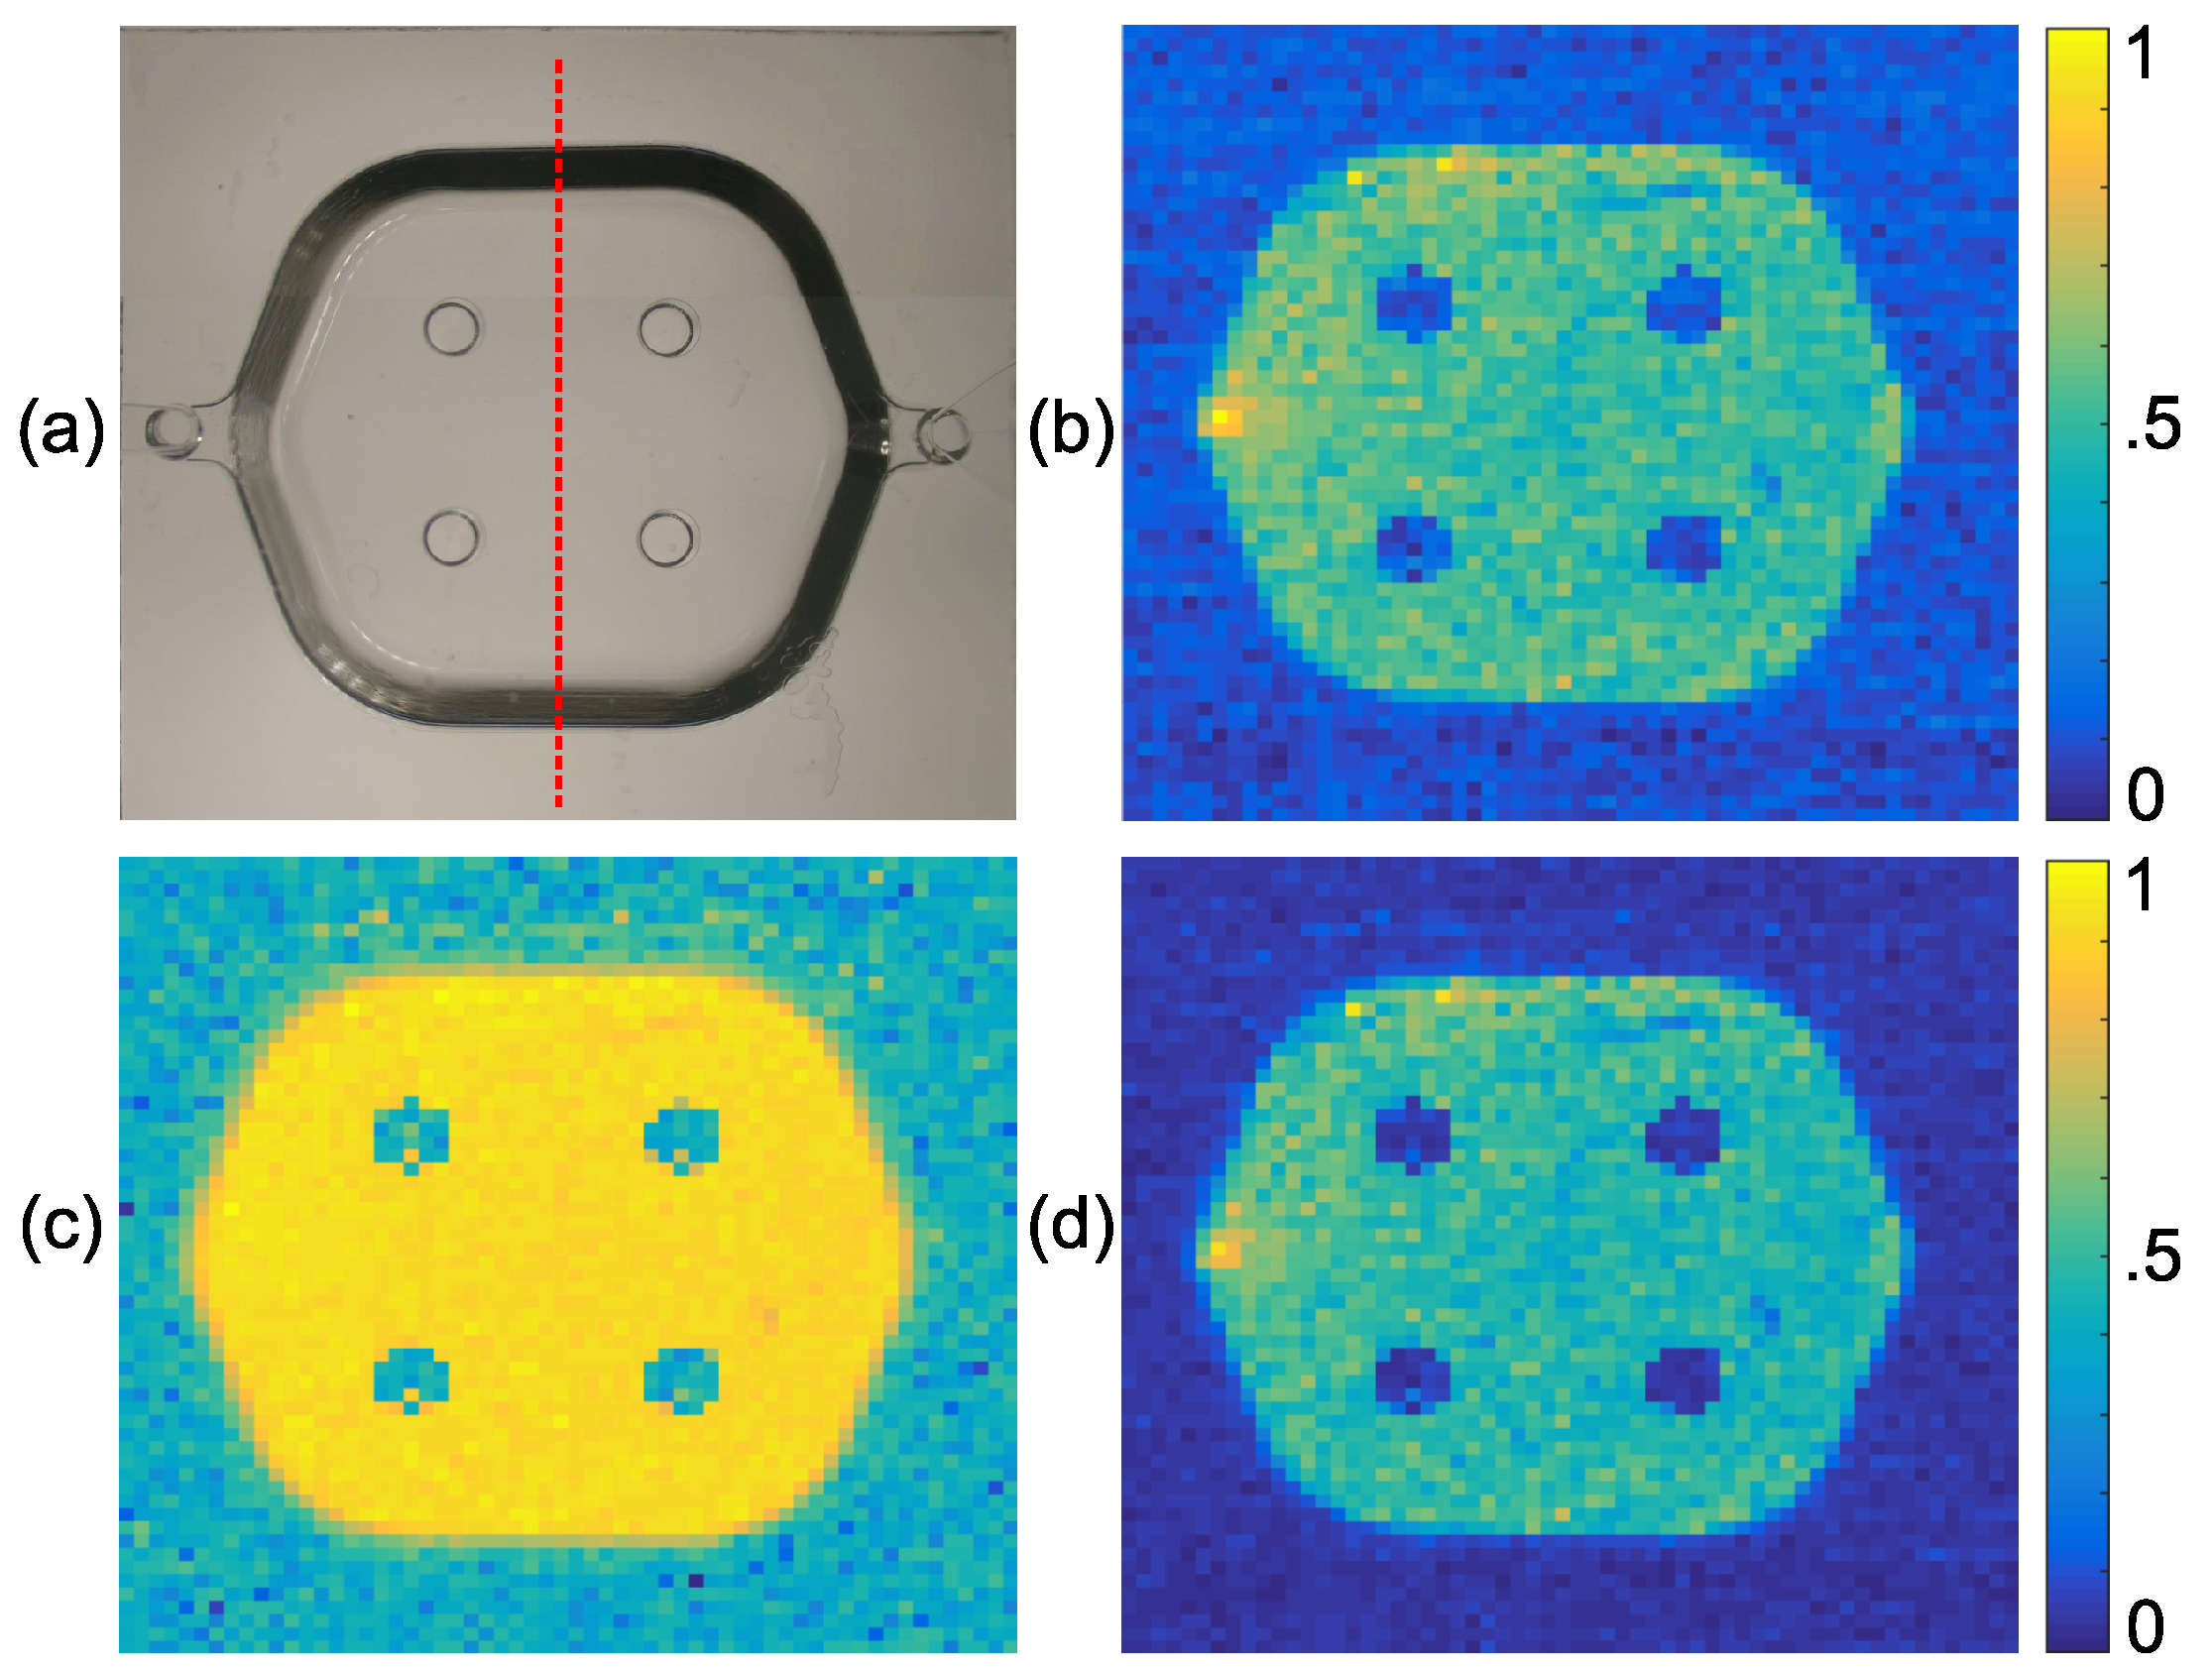
4.1. Experimental Setup
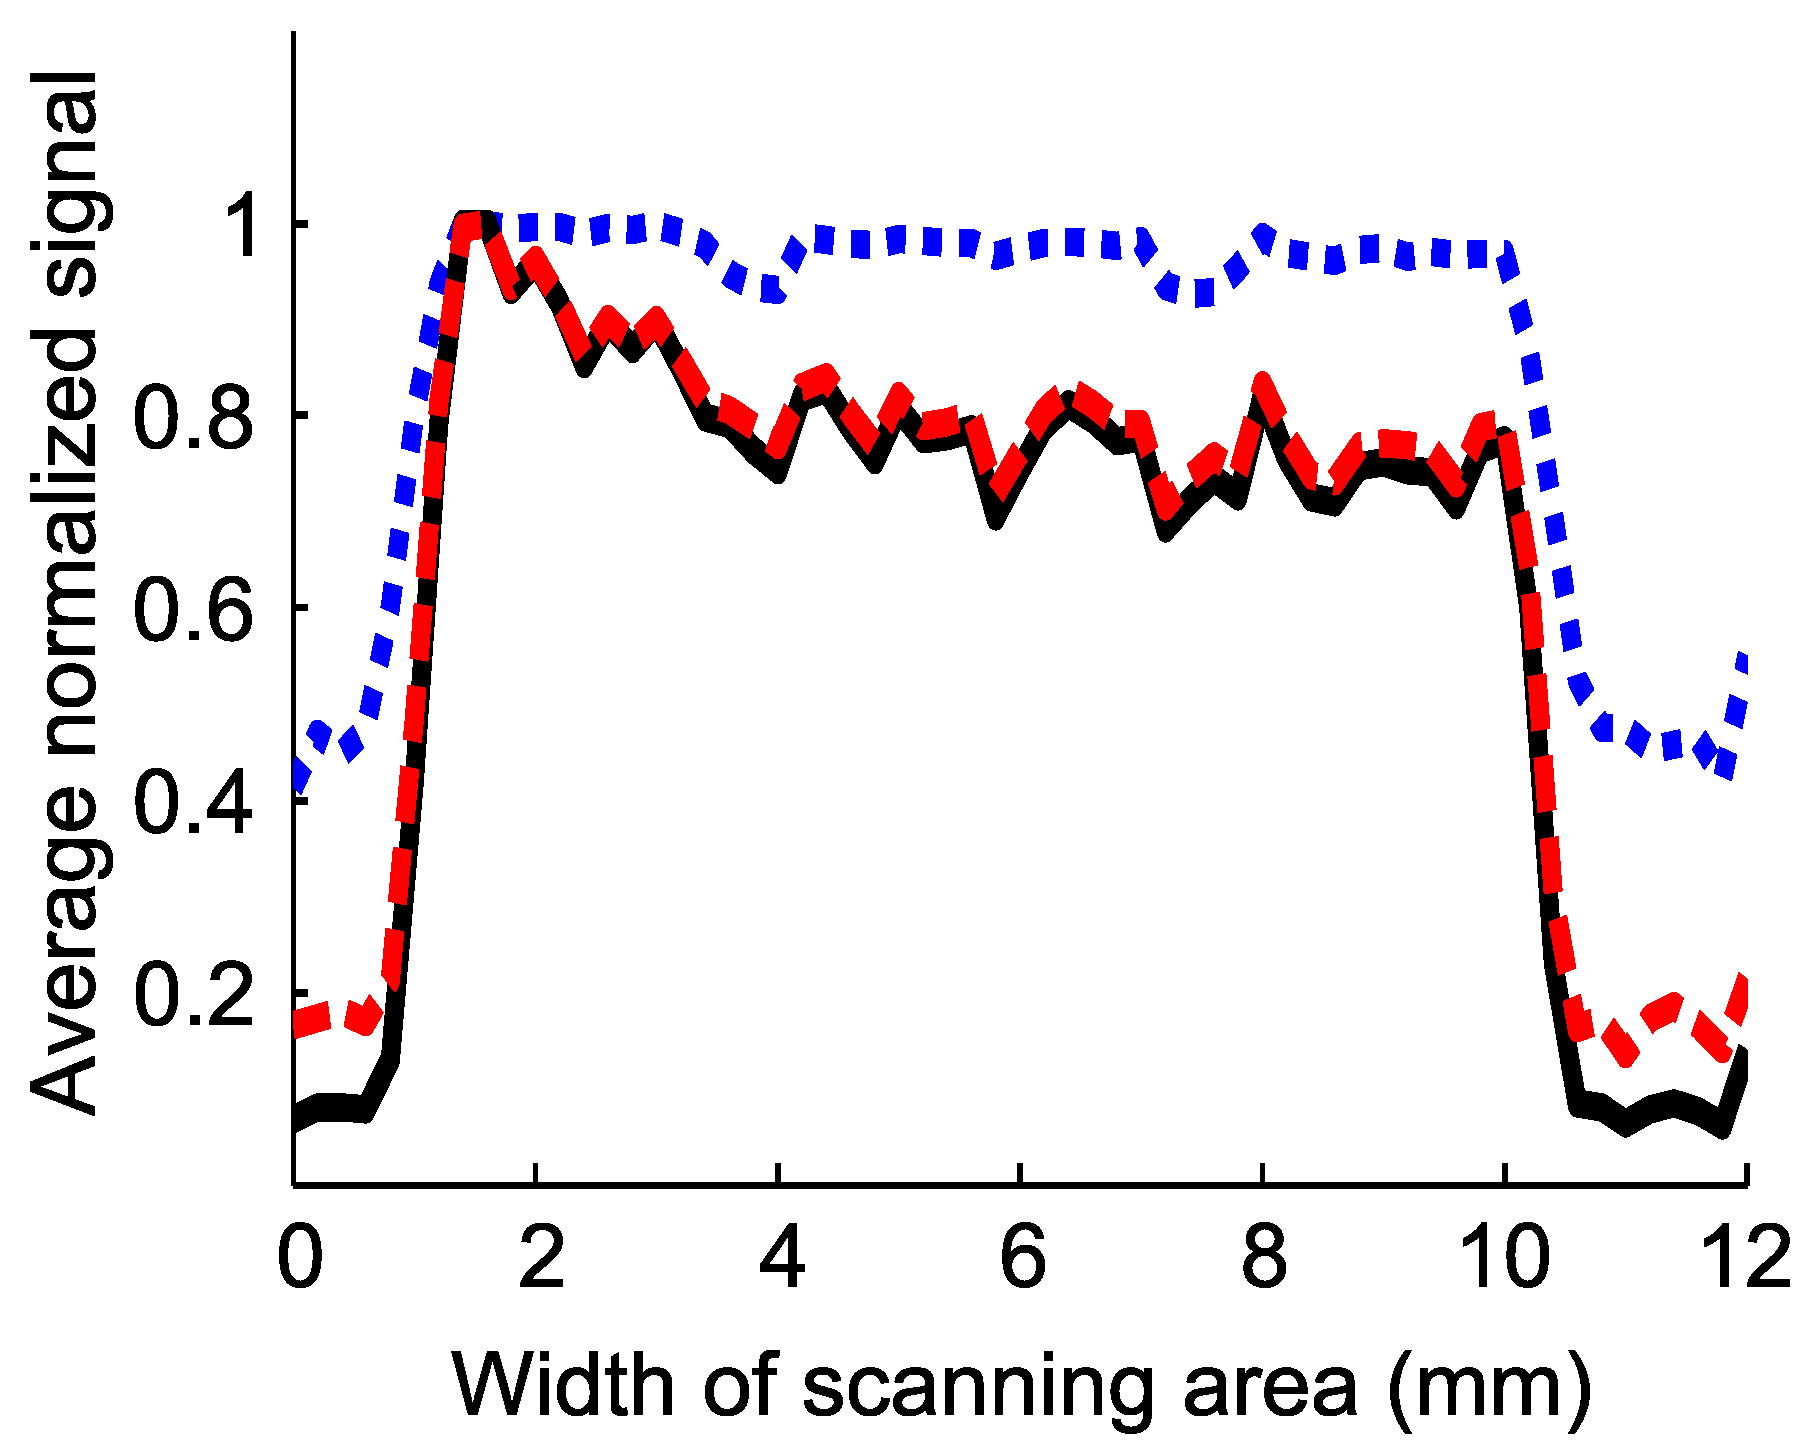
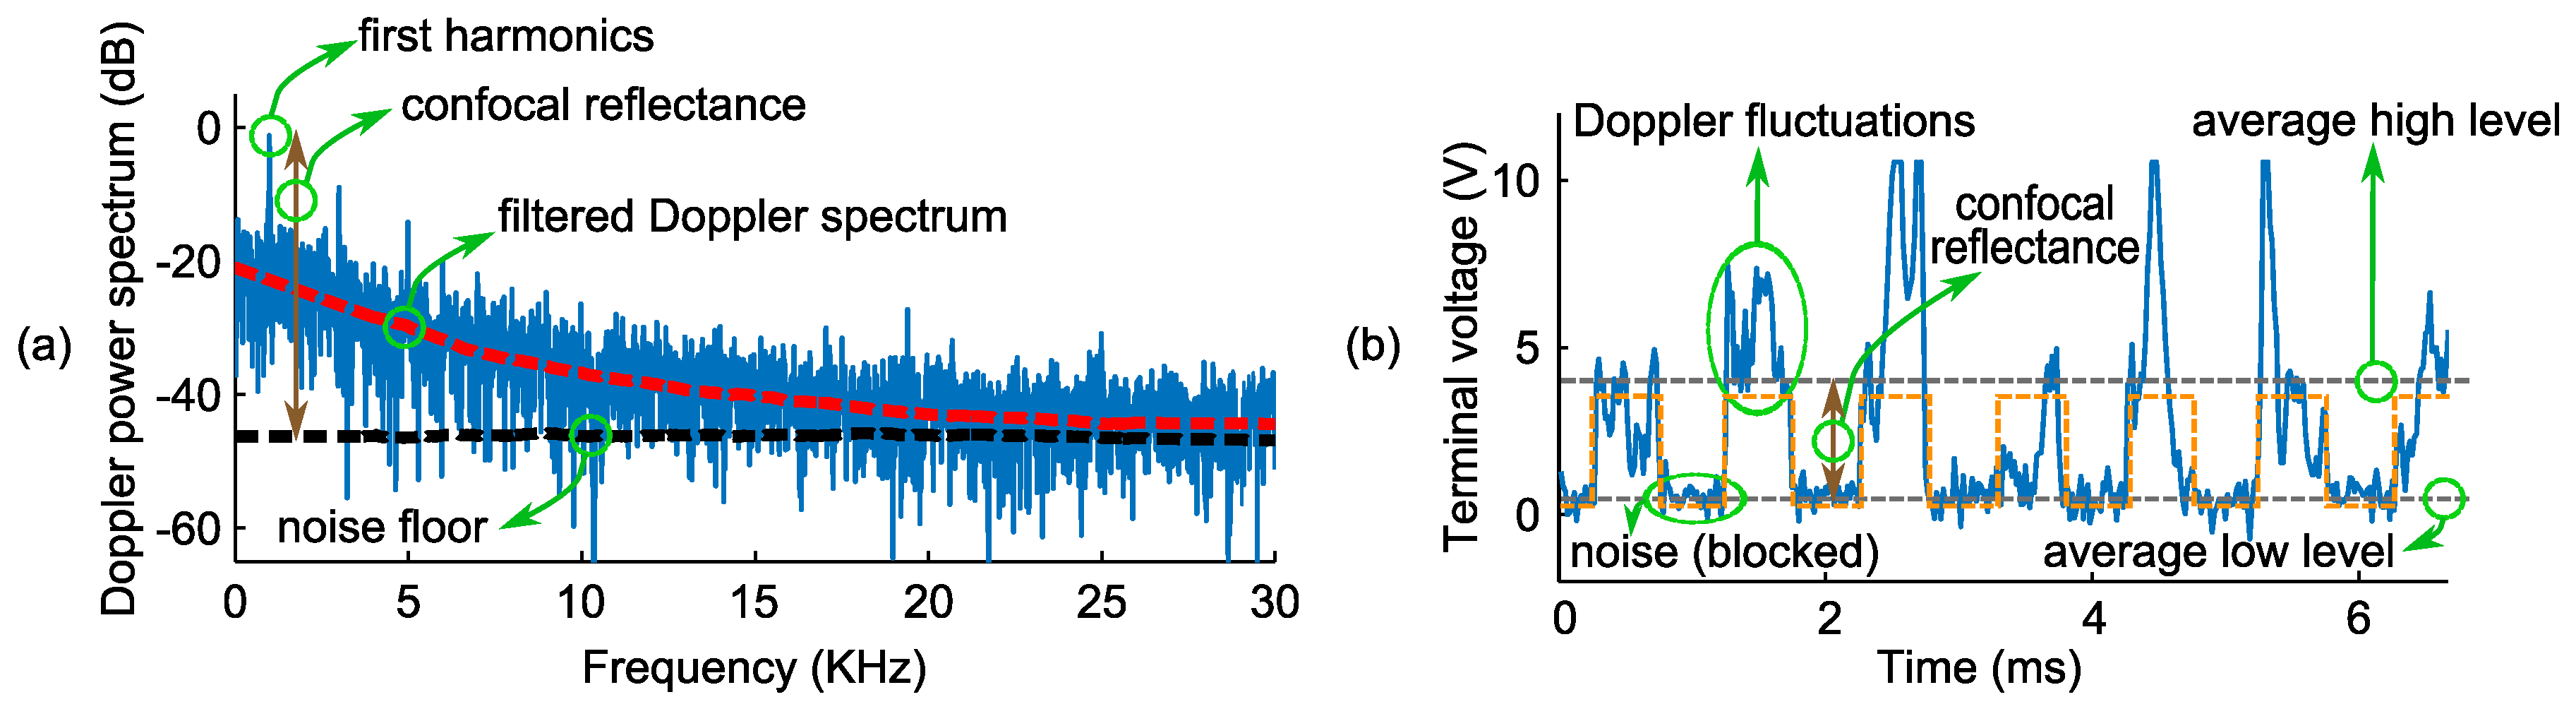
4.2. Experimental Results
5. Discussion
6. Conclusions
Acknowledgments
Author Contributions
Conflicts of Interest
Abbreviations
| LFI | Laser feedback interferometry |
| RCM | Reflectance confocal microscopy |
| SBR | Signal to background ratio |
| KSC | Keratinocyte skin cancer |
| BCC | Basal cell carcinoma |
| SCC | Squamous cell carcinoma |
| LDF | Laser Doppler flowmetry |
| VCSEL | Vertical-cavity surface-emitting laser |
References
- Diepgen, T.; Mahler, V. The epidemiology of skin cancer. Br. J. Dermatol. 2002, 146, 1–6. [Google Scholar] [CrossRef] [PubMed]
- Lomas, A.; Leonardi-Bee, J.; Bath-Hextall, F. A systematic review of worldwide incidence of nonmelanoma skin cancer. Br. J. Dermatol. 2012, 166, 1069–1080. [Google Scholar] [CrossRef] [PubMed]
- Soyer, H.P.; Rigel, D.; Wurm, E.M. Actinic Keratosis, Basal Cell Carcinoma and Squamous Cell Carcinoma. In Dermatology; Elsevier: London, UK, 2012; pp. 1773–1794. [Google Scholar]
- Baldi, A.; Pasquali, P.; Spugnini, E.P. Skin Cancer: A Practical Approach; Humana Press: New York, NY, USA, 2014. [Google Scholar]
- Walling, H.W.; Fosko, S.W.; Geraminejad, P.A.; Whitaker, D.C.; Arpey, C.J. Aggressive basal cell carcinoma: presentation, pathogenesis, and management. Cancer Metastasis Rev. 2004, 23, 389–402. [Google Scholar] [CrossRef] [PubMed]
- Miller, S.J. Biology of basal cell carcinoma (Part I). J. Am. Acad. Dermatol. 1991, 24, 1–13. [Google Scholar] [CrossRef]
- Anderson, R.R.; Parrish, J.A. The optics of human skin. J. Investig. Dermatol. 1981, 77, 13–19. [Google Scholar] [CrossRef] [PubMed]
- Salomatina, E.; Jiang, B.; Novak, J.; Yaroslavsky, A.N. Optical properties of normal and cancerous human skin in the visible and near-infrared spectral range. J. Biomed. Opt. 2006, 11. [Google Scholar] [CrossRef] [PubMed]
- Zonios, G.; Perelman, L.T.; Backman, V.; Manoharan, R.; Fitzmaurice, M.; Van Dam, J.; Feld, M.S. Diffuse reflectance spectroscopy of human adenomatous colon polyps in vivo. Appl. Opt. 1999, 38, 6628–6637. [Google Scholar] [CrossRef] [PubMed]
- Zonios, G.; Bykowski, J.; Kollias, N. Skin melanin, hemoglobin, and light scattering properties can be quantitatively assessed in vivo using diffuse reflectance spectroscopy. J. Investig. Dermatol. 2001, 117, 1452–1457. [Google Scholar] [CrossRef] [PubMed]
- Webb, R.H. Confocal optical microscopy. Rep. Prog. Phys. 1996, 59, 427. [Google Scholar] [CrossRef]
- Rajadhyaksha, M.; Grossman, M.; Esterowitz, D.; Webb, R.H.; Anderson, R.R. In vivo confocal scanning laser microscopy of human skin: Melanin provides strong contrast. J. Investig. Dermatol. 1995, 104, 946–952. [Google Scholar] [CrossRef] [PubMed]
- Hofmann-Wellenhof, R.; Pellacani, G.; Malvehy, J.; Soyer, H.P. Reflectance confocal microscopy for skin diseases; Springer: Berlin, Germany, 2012. [Google Scholar]
- Longo, C.; Farnetani, F.; Ciardo, S.; Cesinaro, A.; Moscarella, E.; Ponti, G.; Zalaudek, I.; Argenziano, G.; Pellacani, G. Is confocal microscopy a valuable tool in diagnosing nodular lesions? A study of 140 cases. Br. J. Dermatol. 2013, 169, 58–67. [Google Scholar] [CrossRef] [PubMed]
- Scope, A.; Mahmood, U.; Gareau, D.; Kenkre, M.; Lieb, J.; Nehal, K.; Rajadhyaksha, M. In vivo reflectance confocal microscopy of shave biopsy wounds: Feasibility of intraoperative mapping of cancer margins. Br. J. Dermatol. 2010, 163, 1218–1228. [Google Scholar] [CrossRef] [PubMed]
- Rishpon, A.; Kim, N.; Scope, A.; Porges, L.; Oliviero, M.C.; Braun, R.P.; Marghoob, A.A.; Fox, C.A.; Rabinovitz, H.S. Reflectance confocal microscopy criteria for squamous cell carcinomas and actinic keratoses. Arch. Dermatol. 2009, 145, 766–772. [Google Scholar] [CrossRef] [PubMed]
- Segura, S.; Puig, S.; Carrera, C.; Palou, J.; Malvehy, J. Development of a two-step method for the diagnosis of melanoma by reflectance confocal microscopy. J. Am. Acad. Dermatol. 2009, 61, 216–229. [Google Scholar] [CrossRef] [PubMed]
- Hanahan, D.; Weinberg, R.A. Hallmarks of cancer: The next generation. Cell 2011, 144, 646–674. [Google Scholar] [CrossRef] [PubMed]
- Vaupel, P.; Kallinowski, F.; Okunieff, P. Blood flow, oxygen and nutrient supply, and metabolic microenvironment of human tumours: A review. Cancer Res. 1989, 49, 6449–6465. [Google Scholar] [PubMed]
- Jain, R.K. Taming vessels to treat cancer. Sci. Am. 2008, 18, 64–71. [Google Scholar] [CrossRef]
- Rajan, V.; Varghese, B.; van Leeuwen, T.G.; Steenbergen, W. Review of methodological developments in laser Doppler flowmetry. Lasers Med. Sci. 2009, 24, 269–283. [Google Scholar] [CrossRef] [PubMed]
- Pigott, K.; Hill, S.; Chaplin, D.; Saunders, M. Microregional fluctuations in perfusion within human tumours detected using laser Doppler flowmetry. Radiother. Oncol. 1996, 40, 45–50. [Google Scholar] [CrossRef]
- Stücker, M.; Horstmann, I.; Nüchel, C.; Röchling, A.; Hoffmann, K.; Altmeyer, P. Blood flow compared in benign melanocytic naevi, malignant melanomas and basal cell carcinomas. Clin. Exp. Dermatol. 1999, 24, 107–111. [Google Scholar] [CrossRef] [PubMed]
- Stücker, M.; Esser, M.; Hoffmann, M.; Memmel, U.; Ller, A.H.; Von Bormann, C.; Hoffmann, K.; Altmeyer, P. High-resolution laser Doppler perfusion imaging aids in differentiating between benign and malignant melanocytic skin tumours. Acta Derm Venereol 2002, 82, 25–29. [Google Scholar] [CrossRef] [PubMed]
- Wang, I.; Anderson-Engels, S.; Nilsson, G.; Wardell, K.; Svanberg, K. Superficial blood flow following photodynamic therapy of malignant non–melanoma skin tumours measured by laser Doppler perfusion imaging. Br. J. Dermatol. 1997, 136, 184–189. [Google Scholar] [CrossRef] [PubMed]
- Saravanamuthu, J.; Seifalian, A.; Reid, W.; Maclean, A. A new technique to map vulva microcirculation using laser Doppler perfusion imager. Int. J. Gynecol. Cancer 2003, 13, 812–818. [Google Scholar] [CrossRef] [PubMed]
- Seifalian, A.; Chaloupka, K.; Parbhoo, S. Laser Doppler perfusion imaging–a new technique for measuring breast skin blood flow. Int. J. Microcirc. 1995, 15, 125–130. [Google Scholar] [CrossRef]
- Wårdell, K.; Jakobsson, A.; Nilsson, G.E. Laser Doppler perfusion imaging by dynamic light scattering. IEEE Trans. Biomed. Eng. 1993, 40, 309–316. [Google Scholar] [CrossRef] [PubMed]
- Chen, Z.; Milner, T.E.; Srinivas, S.; Wang, X.; Malekafzali, A.; van Gemert, M.J.; Nelson, J.S. Noninvasive imaging of in vivo blood flow velocity using optical Doppler tomography. Opt. Lett. 1997, 22, 1119–1121. [Google Scholar] [CrossRef] [PubMed]
- Yaroslavsky, A.N.; Barbosa, J.; Neel, V.; DiMarzio, C.; Anderson, R.R. Combining multispectral polarized light imaging and confocal microscopy for localization of nonmelanoma skin cancer. J. Biomed. Opt. 2005, 10, 014011–0140116. [Google Scholar] [CrossRef] [PubMed]
- Giuliani, G.; Norgia, M.; Donati, S.; Bosch, T. Laser diode self-mixing technique for sensing applications. J. Opt. A Pure Appl. Opt. 2002, 4. [Google Scholar] [CrossRef]
- Donati, S. Developing self-mixing interferometry for instrumentation and measurements. Laser Photonics Rev. 2012, 6, 393–417. [Google Scholar] [CrossRef]
- Donati, S.; Norgia, M. Self-mixing interferometry for biomedical signals sensing. IEEE J. Sel. Top. Quantum Electron. 2014, 20, 104–111. [Google Scholar] [CrossRef]
- Taimre, T.; Nikolić, M.; Bertling, K.; Lim, Y.L.; Bosch, T.; Rakić, A.D. Laser Feedback Interferometry: A Guide to the Self-Mixing Effect for Coherent Sensing. Adv. Opt. Photonics 2015, in press. [Google Scholar]
- Perchoux, J.; Quotb, A.; Atashkhooei, R.; Azcona, F.J.; Ramírez-Miquet, E.E.; Bernal, O.; Jha, A.; Luna-Arriaga, A.; Yanez, C.; Caum, J.; et al. Current Developments on Optical Feedback Interferometry as an All-Optical Sensor for Biomedical Applications. Sensors 2016, 16, 694. [Google Scholar] [CrossRef] [PubMed]
- Bearden, A.; O’Neill, M.P.; Osborne, L.C.; Wong, T.L. Imaging and vibrational analysis with laser-feedback interferometry. Opt. Lett. 1993, 18, 238–240. [Google Scholar] [CrossRef] [PubMed]
- Lu, C.H.; Wang, J.; Deng, K.L. Imaging and profiling surface microstructures with noninterferometric confocal laser feedback. Appl. Phys. Lett. 1995, 66, 2022–2024. [Google Scholar] [CrossRef]
- Lim, Y.L.; Kliese, R.; Bertling, K.; Tanimizu, K.; Jacobs, P.; Rakic, A.D. Self-mixing flow sensor using a monolithic VCSEL array with parallel readout. Opt. Express 2010, 18, 11720–11727. [Google Scholar] [PubMed]
- Campagnolo, L.; Nikolić, M.; Perchoux, J.; Lim, Y.L.; Bertling, K.; Loubiere, K.; Prat, L.; Rakić, A.D.; Bosch, T. Flow profile measurement in microchannel using the optical feedback interferometry sensing technique. Microfluid. Nanofluid. 2013, 14, 113–119. [Google Scholar] [CrossRef]
- Mowla, A.; Nikolic, M.; Lim, Y.L.; Bertling, K.; Rakic, A.D.; Taimre, T. Effect of the optical numerical aperture on the Doppler spectrum in laser Doppler velocimetry. In Proceedings of the 2014 IEEE Conference onOptoelectronic and Microelectronic Materials & Devices, Perth, Australia, 14–17 December 2014; pp. 72–74.
- Mowla, A.; Nikolić, M.; Taimre, T.; Tucker, J.R.; Lim, Y.L.; Bertling, K.; Rakić, A.D. Effect of the optical system on the Doppler spectrum in laser-feedback interferometry. Appl. Opt. 2015, 54, 18–26. [Google Scholar] [CrossRef] [PubMed]
- White, J. Reflecting on confocal microscopy: A personal perspective. Confocal Microsc. Methods Protoc. 2014, 1075, 1–7. [Google Scholar]
- Minsky, M. Memoir on inventing the confocal scanning microscope. Scanning 1988, 10, 128–138. [Google Scholar] [CrossRef]
- White, J.; Amos, W.; Fordham, M. An evaluation of confocal versus conventional imaging of biological structures by fluorescence light microscopy. J. Cell Biol. 1987, 105, 41–48. [Google Scholar] [CrossRef] [PubMed]
- Juškaitis, R.; Rea, N.; Wilson, T. Semiconductor laser confocal microscopy. Appl. Opt. 1994, 33, 578–584. [Google Scholar] [CrossRef] [PubMed]
- Wang, M.; Lai, G. Self-mixing microscopic interferometer for the measurement of microprofile. Opt. Commun. 2004, 238, 237–244. [Google Scholar] [CrossRef]
- Tan, Y.; Wang, W.; Xu, C.; Zhang, S. Laser confocal feedback tomography and nano-step height measurement. Sci. Rep. 2013, 3. [Google Scholar] [CrossRef] [PubMed]
- Mowla, A.; Taimre, T.; Lim, Y.L.; Bertling, K.; Wilson, S.J.; Prow, T.W.; Soyer, H.P.; Rakić, A.D. Diffuse reflectance imaging for non-melanoma skin cancer detection using laser feedback interferometry. Proc. SPIE 2016, 9887. [Google Scholar] [CrossRef]
- Michalzik, R. VCSELs: Fundamentals, Technology and Applications of Vertical-Cavity Surface-Emitting Lasers; Springer: Berlin, Germany, 2012; Volume 166. [Google Scholar]
- Albrecht, H.E. Laser Doppler and Phase Doppler Measurement Techniques; Springer: Berlin, Germany, 2003. [Google Scholar]
- Figueiras, E.; Oliveira, R.; Lourenço, C.F.; Campos, R.; Humeau-Heurtier, A.; Barbosa, R.M.; Laranjinha, J.; Ferreira, L.F.R.; de Mul, F.F. Self-mixing microprobe for monitoring microvascular perfusion in rat brain. Med. Biol. Eng. Comput. 2013, 51, 103–112. [Google Scholar] [CrossRef] [PubMed]
- Wang, L.; Jacques, S.L.; Zheng, L. MCML–Monte Carlo modeling of light transport in multi-layered tissues. Comput. Methods Progr. Biomed. 1995, 47, 131–146. [Google Scholar] [CrossRef]
- Tuchin, V. Tissue Optics: Light Scattering Methods and Instruments for Medical Diagnosis; SPIE Press: Bellingham, WA, USA, 2007. [Google Scholar]
- Kroese, D.P.; Taimre, T.; Botev, Z.I. Handbook of Monte Carlo Methods; John Wiley & Sons: Hoboken, NJ, USA, 2013; Volume 706. [Google Scholar]
- Tycho, A.; Jørgensen, T.M.; Yura, H.T.; Andersen, P.E. Derivation of a Monte Carlo method for modeling heterodyne detection in optical coherence tomography systems. Appl. Opt. 2002, 41, 6676–6691. [Google Scholar] [CrossRef] [PubMed]
- Fredriksson, I.; Larsson, M.; Strömberg, T. Optical microcirculatory skin model: Assessed by Monte Carlo simulations paired with in vivo laser Doppler flowmetry. J. Biomed. Opt. 2008, 13, 014015. [Google Scholar] [CrossRef] [PubMed]
- Hale, G.M.; Querry, M.R. Optical constants of water in the 200-nm to 200-μm wavelength region. Appl. Opt. 1973, 12, 555–563. [Google Scholar] [CrossRef] [PubMed]
- Hammer, M.; Yaroslavsky, A.N.; Schweitzer, D. A scattering phase function for blood with physiological haematocrit. Phys. Med. Biol. 2001, 46. [Google Scholar] [CrossRef]
- Feng, X.; Patel, R.; Yaroslavsky, A.N. Wavelength optimized cross-polarized wide-field imaging for noninvasive and rapid evaluation of dermal structures. J. Biophotonics 2015, 8, 324–331. [Google Scholar] [CrossRef] [PubMed]
- Jacques, S.L. Skin optics. Or. Med. Laser Center News 1998, 1998, 1–9. [Google Scholar]
- Mowla, A.; Taimre, T.; Lim, Y.L.; Bertling, K.; Wilson, S.J.; Prow, T.W.; Rakić, A.D. A Compact Laser Imaging System for Concurrent Reflectance Confocal Microscopy and Laser Doppler Flowmetry. IEEE Photonics J. 2016, in press. [Google Scholar] [CrossRef]
- De Mul, F.; Koelink, M.; Weijers, A.; Greve, J.; Aarnoudse, J.; Graaff, R.; Dassel, A. Self-mixing laser-Doppler velocimetry of liquid flow and of blood perfusion in tissue. Appl. Opt. 1992, 31, 5844–5851. [Google Scholar] [CrossRef] [PubMed]
- Matharu, R.S.; Perchoux, J.; Kliese, R.; Lim, Y.L.; Rakić, A.D. Maintaining maximum signal-to-noise ratio in uncooled vertical-cavity surface-emitting laser-based self-mixing sensors. Opt. Lett. 2011, 36, 3690–3692. [Google Scholar] [CrossRef] [PubMed]
- Flock, S.T.; Jacques, S.L.; Wilson, B.C.; Star, W.M.; van Gemert, M.J. Optical properties of Intralipid: A phantom medium for light propagation studies. Lasers Surg. Med. 1992, 12, 510–519. [Google Scholar] [CrossRef] [PubMed]
- Cubeddu, R.; Pifferi, A.; Taroni, P.; Torricelli, A.; Valentini, G. A solid tissue phantom for photon migration studies. Phys. Med. Biol. 1997, 42. [Google Scholar] [CrossRef]
- Bertling, K.; Taimre, T.; Agnew, G.; Lim, Y.L.; Dean, P.; Indjin, D.; Höfling, S.; Weih, R.; Kamp, M.; von Edlinger, M.; et al. Simple electrical modulation scheme for laser feedback imaging. IEEE Sens. J. 2016, 16, 1937–1942. [Google Scholar] [CrossRef]
- Marchesini, R.; Brambilla, M.; Clemente, C.; Maniezzo, M.; Sichirollo, A.E.; Testori, A.; Venturoli, D.R.; Cascinelli, N. In vivo spectrophotometric evaluation of neoplastic and non-neoplastic skin pigmented lesions–I. reflectance measurements. Photochem. Photobiol. 1991, 53, 77–84. [Google Scholar] [CrossRef] [PubMed]
- Tomatis, S.; Bartoli, C.; Bono, A.; Cascinelli, N.; Clemente, C.; Marchesini, R. Spectrophotometric imaging of cutaneous pigmented lesions: Discriminant analysis, optical properties and histological characteristics. J. Photochem. Photobiol. B Biol. 1998, 42, 32–39. [Google Scholar] [CrossRef]
- Zonios, G.; Dimou, A. Modeling diffuse reflectance from semi-infinite turbid media: Application to the study of skin optical properties. Opt. Express 2006, 14, 8661–8674. [Google Scholar] [CrossRef] [PubMed]
- Zonios, G.; Dimou, A.; Bassukas, I.; Galaris, D.; Tsolakidis, A.; Kaxiras, E. Melanin absorption spectroscopy: New method for noninvasive skin investigation and melanoma detection. J. Biomed. Opt. 2008, 13. [Google Scholar] [CrossRef] [PubMed]
- Zonios, G.; Dimou, A.; Carrara, M.; Marchesini, R. In vivo optical properties of melanocytic skin lesions: Common nevi, dysplastic nevi and malignant melanoma. Photochem. Photobiol. 2010, 86, 236–240. [Google Scholar] [CrossRef] [PubMed]
- Garcia-Uribe, A.; Smith, E.B.; Zou, J.; Duvic, M.; Prieto, V.; Wang, L.V. In-vivo characterization of optical properties of pigmented skin lesions including melanoma using oblique incidence diffuse reflectance spectrometry. J. Biomed. Opt. 2011, 16. [Google Scholar] [CrossRef] [PubMed]
- Garcia-Uribe, A.; Zou, J.; Duvic, M.; Cho-Vega, J.H.; Prieto, V.G.; Wang, L.V. In vivo diagnosis of melanoma and nonmelanoma skin cancer using oblique incidence diffuse reflectance spectrometry. Cancer Res. 2012, 72, 2738–2745. [Google Scholar] [CrossRef] [PubMed]
- Jorgensen, P.; Edgington, N.P.; Schneider, B.L.; Rupeš, I.; Tyers, M.; Futcher, B. The size of the nucleus increases as yeast cells grow. Mol. Biol. Cell 2007, 18, 3523–3532. [Google Scholar] [CrossRef] [PubMed]
- Slater, D.; Rice, S.; Stewart, R.; Melling, S.; Hewer, E.; Smith, J. Proposed Sheffield quantitative criteria in cervical cytology to assist the grading of squamous cell dyskaryosis, as the British Society for Clinical Cytology definitions require amendment. Cytopathology 2005, 16, 179–192. [Google Scholar] [CrossRef] [PubMed]
- Sober, A.J.; Burstein, J.M. Precursors to skin cancer. Cancer 1995, 75, 645–650. [Google Scholar] [CrossRef]
- Schwartz, R.; Bridges, T.; Butani, A.; Ehrlich, A. Actinic keratosis: An occupational and environmental disorder. J. Eur. Acad. Dermatol. Venereol. 2008, 22, 606–615. [Google Scholar] [CrossRef] [PubMed]
- Lacour, J. Carcinogenesis of basal cell carcinomas: Genetics and molecular mechanisms. Br. J. Dermatol. 2002, 146, 17–19. [Google Scholar] [CrossRef] [PubMed]
- Slaughter, D.P.; Southwick, H.W.; Smejkal, W. Field cancerization in oral stratified squamous epithelium. Clinical implications of multicentric origin. Cancer 1953, 6, 963–968. [Google Scholar] [CrossRef]
- Kanjilal, S.; Strom, S.S.; Clayman, G.L.; Weber, R.S.; El-Naggar, A.K.; Kapur, V.; Cummings, K.K.; Hill, L.A.; Spitz, M.R.; Kripke, M.L.; et al. p53 mutations in nonmelanoma skin cancer of the head and neck: Molecular evidence for field cancerization. Cancer Res. 1995, 55, 3604–3609. [Google Scholar] [PubMed]
- Elbaum, M.; Kopf, A.W.; Rabinovitz, H.S.; Langley, R.G.; Kamino, H.; Mihm, M.C.; Sober, A.J.; Peck, G.L.; Bogdan, A.; Gutkowicz-Krusin, D.; et al. Automatic differentiation of melanoma from melanocytic nevi with multispectral digital dermoscopy: A feasibility study. J. Am. Acad. Dermatol. 2001, 44, 207–218. [Google Scholar] [CrossRef] [PubMed]
- Incel, P.; Gurel, M.; Erdemir, A. Vascular patterns of non-pigmented tumoural skin lesions: Confocal perspectives. Skin Res. Technol. 2015, 21, 333–339. [Google Scholar] [CrossRef] [PubMed]
- Yaroslavsky, A.N.; Neel, V.; Anderson, R.R. Demarcation of nonmelanoma skin cancer margins in thick excisions using multispectral polarized light imaging. J. Investig. Dermatol. 2003, 121, 259–266. [Google Scholar] [CrossRef] [PubMed]
- Marks, R.; Edwards, C. The measurement of photodamage. Br. J. Dermatol. 1992, 127, 7–13. [Google Scholar] [CrossRef] [PubMed]
- Calzavara-Pinton, P.; Longo, C.; Venturini, M.; Sala, R.; Pellacani, G. Reflectance confocal microscopy for in vivo skin imaging. Photochem. Photobiol. 2008, 84, 1421–1430. [Google Scholar] [CrossRef] [PubMed]


| Layers Top to Bottom | Epidermis | Papillary Dermis | Superior Blood Net | Reticular Dermis | Inferior Blood Net | Subcutis Subcutis |
|---|---|---|---|---|---|---|
| 0.3-mm/s blood concentration (%) | 0 | 0.2 | 0.6 | 0.1 | 0.25 | 0.1 |
| 3.0-mm/s blood concentration (%) | 0 | 0 | 0.05 | 0.01 | 0.035 | 0.01 |
| 30-mm/s blood concentration (%) | 0 | 0 | 0.001 | 0.0006 | 0.006 | 0.001 |
| Melanin concentration (%) | 2.0 | 0 | 0 | 0 | 0 | 0 |
| Thickness (mm) | 0.075 | 0.15 | 0.15 | 0.8 | 0.4 | 2 |
| bloodless melanin-less (mm−1) | 23 | 13 | 13 | 13 | 13 | 13 |
| bloodless melanin-less (mm−1) | 0.1 | 0.1 | 0.1 | 0.1 | 0.1 | 0.1 |
| Refractive index | 1.4 | 1.4 | 1.4 | 1.4 | 1.4 | 1.4 |
© 2016 by the authors; licensee MDPI, Basel, Switzerland. This article is an open access article distributed under the terms and conditions of the Creative Commons Attribution (CC-BY) license (http://creativecommons.org/licenses/by/4.0/).
Share and Cite
Mowla, A.; Taimre, T.; Lim, Y.L.; Bertling, K.; Wilson, S.J.; Prow, T.W.; Soyer, H.P.; Rakić, A.D. Concurrent Reflectance Confocal Microscopy and Laser Doppler Flowmetry to Improve Skin Cancer Imaging: A Monte Carlo Model and Experimental Validation. Sensors 2016, 16, 1411. https://doi.org/10.3390/s16091411
Mowla A, Taimre T, Lim YL, Bertling K, Wilson SJ, Prow TW, Soyer HP, Rakić AD. Concurrent Reflectance Confocal Microscopy and Laser Doppler Flowmetry to Improve Skin Cancer Imaging: A Monte Carlo Model and Experimental Validation. Sensors. 2016; 16(9):1411. https://doi.org/10.3390/s16091411
Chicago/Turabian StyleMowla, Alireza, Thomas Taimre, Yah Leng Lim, Karl Bertling, Stephen J. Wilson, Tarl W. Prow, H. Peter Soyer, and Aleksandar D. Rakić. 2016. "Concurrent Reflectance Confocal Microscopy and Laser Doppler Flowmetry to Improve Skin Cancer Imaging: A Monte Carlo Model and Experimental Validation" Sensors 16, no. 9: 1411. https://doi.org/10.3390/s16091411
APA StyleMowla, A., Taimre, T., Lim, Y. L., Bertling, K., Wilson, S. J., Prow, T. W., Soyer, H. P., & Rakić, A. D. (2016). Concurrent Reflectance Confocal Microscopy and Laser Doppler Flowmetry to Improve Skin Cancer Imaging: A Monte Carlo Model and Experimental Validation. Sensors, 16(9), 1411. https://doi.org/10.3390/s16091411