3.1. Distribution of Measured Prestress Force
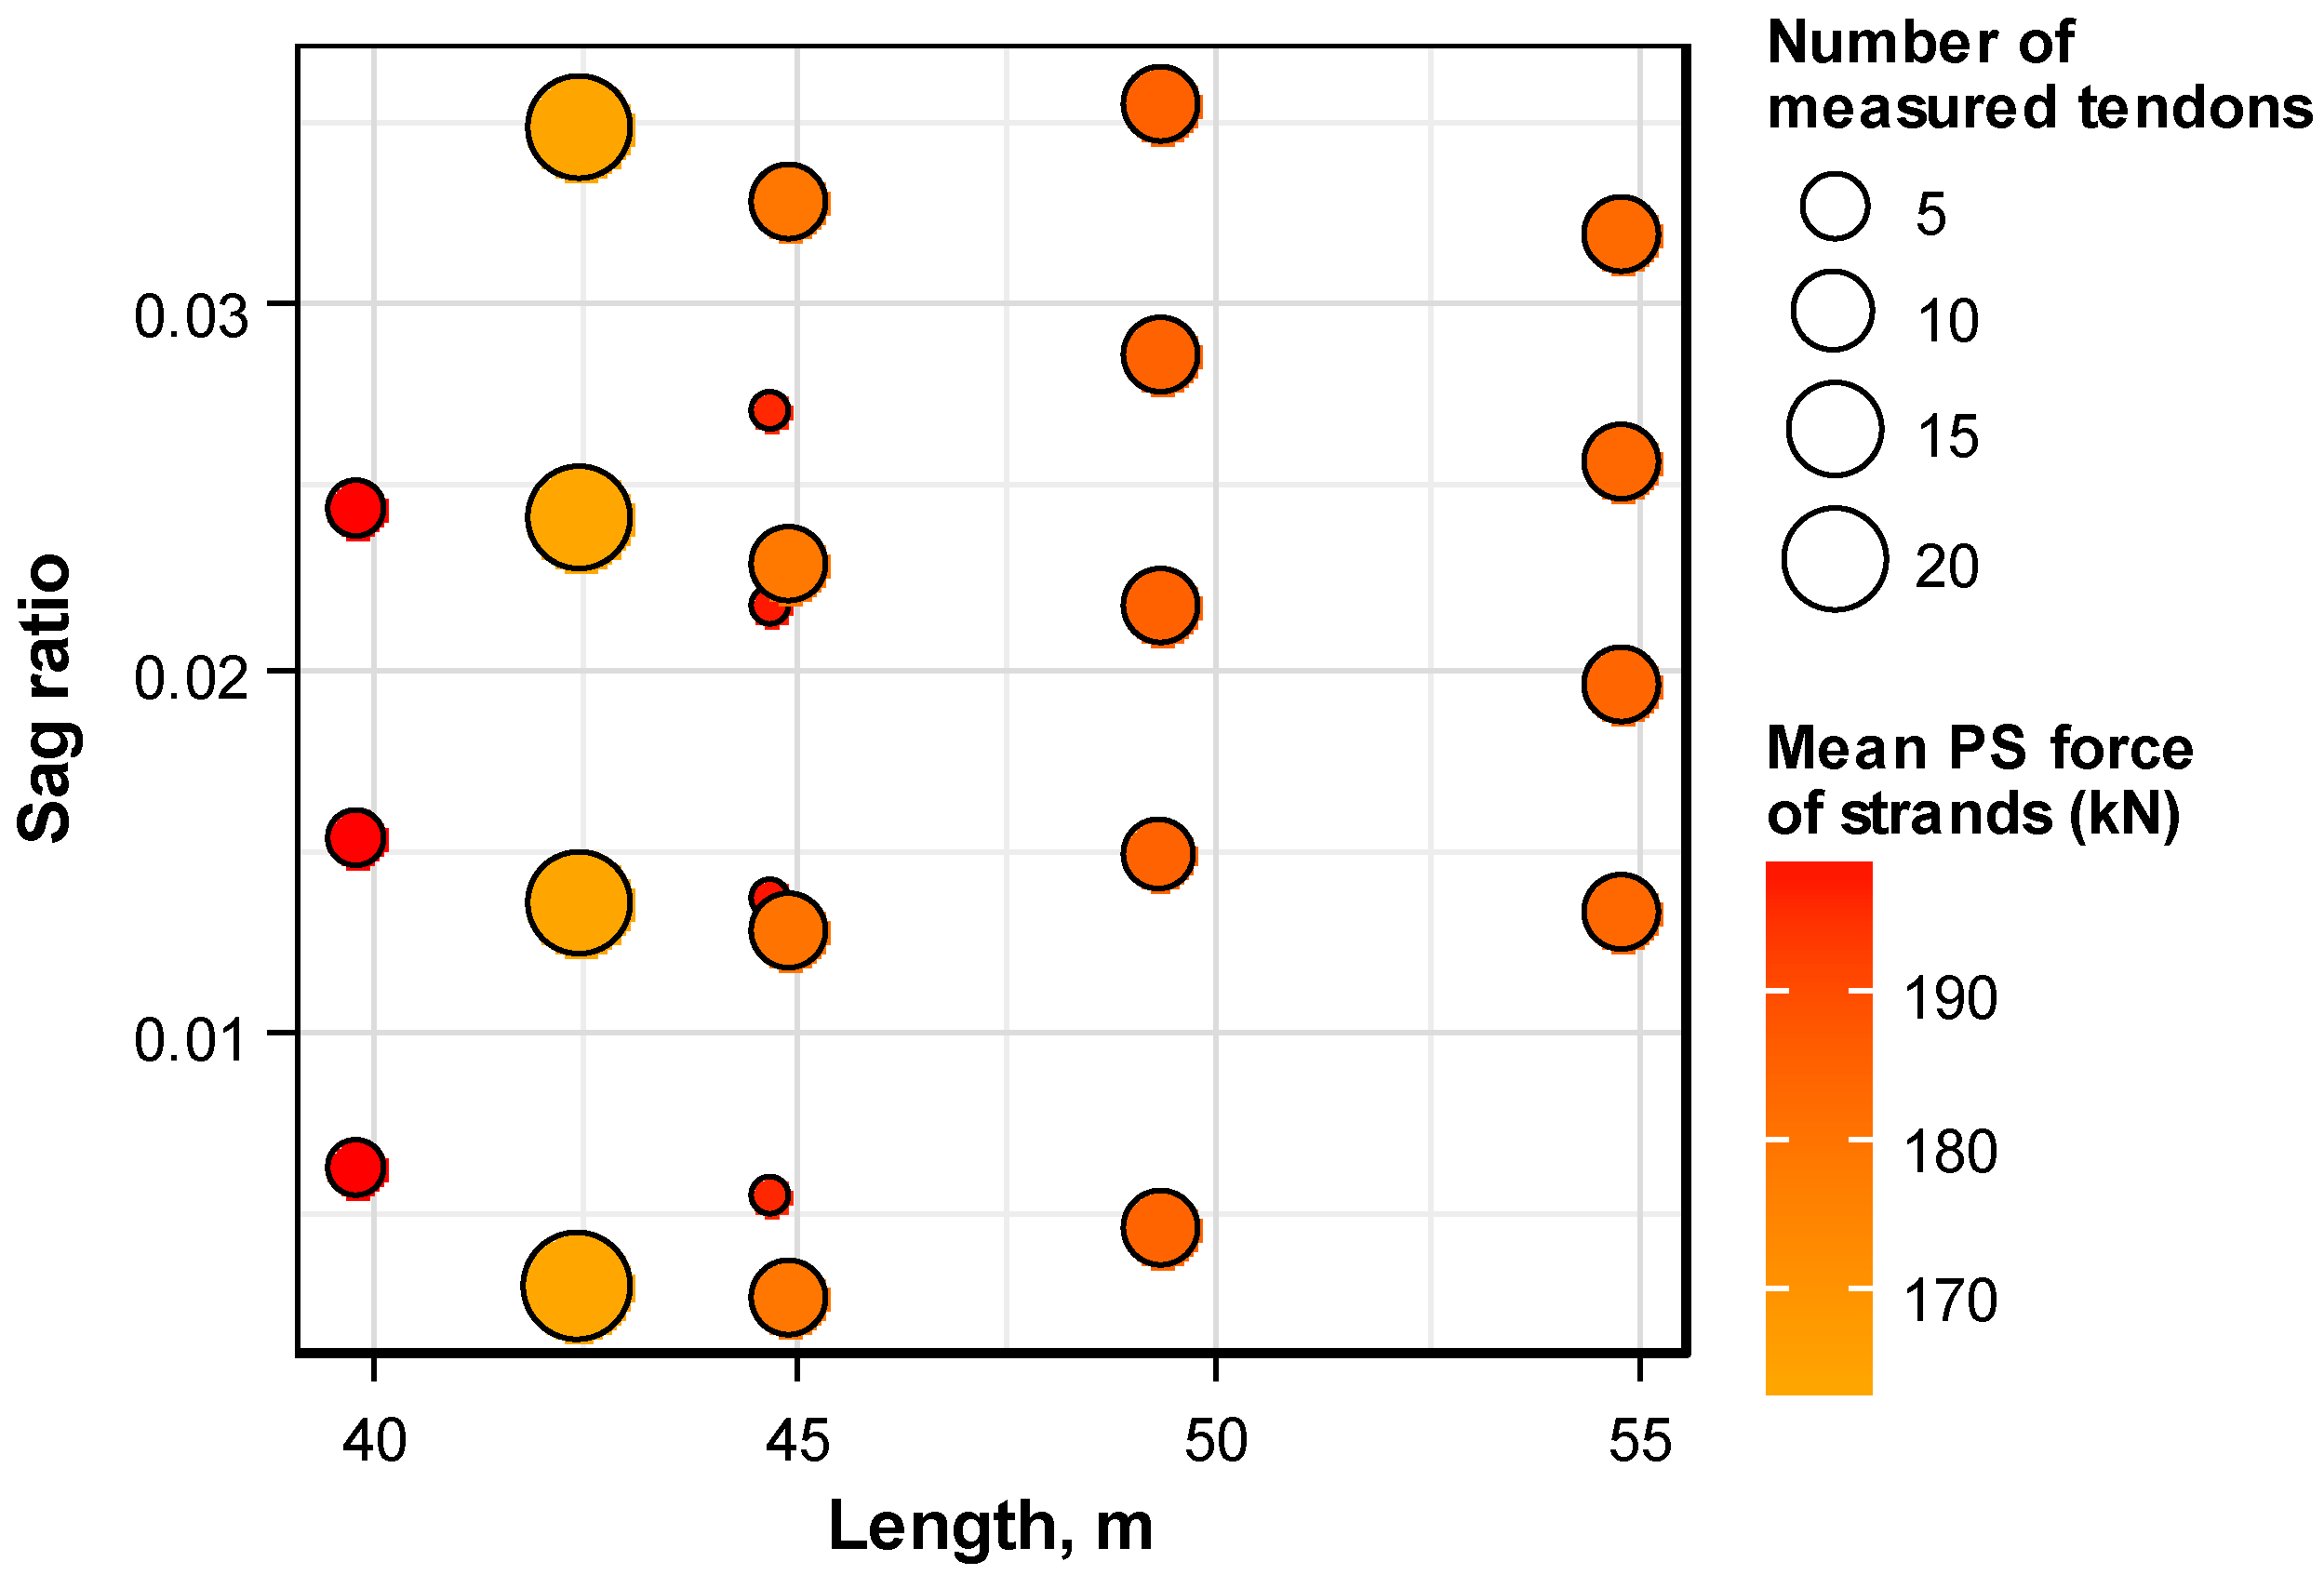
The last two columns of
Table 1 arrange the mean of the mean prestress forces and the mean of the standard deviation of the prestress forces per anchor head by classifying the whole sets of measured data with respect to the girder length and tendon sag ratio. The distributions of the mean prestress force per anchor head have means ranging between 164 kN and 200 kN, and standard deviations ranging between 5.1 kN and 8.4 kN.
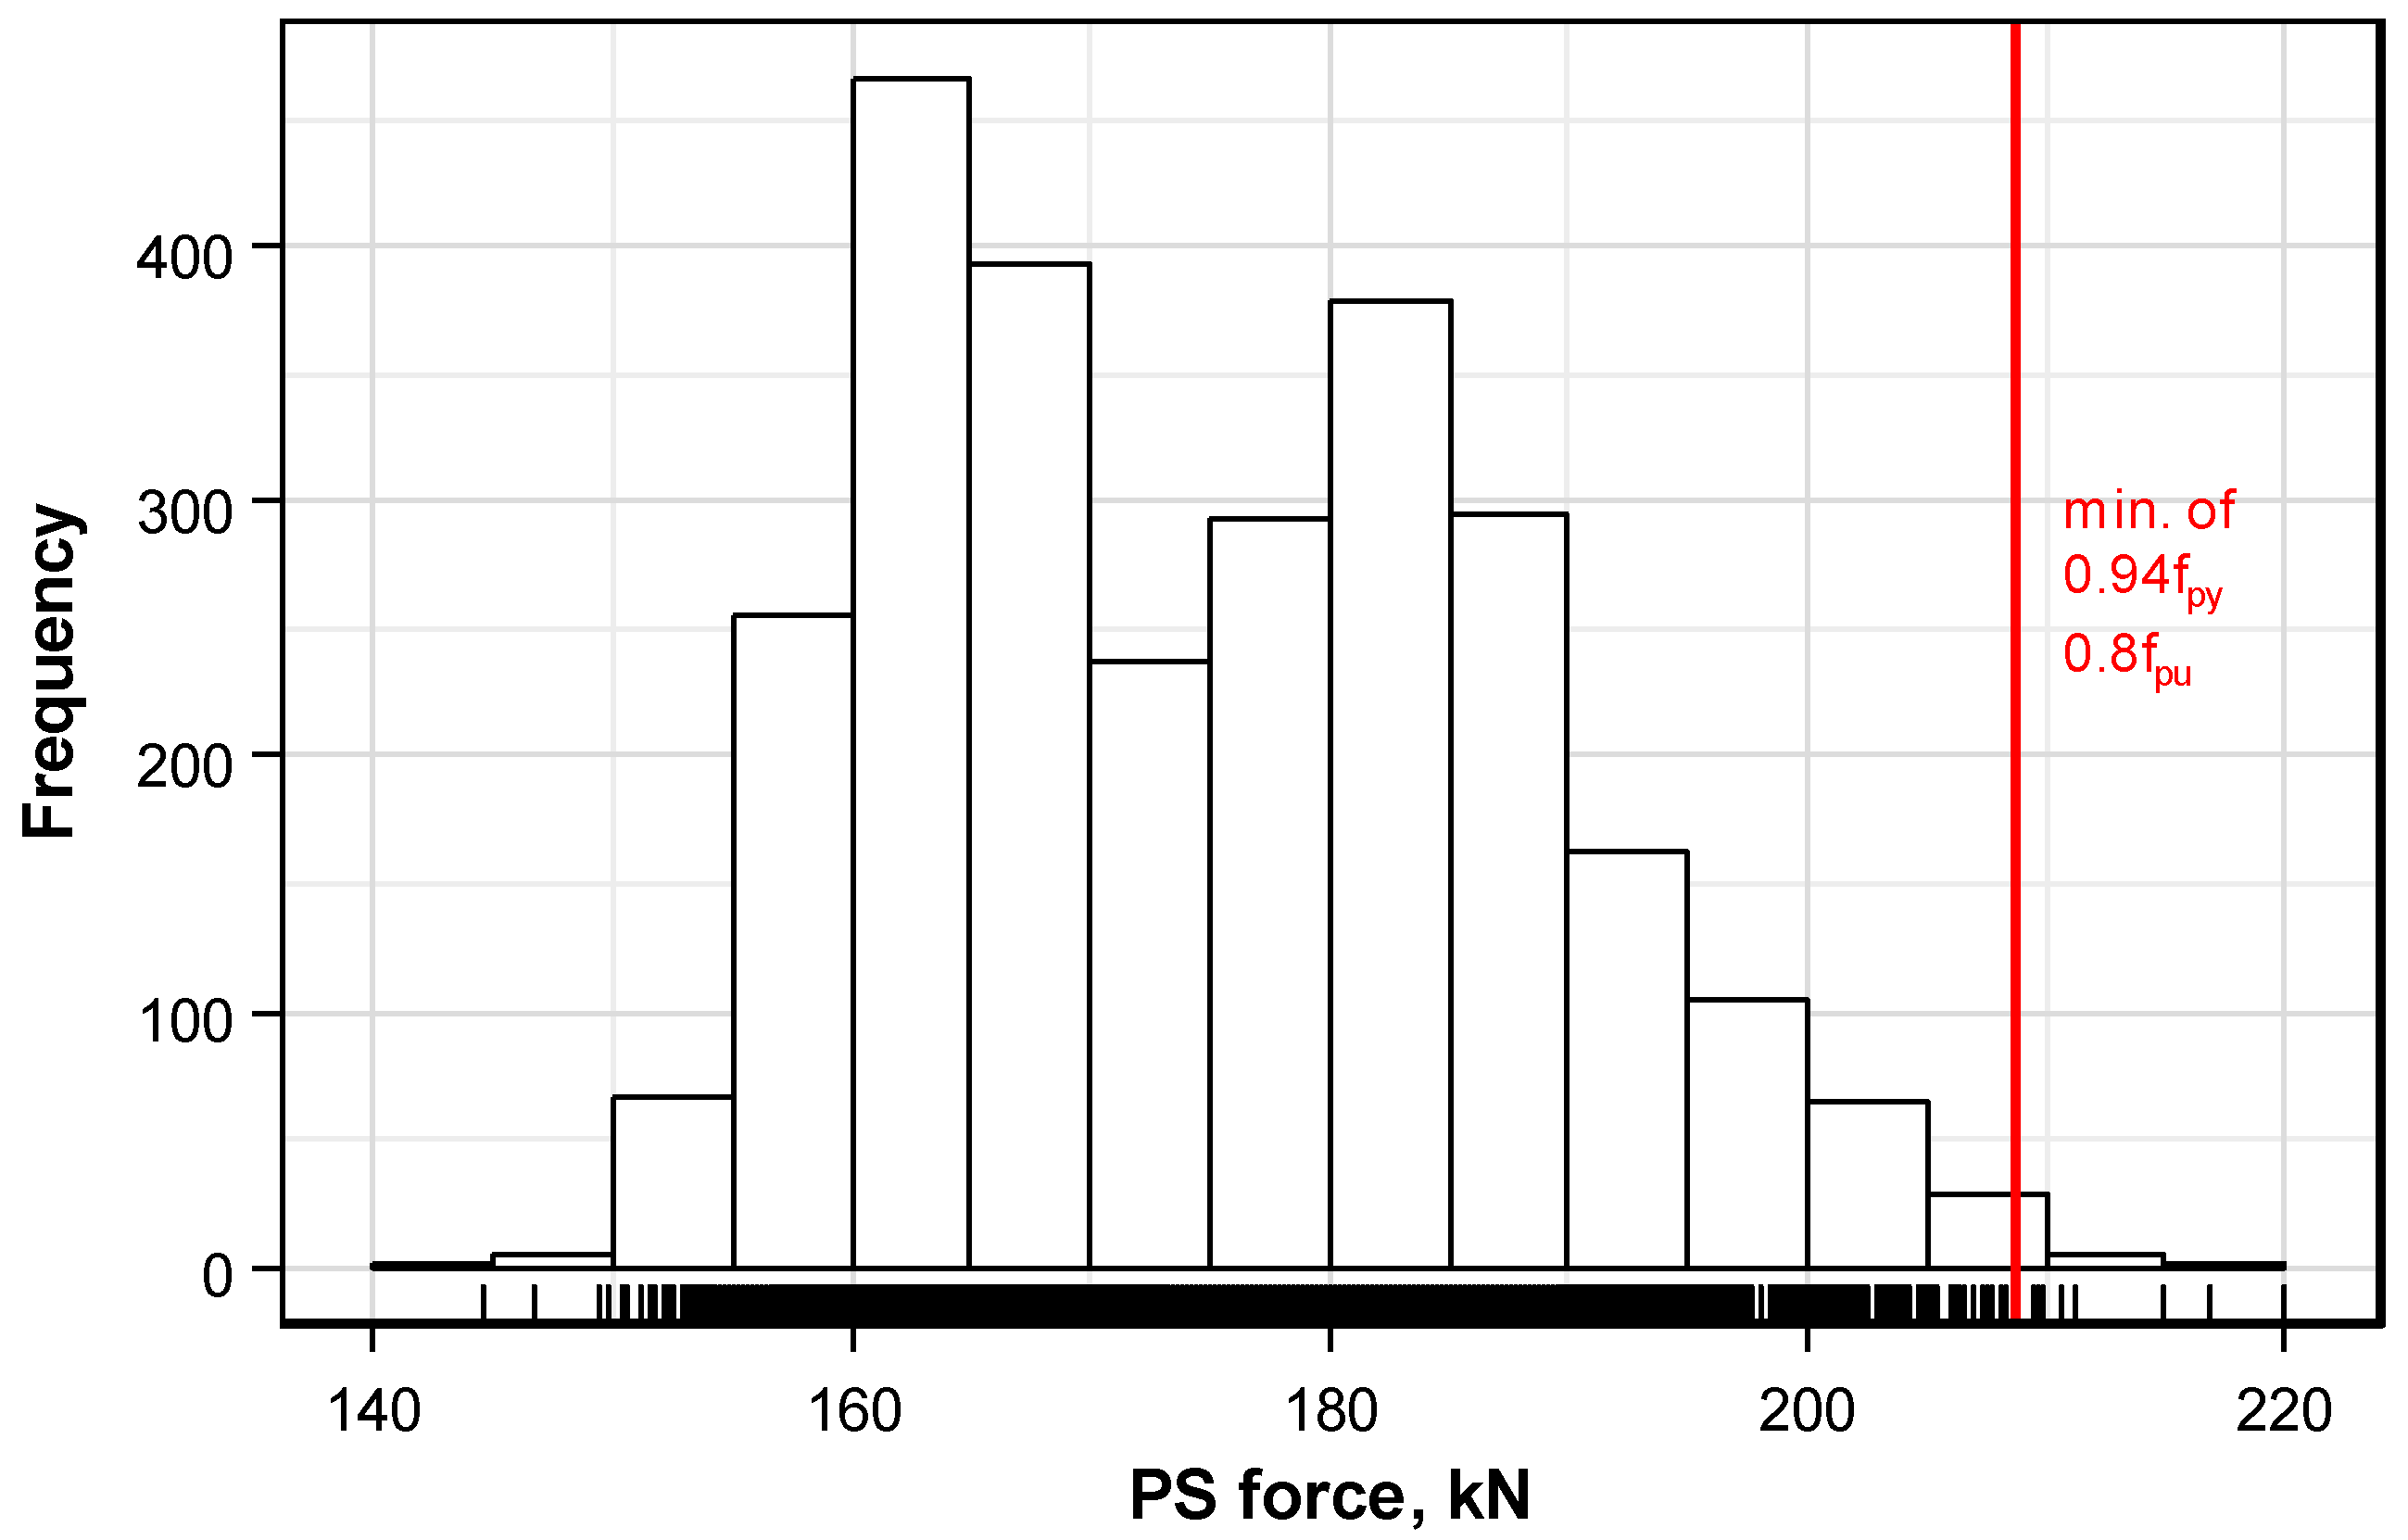
Figure 6 plots the frequency histogram of the prestress force distribution measured on the whole set of strands. The prestress force per strand ranging between 144 kN and 220 kN is seen to cover a wider range than the mean of the prestress force per anchor head.
ACI 318-14 [
9] limits the maximum tensile stress of the tendon due to jacking force during prestressing to a value below
(where
= yield strength),
(where
= ultimate strength), and a proposed value by the manufacturer. With a yield strength of 234.6 kN and ultimate strength 261 kN for a Grade 270 (1860) strand with a diameter of 15.2 mm, as specified in ASTM 416/416M [
10], gives a maximum limit stress of 208.8 kN for the strand. However, as shown in
Figure 6, some strands exceed this stress limitation. Even if the overall average of the mean prestress force per anchor head does not exceed the criterion, the prestress force of some individual strands exceeds the limit stress criterion. Accordingly, it is necessary to limit the mean prestress force to a level that prevents the exceedance of the maximum limit per anchor head to solve this problem.
Since the histogram of the prestress force shown in
Figure 6 may exhibit various distributions according to the level of the design prestress force, the prestress force per anchor head is decomposed as follows in order to exclude the influence of the design prestress force.
where
, the prestress force of
ith strand in the anchor, is expressed as the sum of the mean prestress force per anchor head,
, and the residual prestress force of the strand,
.
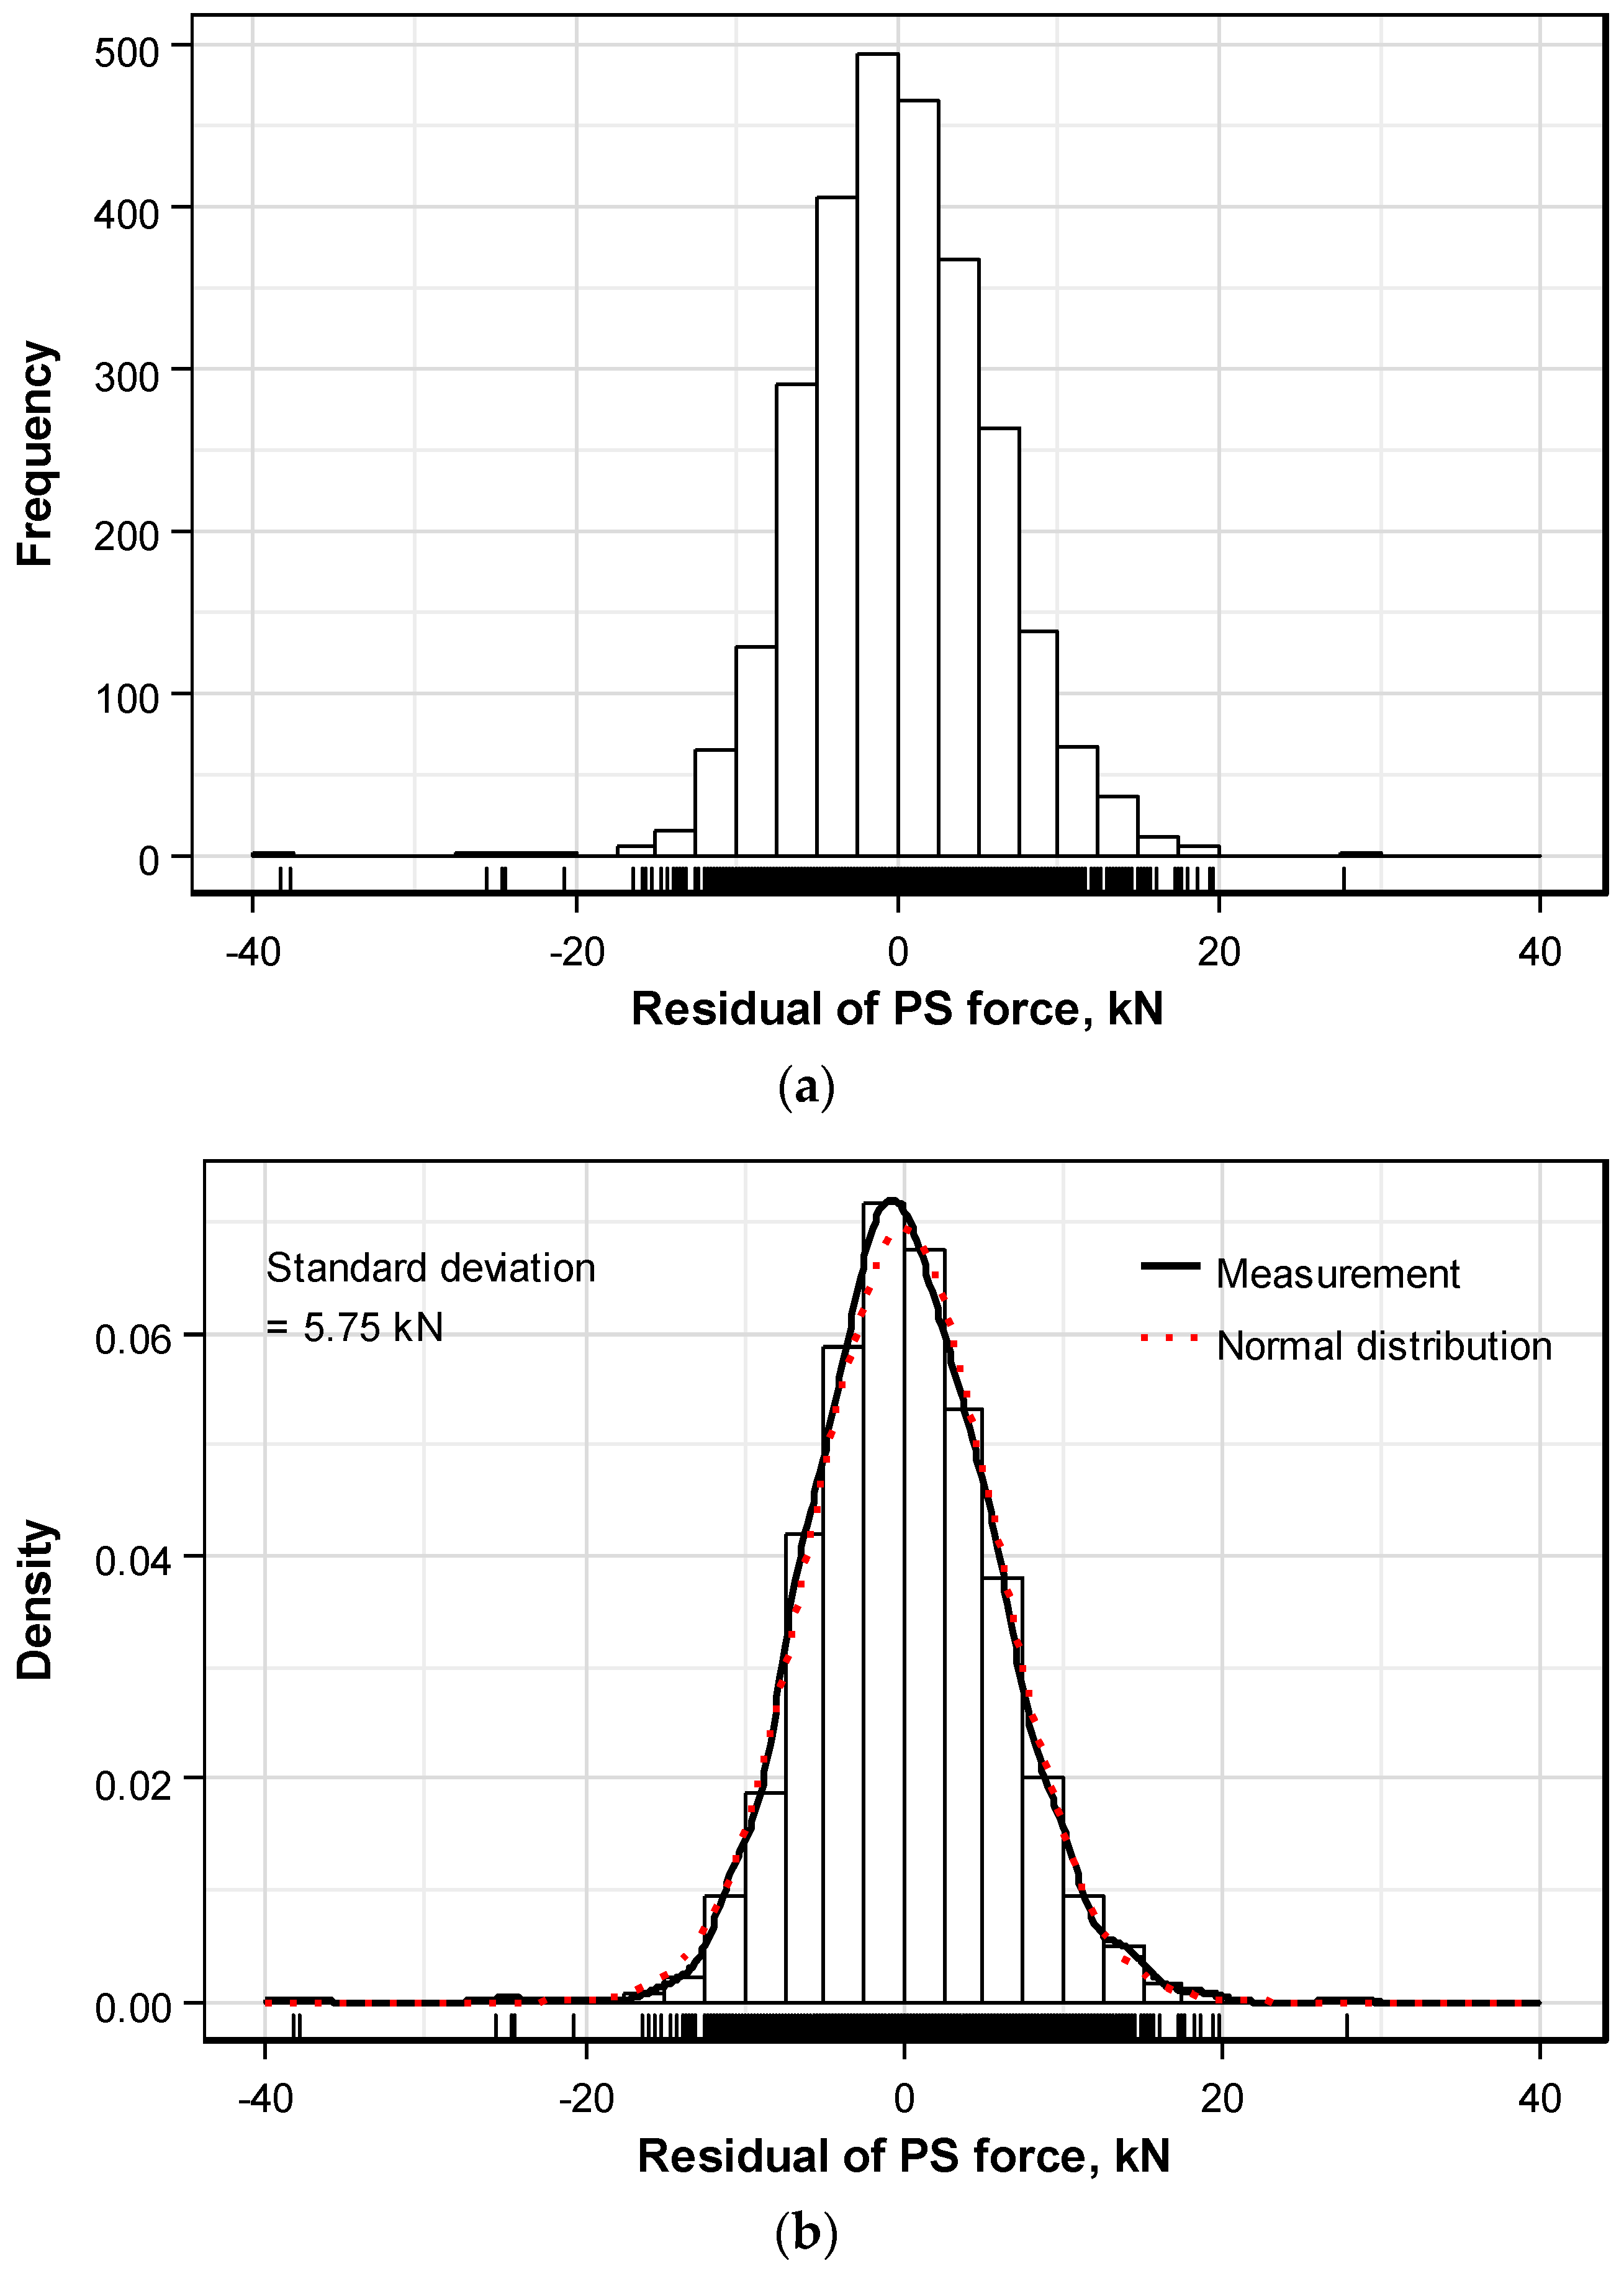
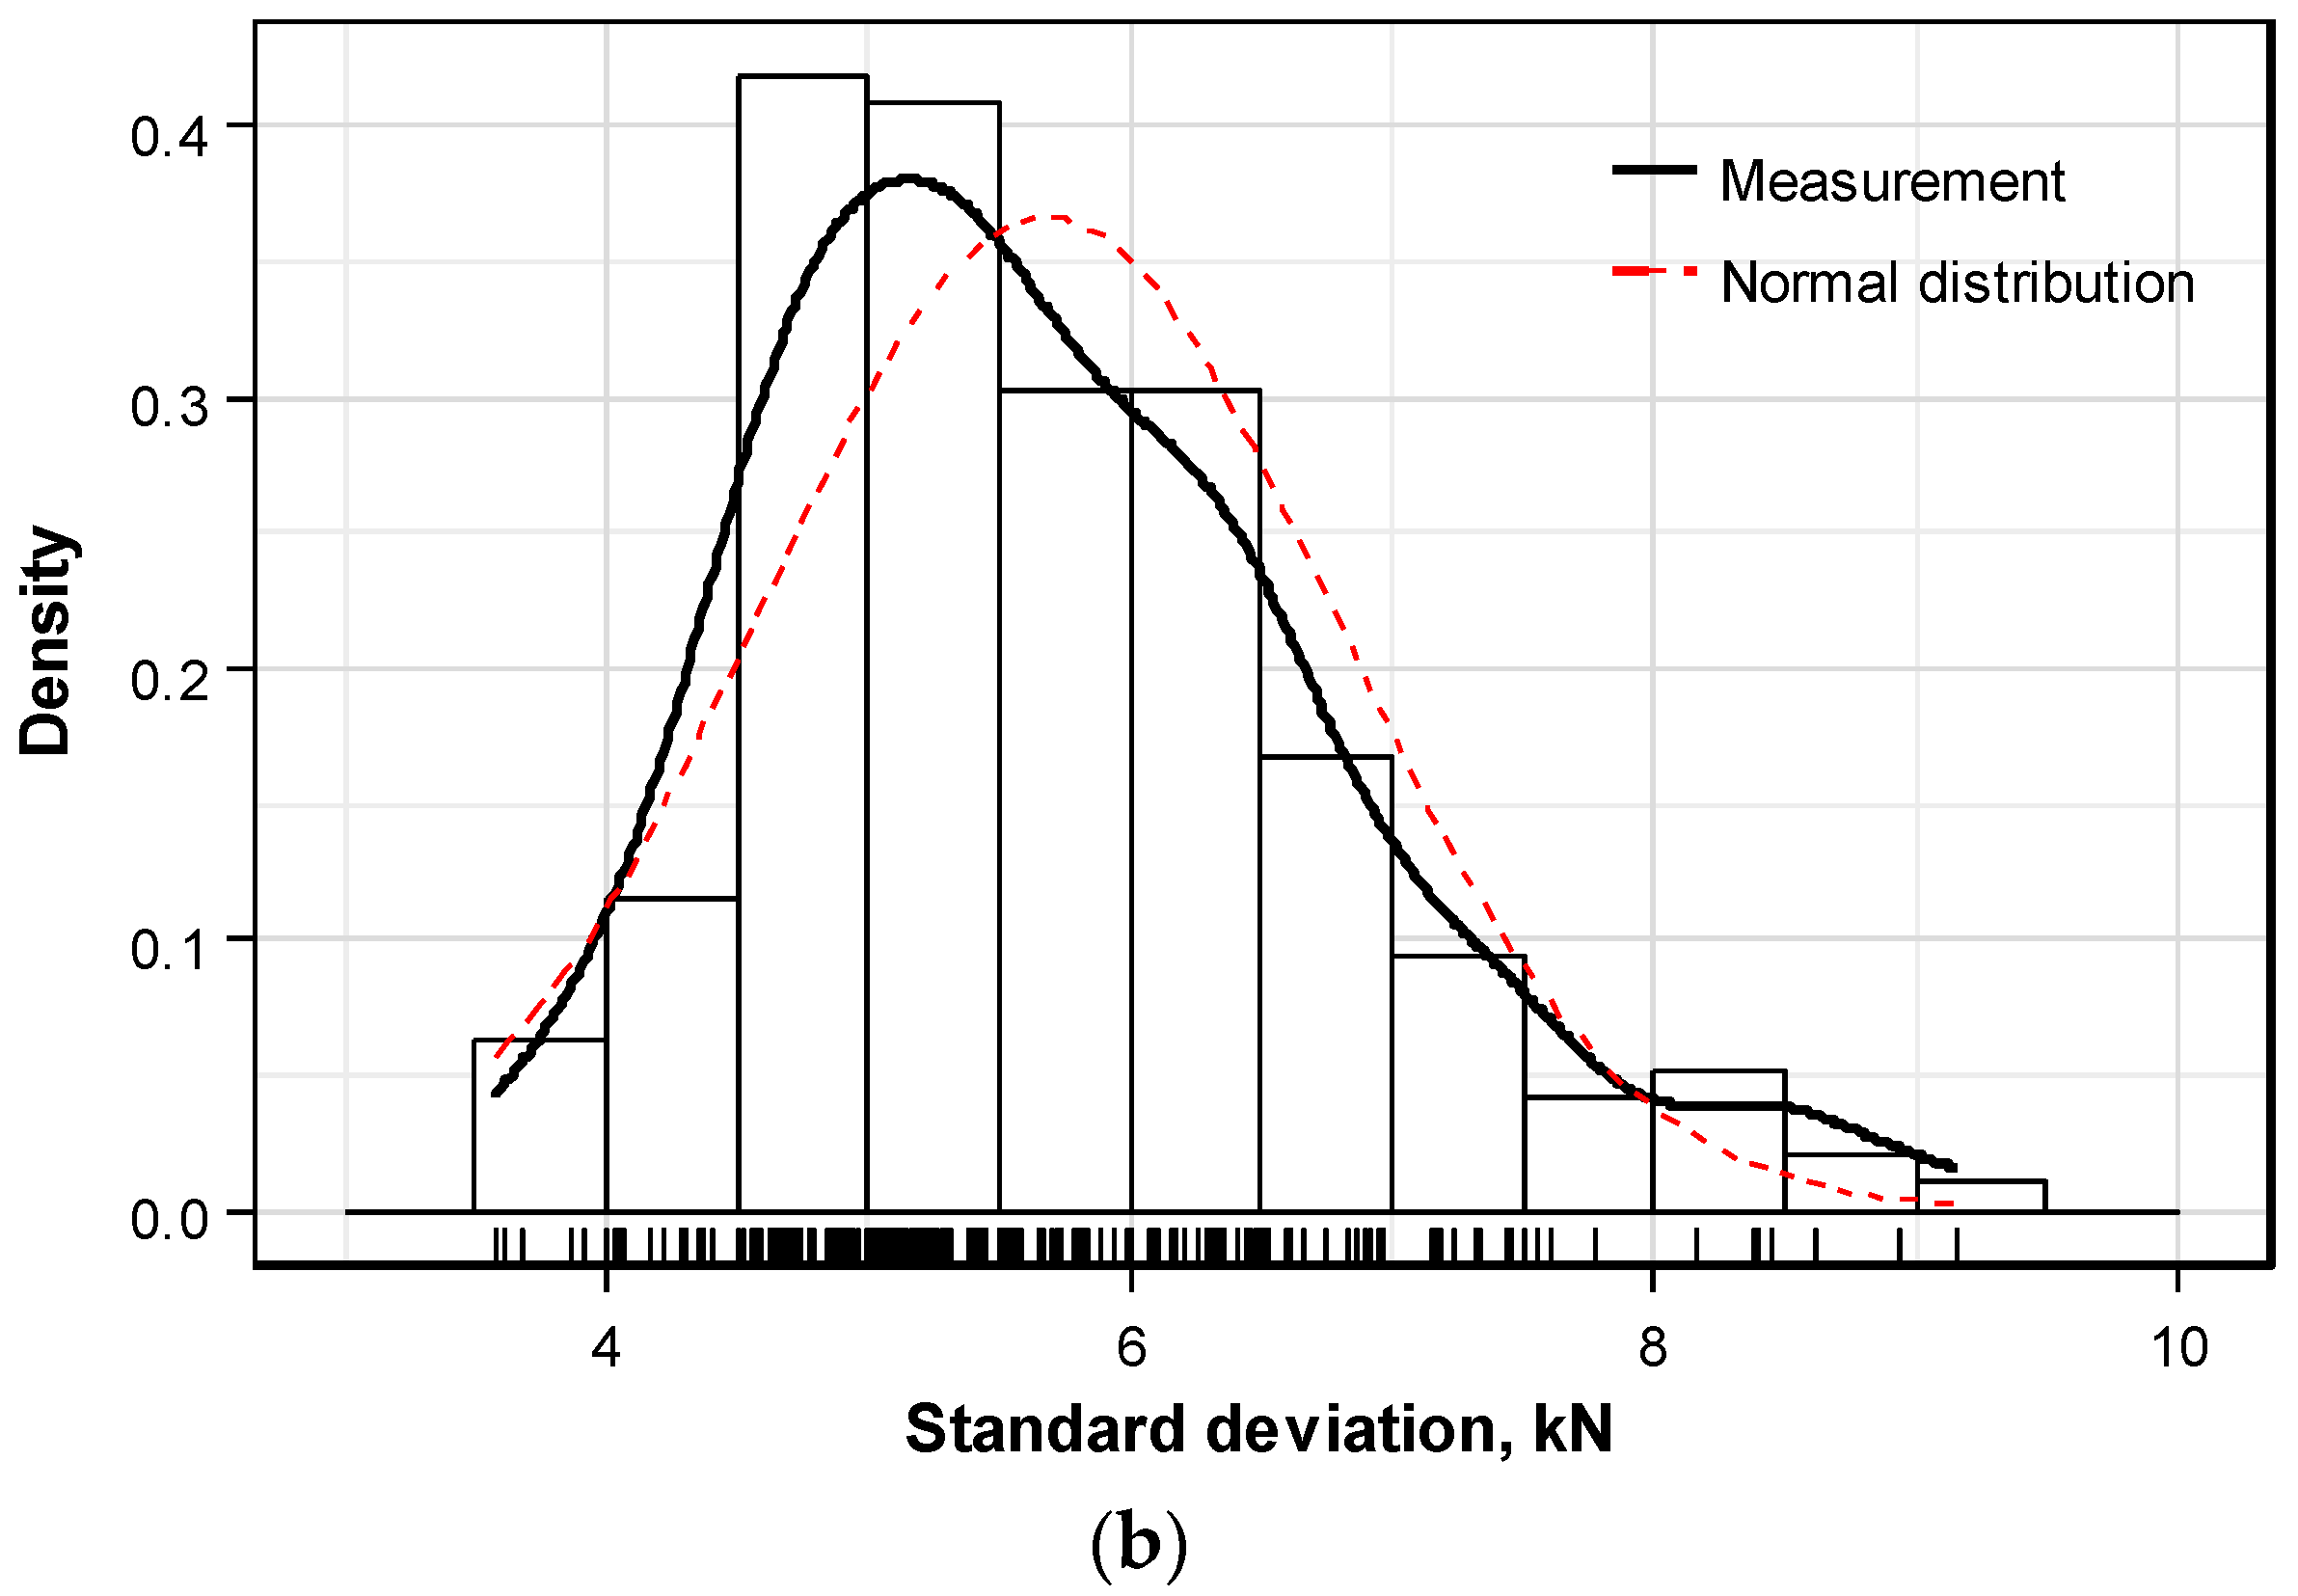
Figure 7 redraws
Figure 6 in term of the residual prestress force from which the influence of the mean prestress force is removed.
Figure 7a represents the frequency distribution and
Figure 7b compares the density distribution and normal distribution, where the normal distribution is drawn for a mean of 0 kN and standard deviation of 5.75 kN of the residual prestress force. Since both density distribution and normal distribution are in good agreement, the distribution of the measured prestress force can be assumed to follow the normal distribution. However, this assumption relates to the distribution of the prestress force of individual strands and does not mean that the distribution of the prestress force per anchor head is normal.
3.2. Test for Normality
The previous section dealt with the distribution pattern of the prestress force relative to the whole set of the 2761 measured strands. On the other hand, the present section intends to examine the distribution pattern of the prestress force by limiting the scope to the anchor head. First, normality test is conducted to determine if the distribution pattern of the prestress force per anchor head follows the normal distribution for the whole set of anchors.
The number of strands per anchor runs around 13–16, which constitutes a relatively small number of samples. As a matter of fact, it is rather difficult to test accurately the normality of a distribution using a small number of samples. Therefore, the Shapiro-Wilk test [
11] is selected here for the normality check owing to the relatively high accuracy provided by this method for a small number of samples [
12].
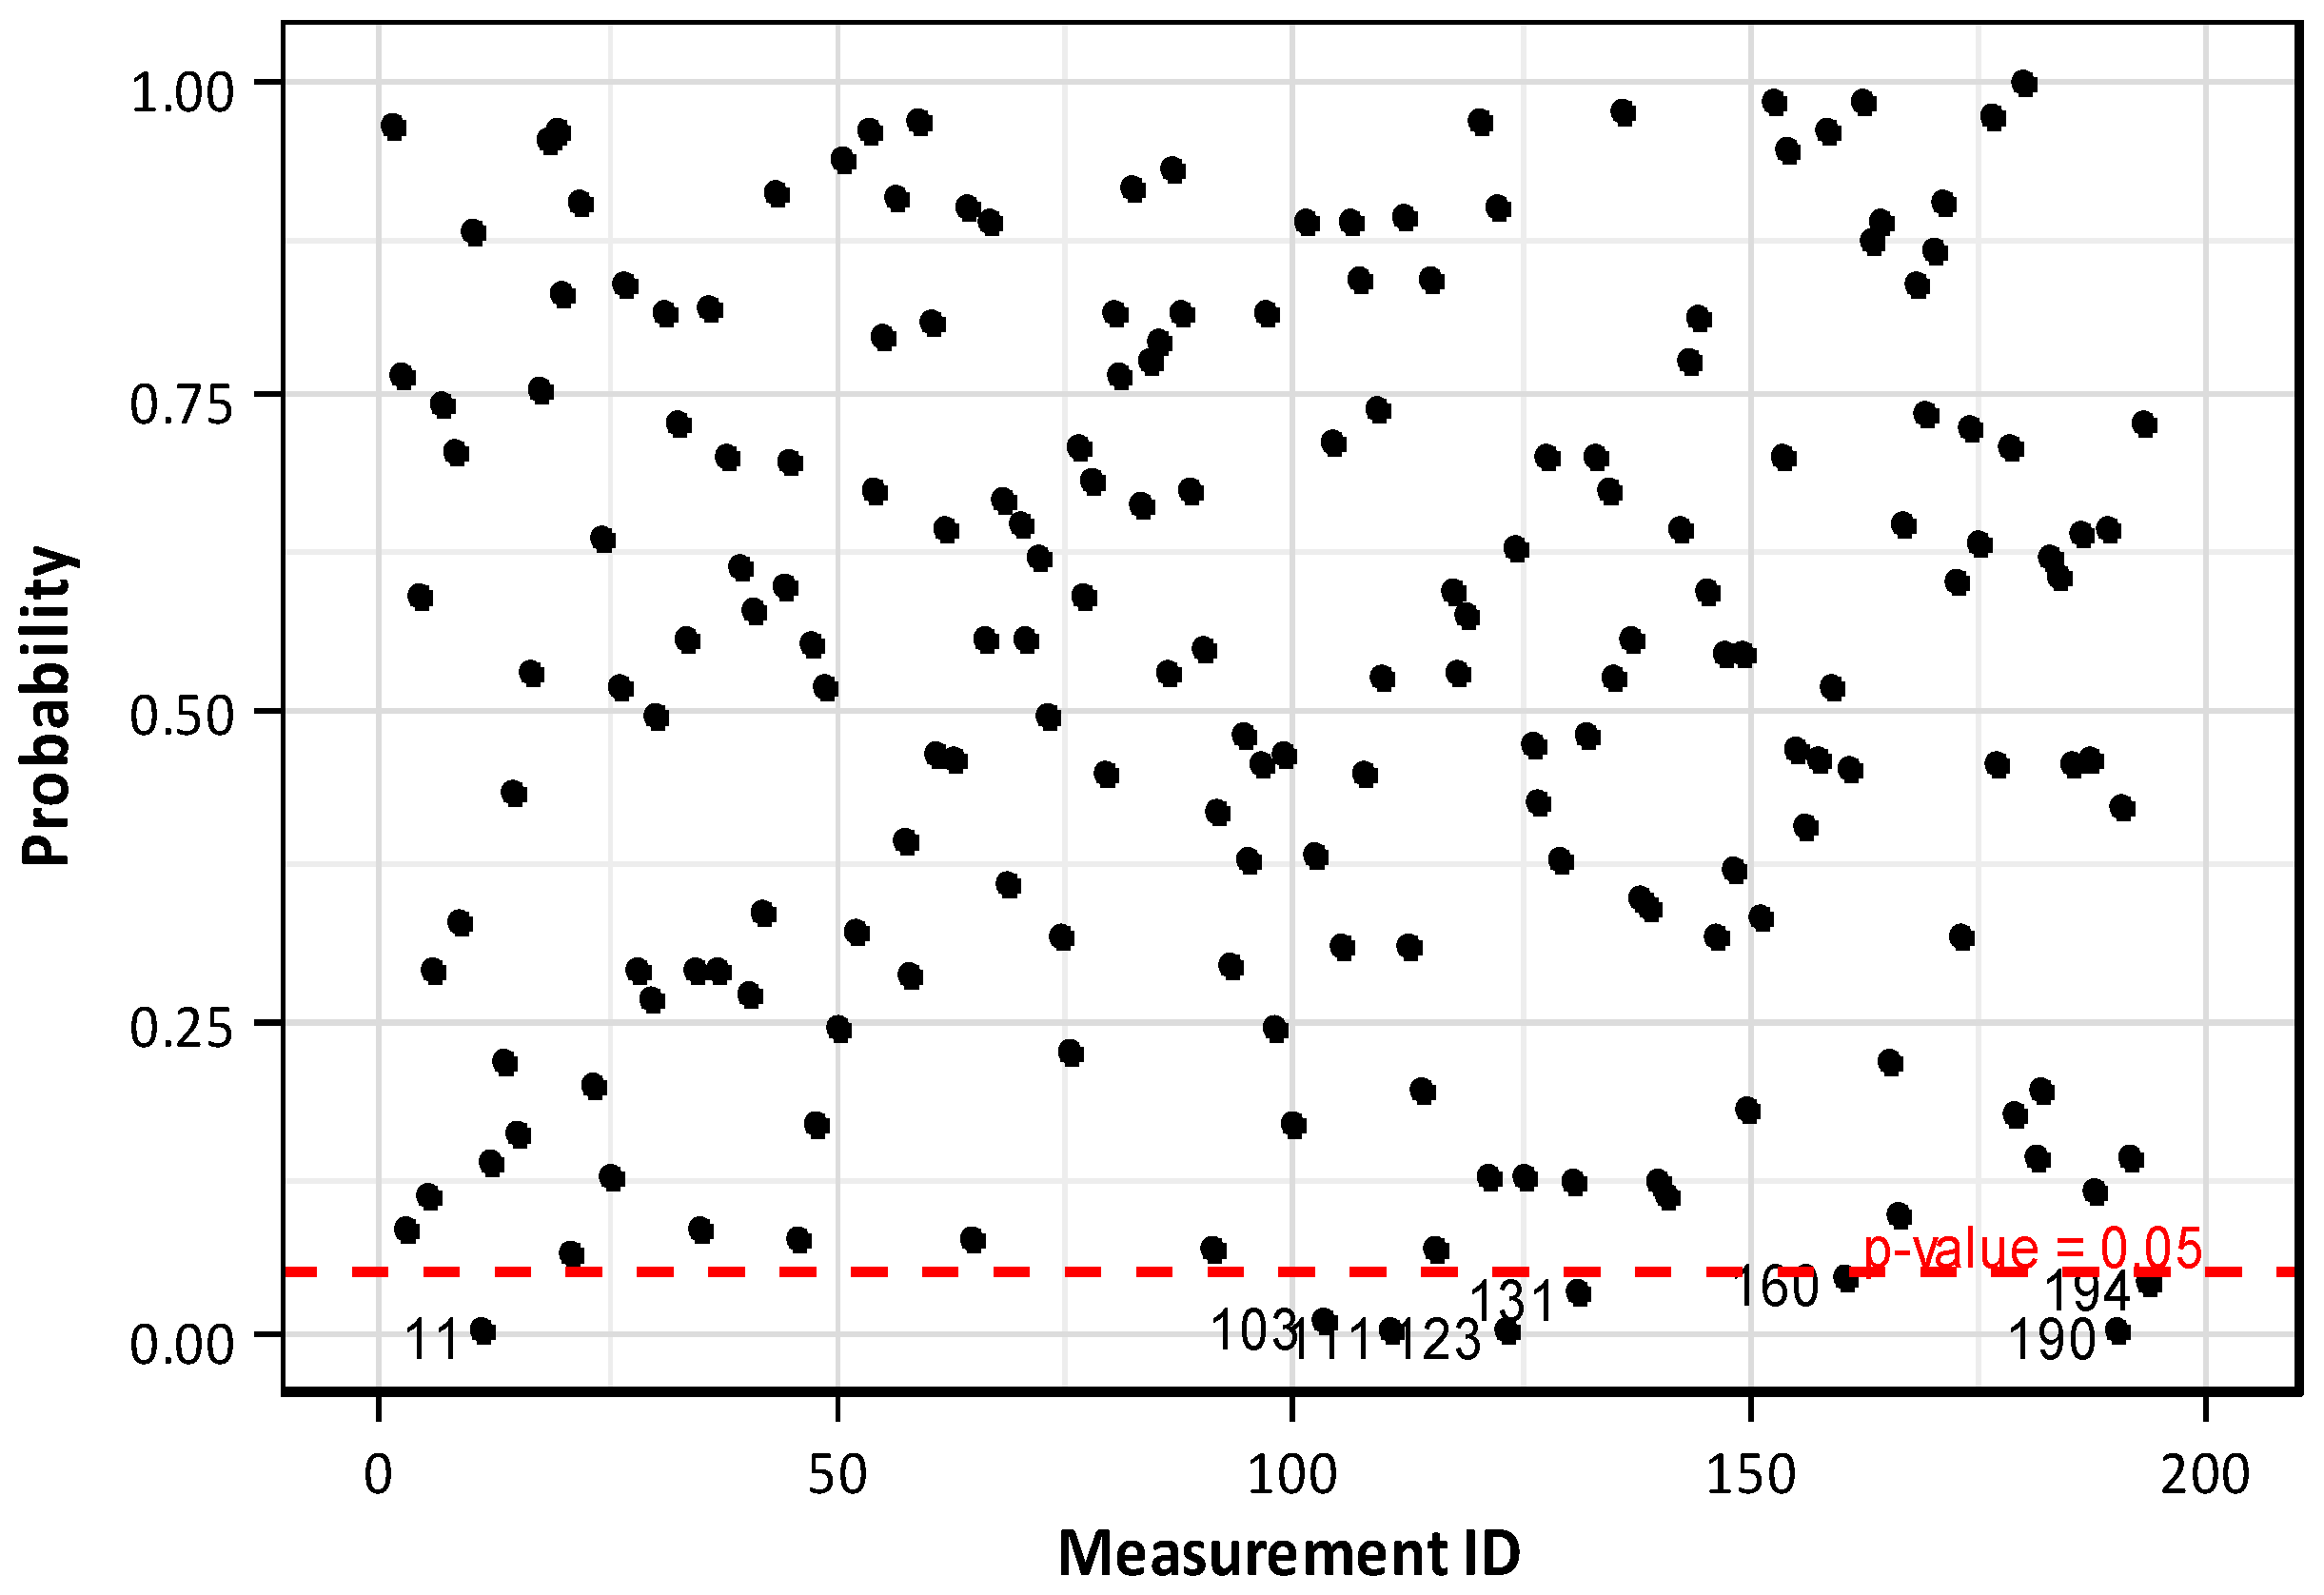
Figure 8 plots the normality test results relative to the 194 anchors considered in this study. It appears that only 8 data have significance probability lower than 5% while the other data present significance probability higher than 5%. Since only a very small portion of the data failed the normality test, it can be assumed reasonably that the distribution of the prestress force per anchor head follows the normal distribution.
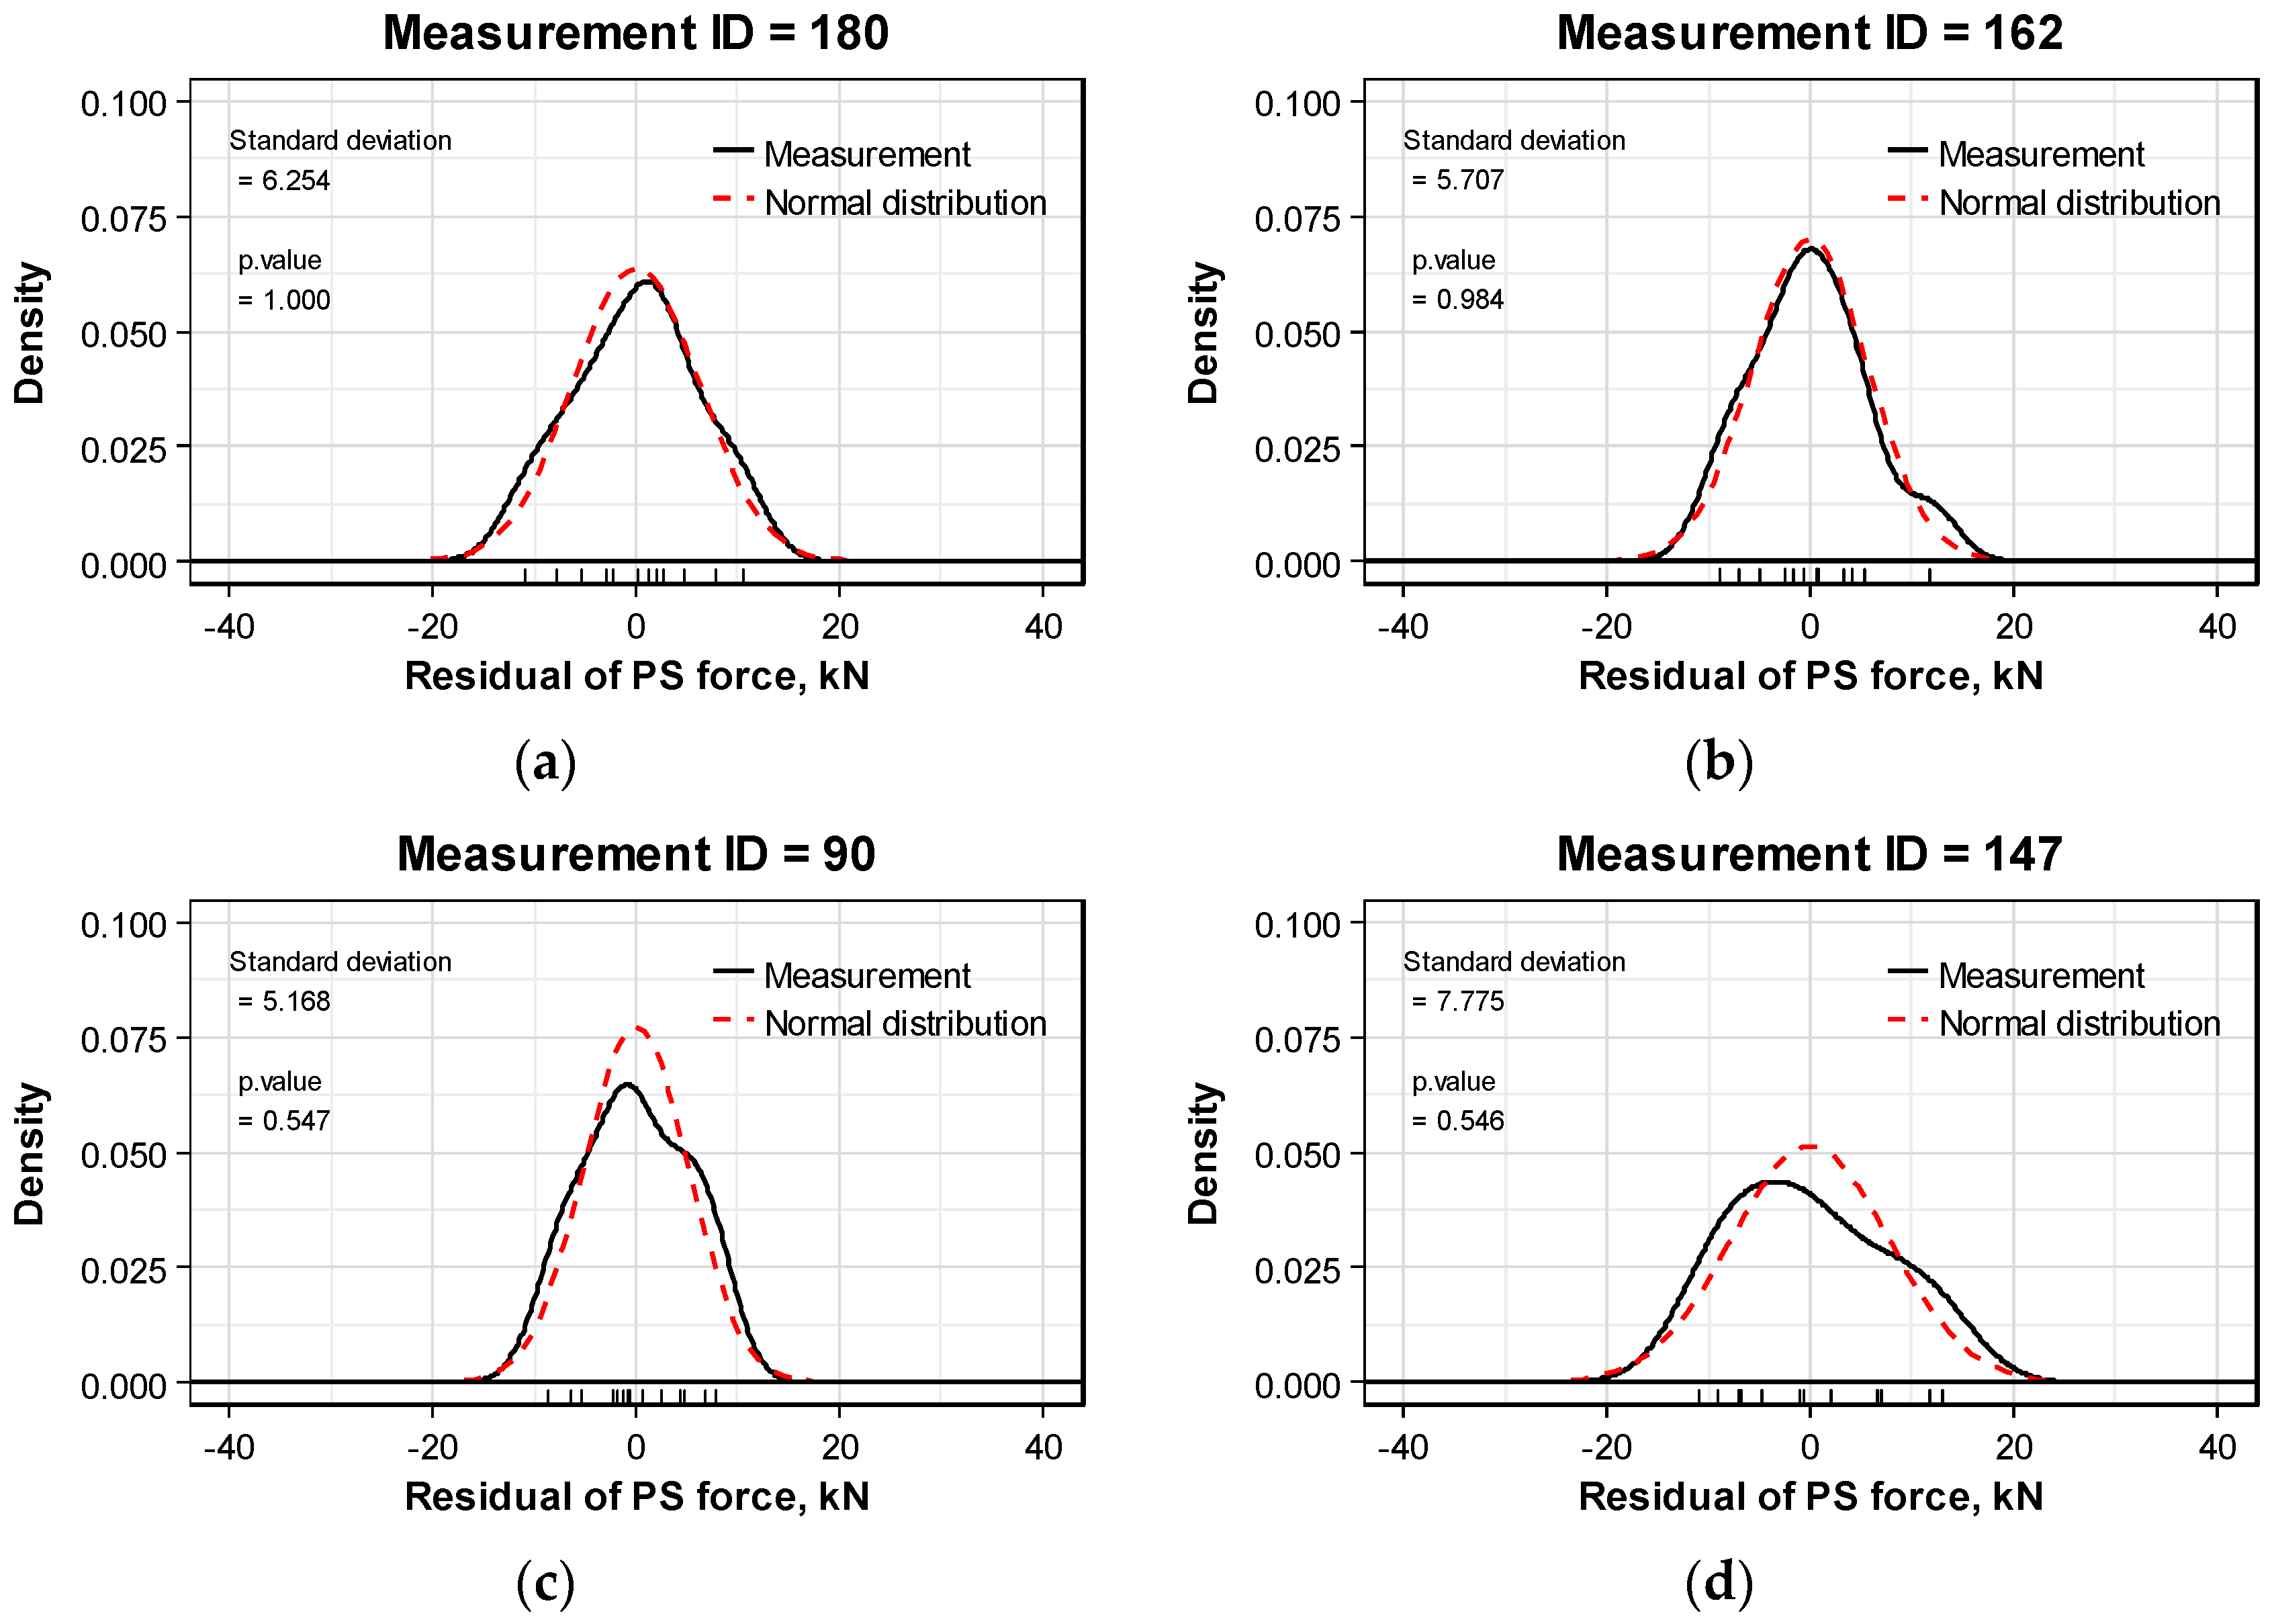
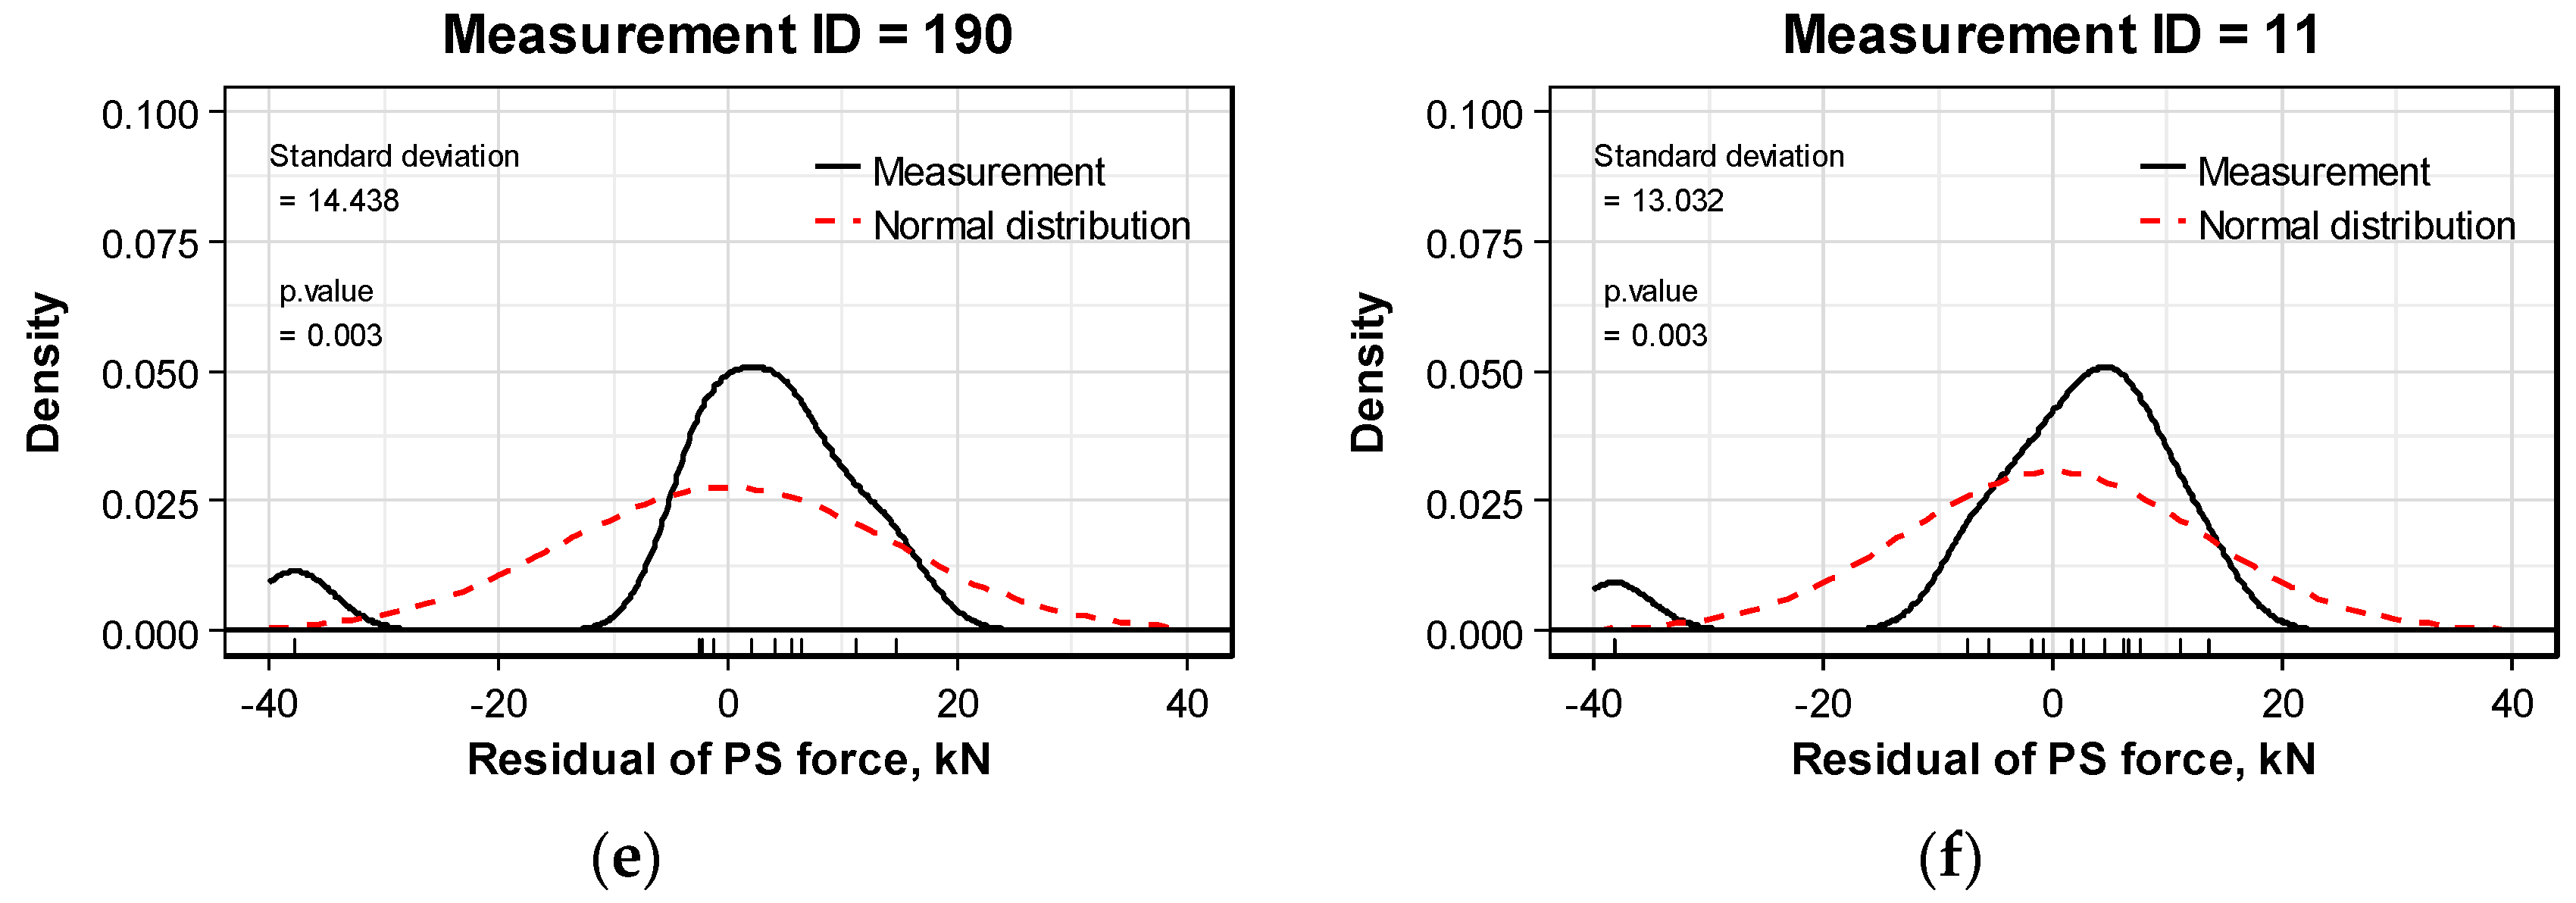
Two sets of data with high significance probability, two sets of data with medium significance probability, and two sets of data with low significance probability were selected to check the extent of agreement of the actual distribution with the normal distribution. The results plotted in
Figure 9 show good agreement for the data with high significance probability and clear disagreement for the data with low significance probability.
3.3. Evaluation of Factors Influencing the Standard Deviation of the Prestress Force per Anchor Head
The previous section validated the assumption that the prestress force distribution of the multi-strand system follows the normal distribution. What is now needed is the mean and the standard deviation to define the normal distribution. The mean can be easily obtained by dividing the prestress force indicated by the hydraulic jack by the number of strands inserted in the anchor. Therefore, the distribution of the prestress force in the anchor can be defined if the standard deviation is obtained. To that goal, this section examines the distribution pattern of the standard deviation per anchor head.
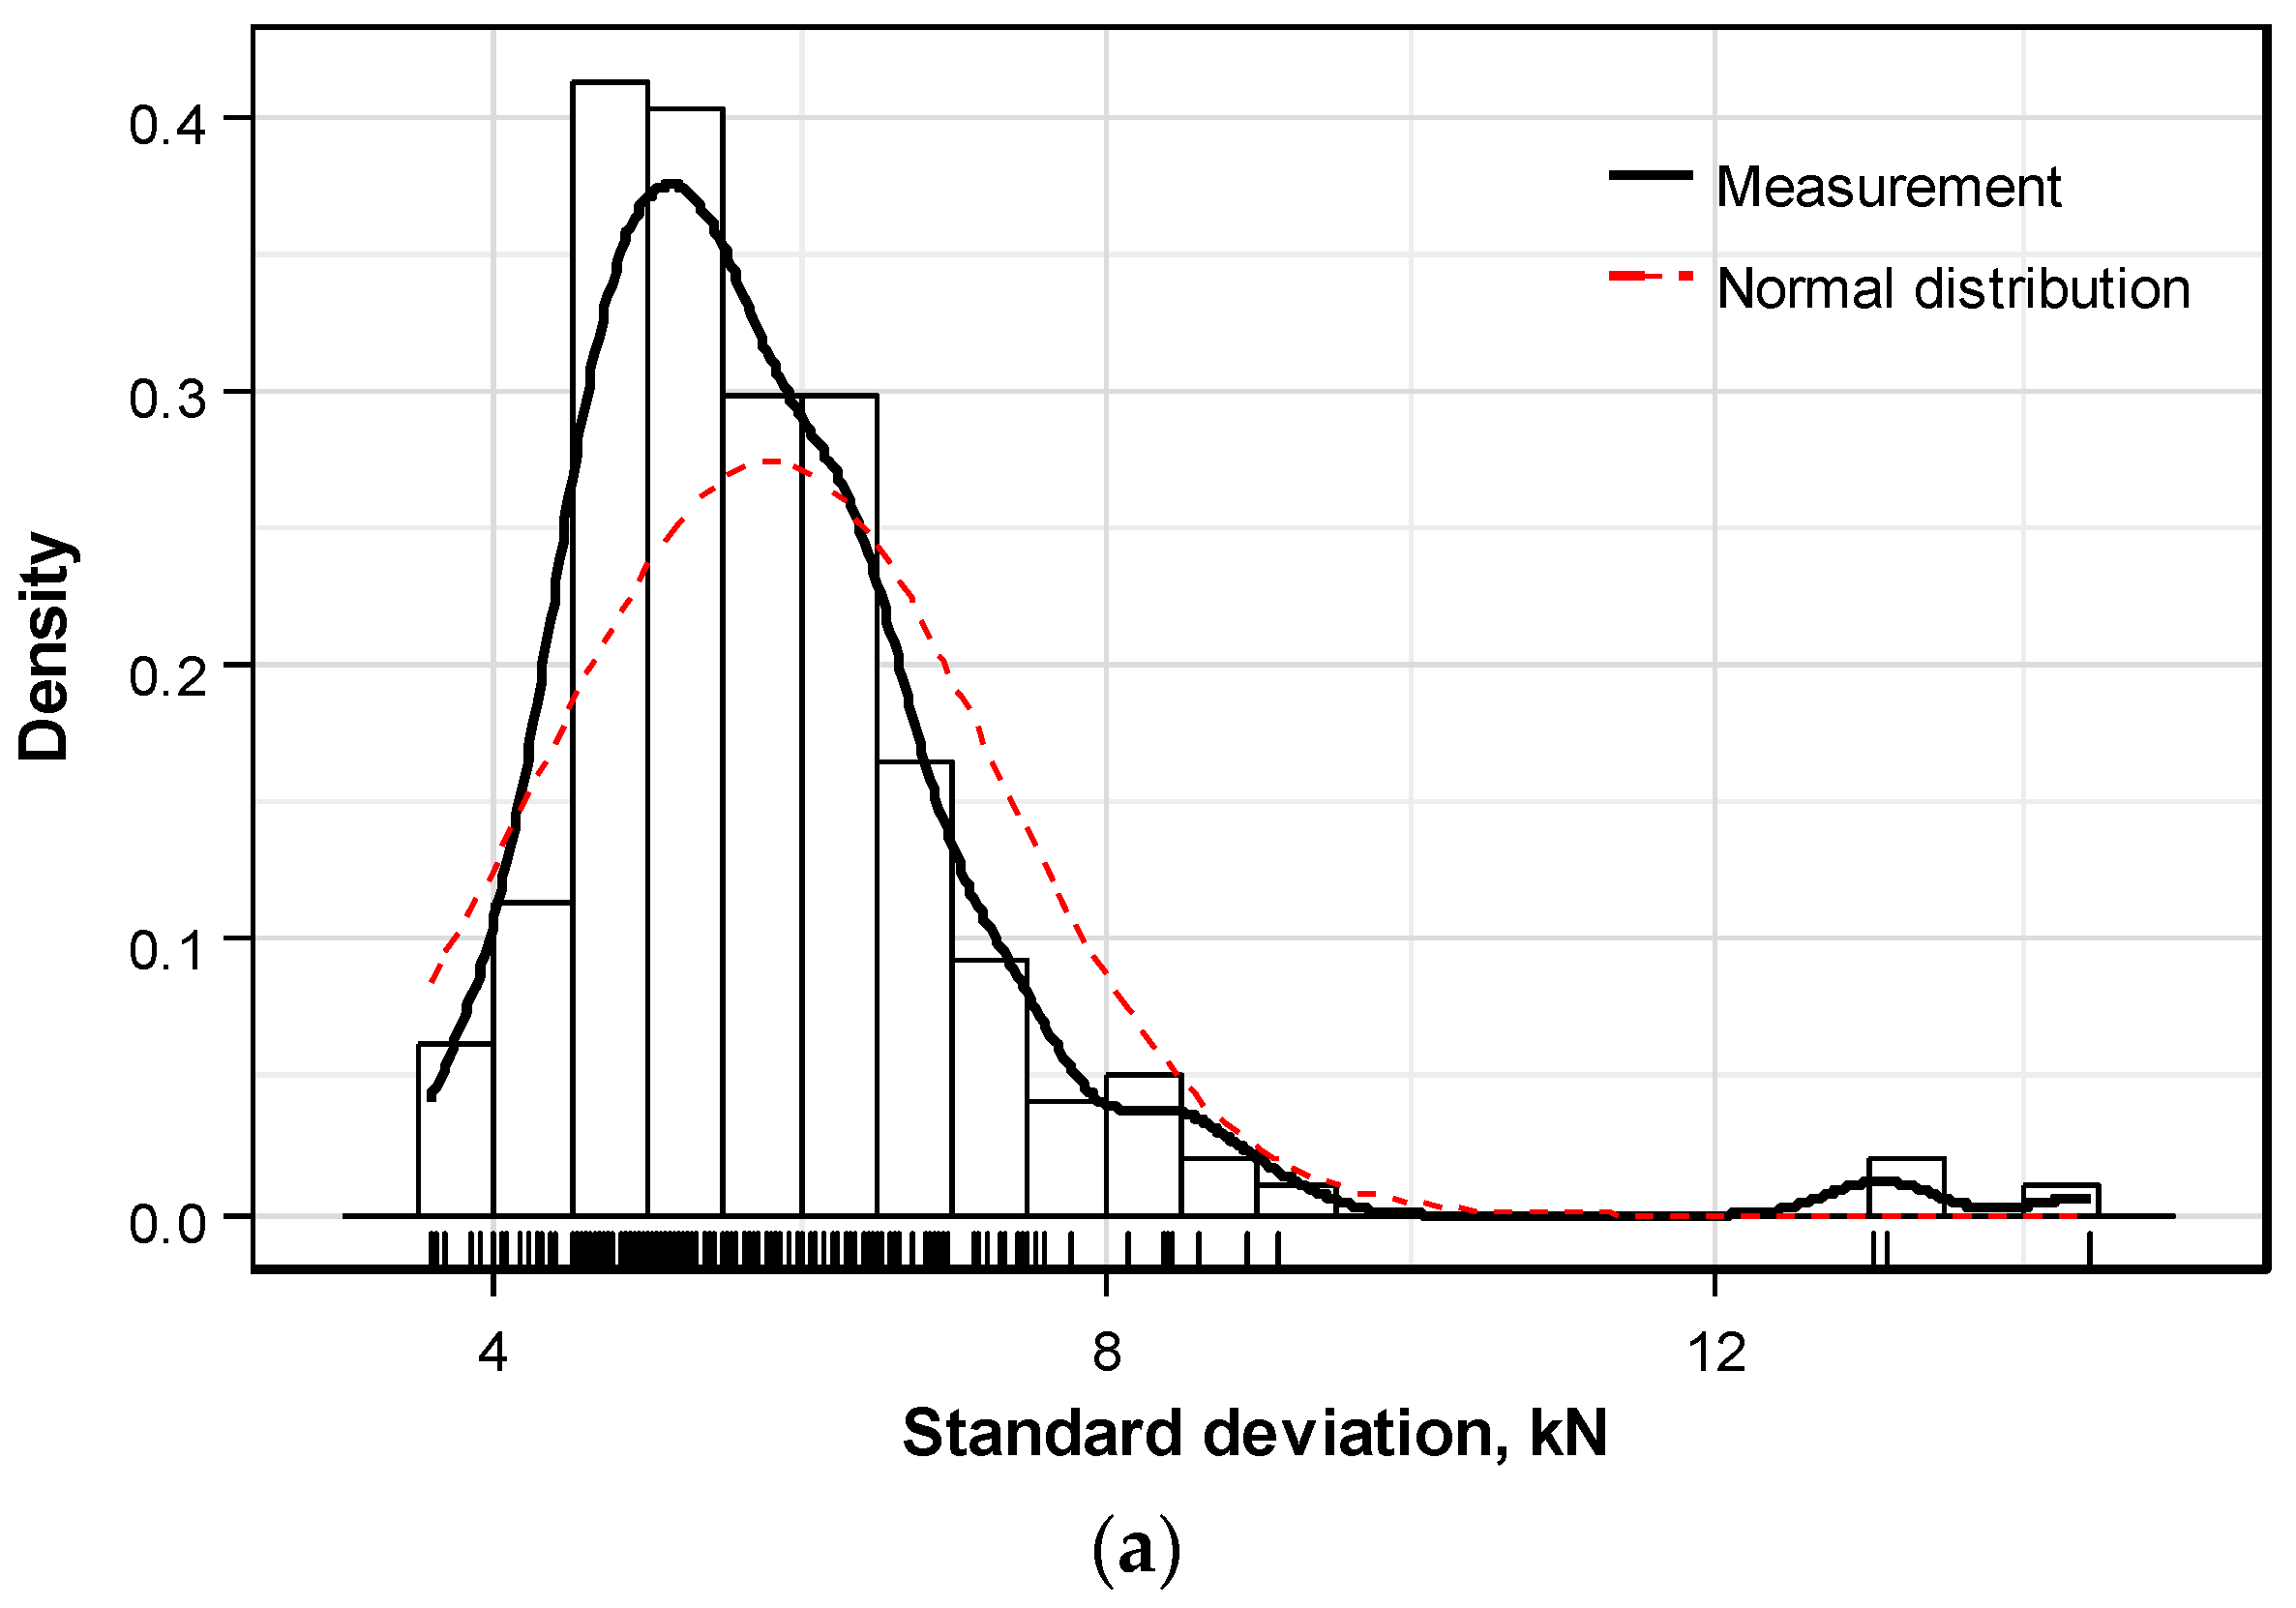
Figure 10 plots the density histograms of the standard deviation per anchor head.
Figure 10a relates the distribution for the whole set of data and
Figure 10b is drawn when the 3 outlier data sets are excluded from the considered data. It appears that the distribution of the standard deviation for the whole set of data, including the outliers, has mean of 5.80 kN and standard deviation of 1.45 kN, whereas the same distribution for the data excluding the outliers has mean of 5.67 kN and standard deviation of 1.09 kN. This indicates that large distortion is generated by the 3 outliers. As shown in
Figure 9c, these 3 outliers correspond to the computation of a large standard deviation caused by the loose arrangement of some strands in the tendon. However, such misplacing of a part of the strands can be attributed to careless prestressing work and should not occur in cases of appropriate prestressing. Accordingly, these 3 outliers are discarded from the subsequent analysis.
Consequently, compared to the normal distribution, the distribution of the standard deviation of the prestress force per anchor head excluding the outliers appears to be slightly skewed to the left and presents a long tail on the right.
The tendency of the distribution of standard deviations of prestress force per anchor head is now examined according to the change in the length of the structure, the curvature of the tendon, and the mean prestress force.
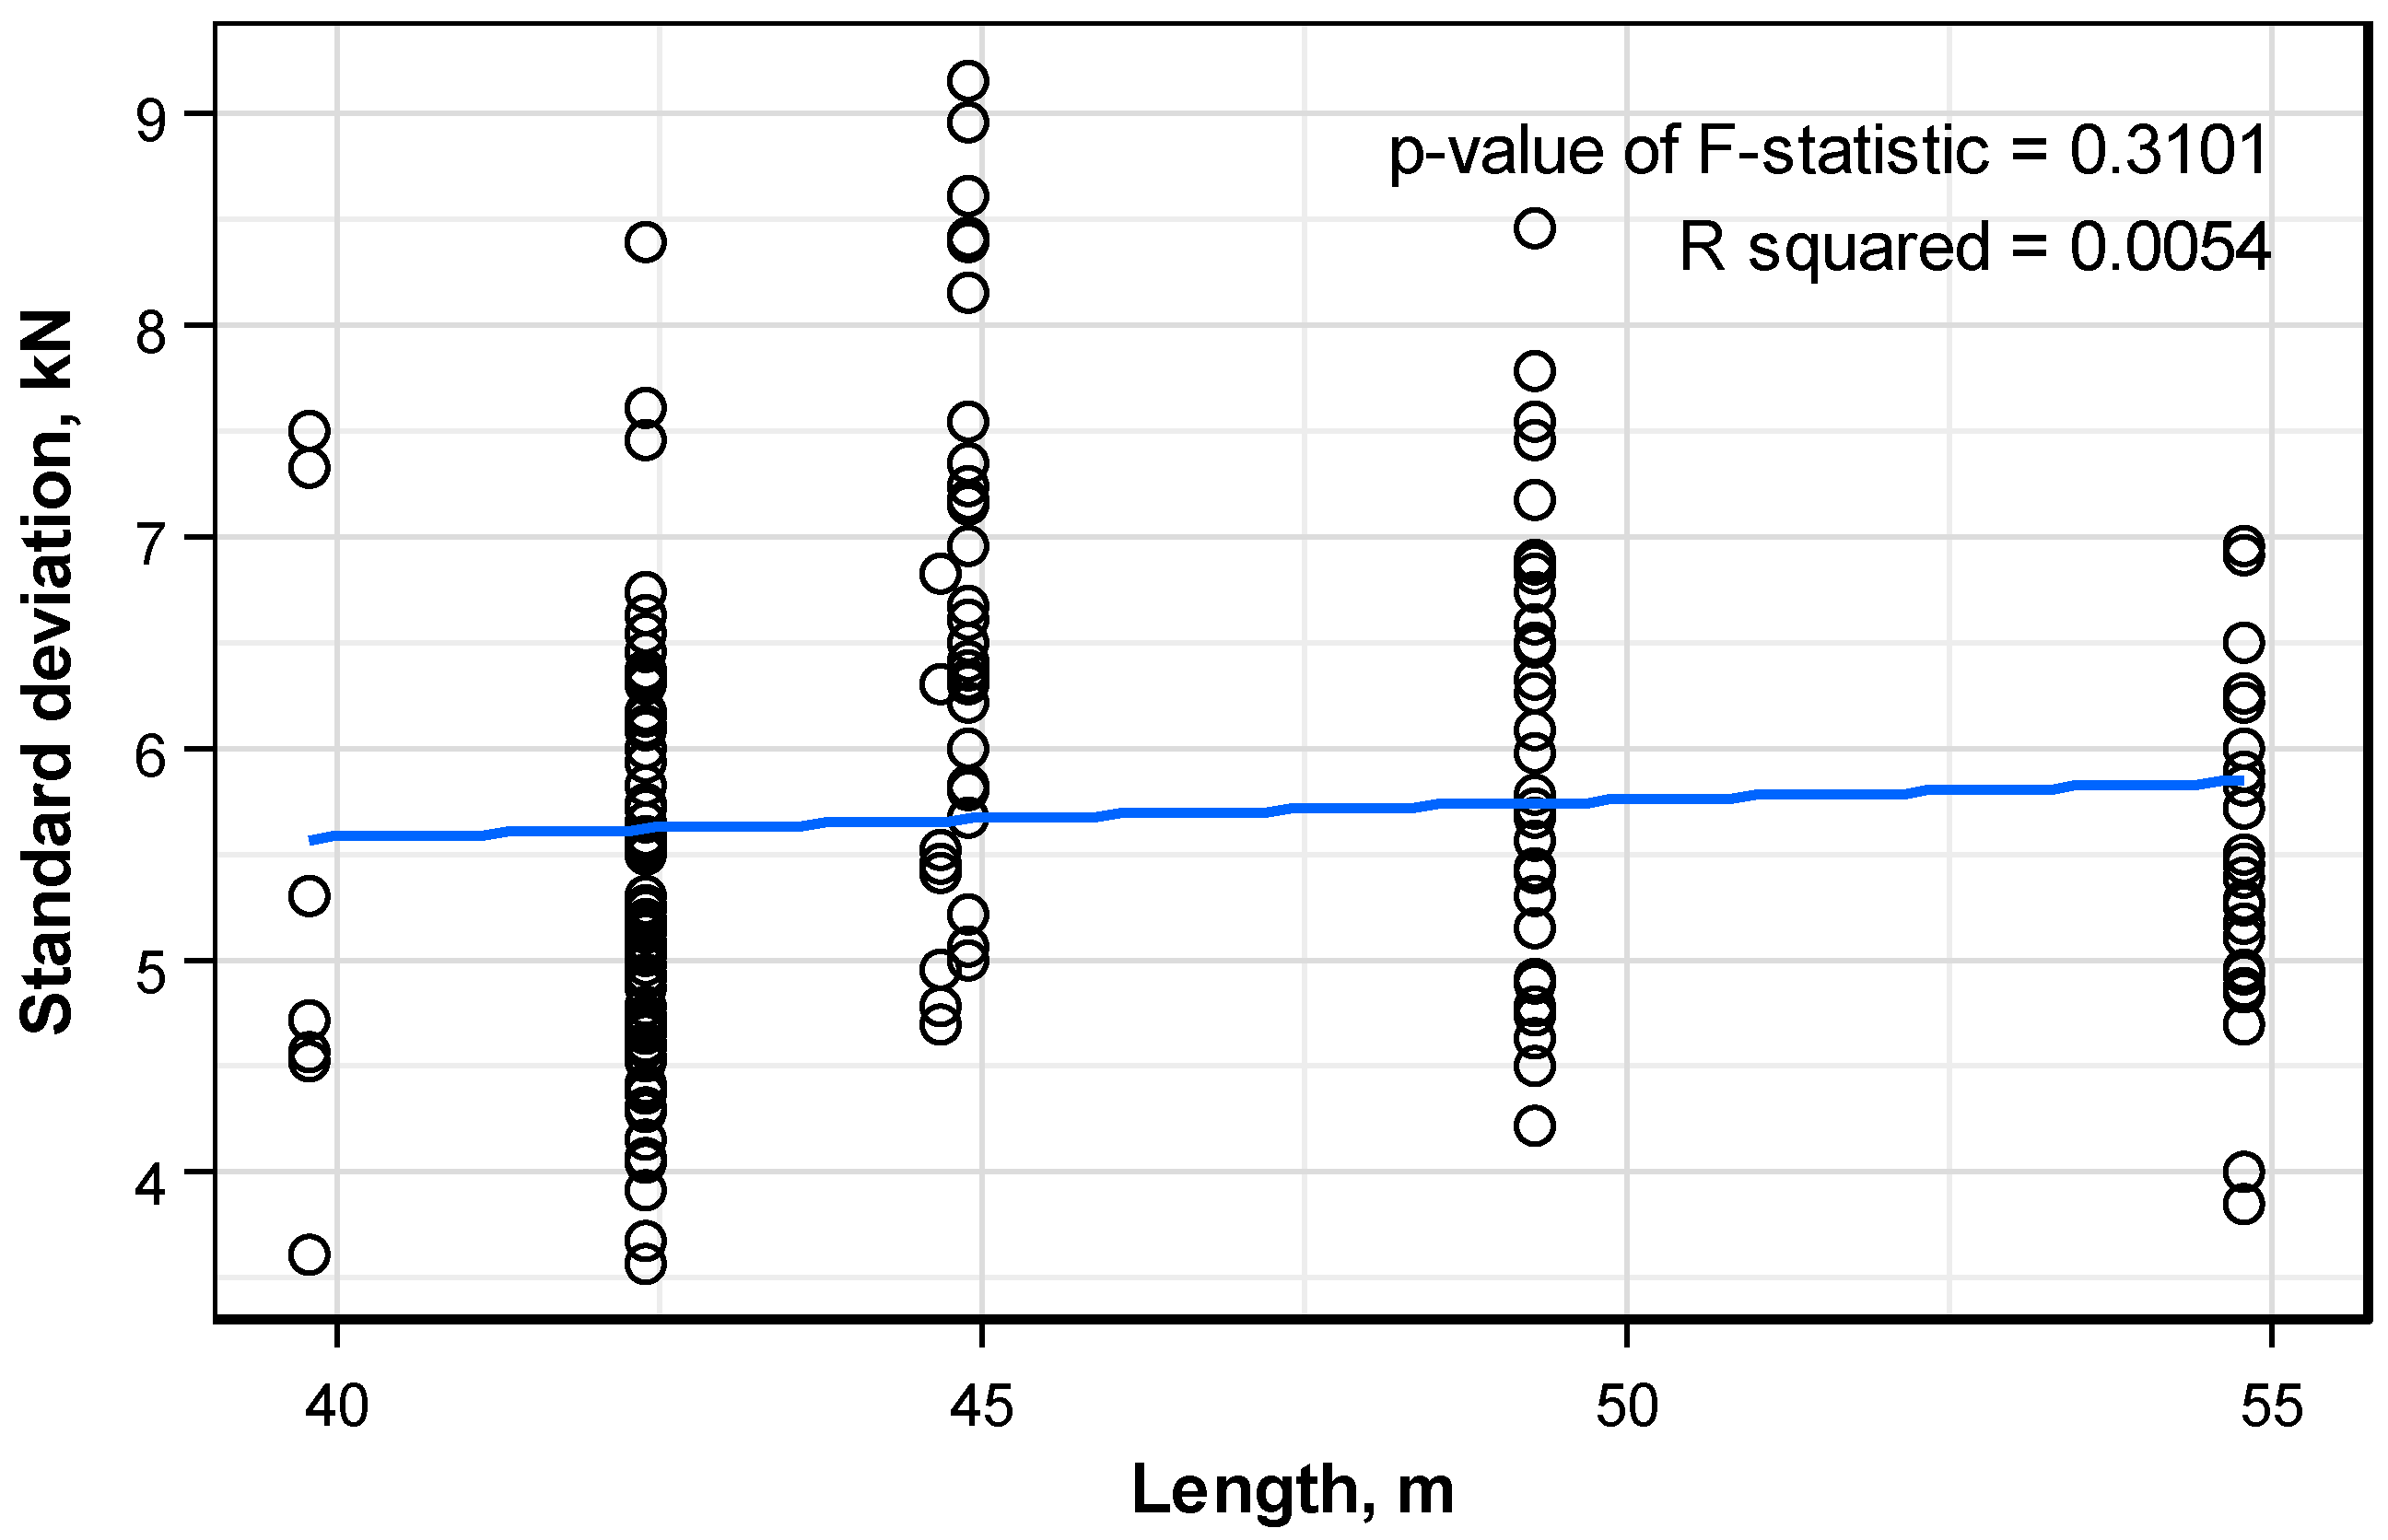
Figure 11 plots the distribution pattern of the standard deviation of the prestress force per anchor head with respect to the length of the structure. The dots indicate the distribution of the standard deviation and the solid line figures the linear trend line. The pattern of the distribution of the standard deviation does not show particular tendency according to the increase of the structure length. In addition, the p-value of the F-statistic indicating the validity of the regressive line is smaller than 0.05 and shows that the regressive line is not valid. Therefore, it can be concluded that the length of the structure has practically no effect on the standard deviation.
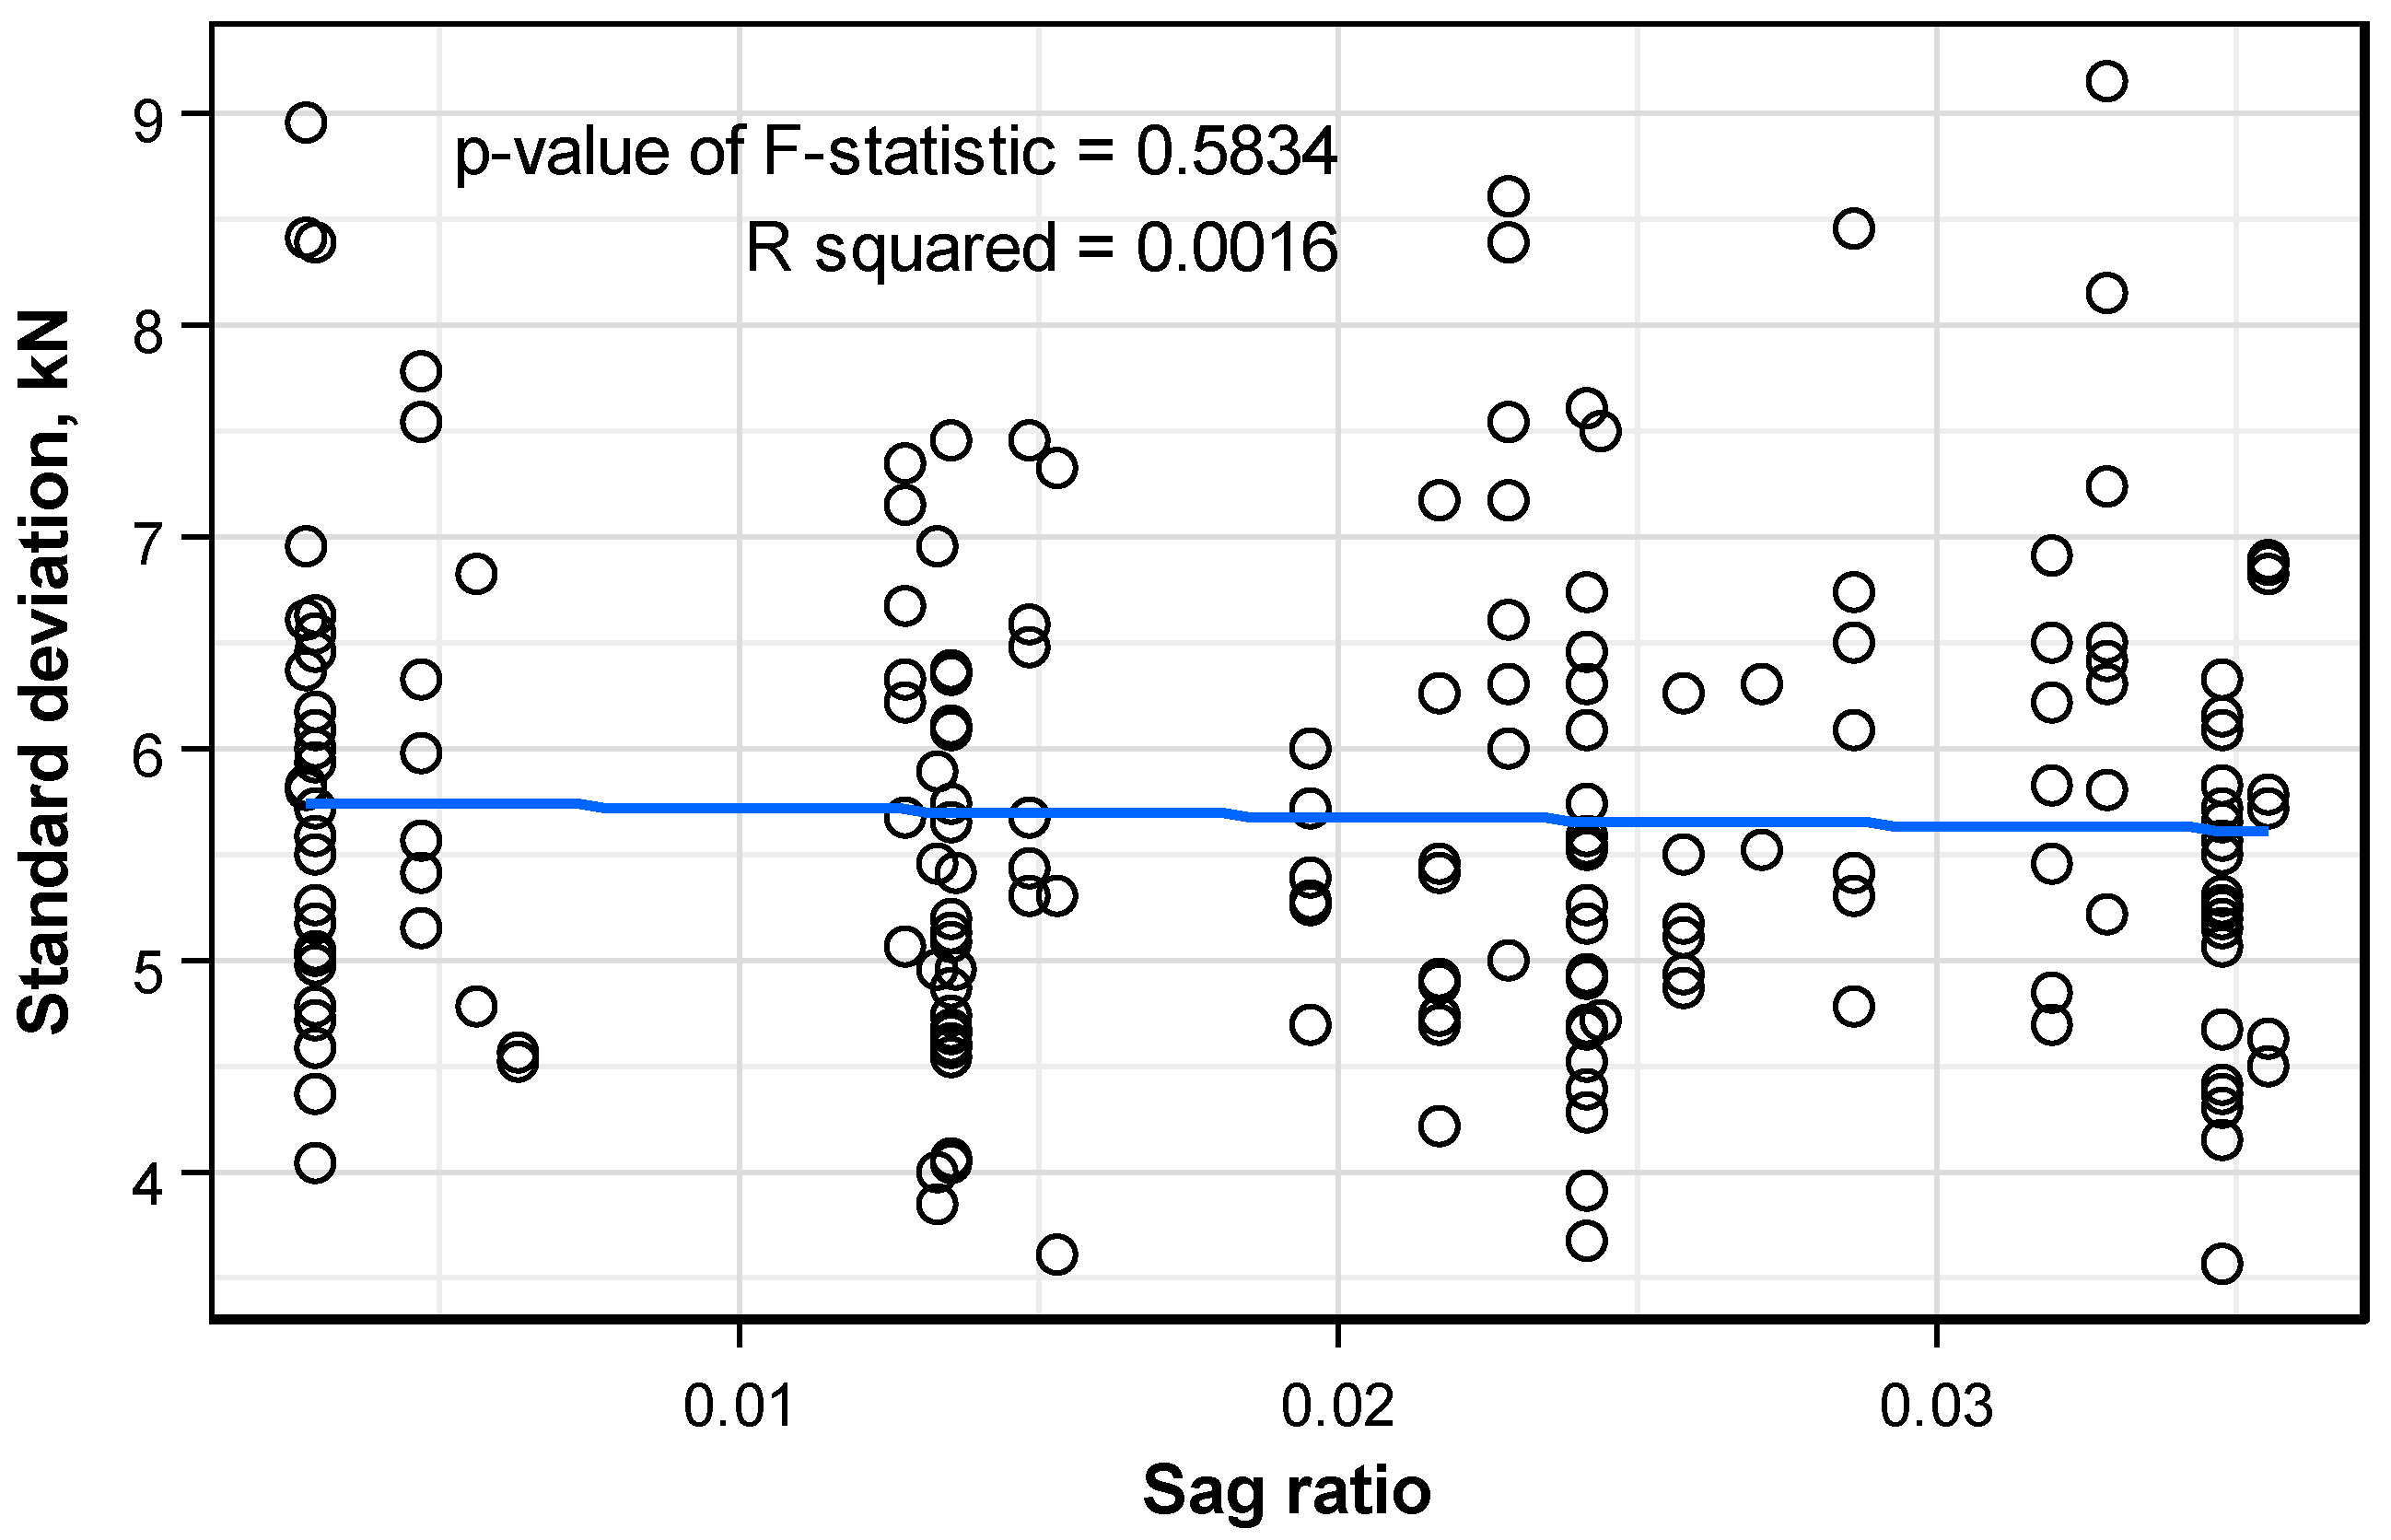
Figure 12 plots the distribution pattern of the standard deviation of the prestress force per anchor head with respect to the sag ratio of the tendon. In this case, the standard deviation seems to reduce with larger sag ratio, but very slightly and without clear trend. Moreover, the regressive line appears to be invalid since the p-value of F-statistic is smaller than 0.05. Accordingly, similar to the structure length, it can also be concluded that the tendon sag ratio has practically no effect on the standard deviation.
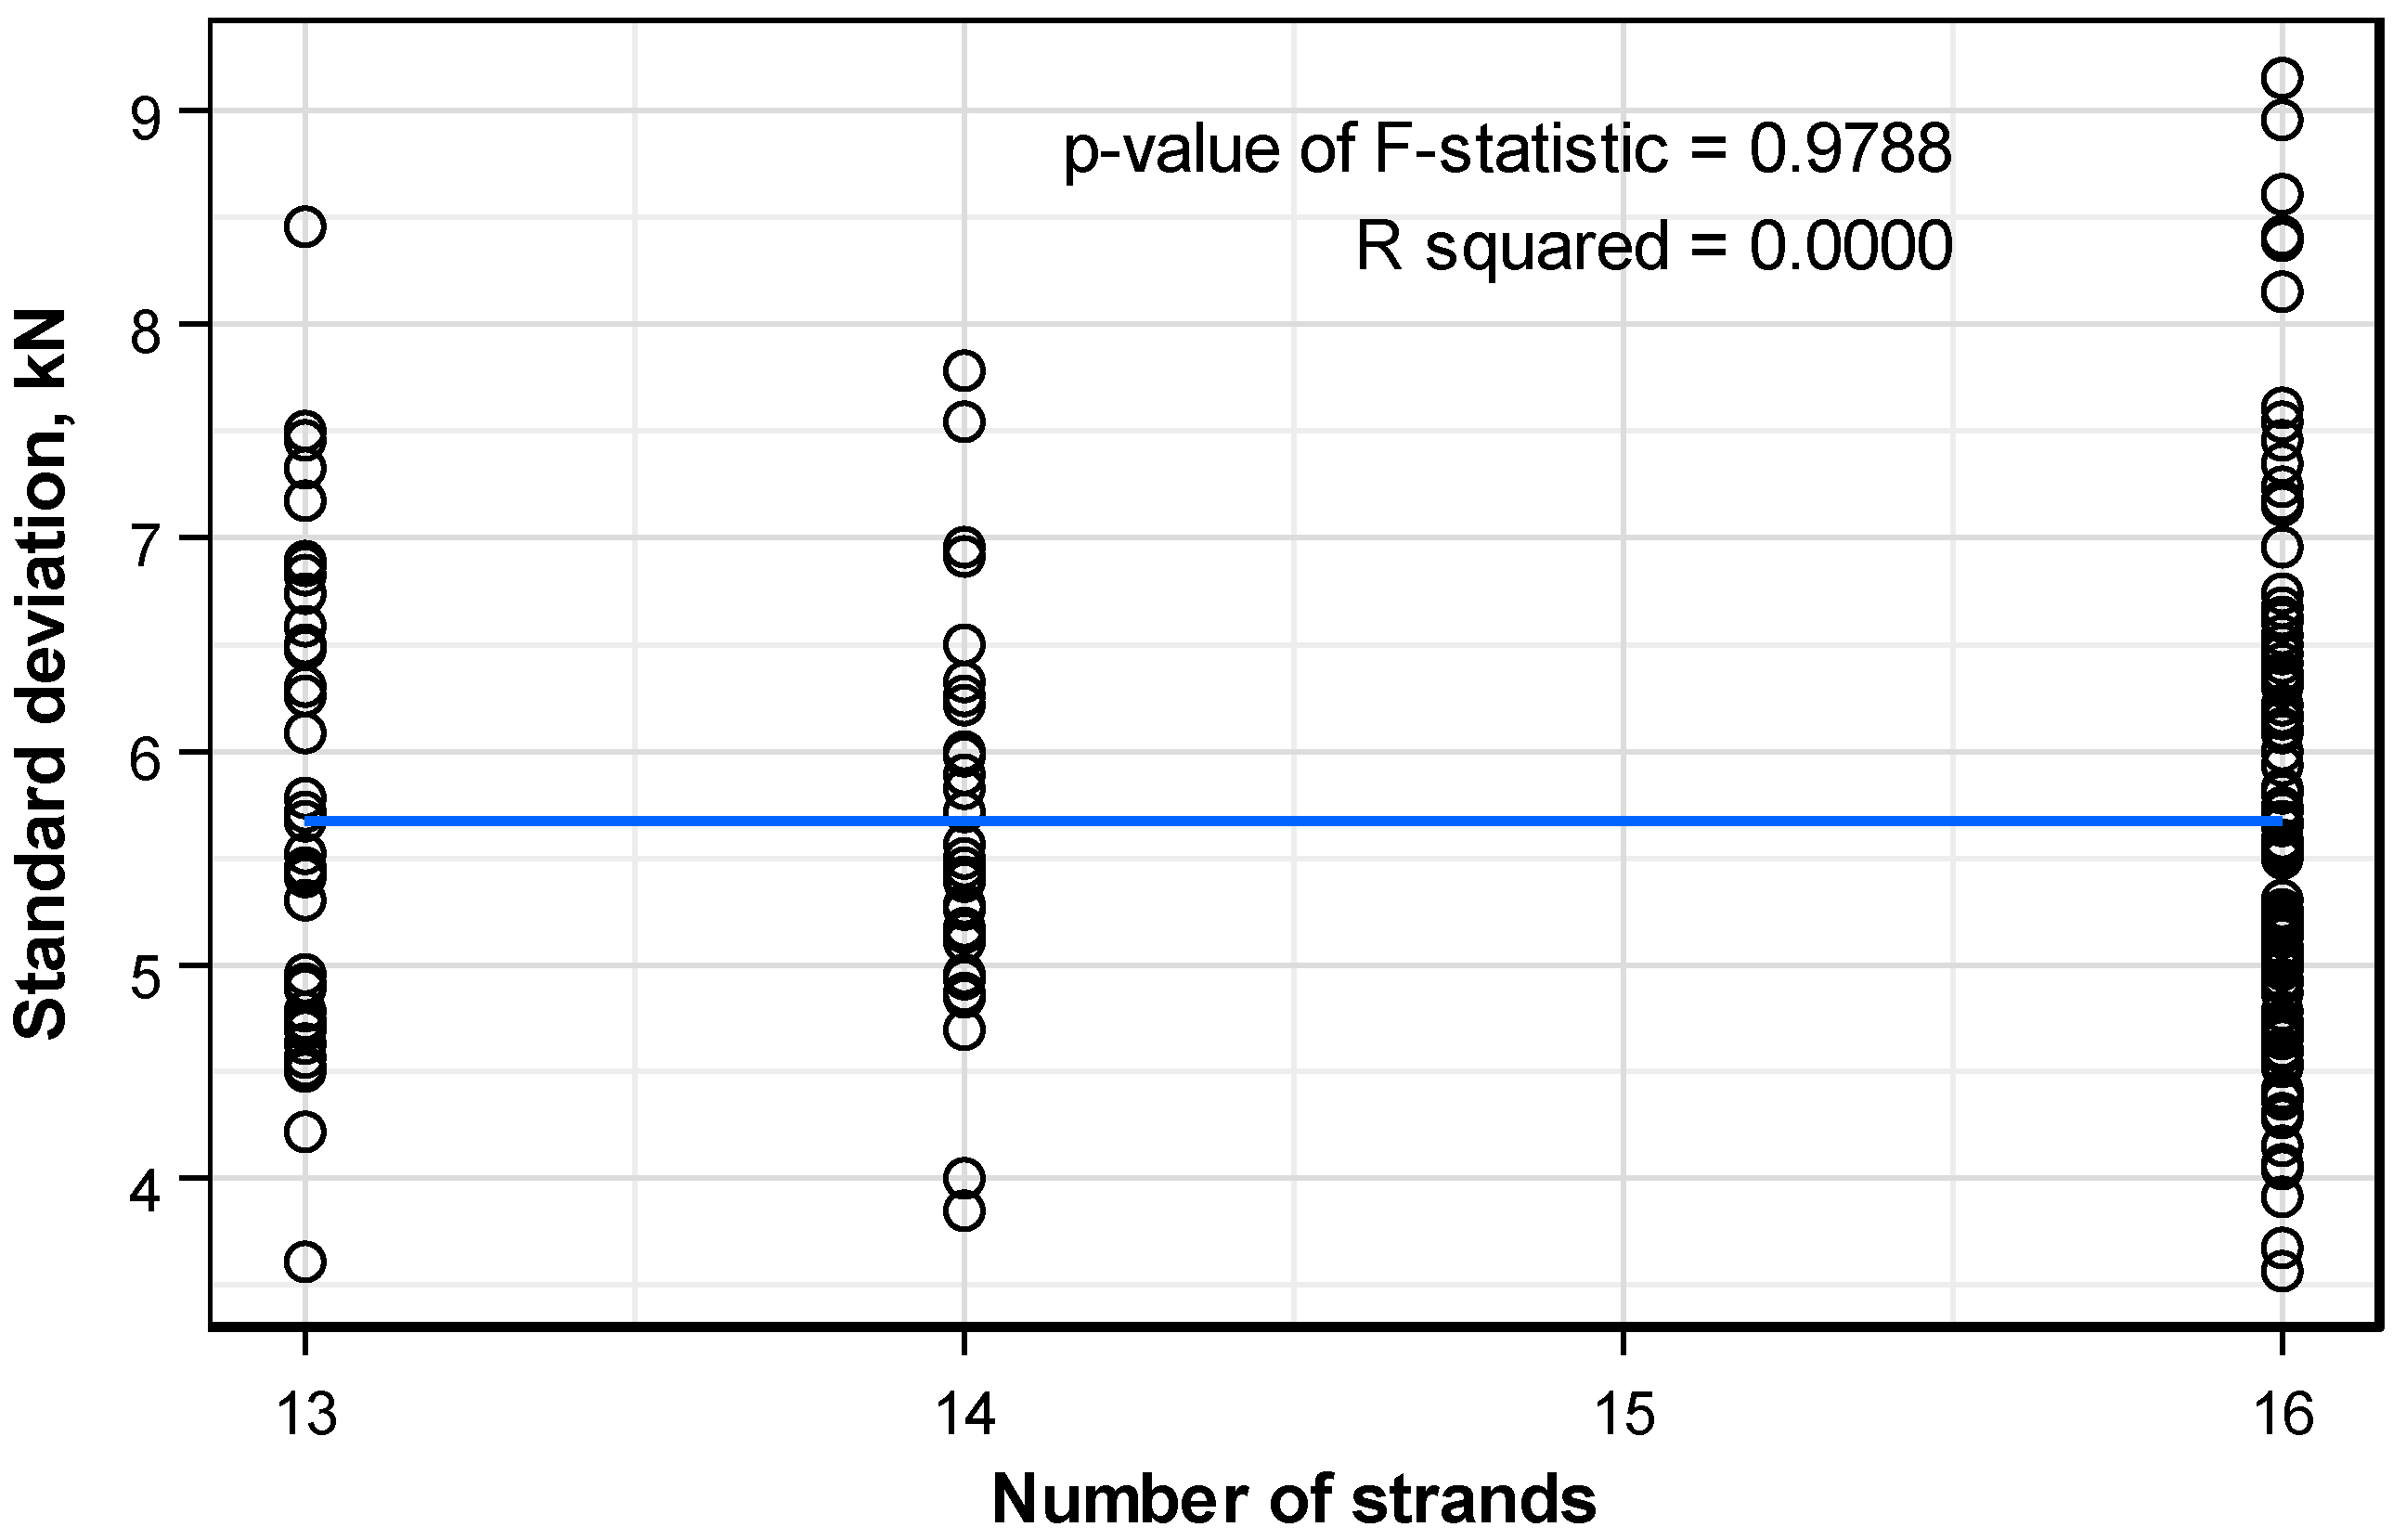
Figure 13 plots the distribution pattern of the standard deviation of the prestress force per anchor head with respect to the number of strands per anchor. Here also, it is also concluded that the number of strands per anchor has practically no effect on the standard deviation.
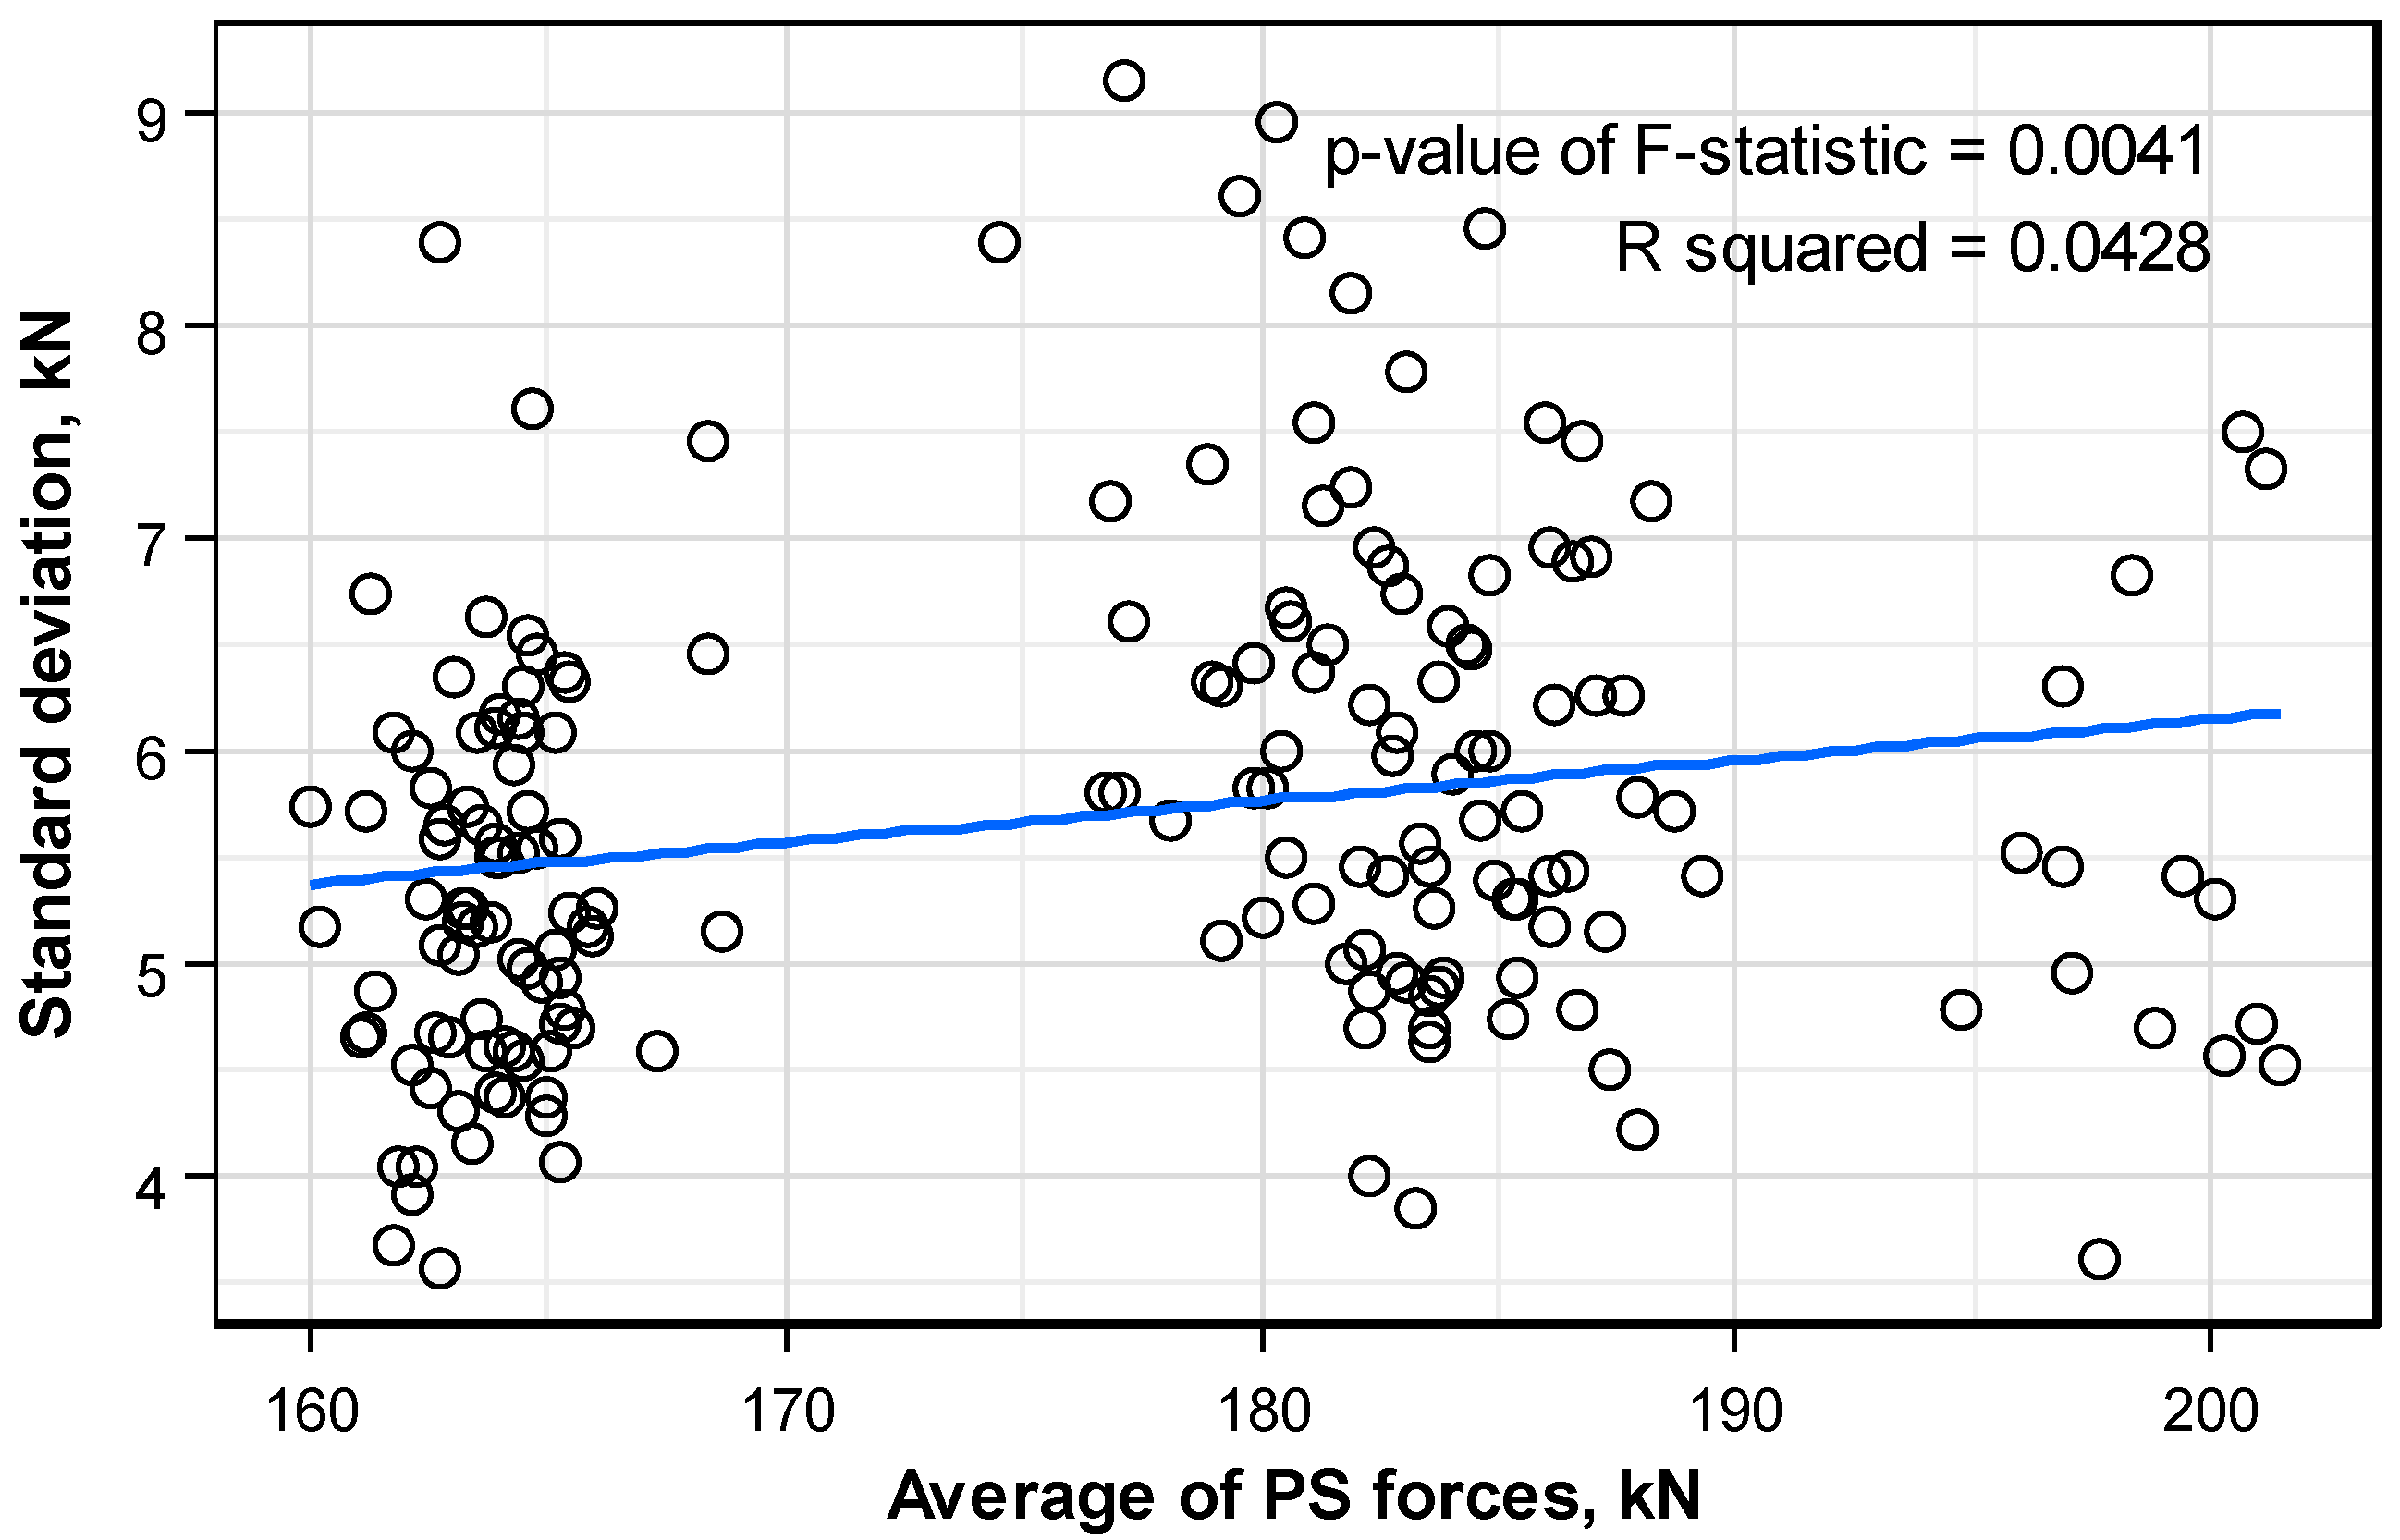
Figure 14 plots the distribution pattern of the standard deviation of the prestress force per anchor with respect to the level of prestress per anchor. Unlike the precedent factors, the level of the prestress force appears to influence the distribution of the standard deviation of the prestress force per anchor head. In addition, the p-value of F-statistic indicates the validity of the regressive line with a value smaller than 0.05. Concretely, higher level of prestress tends to gradually increase the standard deviation of the prestress force. However, the R squared relative to the regressive line indicates poor suitability with a value of about 0.04. This means that the unquantifiable skill and practice of the technician has a larger influence on the standard deviation relative to the distribution of the prestress force per anchor than the factors considered in this study.
3.4. Derivation of Formula for the Estimation of the Prestress Force Distribution
The evaluation of factors influencing the standard deviation of the prestress force per anchor head revealed the linear proportionality between the level of prestress and the standard deviation, and the quasi-absence of effect on the standard deviation of the structure length, tendon sag ratio, and number of strands. Accordingly, the standard deviation of the prestress force per anchor head can be formulated by a linear equation involving the level of prestress per anchor head from
Figure 14 and the trend line can be expressed as follows.
Consequently, the normal distribution of the prestress force per anchor head can be defined using mean prestress force per anchor head , and the standard deviation obtained using Equation (2).
3.5. Tracking of Change in Prestress Force Distribution
The pattern of the distribution of the prestress force per anchor head could be estimated based upon the observation of the measured data. This section intends to find a solution that enables tracking of the distribution of the prestress force in an anchor using the measurement of the smart strand when one strand among those of the anchor is replaced by the smart strand.
During the prestressing of an anchor, the overall prestress force can be known by means of the load cell of the hydraulic jack. The mean prestress force can thus be obtained by dividing this total prestress force by the number of strands inserted to this anchor, and the standard deviation can then be calculated using Equation (2). Using these values, the distribution of the prestress force in the anchor can be estimated as a
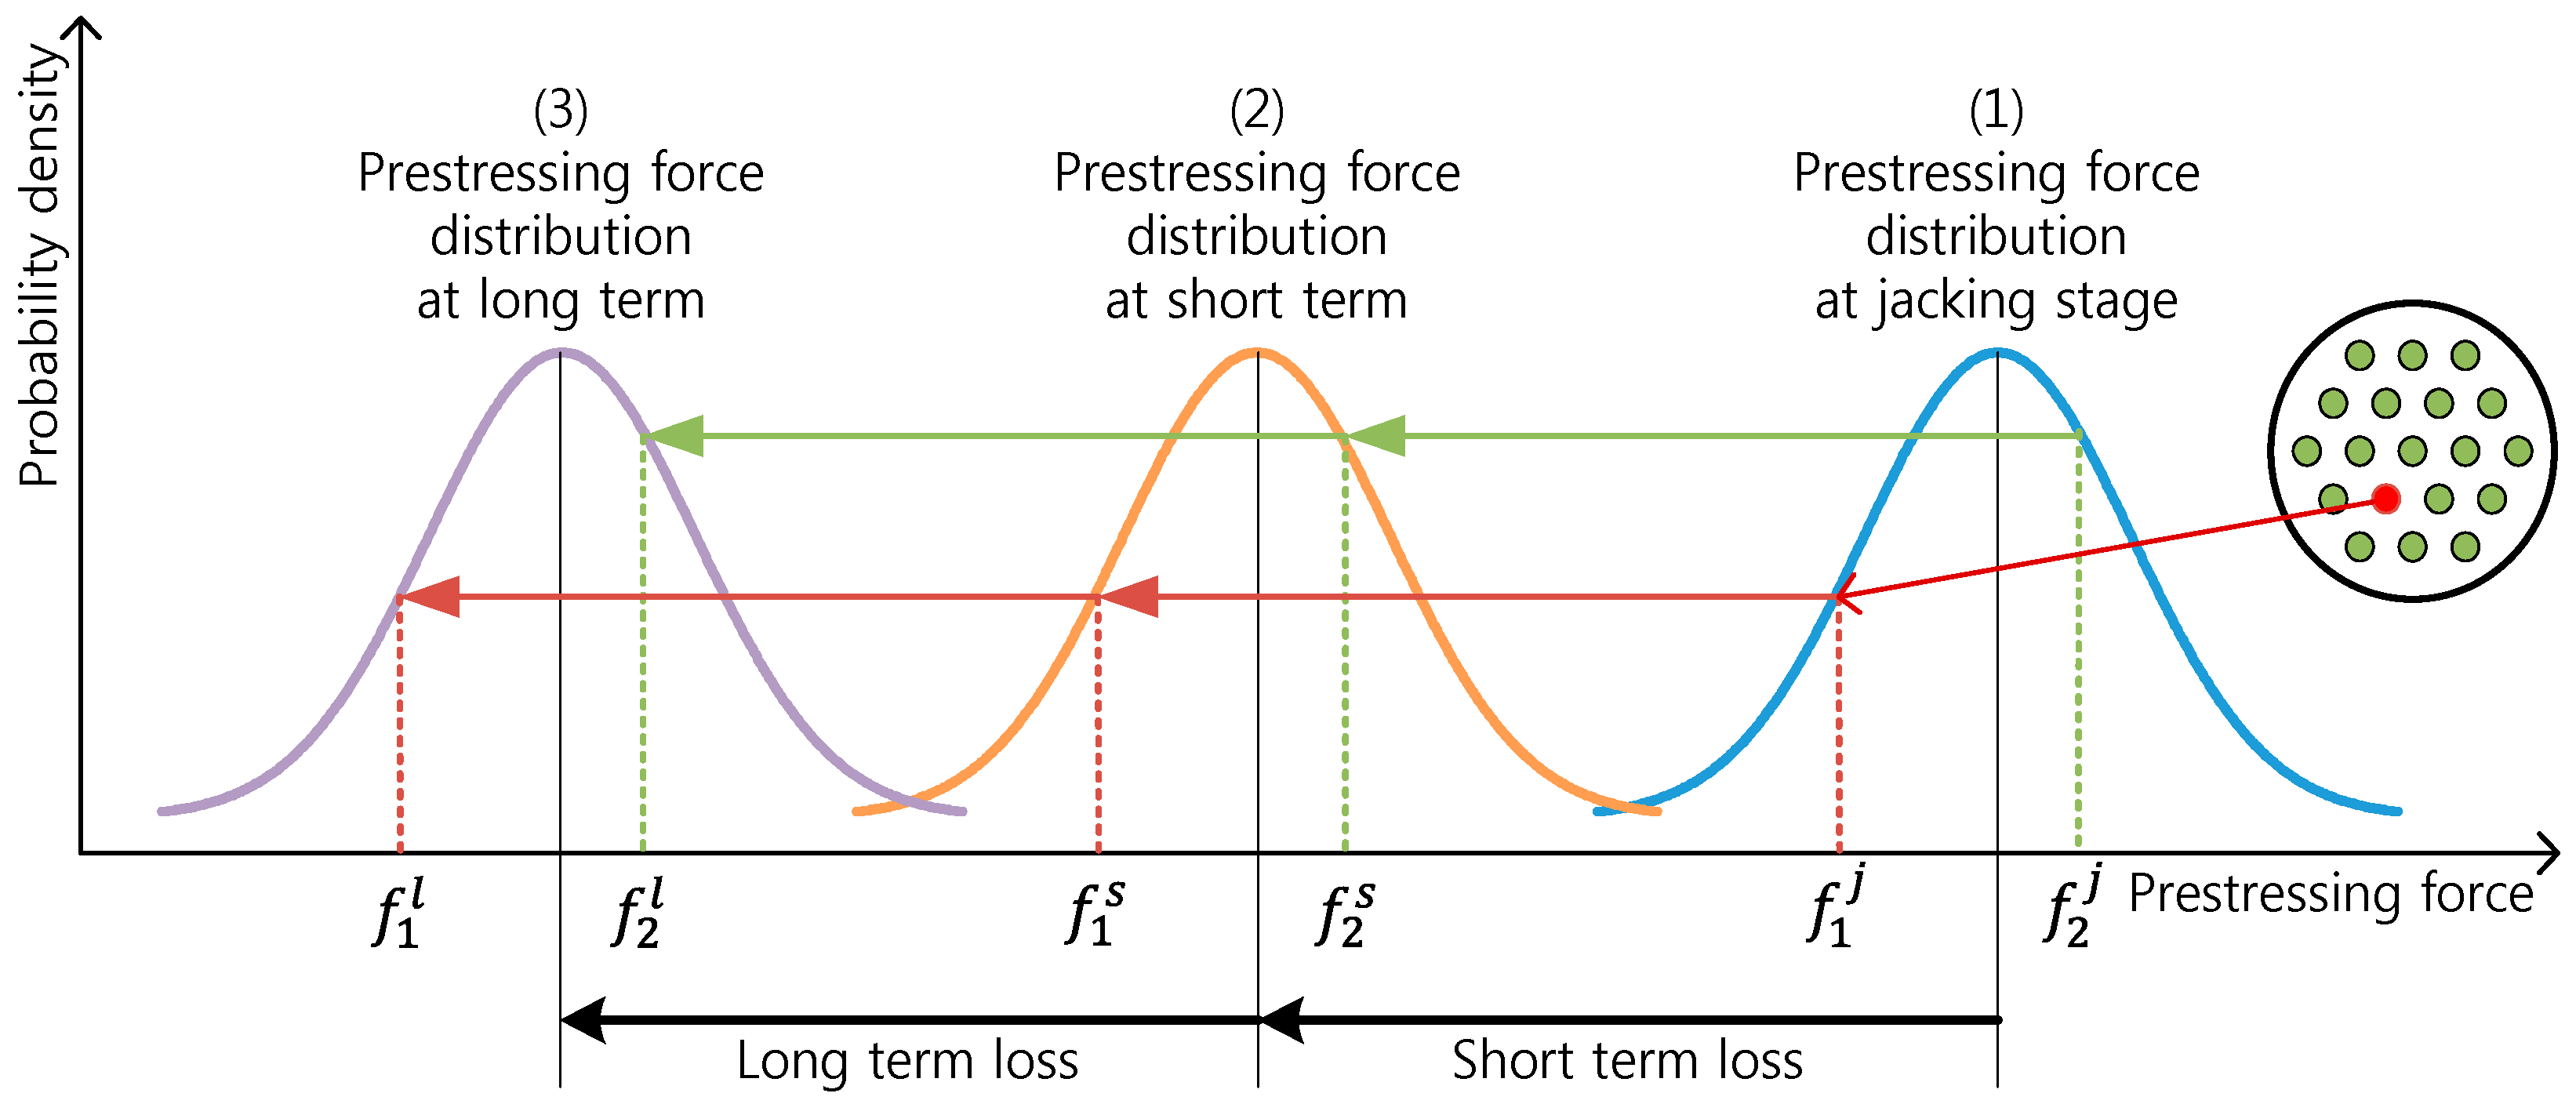
normal distribution. This part corresponds to the first step in the estimation of the prestress force distribution shown in
Figure 15. Here, the measurement given by the smart strand corresponds to just one value in the distribution. In such a case, this measurement may not be in agreement with the mean prestress force.
After prestressing, the distribution pattern of the prestress force experiences continuous change due to the occurrence of long-term and short-term losses of prestress according to the use of the PSC structure. The long-term loss and the short-term loss of prestress corresponding to steps (2) and (3) in
Figure 15 result in the variation of the value measured by the smart strand, which can be used to track the change in the state of the distribution of the prestress force.
Considering that the prestress force measured by the smart strand has changed by
from the prestressing stage to a definite time, it is reasonable to assume that the distribution curve of the prestress force has also translated by
during that period. Even if the change in the distribution of the prestress force can be computed more accurately considering the deformation inside the section of the structure, increasing the accuracy is not worth the effort since the distribution pattern of the prestress force is approximated as a normal distribution. Accordingly, the changed mean prestress force at the considered time becomes
. Noting that the standard deviation has not changed, this means that the distribution of the prestress force at this time can be estimated by the
normal distribution [
5].


