
The Evaluation of Physical Stillness with Wearable Chest and Arm Accelerometer during Chan Ding Practice

 , and
, and 
Abstract
:1. Introduction
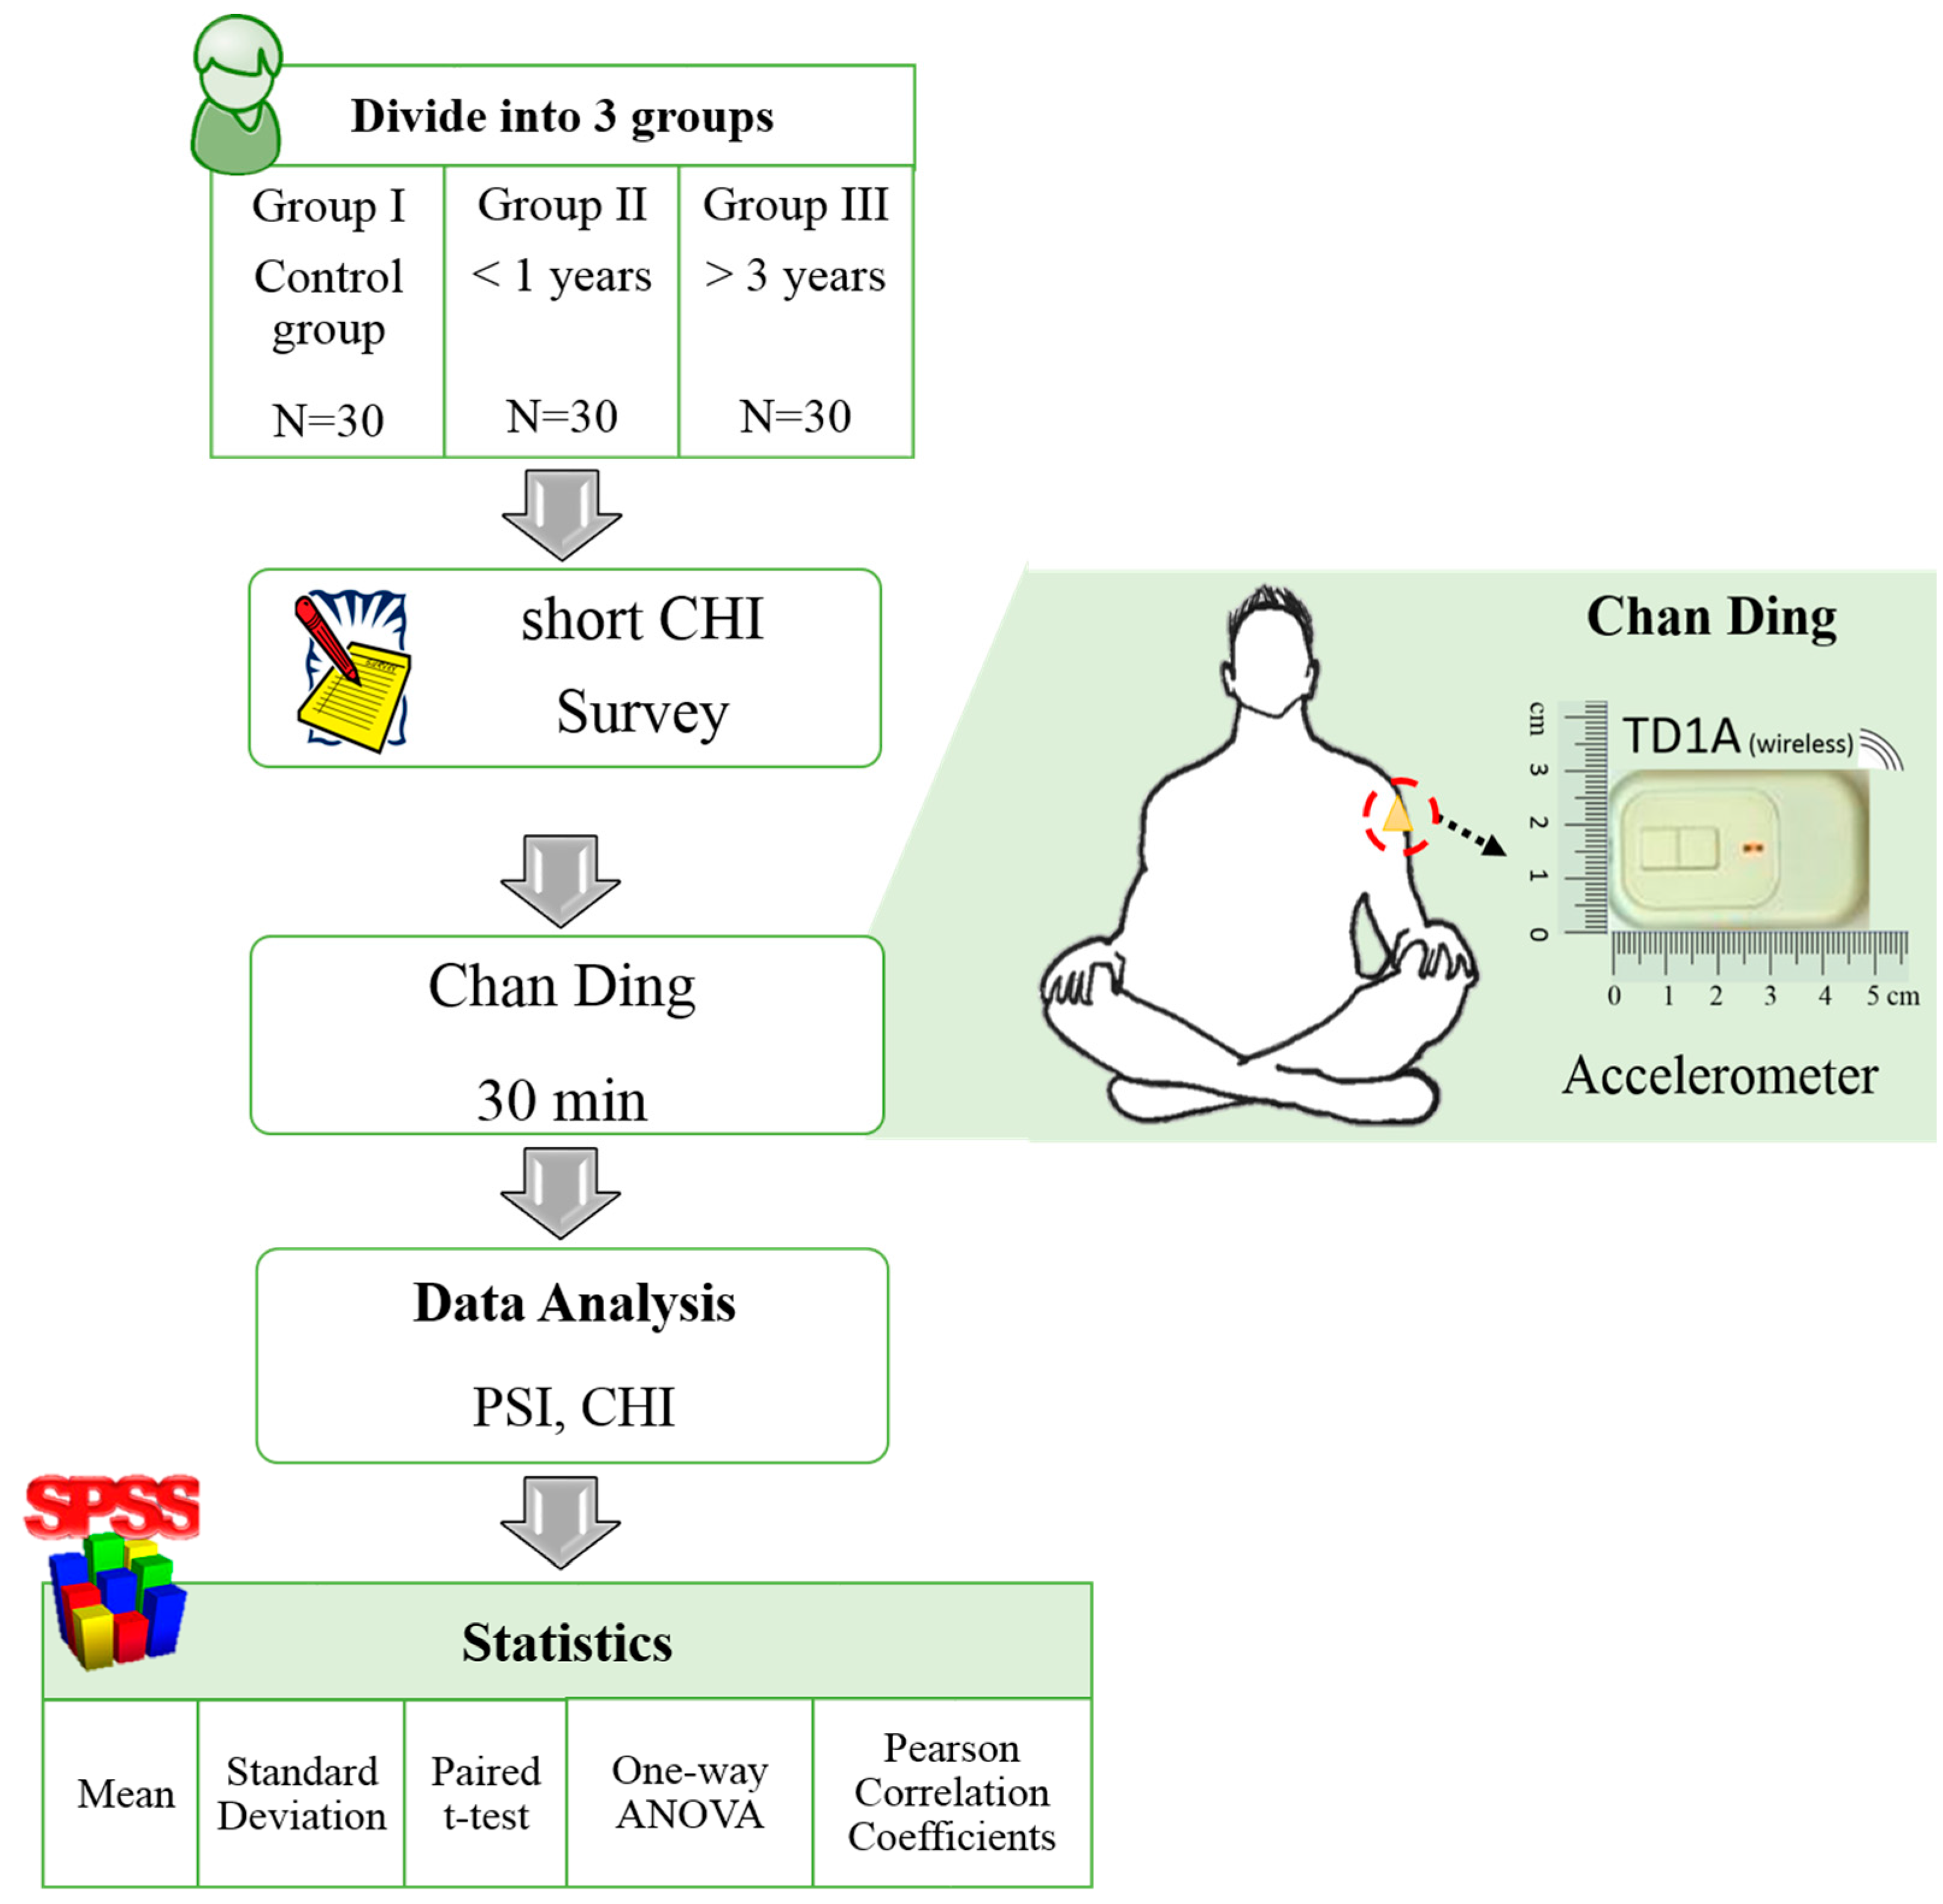
2. Methodology
2.1. Participants
2.2. Surveying Instruments
2.3. The Experiment of Wearable Accelerometers
2.4. Physical Stillness Index (PSI)
2.5. Data Analysis and Statistics
3. Result
3.1. The PSI Analysis for Body Movements
3.2. Long-Term Chan Ding PSI Analysis
3.3. Chinese Happiness Inventory Score and PSI
4. Discussion
5. Conclusions
Acknowledgments
Author Contributions
Conflicts of Interest
References
- Li, Z.; Wei, Z.; Yue, Y.; Wang, H.; Jia, W.; Burke, L.E.; Baranowski, T.; Sun, M. An adaptive Hidden Markov model for activity recognition based on a wearable multi-sensor device. J. Med. Syst. 2015, 39, 57. [Google Scholar] [CrossRef] [PubMed]
- Jeter, P.E.; Moonaz, H.S.; Bittner, A.K.; Dagnelie, G. Ashtanga-Based Yoga Therapy Increases the Sensory Contribution to Postural Stability in Visually-Impaired Persons at Risk for Falls as Measured by the Wii Balance Board: A Pilot Randomized Controlled Trial. PLoS ONE 2015, 10, e0129646. [Google Scholar] [CrossRef] [PubMed]
- O’Donovan, C.; Hussey, J. Active video games as a form of exercise and the effect of gaming experience: A preliminary study in healthy young adults. Physiotherapy 2012, 98, 205–210. [Google Scholar] [CrossRef] [PubMed]
- Cook, S.; Stauffer, J.C.; Goy, J.J.; Graf, D.; Puricel, S.; Frobert, A.; Muller, O.; Togni, M.; Arroyo, D. Heart rate never lies: Interventional cardiologist and Braude’s quote revised. Open Heart 2016, 3, e000373. [Google Scholar] [CrossRef] [PubMed]
- Chen, M.D.; Kuo, C.C.; Pellegrini, C.A.; Hsu, M.J. Accuracy of Wristband Activity Monitors during Ambulation and Activities. Med. Sci. Sports Exerc. 2016. in preparing. [Google Scholar] [CrossRef] [PubMed]
- Yilmaz, T.; Foster, R.; Hao, Y. Detecting vital signs with wearable wireless sensors. Sensors (Basel, Switz.) 2010, 10, 10837–10862. [Google Scholar] [CrossRef] [PubMed]
- Ward, D.S.; Evenson, K.R.; Vaughn, A.; Rodgers, A.B.; Troiano, R.P. Accelerometer use in physical activity: Best practices and research recommendations. Med. Sci. Sports Exerc. 2005, 37 (Suppl. S11), S582–S588. [Google Scholar] [CrossRef] [PubMed]
- Marschollek, M. A Method to Find Generic Thresholds for Identifying Relevant Physical Activity Events in Sensor Data. J. Med. Syst. 2016, 40, 29. [Google Scholar] [CrossRef] [PubMed]
- Chen, S.Y.; Lai, C.F.; Hwang, R.H.; Lai, Y.H.; Wang, M.S. An Adaptive Sensor Data Segments Selection Method for Wearable Health Care Services. J. Med. Syst. 2015, 39, 194. [Google Scholar] [CrossRef] [PubMed]
- Mathie, M.J.; Celler, B.G.; Lovell, N.H.; Coster, A.C. Classification of basic daily movements using a triaxial accelerometer. Med. Biol. Eng. Comput. 2004, 42, 679–687. [Google Scholar] [CrossRef] [PubMed]
- Preece, S.J.; Goulermas, J.Y.; Kenney, L.P.; Howard, D.; Meijer, K.; Crompton, R. Activity identification using body-mounted sensors: A review of classification techniques. Physiol. Meas. 2009, 30, R1–R33. [Google Scholar] [CrossRef] [PubMed]
- Casilari, E.; Luque, R.; Moron, M.J. Analysis of Android Device-Based Solutions for Fall Detection. Sensors 2015, 15, 17827–17894. [Google Scholar] [CrossRef] [PubMed]
- Ozdemir, A.T.; Barshan, B. Detecting falls with wearable sensors using machine learning techniques. Sensors 2014, 14, 10691–10708. [Google Scholar] [CrossRef] [PubMed]
- Kosse, N.M.; Caljouw, S.; Vervoort, D.; Vuillerme, N.; Lamoth, C.J. Validity and Reliability of Gait and Postural Control Analysis Using the Tri-axial Accelerometer of the iPod Touch. Ann. Biomed. Eng. 2015, 43, 1935–1946. [Google Scholar] [CrossRef] [PubMed]
- Meltzer, L.J.; Hiruma, L.S.; Avis, K.; Montgomery-Downs, H.; Valentin, J. Comparison of a Commercial Accelerometer with Polysomnography and Actigraphy in Children and Adolescents. Sleep 2015, 38, 1323–1330. [Google Scholar] [CrossRef] [PubMed]
- Nightingale, T.E.; Walhin, J.P.; Thompson, D.; Bilzon, J.L. Influence of accelerometer type and placement on physical activity energy expenditure prediction in manual wheelchair users. PLoS ONE 2015, 10, e0126086. [Google Scholar] [CrossRef] [PubMed]
- Yurtman, A.; Barshan, B. Automated evaluation of physical therapy exercises using multi-template dynamic time warping on wearable sensor signals. Comput. Methods Programs Biomed. 2014, 117, 189–207. [Google Scholar] [CrossRef] [PubMed]
- Altun, K.; Barshan, B.; Tunçel, O. Comparative study on classifying human activities with miniature inertial and magnetic sensors. Pattern Recognit. 2010, 43, 3605–3620. [Google Scholar] [CrossRef]
- Sayeed, T.; Sama, A.; Catala, A.; Rodriguez-Molinero, A.; Cabestany, J. Adapted step length estimators for patients with Parkinson’s disease using a lateral belt worn accelerometer. Technol. Health Care 2015, 23, 179–194. [Google Scholar] [PubMed]
- Stins, J.F.; Emck, C.; de Vries, E.M.; Doop, S.; Beek, P.J. Attentional and sensory contributions to postural sway in children with autism spectrum disorder. Gait Posture 2015, 42, 199–203. [Google Scholar] [CrossRef] [PubMed]
- Mao, H.Y.; Kuo, L.C.; Yang, A.L.; Su, C.T. Balance in children with attention deficit hyperactivity disorder-combined type. Res. Dev. Disabil. 2014, 35, 1252–1258. [Google Scholar] [CrossRef] [PubMed]
- Ricard, M.; Lutz, A.; Davidson, R.J. Mind of the meditator. Sci. Am. 2014, 311, 38–45. [Google Scholar] [CrossRef] [PubMed]
- Lutz, A.; Slagter, H.A.; Dunne, J.D.; Davidson, R.J. Attention regulation and monitoring in meditation. Trends Cogn. Sci. 2008, 12, 163–169. [Google Scholar] [CrossRef] [PubMed]
- Fredrickson, B.L.; Levenson, R.W. Positive Emotions Speed Recovery from the Cardiovascular Sequelae of Negative Emotions. Cogn. Emot. 1998, 12, 191–220. [Google Scholar] [CrossRef] [PubMed]
- Lo, P.C.; Huang, M.L.; Chang, K.M. EEG alpha blocking correlated with perception of inner light during zen meditation. Am. J. Chin. Med. 2003, 31, 629–642. [Google Scholar] [CrossRef] [PubMed]
- Goyal, M.; Singh, S.; Sibinga, E.S.; Gould, N.F.; Rowland-Seymour, A.; Sharma, R.; Berger, Z.; Sleicher, D.; Maron, D.D.; Shihab, H.M.; et al. Meditation programs for psychological stress and well-being: A systematic review and meta-analysis. JAMA Intern. Med. 2014, 174, 357–368. [Google Scholar]
- Pei-Chen Lo, M.-L.H. Exploring Preventive Power of Ten-Mailuns Actuation in Chan Ding. Int. J. Prev. Med. Res. 2015, 1, 27–34. [Google Scholar]
- Wu, S.D.; Lo, P.C. Inward-attention meditation increases parasympathetic activity: A study based on heart rate variability. Biomed. Res. 2008, 29, 245–250. [Google Scholar] [CrossRef] [PubMed]
- Pavot, W.; Diener, E.; Fujita, F. Extraversion and happiness. Personal. Individ. Differ. 1990, 11, 1299–1306. [Google Scholar] [CrossRef]
- Kawada, T.; Kuratomi, Y.; Kanai, T. Lifestyle determinants of depressive feeling and a feeling of unhappiness among workers: A study in Japan. Work 2009, 33, 255–260. [Google Scholar] [PubMed]
- Ramesh, M.G.; Sathian, B.; Sinu, E.; Kiranmai, S.R. Efficacy of rajayoga meditation on positive thinking: An index for self-satisfaction and happiness in life. J. Clin. Diagn. Res. 2013, 7, 2265–2267. [Google Scholar]
- Luo, L.; Gilmour, R.; Kao, S.F. Cultural values and happiness: An East-West dialogue. J. Soc. Psychol. 2001, 141, 477–493. [Google Scholar] [CrossRef] [PubMed]
- Chang, K.-M.; Chen, S.-H.; Lee, H.-Y.; Ching, C.; Huang, C.-L. A wireless accelerometer-based body posture stability detection system and its application for meditation practitioners. Sensors 2012, 12, 17620–17632. [Google Scholar] [CrossRef] [PubMed]
- Garcia-Ceja, E.; Brena, R.; Carrasco-Jimenez, J.; Garrido, L. Long-term Activity arecognition from wristwatch accelerometer data. Sensors 2014, 14, 22500–22524. [Google Scholar] [CrossRef] [PubMed]
- Boerema, S.; van Velsen, L.; Schaake, L.; Tönis, T.; Hermens, H. Optimal sensor placement for measuring physical activity with a 3D accelerometer. Sensors 2014, 14, 3188–3206. [Google Scholar] [CrossRef] [PubMed]
- Lu, L.; Lin, Y.Y. Family roles and happiness in adulthood. Personal. Individ. Differ. 1998, 25, 195–207. [Google Scholar] [CrossRef]
- Casella, G. Statistical Design; Springer: Heidelberg, Germany, 2008; ISBN 978-0-387-75965-4. [Google Scholar]
- Lin, S.-H. Research on Anger Expression, Interpersonal Relation, and Happiness of Freshmen in University and Colleges of Vocation and Technology. Master’s Thesis, Meiho University, Pintung, Taiwan, 2006. [Google Scholar]
- Manocha, R.; Black, D.; Wilson, L. Quality of life and functional health status of long-term meditators. Evid. Based Complement. Altern. Med. 2012, 2012, 9. [Google Scholar] [CrossRef] [PubMed]
- Rosenzweig, S.; Greeson, J.M.; Reibel, D.K.; Green, J.S.; Jasser, S.A.; Beasley, D. Mindfulness-based stress reduction for chronic pain conditions: Variation in treatment outcomes and role of home meditation practice. J. Psychosom. Res. 2010, 68, 29–36. [Google Scholar] [CrossRef] [PubMed]
- Miller, J.J.; Fletcher, K.; Kabat-Zinn, J. Three-year follow-up and clinical implications of a mindfulness meditation-based stress reduction intervention in the treatment of anxiety disorders. General Hosp. Psych. 1995, 17, 192–200. [Google Scholar] [CrossRef]
- Shoaib, M.; Bosch, S.; Incel, O.D.; Scholten, H.; Havinga, P.J. Fusion of smartphone motion sensors for physical activity recognition. Sensors 2014, 14, 10146–10176. [Google Scholar] [CrossRef] [PubMed]
- Sun, B.; Wang, Y.; Banda, J. Gait characteristic analysis and identification based on the iPhone’s accelerometer and gyrometer. Sensors 2014, 14, 17037–17054. [Google Scholar] [CrossRef] [PubMed]
- Feng, M.; Fukuda, Y.; Mizuta, M.; Ozer, E. Citizen sensors for SHM: Use of accelerometer data from smartphones. Sensors 2015, 15, 2980–2998. [Google Scholar] [CrossRef] [PubMed]


| Body Movement | PSI of the Chest | PSI of the Upper Arm | p-Value | Average Ratio of Arm to Chest |
|---|---|---|---|---|
| AP (20°) | 0.09 ± 0.06 | 0.10 ± 0.08 | 0.61 | 1.1 |
| AP (40°) | 0.17 ± 0.08 | 0.23 ± 0.10 | <0.001 *** | 1.4 |
| AP (60°) | 0.24 ± 0.07 | 0.38 ± 0.09 | <0.001 *** | 1.6 |
| LR (20°) | 0.06 ± 0.03 | 0.09 ± 0.05 | <0.01 ** | 1.5 |
| LR (40°) | 0.14 ± 0.06 | 0.16 ± 0.07 | <0.05 * | 1.1 |
| LR (60°) | 0.20 ± 0.07 | 0.30 ± 0.11 | <0.001 *** | 1.5 |
| HA | 0.05 ± 0.03 | 0.23 ± 0.10 | <0.001 *** | 4.6 |
| NS | 0.01 ± 0.01 | 0.01 ± 0.01 | <0.001 *** | 1.0 |
| Group I | Group II | Group III | p-Value | |
|---|---|---|---|---|
| 0~10 min (Phase I) | 0.013 ± 0.018 | 0.004 ± 0.008 | 0.001 ± 0.001 | 0.001 ** |
| 10~20 min (Phase II) | 0.031 ± 0.042 | 0.005 ± 0.008 | 0.001 ± 0.0005 | <0.001 *** |
| 20~30 min (Phase III) | 0.123 ± 0.155 | 0.012 ± 0.013 | 0.001 ± 0.0003 | <0.001 *** |
| Item | Group I | Group II | Group III |
|---|---|---|---|
| CHI | 10.13 (3.32) a | 17.17 (1.73) b | 25.53 (2.09) c |
| Correlation coefficients between PSI/CHI score | −0.440 d | −0.396 d | −0.537 d |
© 2016 by the authors; licensee MDPI, Basel, Switzerland. This article is an open access article distributed under the terms and conditions of the Creative Commons Attribution (CC-BY) license (http://creativecommons.org/licenses/by/4.0/).
Share and Cite
Chang, K.-M.; Chun, Y.-T.; Chen, S.-H.; Lu, L.; Su, H.-T.J.; Liang, H.-M.; Santhosh, J.; Ching, C.T.-S.; Liu, S.-H. The Evaluation of Physical Stillness with Wearable Chest and Arm Accelerometer during Chan Ding Practice. Sensors 2016, 16, 1126. https://doi.org/10.3390/s16071126
Chang K-M, Chun Y-T, Chen S-H, Lu L, Su H-TJ, Liang H-M, Santhosh J, Ching CT-S, Liu S-H. The Evaluation of Physical Stillness with Wearable Chest and Arm Accelerometer during Chan Ding Practice. Sensors. 2016; 16(7):1126. https://doi.org/10.3390/s16071126
Chicago/Turabian StyleChang, Kang-Ming, Yu-Teng Chun, Sih-Huei Chen, Luo Lu, Hsiao-Ting Jannis Su, Hung-Meng Liang, Jayasree Santhosh, Congo Tak-Shing Ching, and Shing-Hong Liu. 2016. "The Evaluation of Physical Stillness with Wearable Chest and Arm Accelerometer during Chan Ding Practice" Sensors 16, no. 7: 1126. https://doi.org/10.3390/s16071126
APA StyleChang, K.-M., Chun, Y.-T., Chen, S.-H., Lu, L., Su, H.-T. J., Liang, H.-M., Santhosh, J., Ching, C. T.-S., & Liu, S.-H. (2016). The Evaluation of Physical Stillness with Wearable Chest and Arm Accelerometer during Chan Ding Practice. Sensors, 16(7), 1126. https://doi.org/10.3390/s16071126