
A Novel Wearable Device for Food Intake and Physical Activity Recognition


Abstract
:1. Introduction
2. Materials and Methods
2.1. Data Collection Protocol
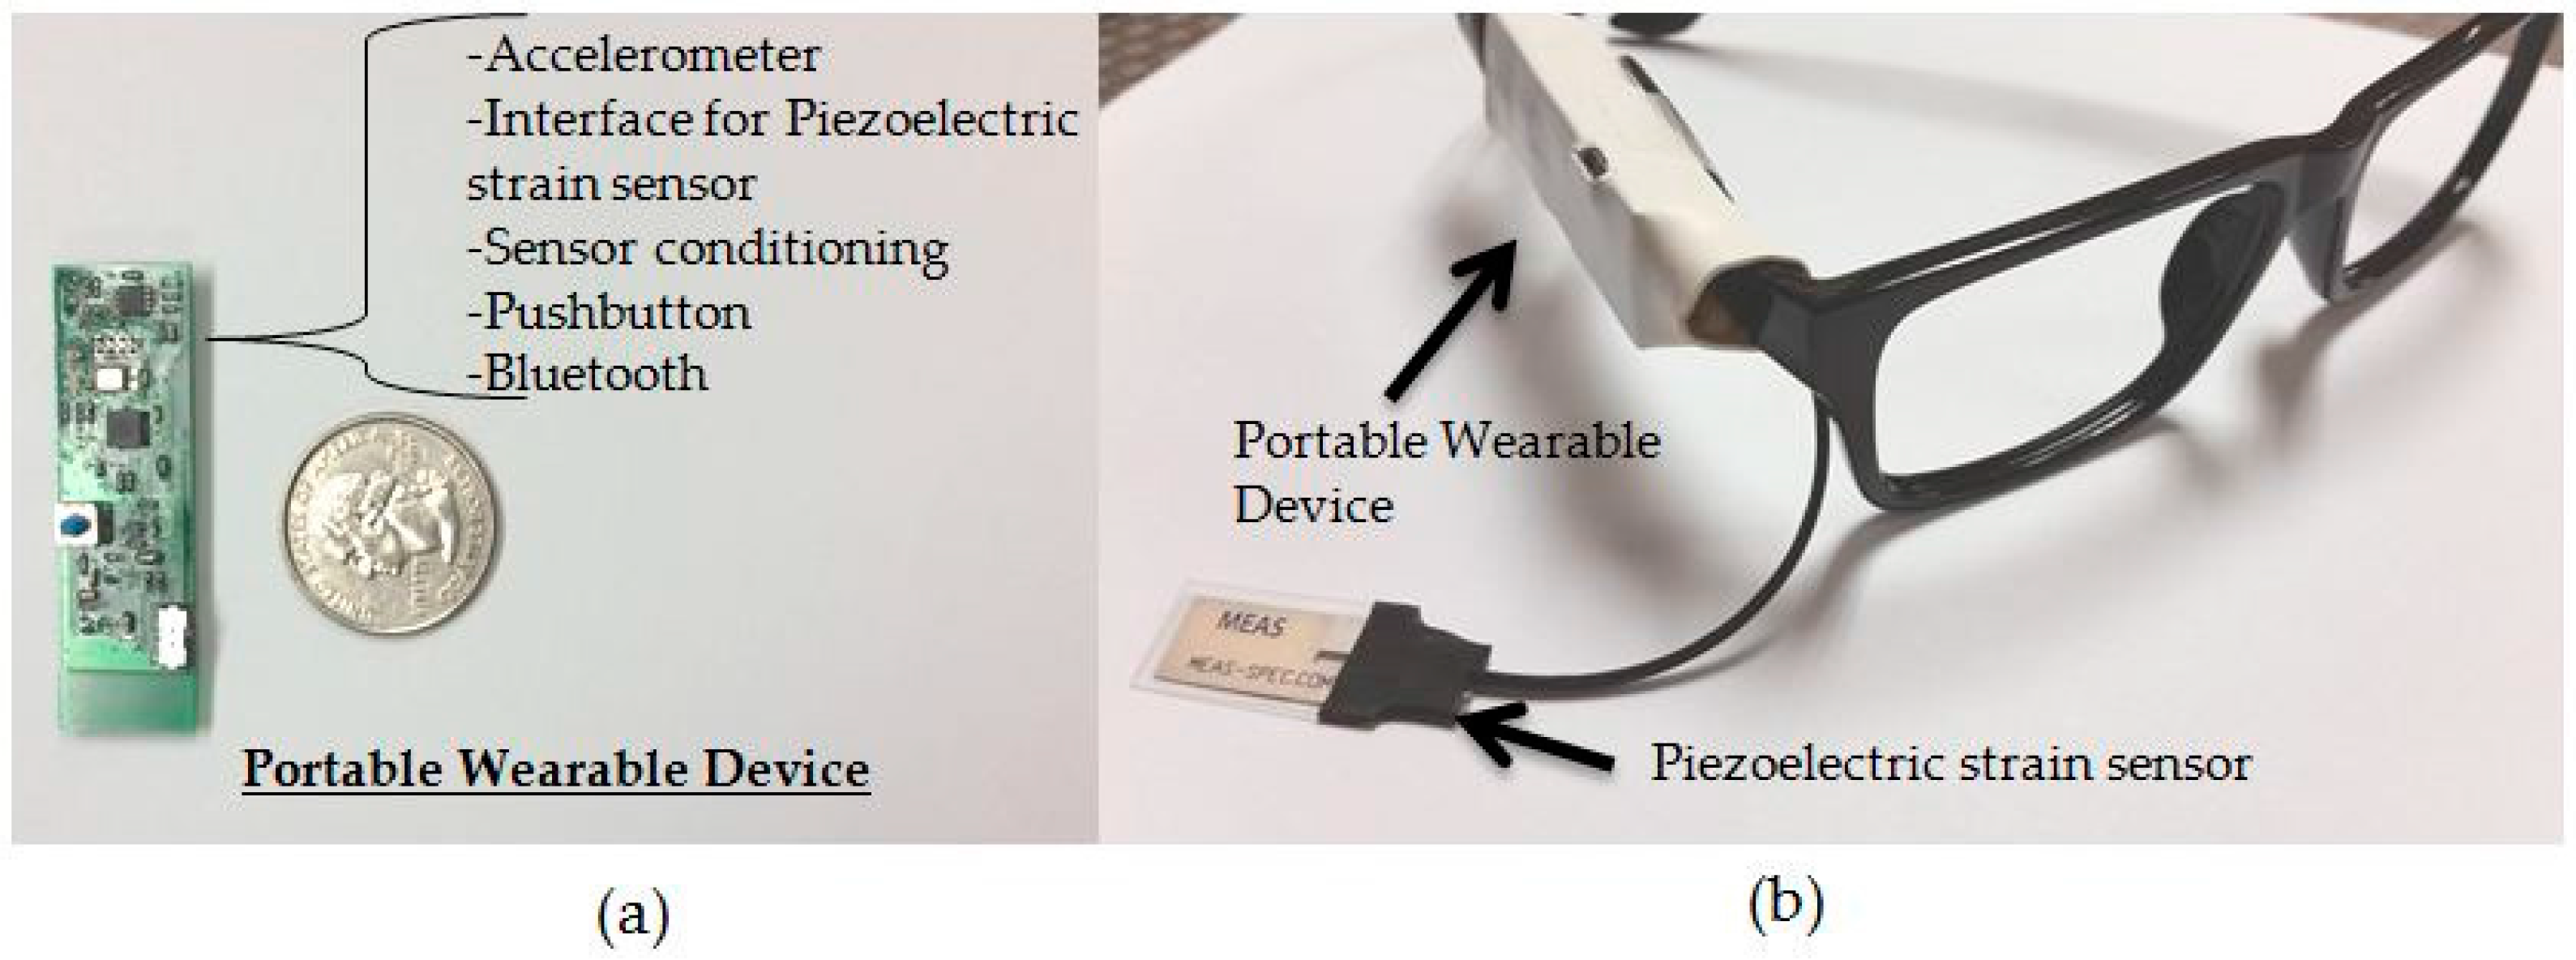
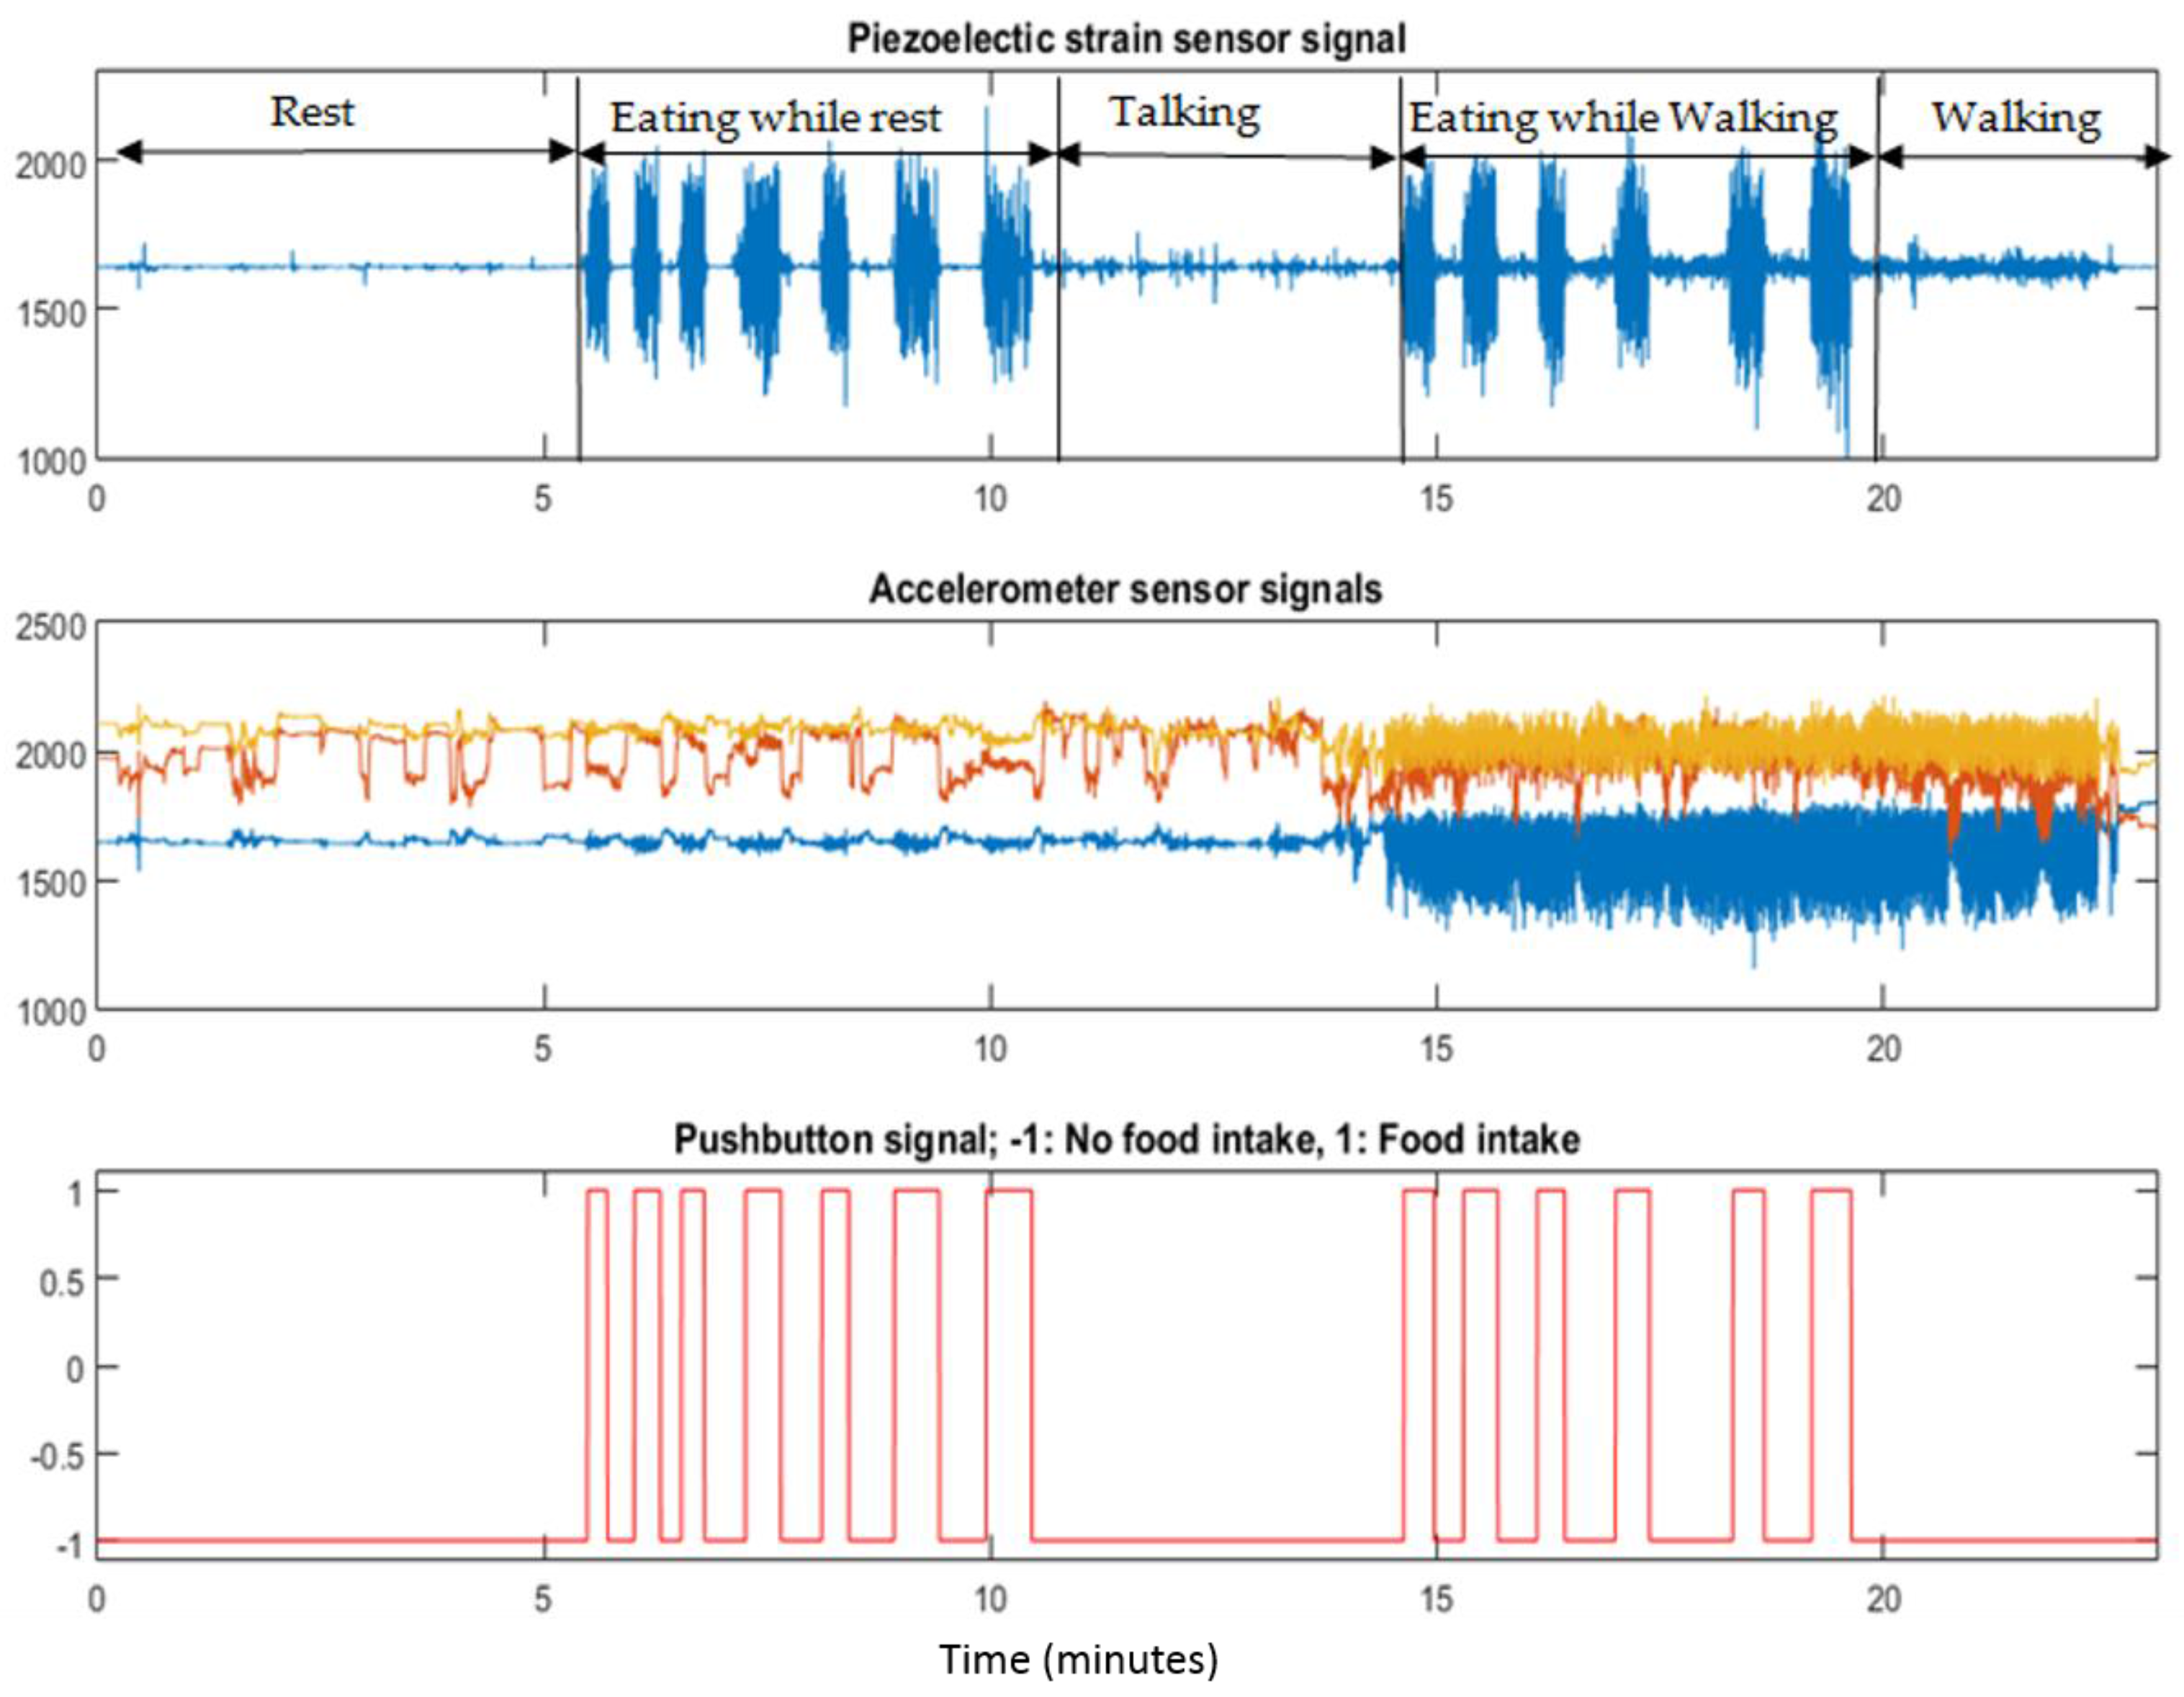
2.2. Sensor System and Annotation
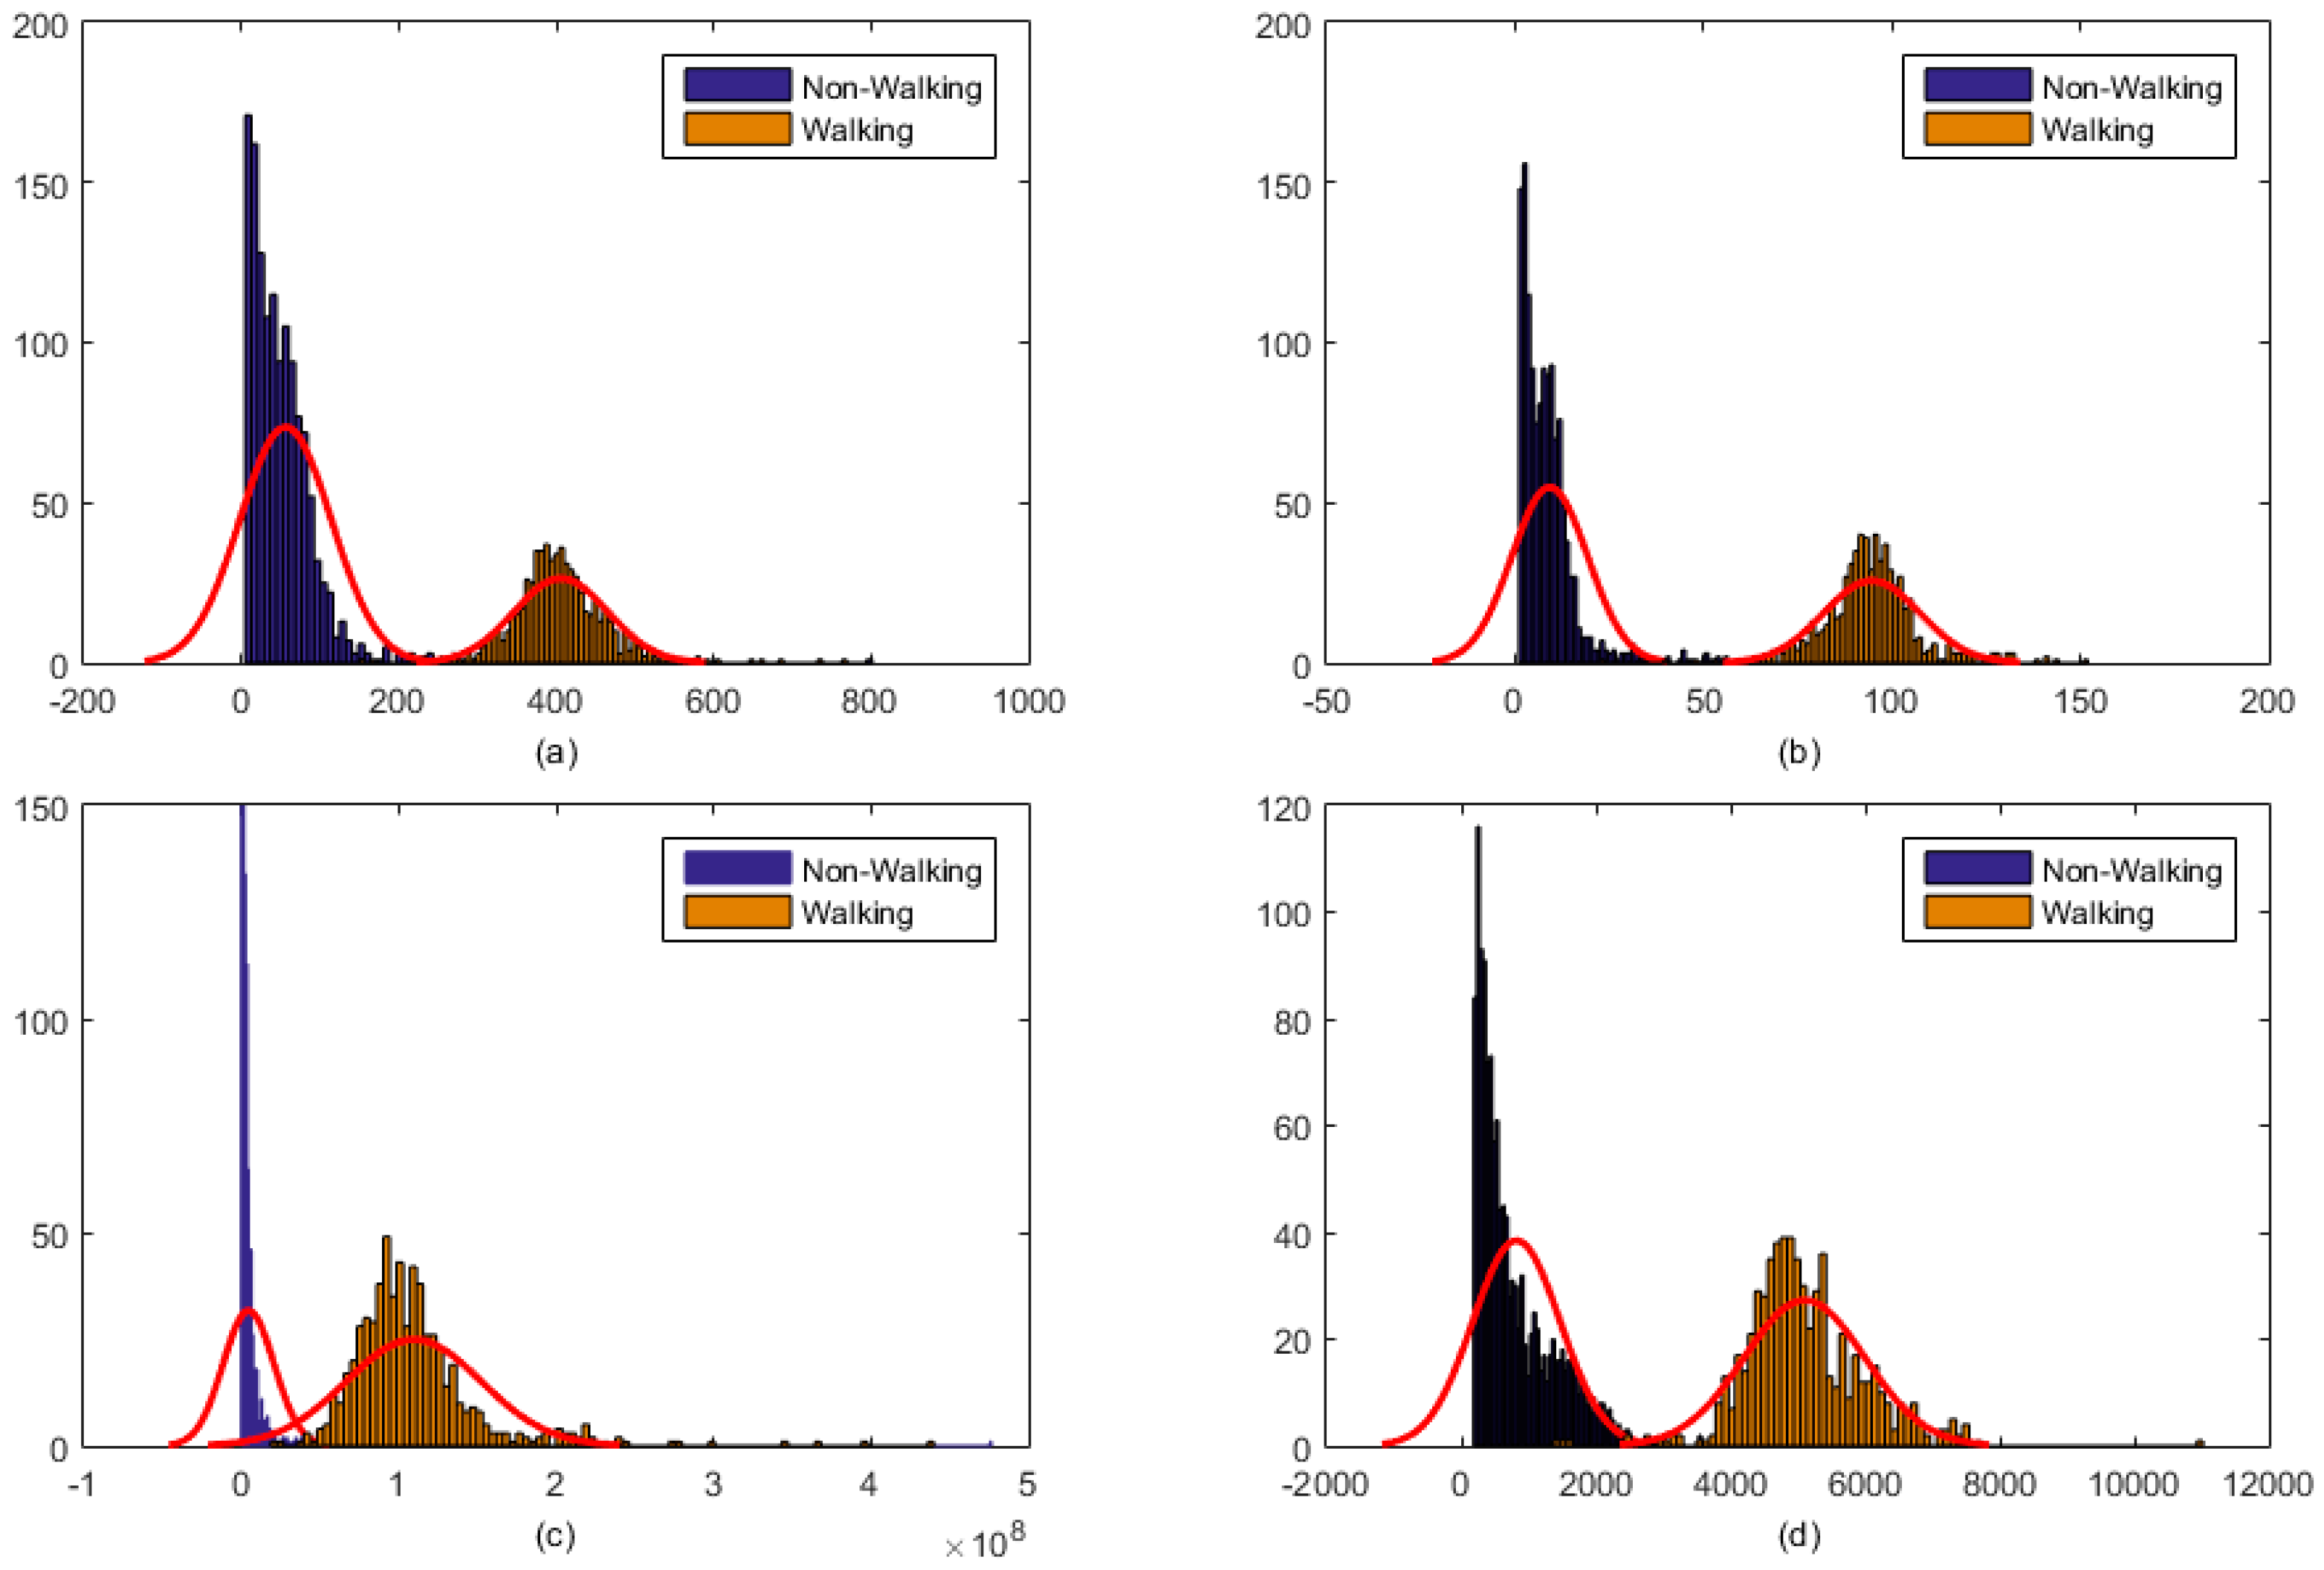
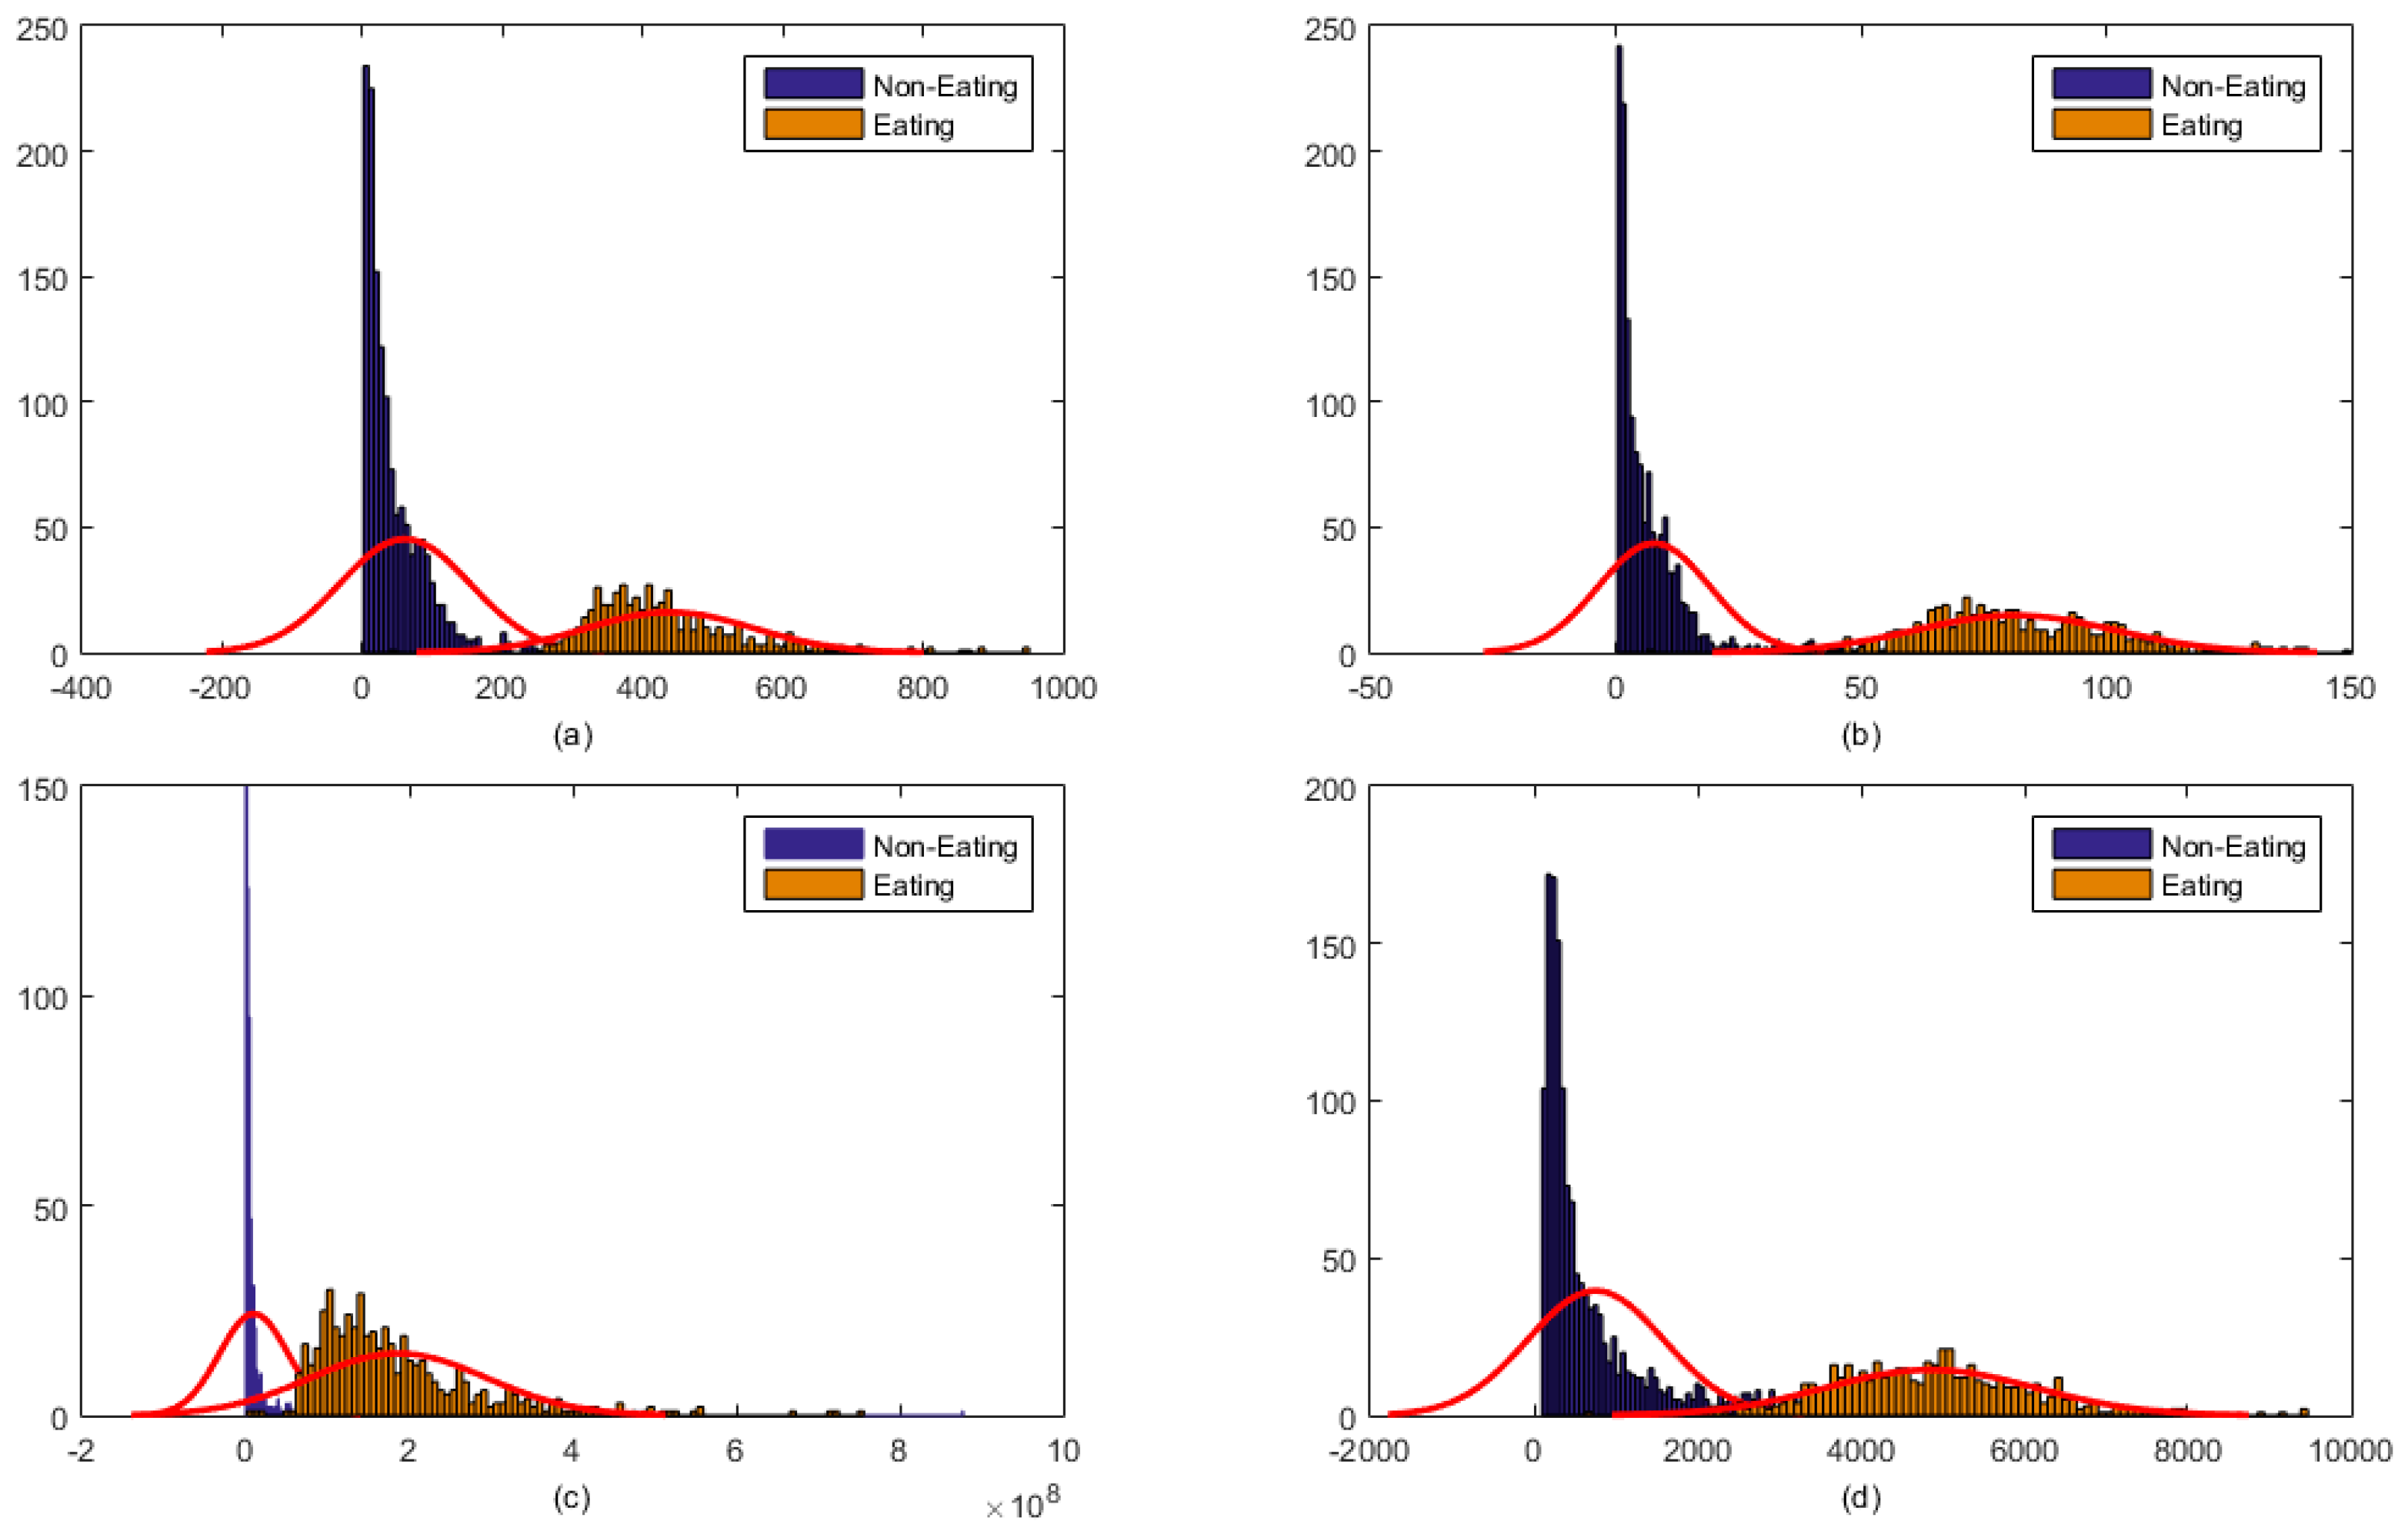
2.3. Signal Processing and Feature Computation
2.4. Multiclass Classification
2.4.1. Single Multiclass Linear SVM with Sensor Fusion
2.4.2. Multi-Stage Classification: Linear SVM + Decision Tree
3. Results
4. Discussion
5. Conclusions
Acknowledgments
Author Contributions
Conflicts of Interest
Abbreviations
| BMI | Body Mass Index |
| TP | True Positive |
| FP | False Positive |
| FN | False Negative |
| FP | False Positive |
| i | ith epoch number |
| x(i) | epoch of sensor signals |
| N | Total number of samples in an epoch |
| fi,chew | Feature vector for piezoelectric strain sensor |
| fi,Acc | Feature vector for Accelerometer signal |
| fi | Feature vector for combined feature vector (sensor fusion) |
| L | length of the epoch in seconds |
References
- Wilfley, D.E.; Schwartz, M.B.; Spurrell, E.B.; Fairburn, C.G. Using the eating disorder examination to identify the specific psychopathology of binge eating disorder. Int. J. Eat. Disord. 2000, 27, 259–269. [Google Scholar] [CrossRef]
- Fairburn, C.G.; Harrison, P.J. Eating disorders. Lancet 2003, 361, 407–416. [Google Scholar] [CrossRef]
- Day, N.E.; McKeown, N.; Wong, M.Y.; Welch, A.; Bingham, S. Epidemiological assessment of diet: A comparison of a 7-day diary with a food frequency questionnaire using urinary markers of nitrogen, potassium and sodium. Int. J. Epidemiol. 2001, 30, 309–317. [Google Scholar] [CrossRef]
- Jonnalagadda, S.S.; Mitchell, D.C.; Smiciklas-Wright, H.; Meaker, K.B.; Van Heel, N.A.N.C.Y.; Karmally, W.; Ershow, A.G.; Kris-Etherton, P.M. Accuracy of Energy Intake Data Estimated by a Multiplepass, 24-hour Dietary Recall Technique. J. Am. Diet. Assoc. 2000, 100, 303–311. [Google Scholar] [CrossRef]
- Beasley, J.M.; Riley, W.T.; Davis, A.; Singh, J. Evaluation of a PDA-based dietary assessment and intervention program: A randomized controlled trial. J. Am. Coll. Nutr. 2008, 27, 280–286. [Google Scholar] [CrossRef] [PubMed]
- Schoeller, D.A.; Bandini, L.G.; Dietz, W.H. Inaccuracies in self-reported intake identified by comparison with the doubly labelled water method. Can. J. Physiol. Pharmacol. 1990, 68, 941–949. [Google Scholar] [CrossRef] [PubMed]
- Black, A.E.; Goldberg, G.R.; Jebb, S.A.; Livingstone, M.B.; Cole, T.J.; Prentice, A.M. Critical evaluation of energy intake data using fundamental principles of energy physiology: 2. Evaluating the results of published surveys. Eur. J. Clin. Nutr. 1991, 45, 583–599. [Google Scholar] [PubMed]
- Livingstone, M.B.E.; Black, A.E. Markers of the validity of reported energy intake. J. Nutr. 2003, 133, 895S–920S. [Google Scholar] [PubMed]
- Schmalz, M.S.; Helal, A.; Mendez-Vasquez, A. Algorithms for the detection of chewing behavior in dietary monitoring applications. In Proceedings of the SPIE Mathematics for Signal and Information Processing, San Diego, CA, USA, 2–5 August 2009.
- Cadavid, S.; Abdel-Mottaleb, M.; Helal, A. Exploiting visual quasi-periodicity for real-time chewing event detection using active appearance models and support vector machines. Pers. Ubiquitous Comput. 2011, 16, 729–739. [Google Scholar] [CrossRef]
- Dong, Y.; Hoover, A.; Scisco, J.; Muth, E. A New Method for Measuring Meal Intake in Humans via Automated Wrist Motion Tracking. Appl. Psychophysiol. Biofeedback 2012, 37, 205–215. [Google Scholar] [CrossRef] [PubMed]
- Dong, Y.; Scisco, J.; Wilson, M.; Muth, E.; Hoover, A. Detecting periods of eating during free-living by tracking wrist motion. IEEE J. Biomed. Health Inform. 2014, 18, 1253–1260. [Google Scholar] [CrossRef] [PubMed]
- Kalantarian, H.; Sarrafzadeh, M. Audio-based detection and evaluation of eating behavior using the smartwatch platform. Comput. Biol. Med. 2015, 65, 1–9. [Google Scholar] [CrossRef] [PubMed]
- Thomaz, E.; Zhang, C.; Essa, I.; Abowd, G.D. Inferring Meal Eating Activities in Real World Settings from Ambient Sounds: A Feasibility Study. In Proceedings of the 20th International Conference on Intelligent User Interfaces, Atlanta, GA, USA, 29 March–1 April 2015; pp. 427–431.
- Thomaz, E.; Essa, I.; Abowd, G.D. A Practical Approach for Recognizing Eating Moments with Wrist-mounted Inertial Sensing. In Proceedings of the 2015 ACM International Joint Conference on Pervasive and Ubiquitous Computing, Osaka, Japan, 7–11 September 2015; pp. 1029–1040.
- Amft, O. A wearable earpad sensor for chewing monitoring. In Proceedings of the 2010 IEEE Sensors, Kona, HI, USA, 1–4 November 2010; pp. 222–227.
- Shuzo, M.; Komori, S.; Takashima, T.; Lopez, G.; Tatsuta, S.; Yanagimoto, S.; Warisawa, S.I.; Delaunay, J.J.; Yamada, I. Wearable Eating Habit Sensing System Using Internal Body Sound. J. Adv. Mech. Des. Syst. Manuf. 2010, 4, 158–166. [Google Scholar] [CrossRef]
- Päßler, S.; Fischer, W.J. Food intake monitoring: Automated chew event detection in chewing sounds. IEEE J. Biomed. Health Inform. 2014, 18, 278–289. [Google Scholar] [CrossRef] [PubMed]
- Fueki, K.; Sugiura, T.; Yoshida, E.; Igarashi, Y. Association between food mixing ability and electromyographic activity of jaw-closing muscles during chewing of a wax cube. J. Oral Rehabil. 2008, 35, 345–352. [Google Scholar] [CrossRef] [PubMed]
- Kohyama, K.; Hatakeyama, E.; Sasaki, T.; Azuma, T.; Karita, K. Effect of sample thickness on bite force studied with a multiple-point sheet sensor. J. Oral Rehabil. 2004, 31, 327–334. [Google Scholar] [CrossRef] [PubMed]
- Bousdras, V.A.; Cunningham, J.L.; Ferguson-Pell, M.; Bamber, M.A.; Sindet-Pedersen, S.; Blunn, G.; Goodship, A.E. A novel approach to bite force measurements in a porcine model in vivo. Int. J. Oral Maxillofac. Surg. 2006, 35, 663–667. [Google Scholar] [CrossRef] [PubMed]
- Fontana, J.M.; Farooq, M.; Sazonov, E. Automatic Ingestion Monitor: A Novel Wearable Device for Monitoring of Ingestive Behavior. IEEE Trans. Biomed. Eng. 2014, 61, 1772–1779. [Google Scholar] [CrossRef] [PubMed]
- Sazonov, E.S.; Fontana, J.M. A Sensor System for Automatic Detection of Food Intake through Non-Invasive Monitoring of Chewing. IEEE Sens. J. 2012, 12, 1340–1348. [Google Scholar] [CrossRef] [PubMed]
- Farooq, M.; Sazonov, E. Comparative testing of piezoelectric and printed strain sensors in characterization of chewing. In Proceedings of the 2015 37th Annual International Conference of the IEEE Engineering in Medicine and Biology Society (EMBC), Milan, Italy, 25–29 August 2015; pp. 7538–7541.
- Farooq, M.; Fontana, J.M.; Boateng, A.F.; Mccrory, M.A.; Sazonov, E. A Comparative Study of Food Intake Detection Using Artificial Neural Network and Support Vector Machine. In Proceedings of the 12th International Conference on Machine Learning and Applications (ICMLA’13), Miami, FL, USA, 4–7 December 2013; pp. 153–157.
- Paßler, S.; Fischer, W.J.; Kraljevski, I. Adaptation of Models for Food Intake Sound Recognition Using Maximum a Posteriori Estimation Algorithm. In Proceedings of the 2012 Ninth International Conference on Wearable and Implantable Body Sensor Networks (BSN), London, UK, 9–12 May 2012; pp. 148–153.
- Bedri, A.; Verlekar, A.; Thomaz, E.; Avva, V.; Starner, T. Detecting Mastication: A Wearable Approach. In Proceedings of the 2015 ACM on International Conference on Multimodal Interaction, Seattle, WA, USA, 9–13 November 2015; pp. 247–250.
- Wang, S.; Zhou, G.; Hu, L.; Chen, Z.; Chen, Y. CARE: Chewing Activity Recognition Using Noninvasive Single Axis Accelerometer. In Proceedings of the 2015 ACM International Joint Conference on Pervasive and Ubiquitous Computing and Proceedings of the 2015 ACM International Symposium on Wearable Computers, Osaka, Japan, 7–11 September 2015; pp. 109–112.
- Fontana, J.M.; Farooq, M.; Sazonov, E. Estimation of Feature Importance for Food Intake Detection Based on Random Forests Classification. In Proceedings of the 2013 35th Annual International Conference of the IEEE Engineering in Medicine and Biology Society (EMBC), Osaka, Japan, 3–7 July 2013; pp. 6756–6759.
- Dodds, W.J. The physiology of swallowing. Dysphagia 1989, 3, 171–178. [Google Scholar] [CrossRef] [PubMed]
- Sazonov, E.; Schuckers, S.; Lopez-Meyer, P.; Makeyev, O.; Sazonova, N.; Melanson, E.L.; Neuman, M. Non-invasive monitoring of chewing and swallowing for objective quantification of ingestive behavior. Physiol. Meas. 2008, 29, 525–541. [Google Scholar] [CrossRef] [PubMed]
- Sazonov, E.S.; Schuckers, S.A.; Lopez-Meyer, P.; Makeyev, O.; Melanson, E.L.; Neuman, M.R.; Hill, J.O. Toward Objective Monitoring of Ingestive Behavior in Free-living Population. Obesity 2009, 17, 1971–1975. [Google Scholar] [CrossRef] [PubMed]
- Makeyev, O.; Lopez-Meyer, P.; Schuckers, S.; Besio, W.; Sazonov, E. Automatic food intake detection based on swallowing sounds. Biomed. Signal Process. Control 2012, 7, 649–656. [Google Scholar] [CrossRef] [PubMed]
- Makeyev, O.; Lopez-Meyer, P.; Schuckers, S.; Besio, W.; Sazonov, E. An Online Swallow Detection Algorithm Based on the Quadratic Variation of Dual-Axis Accelerometry. IEEE Trans. Signal Process. 2010, 58, 3352–3359. [Google Scholar]
- Olubanjo, T.; Ghovanloo, M. Tracheal activity recognition based on acoustic signals. In Proceedings of the 2014 36th Annual International Conference of the IEEE Engineering in Medicine and Biology Society (EMBC), Chicago, IL, USA, 26–30 August 2014; pp. 1436–1439.
- Farooq, M.; Fontana, J.M.; Sazonov, E. A novel approach for food intake detection using electroglottography. Physiol. Meas. 2014, 35, 739. [Google Scholar] [CrossRef] [PubMed]
- Schultheiss, C.; Schauer, T.; Nahrstaedt, H.; Seidl, R.O. Automated Detection and Evaluation of Swallowing Using a Combined EMG/Bioimpedance Measurement System. Sci. World J. 2014, 2014, e405471. [Google Scholar] [CrossRef] [PubMed]
- Kalantarian, H.; Alshurafa, N.; Le, T.; Sarrafzadeh, M. Monitoring eating habits using a piezoelectric sensor-based necklace. Comput. Biol. Med. 2015, 58, 46–55. [Google Scholar] [CrossRef] [PubMed]
- Alshurafa, N.; Kalantarian, H.; Pourhomayoun, M.; Liu, J.J.; Sarin, S.; Shahbazi, B.; Sarrafzadeh, M. Recognition of Nutrition Intake Using Time-Frequency Decomposition in a Wearable Necklace Using a Piezoelectric Sensor. IEEE Sens. J. 2015, 15, 3909–3916. [Google Scholar] [CrossRef]
- Lee, I.M.; Hsieh, C.C.; Paffenbarger, R.S. Exercise intensity and longevity in men: The Harvard Alumni Health Study. J. Am. Med. Assoc. 1995, 273, 1179–1184. [Google Scholar] [CrossRef]
- Fulk, G.D.; Sazonov, E. Using Sensors to Measure Activity in People with Stroke. Top. Stroke Rehabil. 2011, 18, 746–757. [Google Scholar] [CrossRef] [PubMed]
- Karantonis, D.M.; Narayanan, M.R.; Mathie, M.; Lovell, N.H.; Celler, B.G. Implementation of a real-time human movement classifier using a triaxial accelerometer for ambulatory monitoring. IEEE Trans. Inf. Technol. Biomed. 2006, 10, 156–167. [Google Scholar] [CrossRef] [PubMed]
- Knoblauch, R.; Pietrucha, M.; Nitzburg, M. Field Studies of Pedestrian Walking Speed and Start-Up Time. Transp. Res. Rec. J. Transp. Res. Board 1996, 1538, 27–38. [Google Scholar] [CrossRef]
- Blanksma, N.G.; Van Eijden, T.M.G.J. Electromyographic Heterogeneity in the Human Temporalis and Masseter Muscles during Static Biting, Open\Close Excursions, and Chewing. J. Dent. Res. 1995, 74, 1318–1327. [Google Scholar] [CrossRef] [PubMed]
- Po, J.M.C.; Kieser, J.A.; Gallo, L.M.; Tésenyi, A.J.; Herbison, P.; Farella, M. Time-frequency analysis of chewing activity in the natural environment. J. Dent. Res. 2011, 90, 1206–1210. [Google Scholar] [CrossRef] [PubMed]
- Biallas, M.; Andrushevich, A.; Kistler, R.; Klapproth, A.; Czuszynski, K.; Bujnowski, A. Feasibility Study for Food Intake Tasks Recognition Based on Smart Glasses. J. Med. Imaging Health Inform. 2015, 5, 1688–1694. [Google Scholar] [CrossRef]
- Kong, F. Automatic food intake assessment using camera phones. Ph.D. Thesis, Michigan Technological University, Houghton, MI, USA, 2012. [Google Scholar]
- Kong, F.; Tan, J. DietCam: Automatic Dietary Assessment with Mobile Camera Phones. Pervasive Mob. Comput. 2012, 8, 147–163. [Google Scholar] [CrossRef]
- Gillis, L.J.; Kennedy, L.C.; Gillis, A.M.; Bar-Or, O. Relationship between juvenile obesity, dietary energy and fat intake and physical activity. Int. J. Obes. Relat. Metab. Disord. J. Int. Assoc. Study Obes. 2002, 26, 458–463. [Google Scholar] [CrossRef]


| No. | Feature | Description * |
|---|---|---|
| 1 | Range of values | Rng(x(i)) = Max(x(i)) − Min(x(i)) |
| 2 | Standard deviation | STD(x(i)) = |
| 3 | Energy | Eng(x(i)) = |
| 4 | Waveform length | WL(x(i)) = |
| If | Ci,chew | Ci,Acc | Ci | ||
| 1 | −1 | 1: Eating while sitting | |||
| −1 | and | −1 | Then | 2: Sedentary | |
| 1 | 1 | 3: Eating while walking | |||
| −1 | 1 | 4: Walking |
| Eating + Sitting | Sedentary | Eating + Walking | Walking | Recall | F1-Score | |
|---|---|---|---|---|---|---|
| Eating + Sitting | 310 | 9 | 3 | 0 | 96.58% | 96.58% |
| Sedentary | 11 | 1128 | 0 | 16 | 97.66% | 98.09% |
| Eating + Walking | 0 | 0 | 256 | 15 | 95.20% | 94.16% |
| Walking | 0 | 6 | 17 | 414 | 94.28% | 93.85% |
| Precision | 96.58% | 98.52% | 93.14% | 93.42% | Mean: | 95.67% |
| Eating + Sitting | Sedentary | Eating + Walking | Walking | Recall | F1-Score | |
|---|---|---|---|---|---|---|
| Eating + Sitting | 322 | 0 | 0 | 0 | 100.00% | 100.00% |
| Sedentary | 0 | 1155 | 0 | 0 | 100.00% | 100.00% |
| Eating + Walking | 0 | 0 | 269 | 2 | 99.26% | 99.63% |
| Walking | 0 | 0 | 0 | 437 | 100.00% | 99.77% |
| Precision | 100.00% | 100.00% | 100.00% | 99.54% | Mean: | 99.85% |
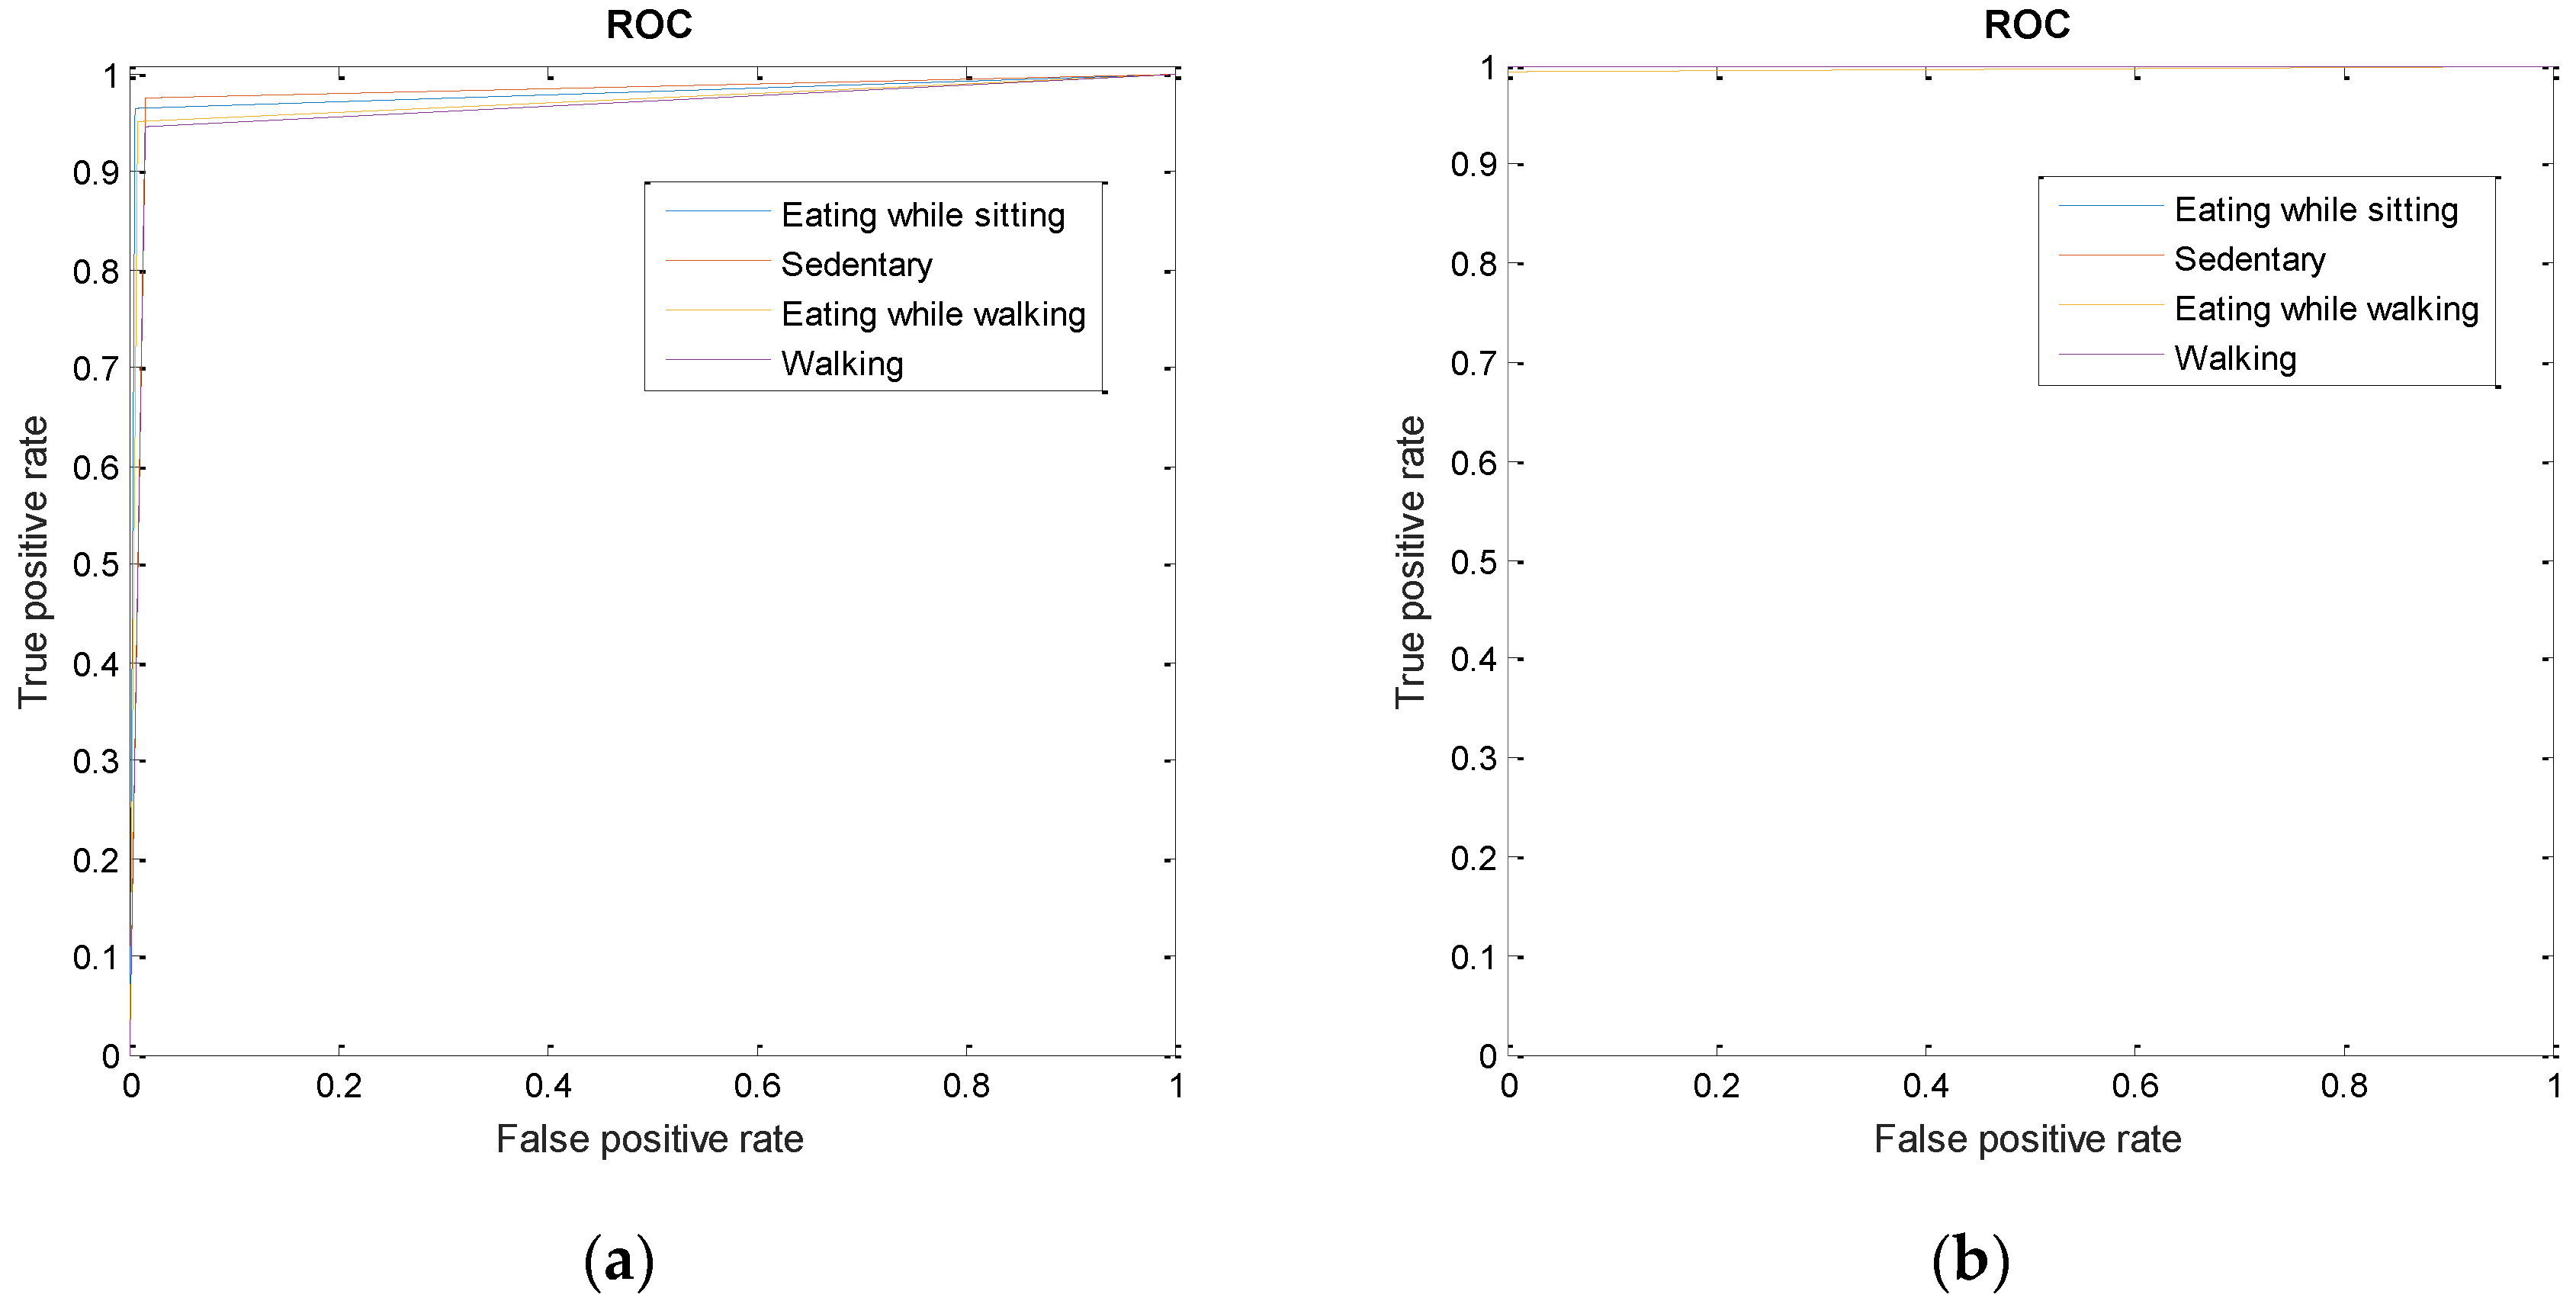
| Classifier | Eating + Sitting | Sedentary | Eating + Walking | Walking | Mean |
|---|---|---|---|---|---|
| Signle multiclass SVM | 0.98 | 0.98 | 0.97 | 0.96 | 0.97 |
| Two-stage classification | 1 | 1 | 0.99 | 0.99 | 0.99 |
© 2016 by the authors; licensee MDPI, Basel, Switzerland. This article is an open access article distributed under the terms and conditions of the Creative Commons Attribution (CC-BY) license (http://creativecommons.org/licenses/by/4.0/).
Share and Cite
Farooq, M.; Sazonov, E. A Novel Wearable Device for Food Intake and Physical Activity Recognition. Sensors 2016, 16, 1067. https://doi.org/10.3390/s16071067
Farooq M, Sazonov E. A Novel Wearable Device for Food Intake and Physical Activity Recognition. Sensors. 2016; 16(7):1067. https://doi.org/10.3390/s16071067
Chicago/Turabian StyleFarooq, Muhammad, and Edward Sazonov. 2016. "A Novel Wearable Device for Food Intake and Physical Activity Recognition" Sensors 16, no. 7: 1067. https://doi.org/10.3390/s16071067
APA StyleFarooq, M., & Sazonov, E. (2016). A Novel Wearable Device for Food Intake and Physical Activity Recognition. Sensors, 16(7), 1067. https://doi.org/10.3390/s16071067