
Recognizing Physisorption and Chemisorption in Carbon Nanotubes Gas Sensors by Double Exponential Fitting of the Response

Abstract
:1. Introduction
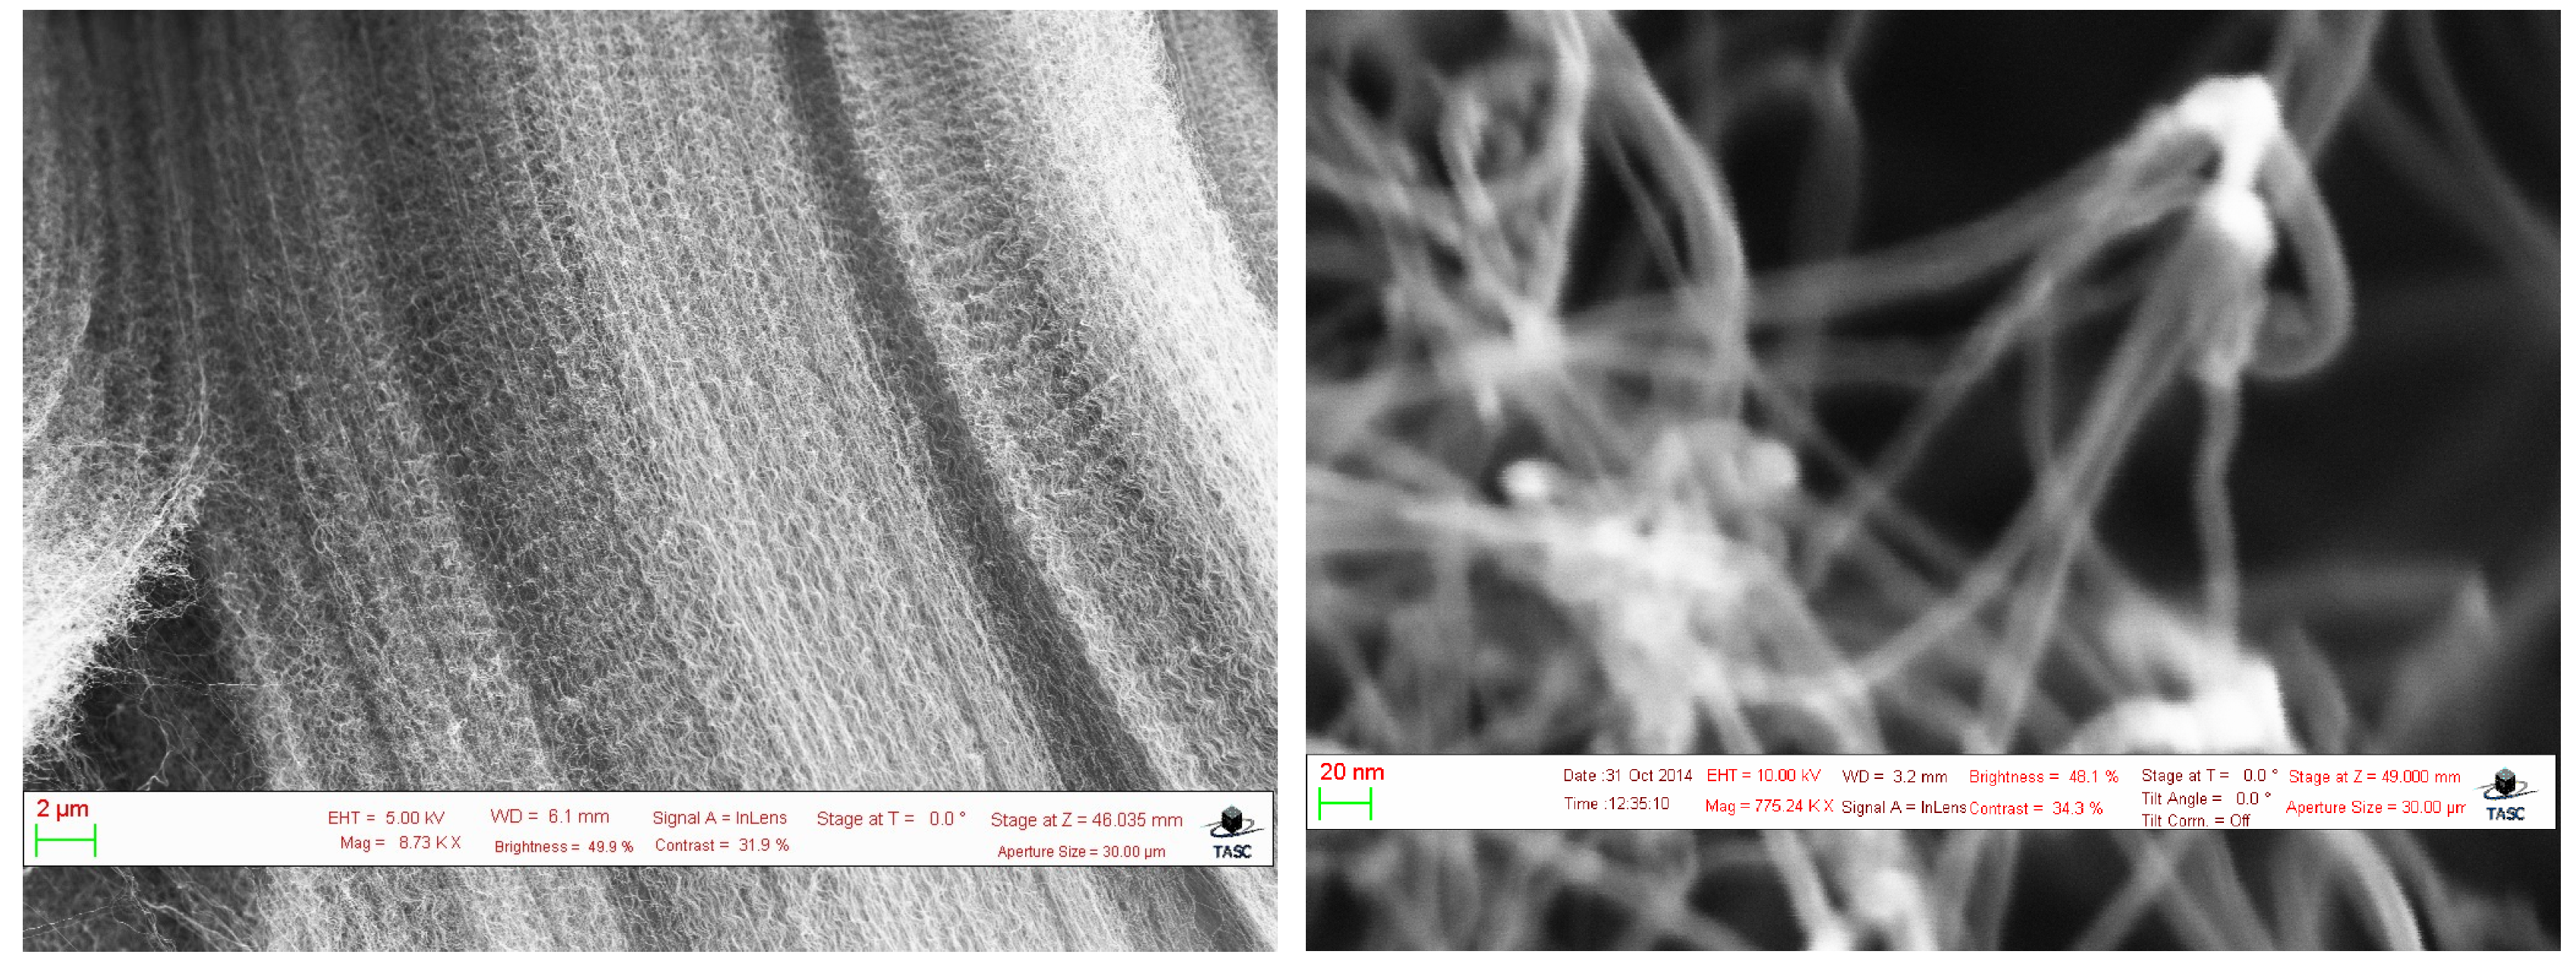
- on the surface of a nanotube (mainly on defects),
- inside CNTs bundles.
2. Experimental
3. Results and Discussion
4. Conclusions
Acknowledgments
Author Contributions
Conflicts of Interest
References
- Liu, X.; Cheng, S.; Liu, H.; Hu, S.; Zhang, D.; Ning, H. A survey on gas sensing technology. Sensors 2012, 12, 9635–9665. [Google Scholar] [CrossRef] [PubMed]
- Sinha, N.; Ma, J.; Yeow, J.T. Carbon nanotube-based sensors. J. Nanosc. Nanotech. 2006, 6, 573–590. [Google Scholar] [CrossRef]
- Rahman, M.M.; Ahammad, A.; Jin, J.-H.; Ahn, S.J.; Lee, J.J. A comprehensive review of glucose biosensors based on nanostructured metal-oxides. Sensors 2010, 10, 4855–4886. [Google Scholar] [CrossRef] [PubMed]
- Wang, Y.; Yeow, J.T. A review of carbon nanotubes-based gas sensors. J. Sens. 2009, 2009, 1–24. [Google Scholar] [CrossRef]
- Jimenez-Cadena, G.; Riu, J.; Rius, F.X. Gas sensors based on nanostructured materials. Analyst 2007, 132, 1083–1099. [Google Scholar] [CrossRef] [PubMed]
- Choi, K.J.; Jang, H.W. One-dimensional oxide nanostructures as gas-sensing materials: Review and issues. Sensors 2010, 10, 4083–4099. [Google Scholar] [CrossRef] [PubMed]
- Avouris, P.; Appenzeller, J.; Martel, R.; Wind, S.J. Carbon nanotube electronics. IEEE Proc. 2003, 91, 1772–1784. [Google Scholar] [CrossRef]
- Avouris, P.; Chen, Z.; Perebeinos, V. Carbon-based electronics. Nat. Nanotech. 2007, 2, 605–615. [Google Scholar] [CrossRef] [PubMed]
- Sayago, I.; Terrado, E.; Aleixandre, M.; Horrillo, M.C.; Fernández, M.J.; Lozano, J.; Lafuente, E.; Maser, W.K.; Benito, A.M.; Martinez, M.T.; et al. Novel Selective senors based on carbon nanotube films for hydrogen detection. Sens. Actuators B Chem. 2007, 122, 75–80. [Google Scholar] [CrossRef]
- Boyda, A.; Dubea, I.; Fedorovb, G.; Paranjapea, M.; Barbaraa, P. Gas sensing Mechanism of carbon nanotubes: From single tubes to high-density networks. Carbon 2014, 69, 417–423. [Google Scholar] [CrossRef]
- Alvi, M.; Al-Hartomy, O.A.; Al-Ghamdi, A. Carbon mono-oxide gas sensing properties of multi-walled carbon nanotubes decorated with platinum nanoparticles based film sensors. Composite 2014, 9, 35–43. [Google Scholar]
- Chang, H.; Lee, J.D.; Lee, S.M.; Lee, Y.H. Adsorption of NH3 and NO2 molecules on carbon nanotubes. Appl. Phys. Lett. 2001, 79, 3863–3865. [Google Scholar] [CrossRef]
- Li, C.; Thostenson, E.T.; Chou, T.W. Sensors and actuators based on carbon nanotubes and their composites: A review. Compos. Sci. Technol. 2008, 68, 1227–1249. [Google Scholar] [CrossRef]
- Huang, C.-S.; Huang, B.; Hsiao, C.; Yeh, C.; Huang, C.; Jang, Y. Effects of the catalyst pretreatment on CO2 sensors made by carbon nanotubes. Diam. Relat. Mater. 2008, 17, 624–627. [Google Scholar] [CrossRef]
- Chopra, S.; McGuire, K.; Gothard, N.; Rao, A.M.; Pham, A. Selective gas detection using a carbon nanotube sensor. Appl. Phys. Lett. 2003, 83. [Google Scholar] [CrossRef]
- Star, A.; Han, T.-R.; Joshi, V.; Gabriel, J.-C.; Grüner, G. Nanoelectronic carbon dioxide sensors. Adv. Mater. 2004, 16, 2049–2052. [Google Scholar] [CrossRef]
- Mubeen, S.; Zhang, T.; Yoo, B.; Deshusses, M.A.; Myung, N.V. Palladium nanoparticles decorated single-walled carbon nanotube hydrogen sensor. J. Phys. Chem. C 2007, 111, 6321–6327. [Google Scholar] [CrossRef]
- Kong, J.; Chapline, M.G.; Dai, H. Functionalized carbon nanotubes for molecular hydrogen sensors. Adv. Mat. 2001, 13, 1384–1386. [Google Scholar] [CrossRef]
- Varghese, O.; Kichambre, P.; Gong, D.; Ong, K.; Dickey, E.; Grimes, C. Gas sensing characteristics of multi-wall carbon nanotubes. Sens. Actuators B Chem. 2001, 81, 32–41. [Google Scholar] [CrossRef]
- Tan, Q.; Fang, J.; Liu, W.; Xiong, J.; Zhang, W. Acetone Sensing Properties of a Gas Sensor Composed of Carbon Nanotubes Doped With Iron Oxide Nanopowder. Sensors 2015, 15, 28502–28512. [Google Scholar] [CrossRef] [PubMed]
- Wong, Y.M.; Kang, W.P.; Davidson, J.L.; Wisitsora-at, A.; Soh, K.L. A novel microelectronic gas sensor utilizing carbon nanotubes for hydrogen gas detection. Sens. Actuators B Chem. 2003, 93, 327–332. [Google Scholar] [CrossRef]
- Zhang, T.; Mubeen, S.; Myung, N.V.; Deshusses, M.A. Recent progress in carbon nanotube-based gas sensors. Nanotechnology 2008, 19. [Google Scholar] [CrossRef] [PubMed]
- Choopun, S.; Hongsith, N.; Wongrat, E. Metal-Oxide Nanowires for Gas Sensors. Available online: http://www.intechopen.com/books/nanowires-recent-advances/metal-oxide-nanowires-for-gas-sensors (accessed on 1 February 2016).
- Nallon, E.C.; Schnee, V.P.; Bright, C.; Polcha, M.P.; Li, Q. Chemical Discrimination with an Unmodified Graphene Chemical Sensor. ACS Sens. 2015, 1, 26–31. [Google Scholar] [CrossRef]
- Rigoni, F.; Tognolini, S.; Borghetti, P.; Drera, G.; Pagliara, S.; Goldoni, A.; Sangaletti, L. Enhancing the sensitivity of chemiresistor gas sensors based on pristine carbon nanotubes to detect low-ppb ammonia concentrations in the environment. Analyst 2013, 138, 7392–7401. [Google Scholar] [CrossRef] [PubMed]
- Novak, J.P.; Snow, E.S.; Houser, E.J.; Park, D.; Stepnowski, J.L.; Mcgill, R.A. Nerve agent detection using networks of single-walled carbon nanotubes. Appl. Phys. Lett. 2003, 83. [Google Scholar] [CrossRef]
- Wang, S.; Zhang, Q.; Yang, D.; Sellin, P.; Zhong, G. Multi-walled carbon nanotube-based gas sensors for NH3 detection. Diam. Relat. Mater. 2004, 13, 1327–1332. [Google Scholar] [CrossRef]
- Barghi, S.H.; Tsotsis, T.T.; Sahimi, M. Chemisorption, physisorption and hysteresis during hydrogen storage in carbon nanotubes. Int. J. Hydrogen. Energy 2014, 39, 1390–1397. [Google Scholar] [CrossRef]
- Froudakis, G.E. Hydrogen interaction with carbon nanotubes: A review of ab initio studies. J. Phys. Condens. Mat. 2002, 14, R453–R465. [Google Scholar] [CrossRef]
- Trocino, S.; Donato, A.; Latino, M.; Donato, N.; Leonardi, S.G.; Neri, G. Pt-TiO2/MWCNTs hybrid composites for monitoring low hydrogen concentrations in air. Sensors 2012, 12, 12361–12373. [Google Scholar] [CrossRef]
- Melechko, A.V.; Merkulov, V.I.; McKnight, T.E.; Guillorn, M.; Klein, K.L.; Lowndes, D.H.; Simpson, M.L. Vertically aligned carbon nanofibers and related structures: Controlled synthesis and directed assembly. J. Appl. Phys. 2005, 97. [Google Scholar] [CrossRef]
- Dai, H. Carbon nanotubes: Synthesis, integration, and properties. Account. Chem. Res. 2002, 35, 1035–1044. [Google Scholar] [CrossRef]


| (a) | |||||
|---|---|---|---|---|---|
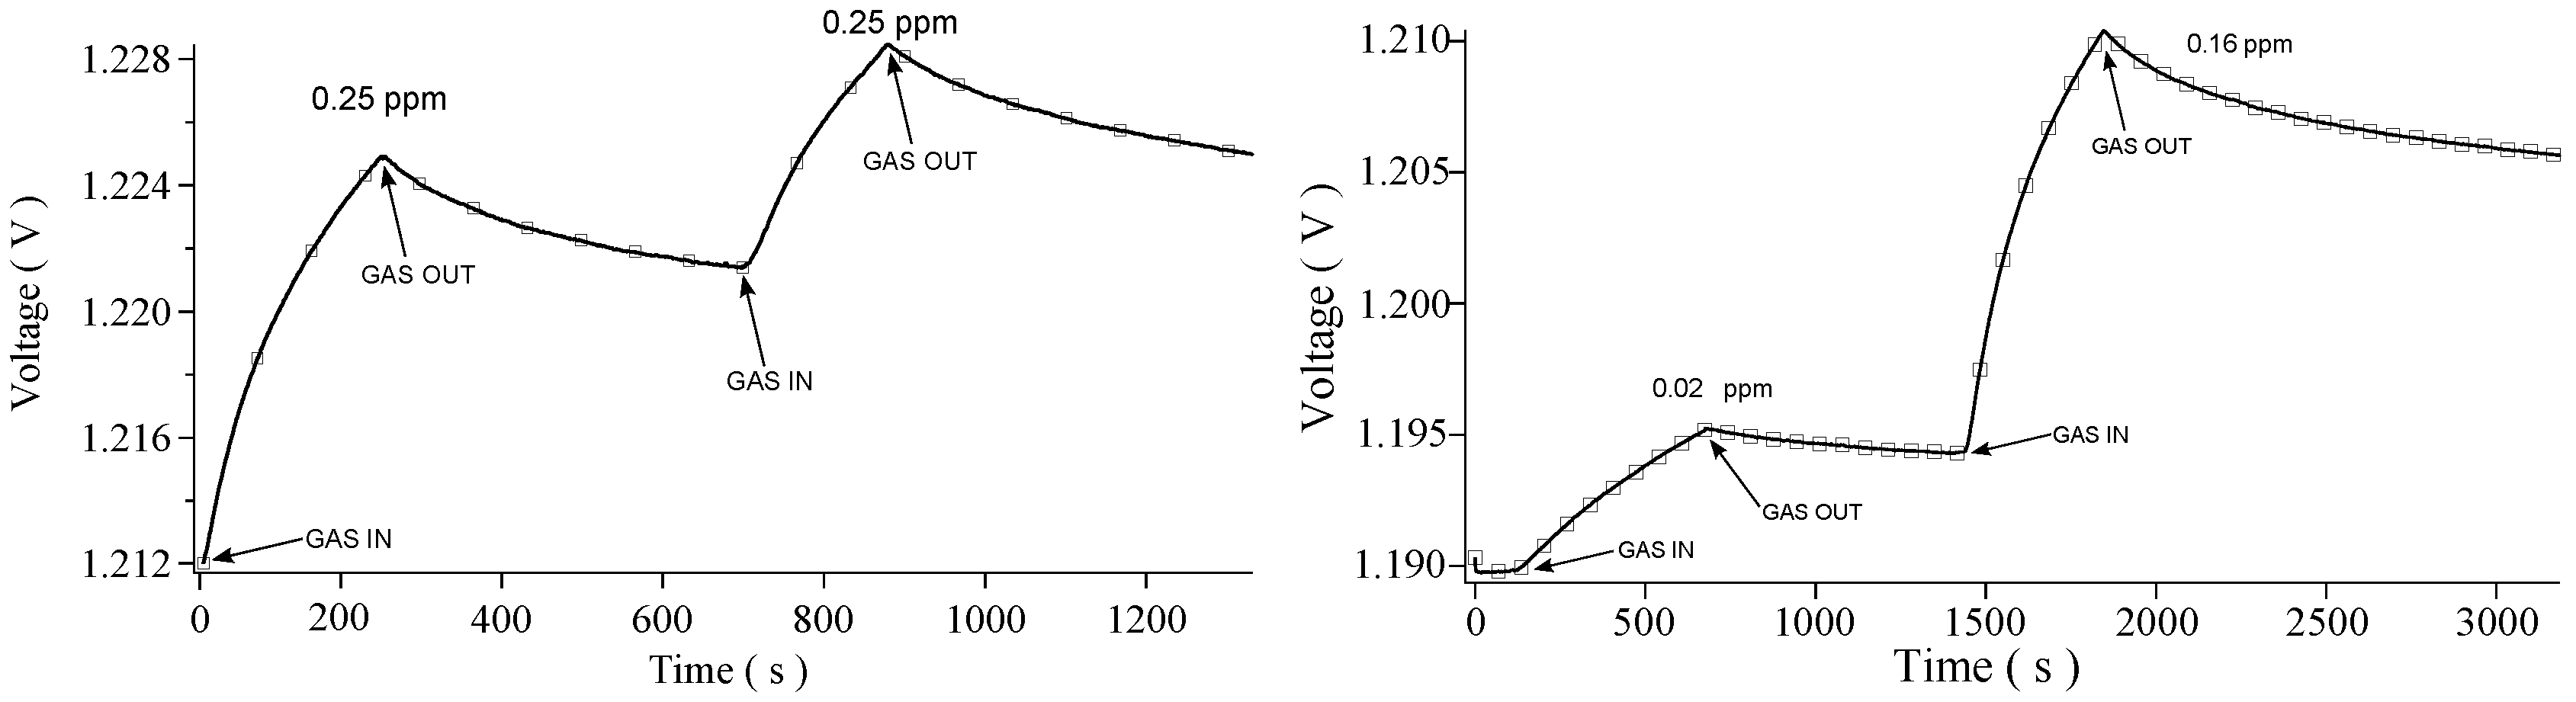
| Concentration | 0.02 ppm | 0.11 ppm | 0.16 ppm | 0.25 ppm | 0.25 ppm |
| ascent | 1.64 | 70.14 | 92.06 | 39.46 | 3.28 |
| descent | 1.38 | 4.95 | 28.66 | 2.69 | 2.97 |
| (b) | |||||
| Concentration | 0.02 ppm | 0.11 ppm | 0.16 ppm | 0.25 ppm | 0.25 ppm |
| ascent | 1.32 | 1.16 | 1.72 | 1.29 | 1.16 |
| descent | 1.22 | 3.21 | 1.75 | 0.82 | 0.66 |
| Characteristic Times as Given by the Model for the Case | |||||
|---|---|---|---|---|---|
| Concentration (ppm) | 0.02 | 0.11 | 0.16 | 0.25 | 0.25 |
| ascent (s) | 327 | 76.7 | 104 | 53.5 | 47.6 |
| ascent (s) | 2060 | 892 | 1250 | 783 | 511 |
| descent (s) | 254 | 161 | 130 | 63.3 | 35.2 |
| descent (s) | 8200 | 8450 | 896 | 494 | 272 |
| Characteristic times for | ||
|---|---|---|
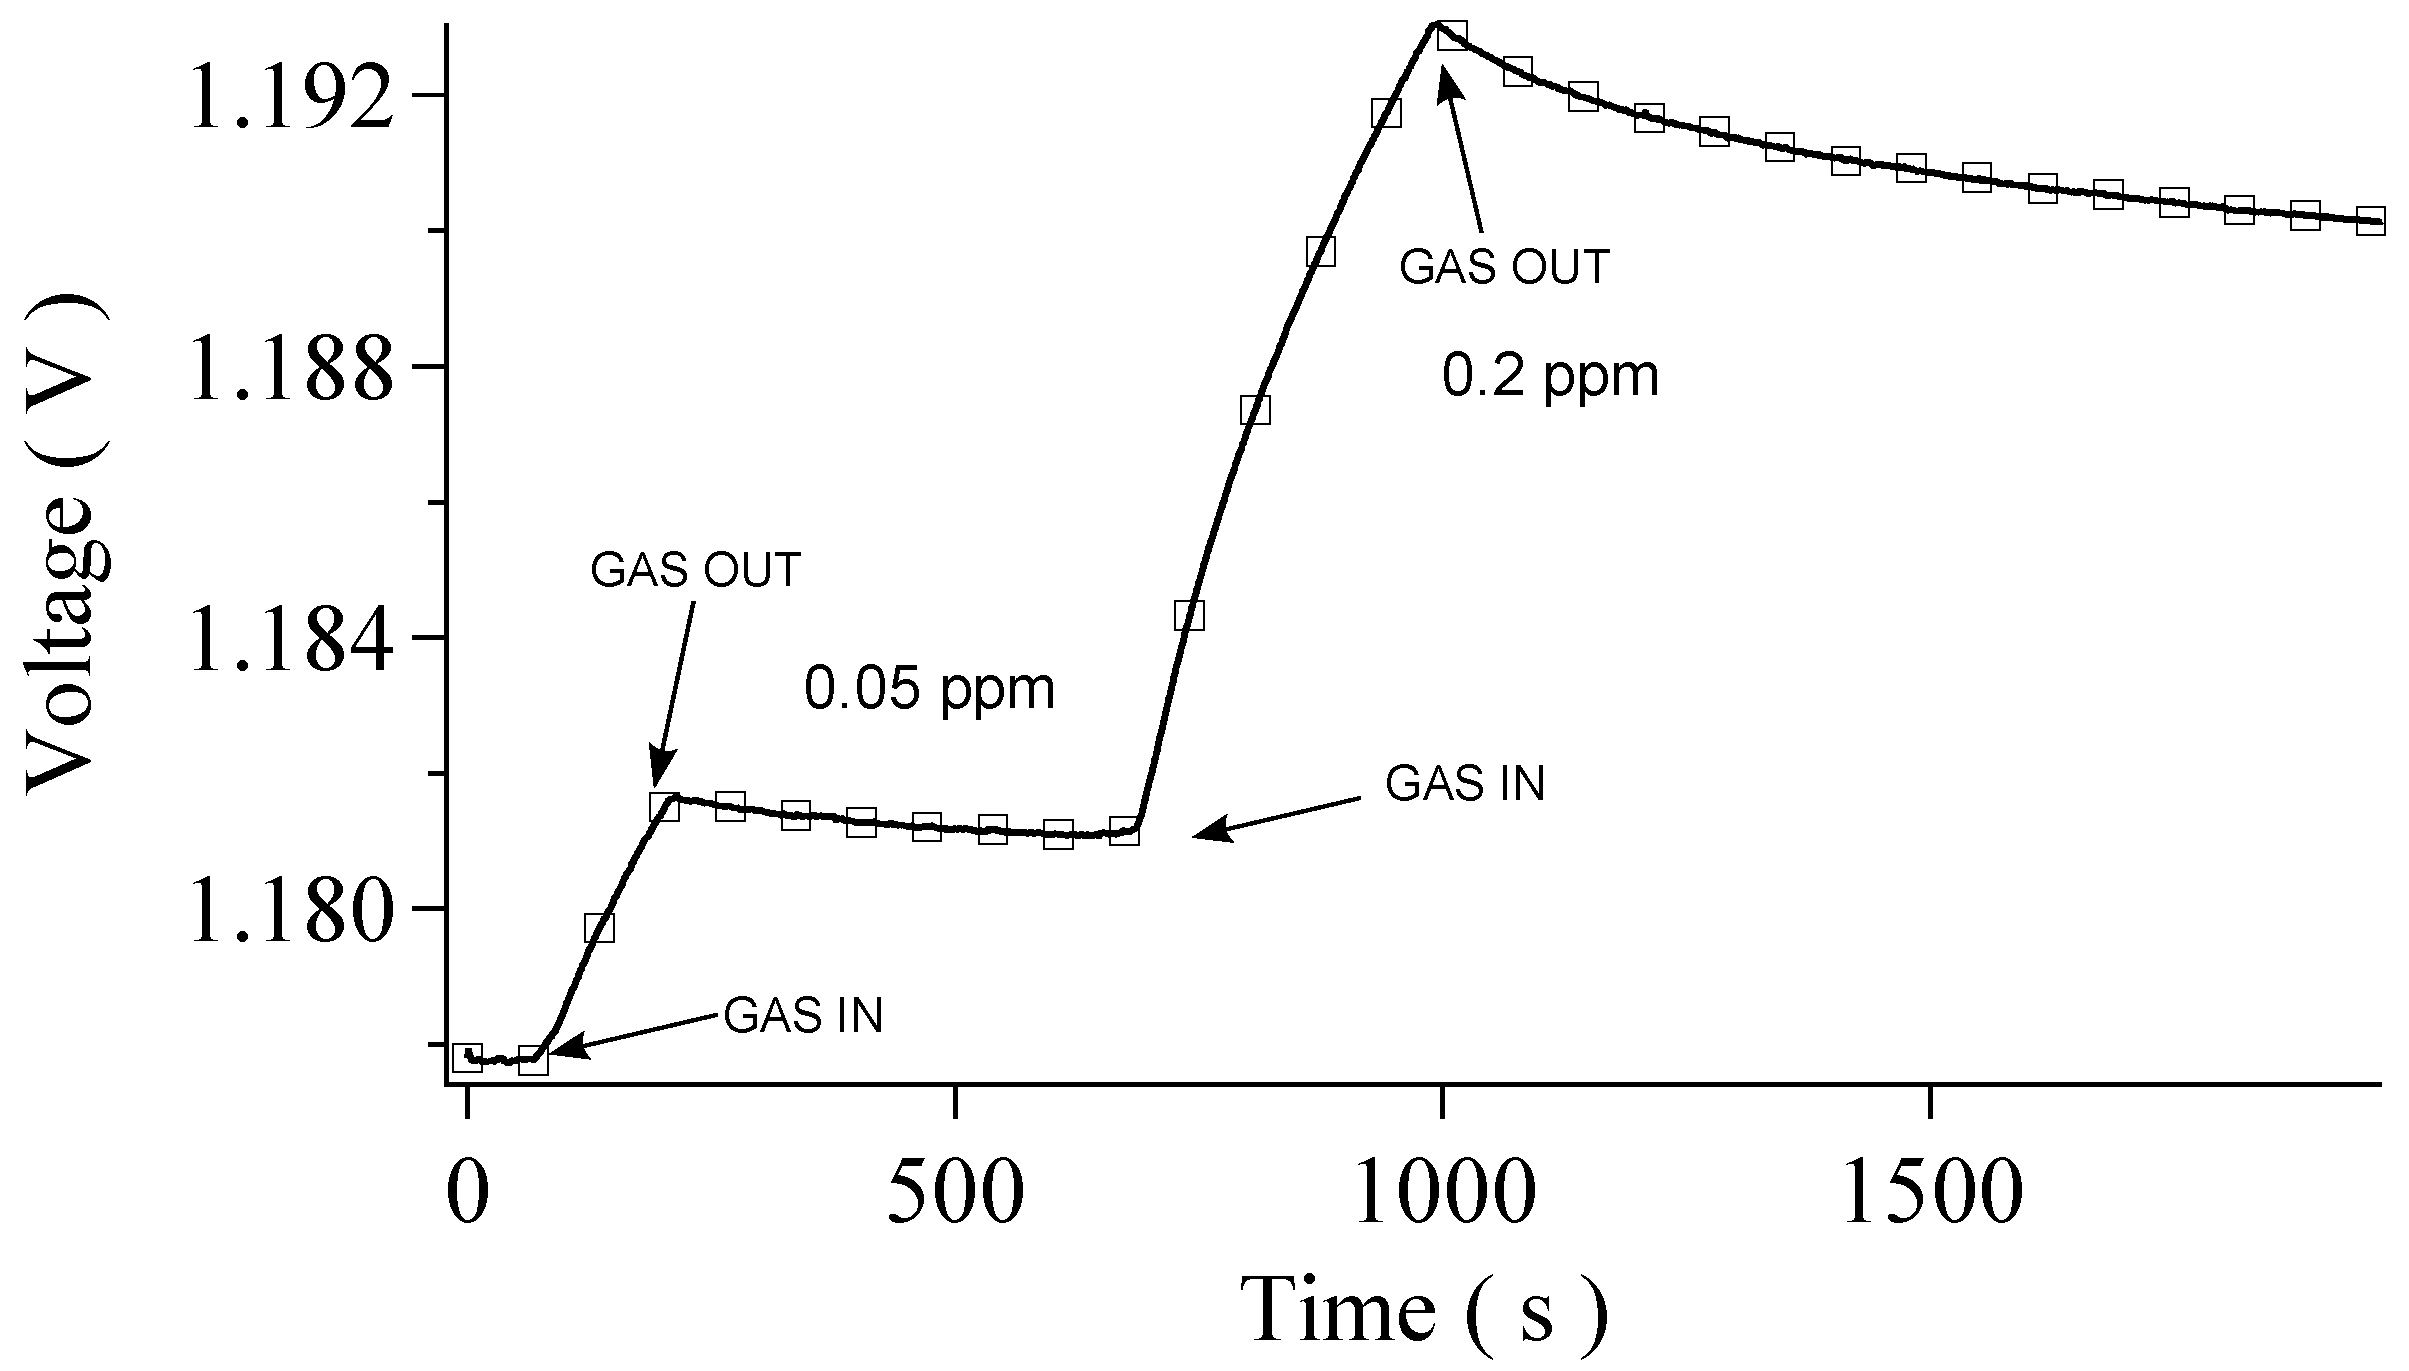
| Concentration (ppm) | 0.05 | 0.20 |
| ascent (s) | 225 | 96 |
| ascent (s) | 2581 | 1471 |
| descent (s) | 285 | 202 |
| descent (s) | 2352 | 5697 |
© 2016 by the authors; licensee MDPI, Basel, Switzerland. This article is an open access article distributed under the terms and conditions of the Creative Commons Attribution (CC-BY) license (http://creativecommons.org/licenses/by/4.0/).
Share and Cite
Calvi, A.; Ferrari, A.; Sbuelz, L.; Goldoni, A.; Modesti, S. Recognizing Physisorption and Chemisorption in Carbon Nanotubes Gas Sensors by Double Exponential Fitting of the Response. Sensors 2016, 16, 731. https://doi.org/10.3390/s16050731
Calvi A, Ferrari A, Sbuelz L, Goldoni A, Modesti S. Recognizing Physisorption and Chemisorption in Carbon Nanotubes Gas Sensors by Double Exponential Fitting of the Response. Sensors. 2016; 16(5):731. https://doi.org/10.3390/s16050731
Chicago/Turabian StyleCalvi, Andrea, Alberto Ferrari, Luca Sbuelz, Andrea Goldoni, and Silvio Modesti. 2016. "Recognizing Physisorption and Chemisorption in Carbon Nanotubes Gas Sensors by Double Exponential Fitting of the Response" Sensors 16, no. 5: 731. https://doi.org/10.3390/s16050731
APA StyleCalvi, A., Ferrari, A., Sbuelz, L., Goldoni, A., & Modesti, S. (2016). Recognizing Physisorption and Chemisorption in Carbon Nanotubes Gas Sensors by Double Exponential Fitting of the Response. Sensors, 16(5), 731. https://doi.org/10.3390/s16050731