
Image Quality Analysis and Optical Performance Requirement for Micromirror-Based Lissajous Scanning Displays

Abstract
: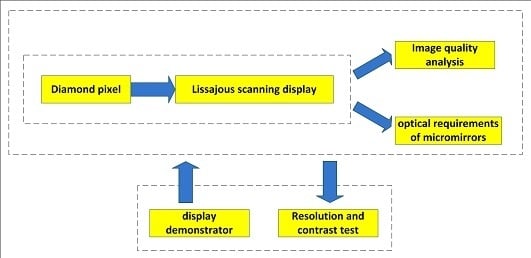
1. Introduction
2. Theoretical Analysis
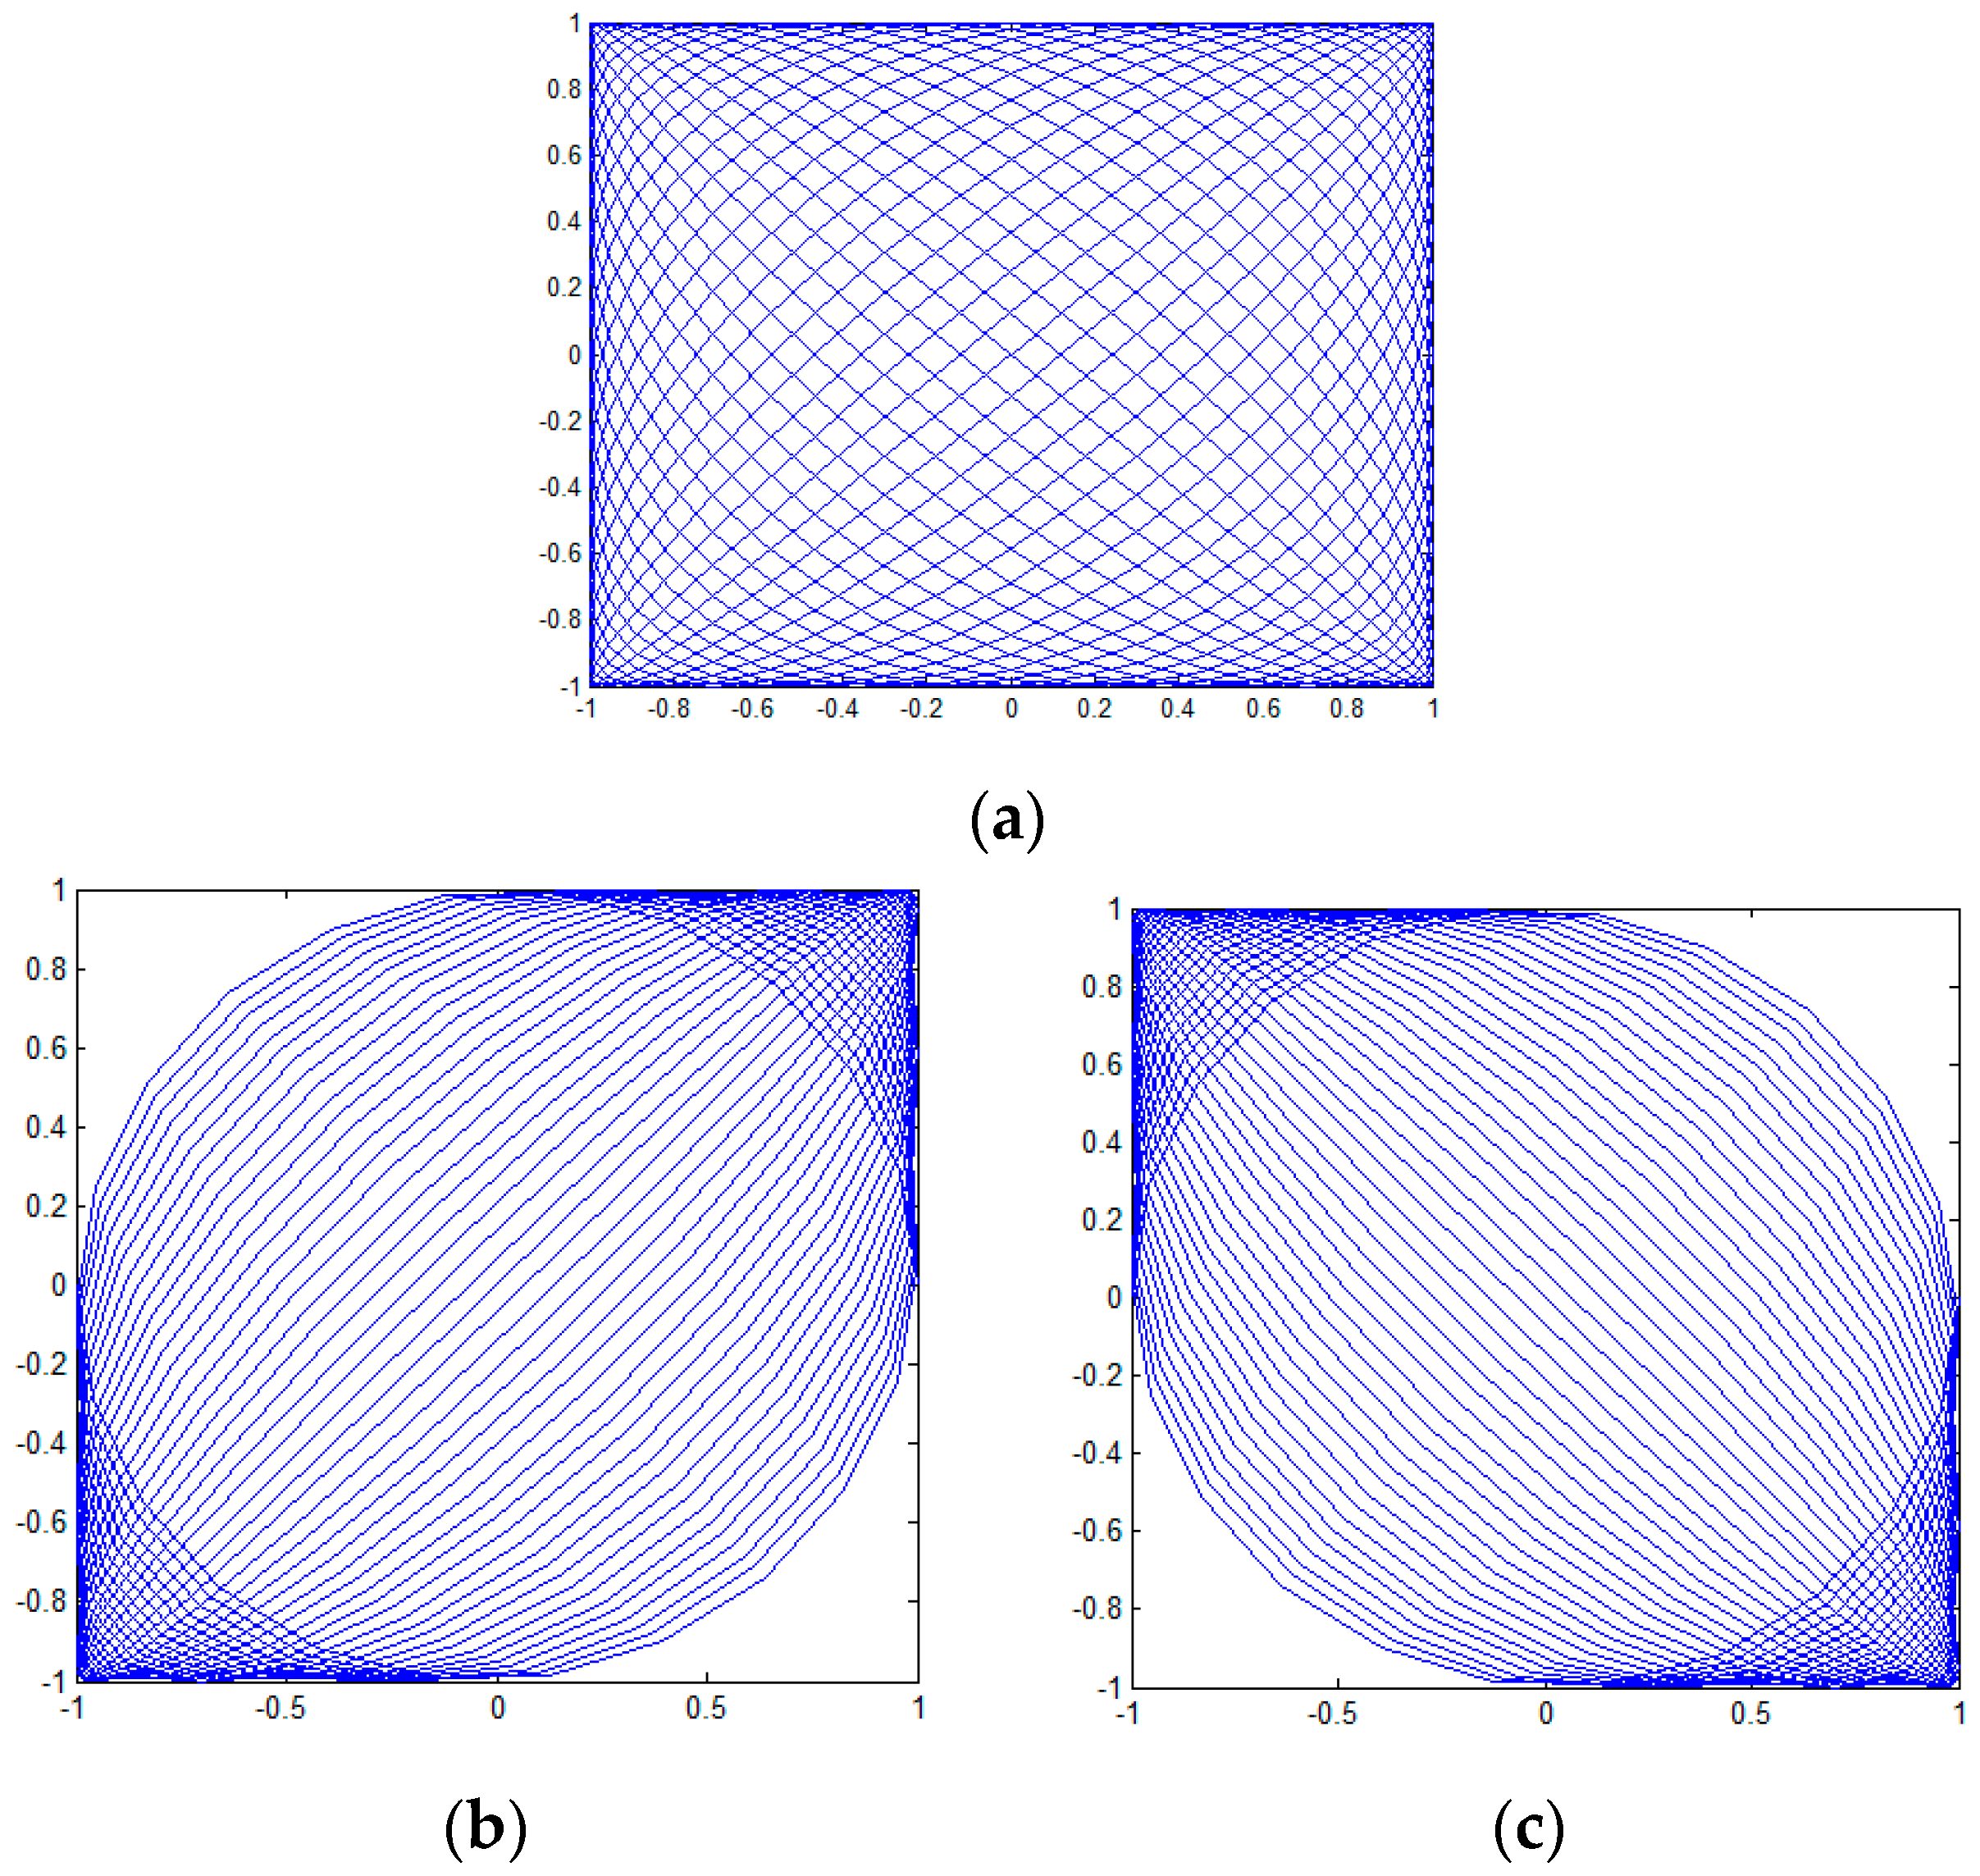
2.1. Period
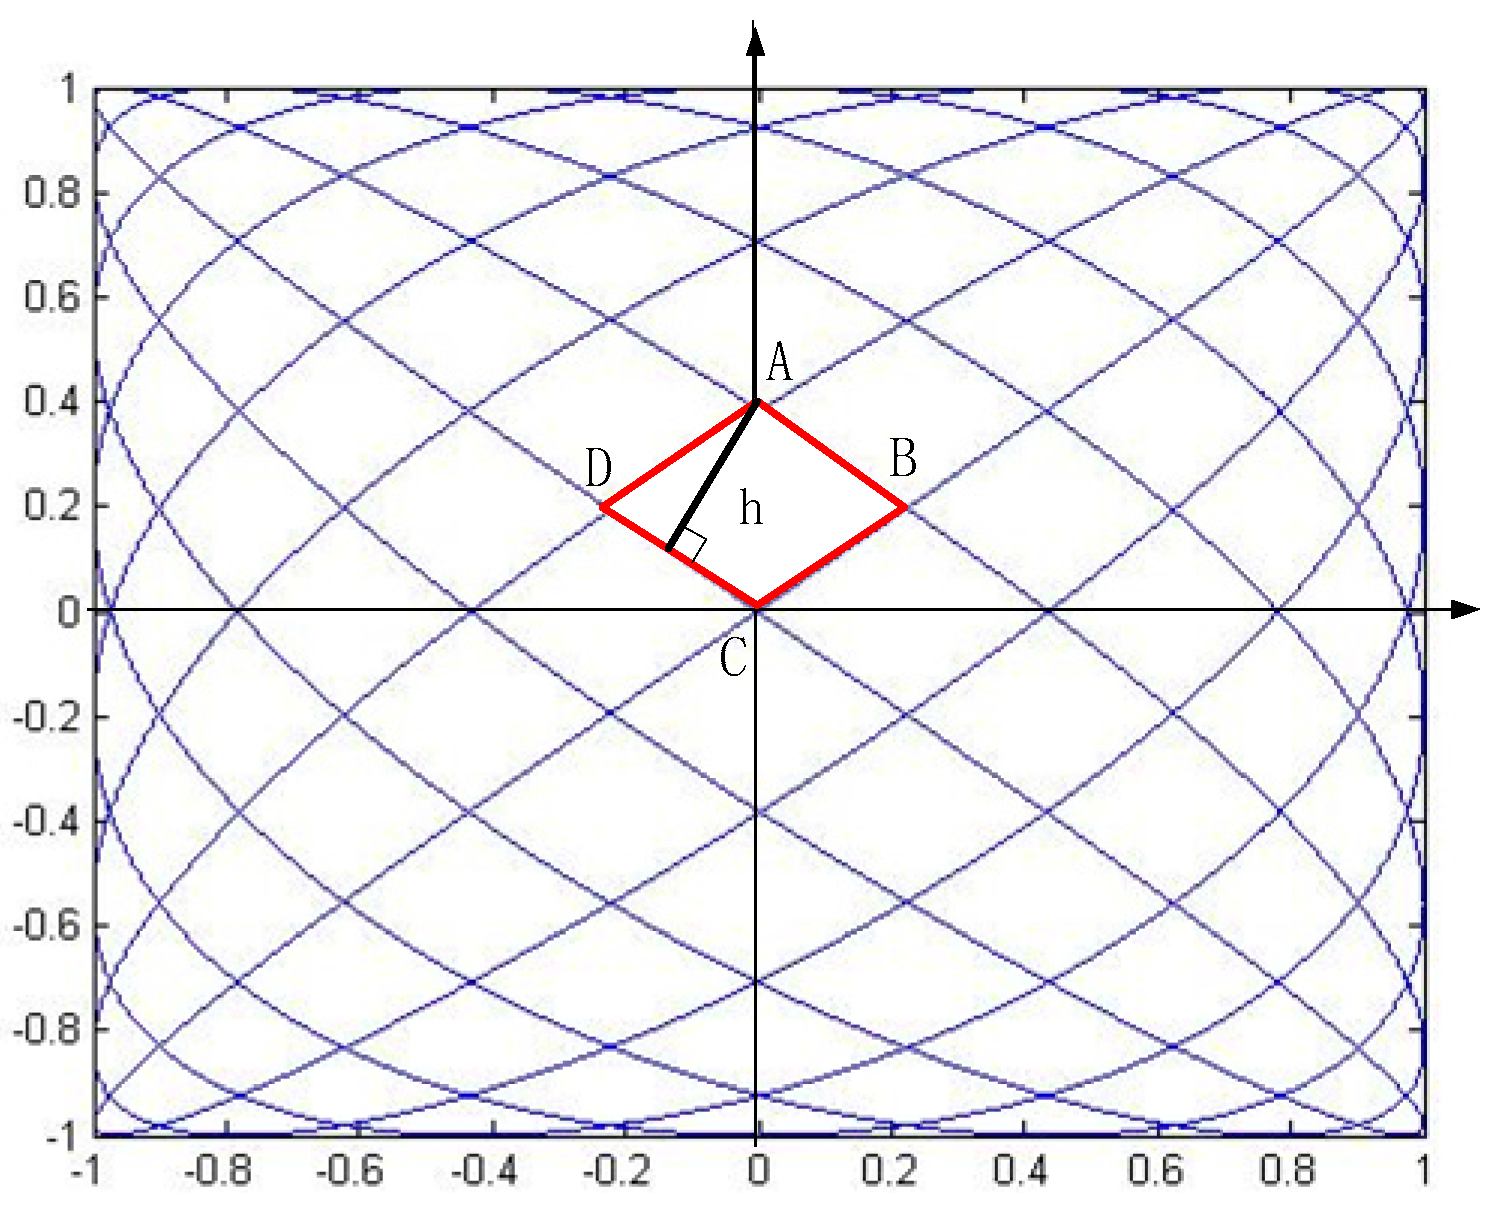
2.2. Line Density
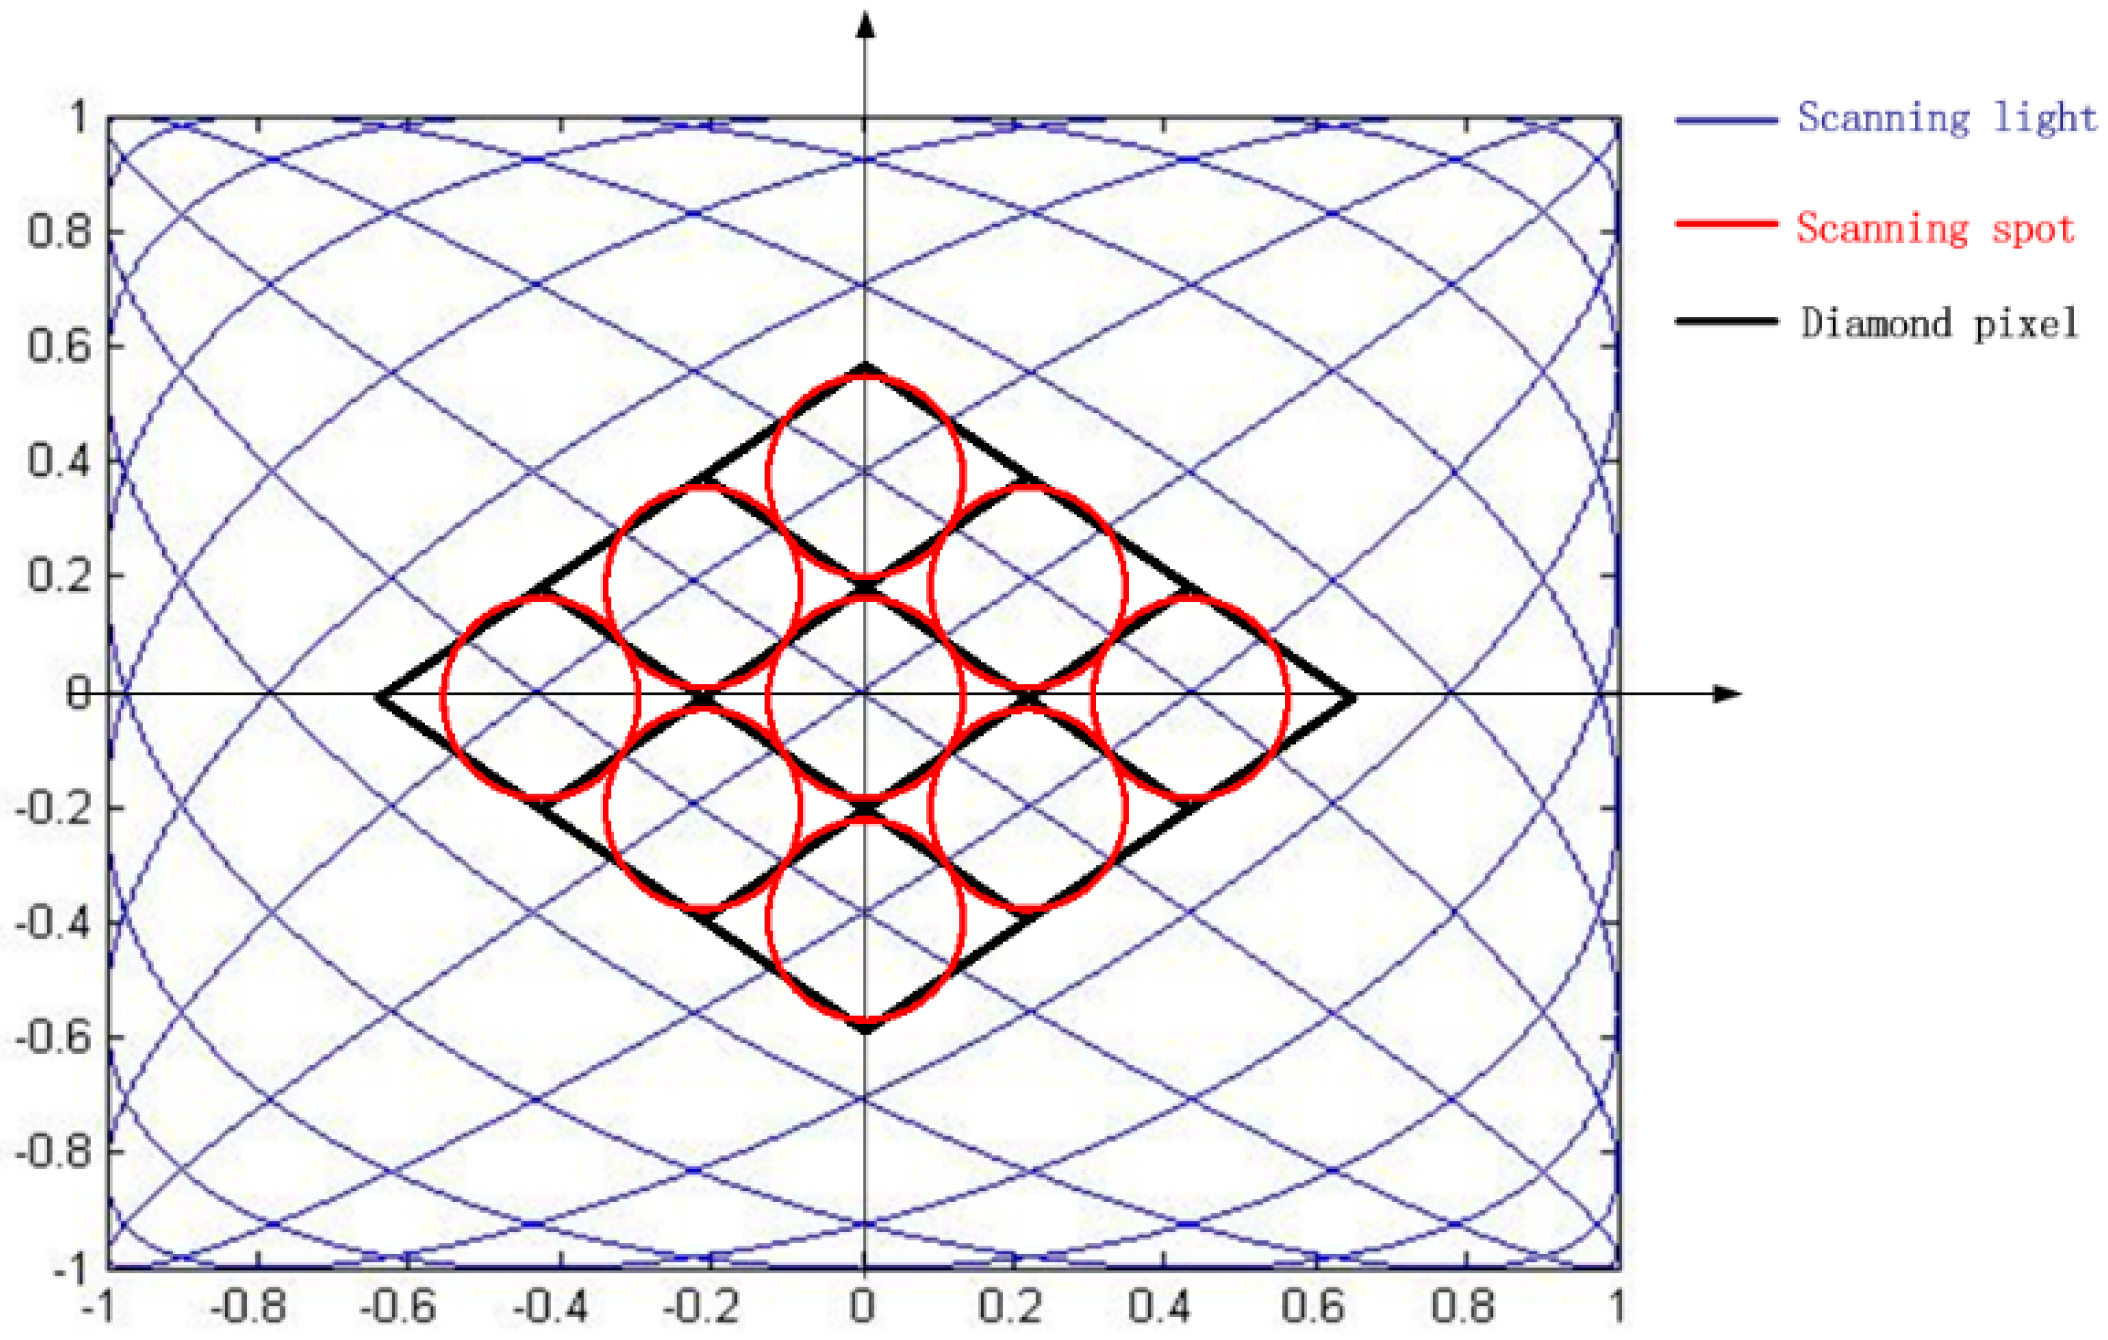
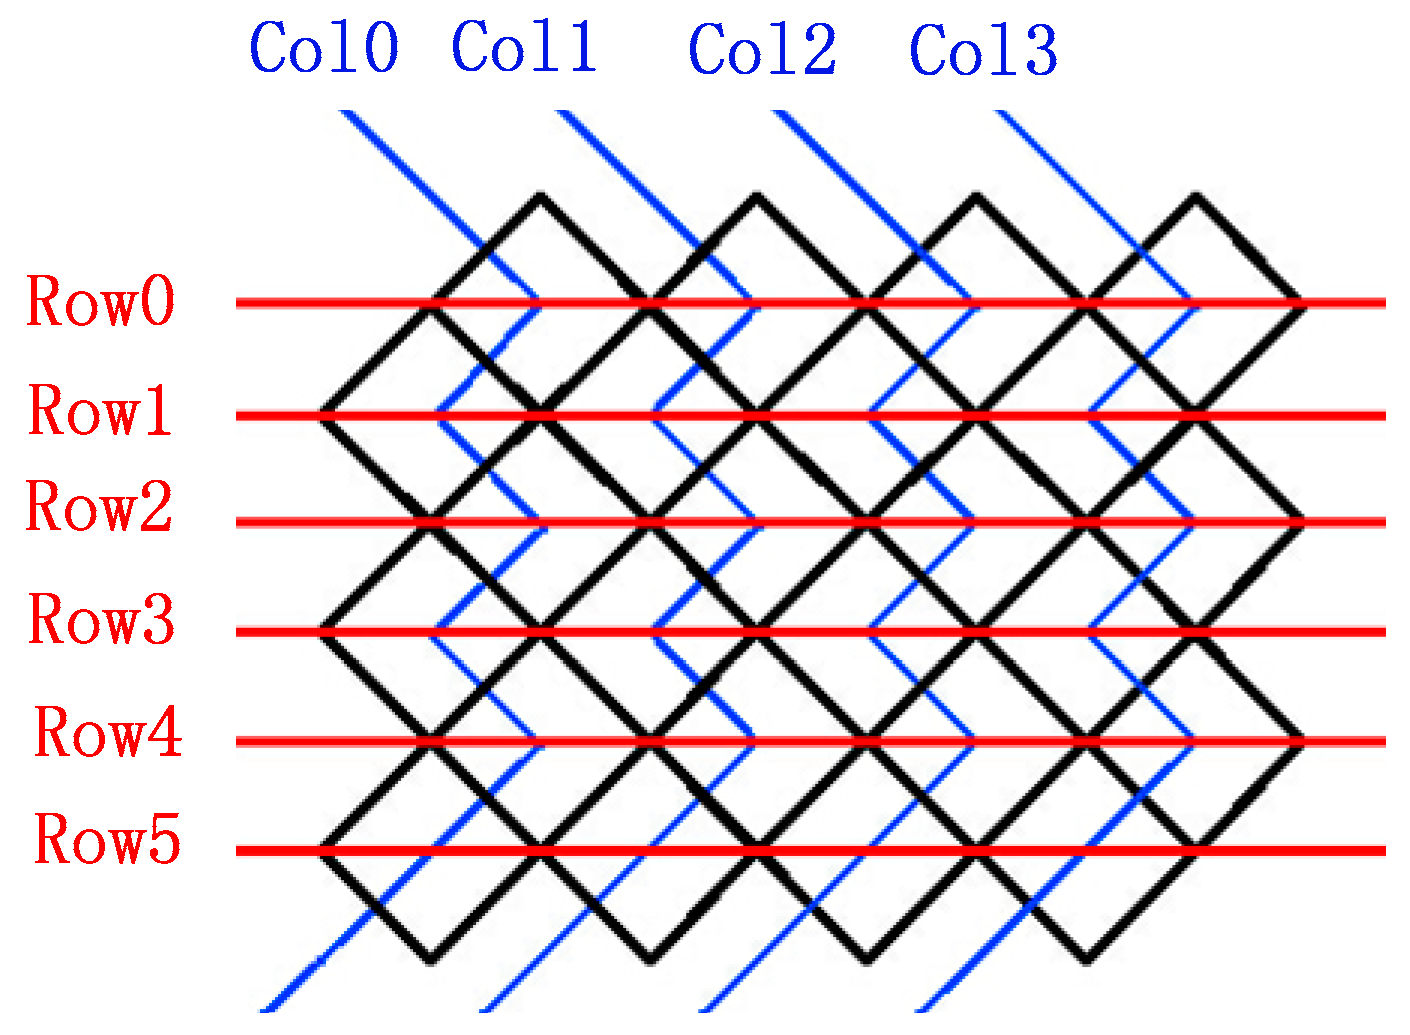
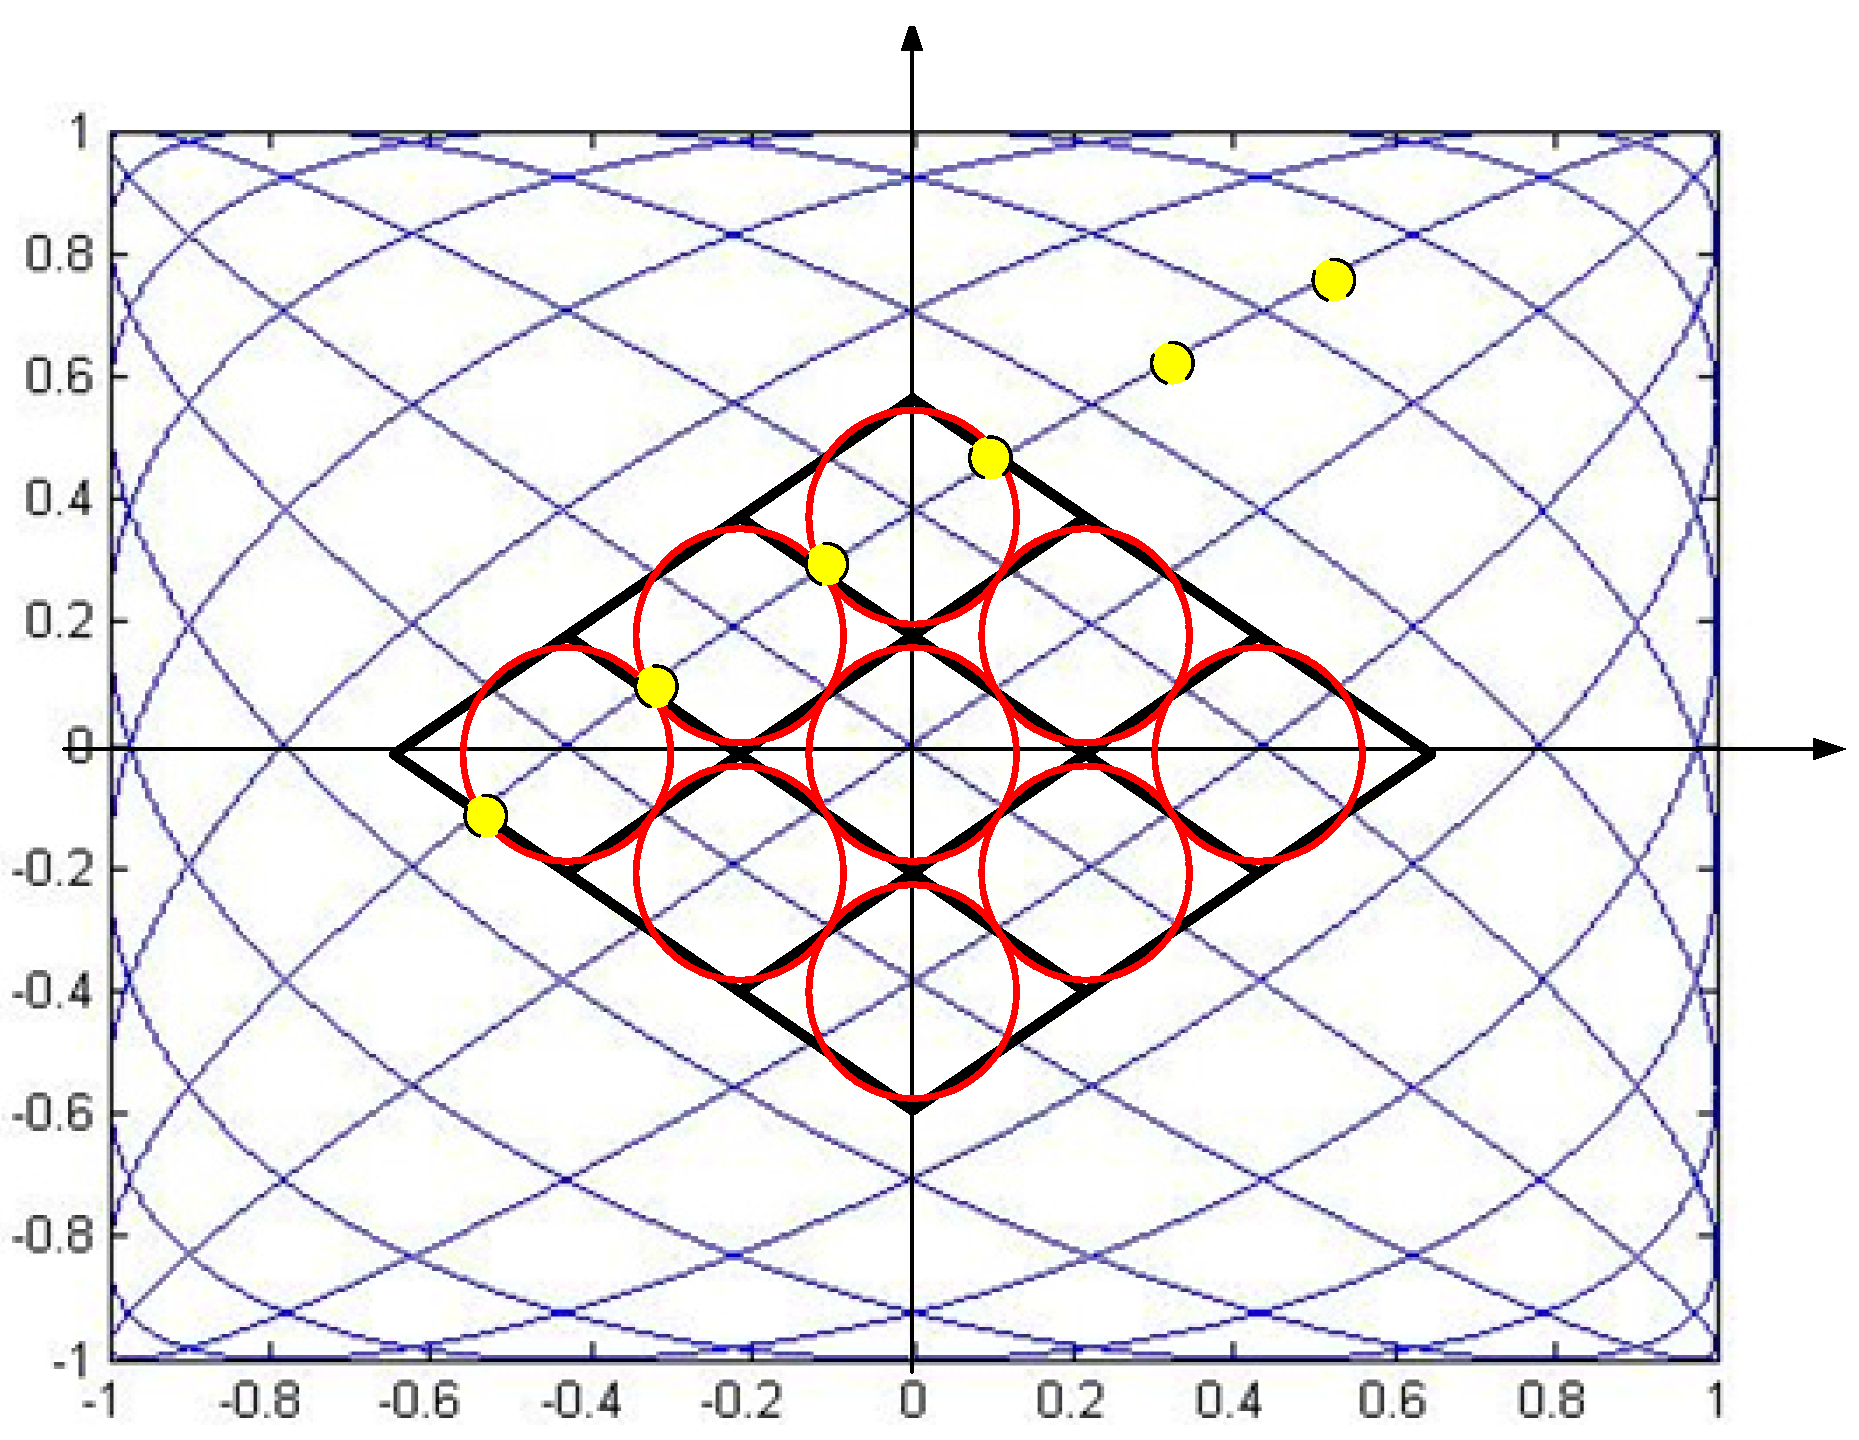
2.3. Method of Display
3. Design Requirements for Micromirrors
3.1. θ × D Product
3.2. Resonant Frequency
3.3. Laser Scanning Time
4. Experiments and Results
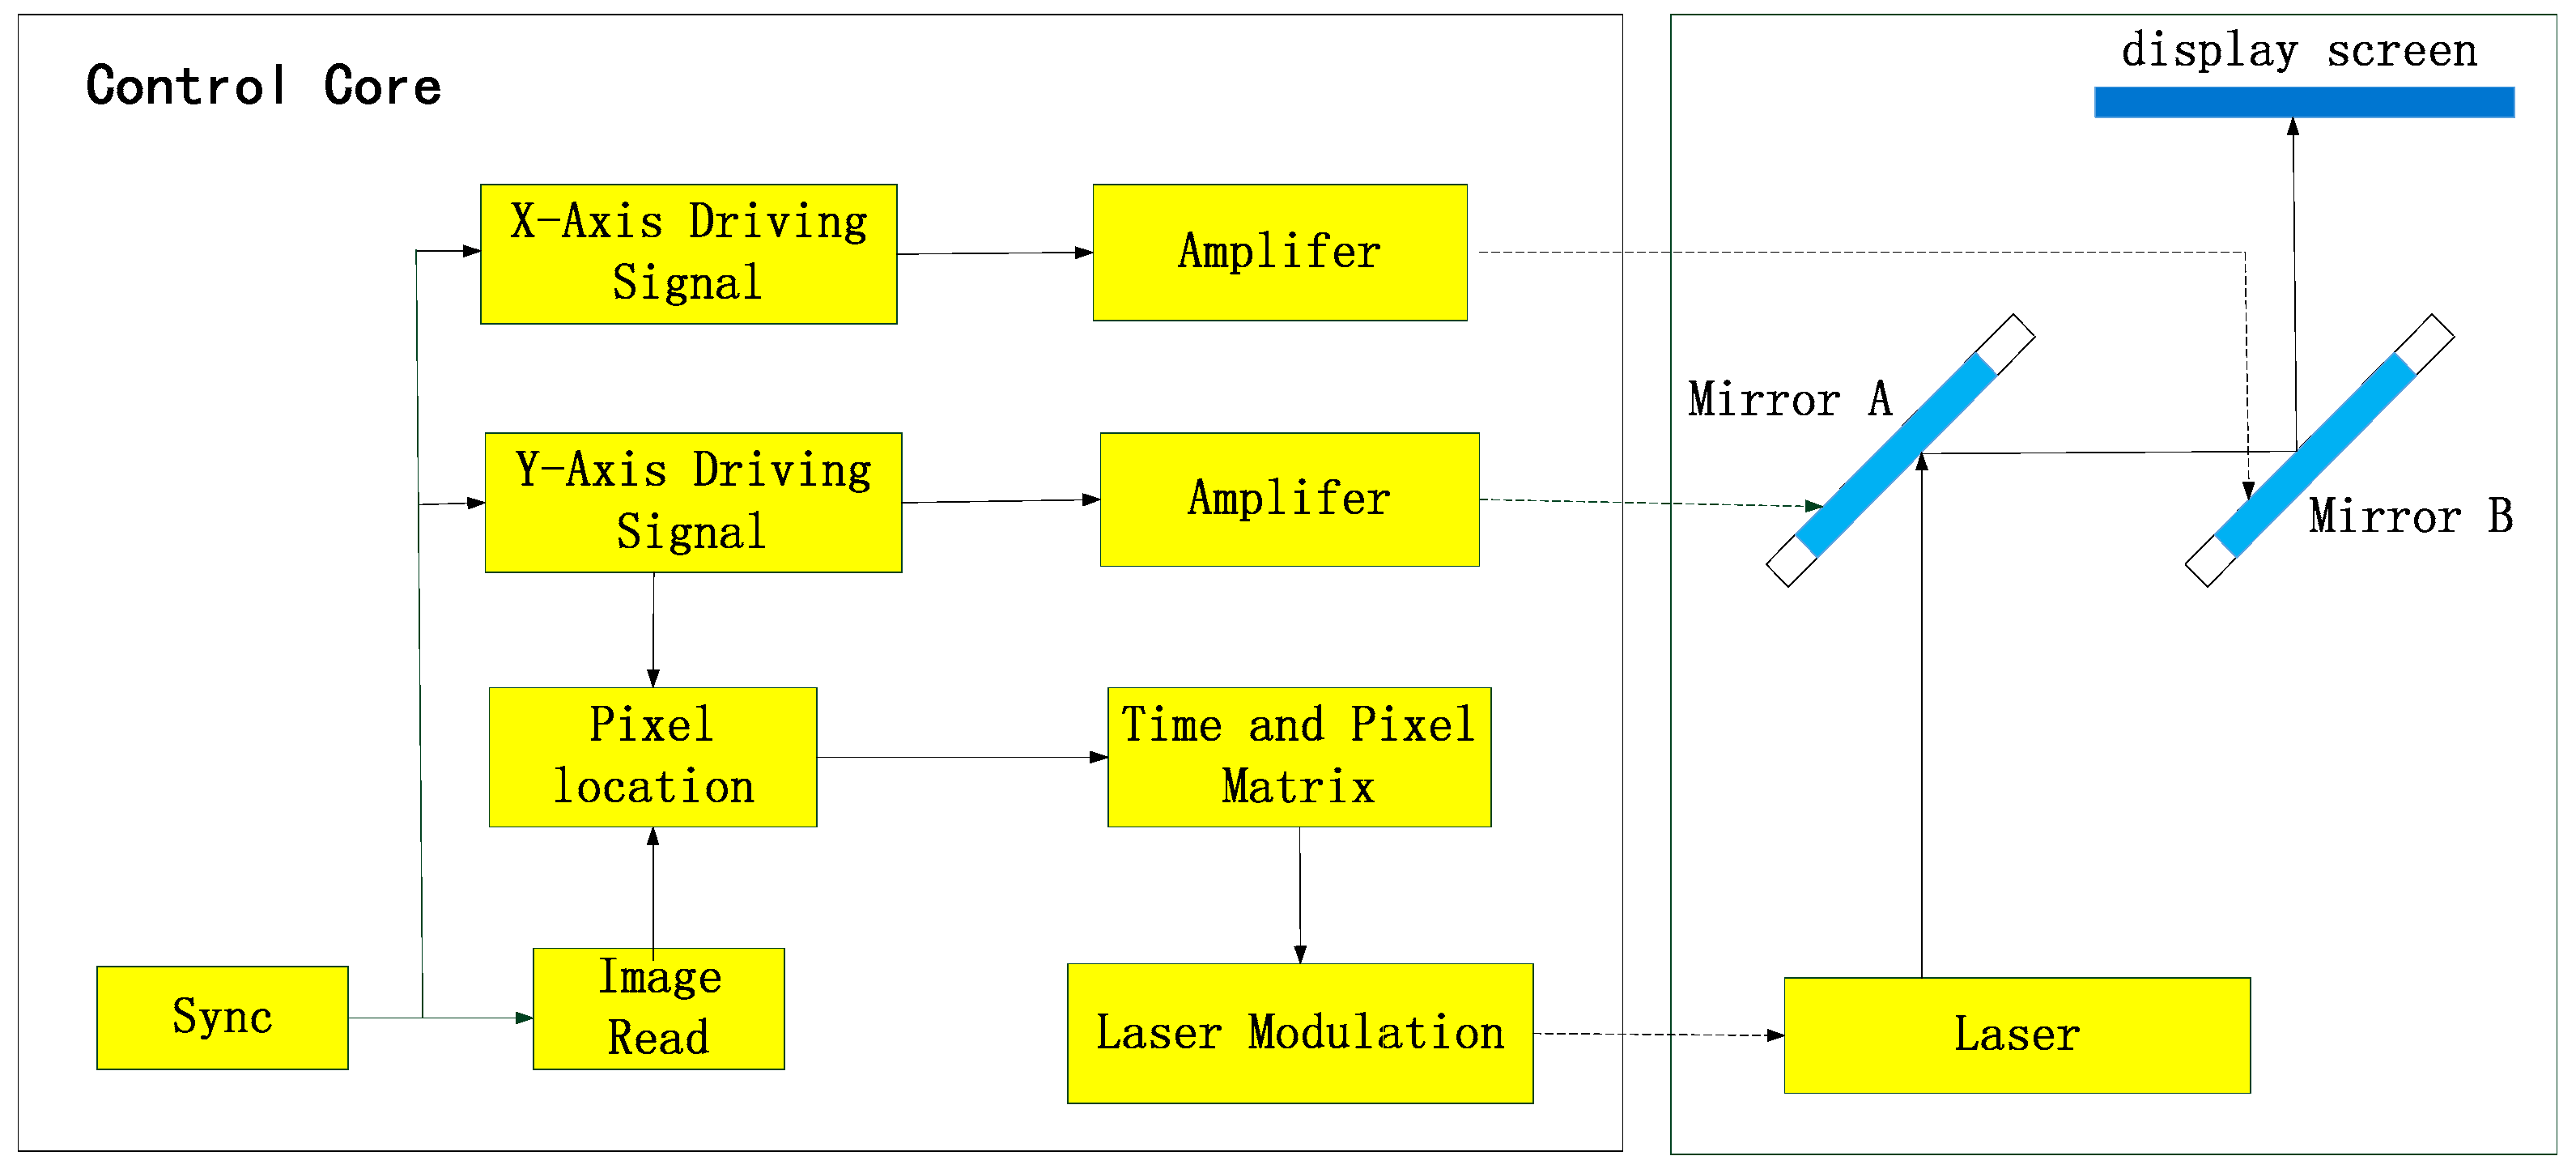
4.1. Demonstrator Setup
- (1)
- Read image and generate the pixel matrix of the image (xi, yi, gi). xi and yi are the horizontal and vertical pixels, and gi is grayscale.
- (2)
- Calculate the pixel time based on the scanning frequency of the two axes and generate the time-pixel array (ti, gi).
- (3)
- Read the first number of time array, ti, and accumulate the processing time, t, using the system clock. If (t < ti), then the output for laser modulation signal is M × gi/256, where M is the max of modulation voltage; otherwise, read the next number in the time array, ti + 1, and repeat step 3.
- (4)
- Continue with step 1 after a frame period.
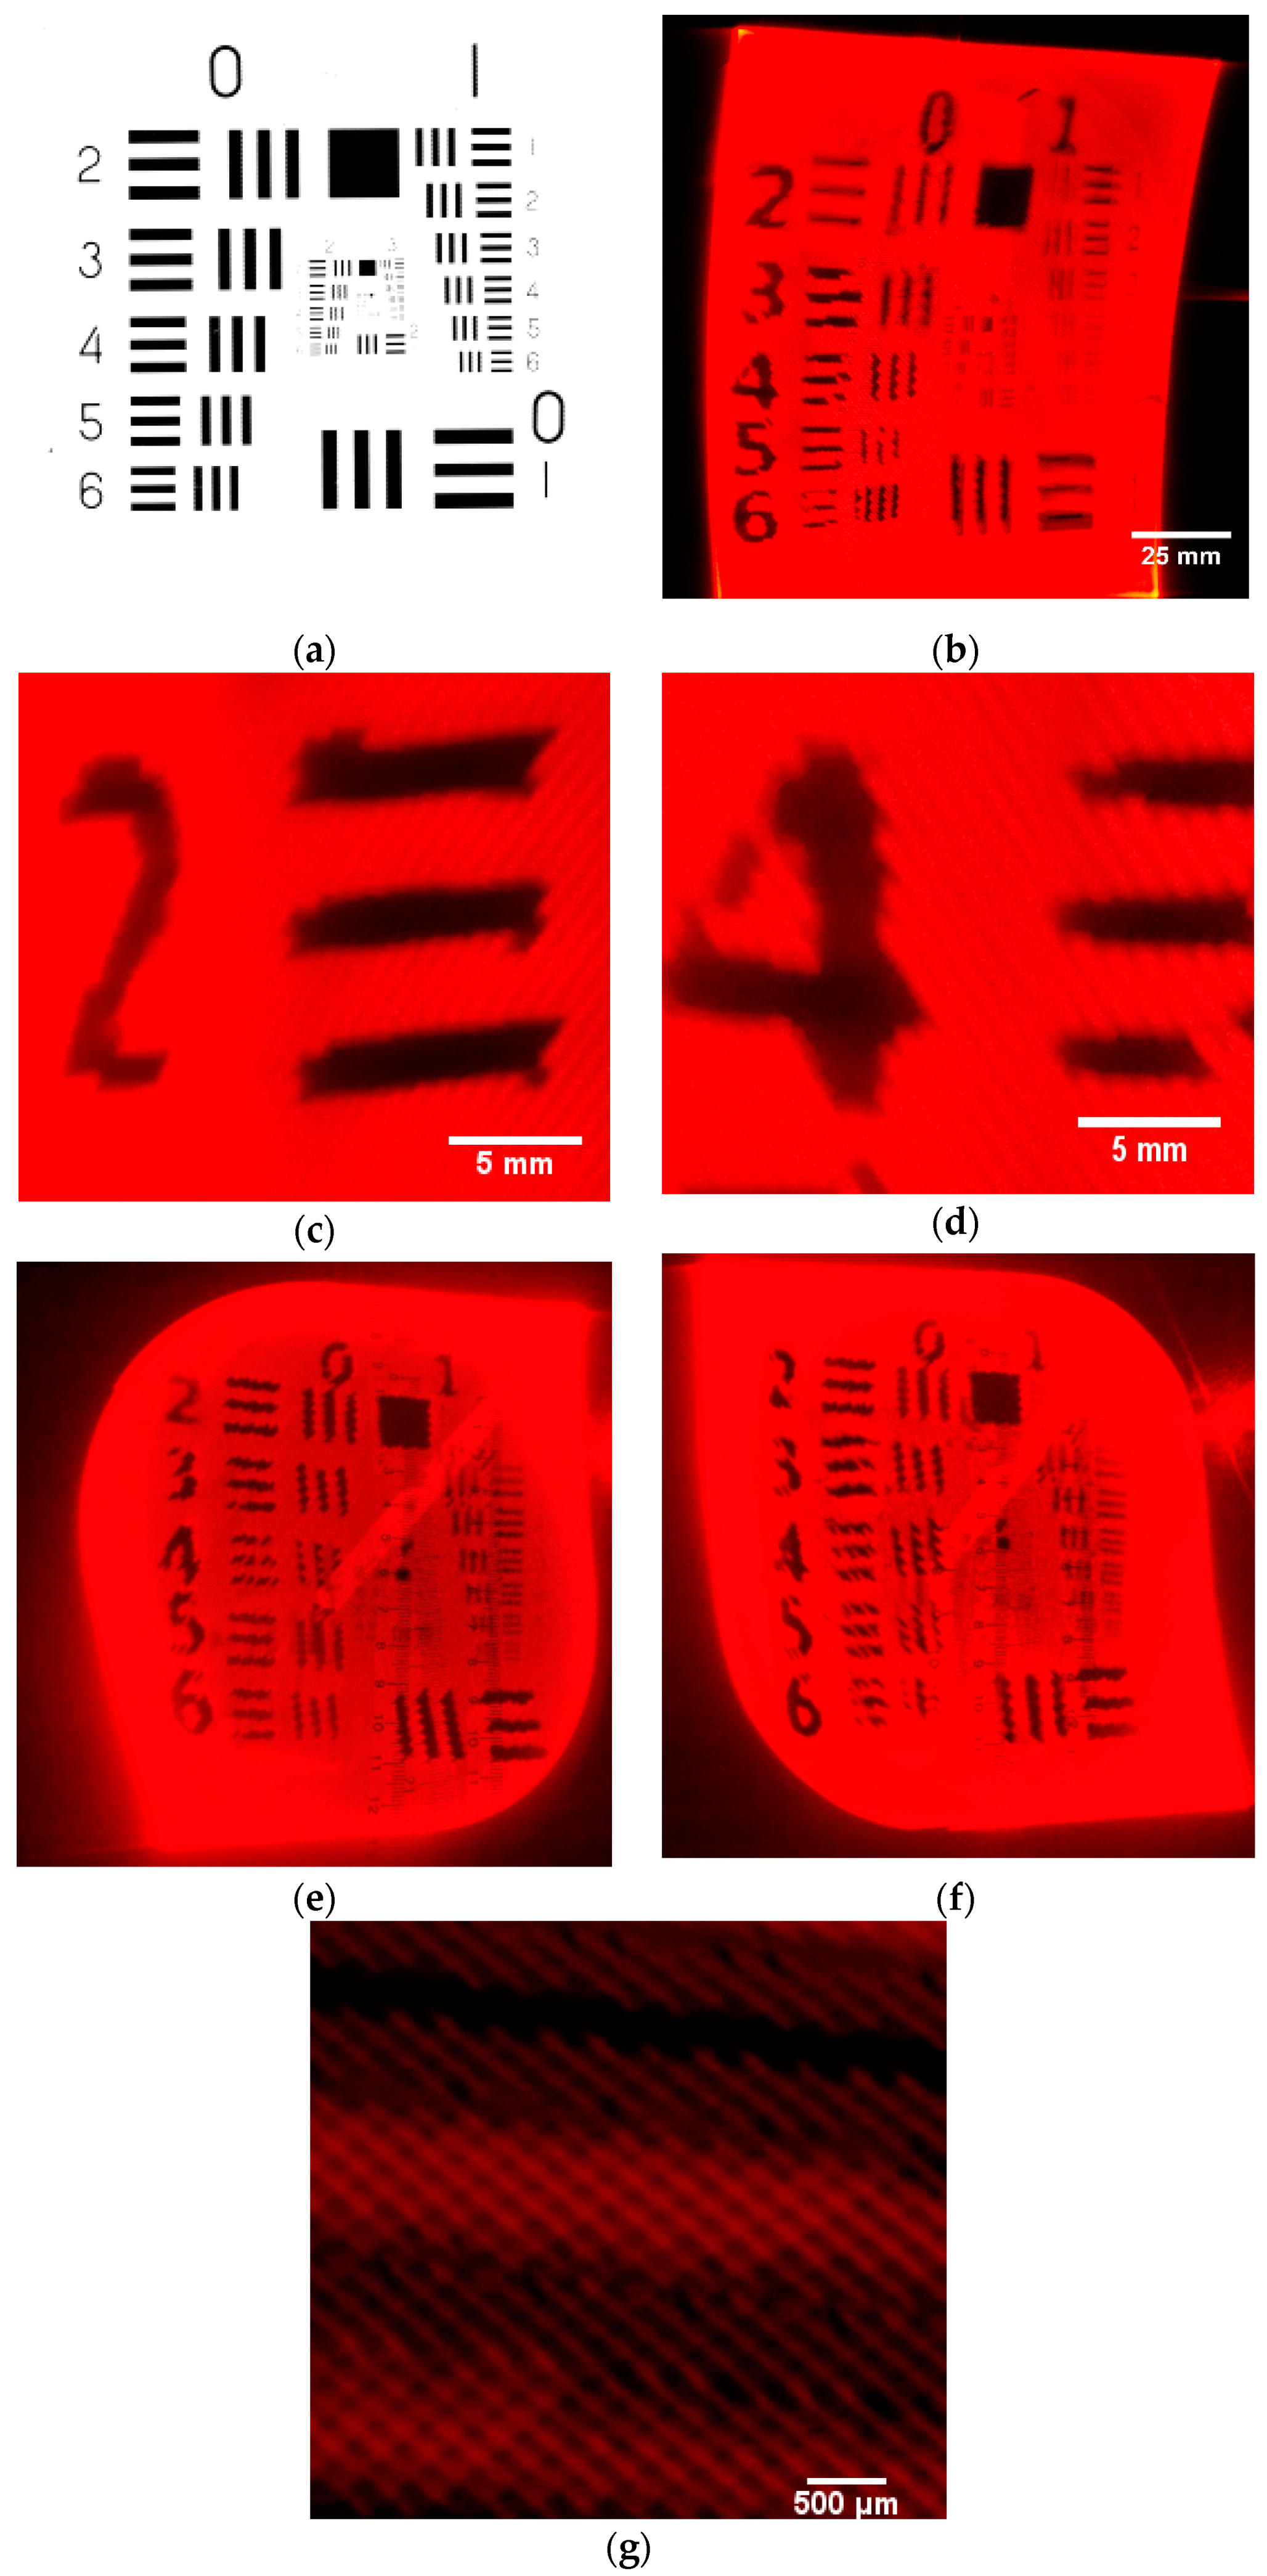
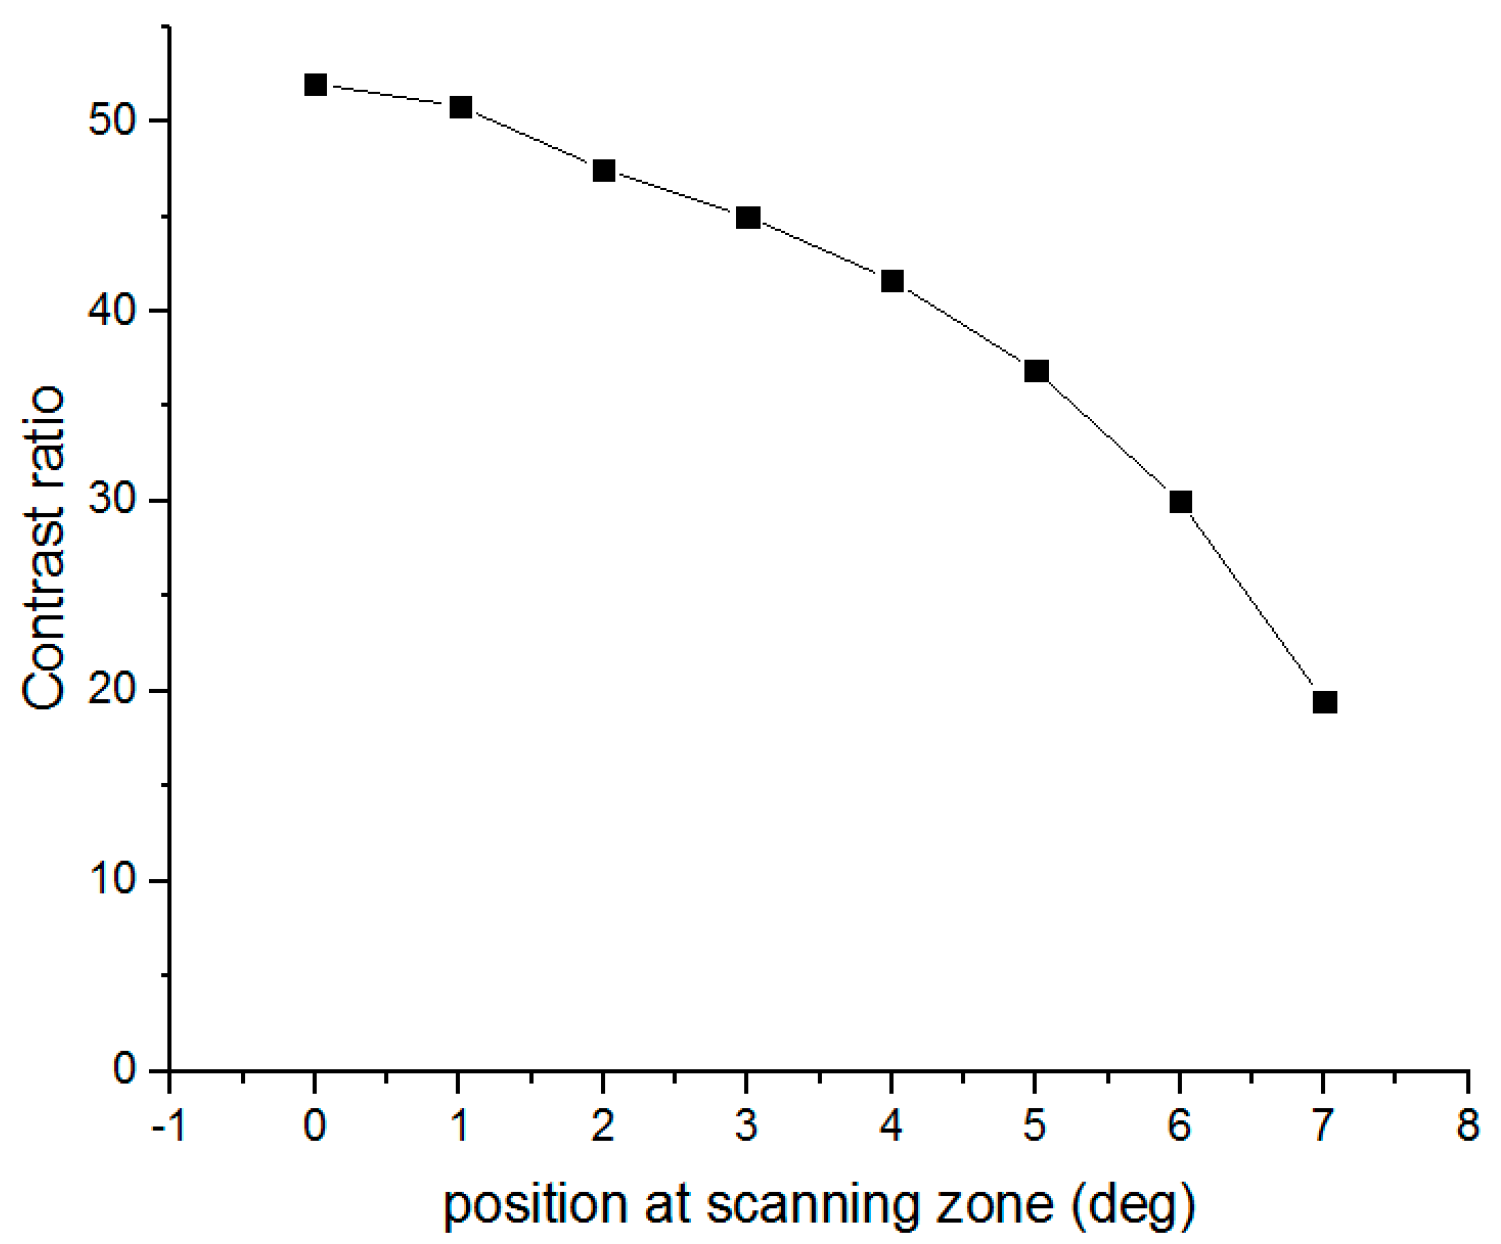
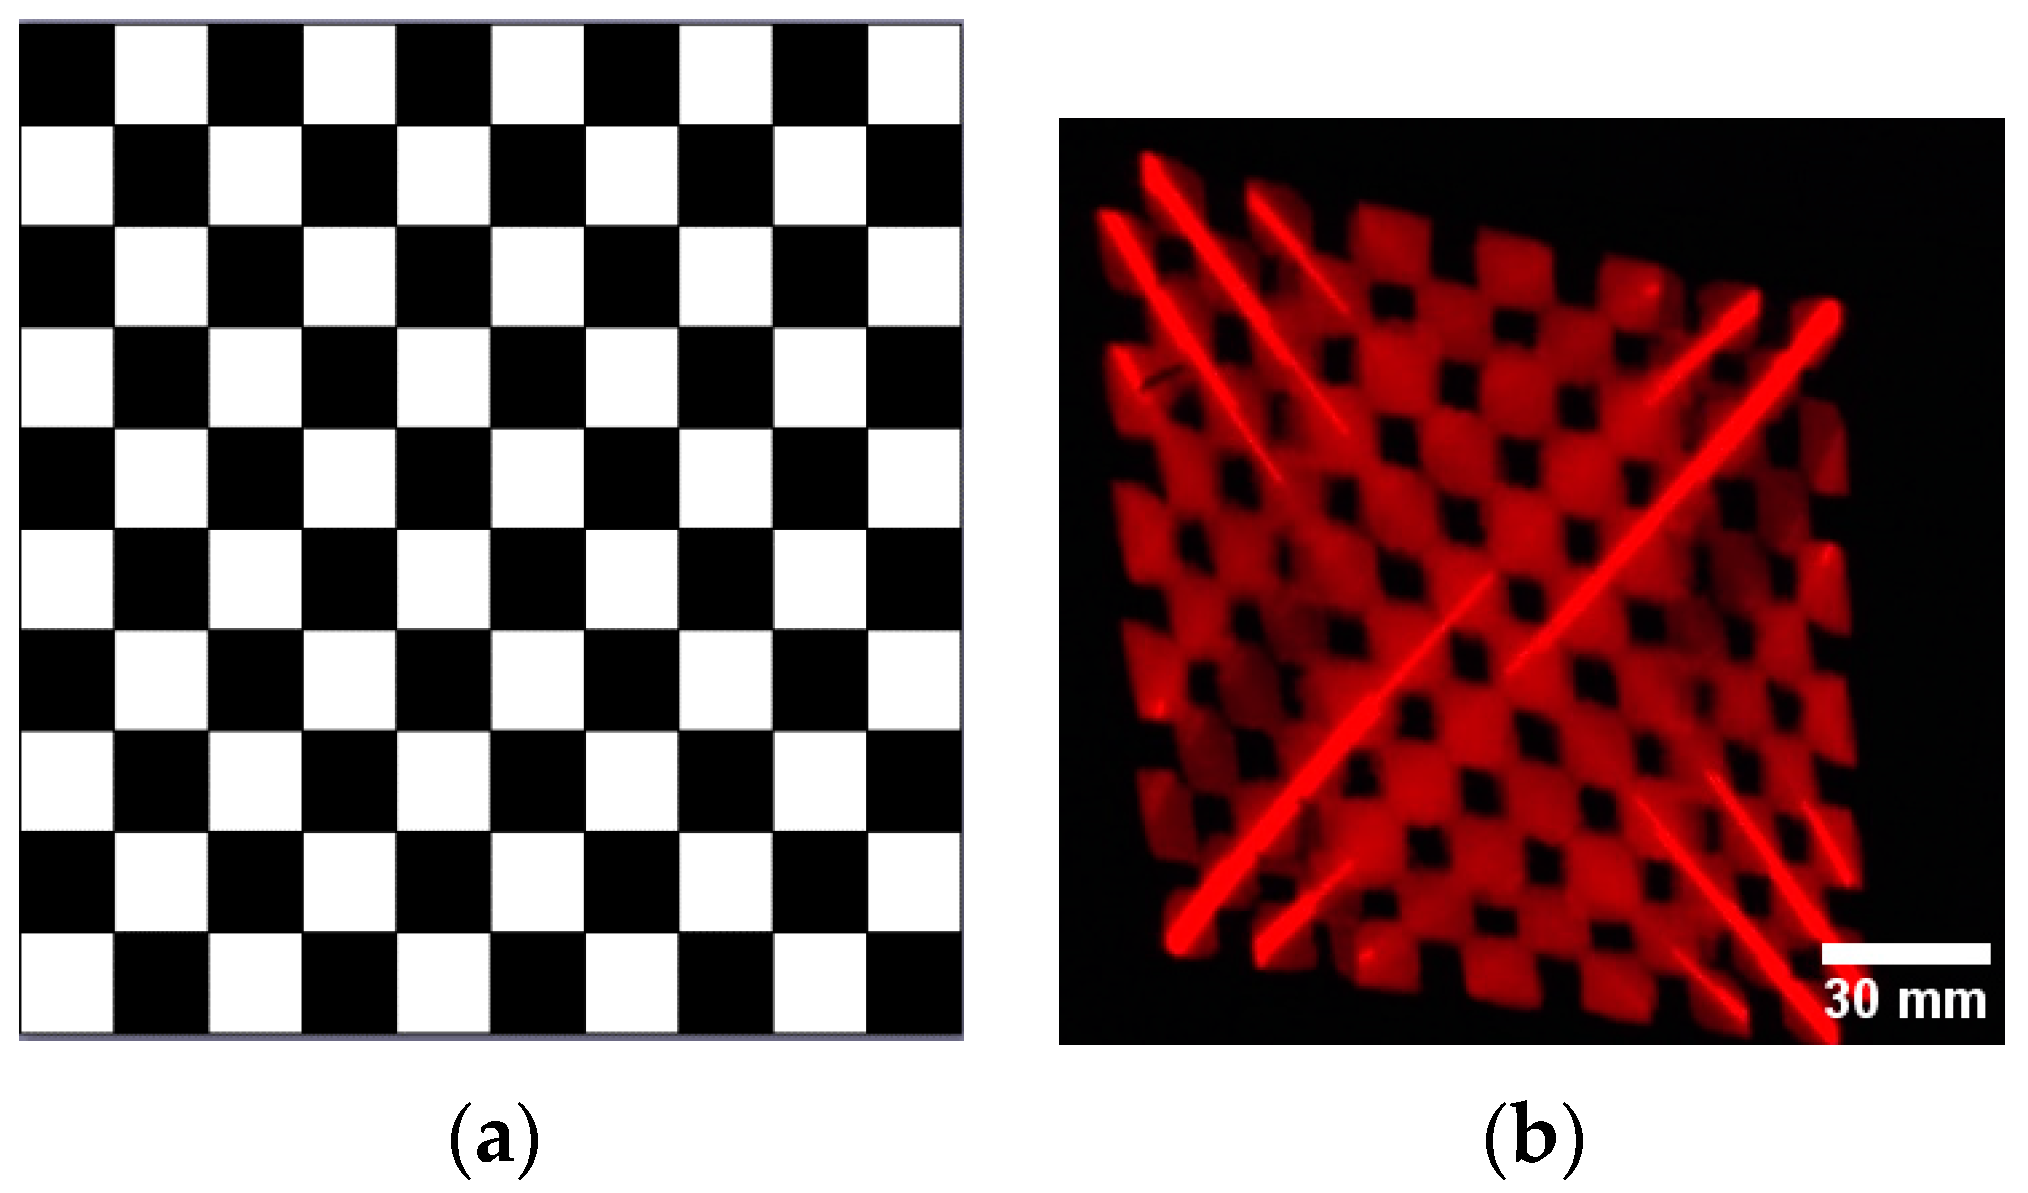
4.2. Parameter Test
5. Conclusions
Acknowledgments
Author Contributions
Conflicts of Interest
References
- Gu-Stoppel, S.; Janes, J.; Quenzer, H.J.; Hofmann, U.; Benecke, W. Two-dimensional scanning using two single-axis low-voltage PZT resonant micromirrors. Proc. SPIE 2014, 8977. [Google Scholar] [CrossRef]
- Urey, H.; DeWitt, F.A., IV; Luanava, S. Optical scanners for high-resolution RSD systems. Proc. SPIE 2002, 4711. [Google Scholar] [CrossRef]
- Scholles, M.; Brauer, A.; Frommhagen, K.; Gerwig, C.; Hoefer, B.; Jung, E.; Lakner, H.; Schenk, H.; Schneider, B.; Schreiber, P.; et al. Miniaturized optical module for projection of arbitrary images based on two-dimensional resonant micro scanning mirrors. Proc. SPIE 2005, 5873. [Google Scholar] [CrossRef]
- Hofmann, U.; Oldsen, M.; Quenzer, H.J.; Janes, J.; Heller, M.; Weiss, M.; Fakas, G.; Ratzmann, L.; Marchetti, E.; D’Ascoli, F.; et al. Wafer-level vacuum packaged resonant micro-scanning mirrors for compact laser projection displays. Proc. SPIE 2008, 6887. [Google Scholar] [CrossRef]
- Urey, H. MEMS scanners for display and imaging applications. Proc. SPIE 2004, 5604. [Google Scholar] [CrossRef]
- Wine, D.W.; Helsel, M.P.; Jenkins, L.; Urey, H.; Osborn, T.D. Performance of a biaxial MEMS-based scanner for microdisplay applications. Proc. SPIE 2000, 4178, 186–196. [Google Scholar]
- Urey, H.; Wine, D.W.; Osborn, T.D. Optical performance requirements for MEMS-scanner-based microdisplays. Proc. SPIE 2000, 4178. [Google Scholar] [CrossRef]
- Ataman, C.; Kaya, O.; Urey, H. Analysis of parametric resonances in comb-driven microscanners. Proc. SPIE 2004, 5455. [Google Scholar] [CrossRef]
- Hofmann, U.; Janes, J.; Quenzer, H.J. High-Q MEMS resonators for laser beam scanning displays. Micromachines 2012, 3, 509–528. [Google Scholar] [CrossRef]
- Scholles, M.; Bräuer, A.; Frommhagen, K.; Gerwig, C.; Lakner, H.; Schenk, H.; Schwarzenberg, M. Ultra-compact laser projection systems based on two-dimensional resonant microscanning mirrors. J. Micro/Nanolithogr. MEMS MOEMS 2008, 7. [Google Scholar] [CrossRef]
- Coltheart, M. The persistences of vision. Philos. Trans. R. Soc. Lond. B Biol. Sci. 1980, 290, 57–69. [Google Scholar] [CrossRef] [PubMed]
- Wolter, A.; Hsu, S.T.; Schenk, H.; Lakner, K. Applications and requirements for MEMS scanner mirrors. Proc. SPIE 2005, 5719. [Google Scholar] [CrossRef]
- Urey, H.; Nestorovic, N.; Ng, B.S.; Gross, A. Optics designs and system MTF for laser scanning displays. Proc. SPIE 1999, 3689. [Google Scholar] [CrossRef]
- Hofmann, U.; Senger, F.; Janes, J.; Mallas, C.; Stenchly, V.; von Wantoch, T.; Quenzer, H.J.; Weiss, M. Wafer-level vacuum-packaged two-axis MEMS scanning mirror for pico-projector application. Proc. SPIE 2014, 8977. [Google Scholar] [CrossRef]
- Roscher, K.U.; Graetz, H.; Schenk, H.; Wolter, A.; Lakner, H. Low cost projection device with a 2-dimensional resonant micro scanning mirror. In Proceedings of the International Society of Photo-Optical-SPIE, San Jose, CA, USA, 26–27 January 2004.
- Allen, W.; Ulichney, R. 47.4: Invited Paper: Wobulation: Doubling the Addressed Resolution of Projection Displays. In SID Symposium Digest of Technical Papers; Blackwell Publishing Ltd.: London, UK, 2005; Volume 36, pp. 1514–1517. [Google Scholar]
- Sullivan, S.Z.; Muir, R.D.; Newman, J.A.; Carlsen, M.S.; Sreehari, S.; Doerge, C.; Simpson, G.J. High frame-rate multichannel beam-scanning microscopy based on Lissajous trajectories. Opt. Express 2014, 22, 24224–24234. [Google Scholar] [CrossRef] [PubMed]
- Bazaei, A.; Yong, Y.K.; Moheimani, S.O.R. High-speed Lissajous-scan atomic force microscopy: Scan pattern planning and control design issues. Rev. Sci. Instrum. 2012, 83, 063701. [Google Scholar] [CrossRef] [PubMed]
- Gove, R.J.; Sampsell, J.B. DMD Architecture to Improve Horizontal Resolution. U.S. Patent 6,232,936, 15 May 2001. [Google Scholar]
- Hutchison, D.C. The SmoothPicture Algorithm: An Overview. Available online: http://xymox1.com/sears/smoothpicture1.pdf (accessed on 5 May 2016).
- Urey, H.; Wine, D.W.; Lewis, J.R. Scanner design and resolution trade-offs for miniature scanning displays. Proc. SPIE 1999, 3636. [Google Scholar] [CrossRef]
- Roscher, K.U.; Graetz, H.; Schenk, H.; Wolter, A.; Lakner, H. Low-cost projection device with a 2D resonant microscanning mirror. Proc. SPIE 2004, 5348. [Google Scholar] [CrossRef]
- Urey, H. P-82: Diffraction Limited Resolution and Maximum Contrast for Scanning Displays. In SID Symposium Digest of Technical Papers; Blackwell Publishing Ltd.: Oxford, UK, 2000; Volume 31, pp. 866–869. [Google Scholar]
- Kykta, M.A. Retinal Scanning Display (RSD) technology and the task of measuring contrast. Proc. SPIE 2001, 4295. [Google Scholar] [CrossRef]


| Requirement | VGA | SVGA | XGA | SXGA | UXGA |
|---|---|---|---|---|---|
| Resolution | 640 × 480 | 800 × 600 | 1024 × 768 | 1280 × 1024 | 1600 × 1200 |
| fr | 60 | 60 | 60 | 60 | 60 |
| NH | 453 | 566 | 725 | 906 | 1132 |
| NV | 679 | 849 | 1087 | 1449 | 1698 |
| Ksp | 1 | 1 | 1 | 1 | 1 |
| Kos | 0.707 | 0.707 | 0.707 | 0.707 | 0.707 |
| KT | 1.134 | 1.134 | 1.134 | 1.134 | 1.134 |
| a | 1.22 | 1.22 | 1.22 | 1.22 | 1.22 |
| λ(μm) | 0.635 | 0.635 | 0.635 | 0.635 | 0.635 |
| θ1·D (deg·mm) | 27.2 | 33.6 | 42.4 | 52.318 | 66.4 |
| θ2·D (deg·mm) | 20.4 | 25.2 | 31.8 | 41.854 | 49.8 |
| N | 313 | 386 | 487 | 626 | 763 |
| f1 | 18,780 | 23,160 | 29,220 | 37,560 | 45,780 |
| f2 | 18,720 | 23,100 | 29,160 | 37,500 | 45,720 |
| Resolution | VGA | SVGA | XGA | SXGA | UXGA |
|---|---|---|---|---|---|
| Minimum pixel time (ns) | 25 | 16 | 10.5 | 6.5 | 4 |
| Modulation frequency (MHz) | 40 | 62.5 | 96 | 154 | 250 |
| Feature | Mirror A | Mirror B |
|---|---|---|
| Frequency (Hz) | 790 | 785 |
| Optical scanning angle (°) | 14 | 14 |
| Mirror size (mm) | 2 mm | 2 mm |
© 2016 by the authors; licensee MDPI, Basel, Switzerland. This article is an open access article distributed under the terms and conditions of the Creative Commons Attribution (CC-BY) license (http://creativecommons.org/licenses/by/4.0/).
Share and Cite
Du, W.; Zhang, G.; Ye, L. Image Quality Analysis and Optical Performance Requirement for Micromirror-Based Lissajous Scanning Displays. Sensors 2016, 16, 675. https://doi.org/10.3390/s16050675
Du W, Zhang G, Ye L. Image Quality Analysis and Optical Performance Requirement for Micromirror-Based Lissajous Scanning Displays. Sensors. 2016; 16(5):675. https://doi.org/10.3390/s16050675
Chicago/Turabian StyleDu, Weiqi, Gaofei Zhang, and Liangchen Ye. 2016. "Image Quality Analysis and Optical Performance Requirement for Micromirror-Based Lissajous Scanning Displays" Sensors 16, no. 5: 675. https://doi.org/10.3390/s16050675
APA StyleDu, W., Zhang, G., & Ye, L. (2016). Image Quality Analysis and Optical Performance Requirement for Micromirror-Based Lissajous Scanning Displays. Sensors, 16(5), 675. https://doi.org/10.3390/s16050675