
A Micro Aerosol Sensor for the Measurement of Airborne Ultrafine Particles

Abstract
:1. Introduction
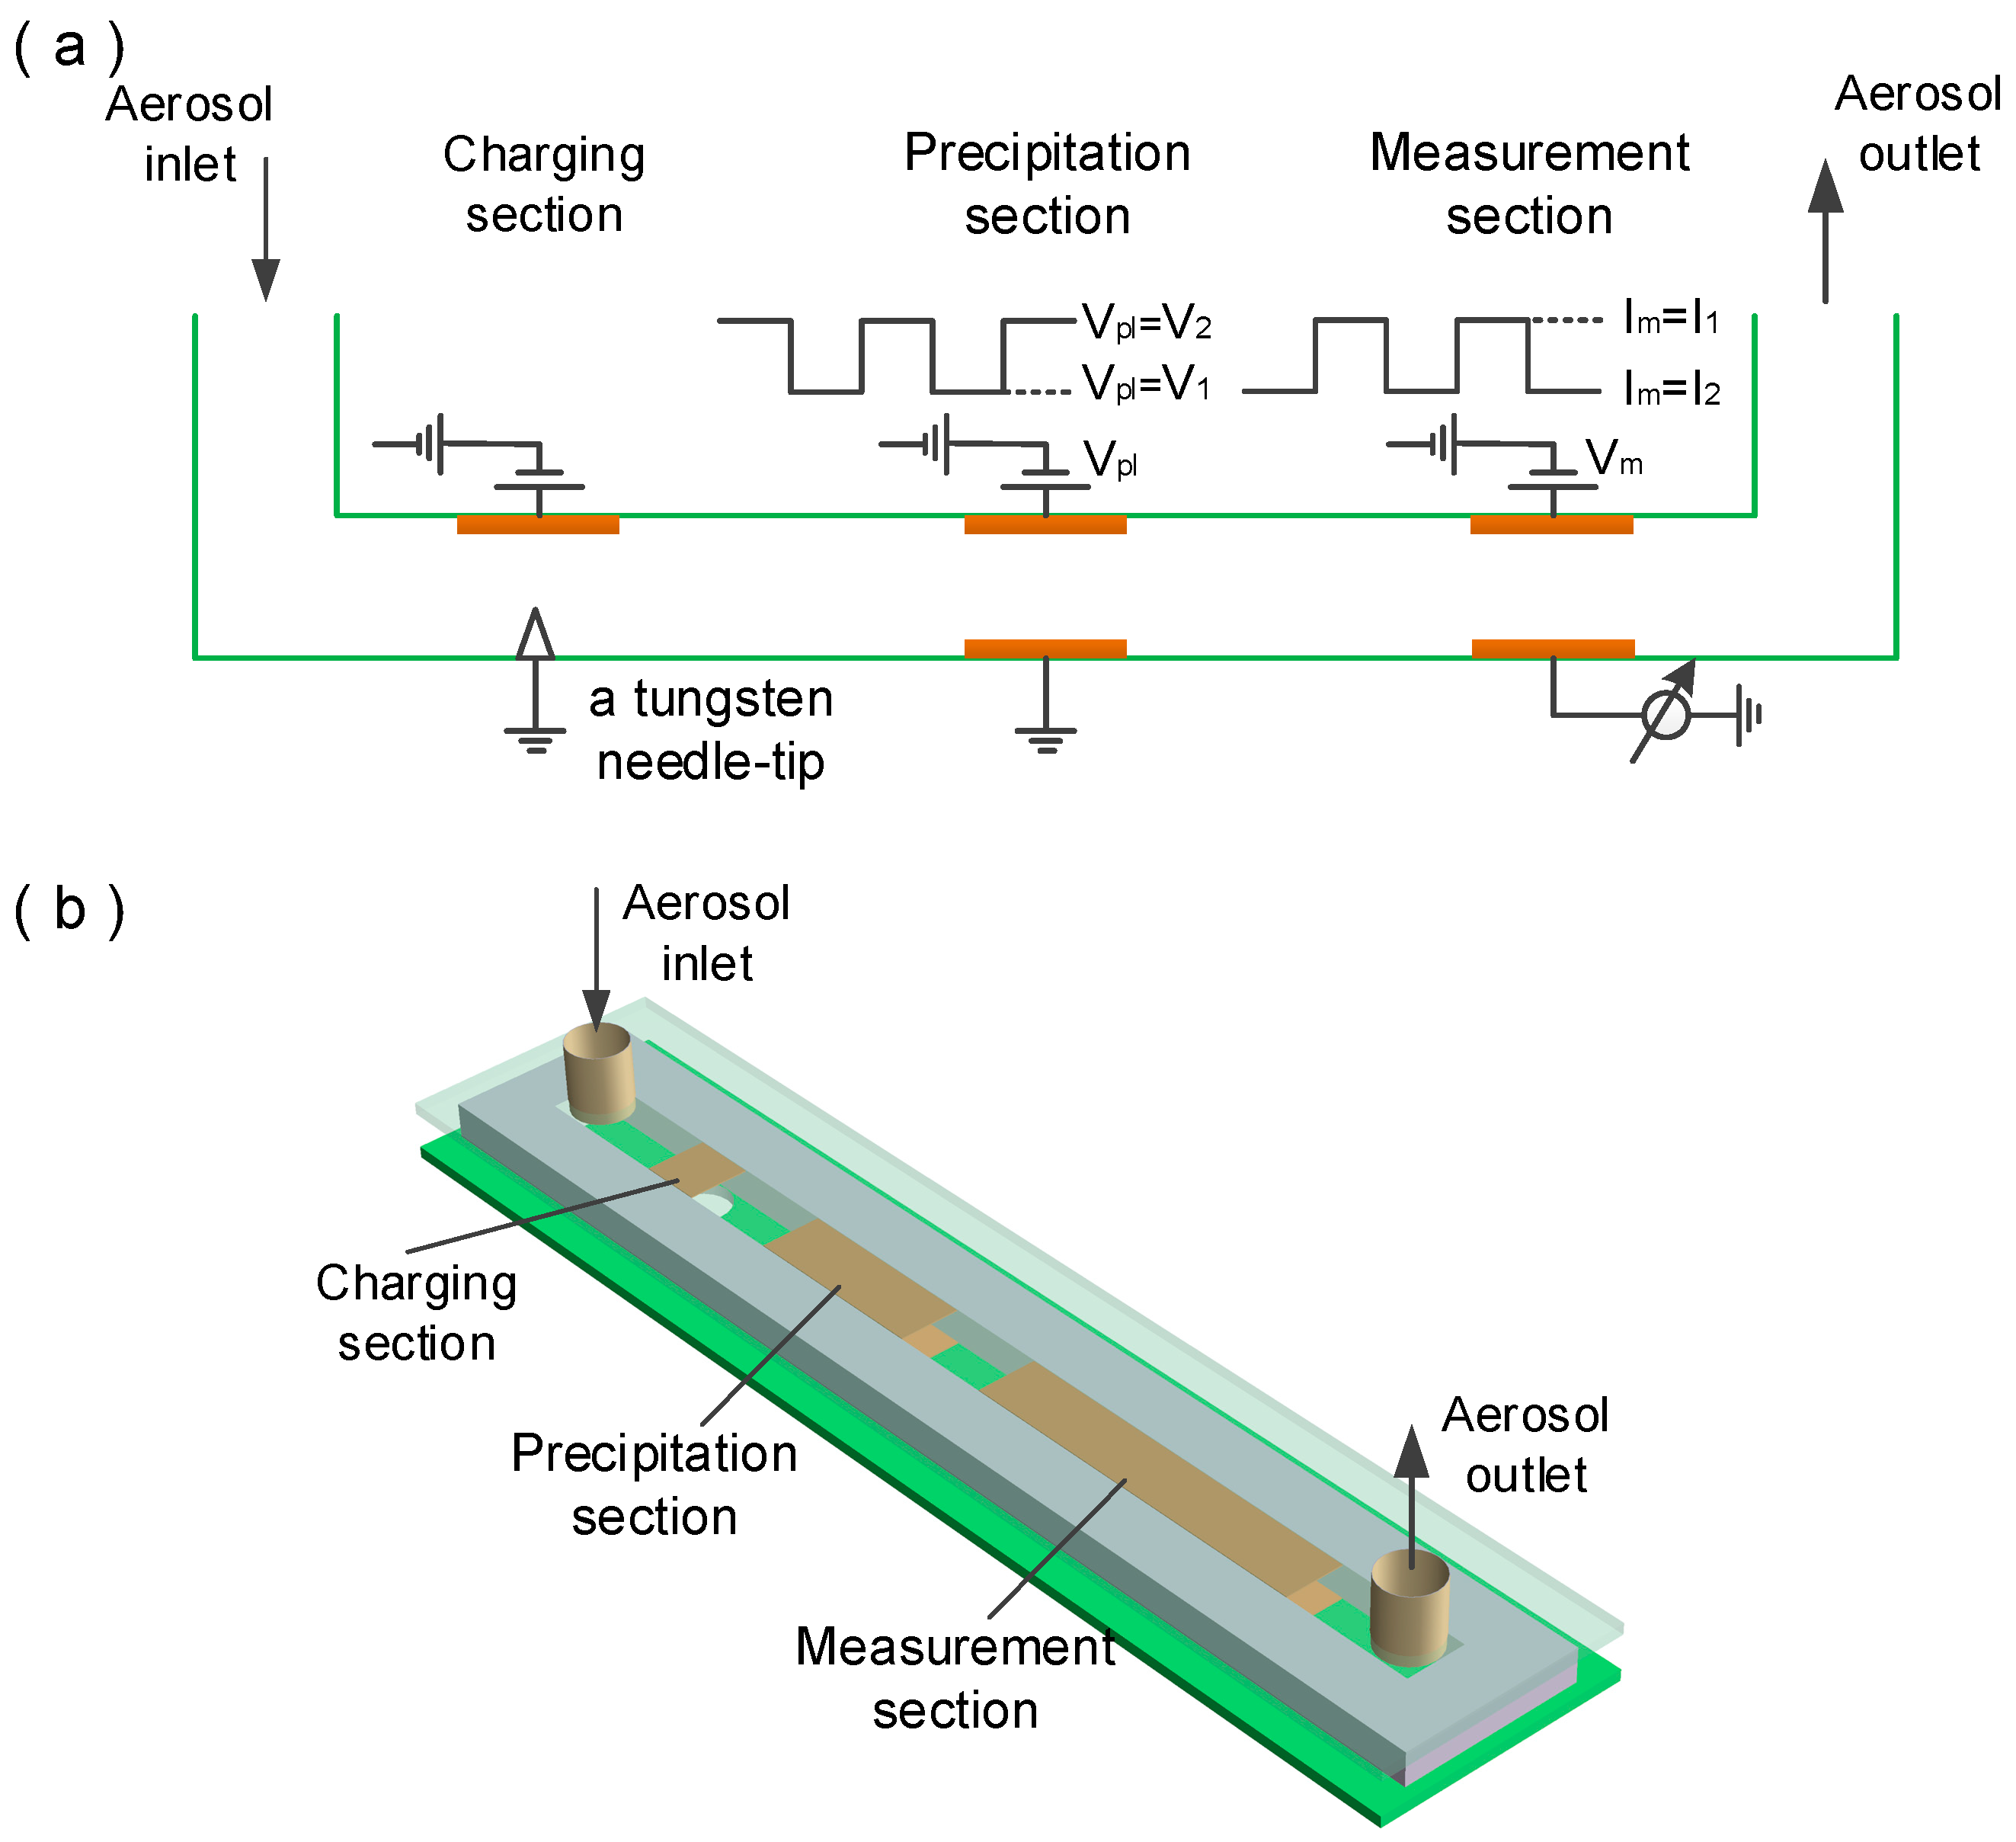
2. Theory of Operation
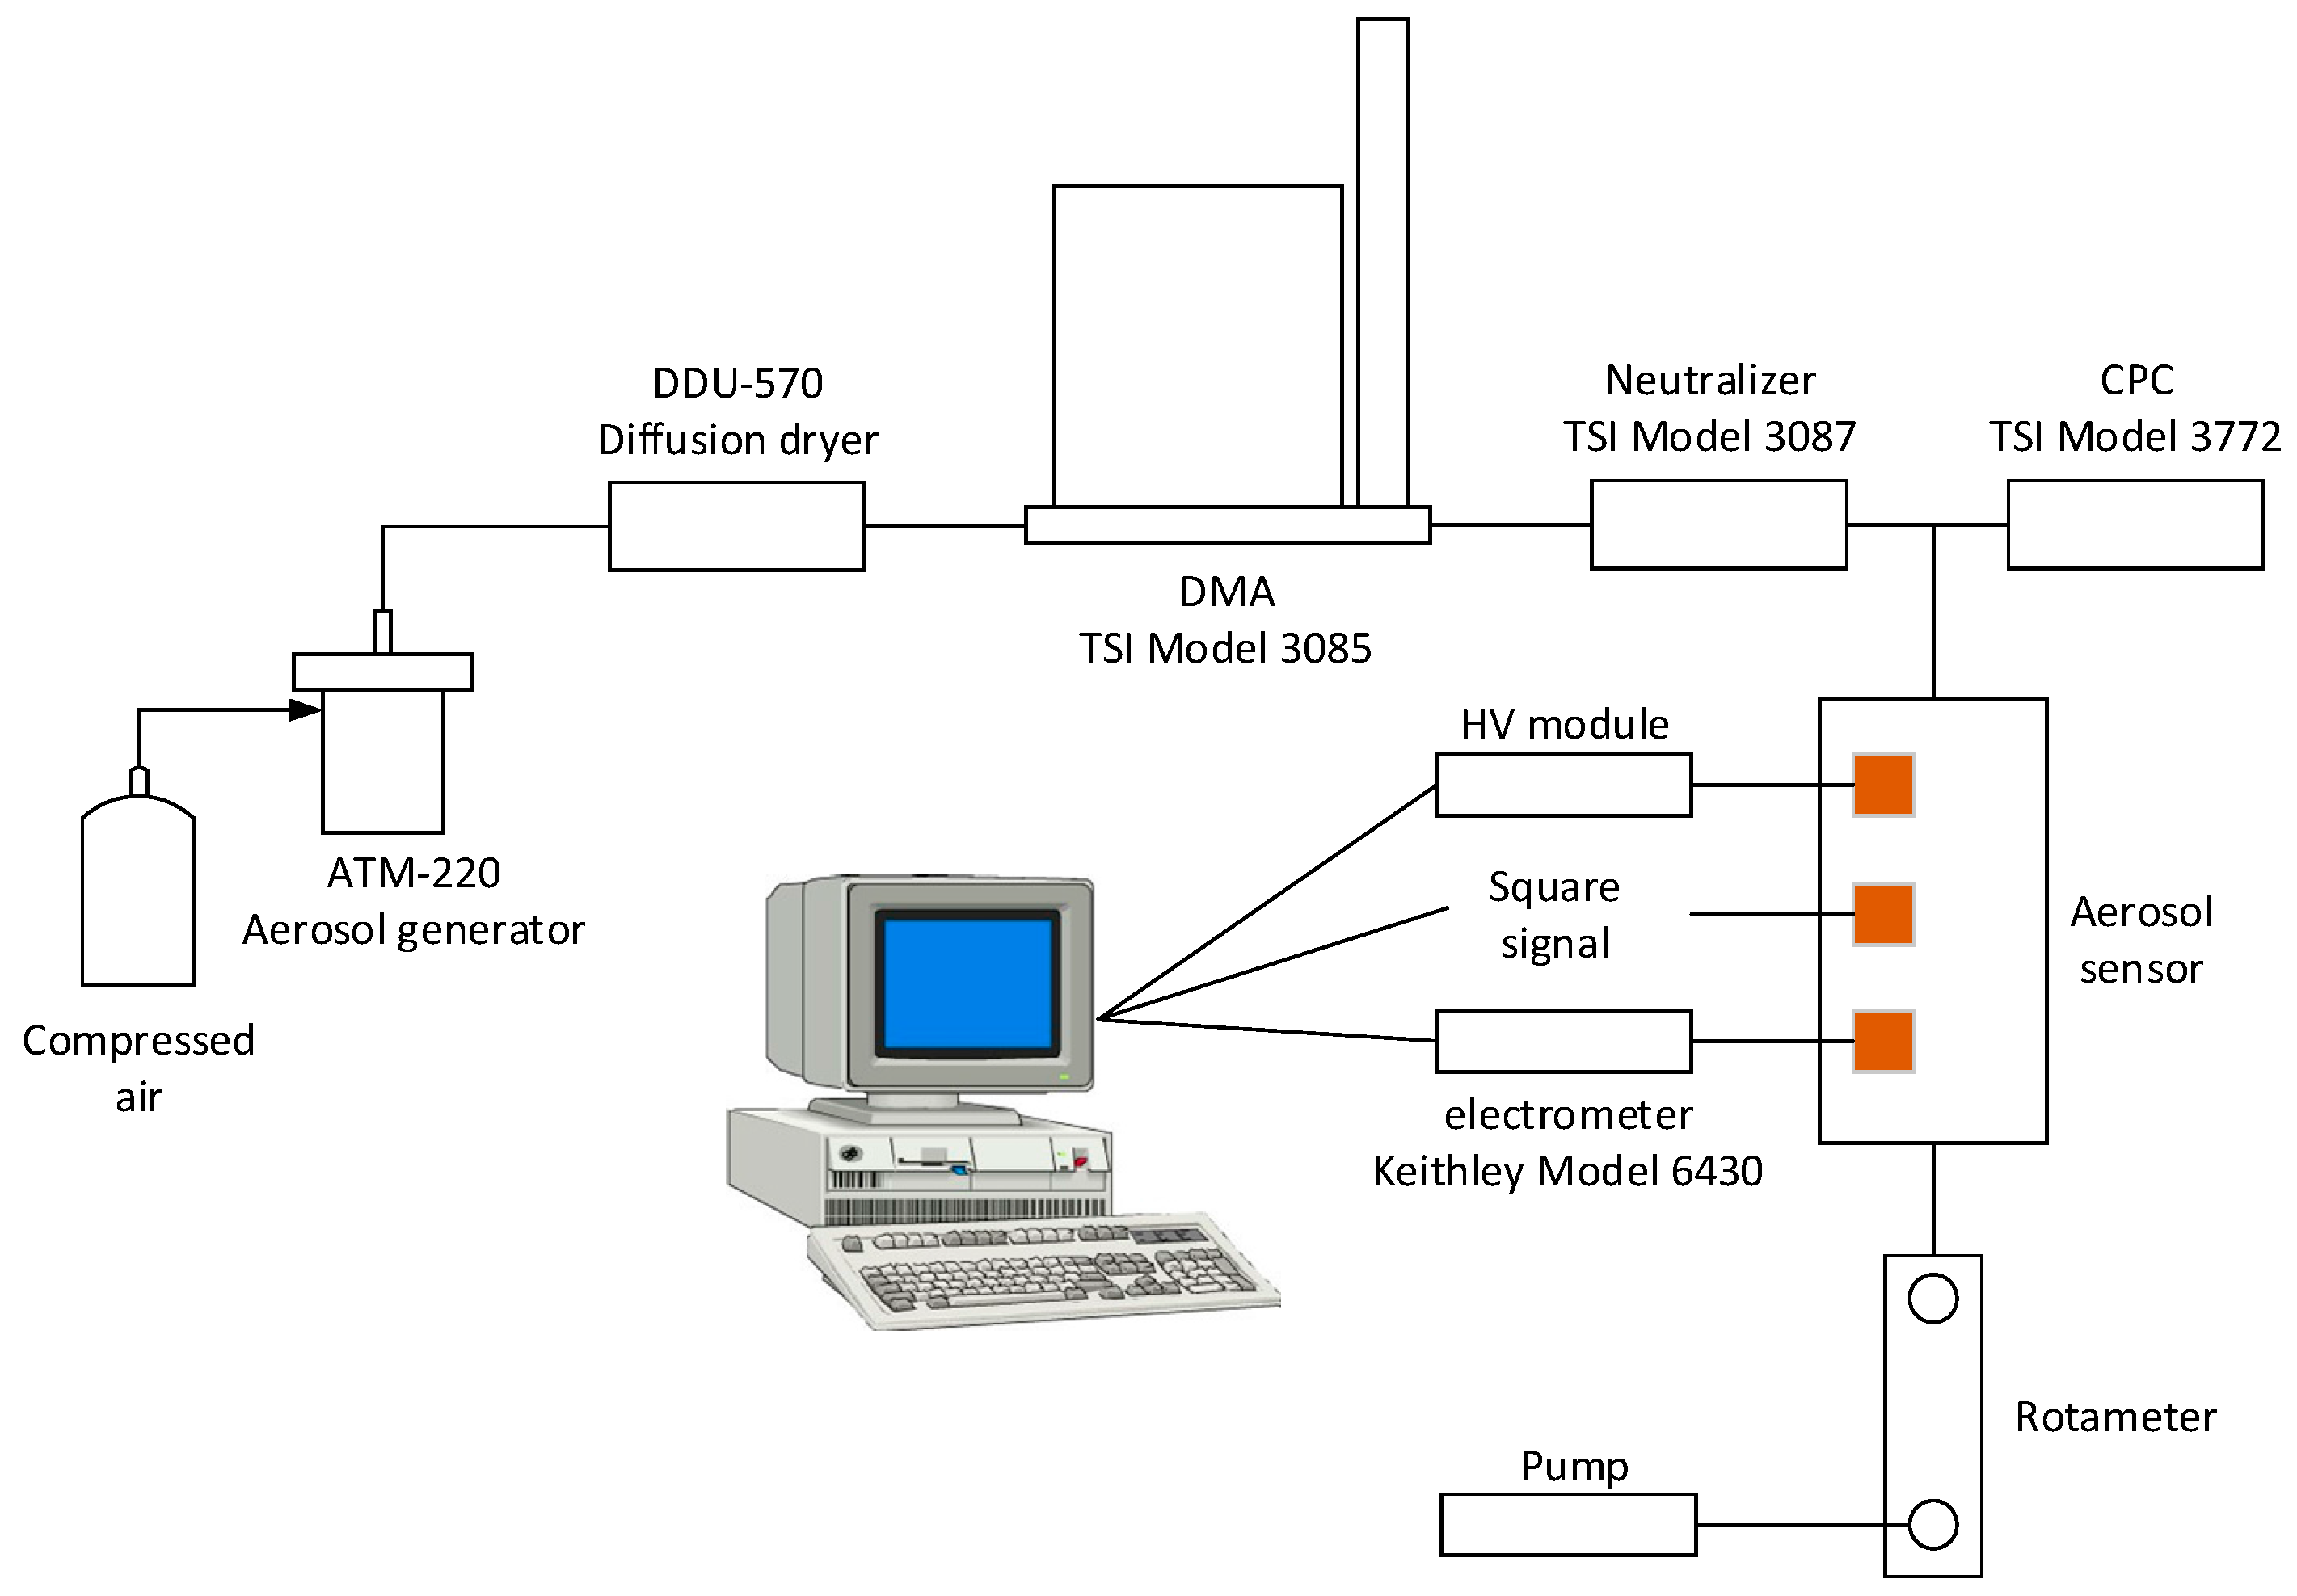
3. Experimental Setup
4. Preliminary Experiments
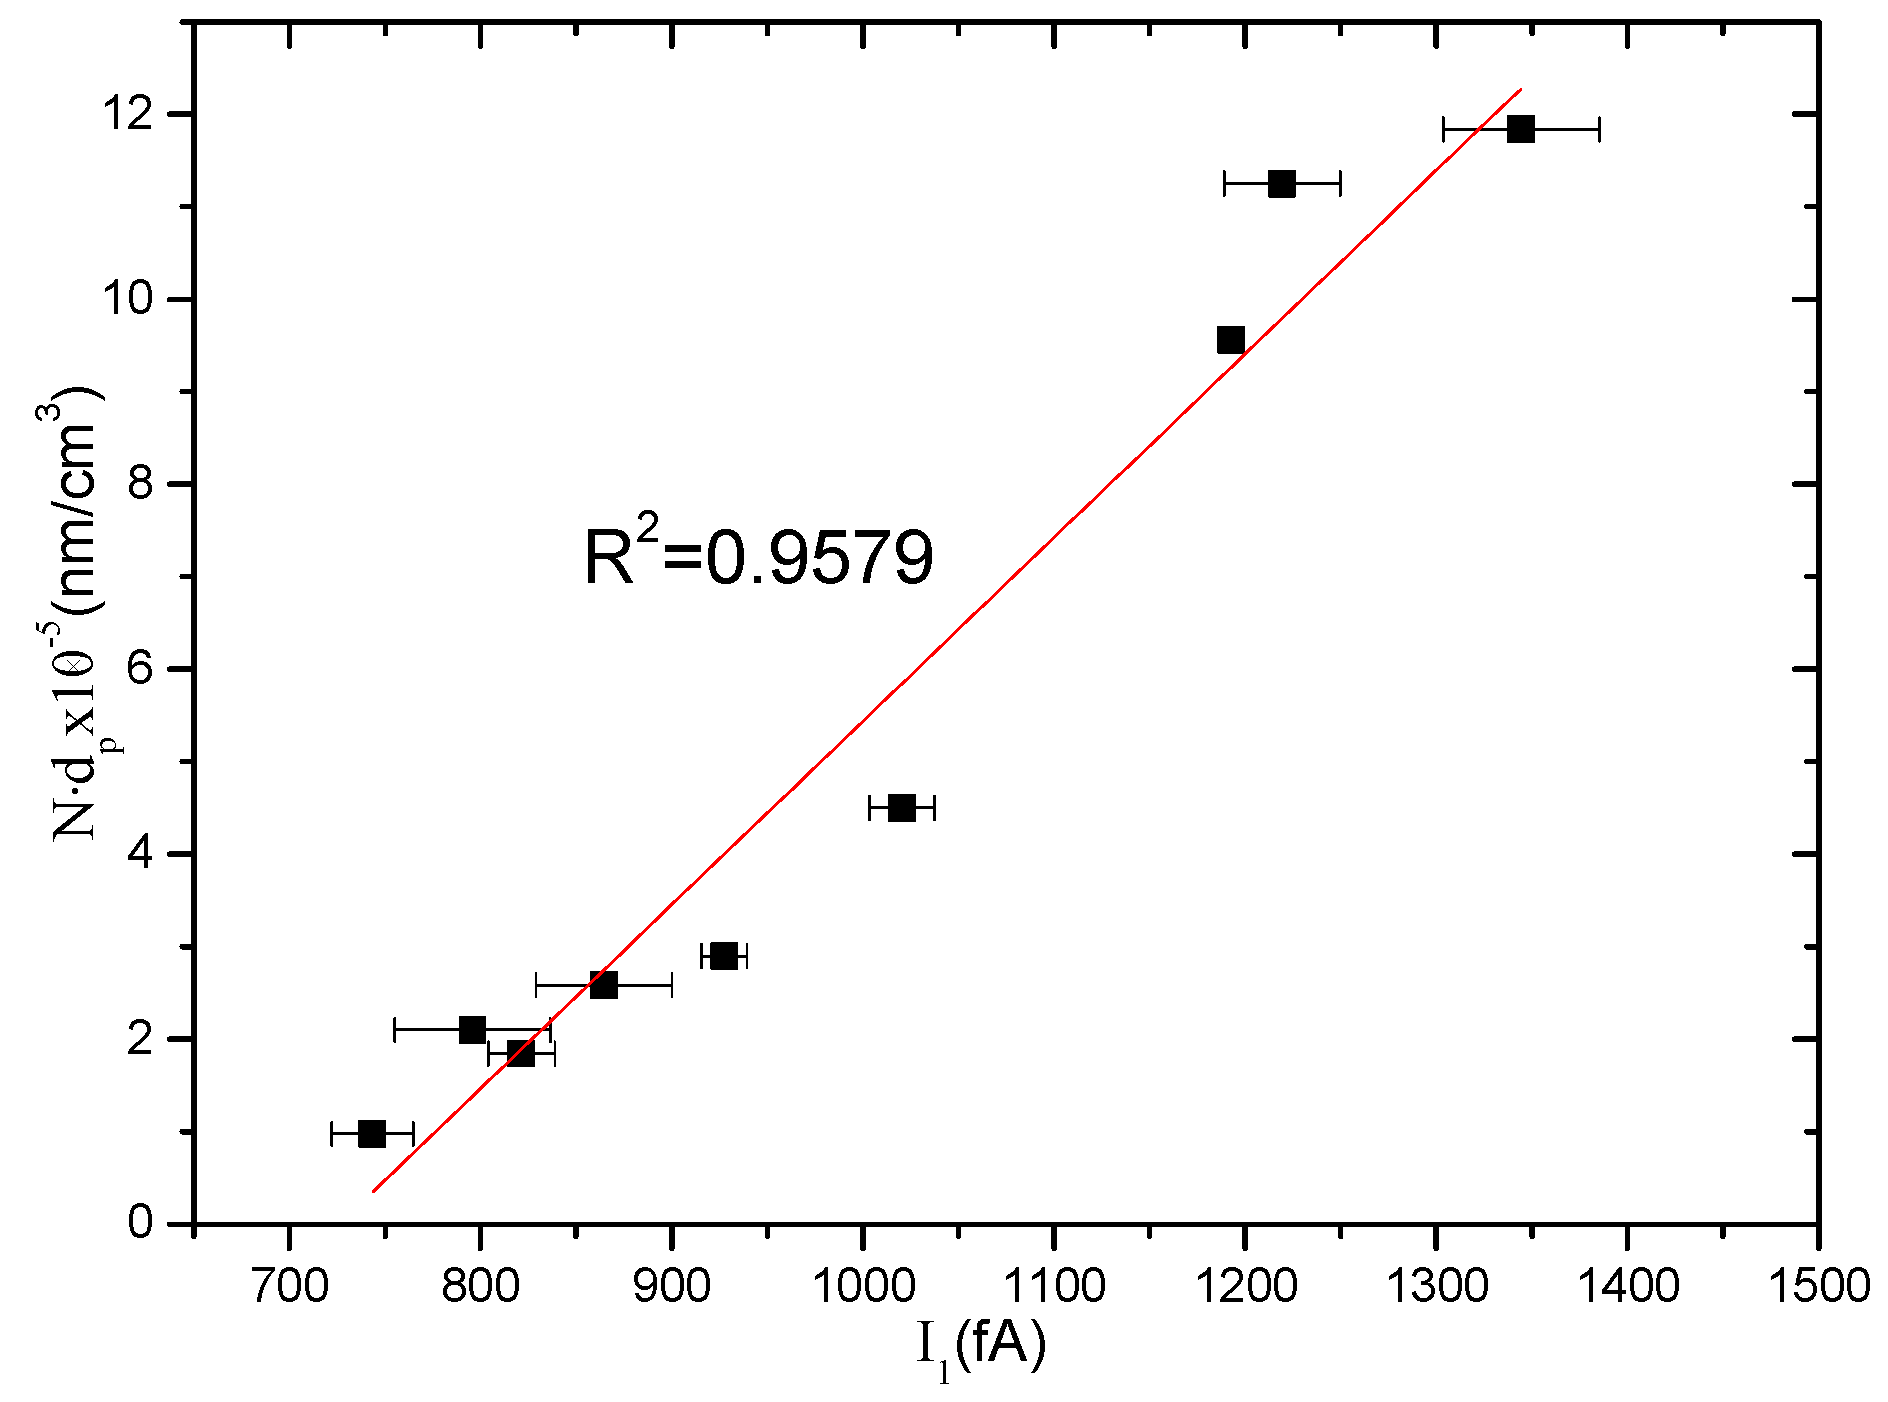
5. Results and Discussion
6. Conclusions
Acknowledgments
Author Contributions
Conflicts of Interest
References
- John, W. Size Distribution Characteristics of Aerosols. In Aerosol Measurement, Principles, Techniques and Applications, 4th ed.; Pramod, K., Paul, A.B., Klaus, W., Eds.; Wiley: Hoboken, NJ, USA, 2011; pp. 41–54. [Google Scholar]
- William, C.H. Aerosol Technology, Properties, Behavior and Measurement of Airborne Particles, 2nd ed.; John Wiley & Sons, Inc.: Hoboken, NJ, USA, 1998. [Google Scholar]
- Maynard, A.D.; Kuempl, E.M. Airborne nanostructured particles and occupational health. J. Nanopart. Res. 2005, 7, 587–614. [Google Scholar] [CrossRef]
- Bakand, S.; Hayes, A.; Dechsakulthorn, F. Nanoparticles: A review of particle toxicology following inhalation exposure. Inhalation Toxic. 2012, 24, 125–135. [Google Scholar] [CrossRef] [PubMed]
- Oberdörster, G. Significance of particle parameters in the evaluation of exposure-dose response relationships of inhaled particles. Part. Sci. Technol. 1996, 14, 135–151. [Google Scholar] [CrossRef]
- Oberdörster, G.; Celein, R.M.; Ferin, J.; Weiss, B. Association of particulate air pollution and acute mortality: Involvement of ultrafine particles. Inhalation Toxic. 1995, 7, 111–124. [Google Scholar] [CrossRef] [PubMed]
- Kreyling, W.G.; Semmler, M.; Erbe, F.; Mayer, P.; Takenaka, S.; Schulz, H.; Oberdörster, G.; Ziesenis, A. Translocation of ultrafine insoluble iridium particles from lung epithelium to extrapulmonary organs is size dependent but very low. J. Toxicol. Environ. Health Part A 2002, 65, 1513–1530. [Google Scholar] [CrossRef] [PubMed]
- Oberdörster, G.; Oberdörster, E.; Oberdörster, J. Nanotoxicology: An emerging discipline evolving from studies of ultrafine particles. Environ. Health Perspect. 2005, 113, 823–839. [Google Scholar] [CrossRef] [PubMed]
- ICRP, International Commission on Radiological Protection. ICRP Publication 66: Human Respiratory Tract Model for Radiological Protection; Elsevier Health Sciences: London, UK, 1994; pp. 1–482. [Google Scholar]
- Koo, J.H.; Hirleman, E.D. Review of Principles of Particle Size Measurements. In Recent Advances in Spray Combustion: Spray Atomization and Drop Burning Phenomena, 1st ed.; Kuo, K.K., Ed.; American Institute of Aeronautics and Astronautics: Reston, VA, USA, 1996; Volume 1, pp. 3–32. [Google Scholar]
- Black, D.L.; McQuay, M.Q.; Bonin, M.P. Laser-based techniques for particle-size measurement: A review of sizing methods and their industrial applications. Progr. Energy Combust Sci. 1996, 22, 267–306. [Google Scholar] [CrossRef]
- Wang, S.C.; Flagan, R.C. Scanning electrical mobility spectrometer. Aerosol Sci. Technol. 1990, 13, 230–240. [Google Scholar] [CrossRef]
- Mamakos, A.; Ntziachristos, L.; Samaras, Z. Diffusion broadening of DMA transfer functions, Numerical validation of Stolzenburg model. J. Aerosol Sci. 2007, 38, 747–763. [Google Scholar] [CrossRef]
- McMurry, P.H. The history of condensation nucleus counters. Aerosol Sci. Technol. 2000, 33, 297–322. [Google Scholar] [CrossRef]
- Marra, J.; Den, B.W.; Goossens, H.; Kessels, S. Nanoparticle monitoring for exposure assessment. IEEE Nanotechnol. Mag. 2009, 3, 6–37. [Google Scholar] [CrossRef]
- Marra, J.; Voetz, M.; Kiesling, H.J. Monitor for detecting and assessing exposure to airborne nanoparticles. J. Nanopart. Res. 2010, 12, 21–37. [Google Scholar] [CrossRef]
- Fierz, M.; Houle, C.; Steigmeier, P.; Burtscher, H. Design, calibration, and field performance of a miniature diffusion size classifier. Aerosol Sci. Tech. 2011, 45, 1–10. [Google Scholar] [CrossRef]
- Fierz, M.; Burtscher, H.; Steigmeier, P.; Kasper, M. Field measurement of particle size and number concentration with the Diffusion Size Classifier (DiSC). SAE Int. 2008. [Google Scholar] [CrossRef]
- Bau, S.; Zimmermann, B.; Payet, R.; Witschger, O. A laboratory study of the performance of the handheld diffusion size classifier (DiSCmini) for various aerosols in the 15–400 nm range. Environ. Sci. Process. Impacts 2015, 17, 261–269. [Google Scholar] [CrossRef] [PubMed]
- Wasisto, H.S.; Merzsch, S.; Uhde, E.; Waag, A.; Peiner, E. Handheld personal airborne nanoparticle detector based on microelectromechanical silicon resonant cantilever. Microelectron. Eng. 2015, 145, 96–103. [Google Scholar] [CrossRef]
- Liang, D.; Shih, W.P.; Chen, C.S.; Dai, C.A. A miniature system for separating aerosol particles and measuring mass concentrations. Sensors 2010, 10, 3641–3654. [Google Scholar] [CrossRef] [PubMed]
- Morris, D.R.; Fatisson, J.; Olsson, A.L.; Tufenkji, N.; Ferro, A.R. Real-time monitoring of airborne cat allergen using a QCM-based immunosensor. Sens. Actuators B: Chem. 2014, 190, 851–857. [Google Scholar] [CrossRef]
- Park, C.W.; Lee, S.G.; Kim, M.O.; Kim, J.; Hwang, J. Development and performance test of a ZnO nanowire charger for measurements of nano-aerosol particles. Sens. Actuators A: Phys. 2015, 222, 1–7. [Google Scholar] [CrossRef]
- Jung, H.; Kittelson, D.B. Characterization of aerosol surface instruments in transition regime. Aerosol Sci. Technol. 2005, 39, 902–911. [Google Scholar] [CrossRef]
- Adachi, M.; Kousaka, Y.; Okuyama, K. Unipolar and bipolar diffusion charging of ultrafine aerosol particles. J. Aerosol Sci. 1985, 16, 109–123. [Google Scholar] [CrossRef]
- Price, H.D.; Stahlmecke, B.; Arthur, R.; Kaminski, H.; Lindermann, J.; Däuber, E.; Asbach, C.; Kuhlbusch, T.A.; Berube, K.A.; Jones, T.P. Comparison of instruments for particle number size distribution measurements in air quality monitoring. J. Aerosol Sci. 2014, 76, 48–55. [Google Scholar] [CrossRef]
- Zimmerman, N.; Pollitt, K.J.G.; Jeong, C.H.; Wang, J.M.; Jung, T.; Cooper, J.M.; Wallace, J.S.; Evans, G.J. Comparison of three nanoparticle sizing instruments: The influence of particle morphology. Atmos. Environ. 2014, 86, 140–147. [Google Scholar] [CrossRef]


| Conditions | Average Current (fA) | Standard Deviation (fA) |
|---|---|---|
| Air without charging | −41.4 | −1.4 |
| Air with diffusion charging | −83.7 | −7.6 |
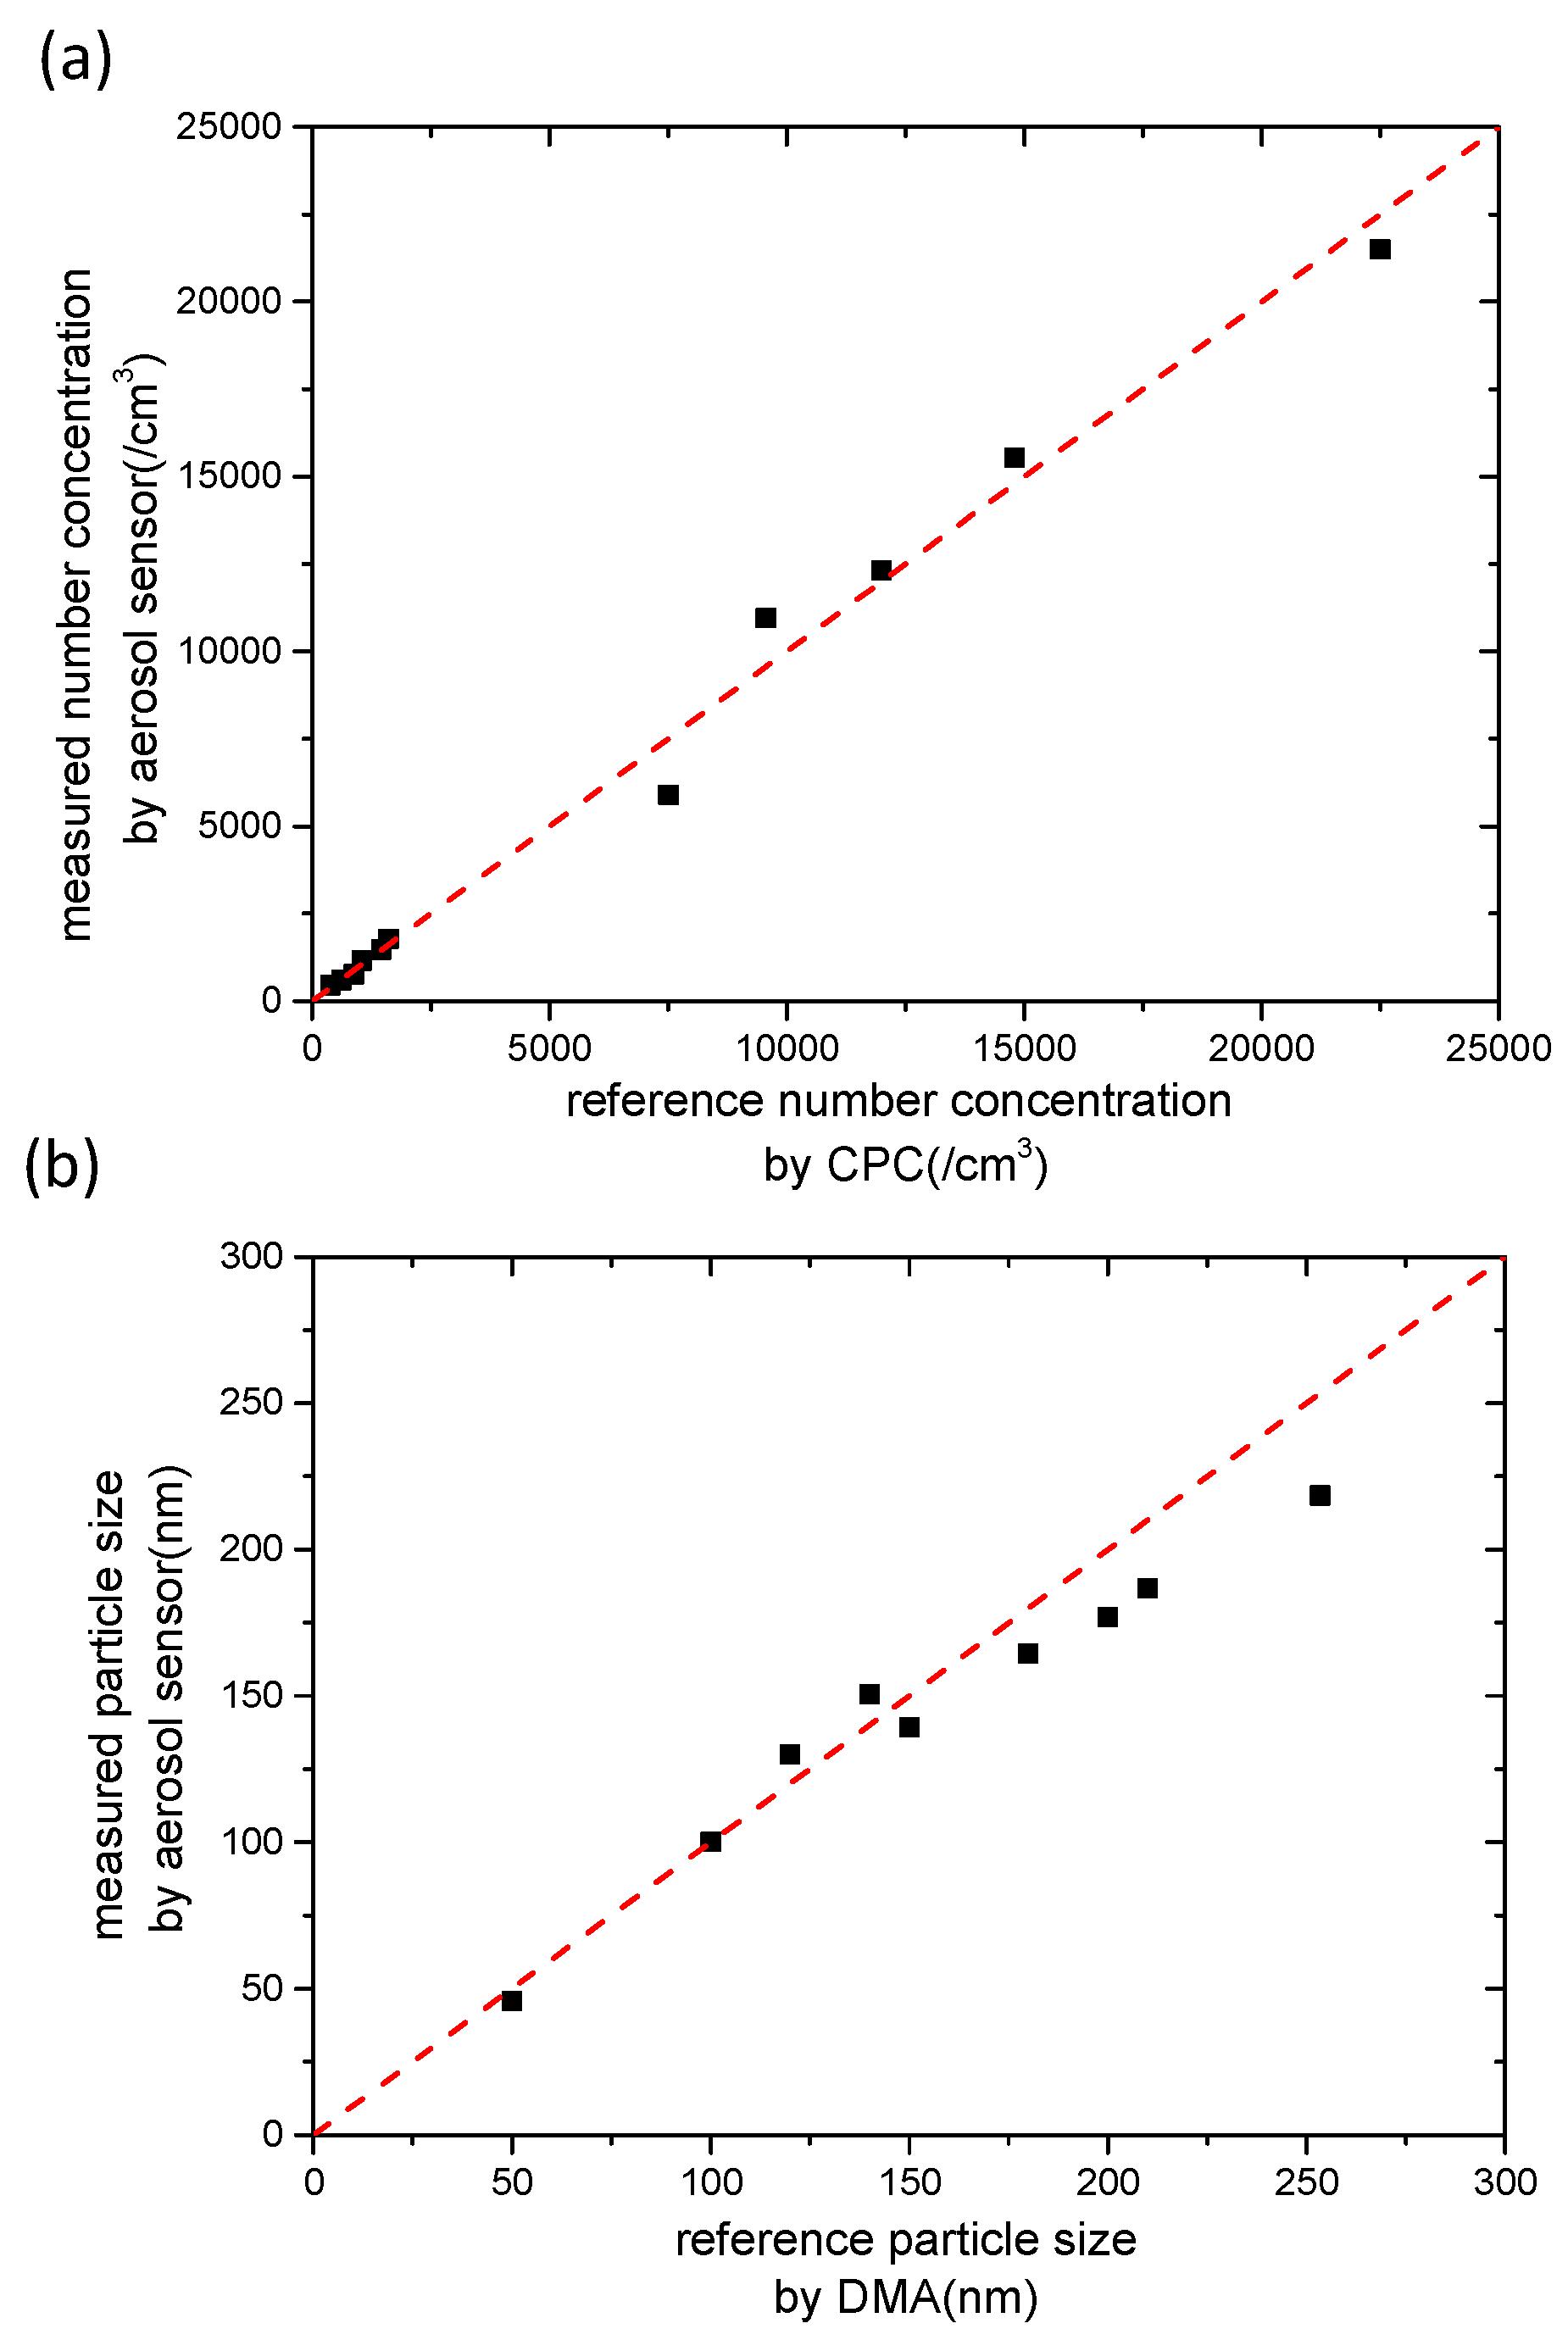
| Parameter | Mean Square Deviation | Maximum Deviation | Minimum Deviation |
|---|---|---|---|
| Number concentration | 6.7% | 21% | 0.03% |
| Aerosol particle size | 3.8% | 13.8% | 0.1% |
© 2016 by the authors; licensee MDPI, Basel, Switzerland. This article is an open access article distributed under the terms and conditions of the Creative Commons by Attribution (CC-BY) license (http://creativecommons.org/licenses/by/4.0/).
Share and Cite
Zhang, C.; Zhu, R.; Yang, W. A Micro Aerosol Sensor for the Measurement of Airborne Ultrafine Particles. Sensors 2016, 16, 399. https://doi.org/10.3390/s16030399
Zhang C, Zhu R, Yang W. A Micro Aerosol Sensor for the Measurement of Airborne Ultrafine Particles. Sensors. 2016; 16(3):399. https://doi.org/10.3390/s16030399
Chicago/Turabian StyleZhang, Chao, Rong Zhu, and Wenming Yang. 2016. "A Micro Aerosol Sensor for the Measurement of Airborne Ultrafine Particles" Sensors 16, no. 3: 399. https://doi.org/10.3390/s16030399
APA StyleZhang, C., Zhu, R., & Yang, W. (2016). A Micro Aerosol Sensor for the Measurement of Airborne Ultrafine Particles. Sensors, 16(3), 399. https://doi.org/10.3390/s16030399