Poly(Ionic Liquid) Semi-Interpenetrating Network Multi-Responsive Hydrogels


Abstract
:
1. Introduction
2. Experimental Section
2.1. General Information
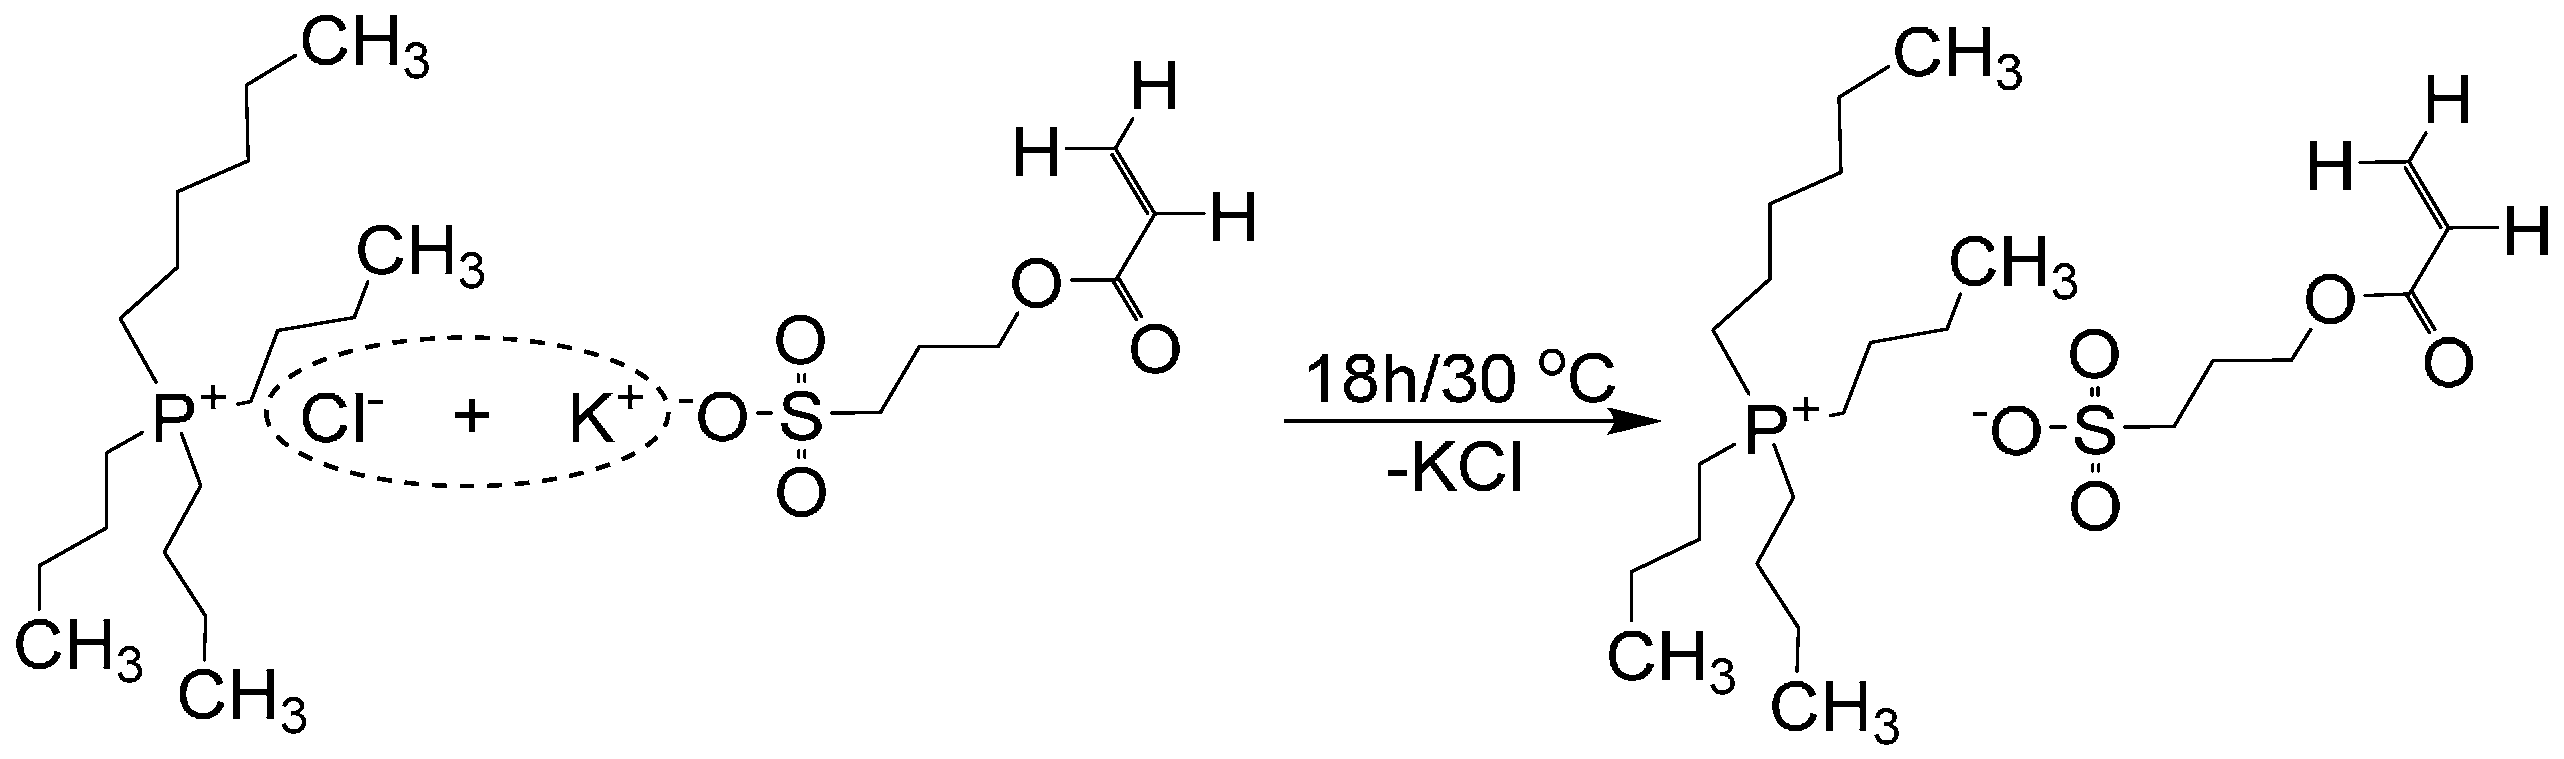
2.2. Synthesis of Tributylhexyl Phosphonium 3-Sulfopropyl Acrylate Ionic Liquid Monomer

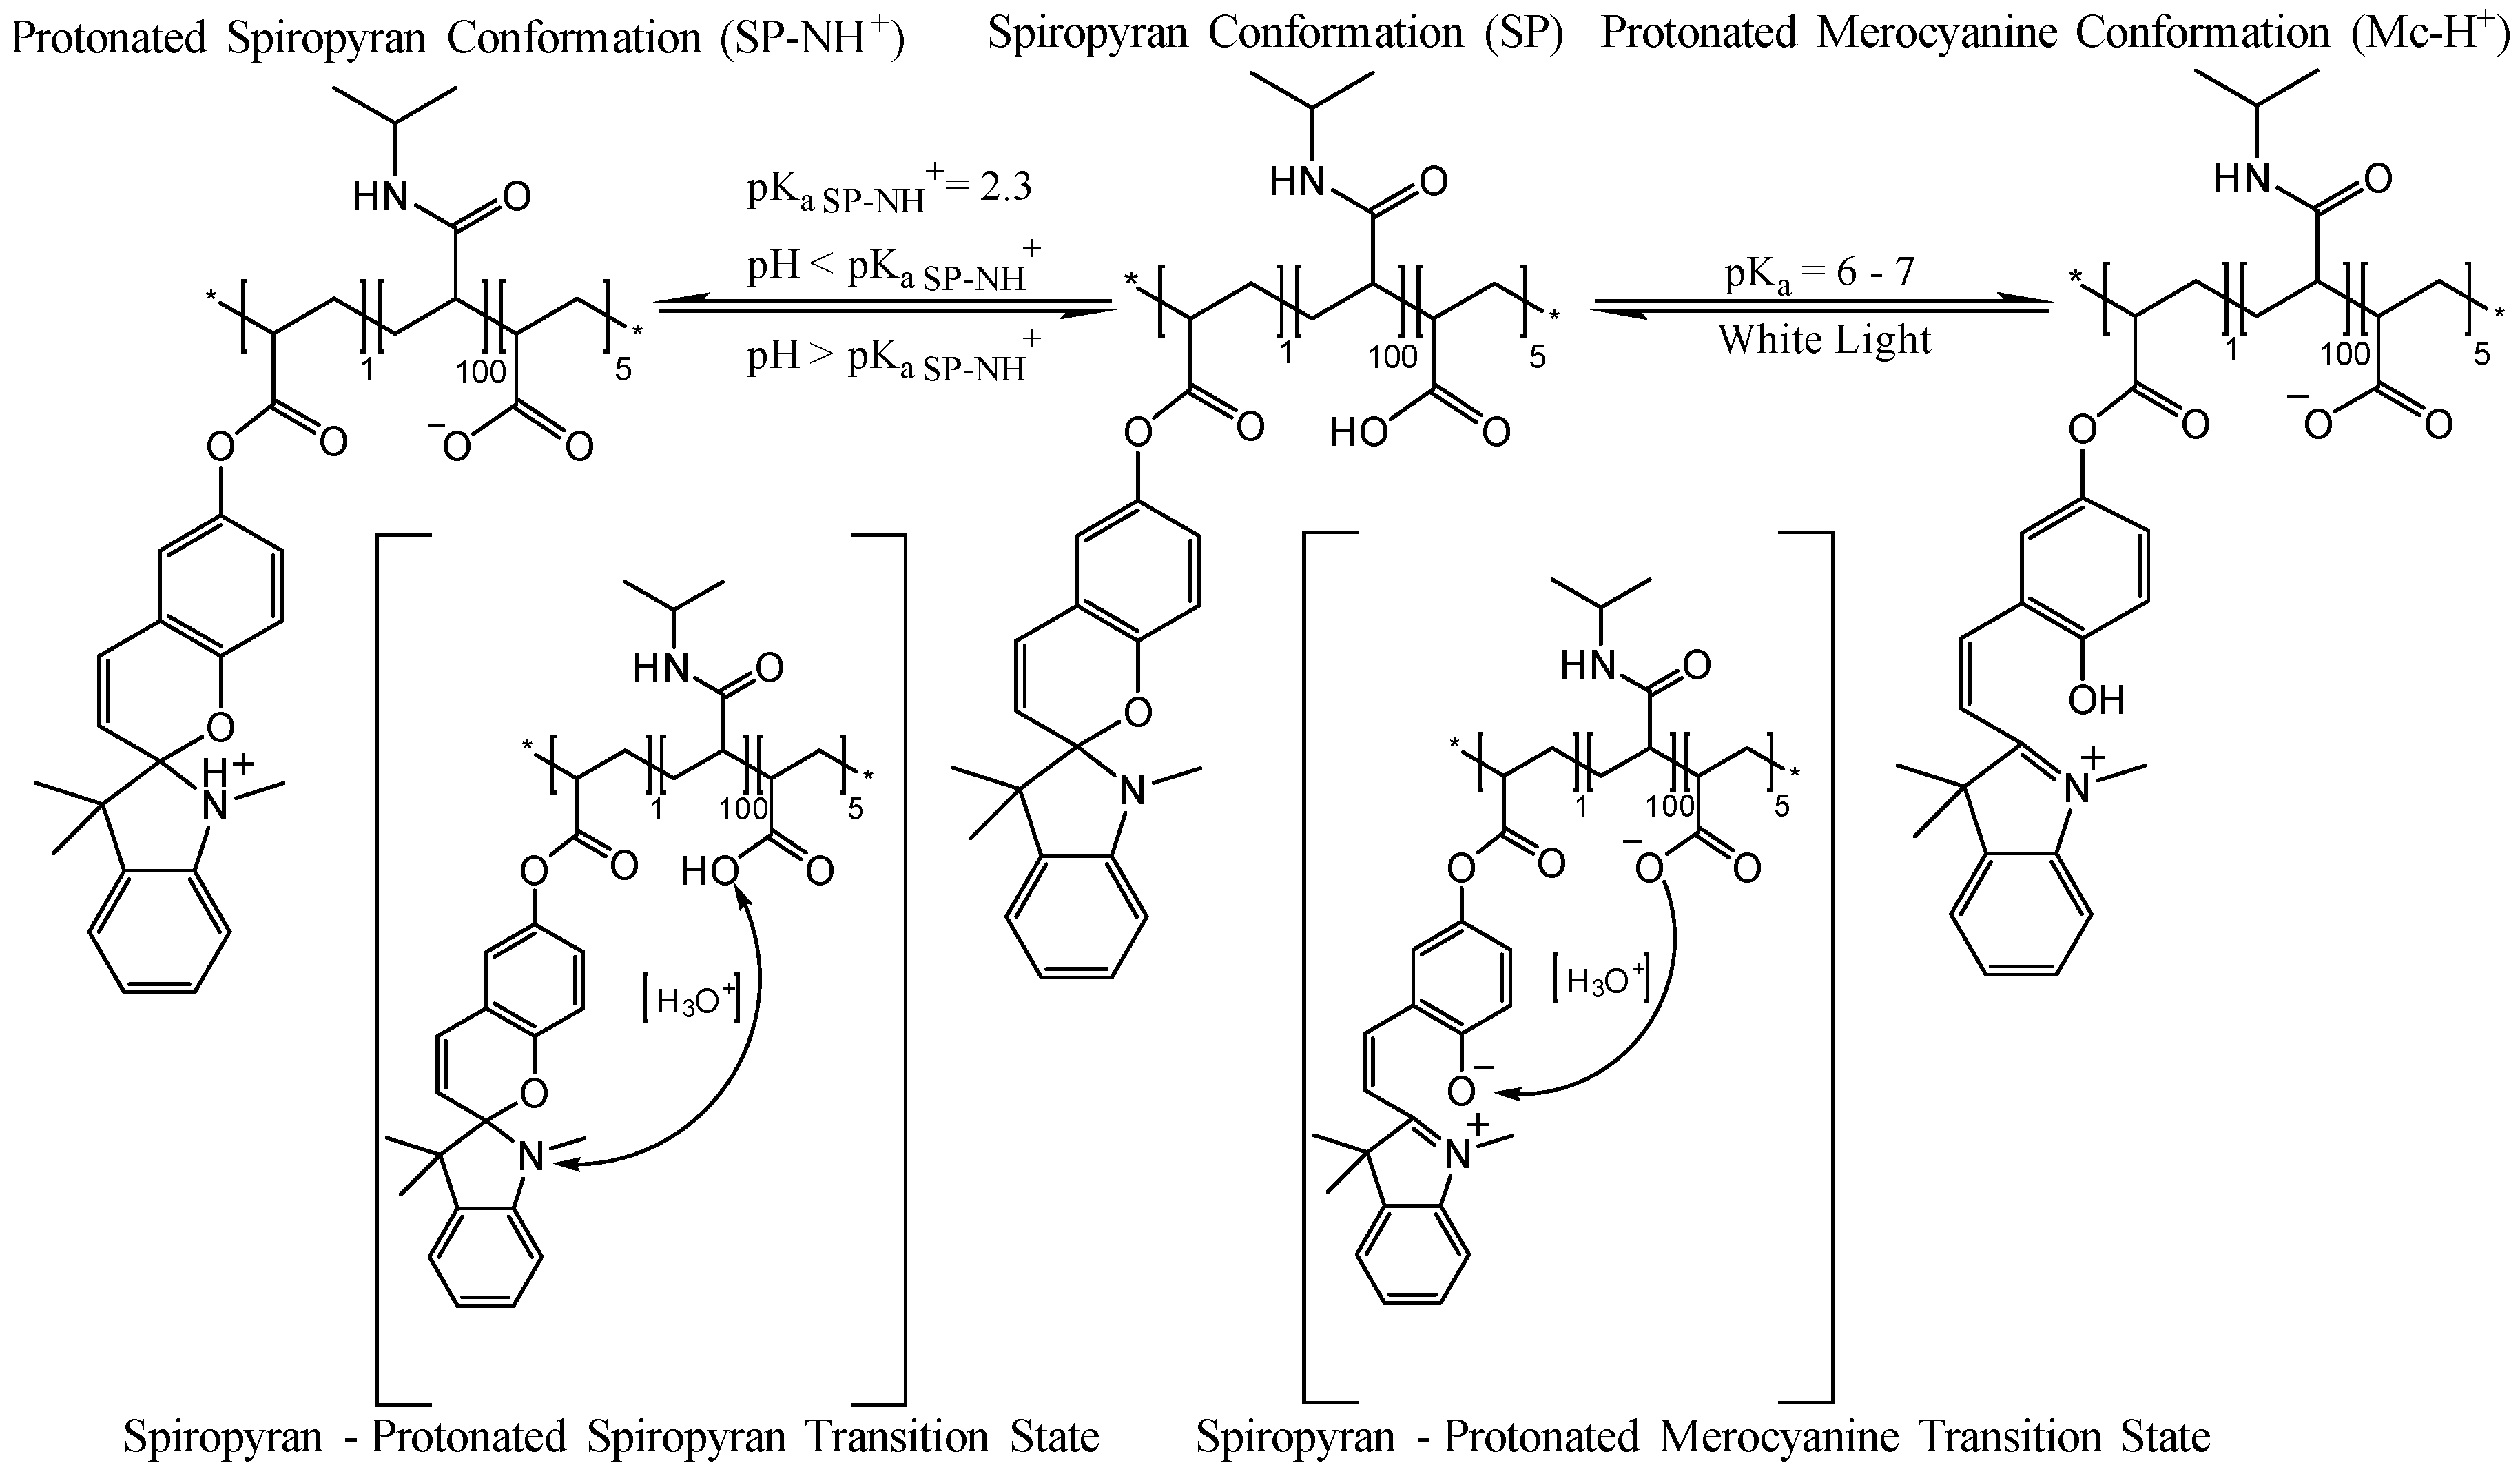
2.3. Synthesis of Linear Poly(N-Isopropylacrylamide-co-Spiropyran-co-Acrylic Acid) p(NiPAAm-BSP-AA) Copolymer
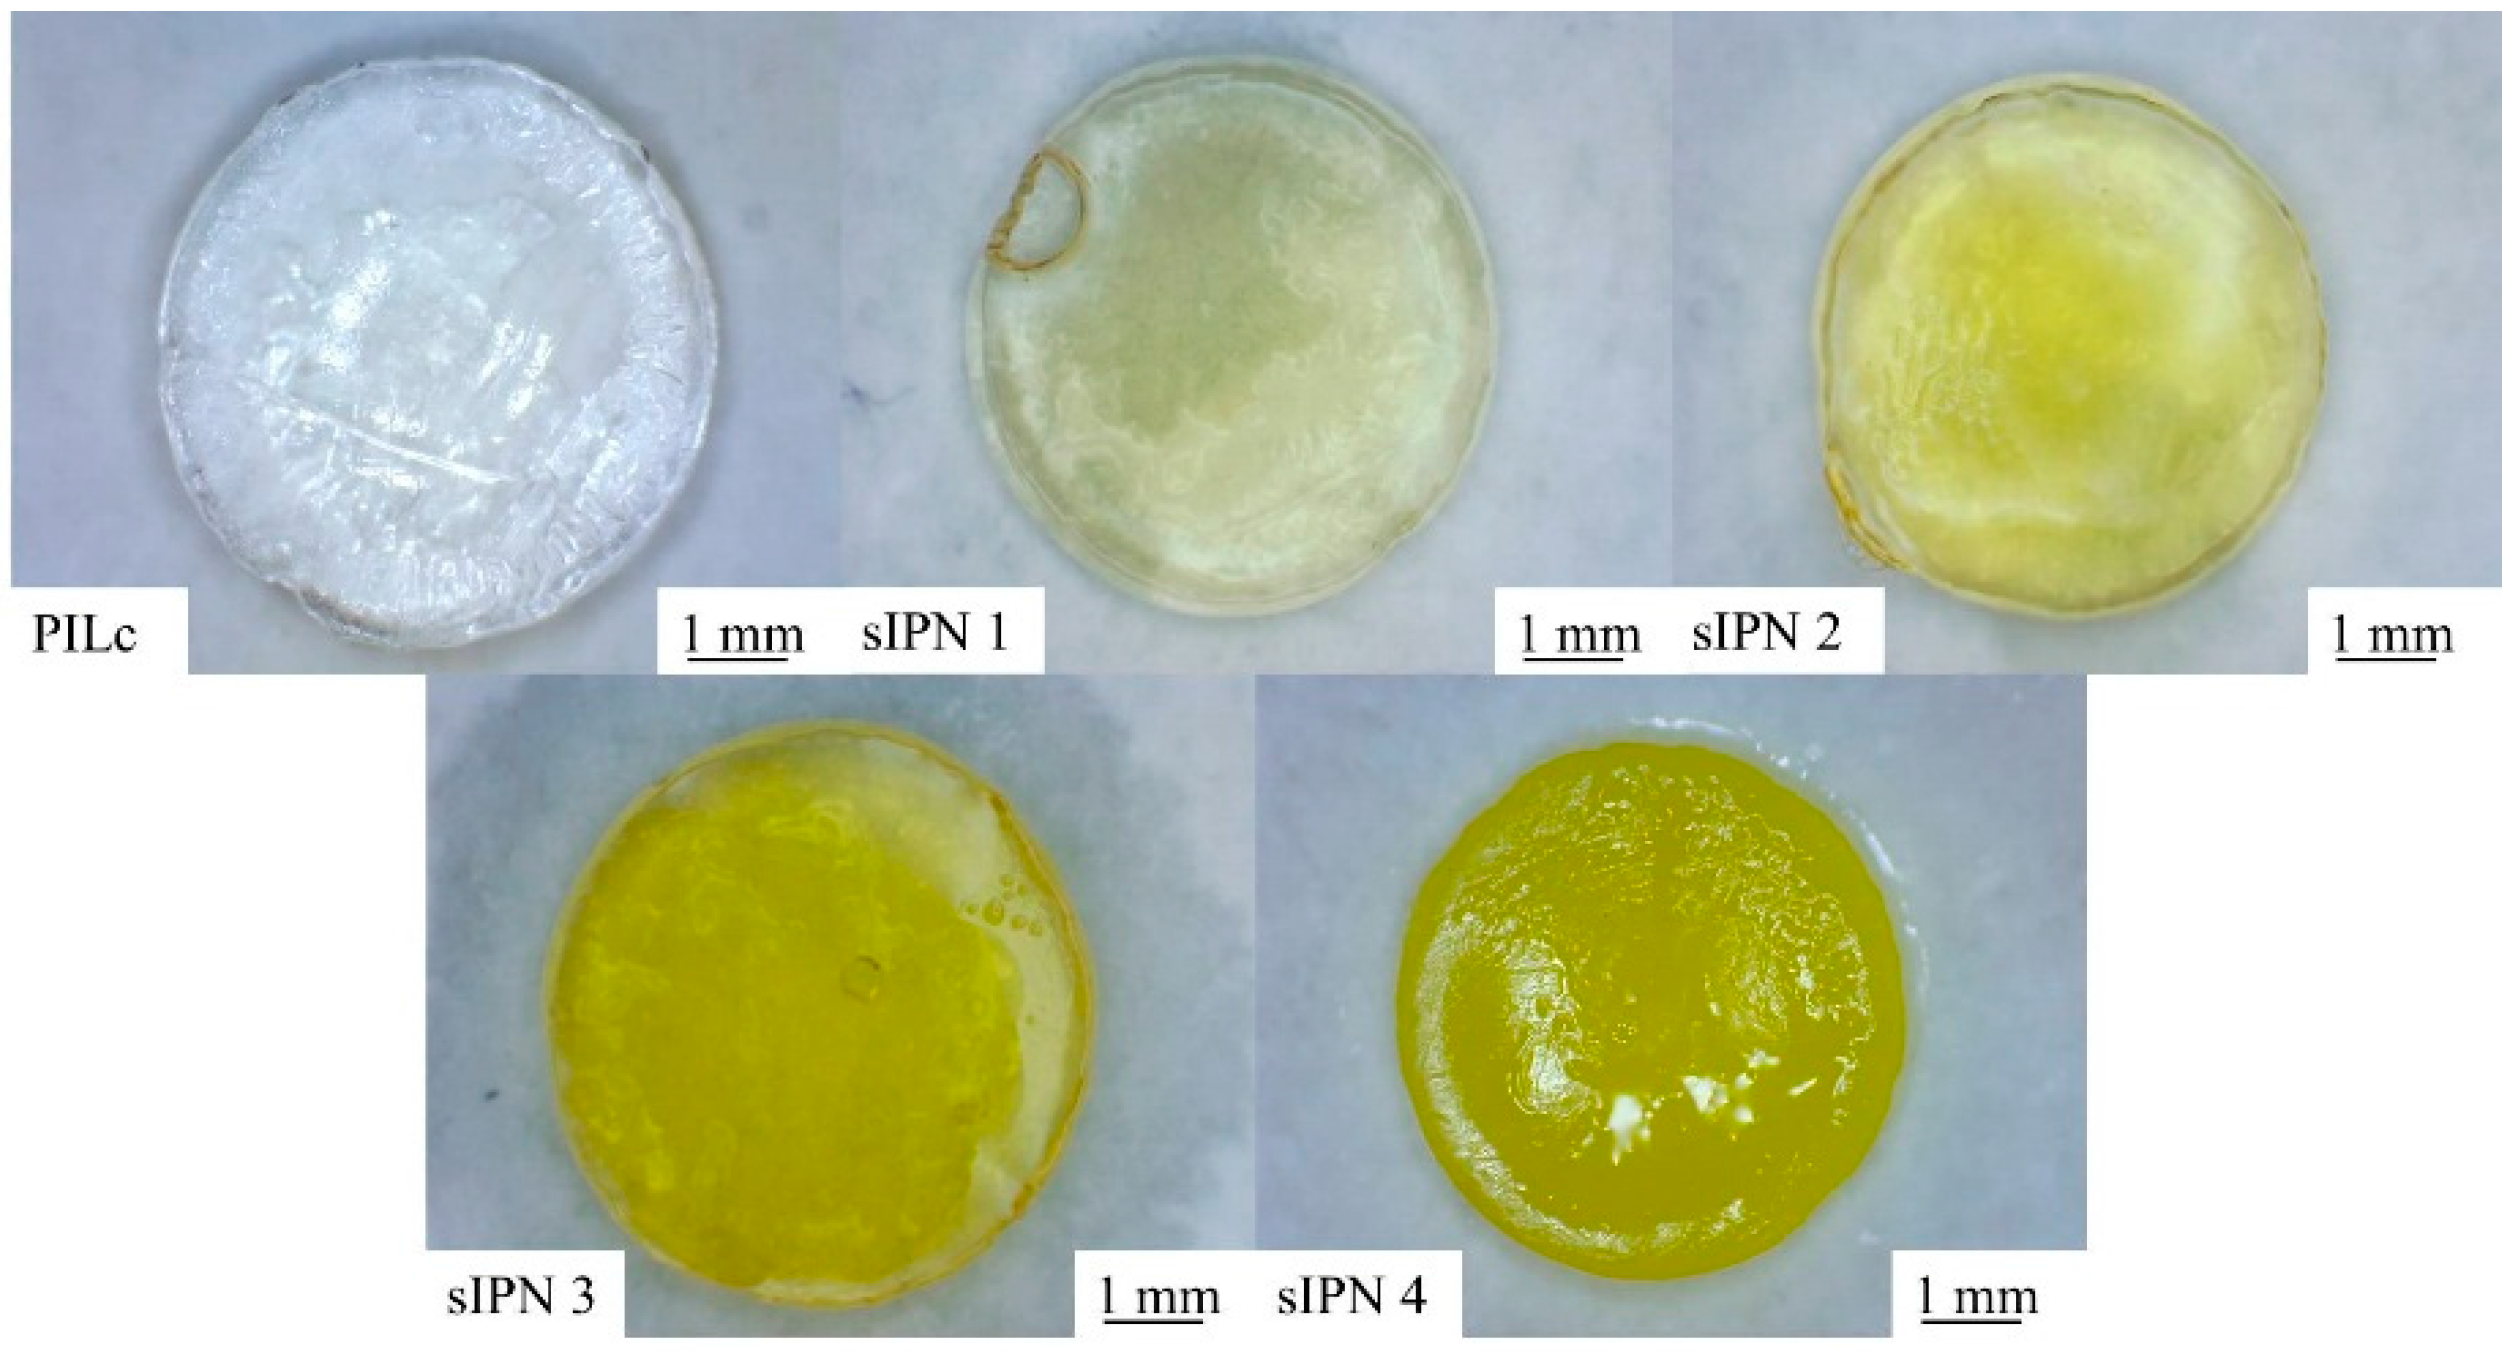
2.4. Synthesis of the Semi-Interpenetrating Network Hydrogels

| PILc | sIPN 1 | sIPN 2 | sIPN 3 | sIPN 4 | |
|---|---|---|---|---|---|
| P4,4,4,6-SPA (g) | 0.1935 | 0.1935 | 0.1935 | 0.1935 | 0.1935 |
| Linear polymer (g) | 0 | 0.0453 | 0.0905 | 0.1308 | 0.1810 |
| P4,4,4,6-SPA:NiPAAm (molar ratio) | 1:0 | 1:1 | 1:2 | 1:3 | 1:4 |
| PPG 800 (g) | 0.0160 | 0.0160 | 0.0160 | 0.0160 | 0.0160 |
| PBPO (g) | 0.0034 | 0.0034 | 0.0034 | 0.0034 | 0.0034 |
| ACN:H2O (g) | 0.1935 | 0.1935 | 0.1935 | 0.1935 | 0.1935 |

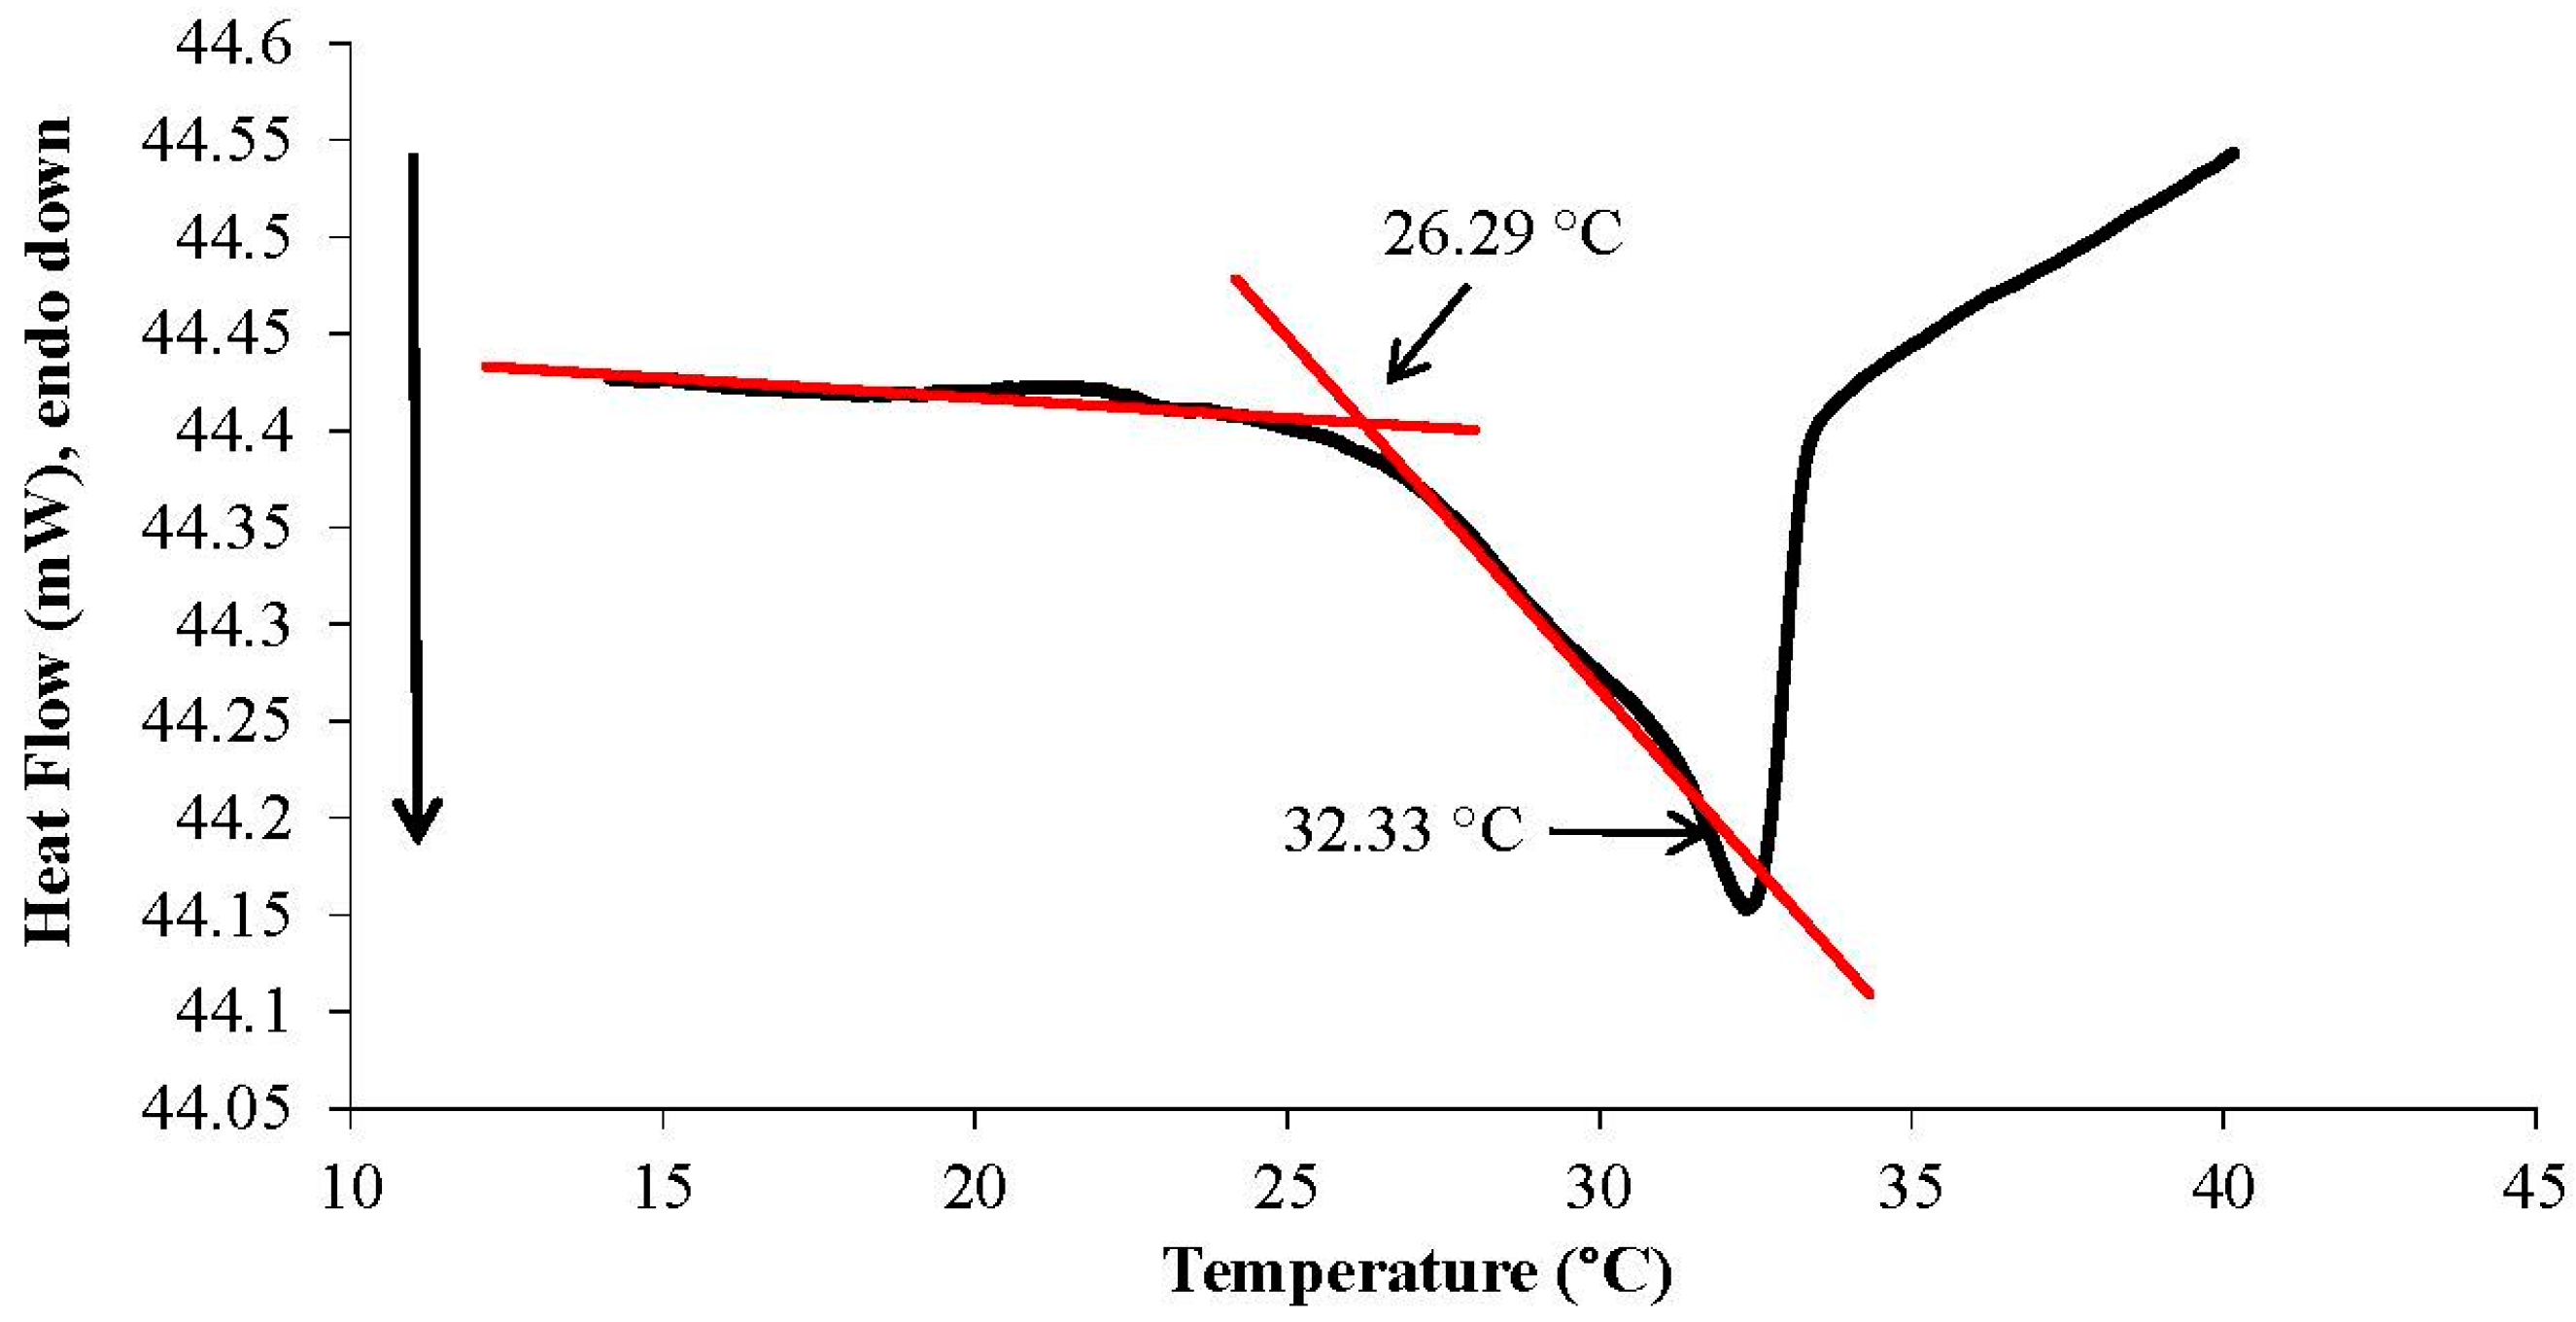
2.5. Thermal Behaviour of Linear p(NiPAAm-SPA-AA) Copolymer
2.6. White-Light Curing Studies of the sIPN Hydrogels Using Rheometry
2.7. Measurement of Stimuli-Induced Shrinking
3. Results and Discussion
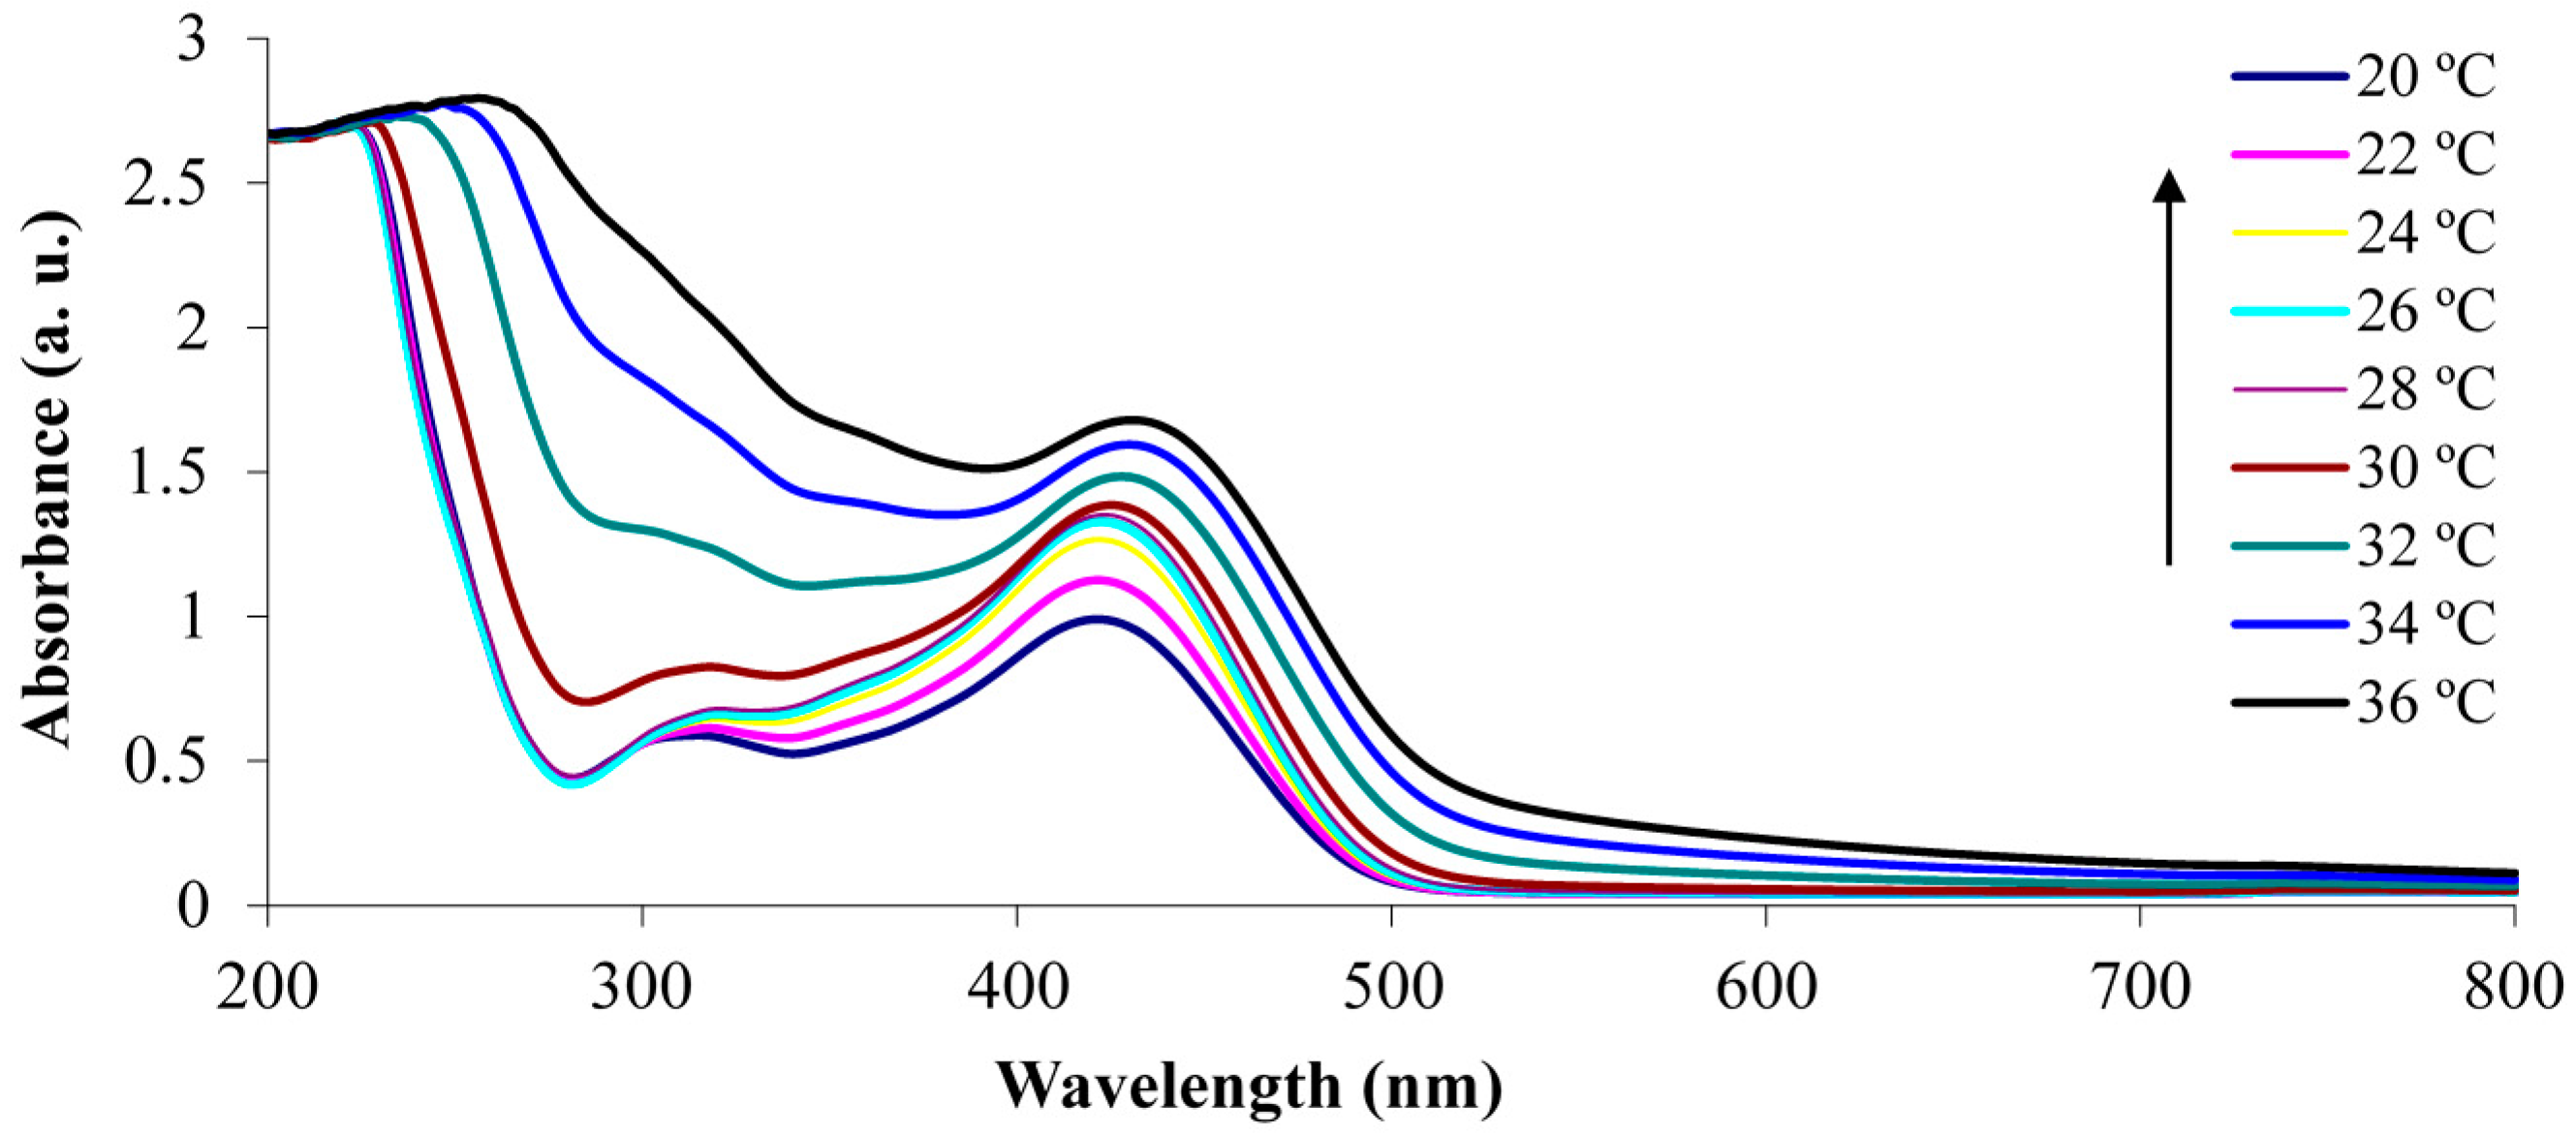
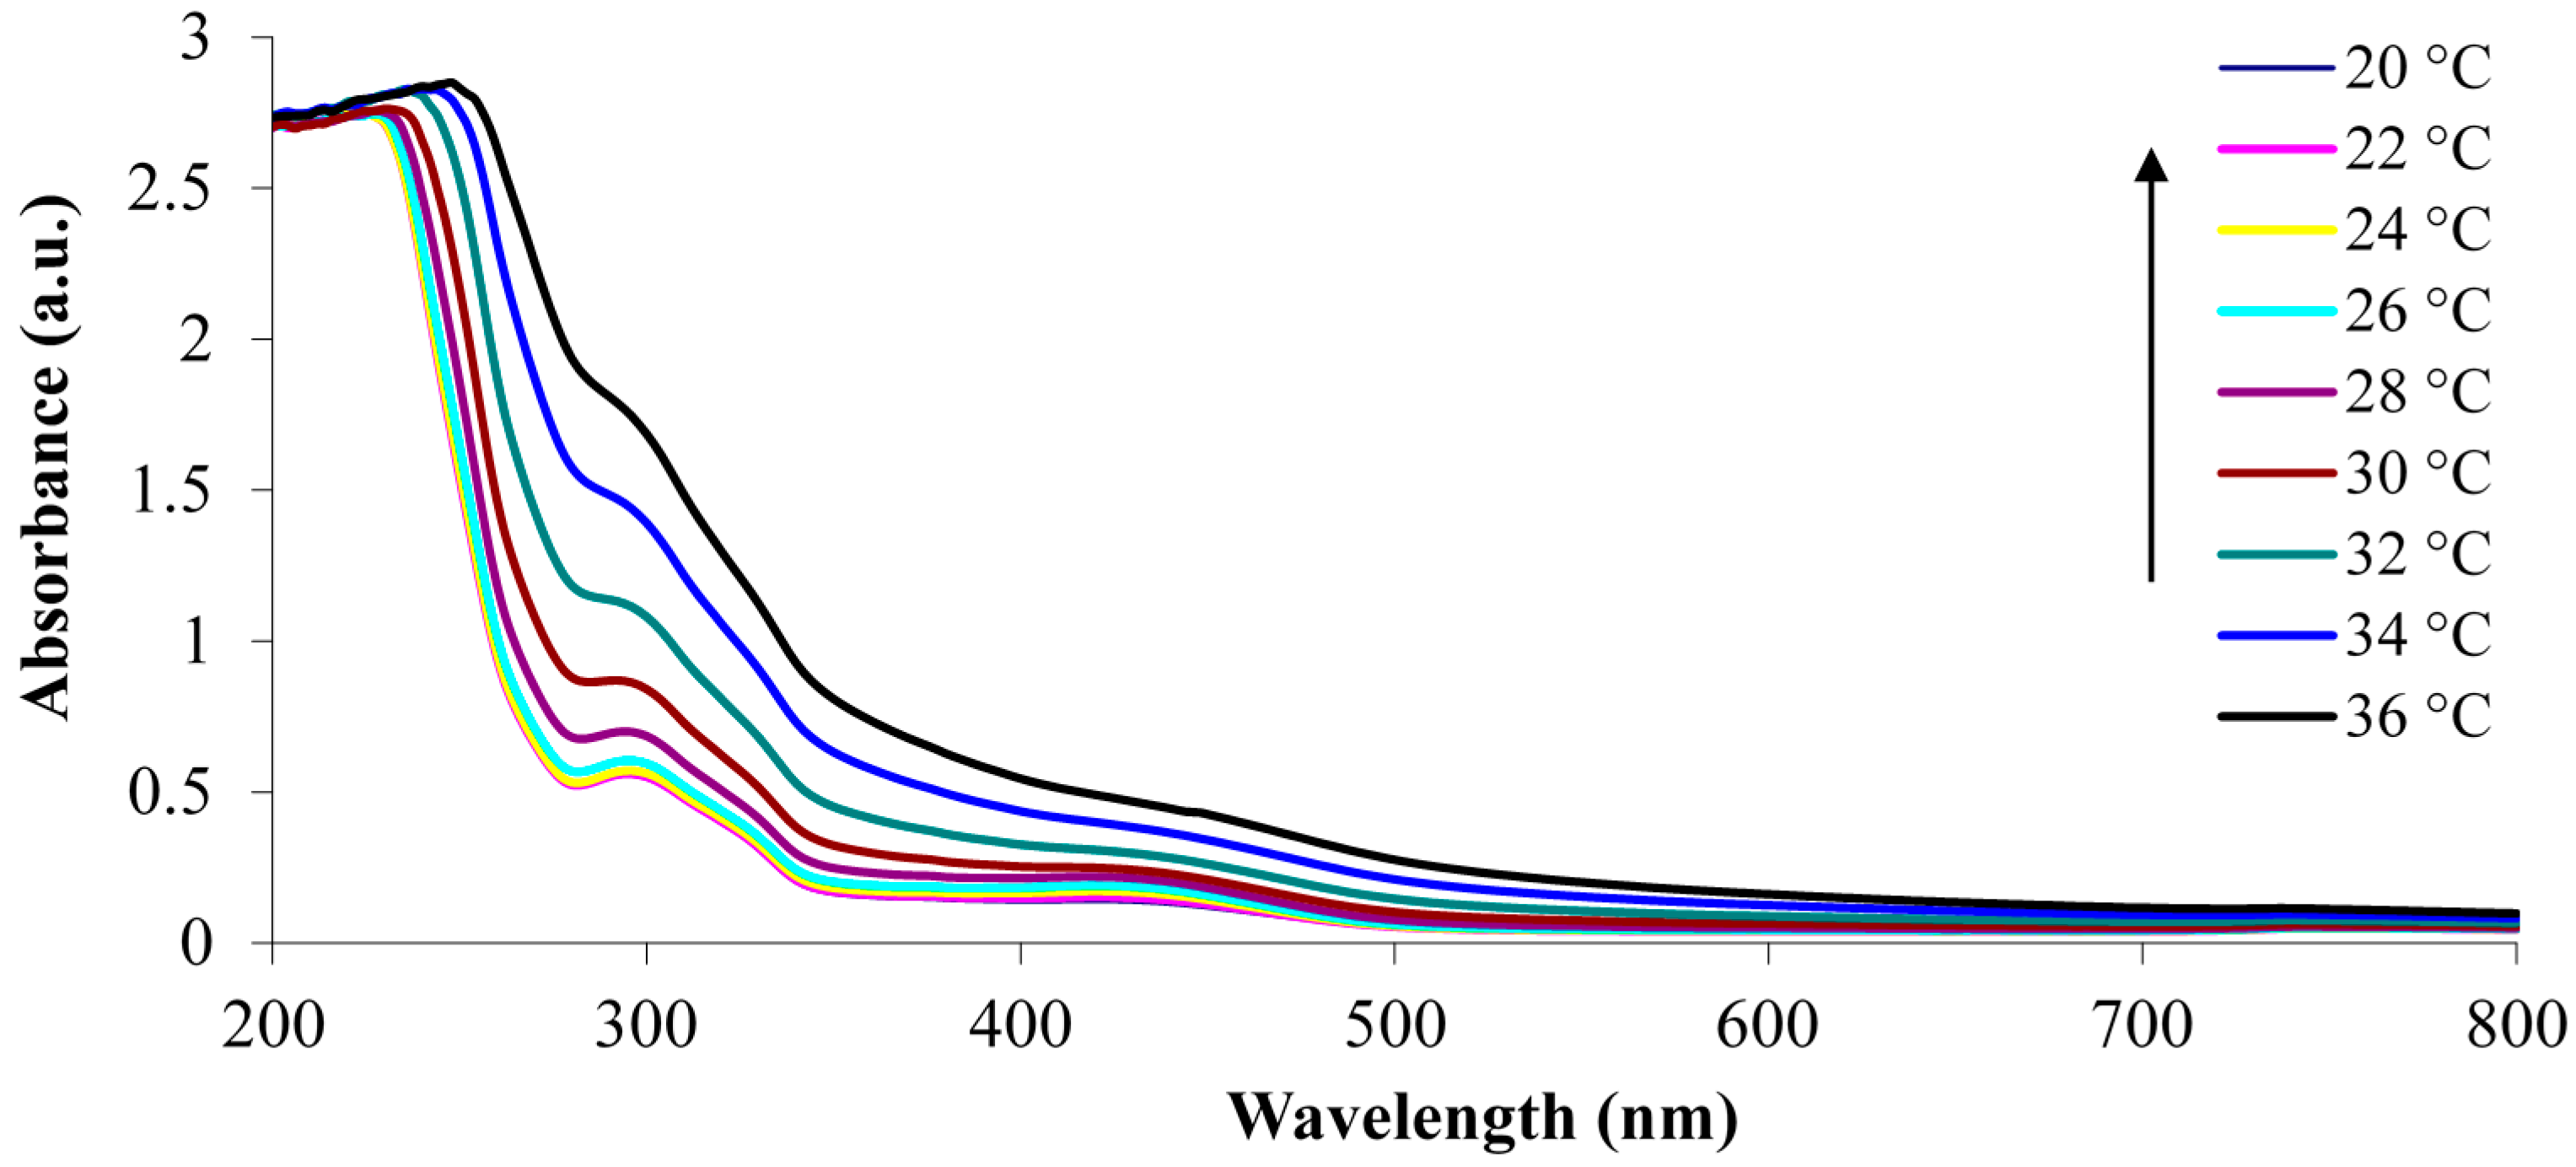
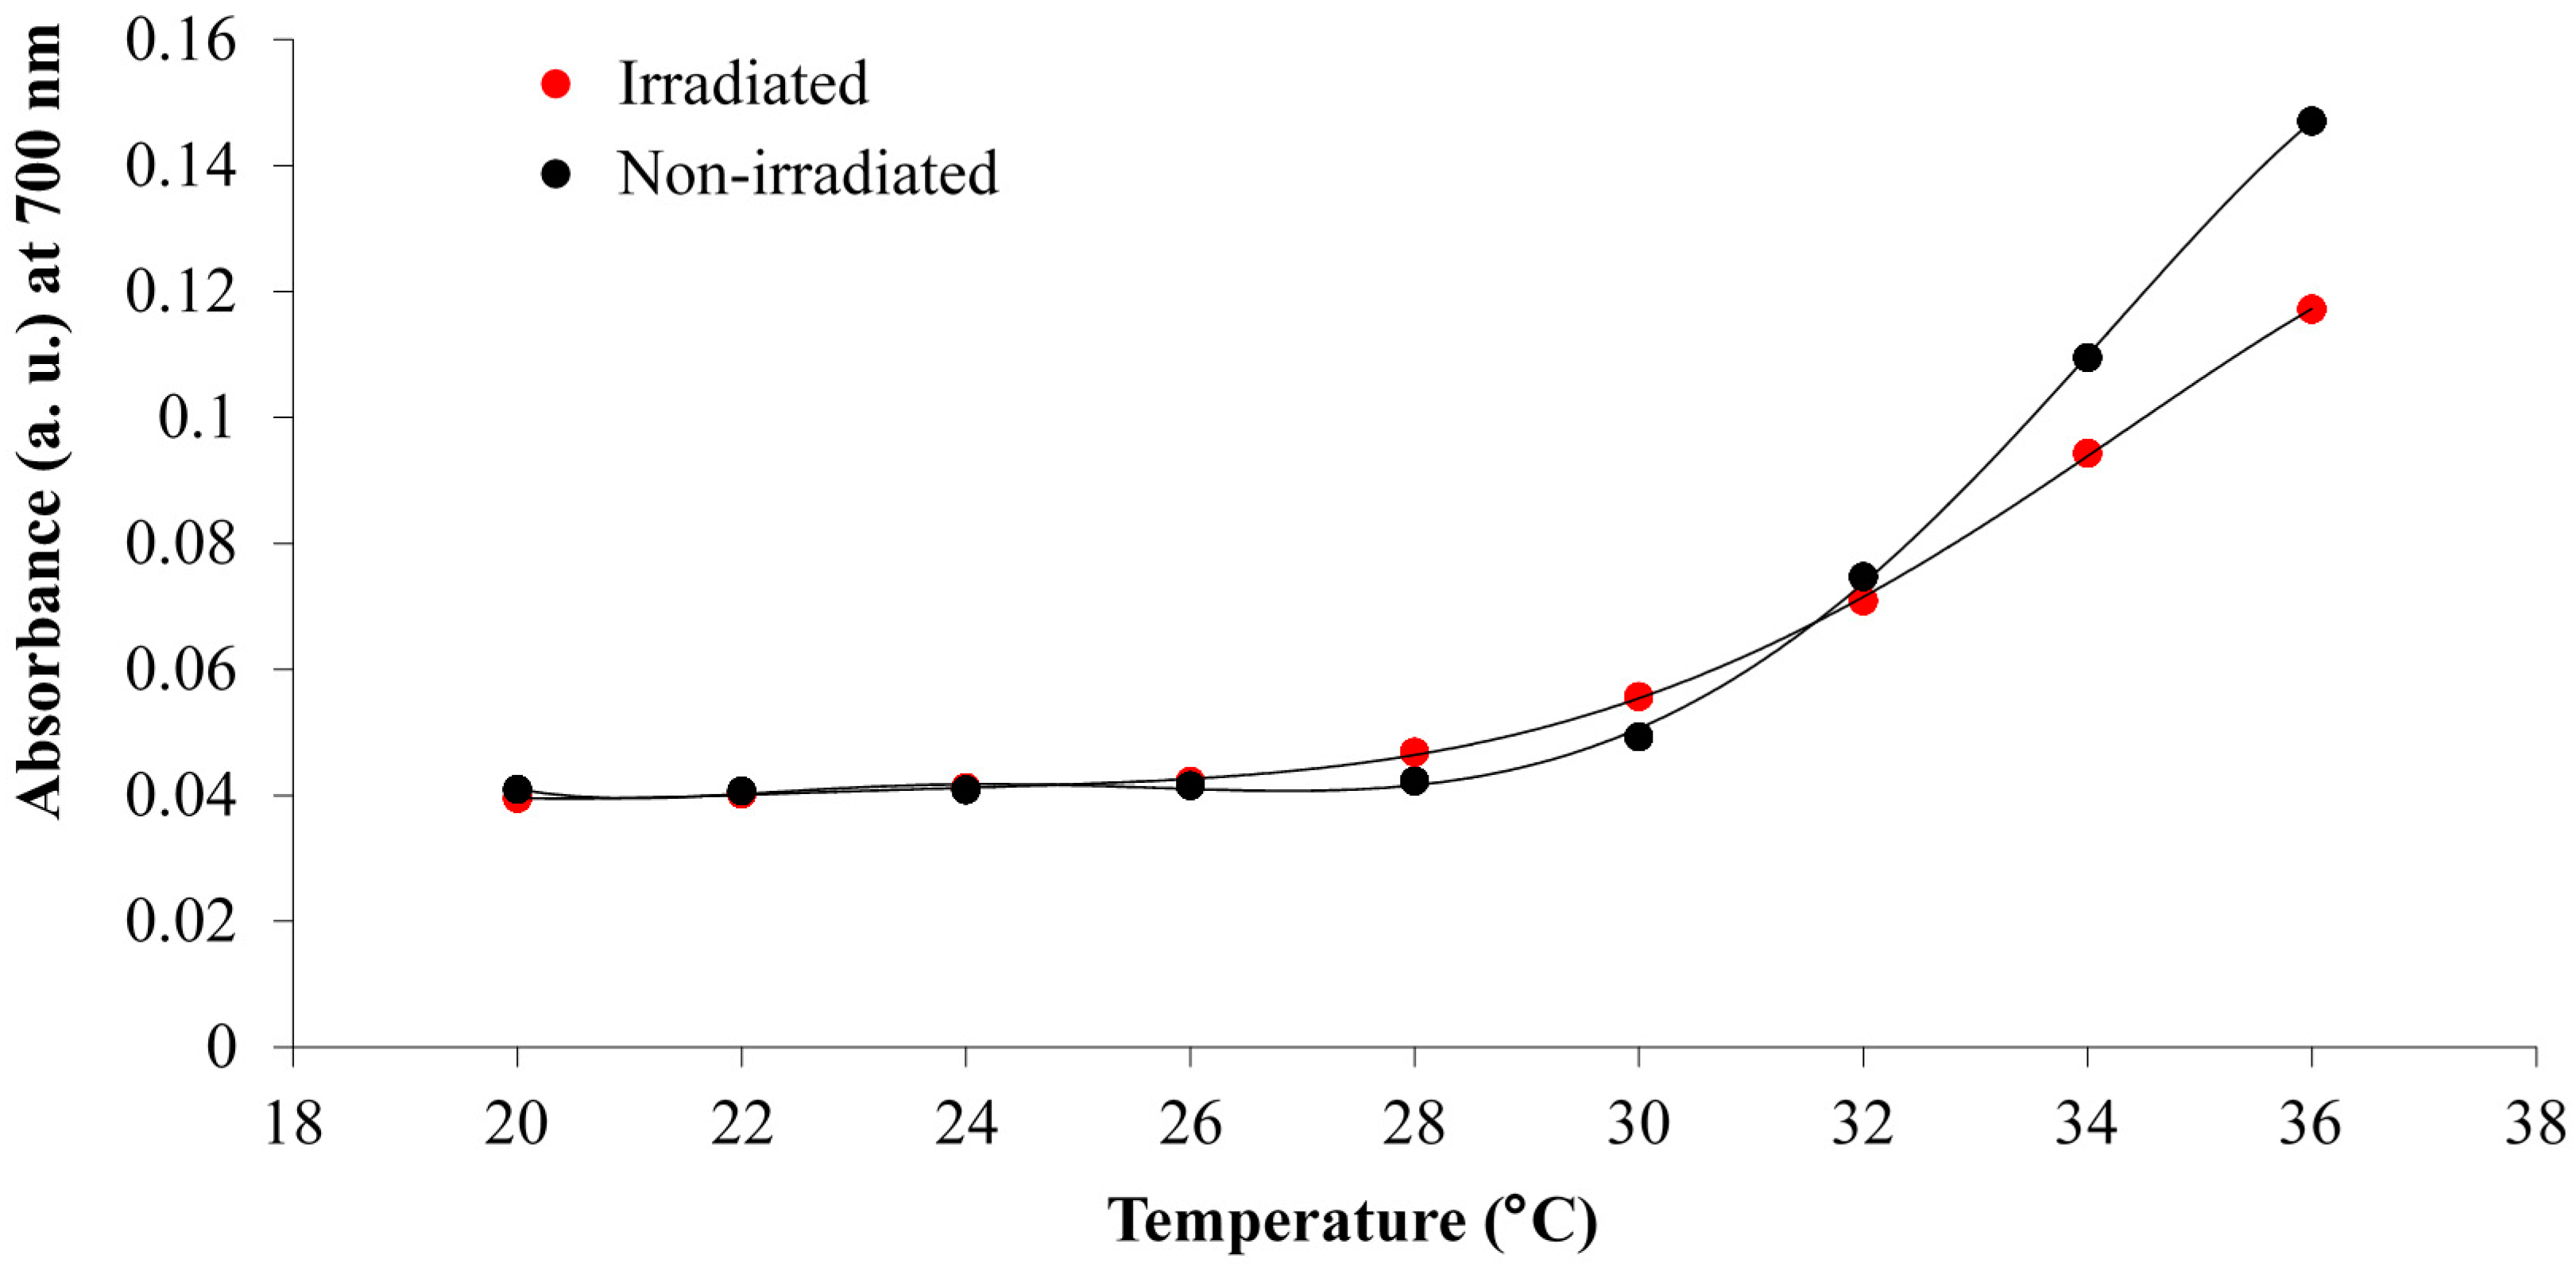
3.1. White Light and Temperature Response of the Linear p(NiPAAm-BSP-AA) Copolymer Solutions
3.2. Photo-Induced Curing Studies and Mechanical Properties of the Hydrogels
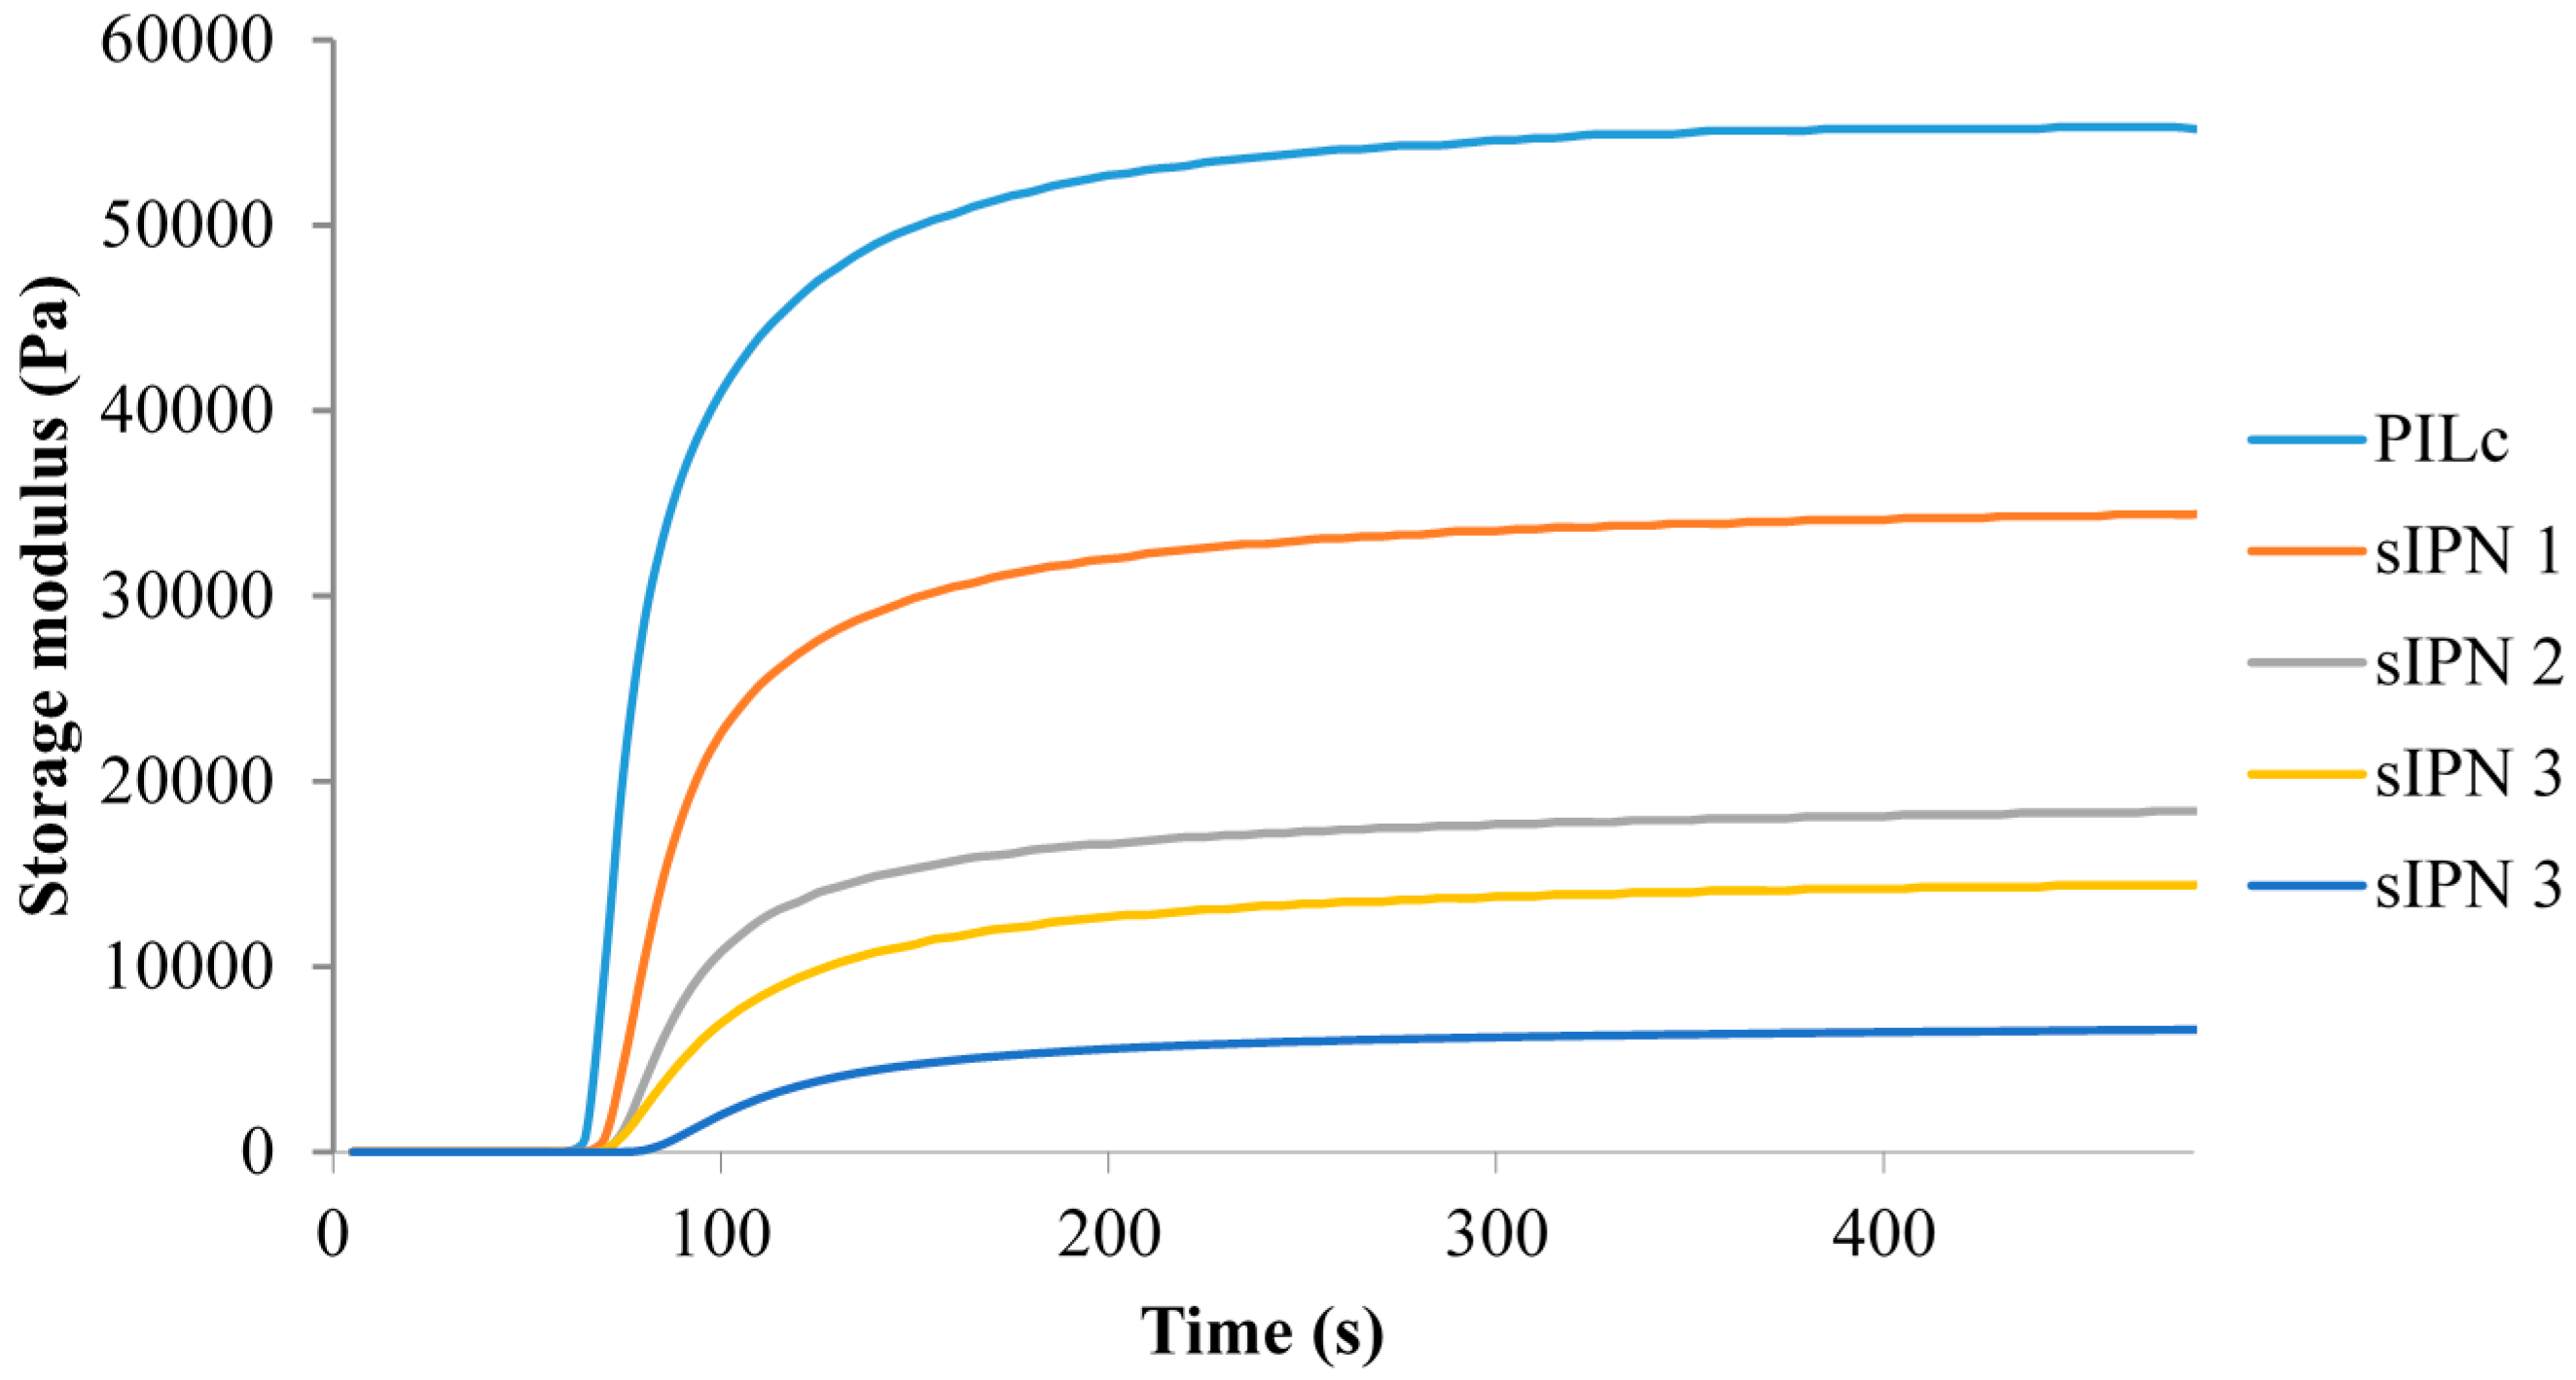
| Hydrogel | NiPAAm (molar %–to PSPA) | Loss Modulus (Pa) | Storage Modulus (Pa) | Tanδ |
|---|---|---|---|---|
| PILc | 0 | 76 | 51,800 | 0.0015 |
| sIPN 1 | 100 | 85.7 | 31,400 | 0.0027 |
| sIPN 2 | 200 | 650 | 16,300 | 0.0400 |
| sIPN 3 | 300 | 617 | 12,200 | 0.0506 |
| sIPN 4 | 400 | 832 | 5310 | 0.1567 |
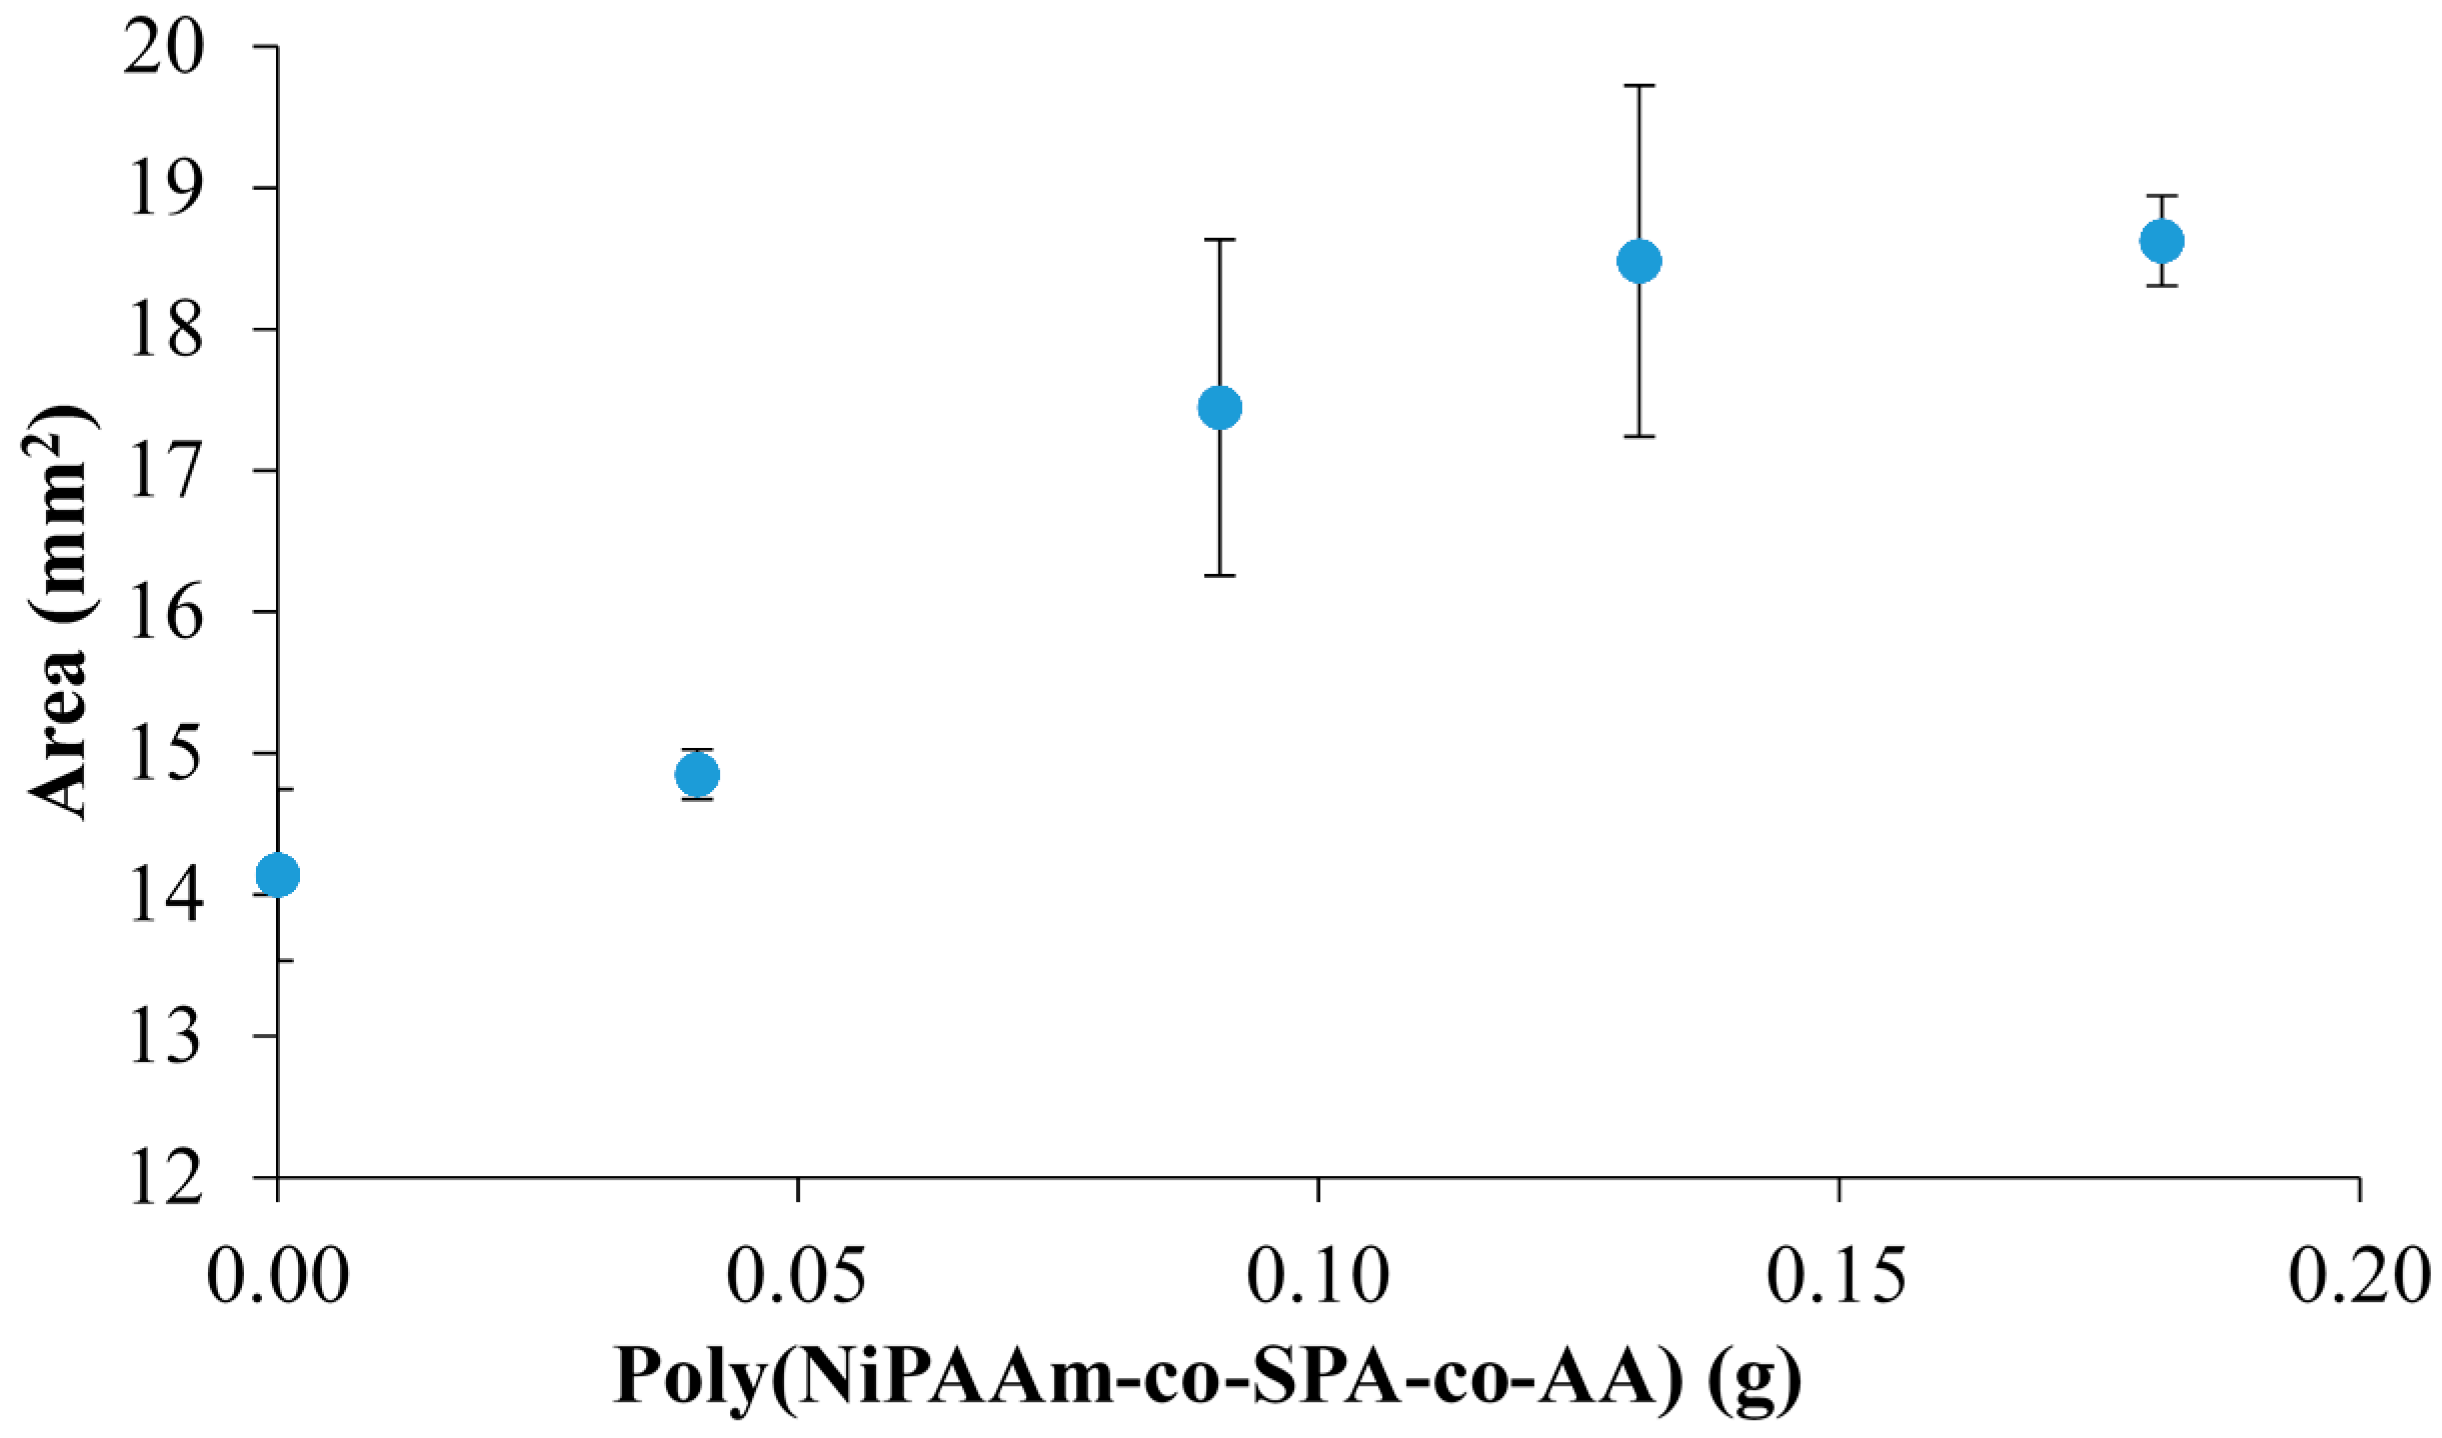
| Hydrogel | NiPAAm (molar %–to PSPA) | Hydrated Area (mm2) | Standard Deviation (n = 3) | Hydrated Area Increase (%) | RSD (%) (n = 3) |
|---|---|---|---|---|---|
| PILc | 0 | 14.140 | 0.606 | - | 4.286 |
| sIPN 1 | 100 | 14.851 | 0.177 | 5.030 | 1.193 |
| sIPN 2 | 200 | 17.445 | 1.191 | 23.375 | 6.825 |
| sIPN 3 | 300 | 18.482 | 1.242 | 30.708 | 6.717 |
| sIPN 4 | 400 | 18.625 | 0.317 | 31.715 | 1.703 |
3.3. White Light Induced Shrinking

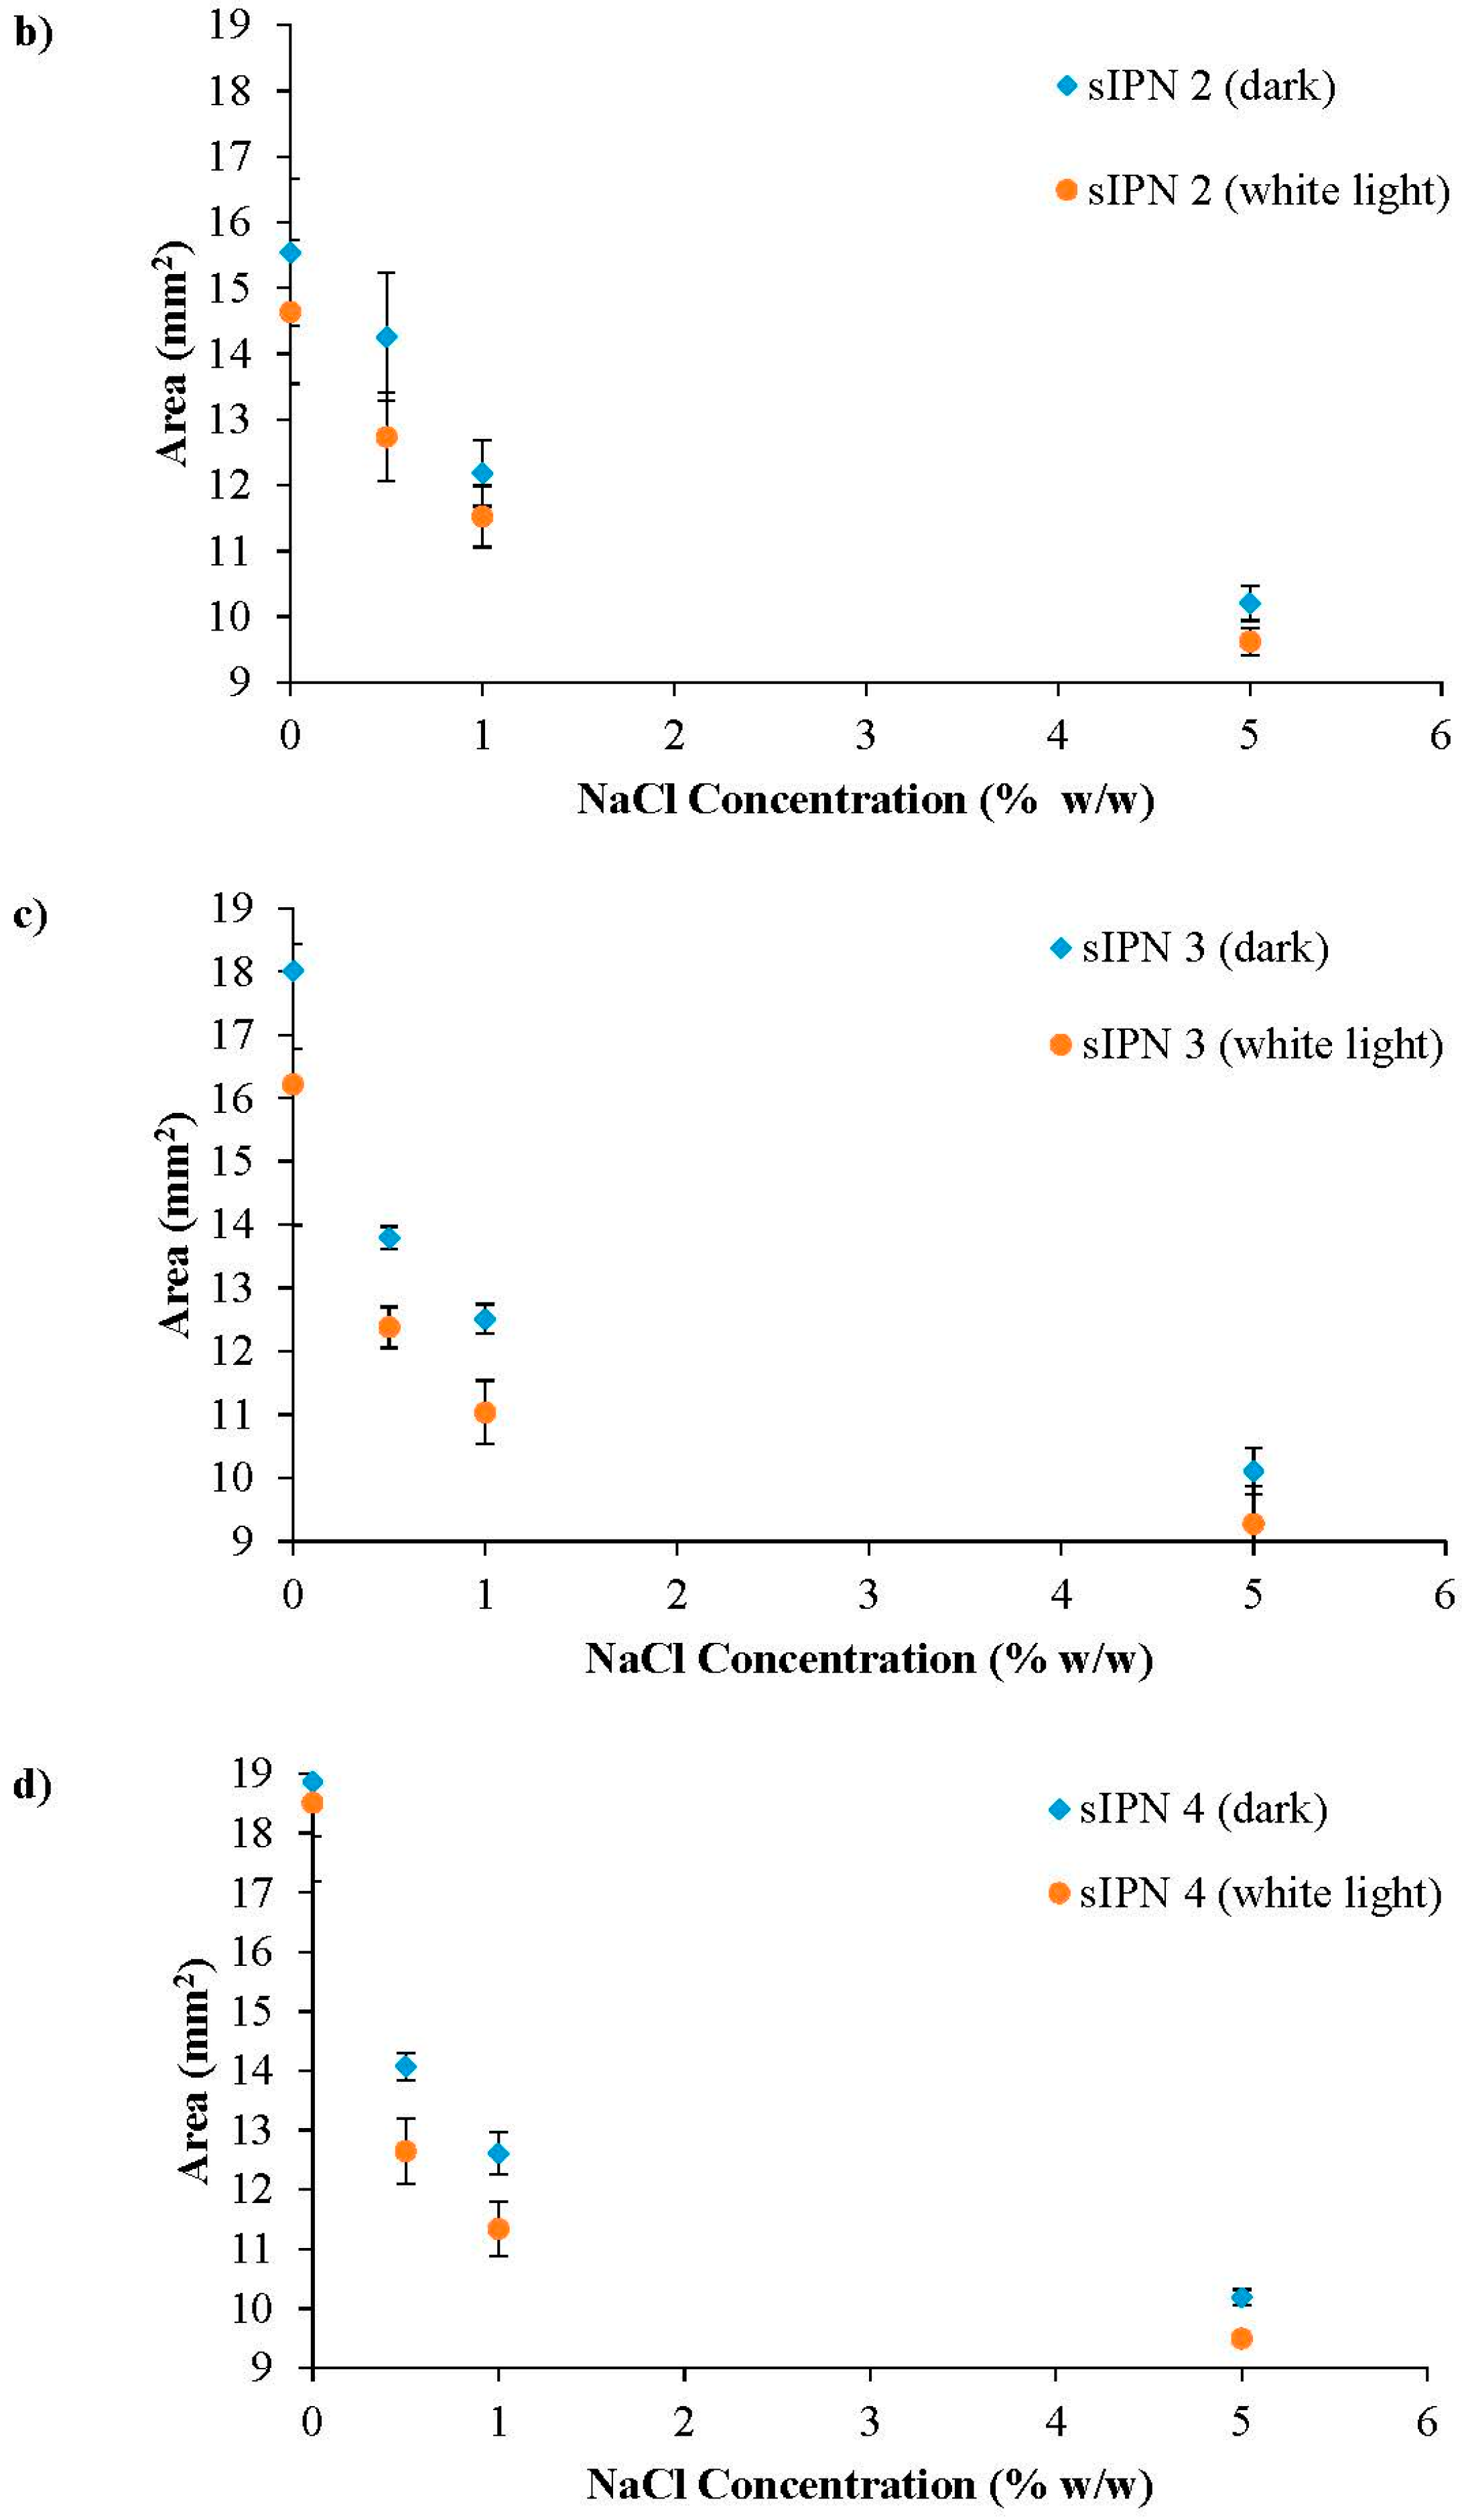
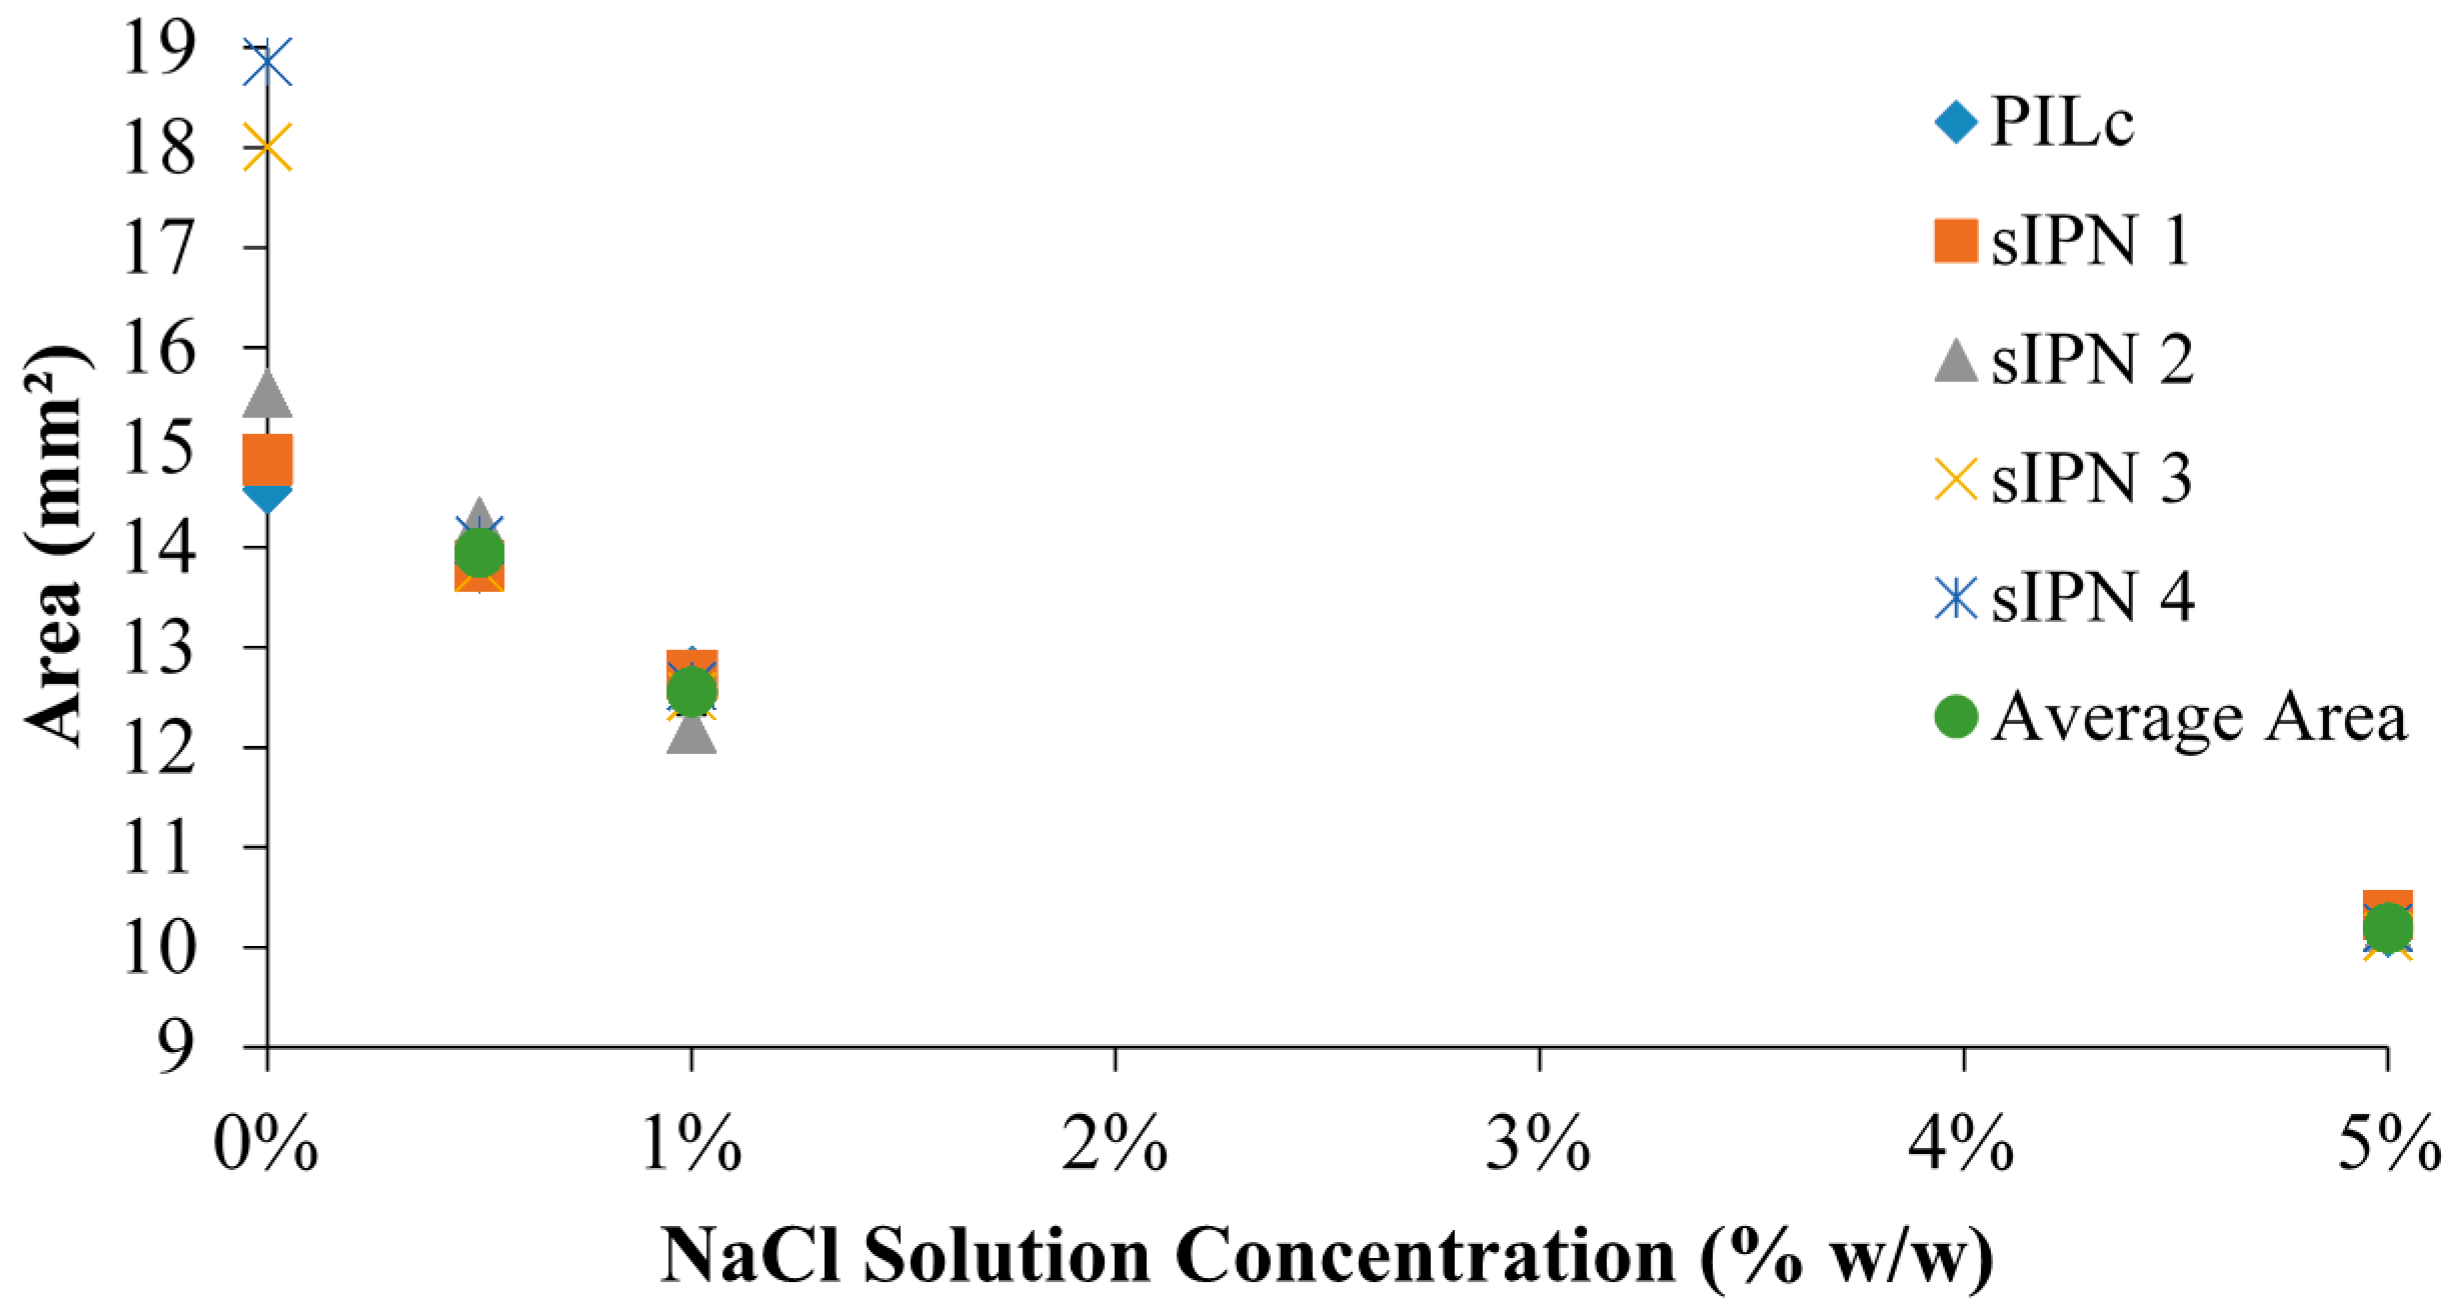
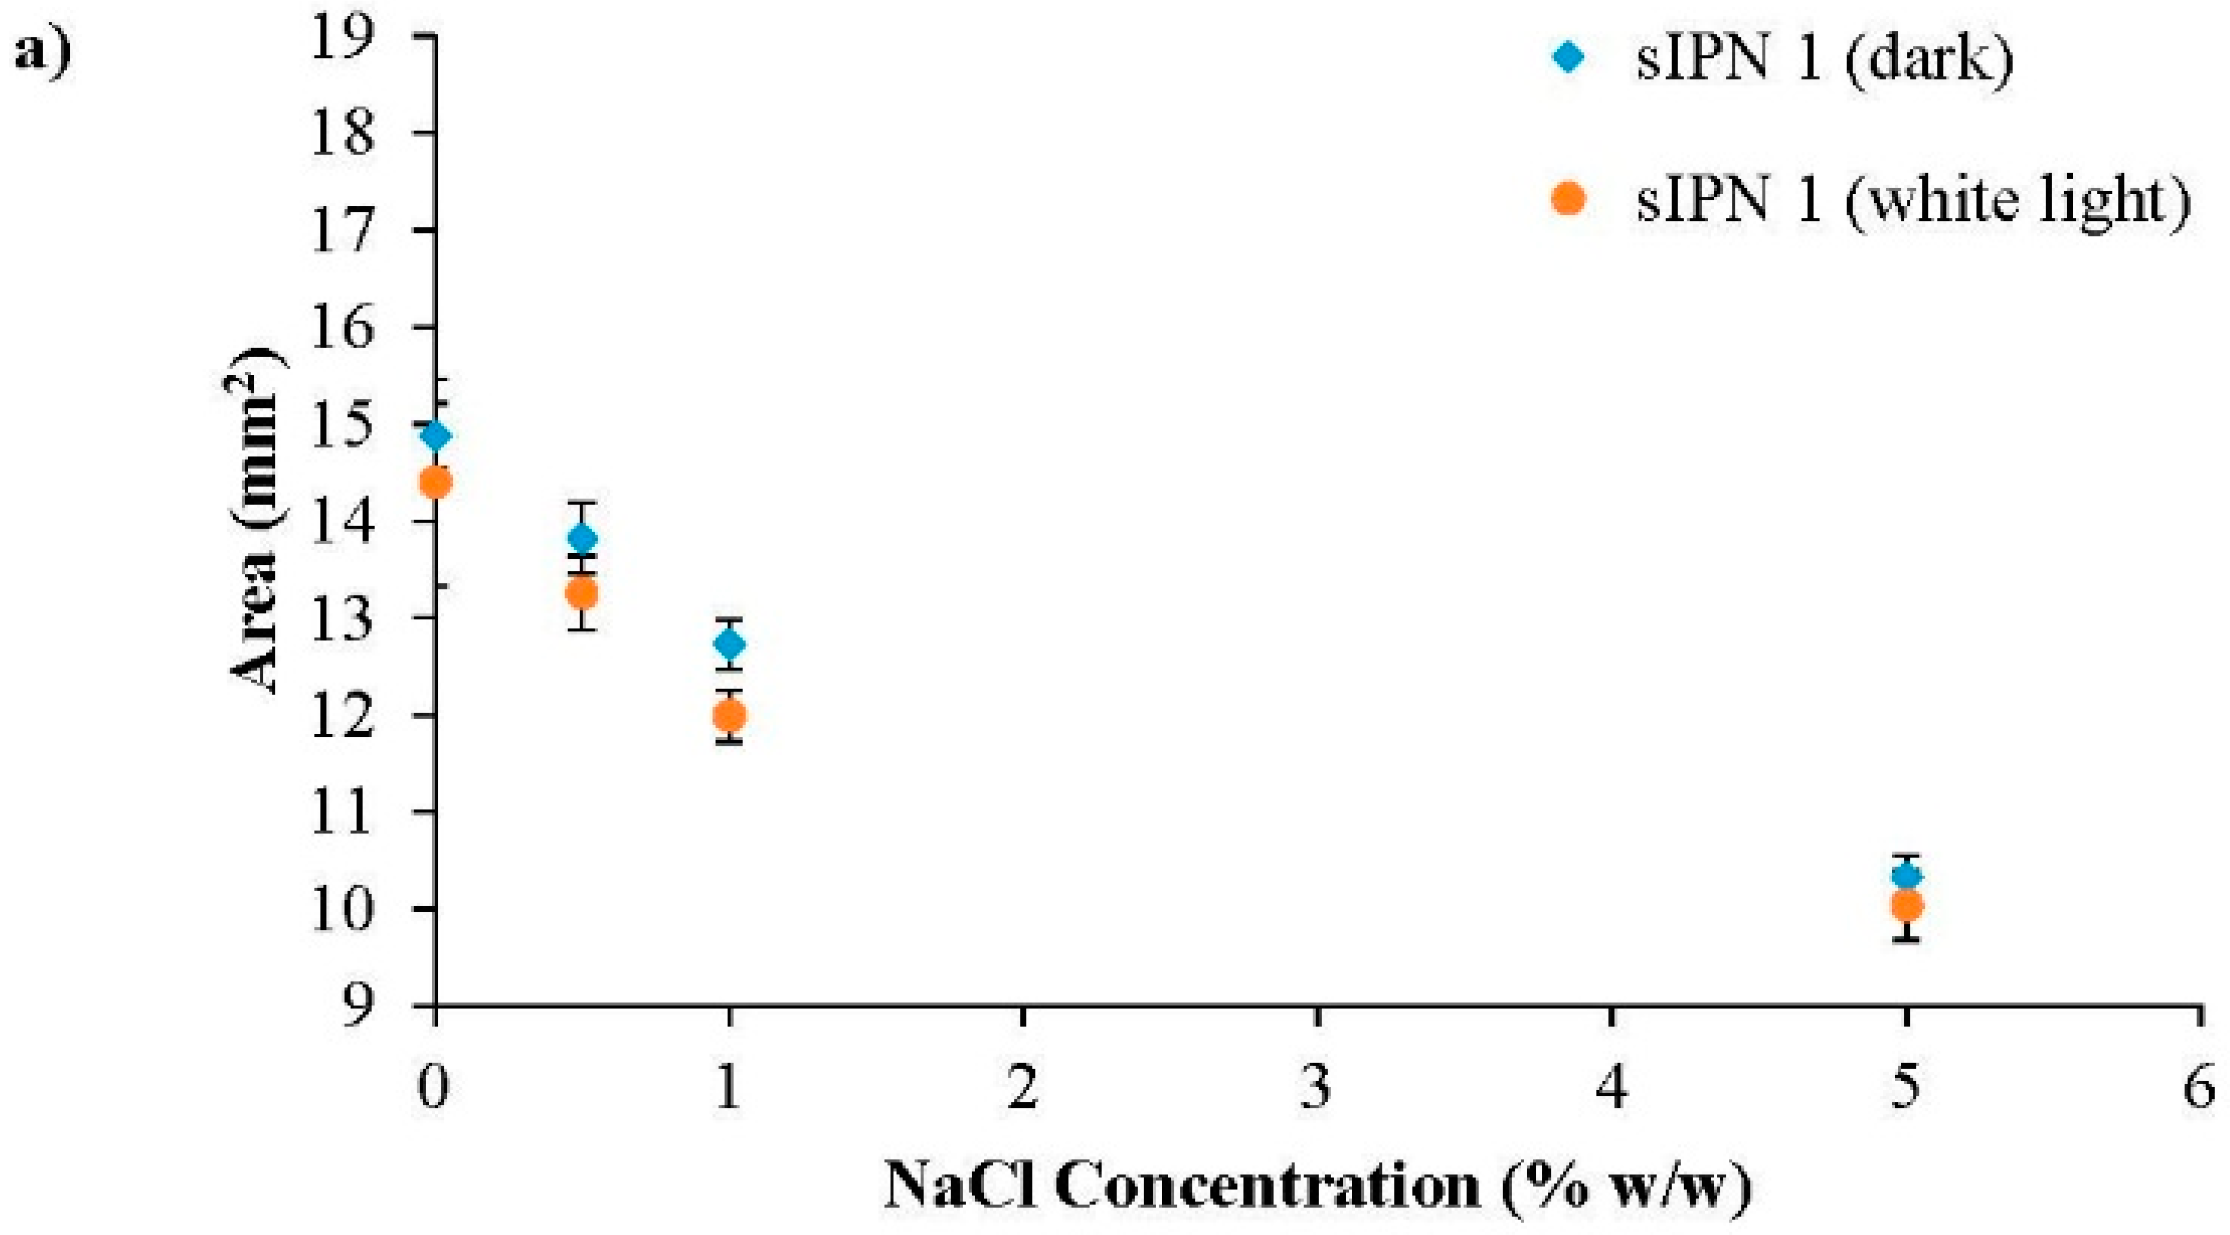
3.4. Ionic Radius Dependent Shrinking
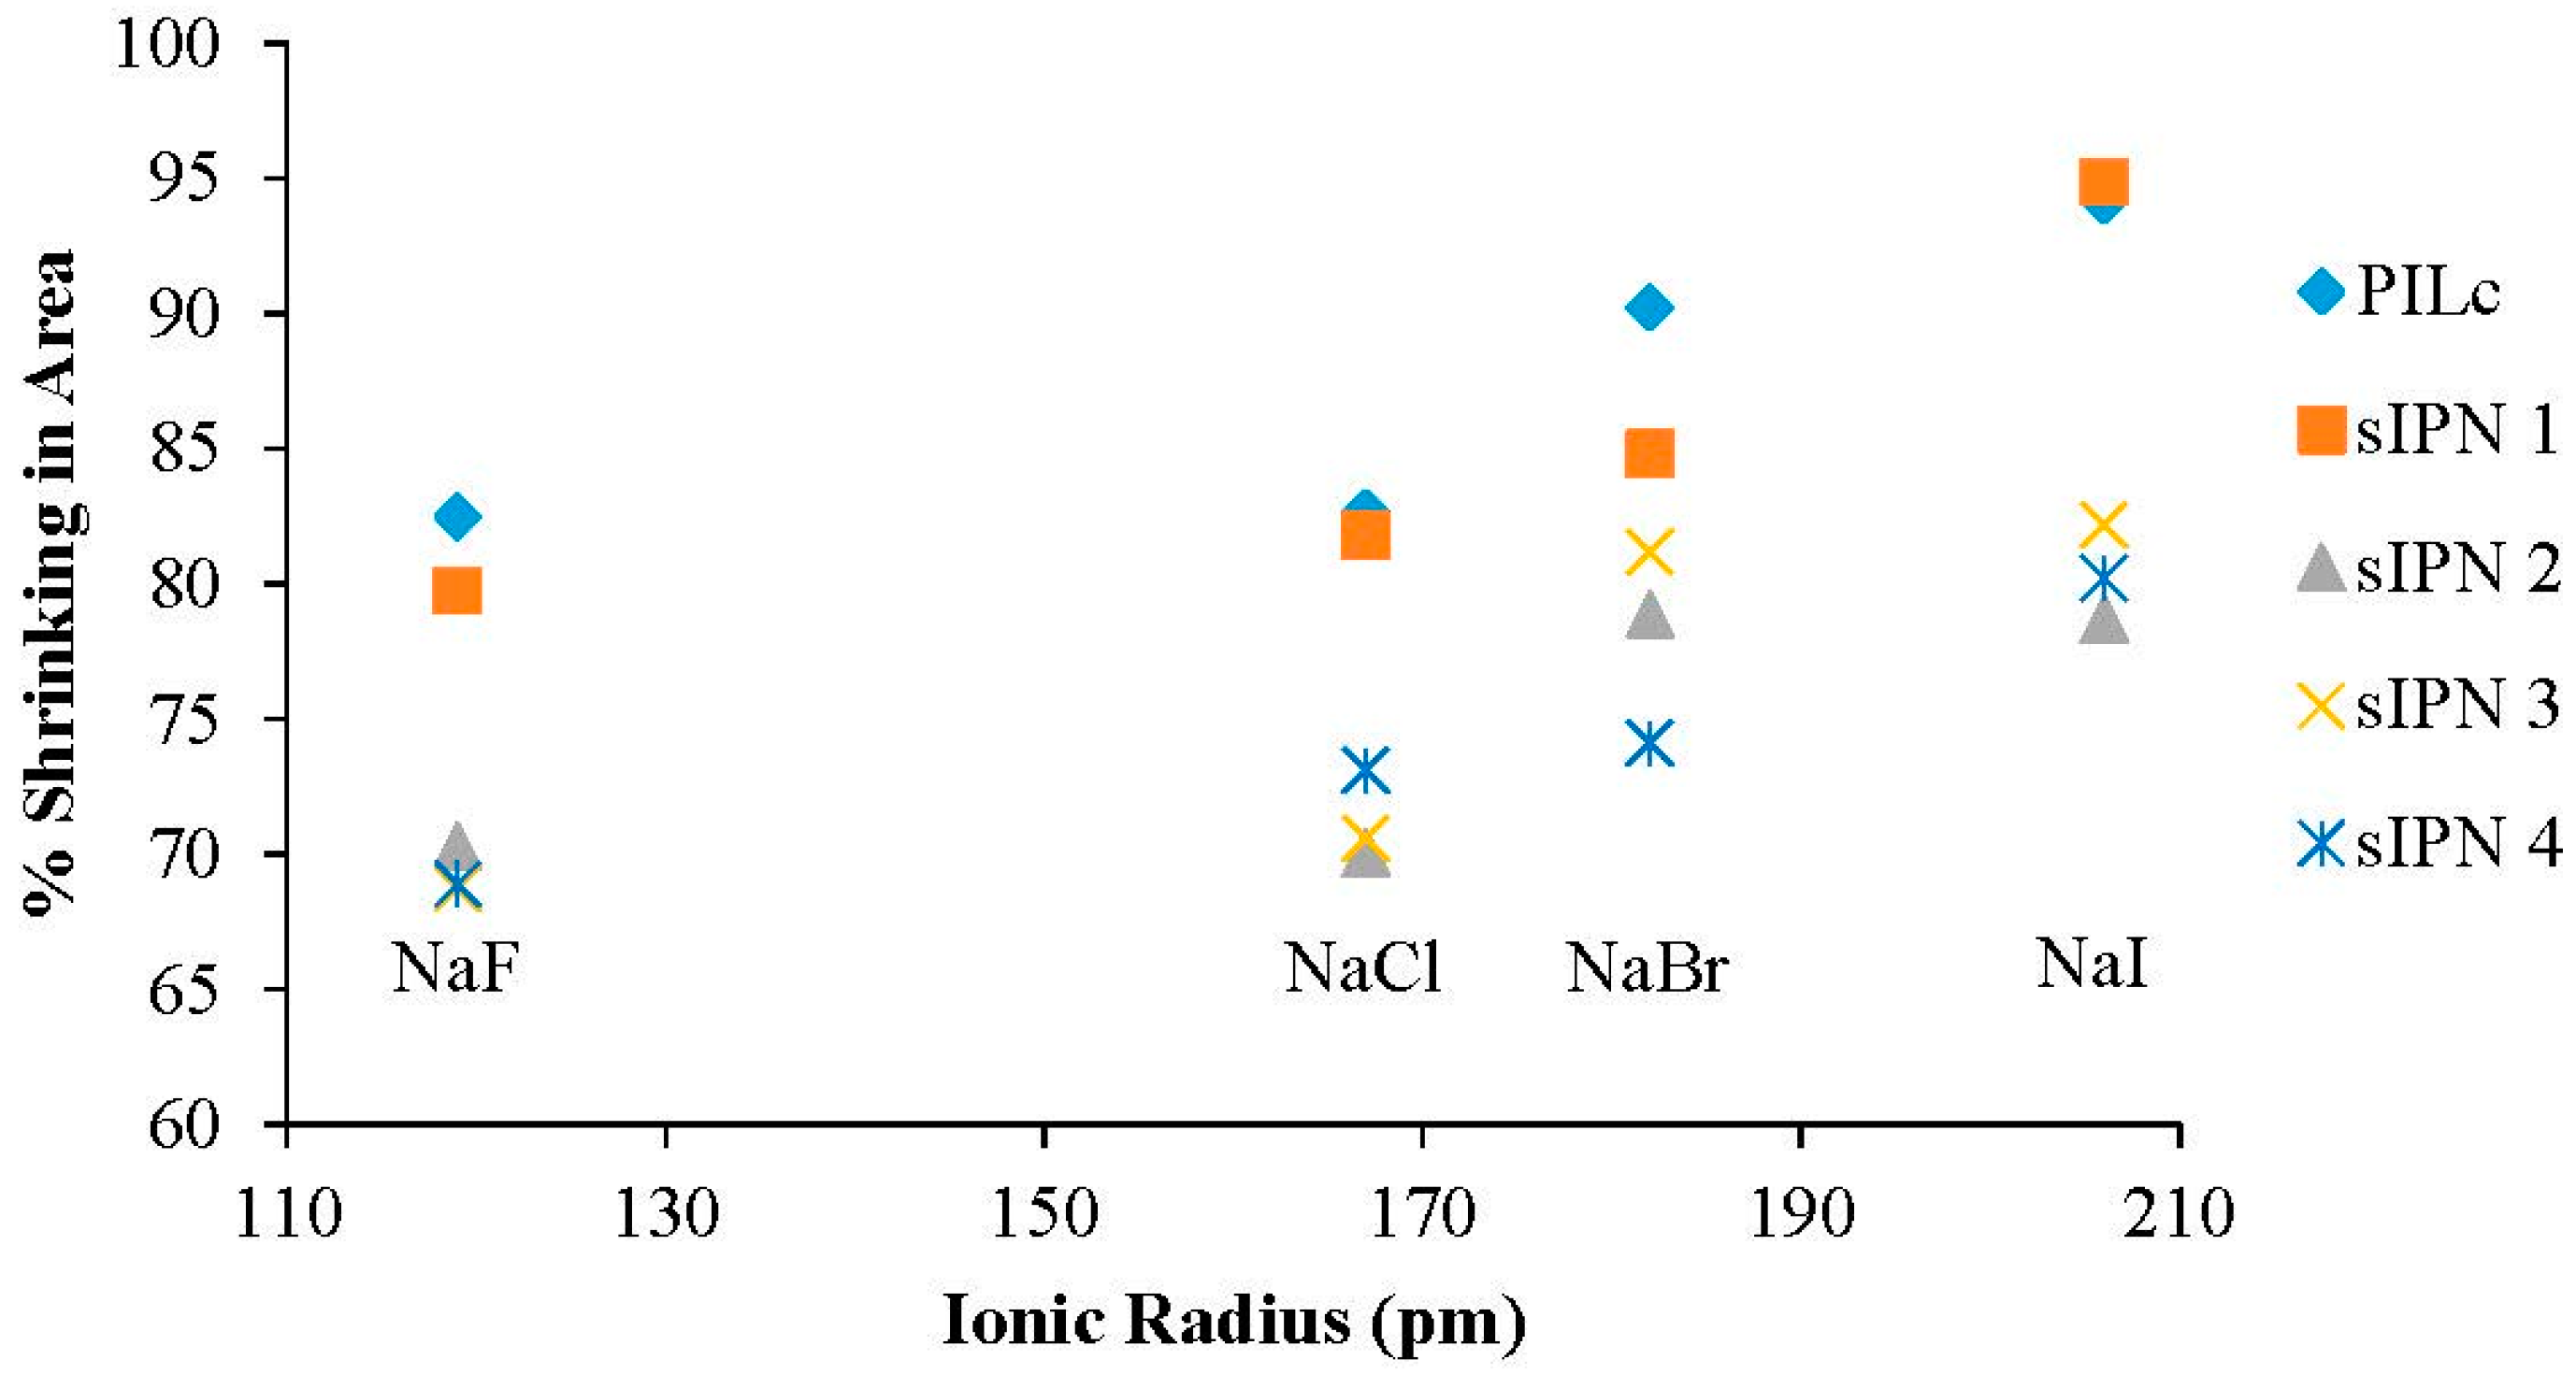
| A− Ionic Radius (pm) | PILc (%) | sIPN 1 (%) | sIPN 2 (%) | sIPN 3 (%) | sIPN 4 (%) | |
|---|---|---|---|---|---|---|
| NaF | 119 | 82.491 | 79.760 | 70.316 | 68.742 | 68.912 |
| NaCl | 167 | 82.621 | 81.791 | 70.058 | 70.582 | 73.098 |
| NaBr | 182 | 90.246 | 84.833 | 78.894 | 81.213 | 74.110 |
| NaI | 206 | 94.196 | 94.898 | 78.703 | 82.195 | 80.228 |
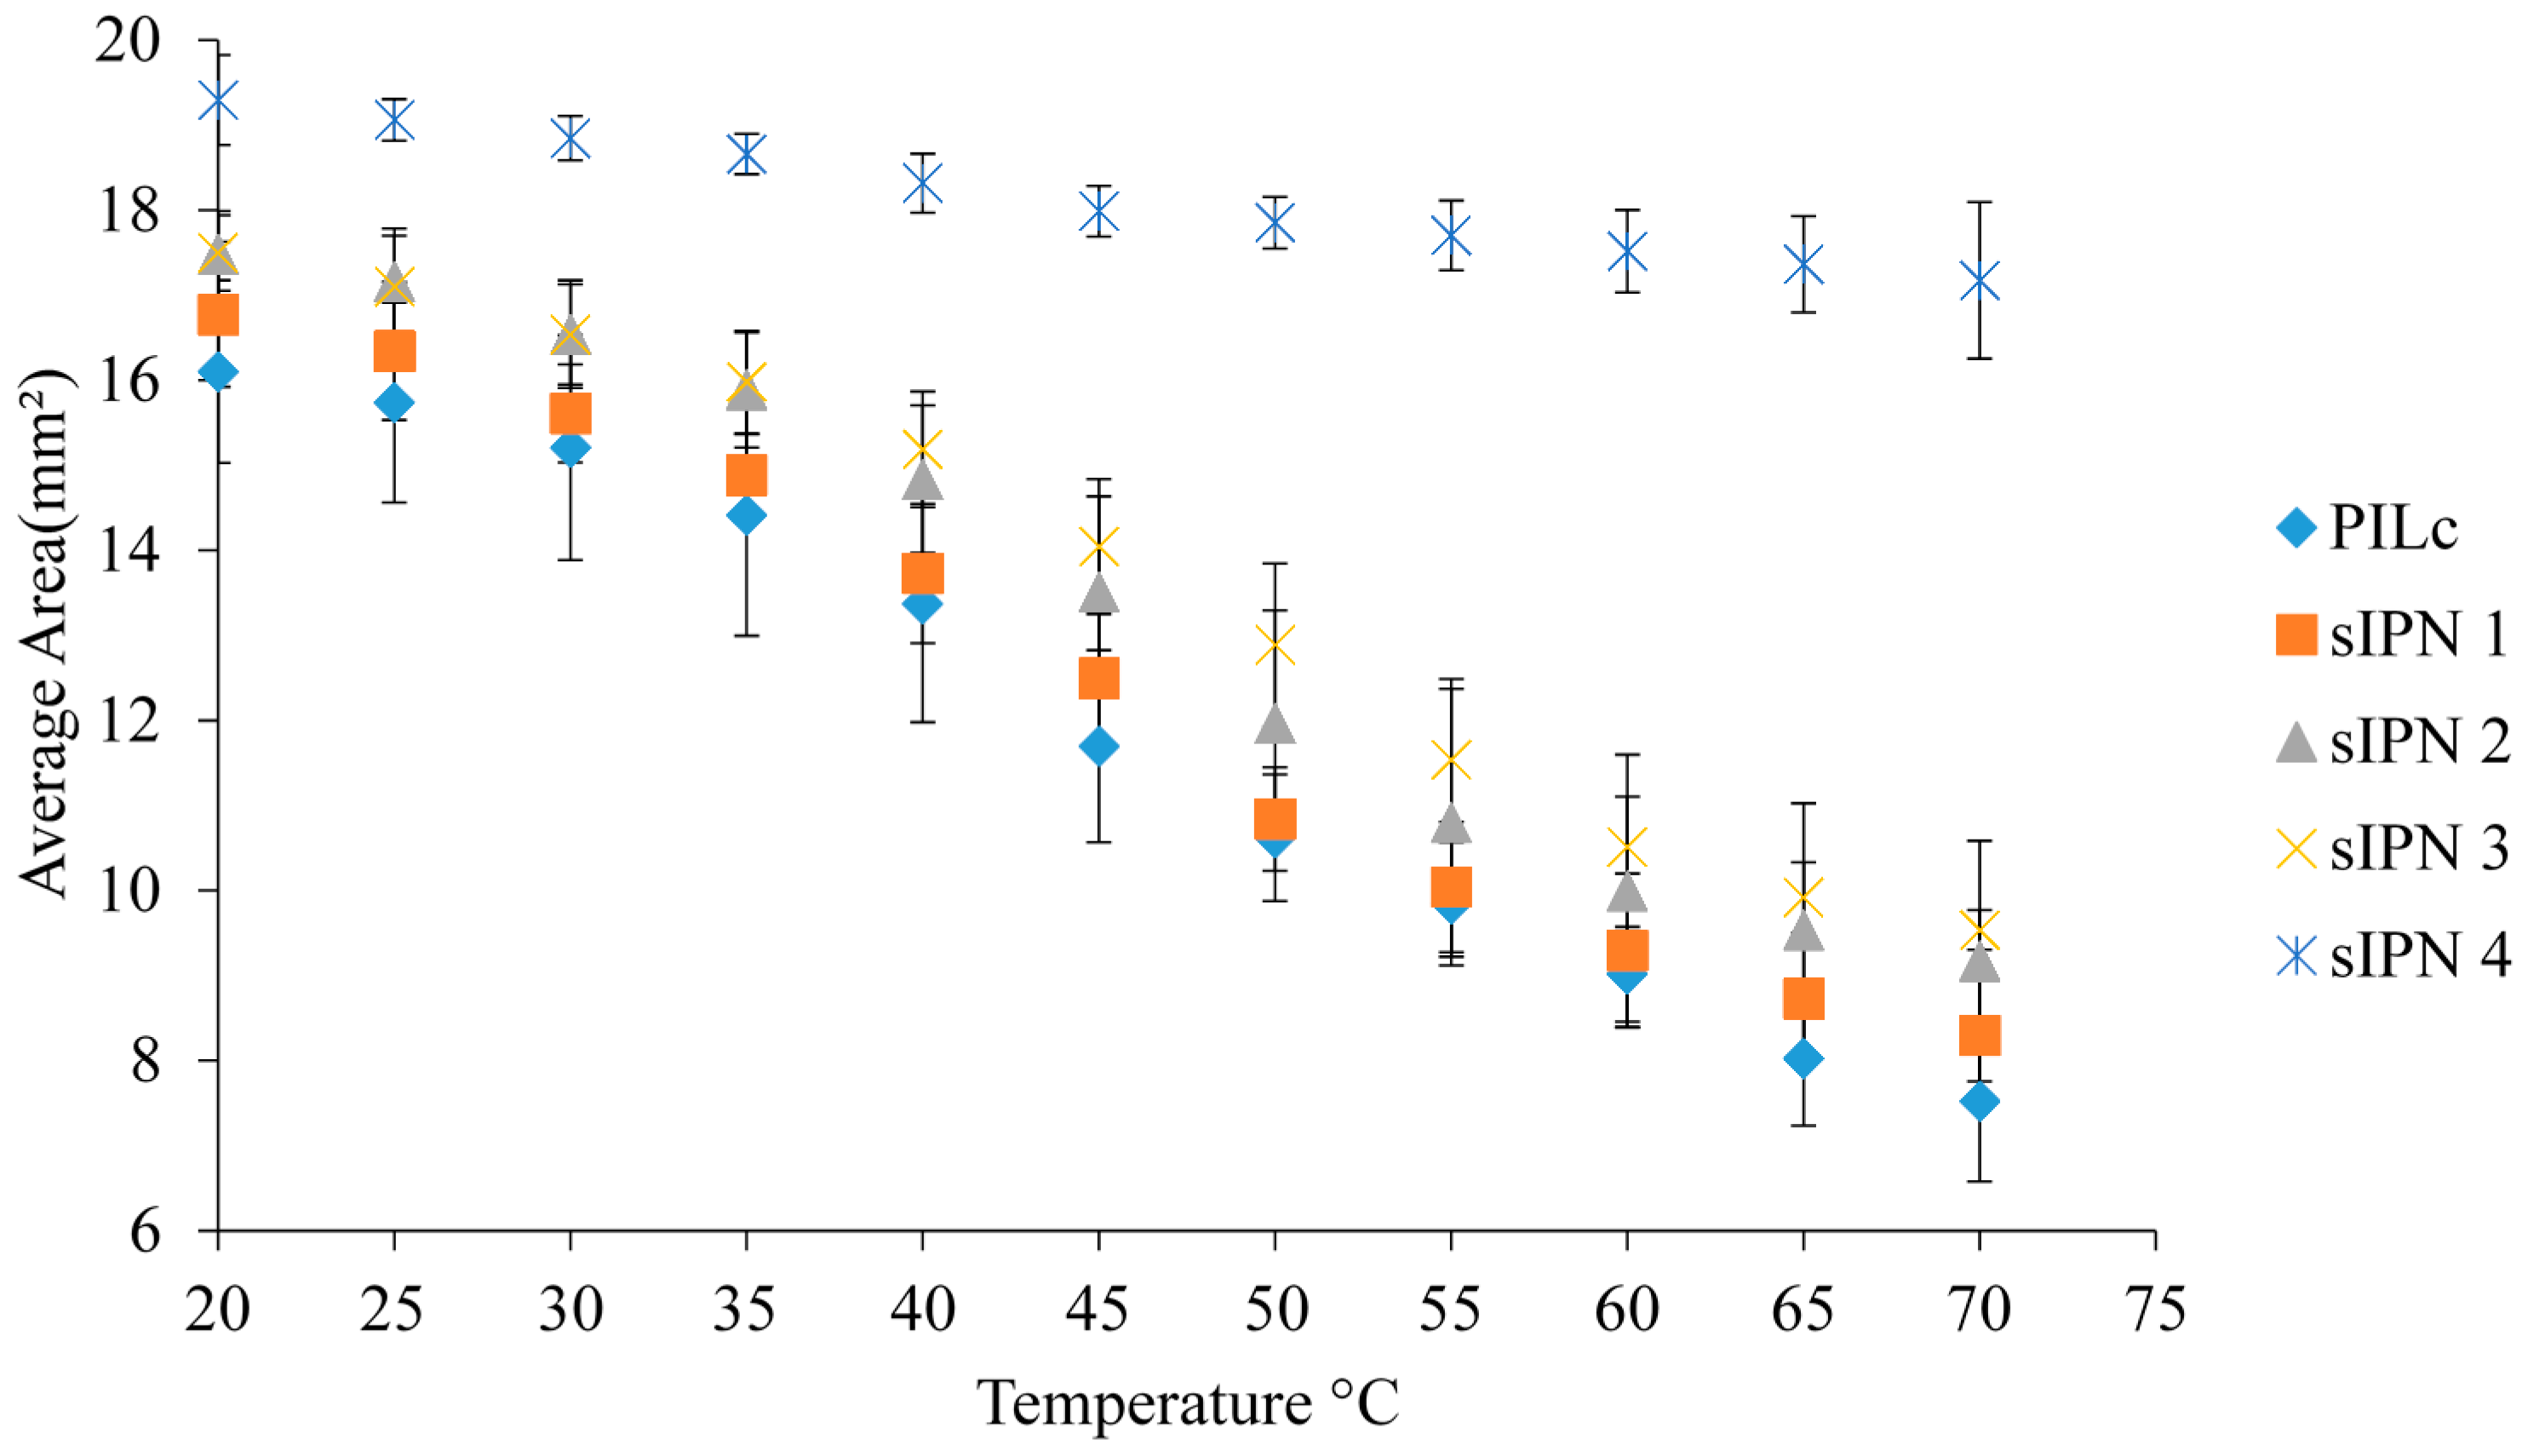
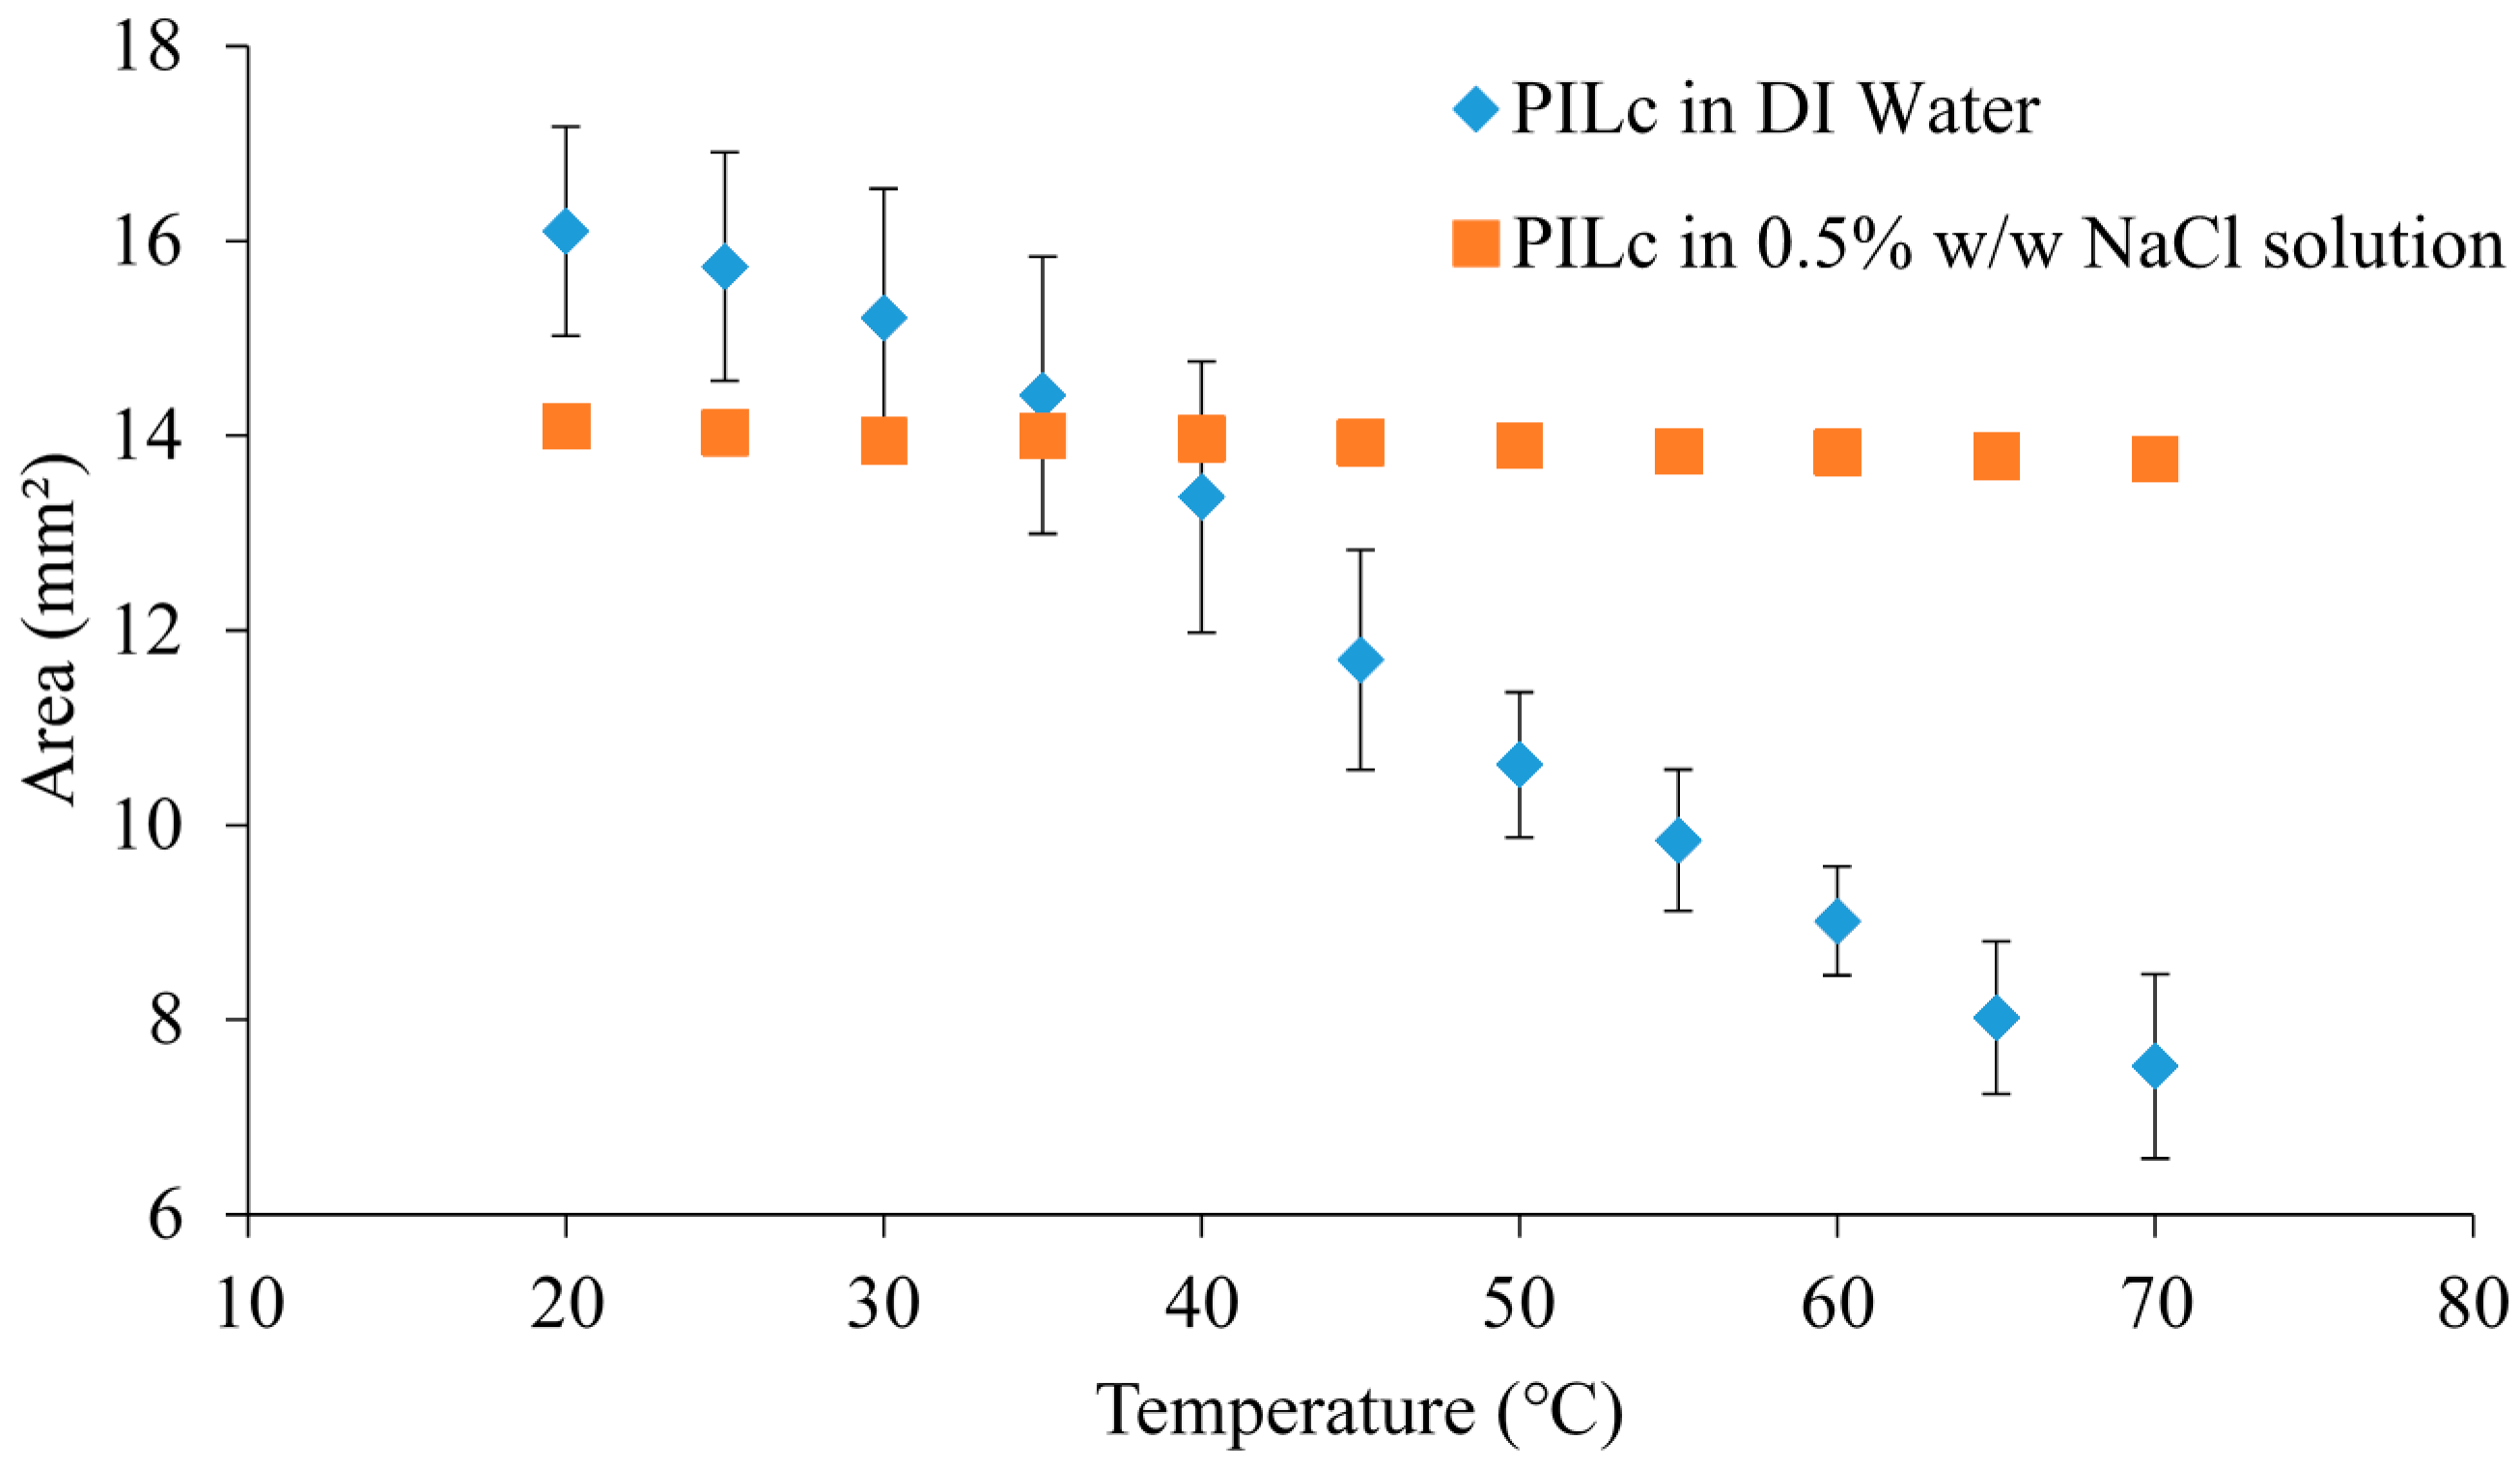
3.5. Temperature Induced Shrinking
| Sample | Fully Swollen Hydrogel Area (mm2) | Standard Deviation (n = 3) | Contracted Hydrogel Area (mm2) | Standard Deviation (n = 3) | % Shrinking |
|---|---|---|---|---|---|
| PILc | 16.101 | 1.074 | 7.524 | 0.945 | 53.273 |
| sIPN 1 | 16.774 | 0.853 | 8.295 | 0765 | 50.549 |
| sIPN 2 | 17.483 | 0.507 | 9.172 | 1.414 | 47.537 |
| sIPN 3 | 17.497 | 0.443 | 9.537 | 0.232 | 45.494 |
| sIPN 4 | 19.296 | 0.530 | 17.174 | 0.922 | 10.995 |
4. Conclusions
Acknowledgments
Author Contributions
Conflicts of Interest
References
- Bogue, R. Smart materials: A review of recent developments. Assem. Autom. 2012, 32, 3–7. [Google Scholar] [CrossRef]
- Men, Y.; Li, X.-H.; Antonietti, M.; Yuan, J. Poly(tetrabutylphosphonium 4-styrenesulfonate): A poly(ionic liquid) stabilizer for graphene being multi-responsive. Polym. Chem. 2012, 3, 871–873. [Google Scholar] [CrossRef]
- Ziółkowski, B.; Diamond, D. Thermoresponsive poly(ionic liquid) hydrogels. Chem. Commun. 2013, 49, 10308–10310. [Google Scholar] [CrossRef] [PubMed]
- Ziółkowski, B.; Florea, L.; Theobald, J.; Benito-Lopez, F.; Diamond, D. Self-protonating spiropyran-co-NIPAM-co-acrylic acid hydrogel photoactuators. Soft Matter 2013, 9, 8754–8760. [Google Scholar] [CrossRef]
- Boutris, C.; Chatzi, E.G.; Kiparissides, C. Characterization of the LCST behaviour of aqueous poly(N-isopropylacrylamide) solutions by thermal and cloud point techniques. Polymer 1997, 38, 2567–2570. [Google Scholar] [CrossRef]
- Buwalda, S.J.; Boere, K.W.M.; Dijkstra, P.J.; Feijen, J.; Vermonden, T.; Hennink, W.E. Hydrogels in a historical perspective: From simple networks to smart materials. J. Control. Release 2014, 190, 254–273. [Google Scholar] [CrossRef] [PubMed]
- Renamayor, C.S.; Pastoriza, A.; Usma, C.L.; Pierola, I.F. Salting-in effect of ionic liquids on poly(N-vinylimidazole) hydrogels. Colloid Polym. Sci. 2013, 291, 2017–2021. [Google Scholar] [CrossRef]
- Mecerreyes, D. Polymeric ionic liquids: Broadening the properties and applications of polyelectrolytes. Prog. Polym. Sci. 2011, 36, 1629–1648. [Google Scholar] [CrossRef]
- Guilherme, M.R.; da Silva, R.; Rubira, A.F.; Geuskens, G.; Muniz, E.C. Thermo-sensitive hydrogels membranes from PAAm networks and entangled PNIPAAm: Effect of temperature, cross-linking and PNIPAAm contents on the water uptake and permeability. React. Funct. Polym. 2004, 61, 233–243. [Google Scholar] [CrossRef]
- Yuan, J.; Mecerreyes, D.; Antonietti, M. Poly(ionic liquid)s: An update. Prog. Polym. Sci. 2013, 38, 1009–1036. [Google Scholar] [CrossRef]
- Yuan, J.; Antonietti, M. Poly(ionic liquid)s: Polymers expanding classical property profiles. Polymer 2011, 52, 1459–1482. [Google Scholar] [CrossRef]
- Sumaru, K.; Kameda, M.; Kanamori, T.; Shinbo, T. Characteristic Phase Transition of Aqueous Solution of Poly(N-isopropylacrylamide) Functionalized with Spirobenzopyran. Macromolecules 2004, 37, 4949–4955. [Google Scholar] [CrossRef]
- Schild, H.G. Poly (n-isopropylacrylamide)—Experiment, Theory and Application. Prog. Polym. Sci. 1992, 17, 163–249. [Google Scholar] [CrossRef]
- Gallagher, S.; Kavanagh, A.; Zíołkowski, B.; Florea, L.; MacFarlane, D.R.; Fraser, K.J.; Diamond, D. Ionic liquid modulation of swelling and LCST behavior of N-isopropylacrylamide polymer gels. Phys. Chem. Chem. Phys. 2013, 16, 3610–3616. [Google Scholar] [CrossRef] [PubMed]
- Gallagher, S.; Florea, L.; Fraser, K.J.; Diamond, D. Swelling and Shrinking Properties of Thermo-Responsive Polymeric Ionic Liquid Hydrogels with Embedded Linear pNIPAAM. Int. J. Mol. Sci. 2014, 15, 5337–5349. [Google Scholar] [CrossRef] [PubMed]
- Stuart, M.A.; Huck, W.T.; Genzer, J.; Müller, M.; Ober, C.; Stamm, M.; Sukhorukov, G.B.; Szleifer, I.; Tsukruk, V.V.; Urban, M.; et al. Emerging applications of stimuli-responsive polymer materials. Nat. Mater. 2010, 9, 101–113. [Google Scholar] [CrossRef] [PubMed]
- Vancoillie, G.; Frank, D.; Hoogenboom, R. Thermoresponsive poly(oligo ethylene glycol acrylates). Prog. Polym. Sci. 2014, 39, 1074–1095. [Google Scholar] [CrossRef]
- Yuan, C.; Guo, J.; Tan, M.; Guo, M.; Qiu, L.; Yan, F. Multistimuli Responsive and Electroactive Supramolecular Gels Based on Ionic Liquid Gemini Guest. ACS Macro Lett. 2014, 3, 271–275. [Google Scholar] [CrossRef]
- Yuan, C.; Guo, J.; Yan, F. Shape memory poly(ionic liquid) gels controlled by host–guest interaction with β-cyclodextrin. Polymer 2014, 55, 3431–3435. [Google Scholar] [CrossRef]
- Zhang, W.; Yuan, C.; Guo, J.; Qiu, L.; Yan, F. Supramolecular Ionic Liquid Gels for Quasi-Solid-State Dye-Sensitized Solar Cells. ACS Appl. Mater. Interfaces 2014, 6, 8723–8728. [Google Scholar] [CrossRef] [PubMed]
- Zhang, X.Z.; Yang, Y.Y.; Chung, T.S.; Ma, K.X. Preparation and characterization of fast response macroporous poly(N-isopropylacrylamide) hydrogels. Langmuir 2001, 17, 6094–6099. [Google Scholar] [CrossRef]
- Orlov, Y.; Xu, X.P.; Maurer, G. An experimental and theoretical investigation on the swelling of N-isopropyl acrylamide based ionic hydrogels in aqueous solutions of (sodium chloride or di-sodium hydrogen phosphate). Fluid Phase Equilib. 2007, 254, 1–10. [Google Scholar]
- Zhang, X.-Z.; Xu, X.-D.; Cheng, S.-X.; Zhuo, R.-X. Strategies to improve the response rate of thermosensitive PNIPAAm hydrogels. Soft Matter 2008, 4, 385–391. [Google Scholar] [CrossRef]
- Ziółkowski, B.; Ates, Z.; Gallagher, S.; Byrne, R.; Heise, A.; Fraser, K.J.; Diamond, D. Mechanical Properties and UV Curing Behavior of Poly(N-Isopropylacrylamide) in Phosphonium-Based Ionic Liquids. Macromol. Chem. Phys. 2013, 214, 787–796. [Google Scholar] [CrossRef]
- Florea, L.; Diamond, D.; Benito-Lopez, F. Photo-Responsive Polymeric Structures Based on Spiropyran. Macromol. Chem. Phys. 2012, 297, 1148–1159. [Google Scholar] [CrossRef]
- Kohno, Y.; Deguchi, Y.; Ohno, H. Ionic liquid-derived charged polymers to show highly thermoresponsive LCST-type transition with water at desired temperatures. Chem. Commun. 2012, 48, 11883–11885. [Google Scholar] [CrossRef] [PubMed]
- Kohno, Y.; Saita, S.; Men, Y.; Yuan, J.; Ohno, H. Thermoresponsive polyelectrolytes derived from ionic liquids. Polym. Chem. 2015, 6, 2163–2178. [Google Scholar] [CrossRef]
- Men, Y.; Schlaad, H.; Voelkel, A.; Yuan, J. Thermoresponsive polymerized gemini dicationic ionic liquid. Polym. Chem. 2014, 5, 3719–3724. [Google Scholar] [CrossRef]
- Welton, T. Room-temperature ionic liquids. Solvents for synthesis and catalysis. Chem. Rev. 1999, 99, 2071–2083. [Google Scholar] [CrossRef] [PubMed]
- Wilkes, J.S.; Zaworotko, M.J. Air and Water Stable 1-ethyl-3-methylimidazolium Based Ionic Liquids. J. Chem. Soc. Chem. Commun. 1992, 965–967. [Google Scholar] [CrossRef]
- Fraser, K.J.; MacFarlane, D.R. Phosphonium-Based Ionic Liquids: An Overview. Aust. J. Chem. 2009, 62, 309–321. [Google Scholar] [CrossRef]
- Maeda, Y.; Higuchi, T.; Ikeda, I. FTIR Spectroscopic and Calorimetric Studies of the Phase Transitions of N-Isopropylacrylamide Copolymers in Water. Langmuir 2001, 17, 7535–7539. [Google Scholar] [CrossRef]
- Hammarson, M.; Nilsson, J.R.; Li, S.; Beke-Somfai, T.; Andréasson, J. Characterization of the Thermal and Photoinduced Reactions of Photochromic Spiropyrans in Aqueous Solution. J. Phys. Chem. B 2013, 117, 13561–13571. [Google Scholar] [CrossRef] [PubMed]
- Reijenga, J.; Hoof, A.V.; Loon, A.V.; Teunissen, B. Development of Methods for the Determination of pKa Values. Anal. Chem. Insights 2013, 8, 53–71. [Google Scholar] [CrossRef] [PubMed]
- Krongauz, V.A.; Fishman, S.N.; Goldburt, E.S. Quasi-crystals. Growth from photochromic spiropyrans on irradiation in a constant electric field. J. Phys. Chem. 1978, 82, 2469–2474. [Google Scholar] [CrossRef]
- Baldwin, R.L. How Hofmeister ion interactions affect protein stability. Biophys. J. 2009, 71, 2056–2063. [Google Scholar] [CrossRef]
- Odijk, T.; Houwaart, A.C. On the theory of the excluded-volume effect of a polyelectrolyte in a 1-1 electrolyte solution. J. Polym. Sci. Polym. Phys. Ed. 1978, 16, 627–639. [Google Scholar] [CrossRef]
© 2016 by the authors; licensee MDPI, Basel, Switzerland. This article is an open access article distributed under the terms and conditions of the Creative Commons by Attribution (CC-BY) license (http://creativecommons.org/licenses/by/4.0/).
Share and Cite
Tudor, A.; Florea, L.; Gallagher, S.; Burns, J.; Diamond, D. Poly(Ionic Liquid) Semi-Interpenetrating Network Multi-Responsive Hydrogels. Sensors 2016, 16, 219. https://doi.org/10.3390/s16020219
Tudor A, Florea L, Gallagher S, Burns J, Diamond D. Poly(Ionic Liquid) Semi-Interpenetrating Network Multi-Responsive Hydrogels. Sensors. 2016; 16(2):219. https://doi.org/10.3390/s16020219
Chicago/Turabian StyleTudor, Alexandru, Larisa Florea, Simon Gallagher, John Burns, and Dermot Diamond. 2016. "Poly(Ionic Liquid) Semi-Interpenetrating Network Multi-Responsive Hydrogels" Sensors 16, no. 2: 219. https://doi.org/10.3390/s16020219
APA StyleTudor, A., Florea, L., Gallagher, S., Burns, J., & Diamond, D. (2016). Poly(Ionic Liquid) Semi-Interpenetrating Network Multi-Responsive Hydrogels. Sensors, 16(2), 219. https://doi.org/10.3390/s16020219