
A Novel Piezoresistive Accelerometer with SPBs to Improve the Tradeoff between the Sensitivity and the Resonant Frequency


Abstract
:1. Introduction
2. Theory
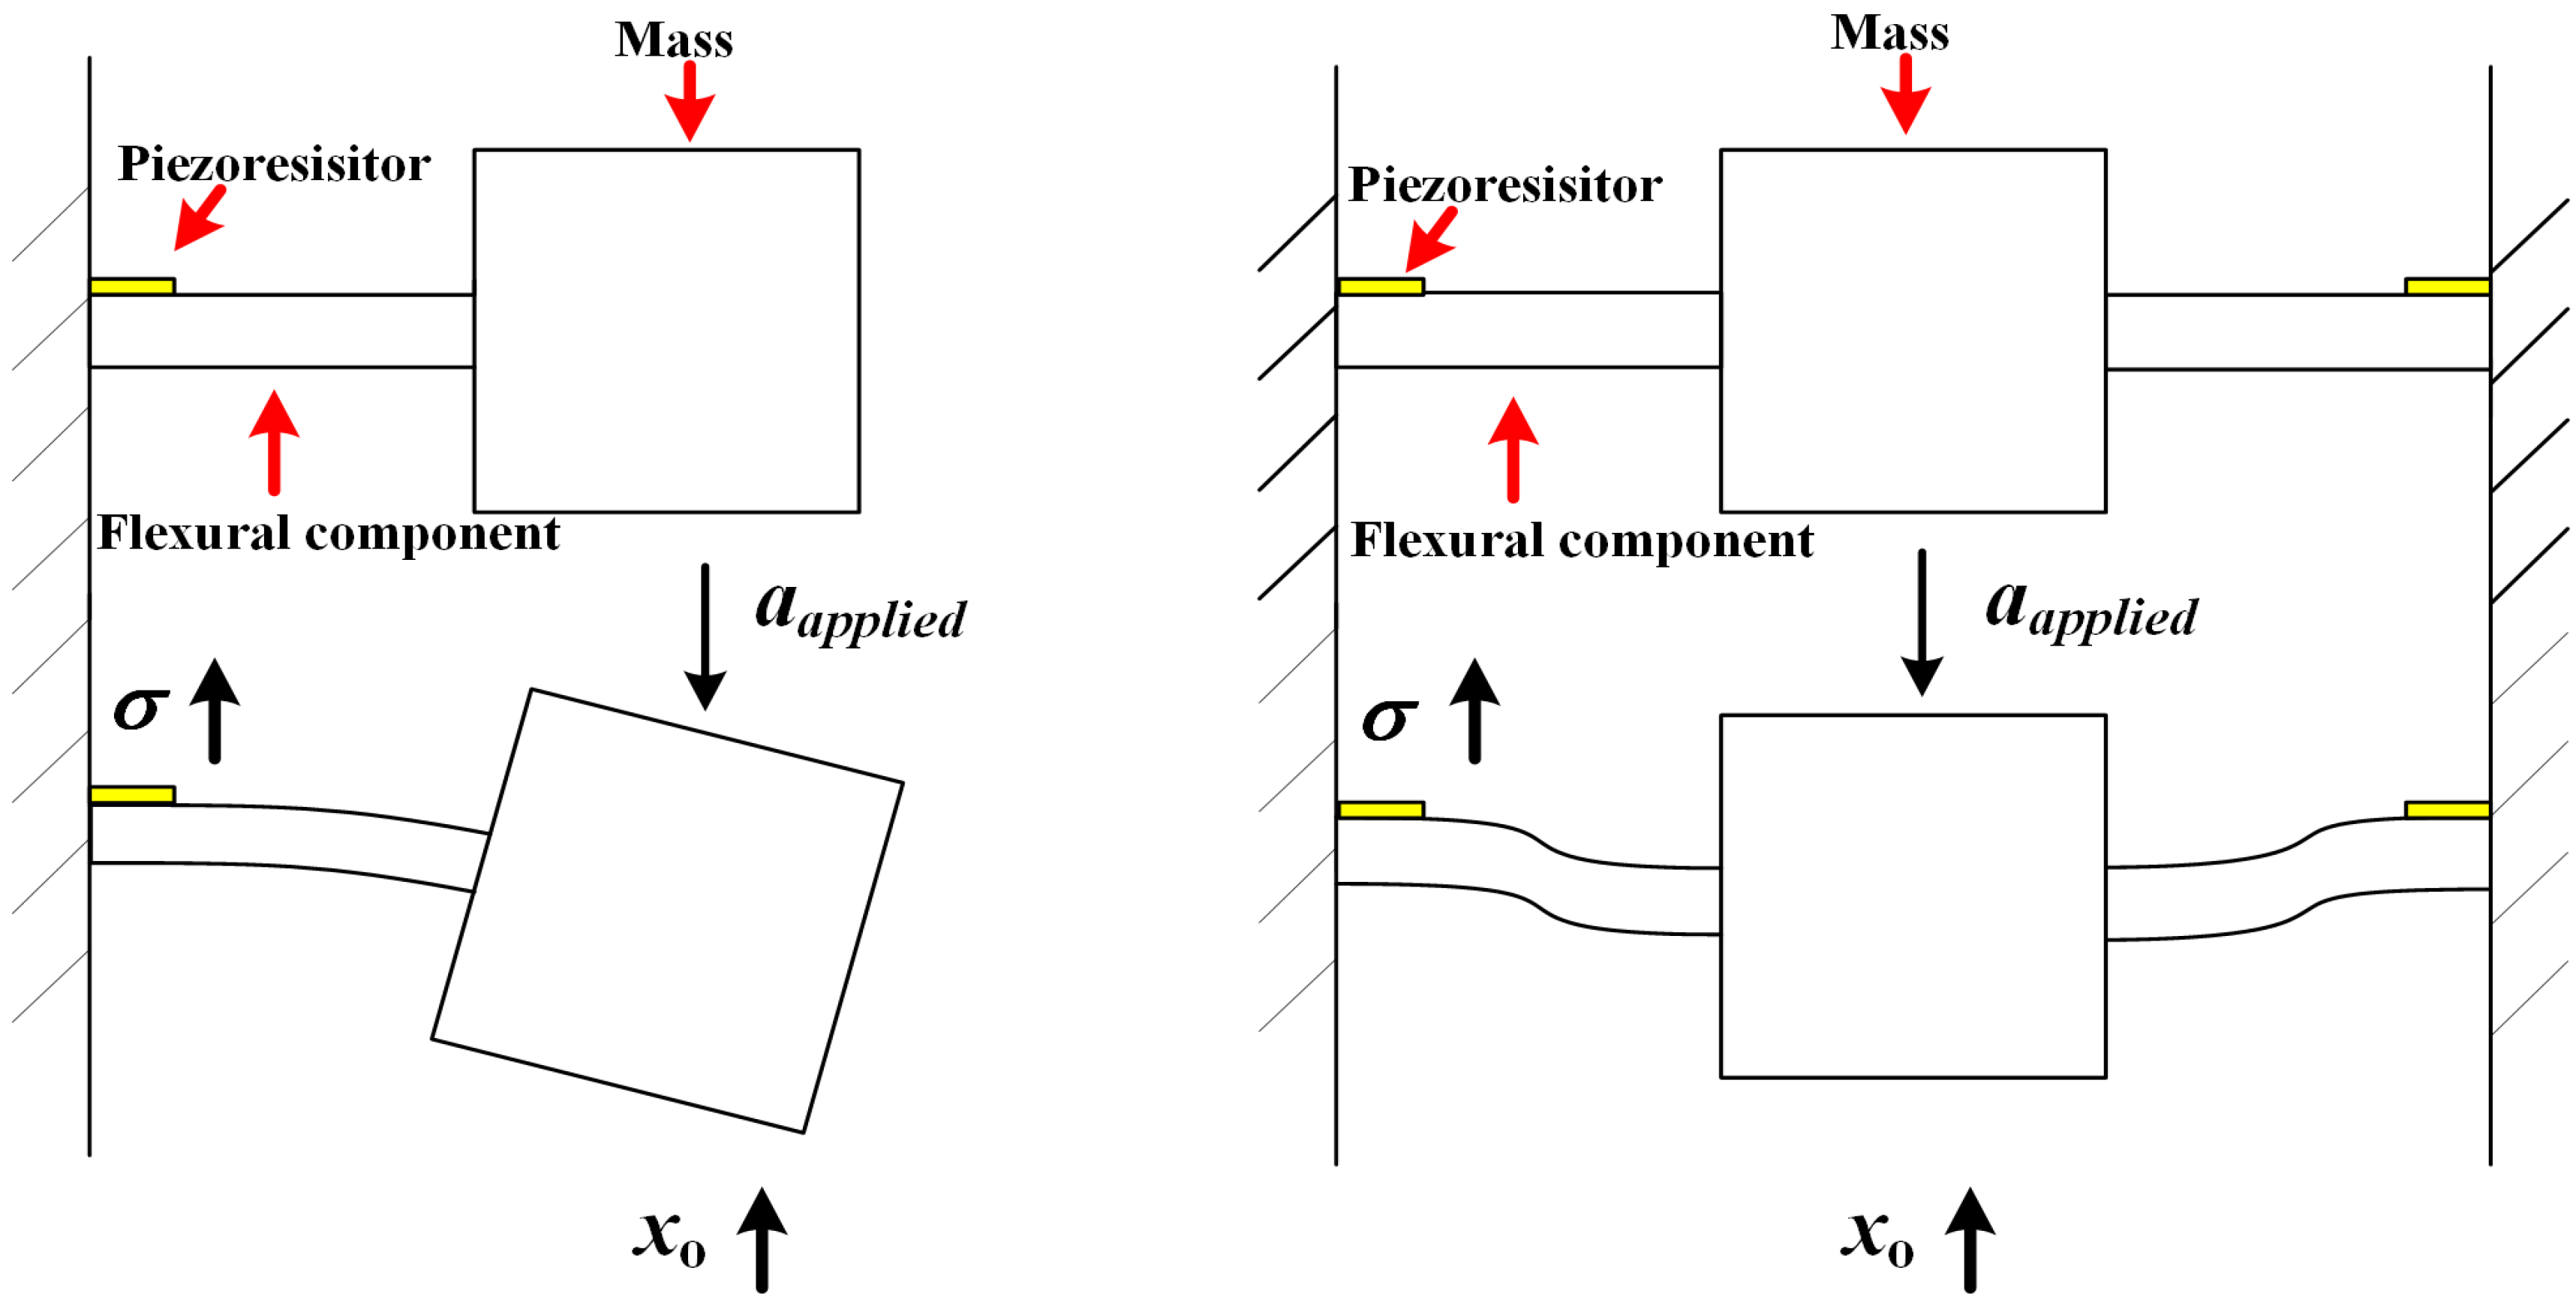
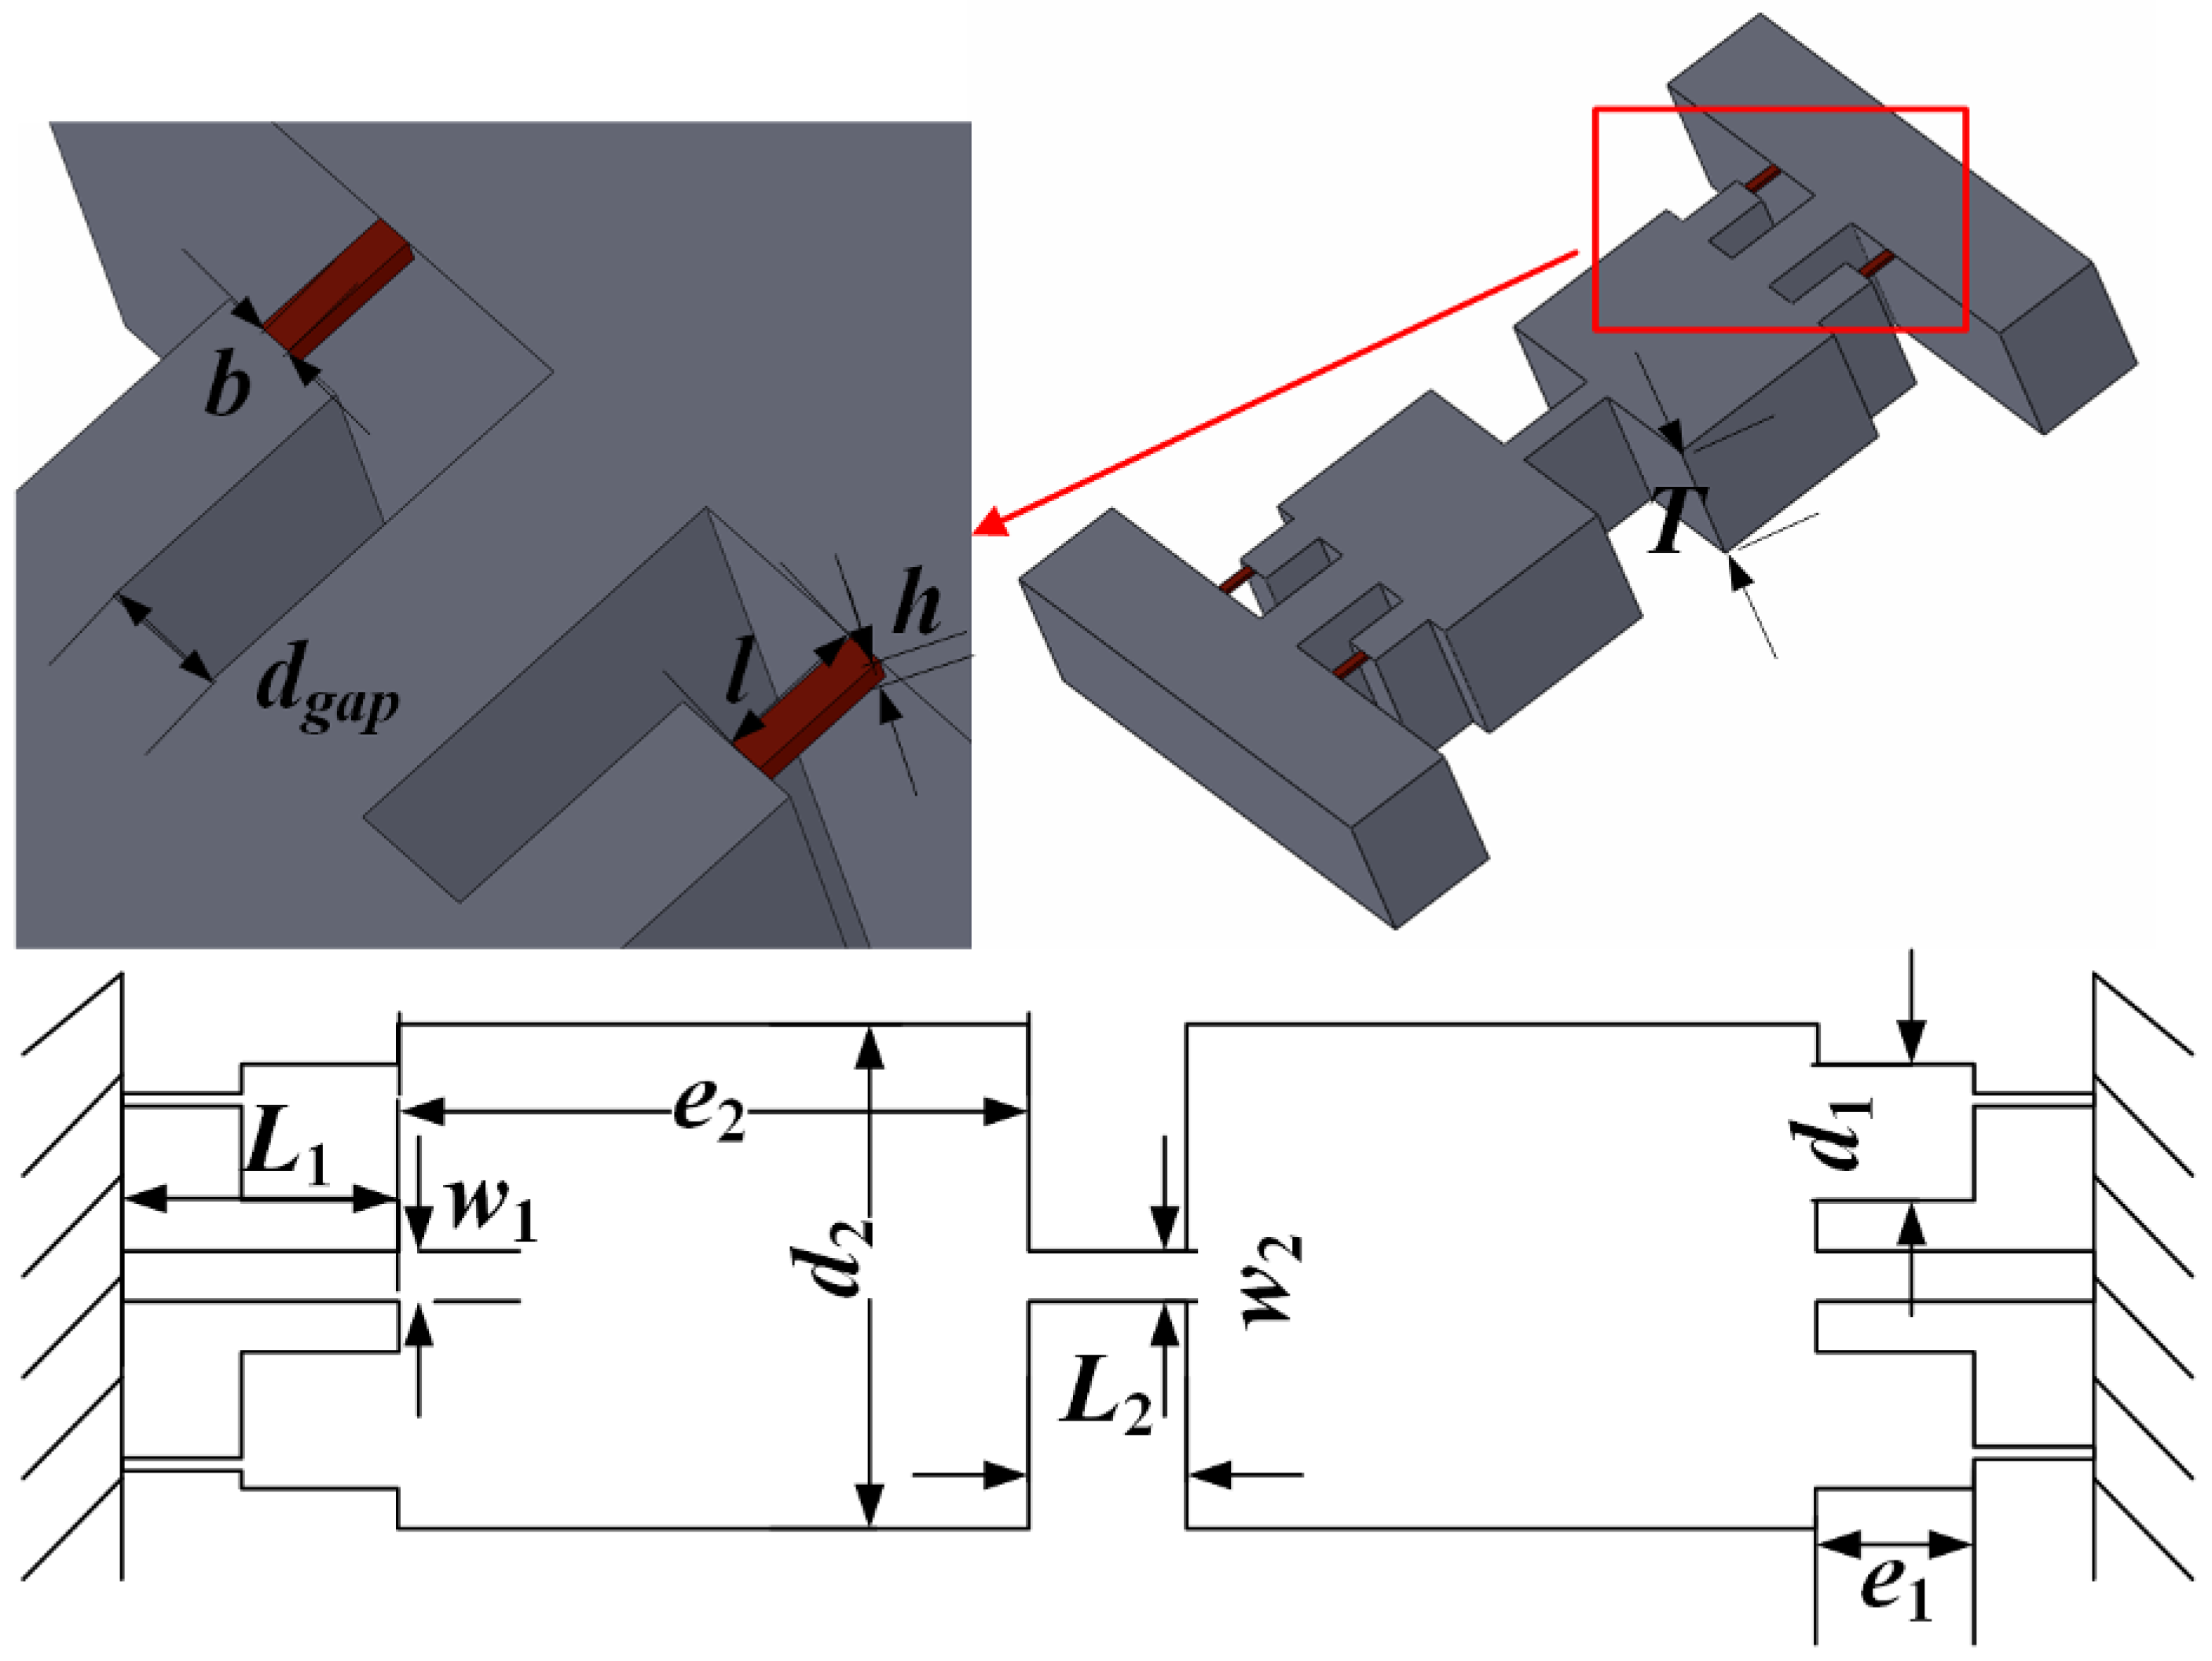
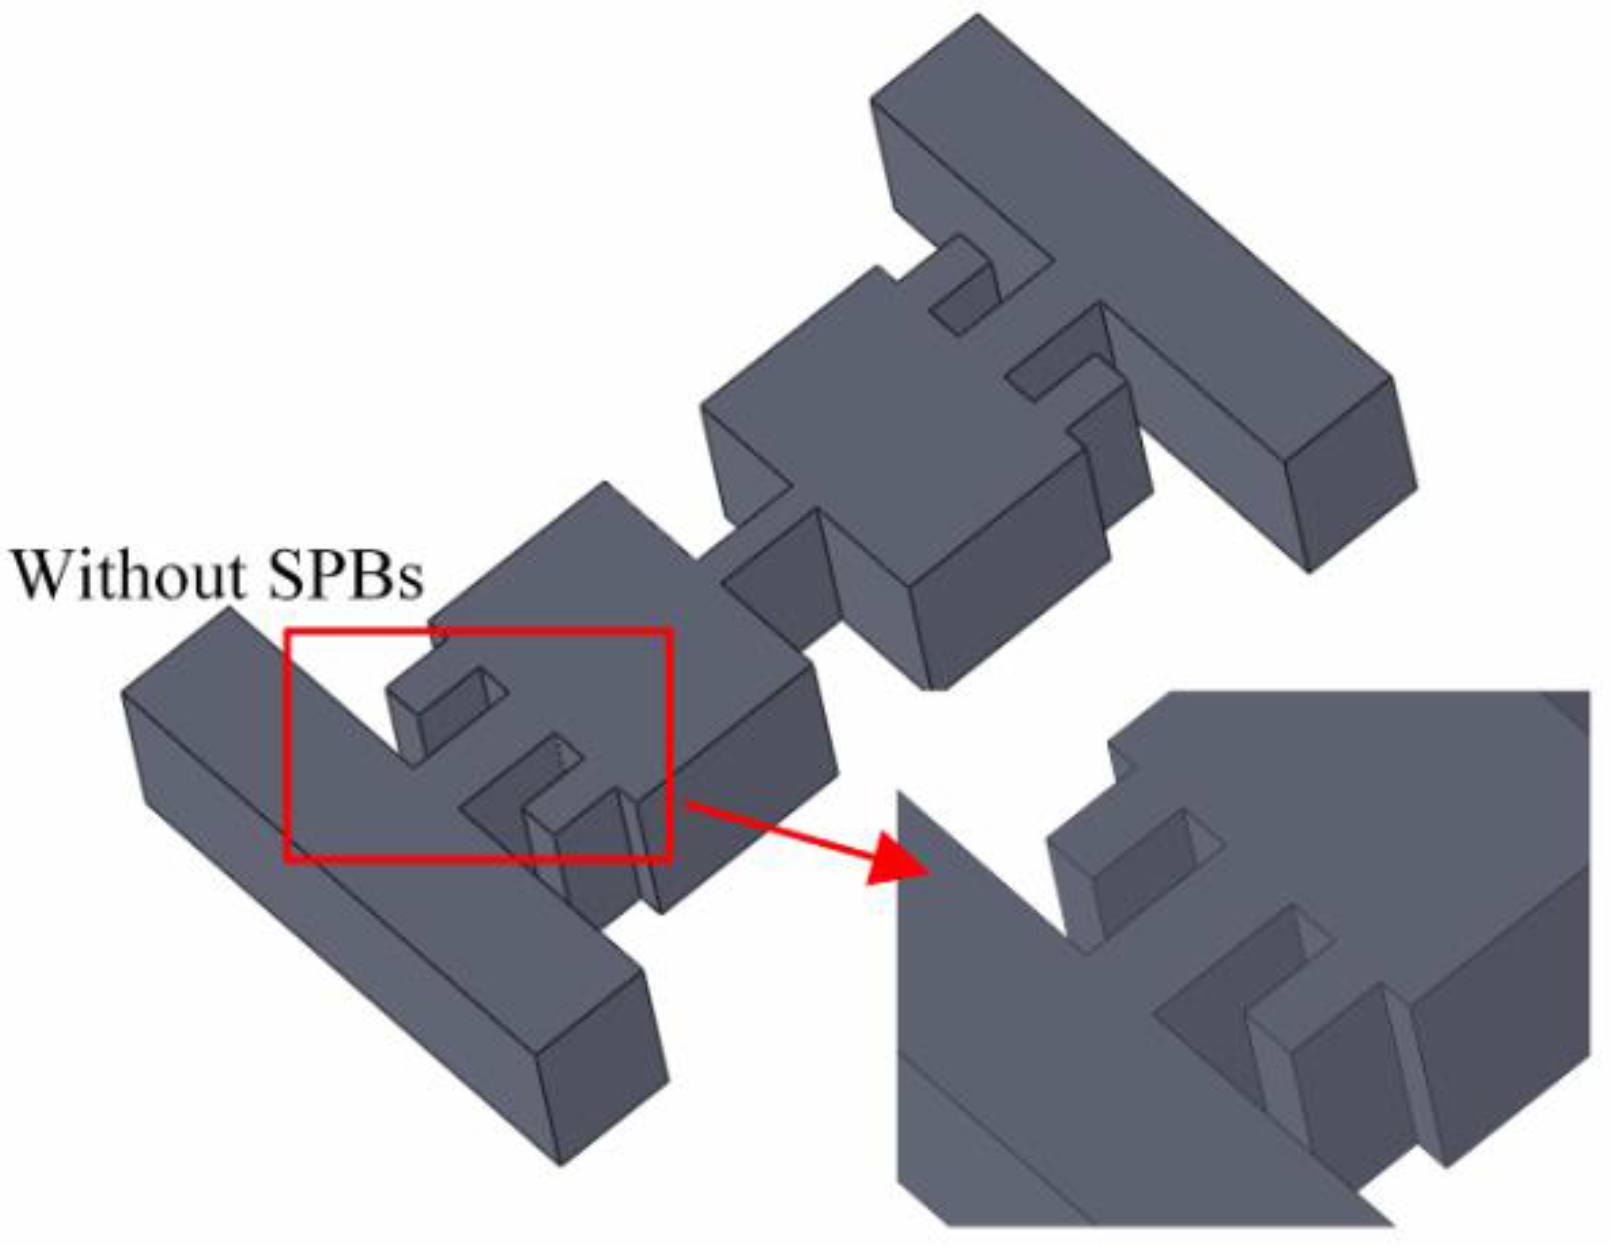
2.1. Theoretical Structure

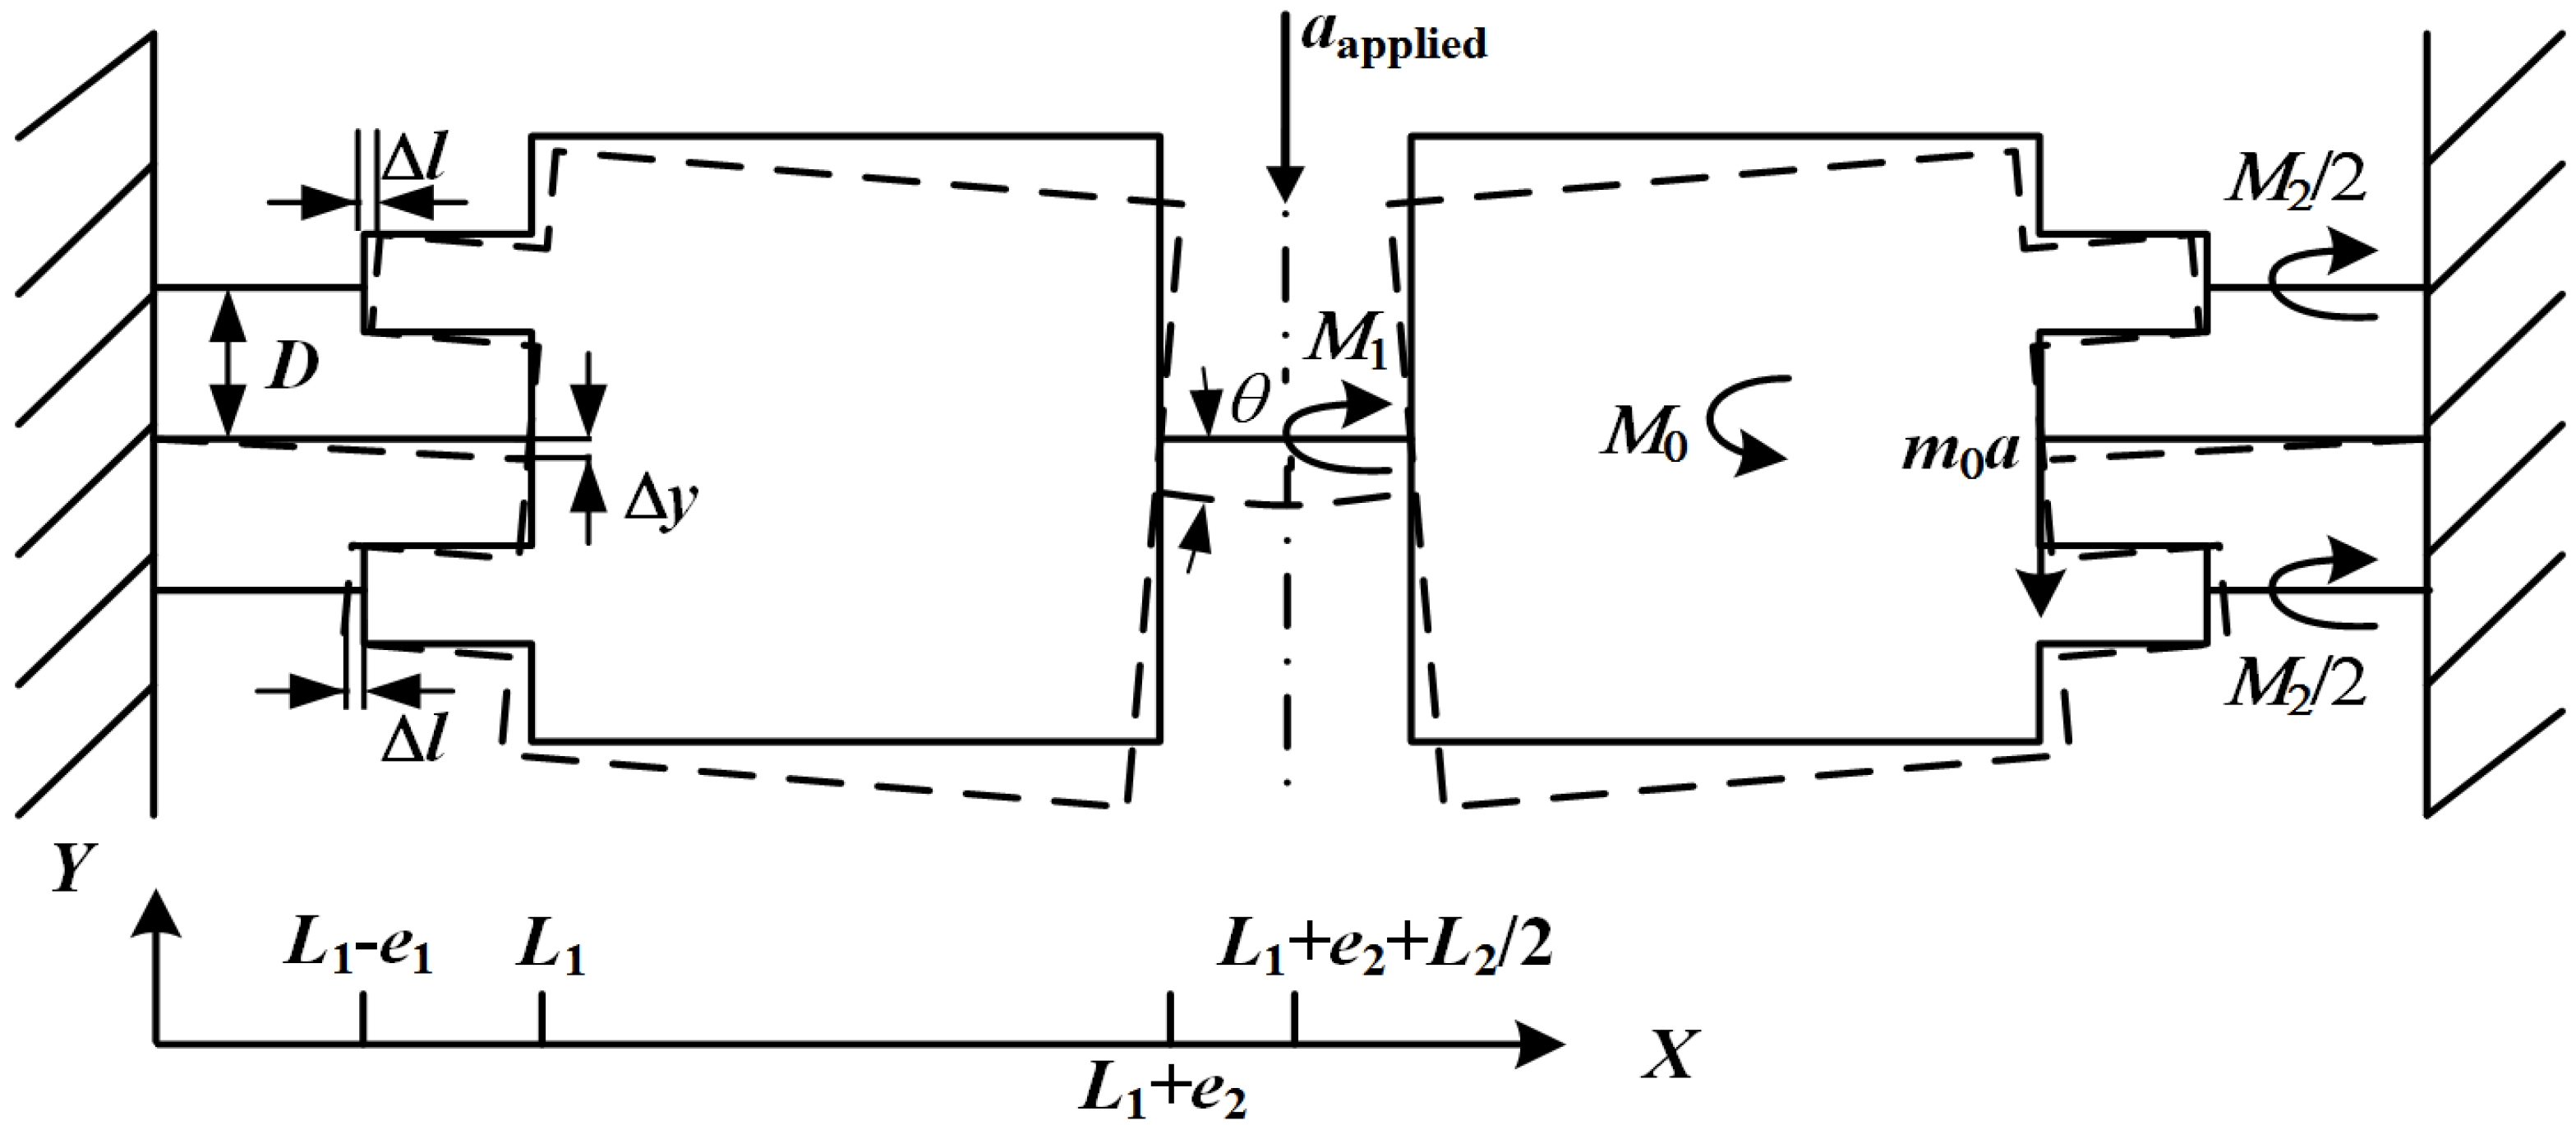
2.2. The Location of the SPBs for Achieving Axial-Deformation
2.3. The Stress of the SPBs
2.4. The Frequency of the Structure
3. Theoretical Validation

| w1 | L1 | e1 | d1 | e2 | d2 | w2 | L2 | T | b | h | l | dgap | |
|---|---|---|---|---|---|---|---|---|---|---|---|---|---|
| Initial dimensions (μm) | 70 | 500 | 430 | 395 | 1600 | 1000 | 30 | 500 | 310 | 5 | 10 | 70 | 70 |
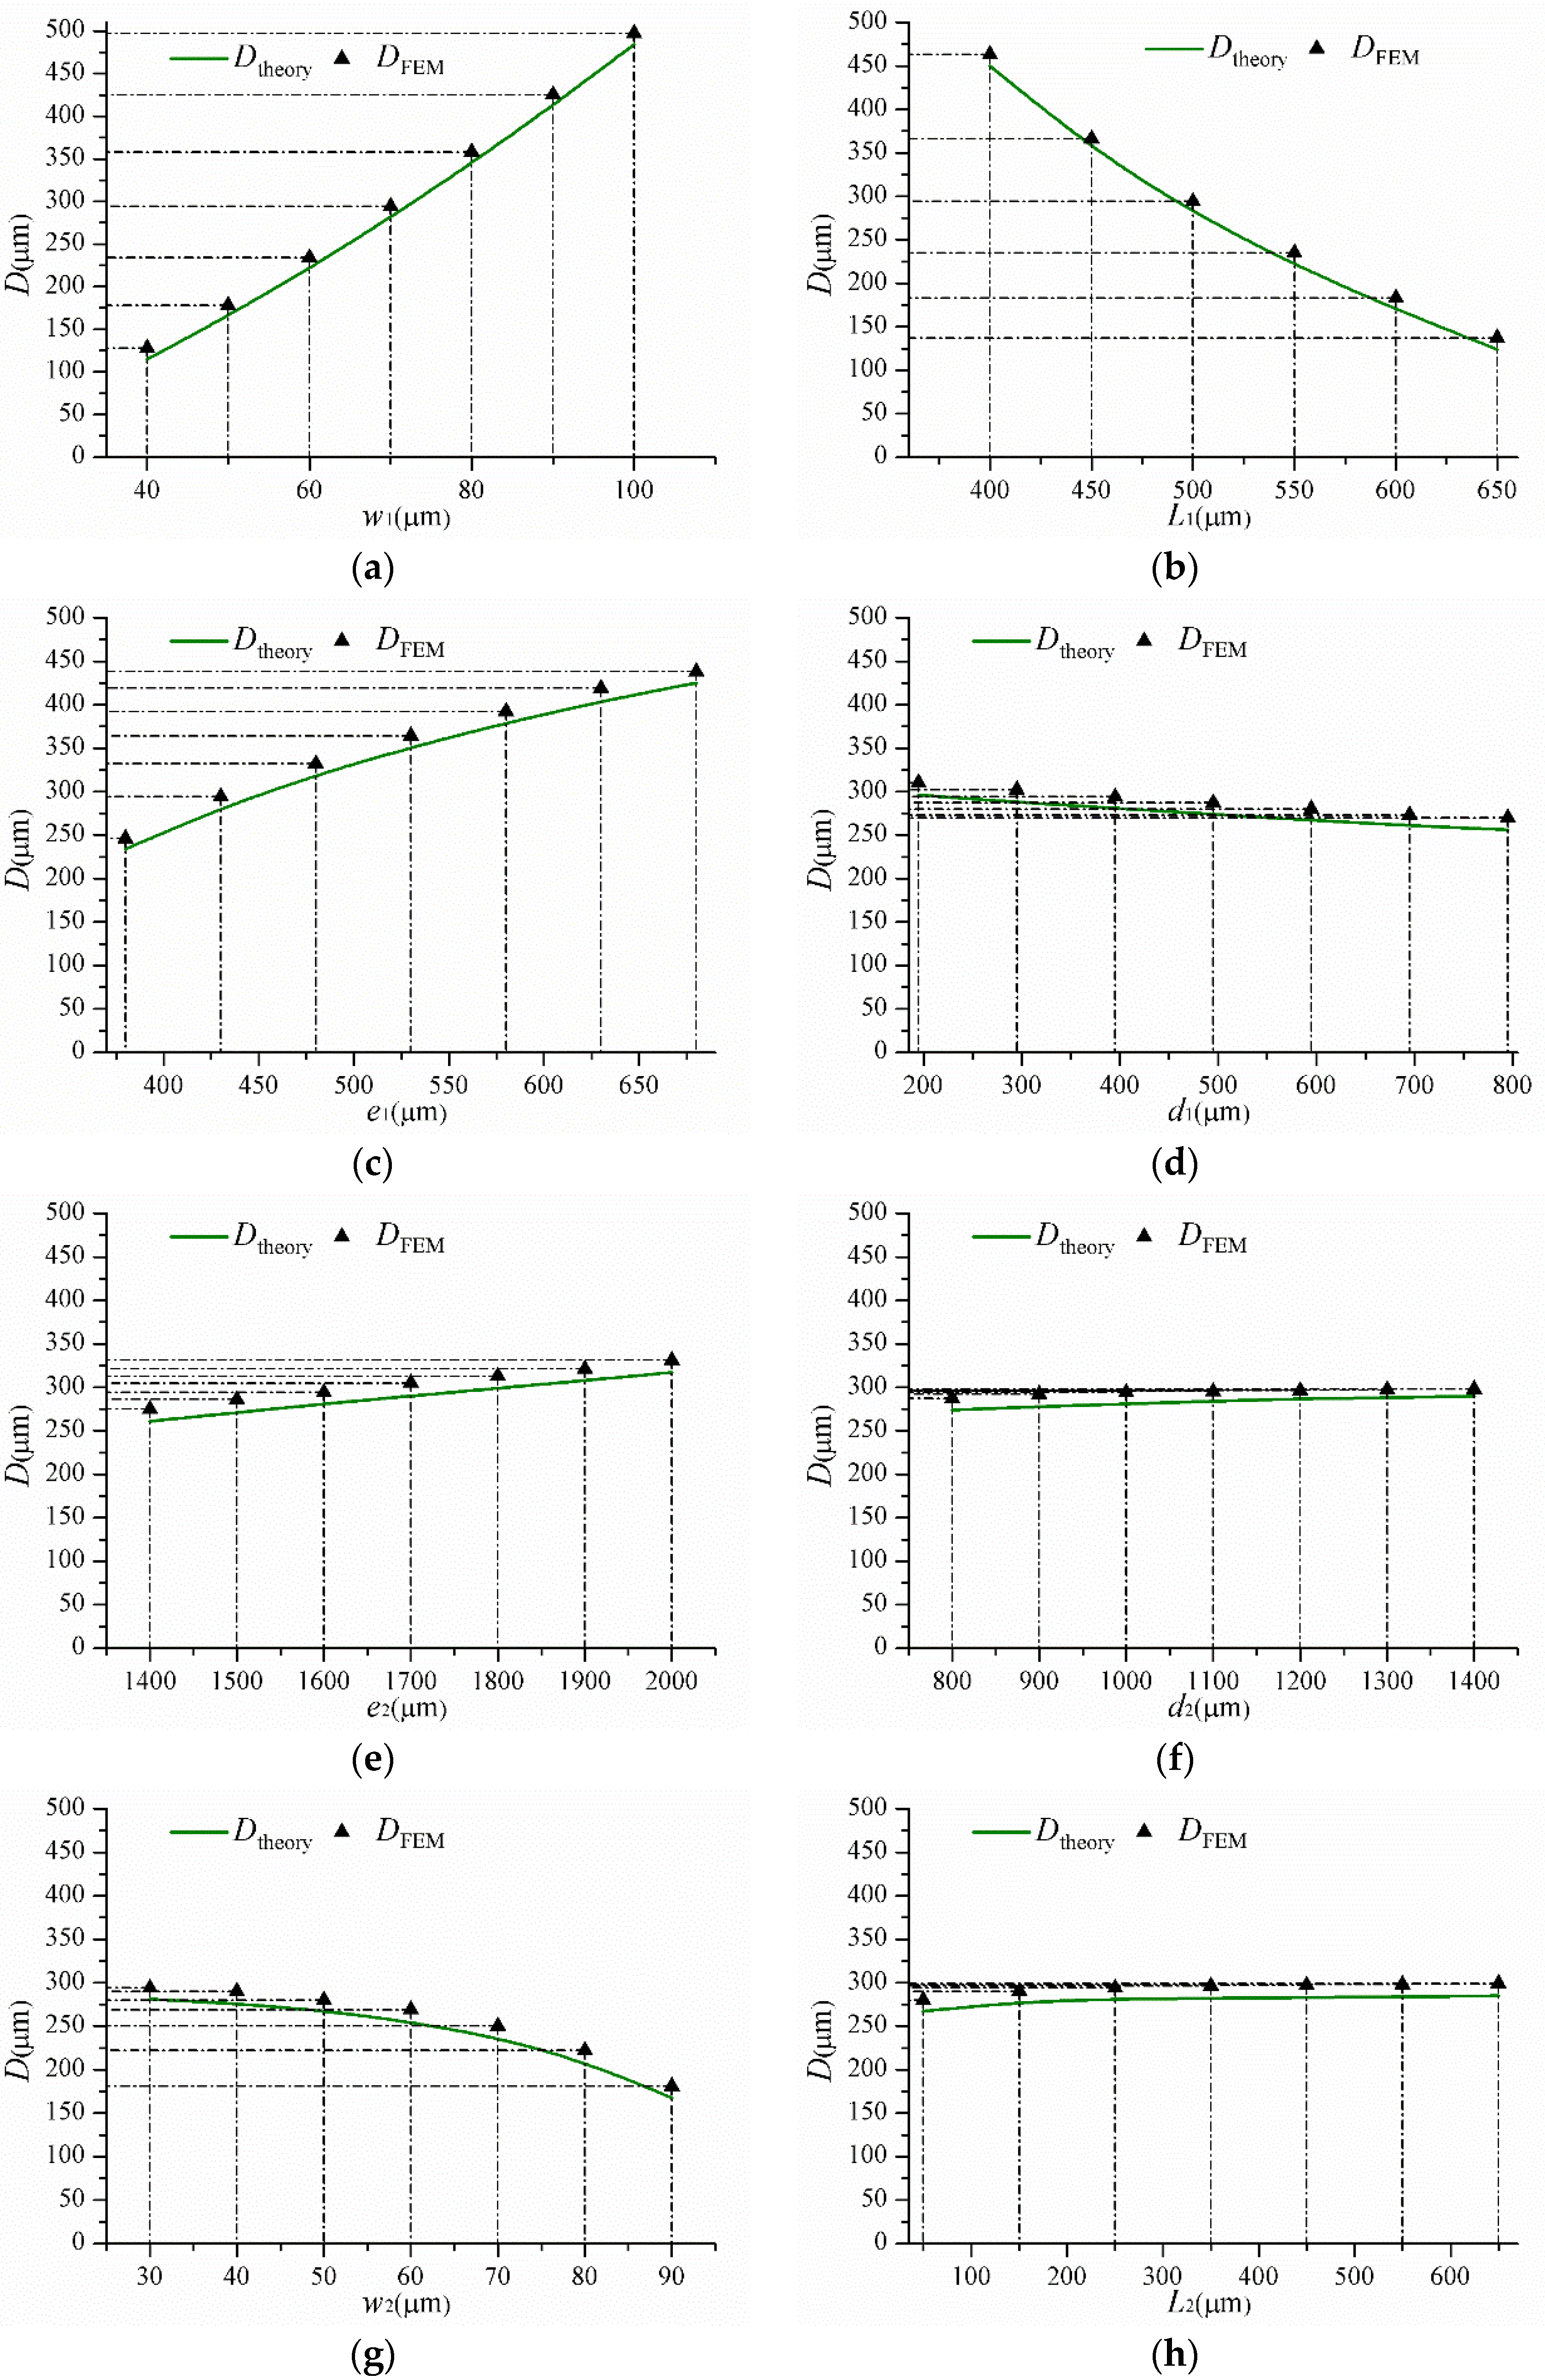
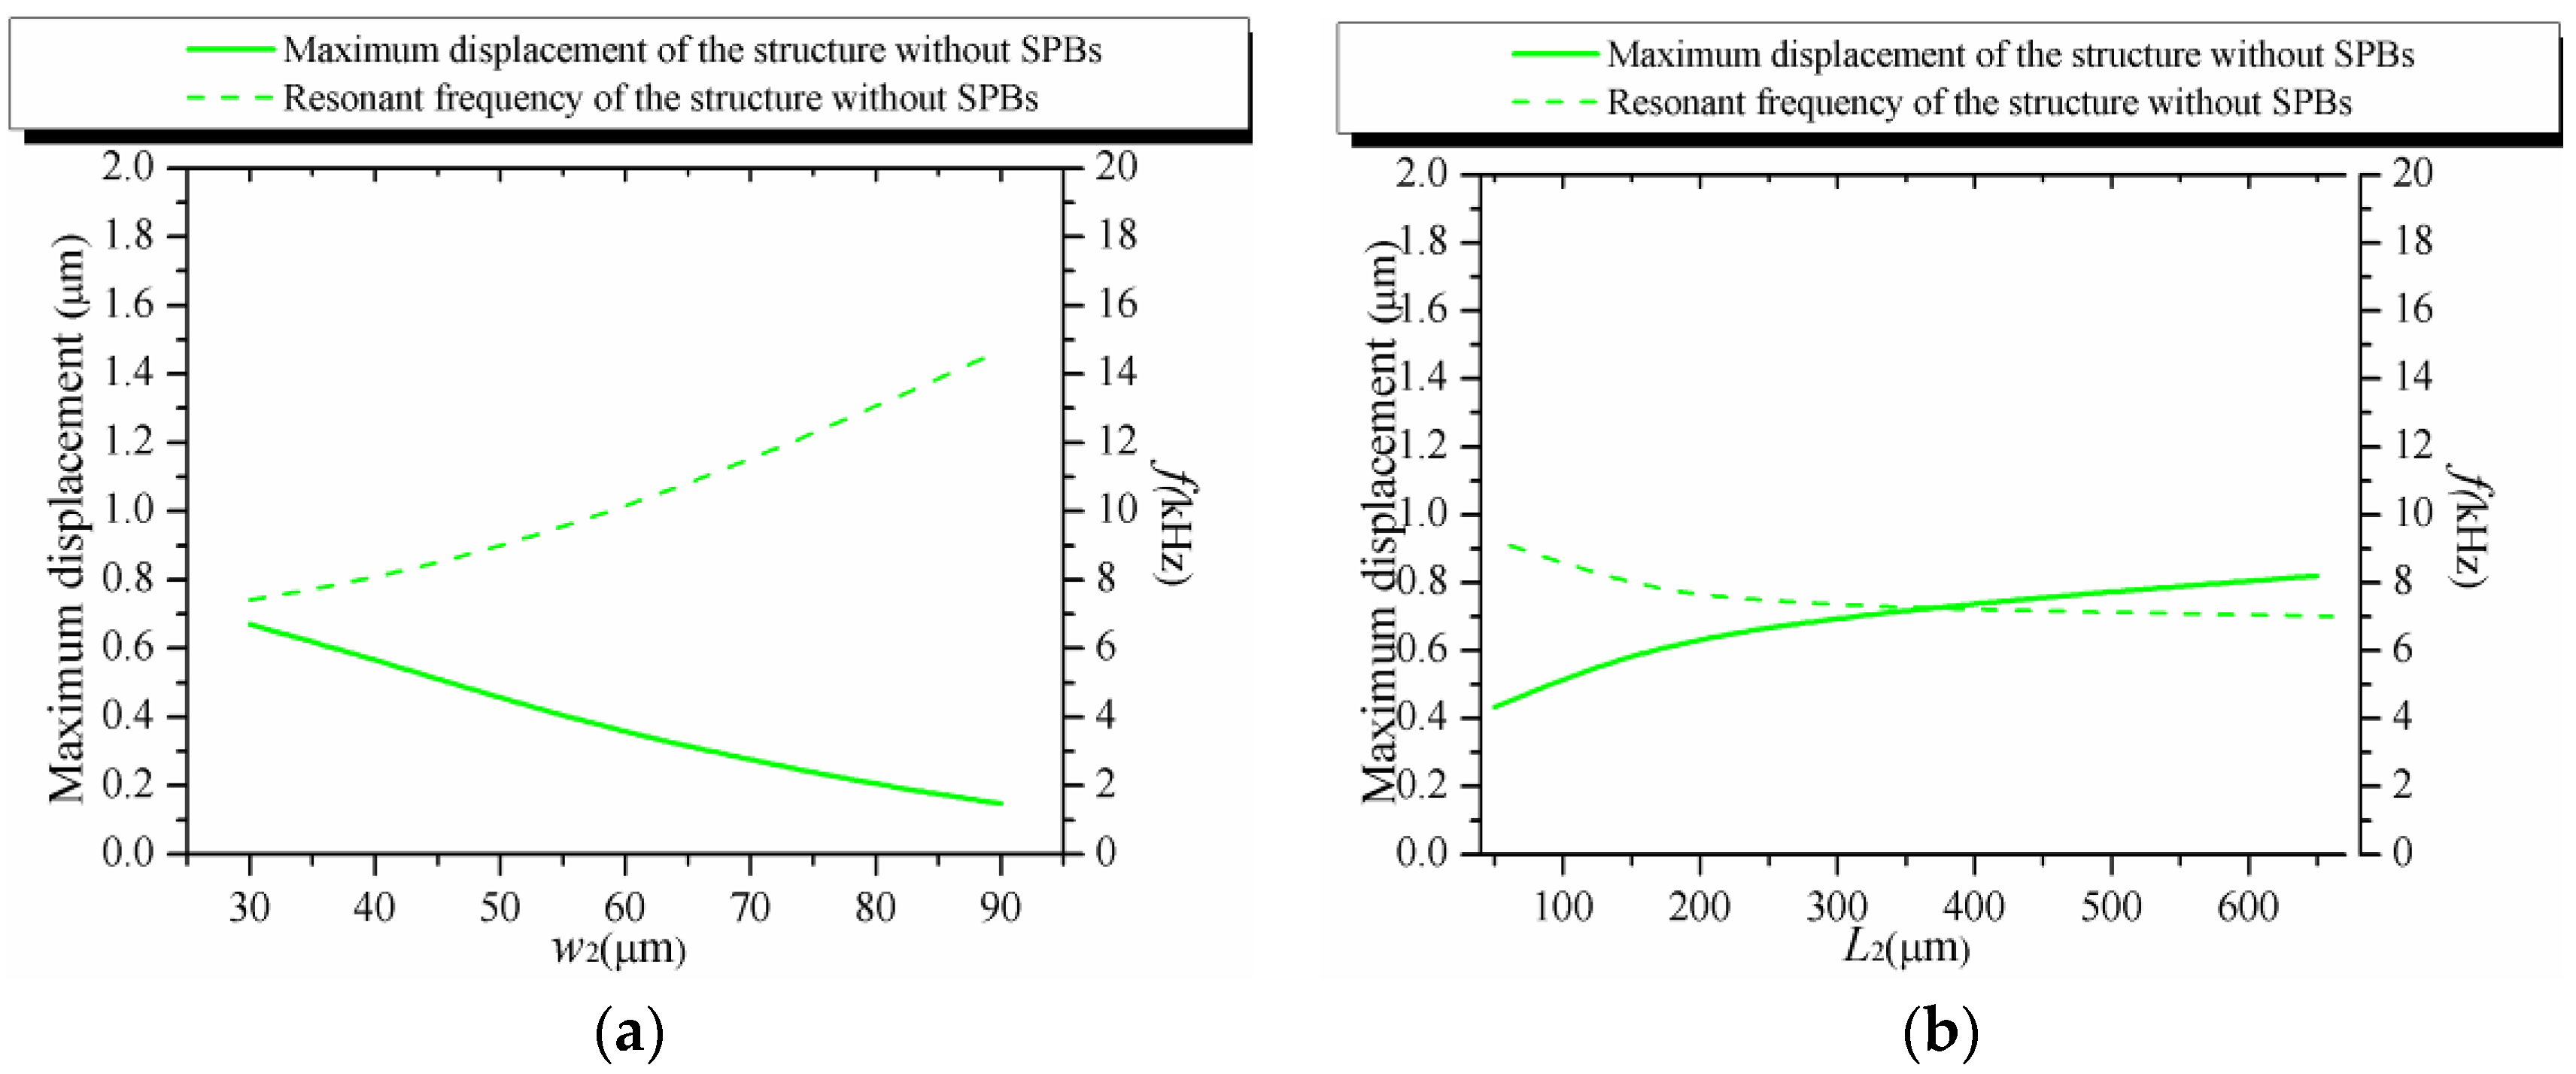
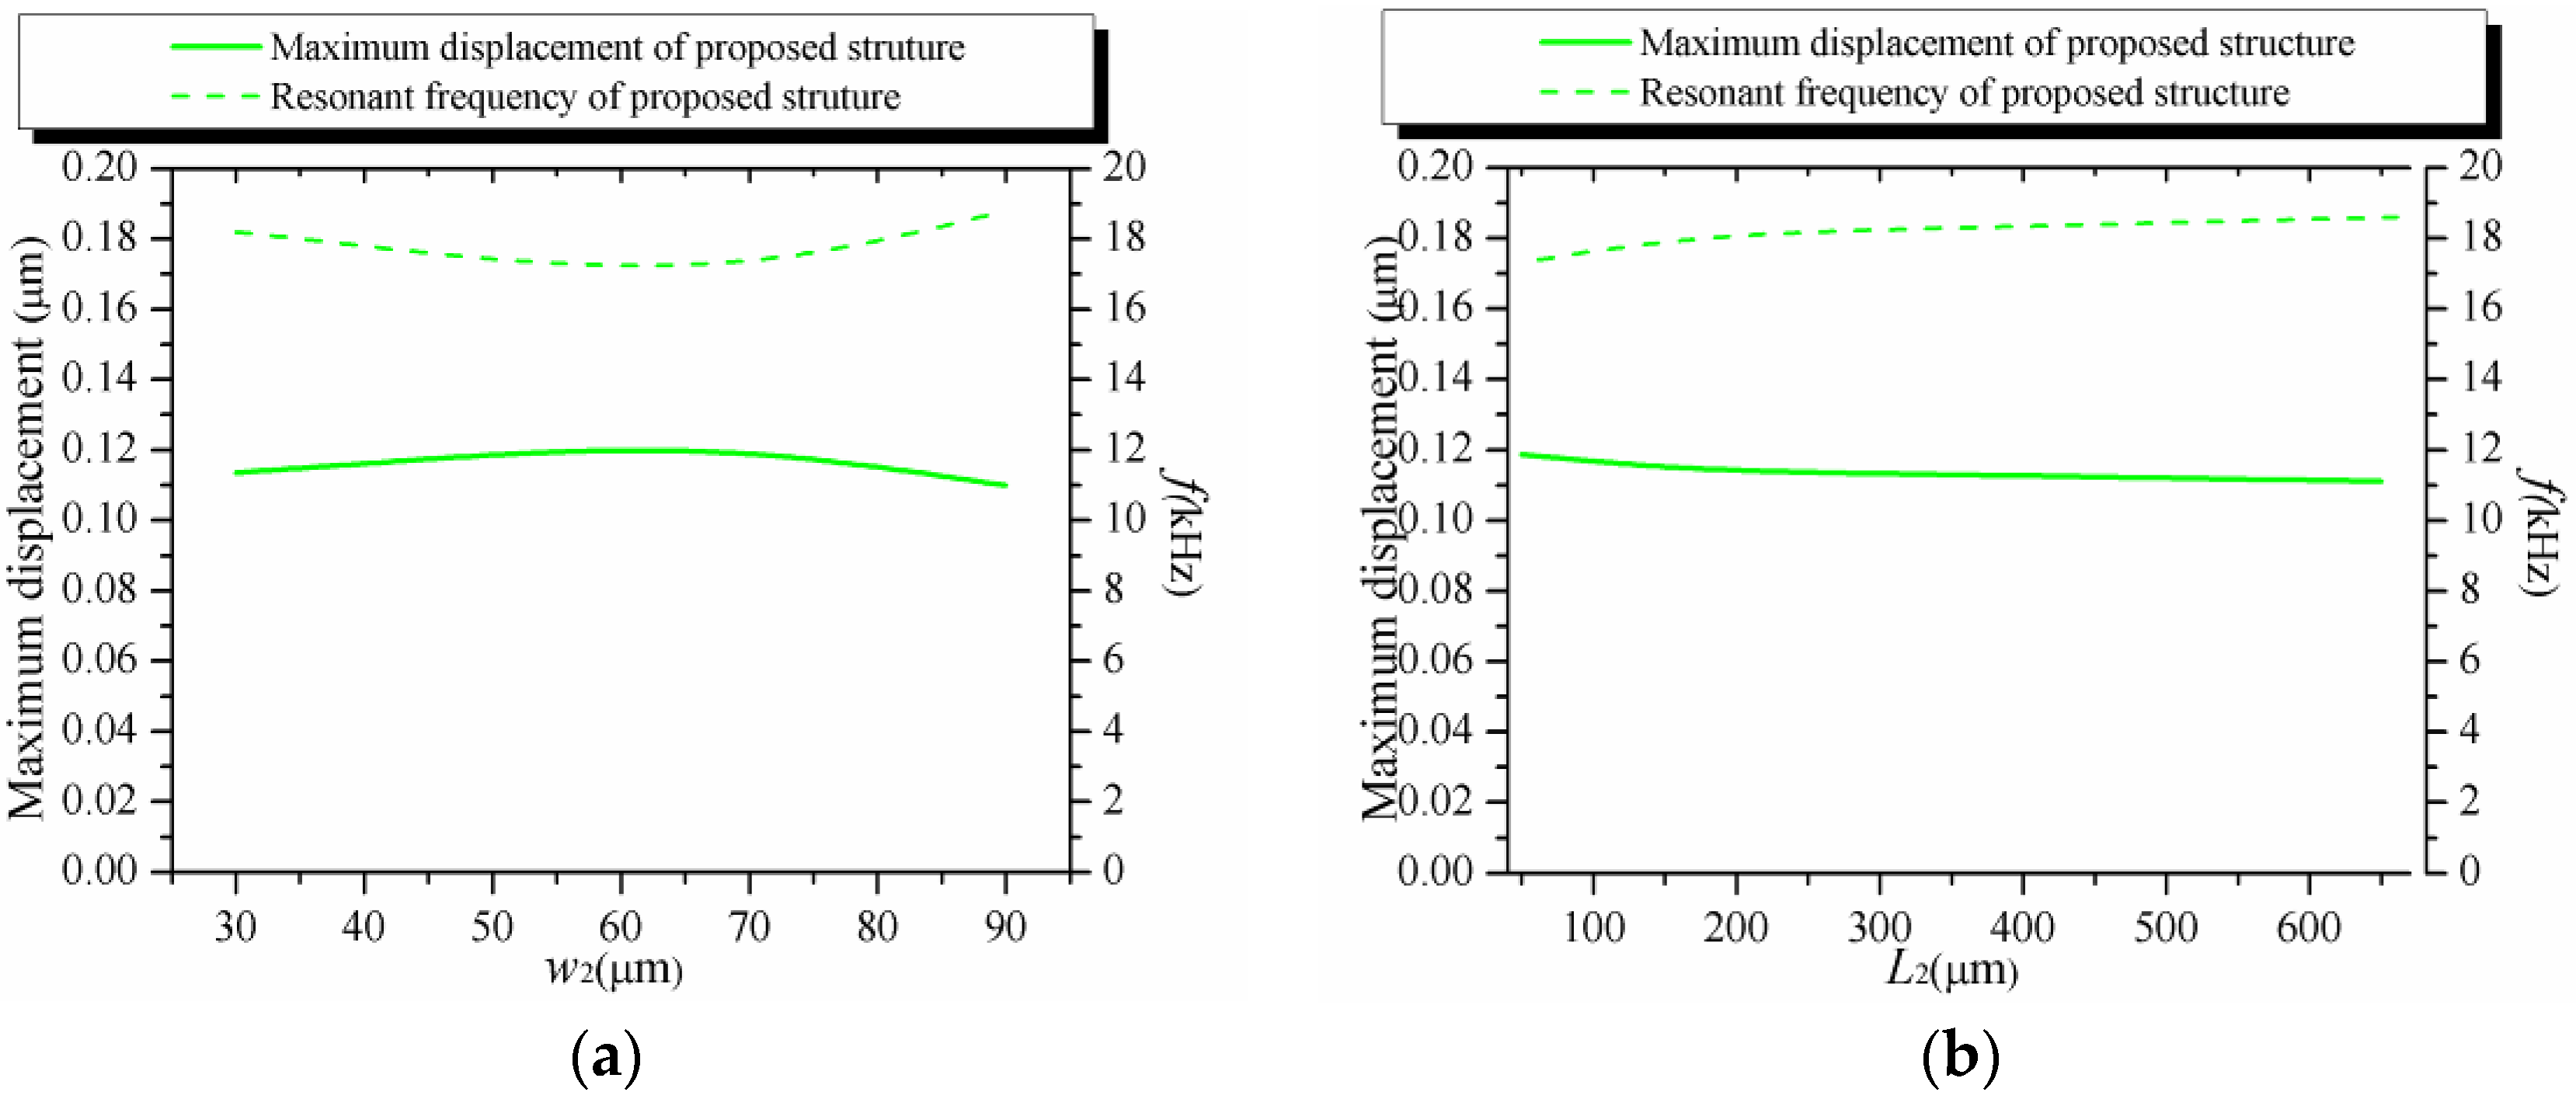
3.1. The Effects of Various Geometrical Parameters on D
| w1 | L1 | e1 | d1 | |
| Geometrical dismension range (μm) | 40–100 | 400–650 | 380–680 | 195–795 |
| Max relative error | 10.9% | 9.4% | 4.8% | 5.1% |
| e2 | d2 | w2 | L2 | |
| Geometrical dismension range (μm) | 1400–2000 | 800–1400 | 30–90 | 50–650 |
| Max relative error | 5.0% | 4.5% | 7.1% | 4.6% |

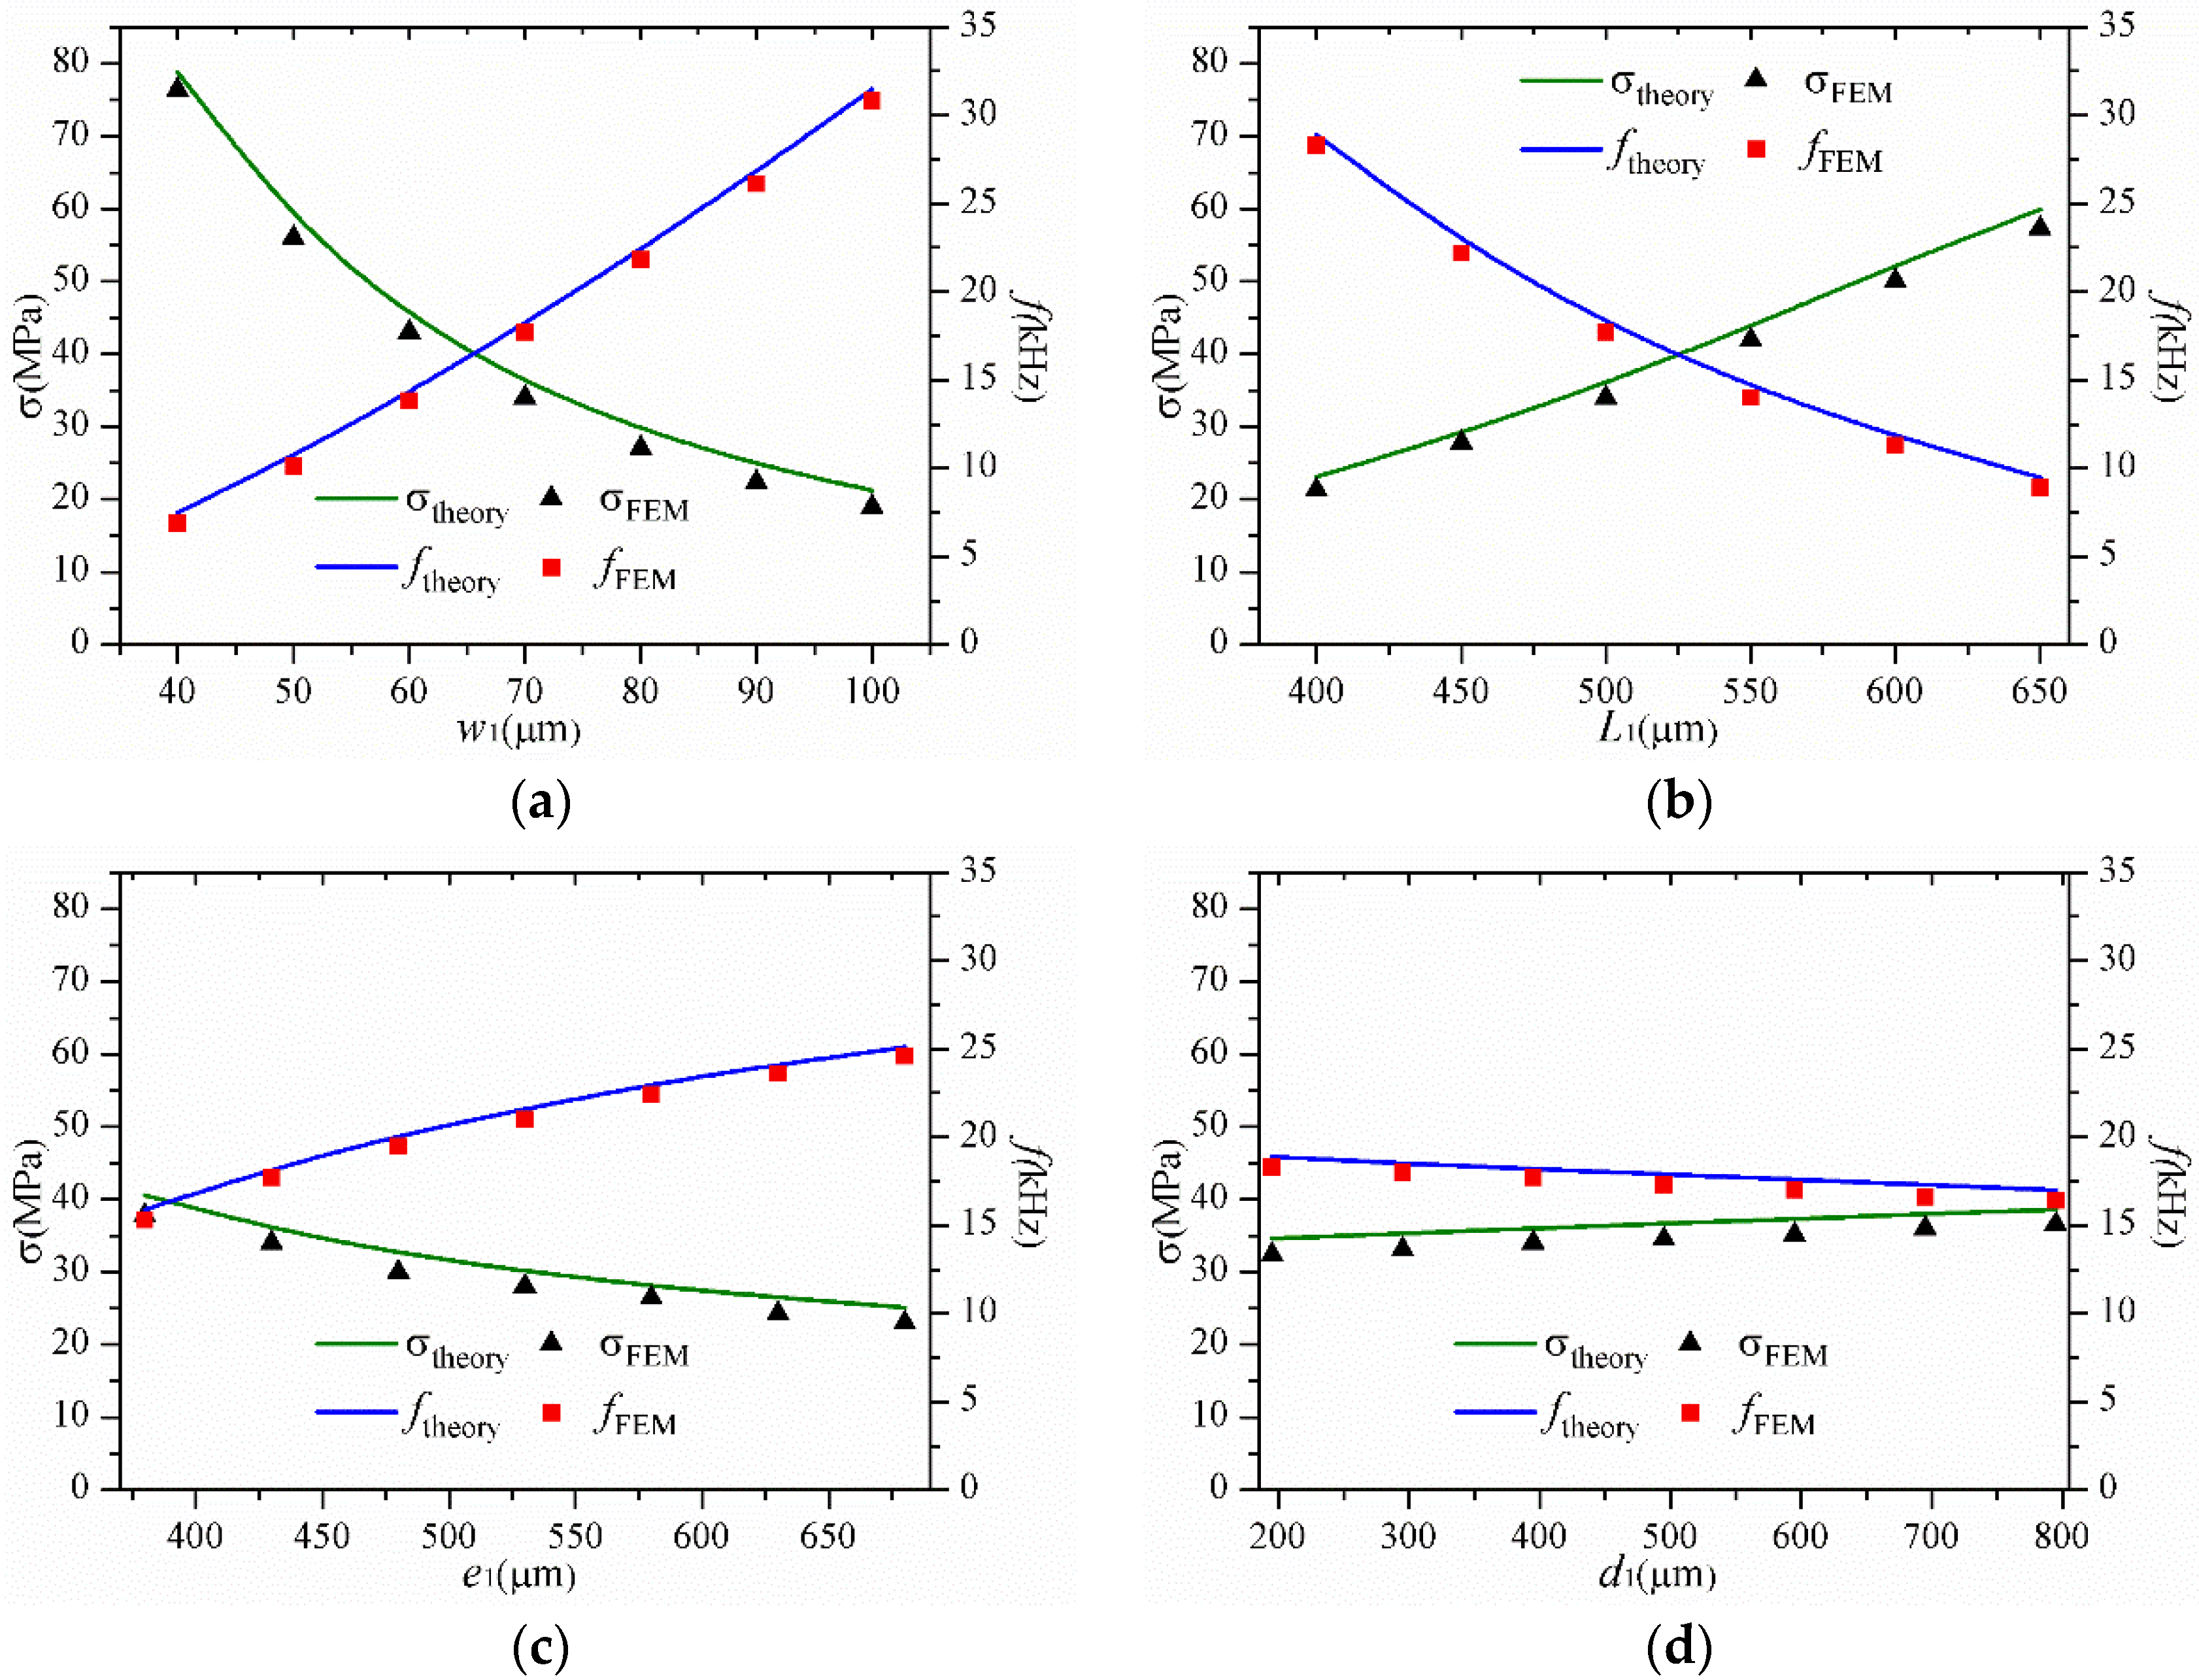
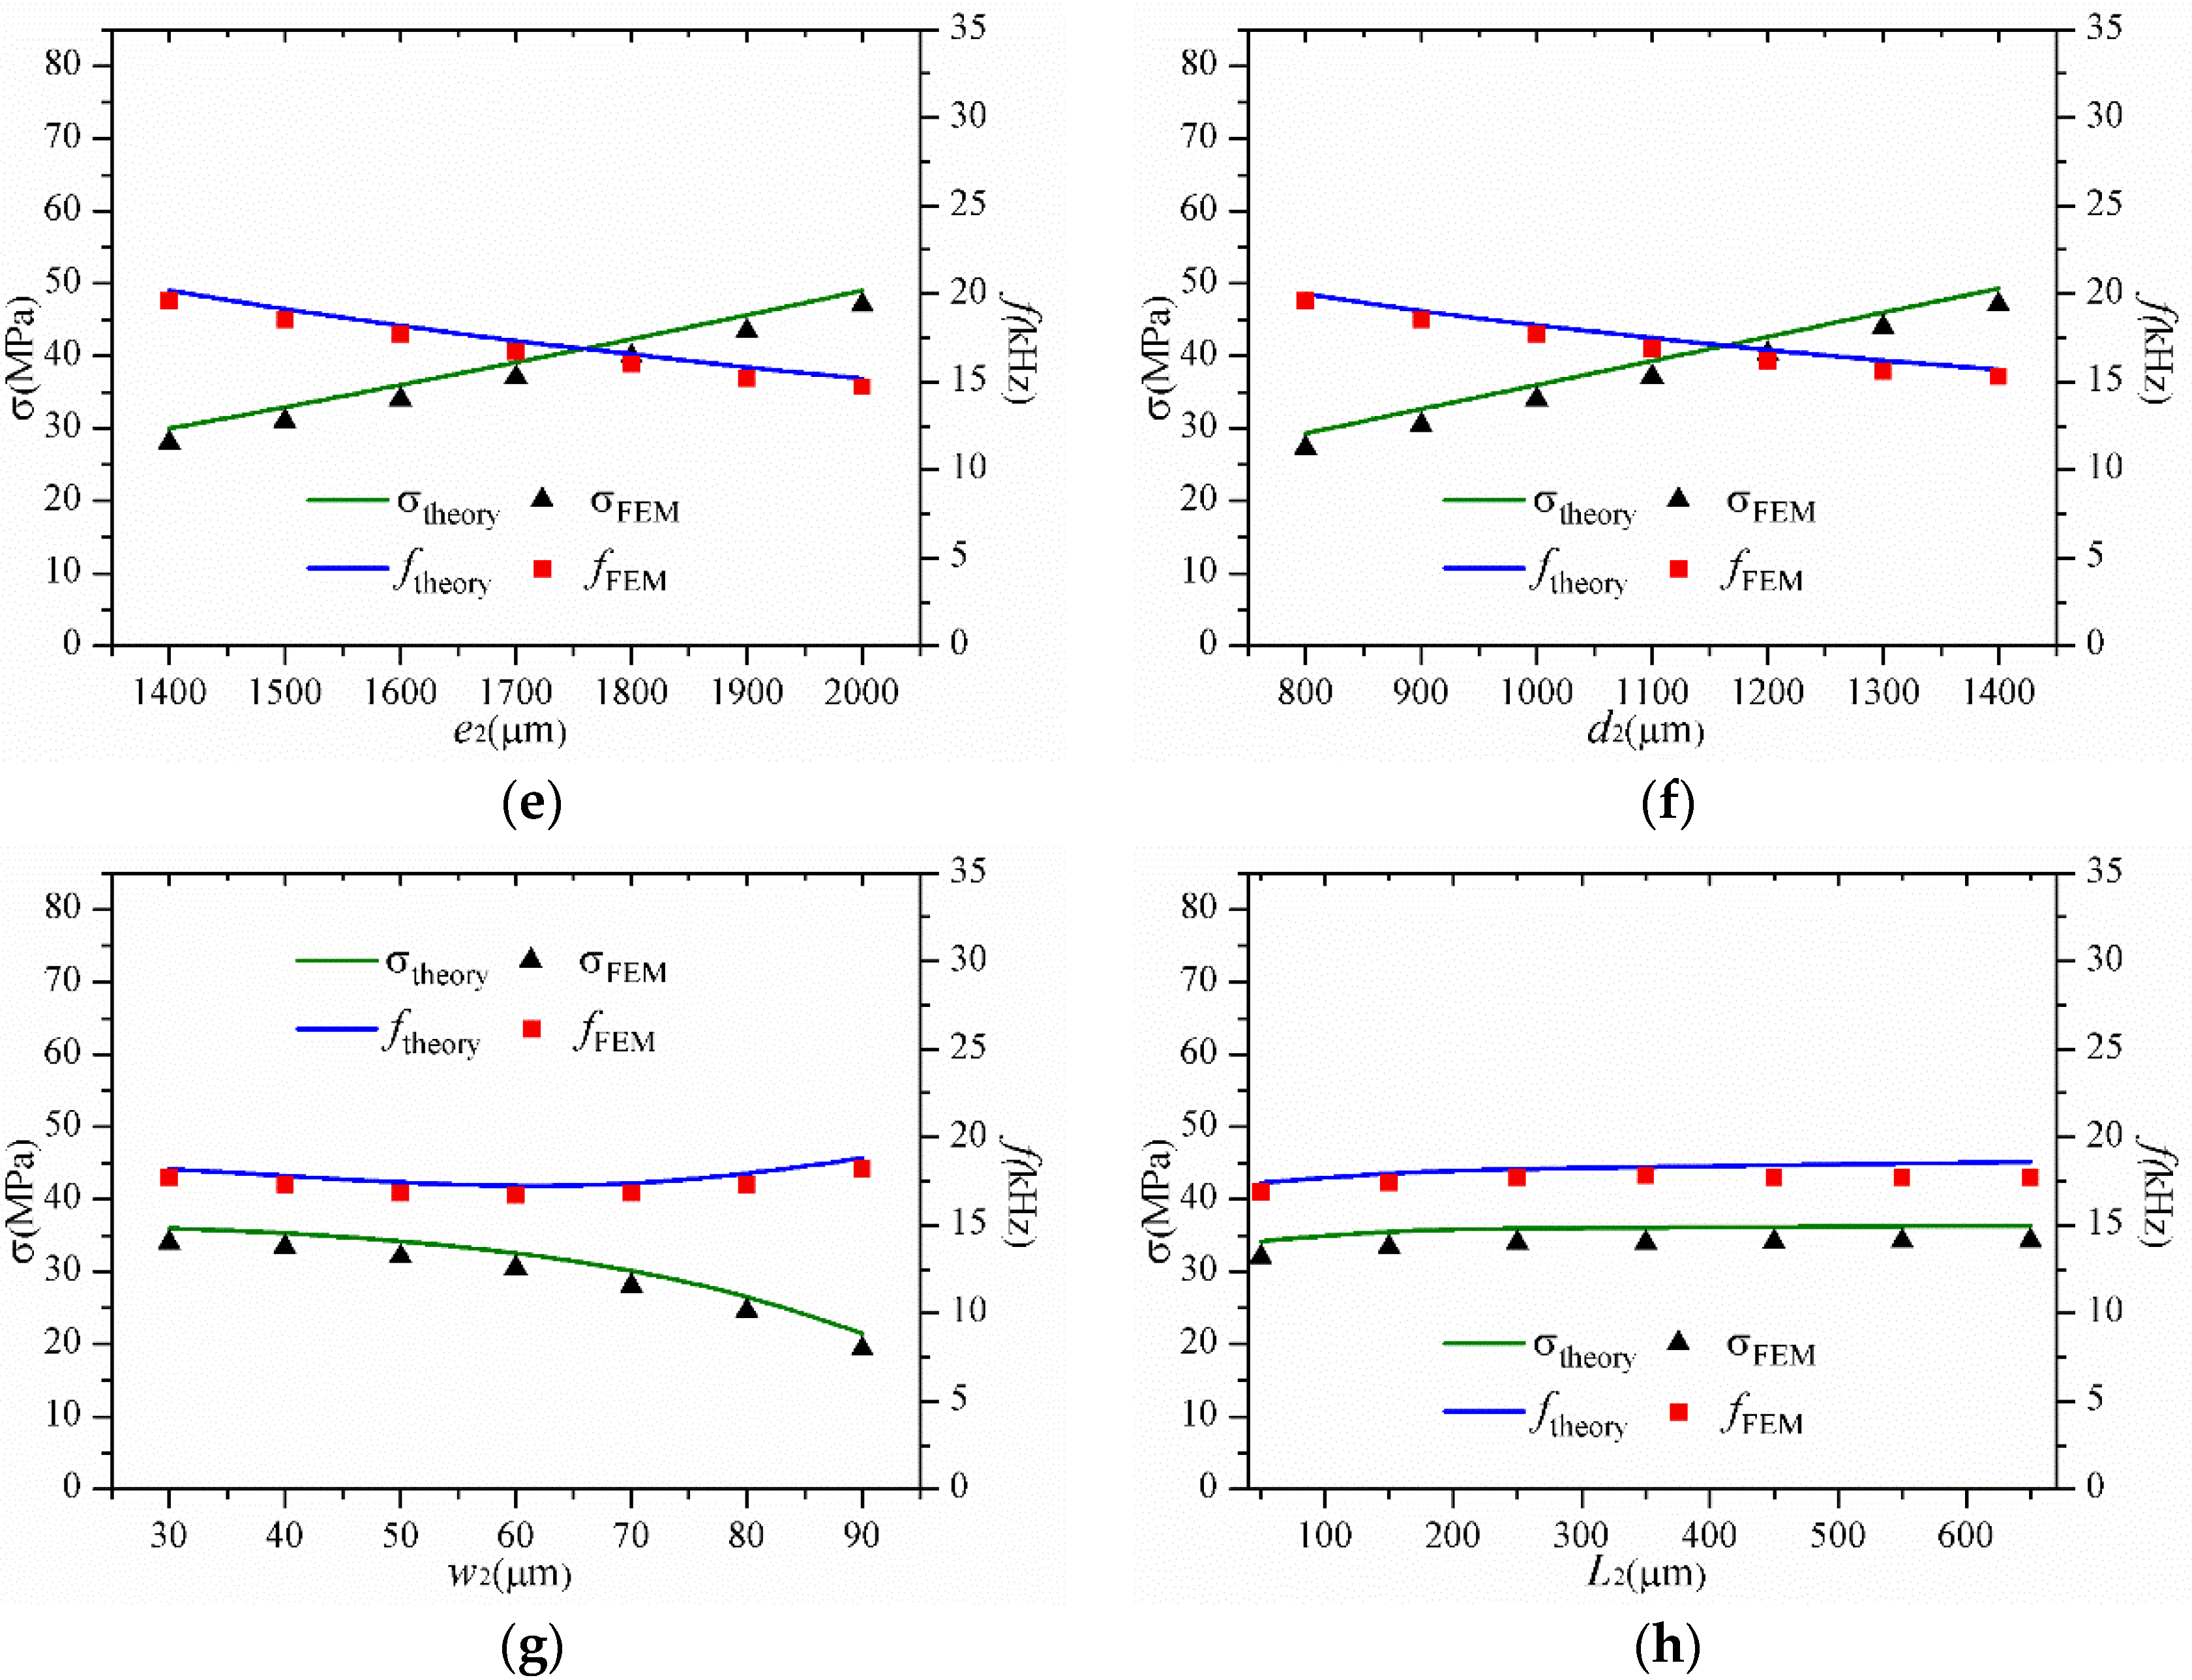
3.2. The Effects of Various Geometrical Parameters on σ and f
| w1 | L1 | e1 | d1 | e2 | d2 | w2 | L2 | |
|---|---|---|---|---|---|---|---|---|
| Maximum relative error of σ | 10.3% | 7.1% | 8.3% | 6.3% | 6.7% | 6.8% | 9.4% | 6.4% |
| Max relative error of f | 8.0% | 6.2% | 3.7% | 3.5% | 3.2% | 2.6% | 2.9% | 2.8% |
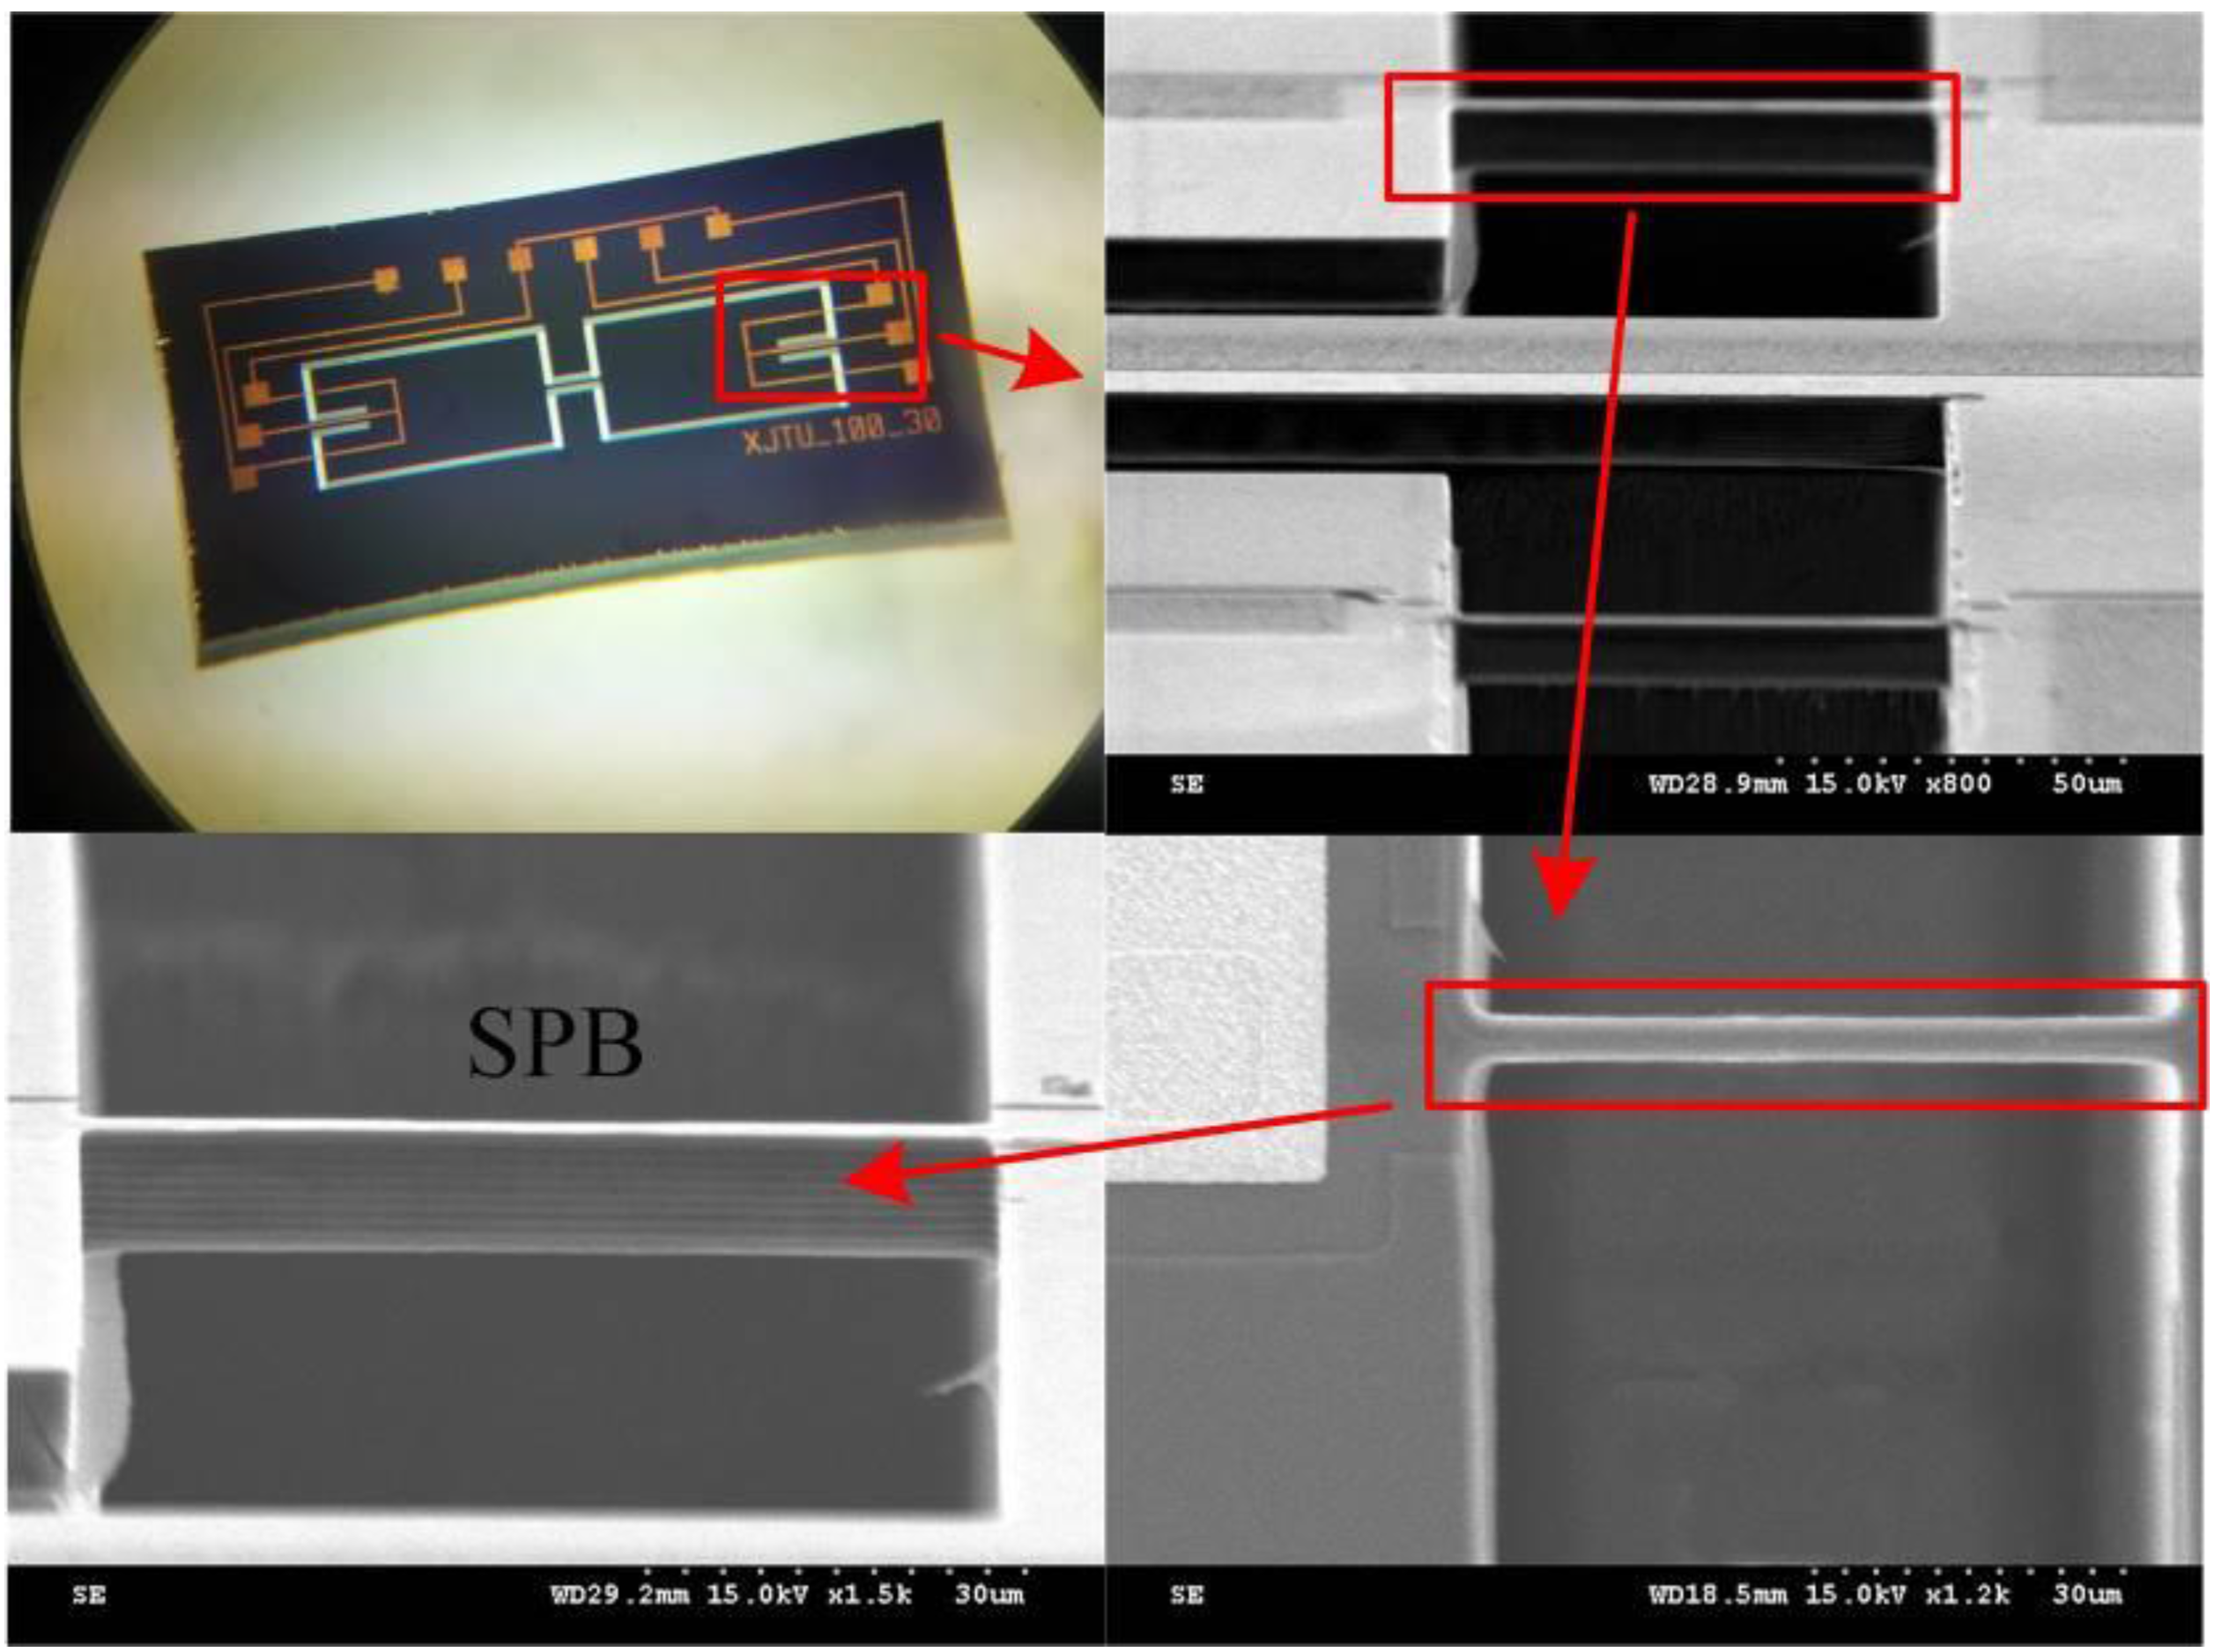
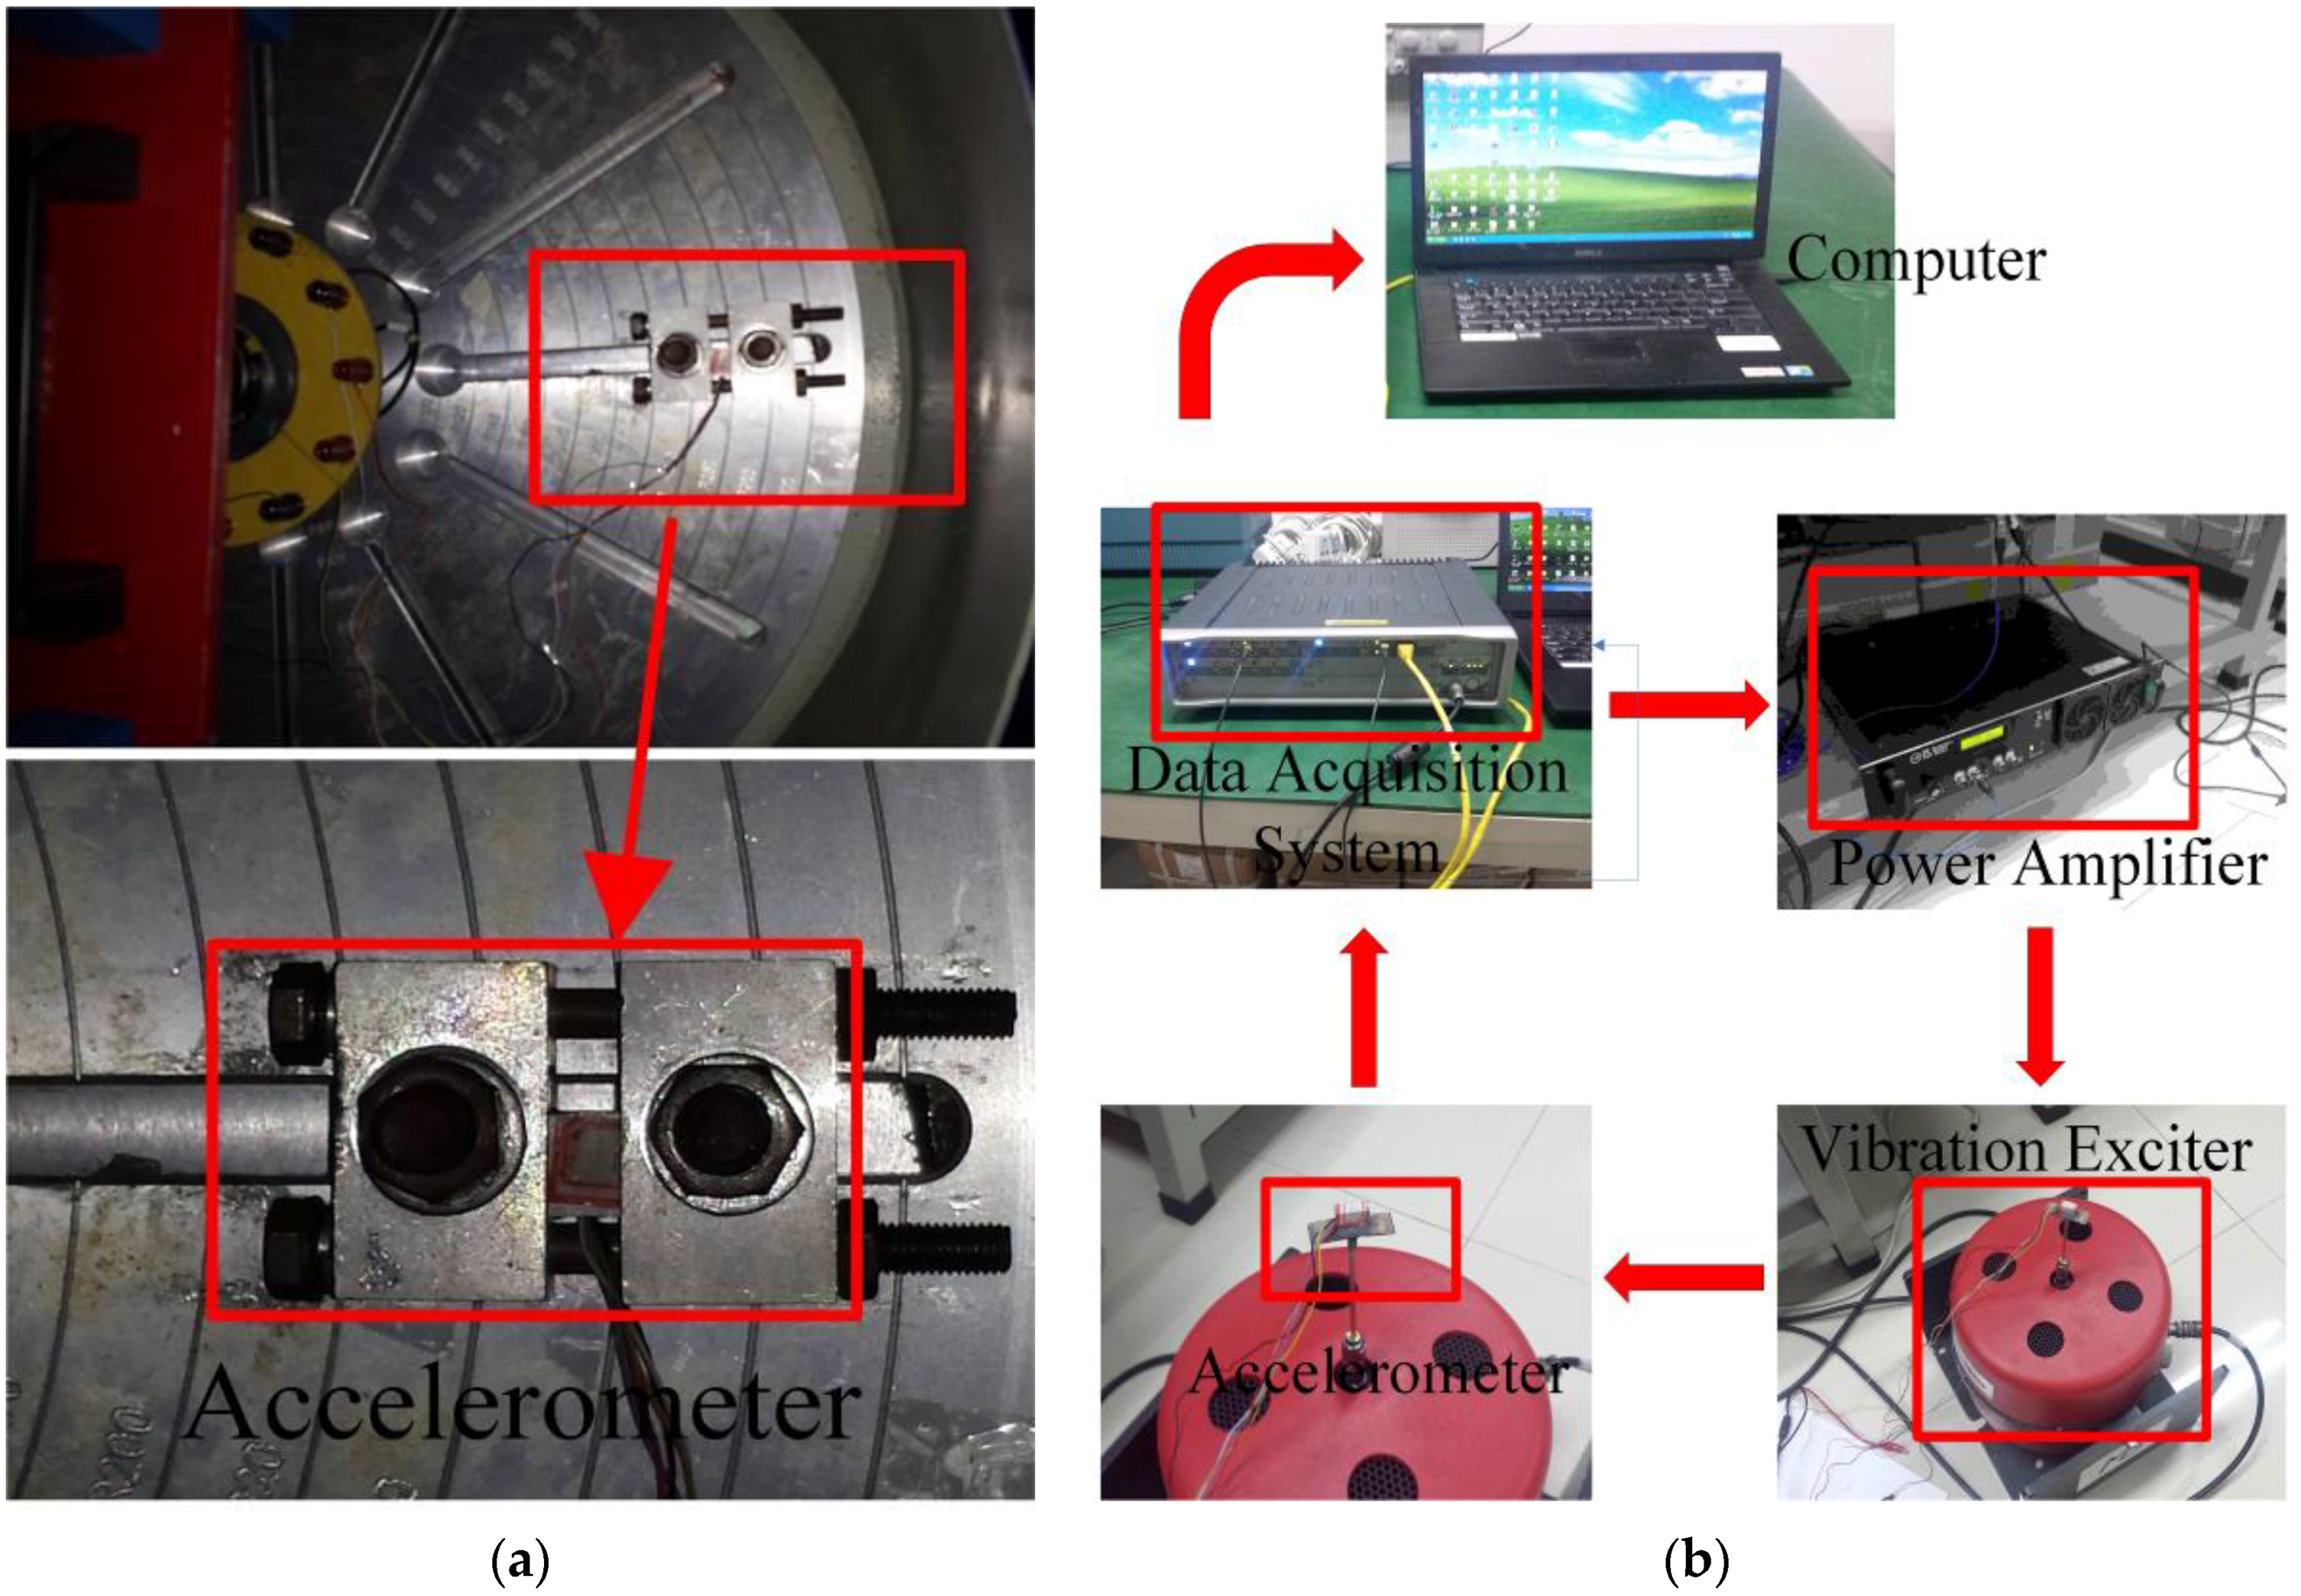
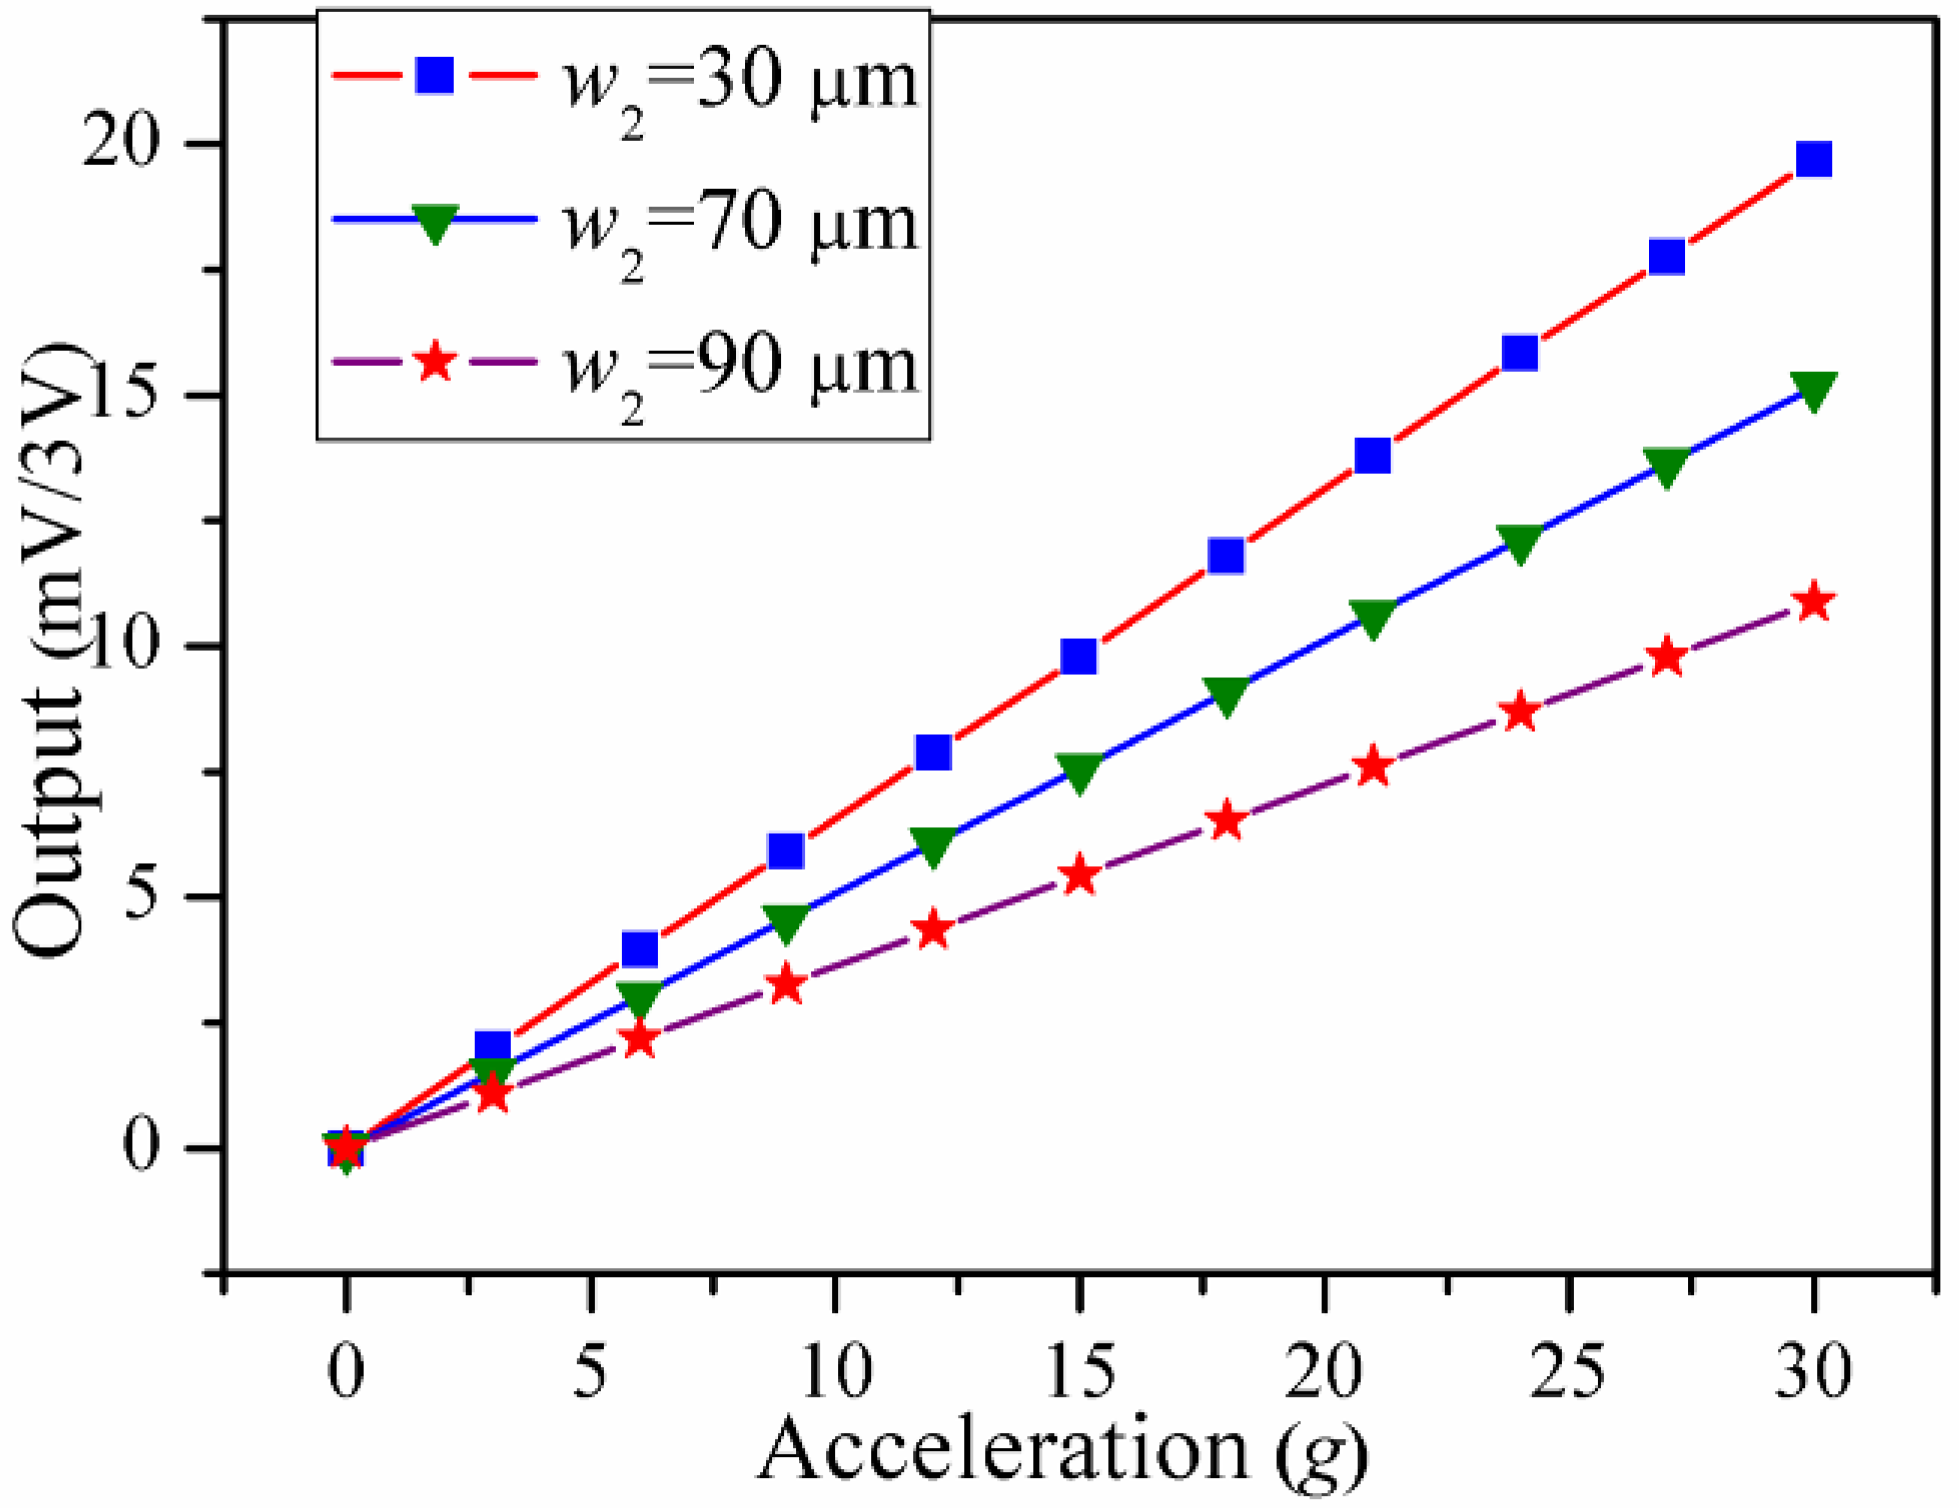
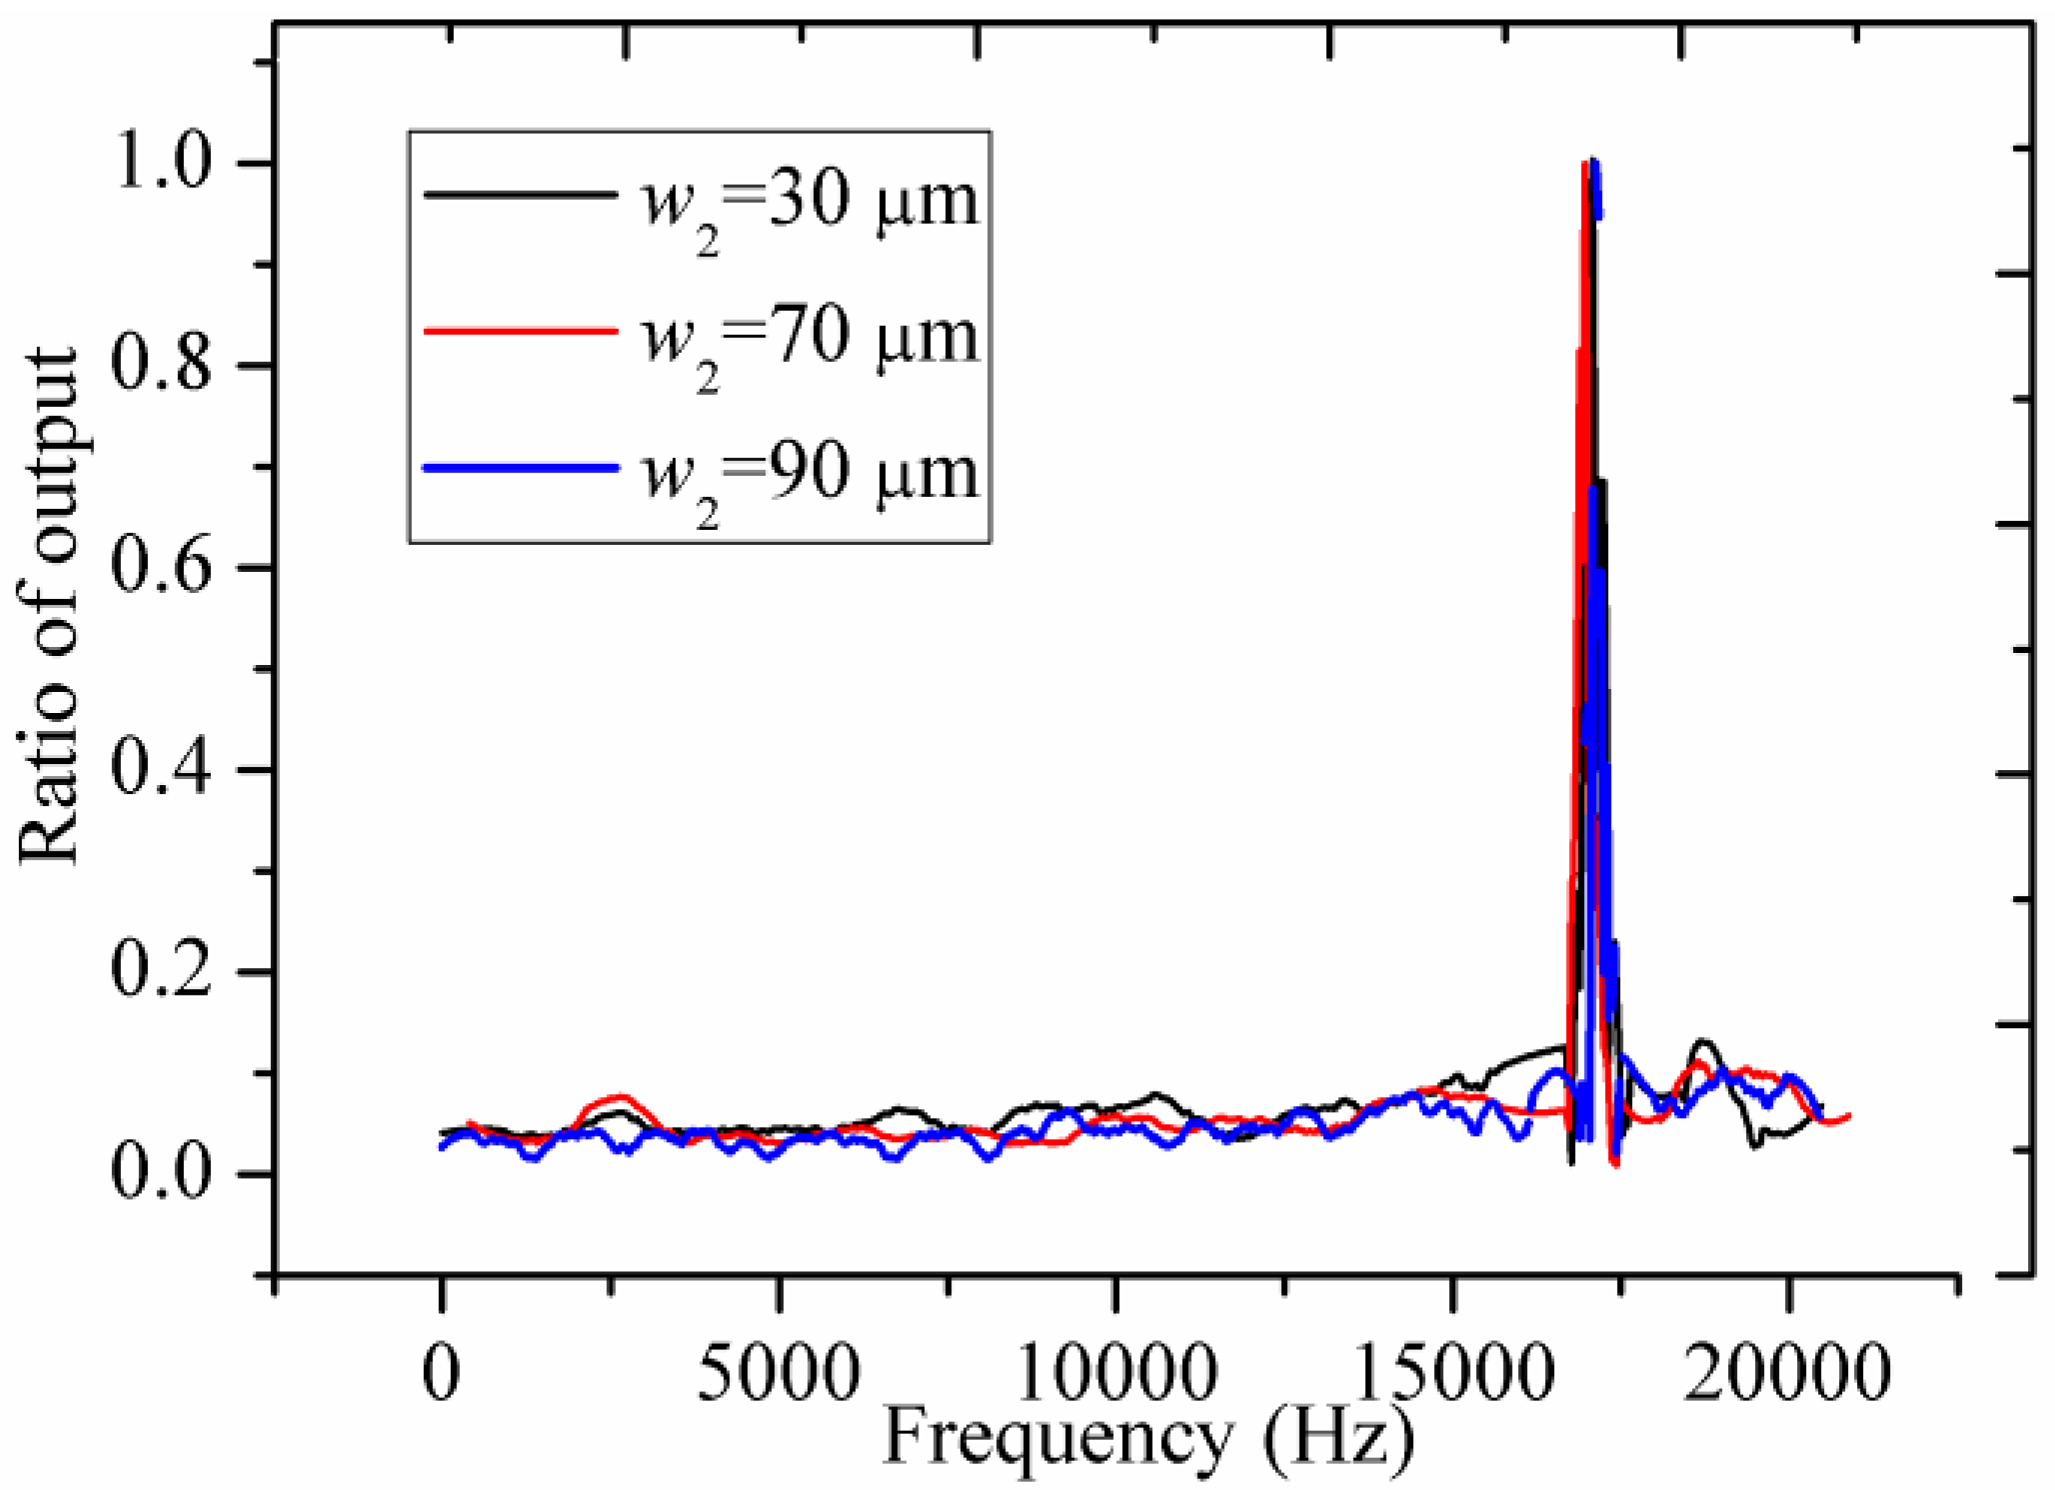
4. Results
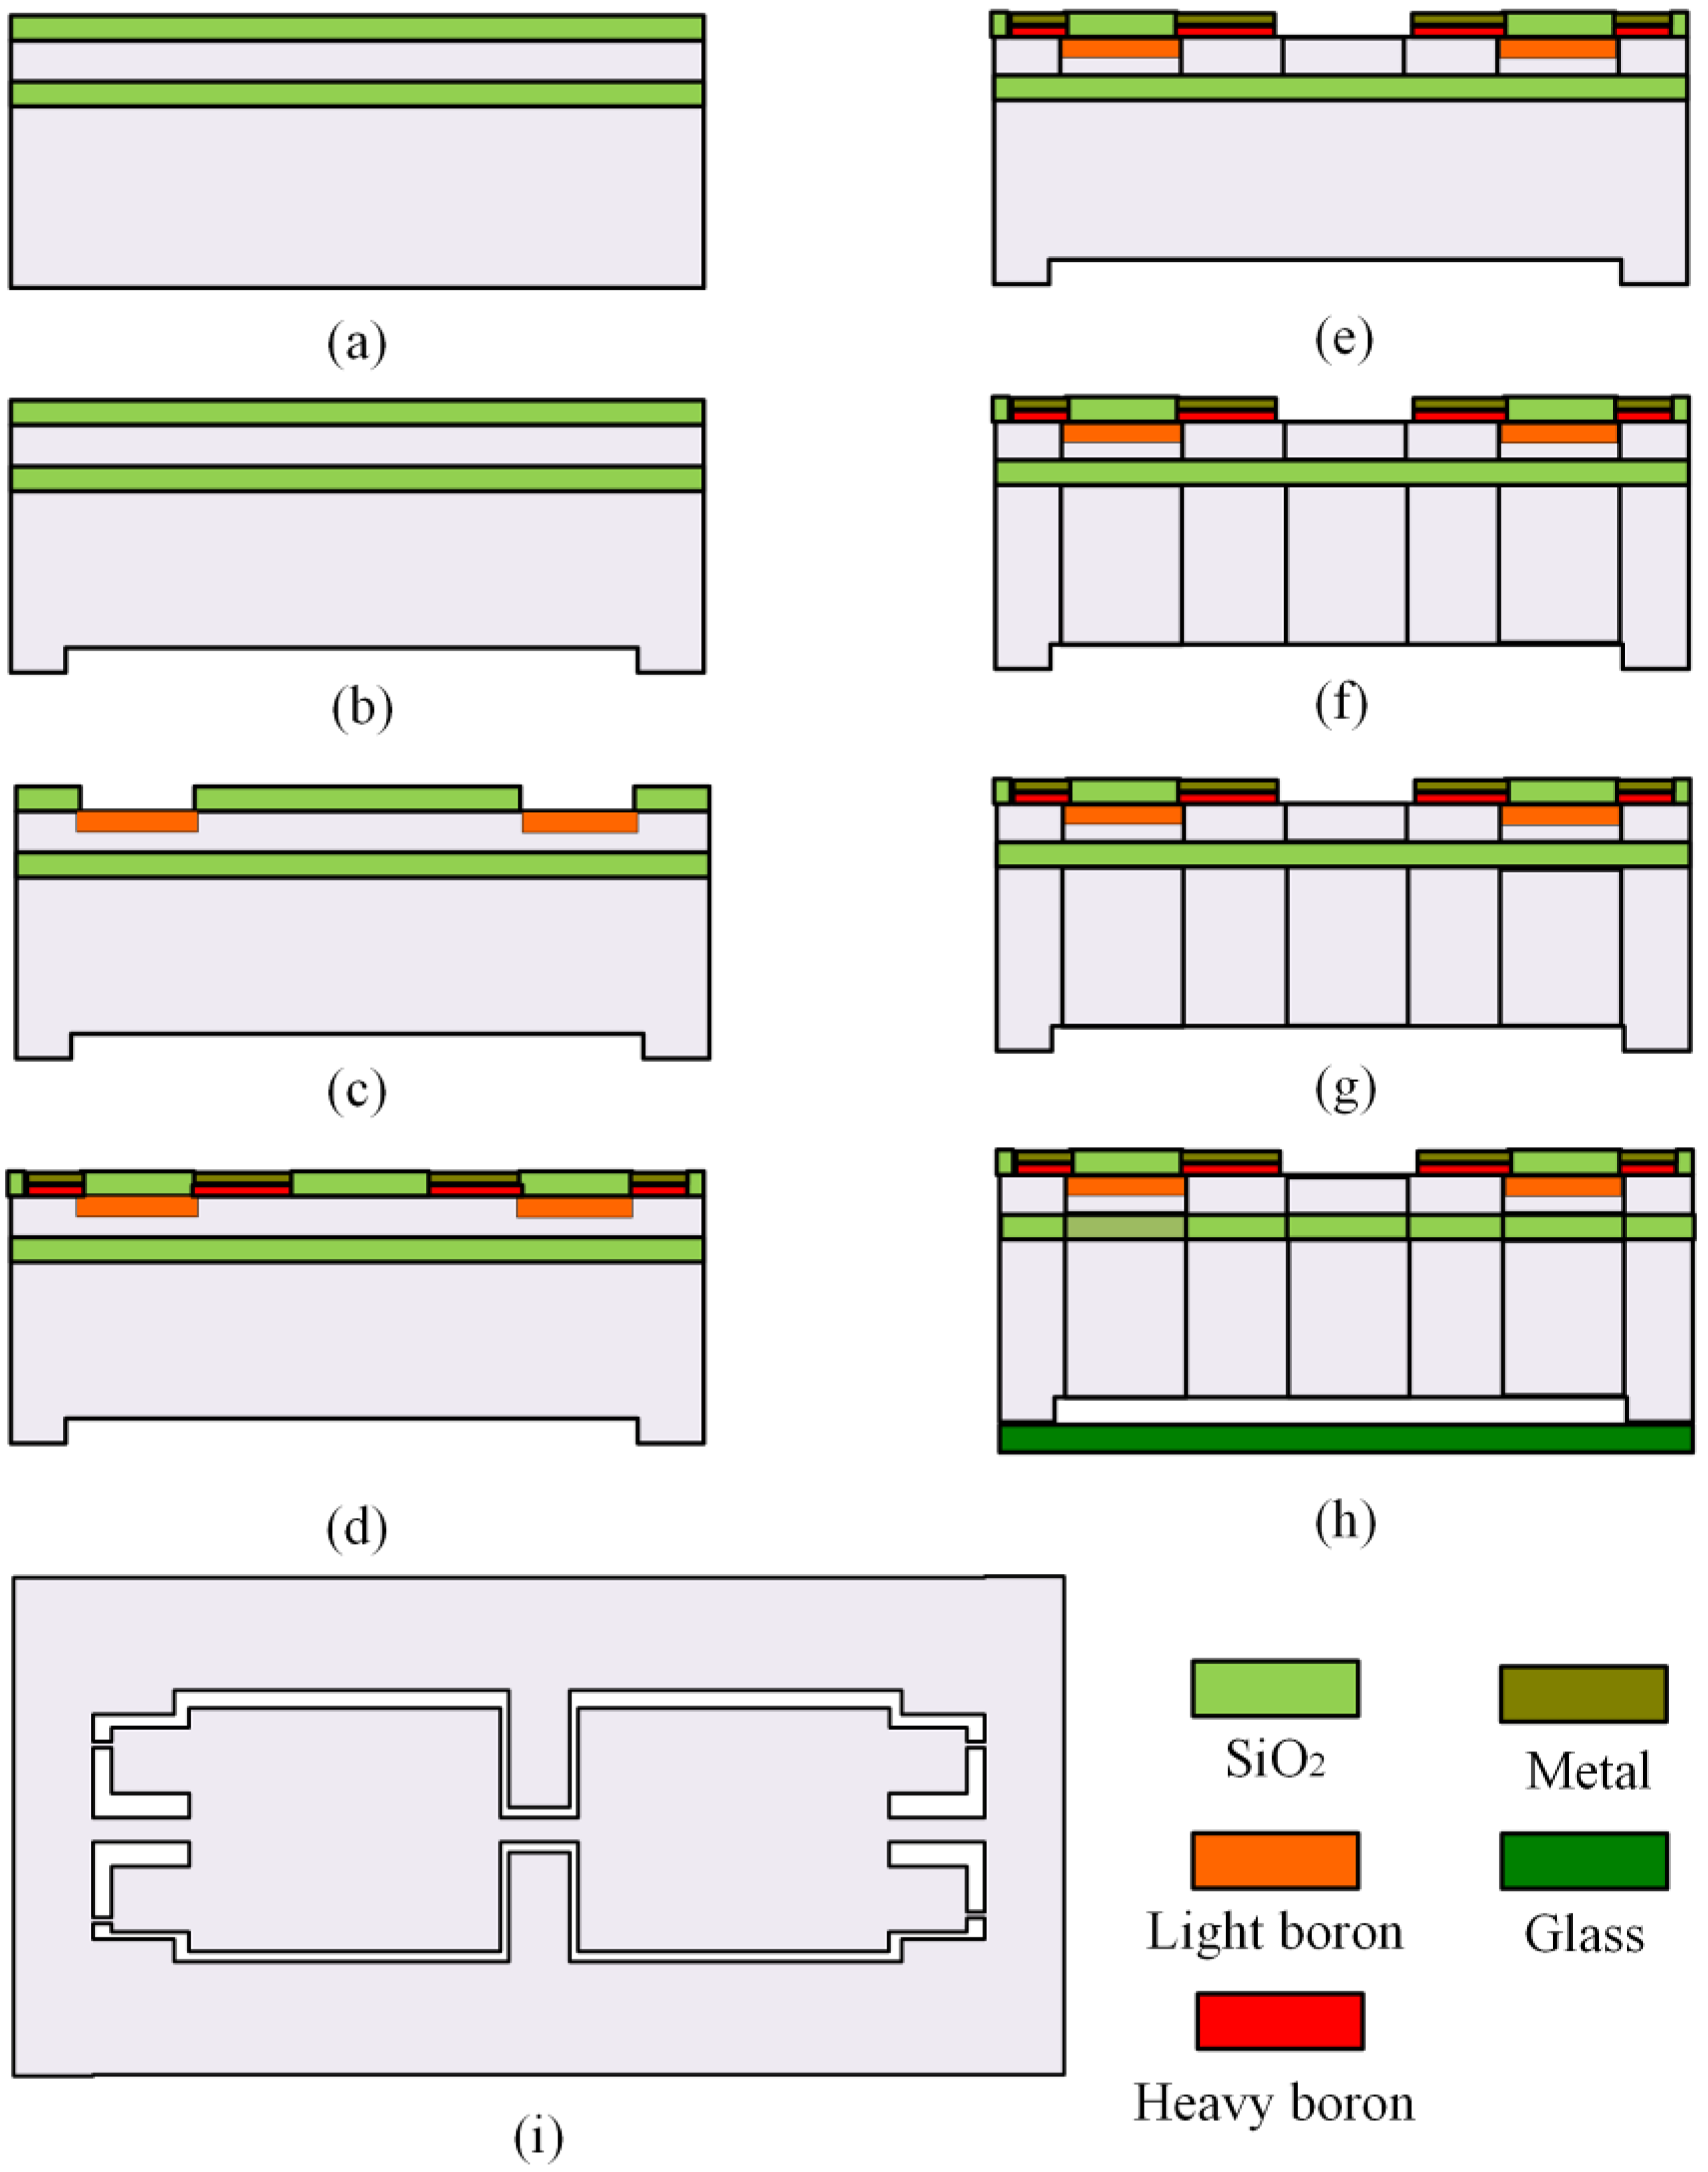
| Gas Flow (sccm) | RF Power (W) | Working Pressure (Pa) | Etching Rate (μm/min) | |
|---|---|---|---|---|
| RIE | SF6:20 | 20 | 8 | 0.4 |
| DRIE | SF6:130 O2:13 C4F8:85 | Source power:1000 Bias power:20 | 5.7 | 4 |
| w2 = 30 μm | w2 = 70 μm | w2 = 90 μm | |
|---|---|---|---|
| Measuring sensitivity (mV/g/3V) | 0.666 | 0.505 | 0.363 |
| Resonant frequency (kHz) | 17.1 | 16.9 | 17.2 |
5. Discussion

6. Conclusions
Acknowledgments
Author Contributions
Conflicts of Interest
References
- Bao, M.-H. Micro Mechanical Transducers: Pressure Sensors, Accelerometers and Gyroscopes; Elsevier: Amsterdam, The Netherlands, 2000; Volume 3, pp. 247–250. [Google Scholar]
- Mukhiya, R.; Gopal, R.; Pant, B.D.; Khanna, V.K.; Bhattacharyya, T.K. Design, modeling and fem-based simulations of a 1-dof mems bulk micromachined piezoresistive accelerometer. Microsyst. Technol. 2014, 21, 2241–2258. [Google Scholar] [CrossRef]
- Kraft, M. Micromachined inertial sensors: State-of-the-art and a look into the future. Meas. Control 2000, 33, 164–168. [Google Scholar] [CrossRef]
- Kobayashi, T.; Okada, H.; Masuda, T.; Maeda, R.; Itoh, T. A digital output accelerometer using mems-based piezoelectric accelerometer connected to parallel CMOS circuit. Procedia Eng. 2010, 5, 1071–1074. [Google Scholar] [CrossRef]
- Zheng, Q.; Xu, Y. Asymmetric air-spaced cantilevers for vibration energy harvesting. Smart Mater. Struct. 2008, 17, 6777–6790. [Google Scholar] [CrossRef]
- Kovács, Á.; Vı́Zváry, Z. Structural parameter sensitivity analysis of cantilever and bridge-type accelerometers. Sens. Actuators A Phys. 2001, 89, 197–205. [Google Scholar] [CrossRef]
- Nemirovsky, Y.; Nemirovsky, A.; Muralt, P.; Setter, N. Design of novel thin-film piezoelectric accelerometer. Sens. Actuators A Phys. 1996, 56, 239–249. [Google Scholar] [CrossRef]
- Han, G.Y.; Zou, L.; Deng, K.; Wolf, R.; Tadigadapa, S.; Trolier-Mckinstry, S. Lead zirconate titanate MEMS accelerometer using interdigitated electrodes. Sens. Actuators A Phys. 2003, 107, 26–35. [Google Scholar]
- Roylance, L.M.; Angell, J.B. A batch-fabricated silicon accelerometer. IEEE Trans. Electron Dev. 1980, 26, 1911–1917. [Google Scholar] [CrossRef]
- Wei, C.; Zhou, W.; Wang, Q.; Xia, X.; Li, X. Tpms (tire-pressure monitoring system) sensors: Monolithic integration of surface-micromachined piezoresistive pressure sensor and self-testable accelerometer. Microelectron. Eng. 2012, 91, 167–173. [Google Scholar] [CrossRef]
- Zhao, Y.; Sun, L.; Liu, Y.; Wang, W.; Tian, B. Incorporation of the stress concentration slots into the flexures for a high-performance microaccelerometer. Rev. Sci. Instrum. 2012, 83. [Google Scholar] [CrossRef] [PubMed]
- Sankar, A.R.; Das, S.; Lahiri, S.K. Cross-axis sensitivity reduction of a silicon MEMS piezoresistive accelerometer. Microsyst. Technol. 2009, 15, 511–518. [Google Scholar] [CrossRef]
- Liu, J.; Shi, Y.; Li, P.; Tang, J.; Zhao, R.; Zhang, H. Experimental study on the package of high-g accelerometer. Sens. Actuators A Phys. 2012, 173, 1–8. [Google Scholar] [CrossRef]
- Farahani, H.; Mills, J.K.; Cleghorn, W.L. Design, fabrication and analysis of micromachined high sensitivity and 0% cross-axis sensitivity capacitive accelerometers. Microsyst. Technol. 2009, 15, 1815–1826. [Google Scholar] [CrossRef]
- Yu, J.C.; Lee, C.; Kuo, W.; Chang, C. Modeling analysis of a triaxial microaccelerometer with piezoelectric thin-film sensing using energy method. Microsyst. Technol. 2011, 17, 483–493. [Google Scholar] [CrossRef]
- Zhou, X.; Che, L.; Liang, S.; Lin, Y.; Li, X.; Wang, Y. Design and fabrication of a MEMS capacitive accelerometer with fully symmetrical double-sided h-shaped beam structure. Microelectron. Eng. 2015, 131, 51–57. [Google Scholar] [CrossRef]
- Mehran, M.; Mohajerzadeh, S. High sensitivity nanostructure incorporated interdigital silicon based capacitive accelerometer. Microelectr. J. 2015, 46, 166–173. [Google Scholar] [CrossRef]
- Toriyama, T.; Tanimoto, Y.; Sugiyama, S. Single crystal silicon nano-wire piezoresistors for mechanical sensors. J. Microelectromech. Syst. 2002, 11, 605–611. [Google Scholar] [CrossRef]
- Dao, D.V.; Toriyama, T.; Sugiyama, S. Noise and frequency analyses of a miniaturized 3-dof accelerometer utilizing silicon nanowire piezoresistors. In Proceedings of the 2004 IEEE Sensors, Vienna, Austria, 24–27 October 2004; pp. 1464–1467.
- Amarasinghe, R.; Dao, D.V.; Toriyama, T.; Sugiyama, S. Development of miniaturized 6-axis accelerometer utilizing piezoresistive sensing elements. Sens. Actuators A Phys. 2007, 134, 310–320. [Google Scholar] [CrossRef]
- Roy, A.L.; Bhattacharyya, T.K. Design, fabrication and characterization of high performance SOI MEMS piezoresistive accelerometers. Microsyst. Technol. 2013, 21, 55–63. [Google Scholar] [CrossRef]
- Perez, M.; Eklund, E.J.; Shkel, A.M. Designing micromachined accelerometers with interferometric detection. In Proceedings of the 2005 IEEE Sensors, Irvine, CA, USA, 30 October–3 November 2005; pp. 652–655.
- Khir, M.H.M.; Peng, Q.; Hongwei, Q. A low-cost COMS-MEMS piezoresistive accelerometer with large proof mass. Sensors 2011, 11, 7892–7907. [Google Scholar] [CrossRef] [PubMed]
- Wang, J.; Li, X. A high-performance dual-cantilever high-shock accelerometer single-sided micromachined in (111) silicon wafers. J. Microelectromech. Syst. 2011, 19, 1515–1520. [Google Scholar] [CrossRef]
- Wung, T.S.; Ning, Y.T.; Chang, K.H.; Tang, S.; Tsai, Y.X. Vertical-plate-type microaccelerometer with high linearity and lowcross-axis sensitivity. Sens. Actuators A Phys. 2015, 222, 284–292. [Google Scholar] [CrossRef]
- Lim, M.K.; Du, H.; Su, C.; Jin, W.L. A micromachined piezoresistive accelerometer with high sensitivity: Design and modelling. Microelectron. Eng. 1999, 49, 263–272. [Google Scholar] [CrossRef]
- Huang, S.; Li, X.; Song, Z.; Wang, Y.; Yang, H.; Che, L.; Jiao, J. A high-performance micromachined piezoresistive accelerometer with axially stressed tiny beams. J. Micromech. Microeng. 2005, 15, 993–1000. [Google Scholar] [CrossRef]
- Dong, P.; Li, X.; Yang, H.; Bao, H.; Zhou, W.; Li, S.; Feng, S. High-performance monolithic triaxial piezoresistive shock accelerometers. Sens. Actuators A Phys. 2008, 141, 339–346. [Google Scholar] [CrossRef]
- Kuells, R.; Nau, S.; Salk, M.; Thoma, K. Novel piezoresistive high-g accelerometer geometry with very high sensitivity-bandwidth product. Sens. Actuators A Phys. 2012, 182, 41–48. [Google Scholar] [CrossRef]
- Seidel, H.; Csepregi, L. Design optimization for cantilever-type accelerometers. Sens. Actuators A Phys. 1984, 6, 81–92. [Google Scholar] [CrossRef]
© 2016 by the authors; licensee MDPI, Basel, Switzerland. This article is an open access article distributed under the terms and conditions of the Creative Commons by Attribution (CC-BY) license (http://creativecommons.org/licenses/by/4.0/).
Share and Cite
Xu, Y.; Zhao, L.; Jiang, Z.; Ding, J.; Peng, N.; Zhao, Y. A Novel Piezoresistive Accelerometer with SPBs to Improve the Tradeoff between the Sensitivity and the Resonant Frequency. Sensors 2016, 16, 210. https://doi.org/10.3390/s16020210
Xu Y, Zhao L, Jiang Z, Ding J, Peng N, Zhao Y. A Novel Piezoresistive Accelerometer with SPBs to Improve the Tradeoff between the Sensitivity and the Resonant Frequency. Sensors. 2016; 16(2):210. https://doi.org/10.3390/s16020210
Chicago/Turabian StyleXu, Yu, Libo Zhao, Zhuangde Jiang, Jianjun Ding, Niancai Peng, and Yulong Zhao. 2016. "A Novel Piezoresistive Accelerometer with SPBs to Improve the Tradeoff between the Sensitivity and the Resonant Frequency" Sensors 16, no. 2: 210. https://doi.org/10.3390/s16020210
APA StyleXu, Y., Zhao, L., Jiang, Z., Ding, J., Peng, N., & Zhao, Y. (2016). A Novel Piezoresistive Accelerometer with SPBs to Improve the Tradeoff between the Sensitivity and the Resonant Frequency. Sensors, 16(2), 210. https://doi.org/10.3390/s16020210