Article

Multi-Axis Force/Torque Sensor Based on Simply-Supported Beam and Optoelectronics

1
Department of Informatics, King’s College London, London WC2R 2LS, UK
2
Department of Biomedical Engineering, King’s College London, London SE1 7EH, UK
3
Instituto Italiano di Tecnologia (IIT), Genova 16163, Italy
4
Department of Aeronautics, Imperial College London, London SW7 2AZ, UK
5
Department of Mechanical Engineering, University College London, London WC1E 7JE, UK
6
Industrial Research Institute for Automation and Measurements, Warsaw 02-486, Poland
7
Department of Mechanical Engineering, University of Moratuwa, Katubadda, Moratuwa 10400, Sri Lanka
8
ARQ—Advanced Robotics @ Queen Mary Faculty of Science and Engineering Queen Mary University of London, Mile End Rd, London E1 4NS, UK
*
Author to whom correspondence should be addressed.
Sensors 2016, 16(11), 1936; https://doi.org/10.3390/s16111936
Submission received: 28 July 2016 / Revised: 26 October 2016 / Accepted: 27 October 2016 / Published: 17 November 2016
(This article belongs to the Section Physical Sensors)

Abstract

:
This paper presents a multi-axis force/torque sensor based on simply-supported beam and optoelectronic technology. The sensor’s main advantages are: (1) Low power consumption; (2) low-level noise in comparison with conventional methods of force sensing (e.g., using strain gauges); (3) the ability to be embedded into different mechanical structures; (4) miniaturisation; (5) simple manufacture and customisation to fit a wide-range of robot systems; and (6) low-cost fabrication and assembly of sensor structure. For these reasons, the proposed multi-axis force/torque sensor can be used in a wide range of application areas including medical robotics, manufacturing, and areas involving human–robot interaction. This paper shows the application of our concept of a force/torque sensor to flexible continuum manipulators: A cylindrical MIS (Minimally Invasive Surgery) robot, and includes its design, fabrication, and evaluation tests.

1. Introduction

Robotic systems have developed considerably over the last ten years. New advances in actuators and materials allow the creation of more complex systems capable of conducting more advanced tasks than previously possible. Force and tactile sensing is one of the key research areas for robot systems, where such systems are required to characterise their interaction with the environment. With the ever-increasing demand to create robots that can safely interact with their environment, especially with humans, the need for robust, low-cost and miniature sensors is increasing too. It is well recognised that the acquisition of high-quality force and tactile sensor signals during a physical interaction between, say, a robot hand and an object being manipulated provides the opportunity to greatly improve the handling and manipulation capability of the robot system. Incorporating small-sized force/torque sensors in robot hands and arms has been shown to enhance obstacle avoidance, object grasping, in-hand manipulation and, generally, the meaningful interaction with the physical environment [1,2,3]. Current force measuring sensors show clear shortcomings due to their size, manufacturability, integration incompatibility, sensitivity, measurement range and/or lack of sufficient axes of measurement [4,5,6,7], with direct force measurements clearly outperforming approaches that use remote sensors to indirectly measure forces imparted on the robot structure.
The force sensing approach proposed in this paper attempts to provide a solution to this issue whilst keeping costs low and representing an enabling technology for a wide range of application areas including medical robotics, manufacturing, and areas involving human–robot interaction. The main contributions of the presented work are:
  • Integration of optoelectronic force sensors in a bespoke mechanical structure for the purpose of force/torque measurement;
  • A concept that lends itself to miniaturisation;
  • Simplified manufacturability and customisation to fit a wide-range of robot systems;
  • Low-cost fabrication and assembly of sensor structure; and
  • Good sensitivity and sensor range for a wide range of manipulation tasks.
A number of advanced robots have appeared recently in the research arena. Examples include dexterous, flexible snake-like manipulators that can potentially provide high dexterity and mobility in confined spaces that may not be easily achieved by traditional robotic systems [8,9,10,11,12]. However, most of these robots lack force-sensing capabilities—An aspect that becomes essential if one wants to operate a robot in an environment where physical interactions with surrounding objects are the norm. Hence, such robots cannot exploit their dexterity capabilities to the full, since interactions (collisions) with the environment remain largely undetected [13,14,15].
Using force sensors, robot hands can distinguish various kinds of tactile information including pressure and tangential forces, providing a sense of touch and enabling the equipped hands to perceive scratching, pricking, rubbing and the recognition of object shapes. The interpretation of the force sensor signals and, generally, the sense of touch have been extensively researched within the field of robotics [16,17,18,19].
One of the most advanced force/torque sensors is probably the six-axis sensor developed by DLR (German Aerospace Center) [20,21]. Despite its superior force/torque measurement capabilities, there are some shortcomings: (a) The sensor’s geometry cannot be easily adapted to a particular robot structure (because of the Stewart platform, which is the dominant feature of this sensor and cannot be altered without impacting on the measurement characteristics); (b) the sensor is relatively complex; and (c) expensive to manufacture (manually attachment of strain gauges on the sensor’s flexor beams). The superior measurement characteristics of the DLR force/torque sensor are acknowledged. Our paper is particularly interested in proposing a sensing concept that is low cost and can easily be integrated with a robotic structure—Hence, we do not see our sensor as a competitor to the DLR sensor with regards to measurement accuracy and sensitivity.
Another important and widely used force/torque sensor is the ATI Nano17 sensor (ATI Industrial Automation, Apex, NC, USA)—This sensor is often seen as an industry standard for torque/force sensors, because of its outstanding sensing capabilities with regards to accuracy, sensitivity and range [22]. However, the sensor comes in a predefined housing (circular, 17 mm diameter, 14 mm length) which cannot be modified, and as such is of limited usefulness when further miniaturisation and adaptation to robot structures are required, although some researchers have succeeded in integrating these sensors with robot hands for improved interaction sensing. For example, during EU project HANDLE (Developmental pathway towards autonomy and dexterity in robot in-hand manipulation), the fingertips of the Shadow Robot Hand were equipped with Nano17 sensors to measure force and tactile information during robot-object interaction [23]. Good real-time measurements along all six axes were achievable, but the robot hand’s fingertips needed to be adapted and integrating the Nano17 sensors meant increasing the size of the fingertips; also the comparatively high weight of the sensors impacted on the fingers’ inertia and required control adjustments. It is also noted that an ATI sensor is a relatively expensive item. In this paper, the ATI sensor is used for the calibration and evaluation of our sensor (see Section 3).
In general, most available force sensors are fabricated without the structure that they will be used on in mind. This complicates their integration with the intended structure. This becomes particularly problematic in cases where the robot structure is small, as is often the case with manipulation devices such as robot hands and robots used for minimally invasive surgery [4,5,24]. In such cases, having the capability of adapting the sensor geometry to the robot’s structure is essential. In some cases, there is additionally the need of extending the structural geometry of the robot at the point where the sensor is to be integrated. A number of robots or, in some cases, their links can be represented by hollow, cylindrical structures where the inner space is used to feed through auxiliary cables, tubes and/or tendons. Integrating a “conventional” sensor (which commonly does not provide empty space internally) is not possibly in such a case without significantly modifying the overall robot structure [13,14]. Here, our sensor concept excels because it provides the required design freedom to align the sensor structure with the robot structure. In our chosen example, where the force/torque sensor is to be integrated with the STIFF-FLOP (STIFFness controllable Flexible and Learn-able Manipulator for surgical OPerations) arm [25,26,27,28,29,30], the sensor structure is designed to be ring-shaped and, thus, easily integrated between robot segments, allowing multiple cables and tubes to be passed through (Figure 1, Figure 2 and Figure 3).
In general, our work aims at creating force/torque sensors that are most suitable for integration with a range of robot systems, particularly snake-like and highly redundant arms to measure the interaction of their individual links with the environment and robot hands to measure forces during grasping and manipulation events. Particular emphasis is on the creation of low-cost, easily manufacturable and integratable sensors for the real-time measurement of force and torque signals. With a particular interest in medical robotics, we will demonstrate the integration of our sensor with a continuum robot (the STIFF-FLOP arm), which is intended for use during minimally invasive surgery. Having such sensors integrated with these types of robots, we can provide physical interaction information such as force and tactile perception in surgical environments during an operation. Having this information readily available, compliant force control can be incorporated and used to move complex robot structures whilst preventing excessive forces from being applied to the clinical environment [31,32].
Although there are many methods to measure deformation to calculate external force/torque, for example by attaching polyvinylidene fluoride (PVDF) films [33], strain gauges [20], piezoresistive materials [34], or fibre bragg grating (FBG) [21,35] on the sensor structures, we are proposing light intensity-based measurement using optoelectric technology [36,37,38] and simply-supported beam (Figure 1 and Figure 2) [39]. Our proposed methods have advantages such as immunity to electrical noise, low power consumption, low-level noise, no need for electronic filtering, easy attachment into the sensor body, and low cost [40,41,42,43,44,45]. In addition, recent technological advances allow diminutive sized photo sensor (1.0 × 1.4 × 0.6 mm3) [46]. To calculate force/torque components, optoelectronic sensors are deployed along the circumference of the sensor structure and can measure three deflections (δ1, δ2 and δ3) (Figure 1, Figure 2 and Figure 4). This simplifies manufacturing, makes the overall sensor size miniaturised, and secures an ample space in the centre of the sensor structure. This is in contrast with conventional methods as mentioned above, so it is hard to secure an ample space in the centre of the sensor structure.
Furthermore, today’s 3D printing technologies allow low cost fabrication of miniaturised complex sensor structures in metal. Hence, the overall size of the sensors can be much smaller than commercially available force/torque sensors. In this paper, the detailed design and calibration of a proposed multi-axis force/torque sensor with a ring-like structure and hollow inner section providing ample space for auxiliary components is presented. Employing the STIFF-FLOP manipulator as an example, we show how our sensor can be customised to fit a particular robot structure. The sensor is calibrated and, hence, through an experimental study, we obtain and validate its calibration matrix. This study also evaluates various properties such as measurement error, repeatability, hysteresis and crosstalk.

2. Design Methods and Fabrication

This section will describe the design requirements, the configuration and the analysis for an optimized force/torque sensor, specifically for integration with the STIFF-FLOP robot arm design.

2.1. Design Requirements

The design of the force/torque sensor should satisfy the following requirements:
(1)
Be capable of measuring forces and moments in a range suitable for the application: In [47,48,49], the force applied by robotic surgical systems ranges from 0 to 21 N.
(2)
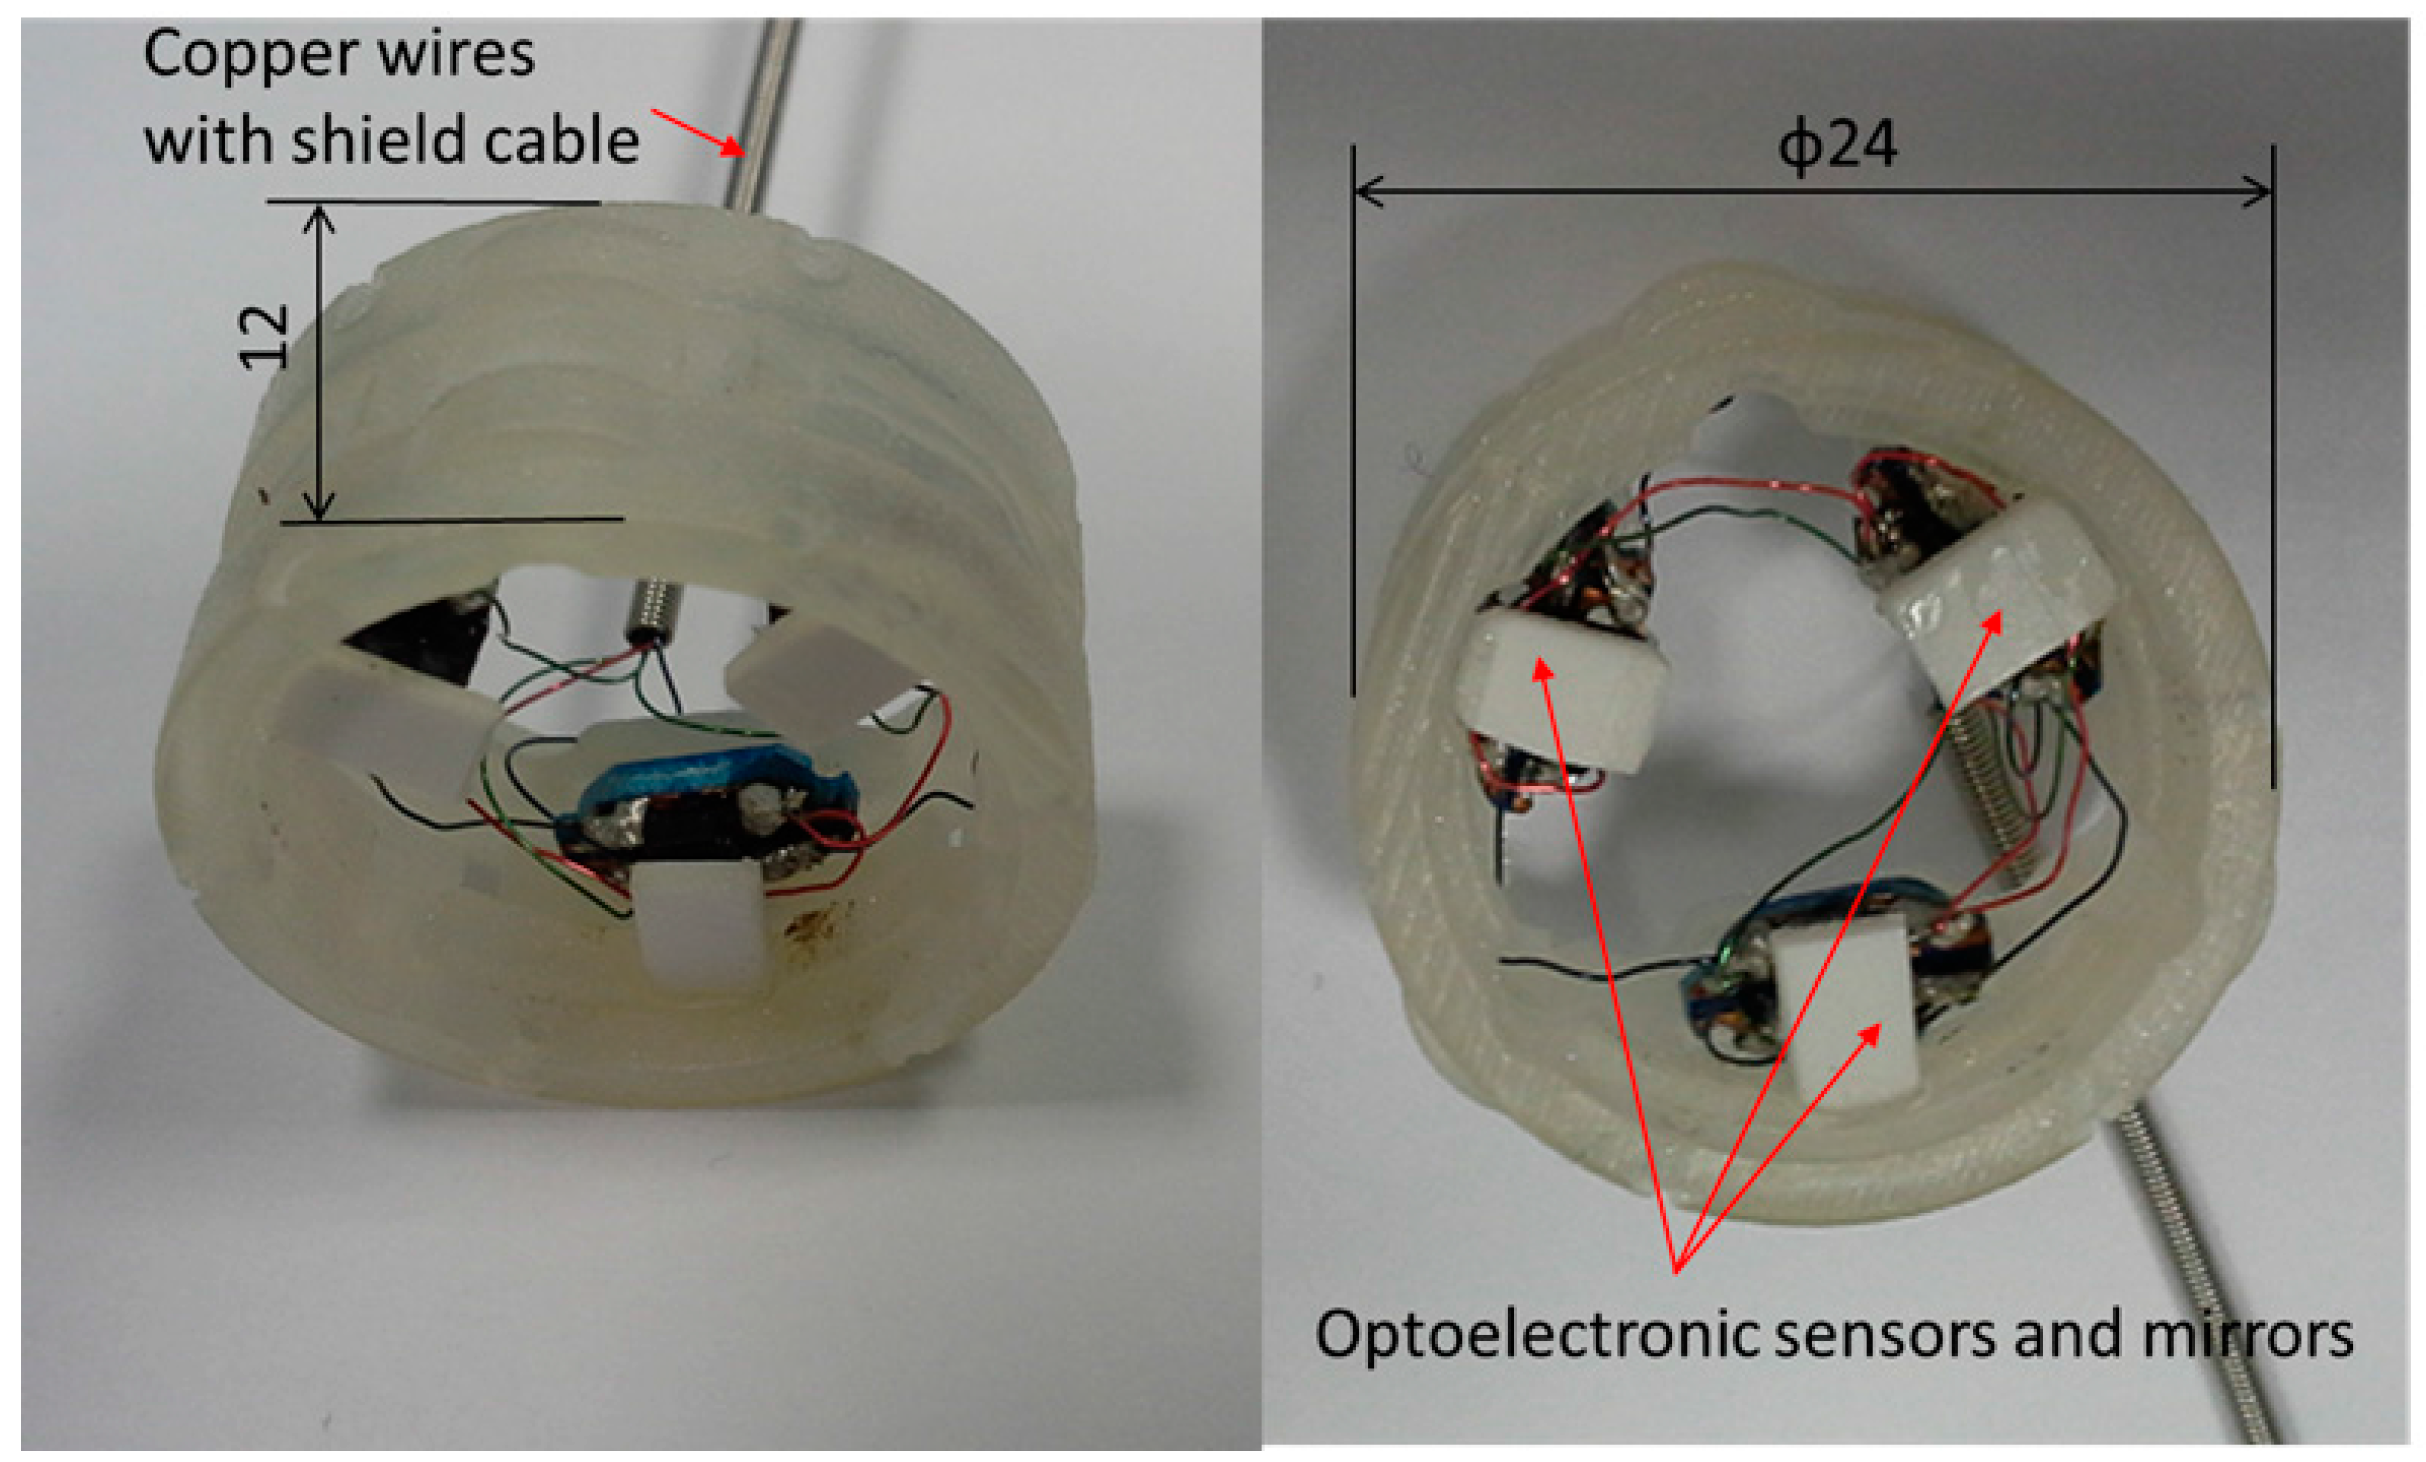
Be miniaturisable: The diameter of sensor structure should be less than 15 mm to be able to pass through the current commercialized trocars.
(3)
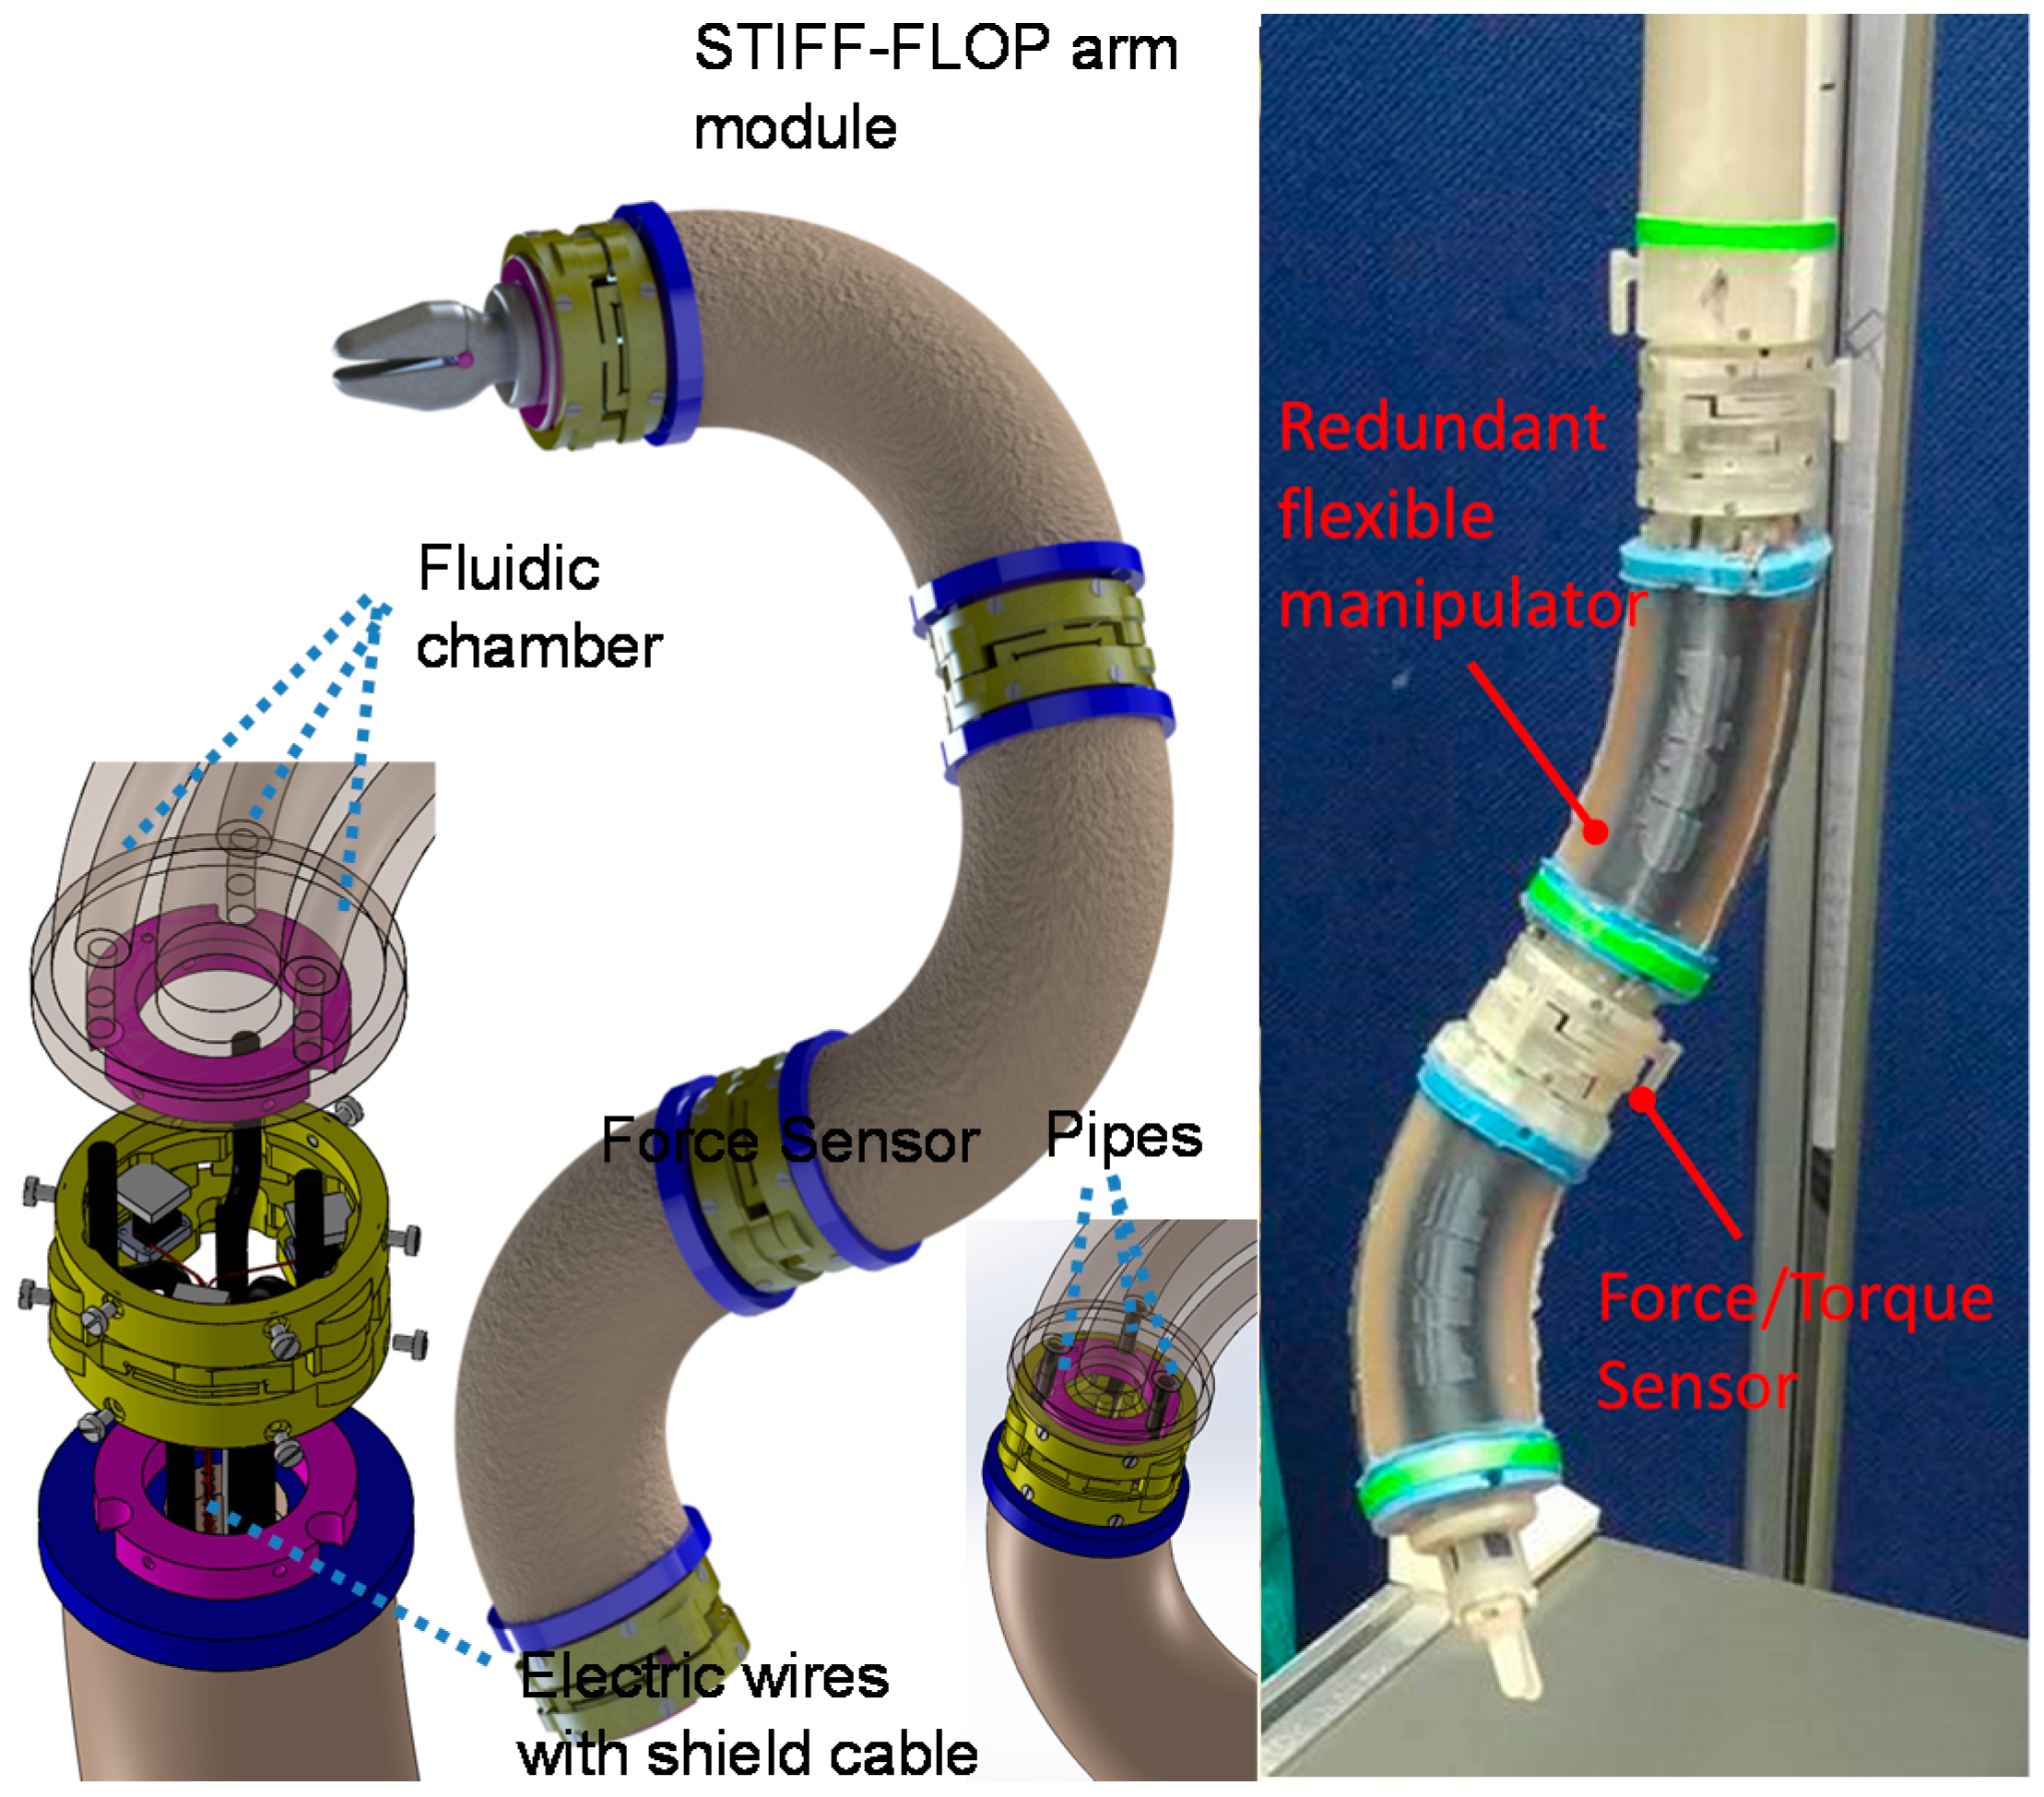
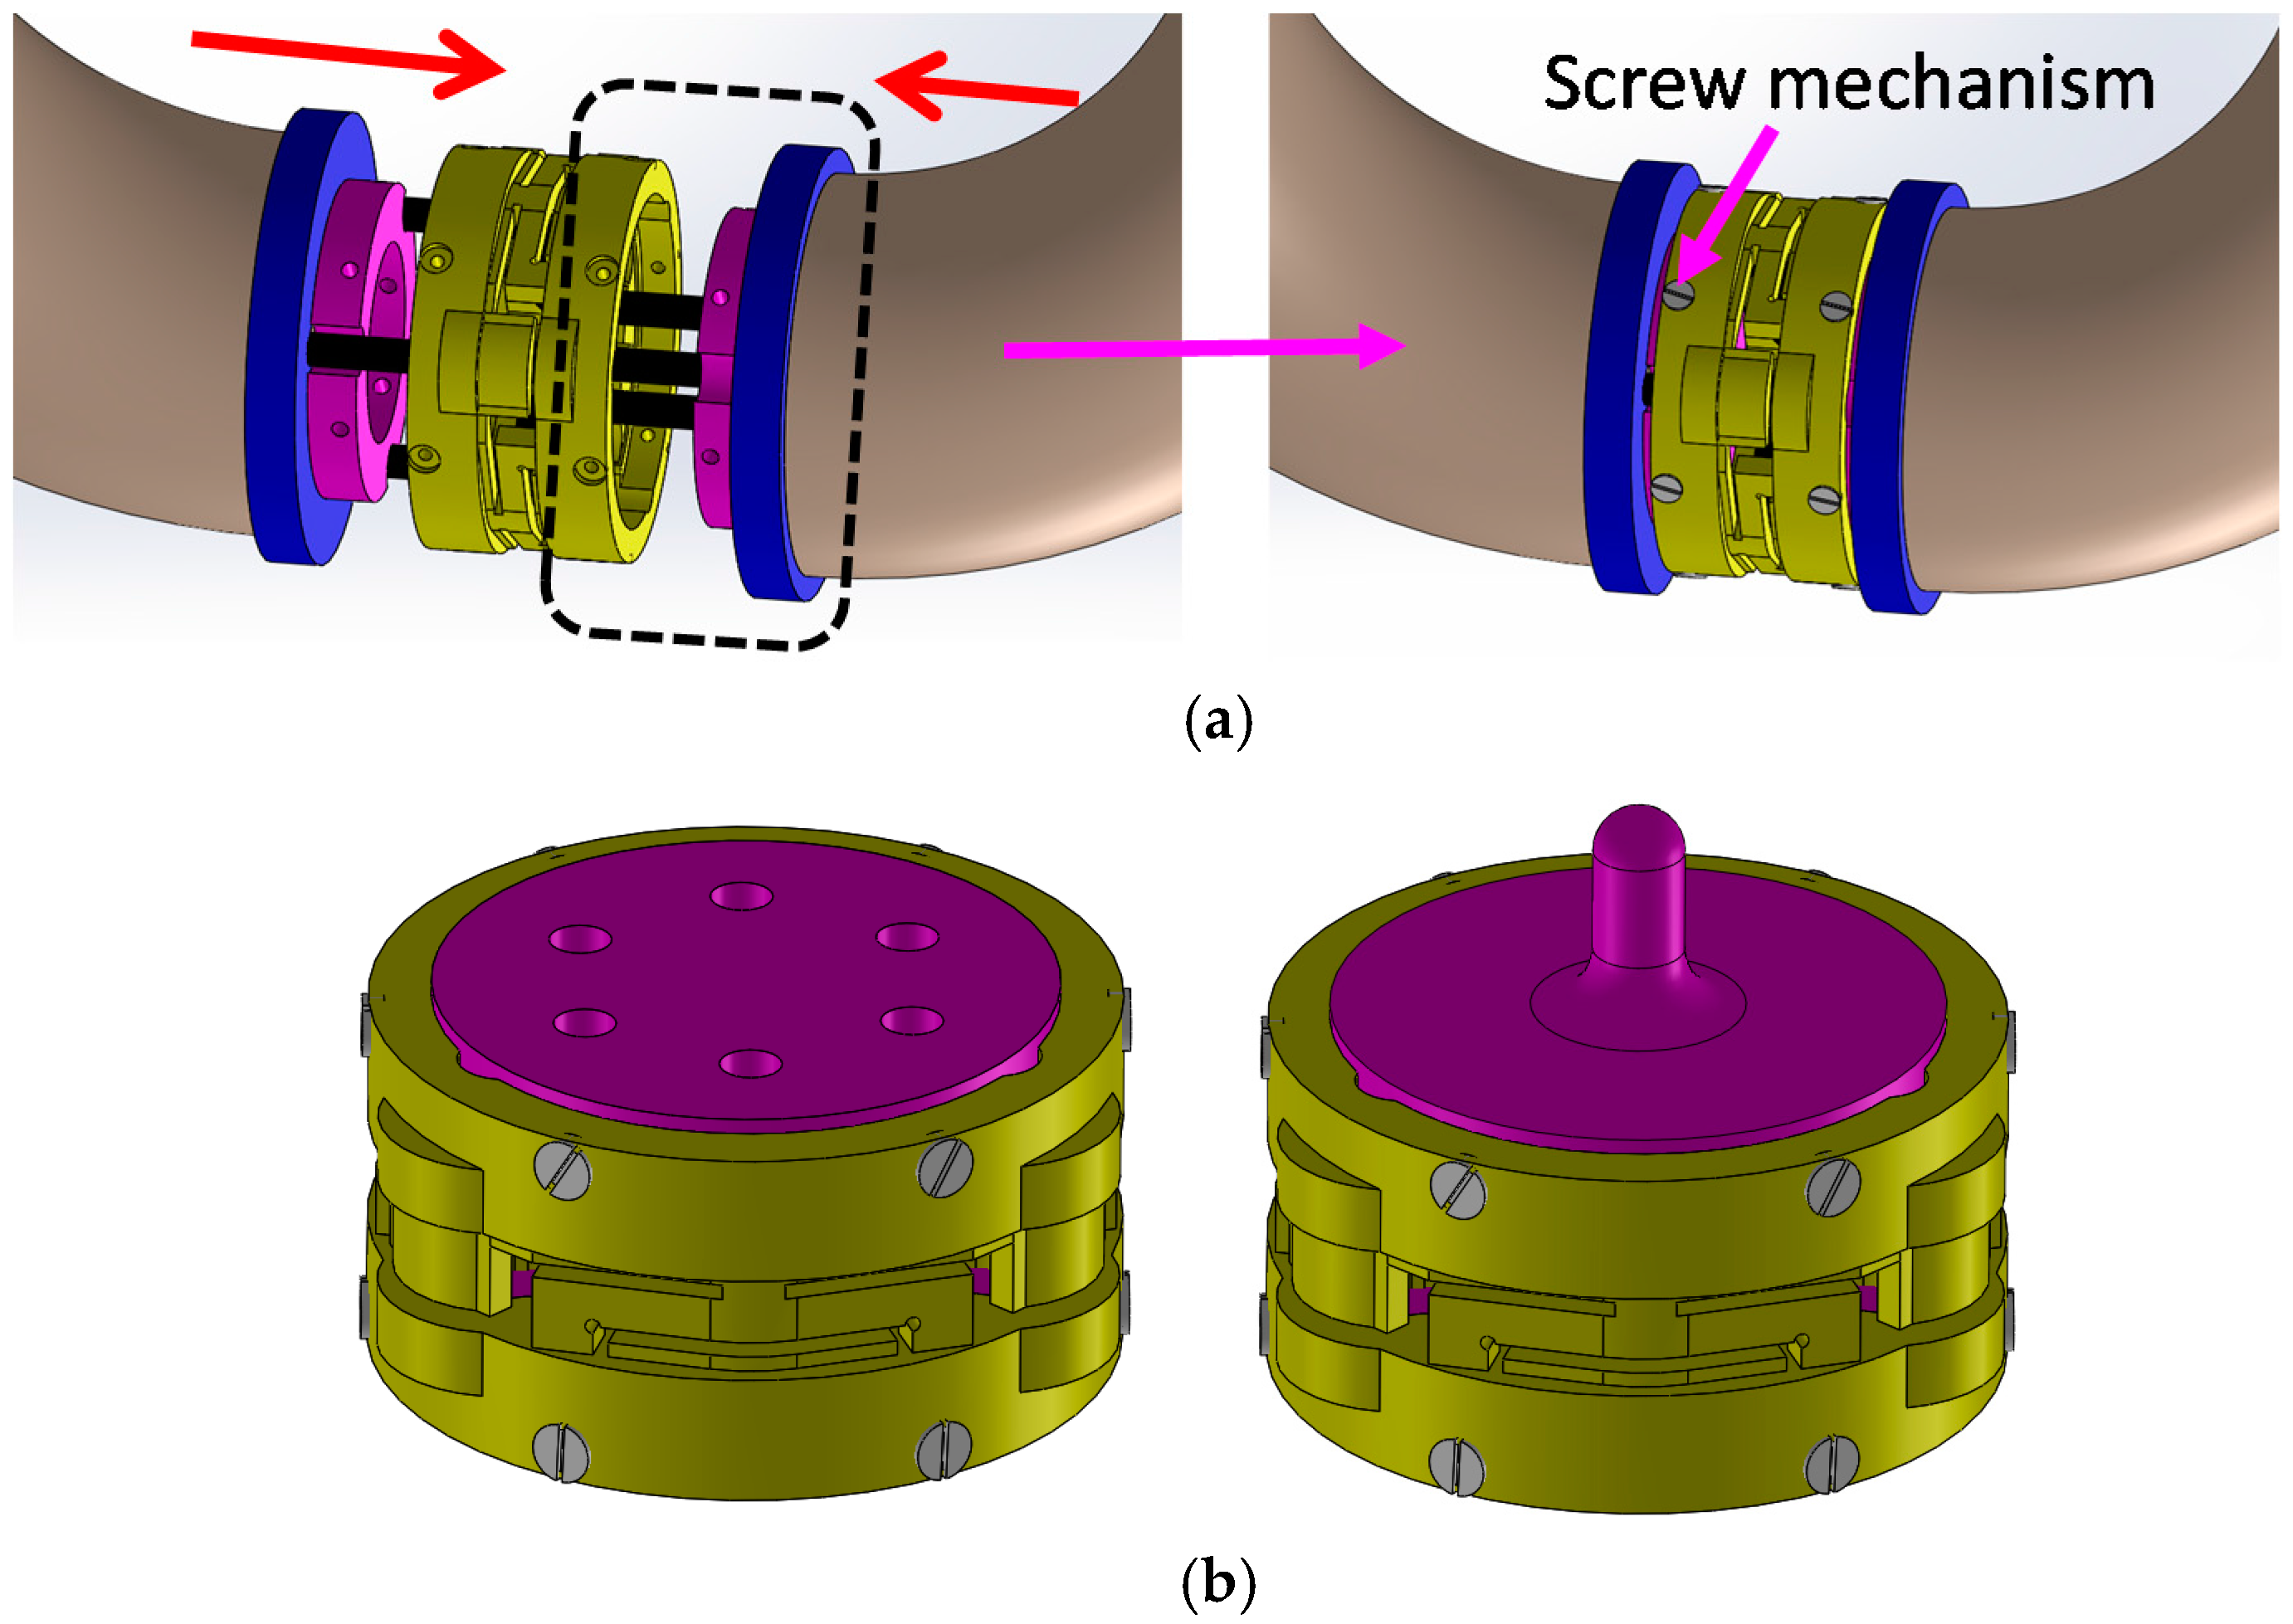
Be easily adaptable and integrateable with the given manipulator structure.
(4)
Impact on the robot structure as little as possible and provide space for necessary tubes and cables for other functions such as robot actuation, sensing, and tool actuation.
In this paper, to prove the efficiency of our proposed three-axis force sensor for being integrated into the STIFF-FLOP manipulator (Diameter: 25 mm, Length: 50 mm, four 1 mm or 2 mm pipes are required for one manipulator as shown in Figure 3), we designed the first prototype with the measurement range and size described in Table 1.

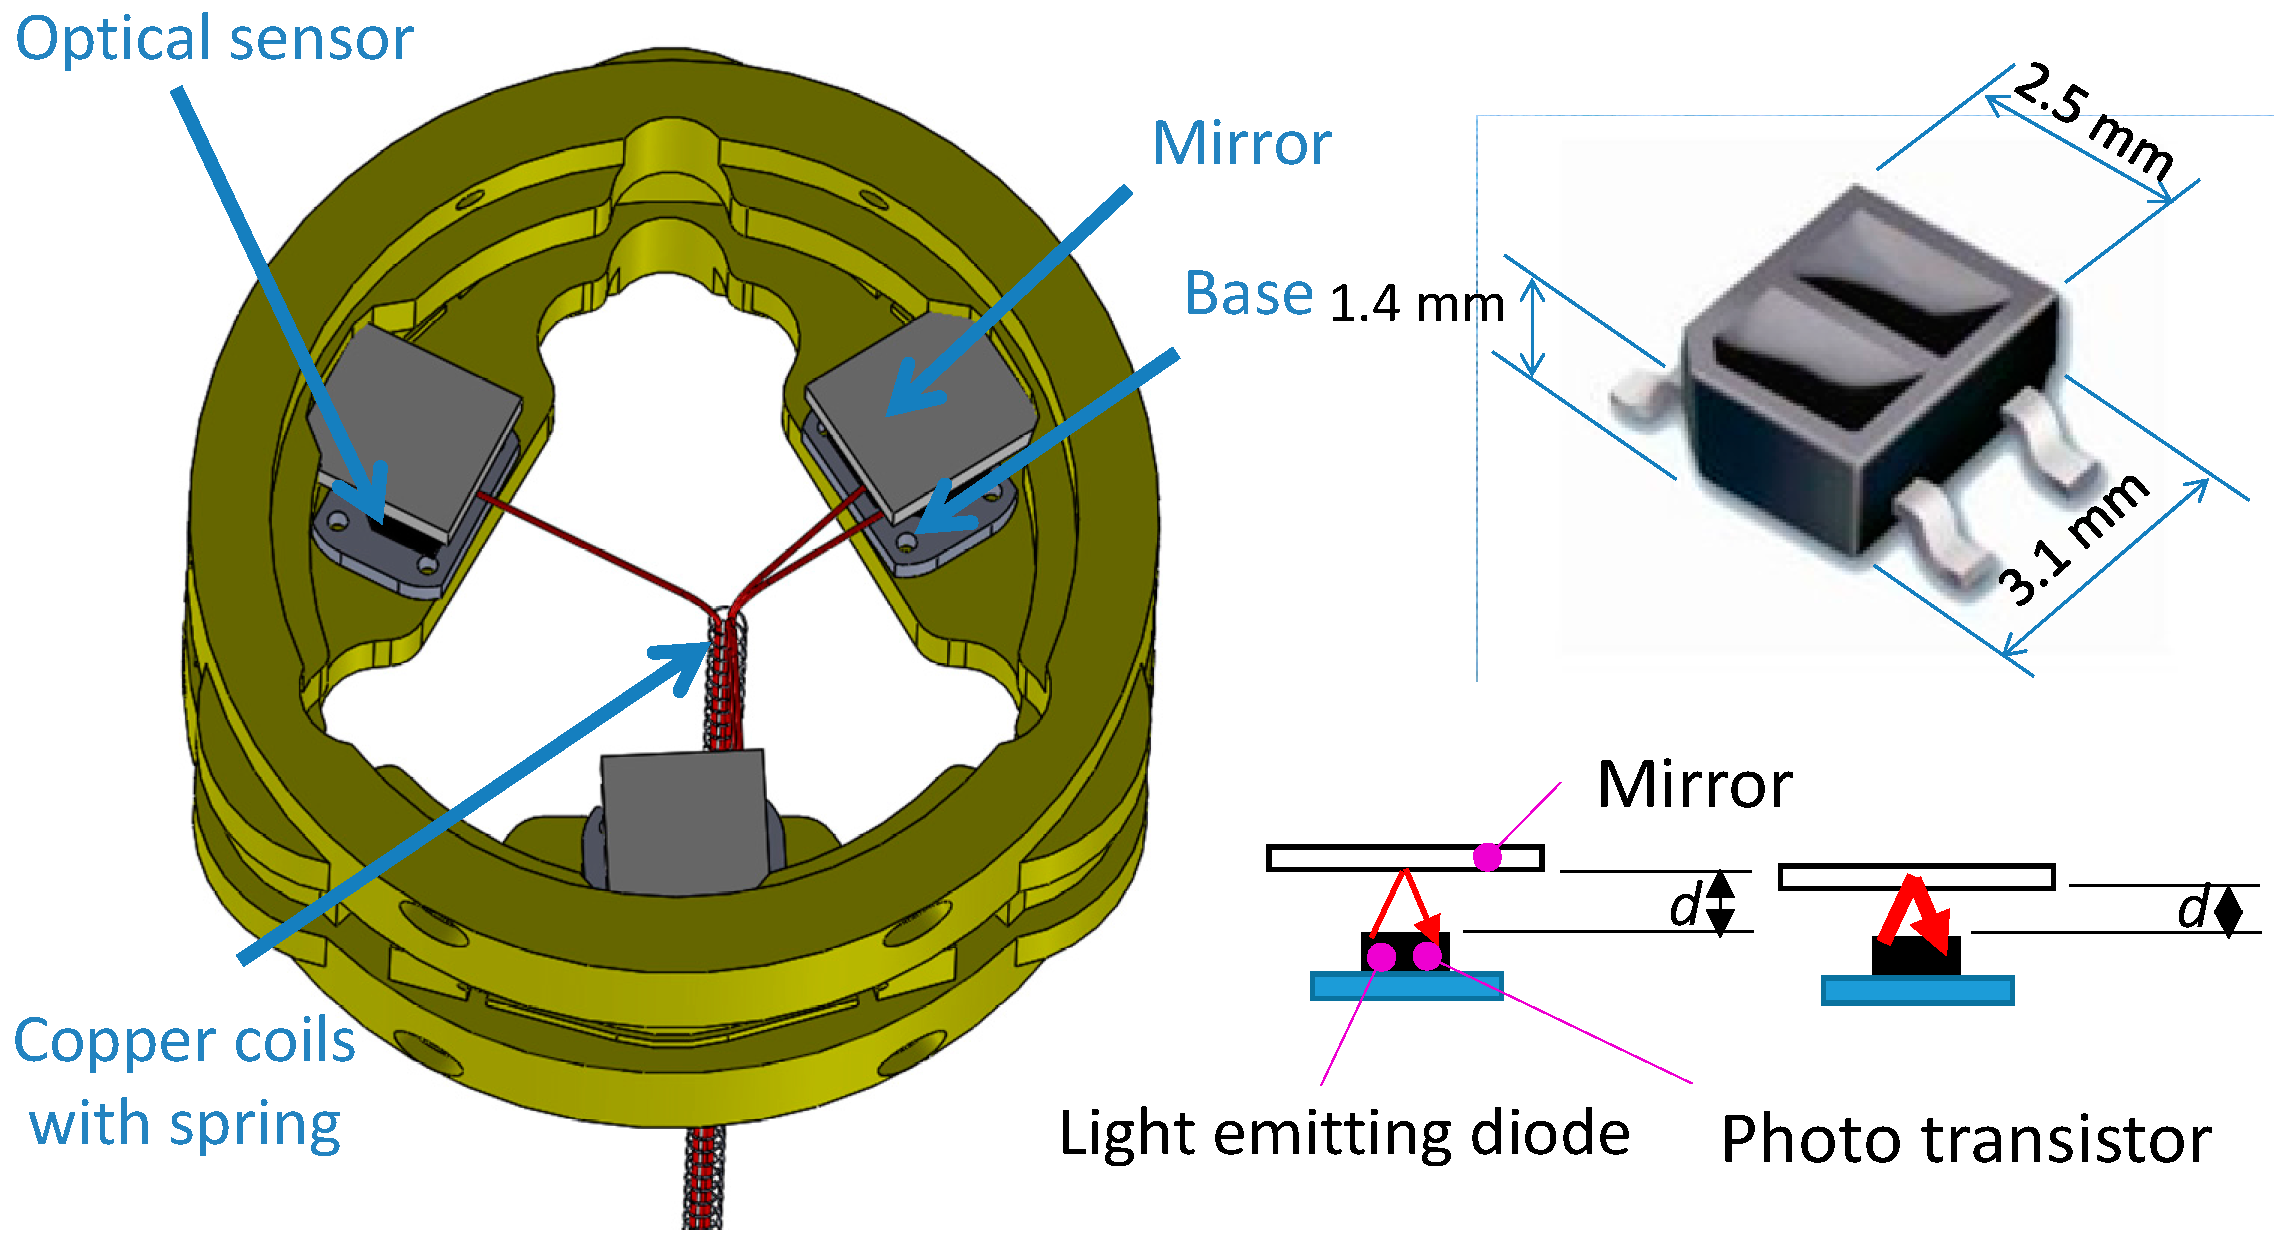
2.2. Configuration of Optoelectronic Based Force/Torque Sensor

The structure of the optoelectronic force/torque sensor is shown in Figure 1 and Figure 2. The force/torque sensor uses an optoelectronic sensor, QRE1113 from Fairchild Semiconductor Corp. (Figure 1), with reflective plastic as a mirror [50]. A flexible ring-like structure made of ABS plastic (Visijet® EX200, 3D Systems Corporation, Rock Hill, SC, USA, a copolymer of Acrylonitrile, Butadiene, and Styrene) using rapid prototyping (ProjectTM HD-3000 Plus, 3D Systems Corporation, Rock Hill, SC, USA) was created to measure one force component Fz, and two moment components, Mx and My, as illustrated in Figure 4. In order to measure the three components of force and moments, the three deflections δ1, δ2 and δ3 in the sensor structure based on the simply-supported beam need to be measured through three optoelectronic sensors (Figure 4).
Each of our individual force sensing elements makes use of a pair of optoelectronics consisting of a light-emitting diode and a phototransistor. The optoelectronics are appropriately combined with a reflective surface (mirror) to reflect the light emitted by the light-emitting diode then received by the phototransistor (Figure 1 and Figure 2). Any variation in distance with regards to the optoelectronics due to an applied force changes the amount of light reflected onto the phototransistor. The light received by the phototransistor element is converted into an analogue voltage signal and subsequently converted into a digital signal for further processing on a computer.
In the event that an external force and moment Fz, Mx and My are applied to the upper plate of the sensing structure, the three associated beams are deflected. The three corresponding optoelectronic sensing elements measure the resultant beam deflections (δ1, δ2 and δ3) between the upper plate and bottom plate (Figure 4). The deflections δ1, δ2 and δ3 can be determined from the read-out output voltages of the receiving elements of the optoelectronics, i.e., the photo transistors.
In addition, in order to anchor the force sensor to the structure of the STIFF-FLOP arm, 12 screws are used, as shown in Figure 4 and Figure 5. The hollow structure of our force sensor allows pipes and electrical wires to pass through. By modifying the shape of the bottom and top connection parts (purple components), the proposed sensor can be easily adapted to a wide range of robot structures (Figure 5).

2.3. Sensor Structure Design, Modelling, Simulation, and Sensor’s Optoelectronic Optimization

To measure the force component and the two moments, the structure of the ring-shaped force/torque sensor can be simplified to three simply-supported beams arranged within the sensor structure, with an angular distance of 120° between them, as shown in Figure 1 and Figure 6. In the event that an external force is applied on the upper plate, each of the three simply-supported beams is deflected. The three photo sensors can measure the amount of deflection δ1, δ2 and δ3, and from the three deflections, the two moments Mx, My and force Fz can be measured in terms of f1, f2 and f3:
f 1 = k 1 δ 1
f 2 = k 2 δ 2
f 3 = k 3 δ 3
Exploiting knowledge of the beam material properties, the deflections of the simply-supported beams are calculated and spring coefficient k can be obtained [39]:
I = b h 3 12
δ = f L 3 48 E I
k = 48 E I L 3
where spring coefficient k is modelled as a function of the beam length L/2, the modulus of elasticity E, the moment of inertia I, the width of beam’s section b, and the beam’s section h as shown in Figure 6a.
In the event that an amount of external force is applied to the upper plate (as shown in Figure 6), force Fz and moment components Mx and My can be calculated by substituting all of the variables as follows:
F z = f 1 + f 2 + f 3 = k δ 1 +   k δ 2 + k δ 3
M x = F · l · s i n θ = L 1 y · f 1 L 2 y · f 2 + L 3 y · f 3
M y = F · l · c o s θ = L 1 x · f 1 + L 2 x · f 2
The deflections of the three simply-supported beams are represented, in turn, by the output voltages (v1, v2 and v3) of the three optoelectronic sensing elements, as follows:
f 1 = k δ 1 = m 1 v 1
f 2 = k δ 2 = m 2 v 2
f 3 = k δ 3 = m 3 v 3
where constants m1, m2 and m3 are obtained experimentally. From Equations (10) to (12), the external force Fz and moment components Mx and My can be calculated by measuring f1, f2 and f3 as shown in Figure 4 (right). The calibration matrix kv can be obtained as follows:
[ F z M x M y ] = k v · v = [ k v 11 k v 12 k v 13 k v 21 k v 22 k v 23 k v 31 k v 32 k v 33 ] [ v 1 v 2 v 3 ] = [ m 1 m 2 m 3 m 1 L 1 y m 2 L 2 y m 3 L 3 y m 1 L 1 x m 2 L 2 y 0 ] [ v 1 v 2 v 3 ]

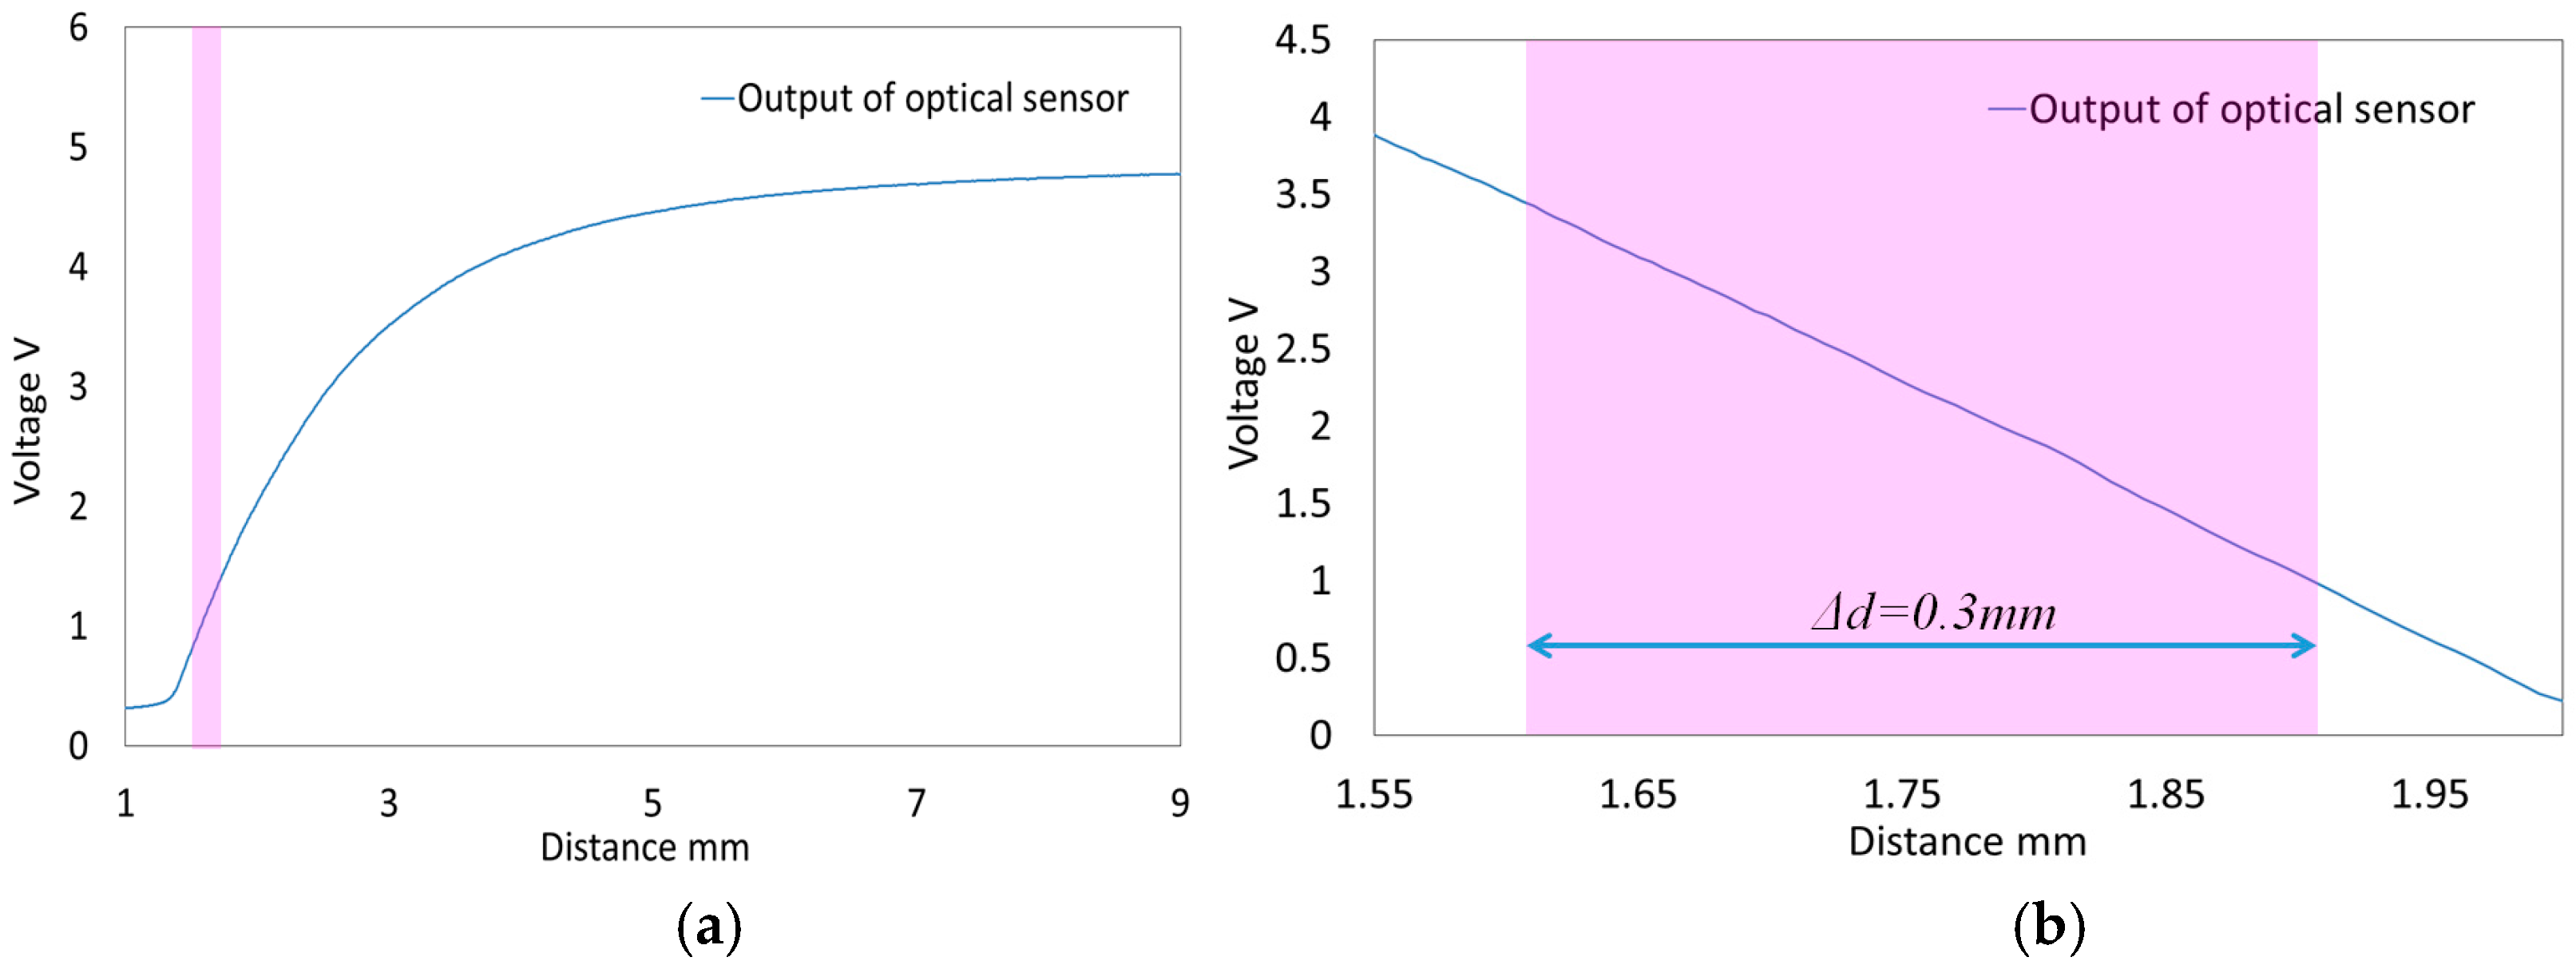
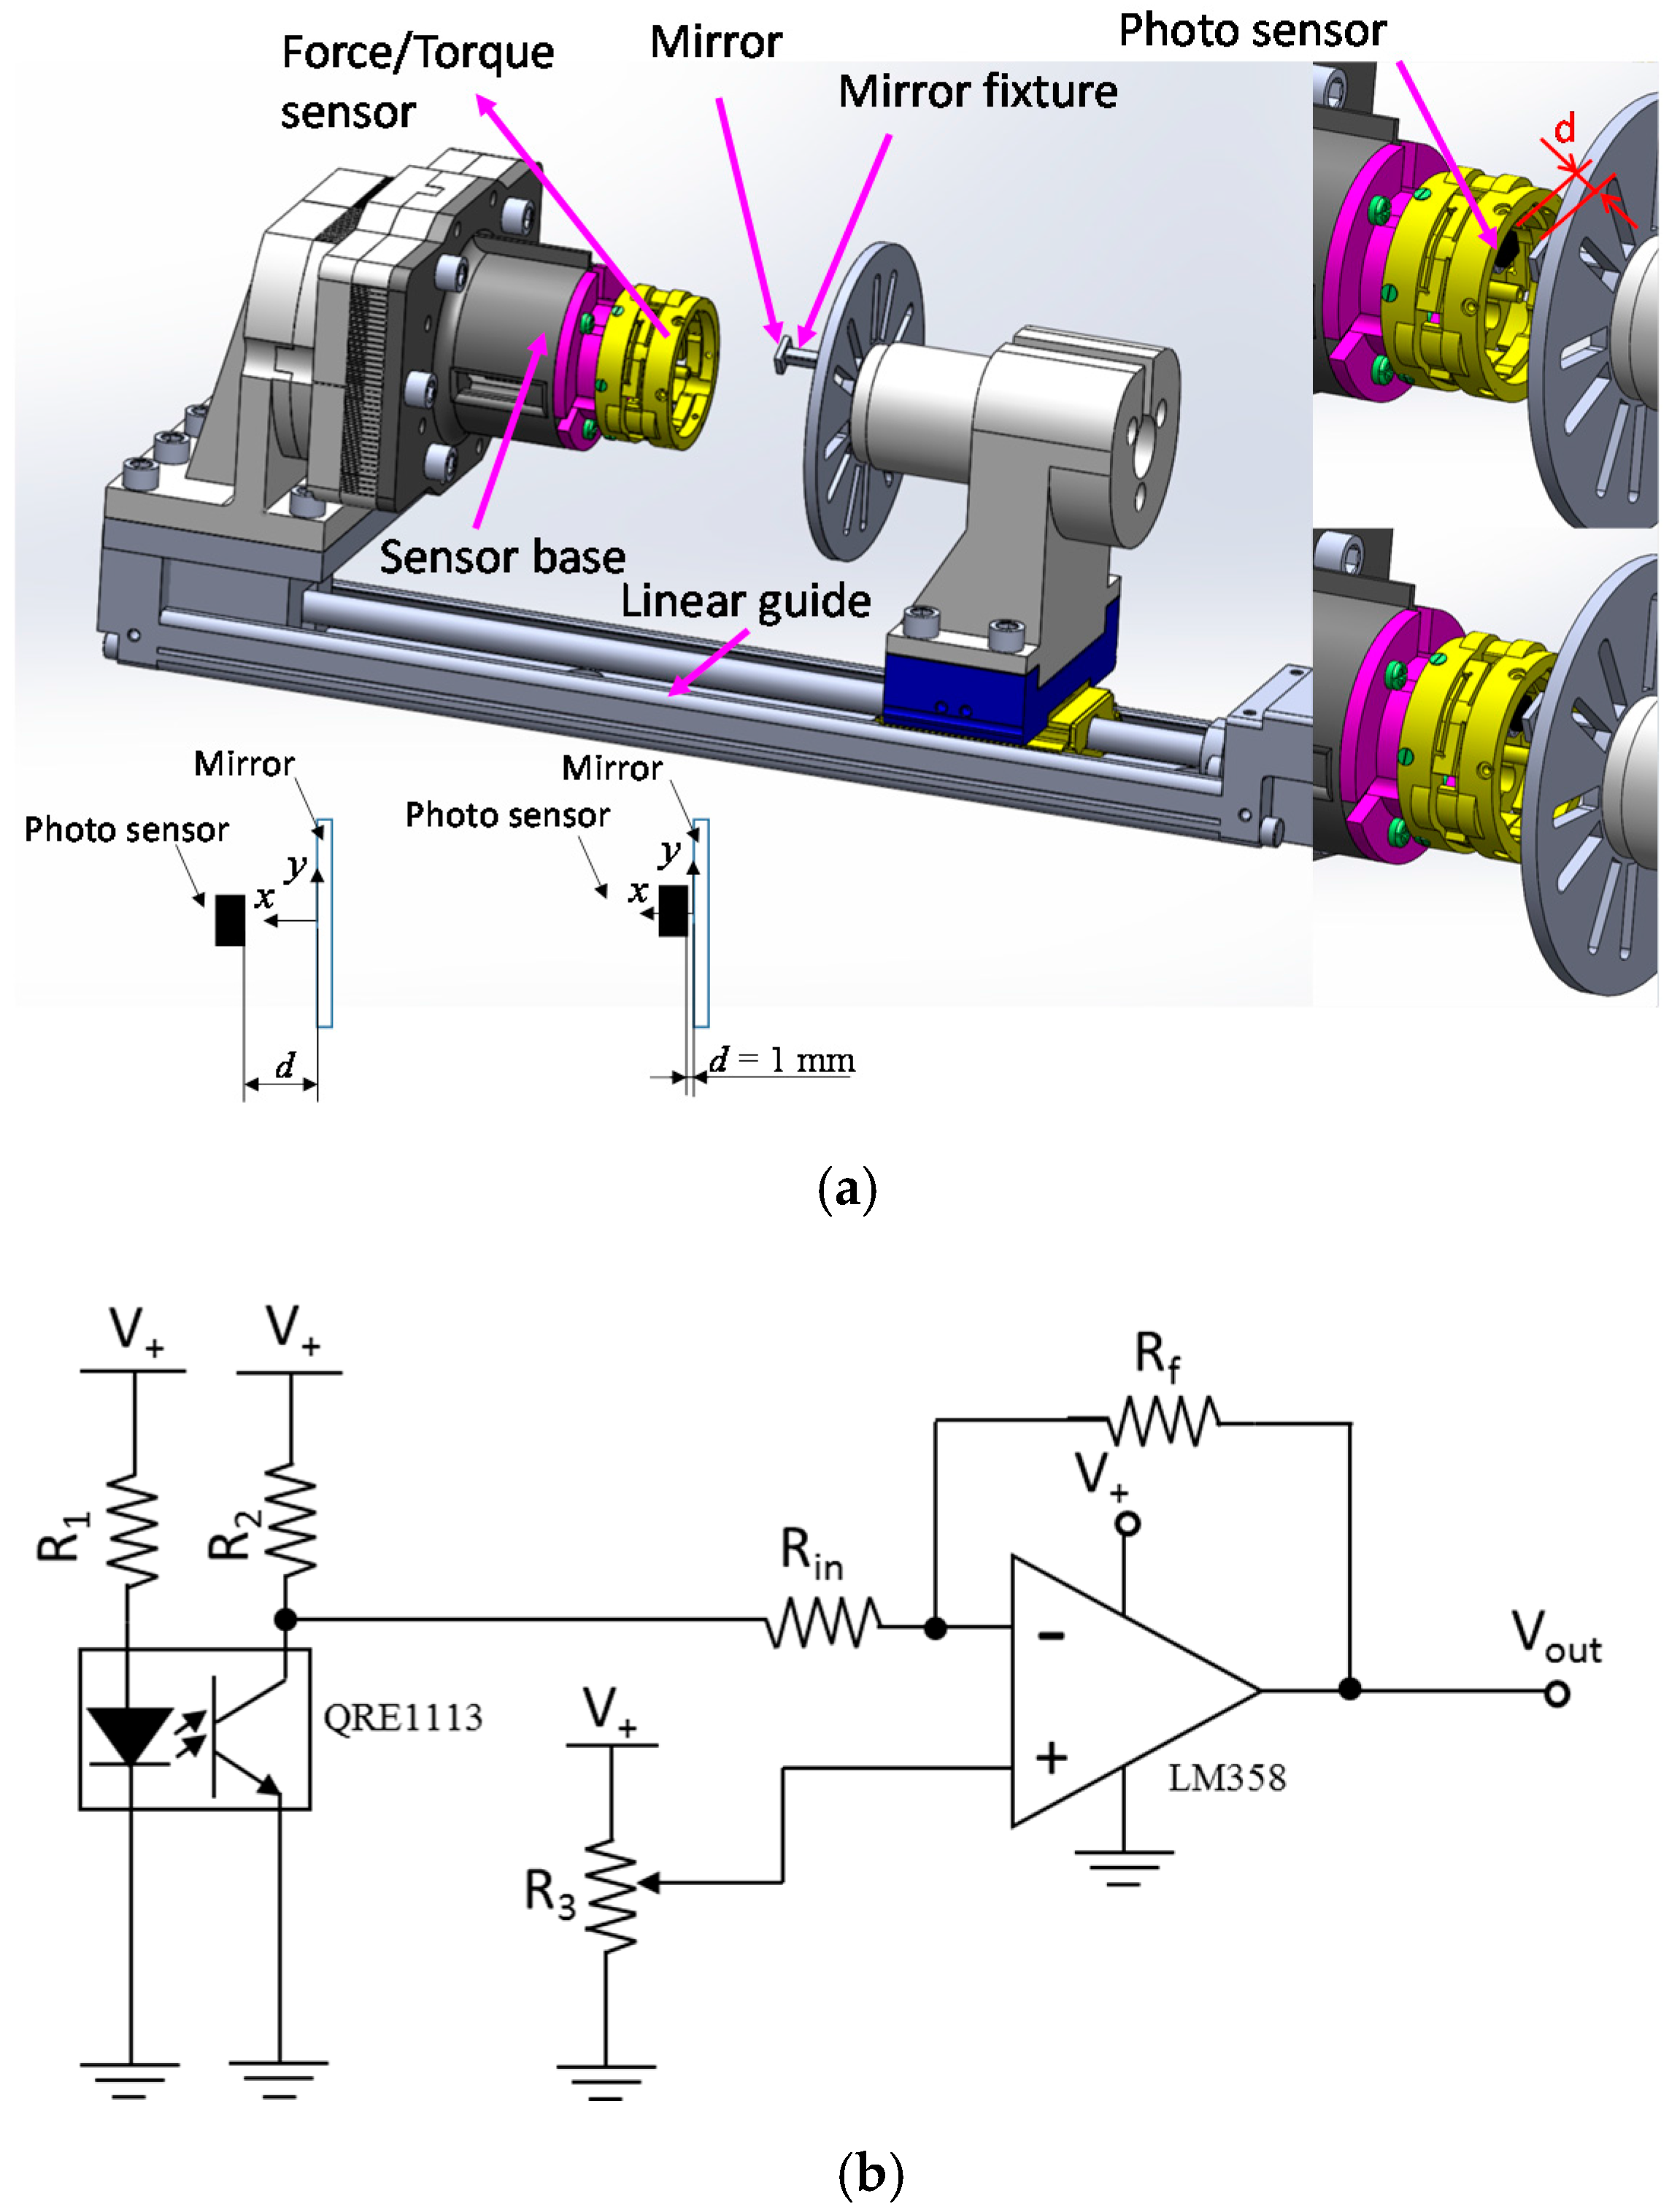
2.3.1. Optimization of Characteristic Curves on Optoelectronic Sensor

For the development of the three-axis force sensor, first of all, the relationship between deflections (δ1, δ2 and δ3) and output voltages of the optoelectronic sensors (v1, v2 and v3) need to be obtained. As shown in Figure 7, the calibration system consists of a linear guide, a sensor base, and a mirror. The mirror was set at the initial position where the distance between mirror and optoelectronic sensor was 1 mm, and moved 9 mm backward such that distance d from the optoelectronic sensors was increased.
The outcome from our experimental study is the characteristic curves relating the output voltages of the optoelectronics (v1, v2 and v3) to distance d (Figure 8a). For the development of the force/torque sensor, the following requirements should be satisfied: (1) Small deflections yield large changes in voltage; (2) linearity. From the characteristic curves shown in the purple area in Figure 8a, the characteristic curves are fairly linear, but with small voltage changes for small changes in distance.
To obtain large voltage change with respect to small distance changes, an inverting amplifier was used as shown in Figure 7b and Figure 8b. The output shows linear behaviour in the region highlighted in purple, with ∆d = 0.3 mm and a 2.5 V voltage change. For this reason, when force Fz and moments Mx and My are applied to the upper plate as shown in Figure 4 and Figure 6, each of the three beam deflections should not exceeded δ = ±0.15 mm because the sensor output shows a linear behaviour within the distance Δd = 0.3 mm, as shown in Figure 8b. In addition, to measure positive or negative deflection when force and moment components are applied on the sensor structure, the initial output voltage of the optoelectronic sensor should be in the middle of the overall voltage range, i.e., here, at d = 1.75 mm in the purple area of Figure 8b.

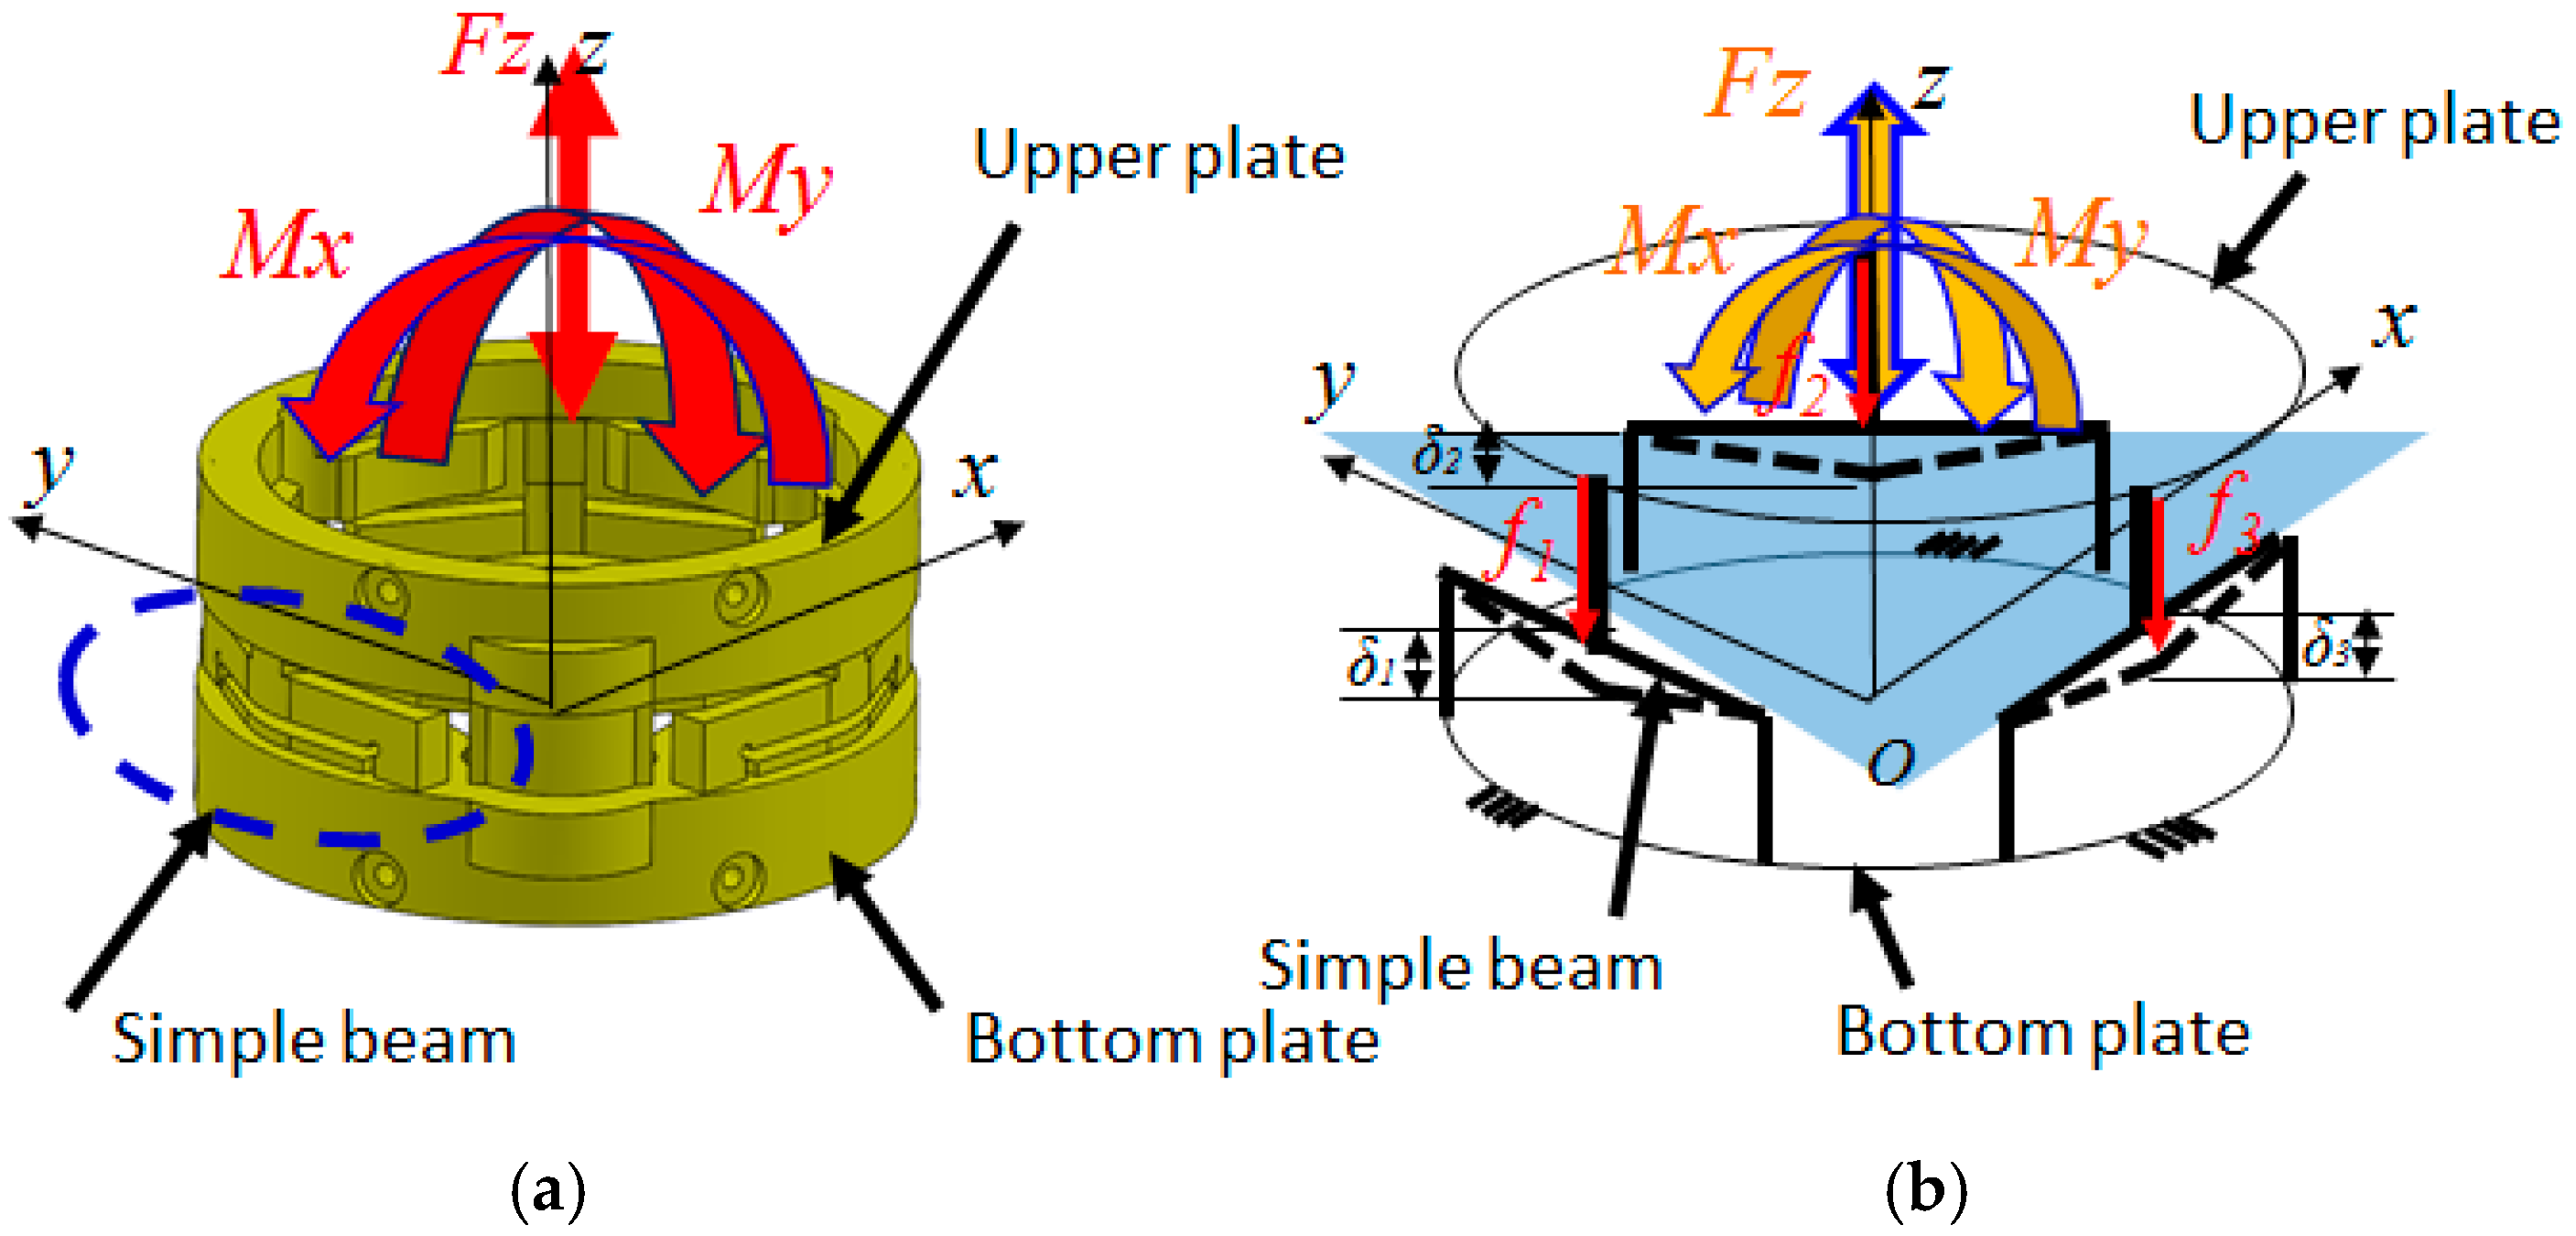
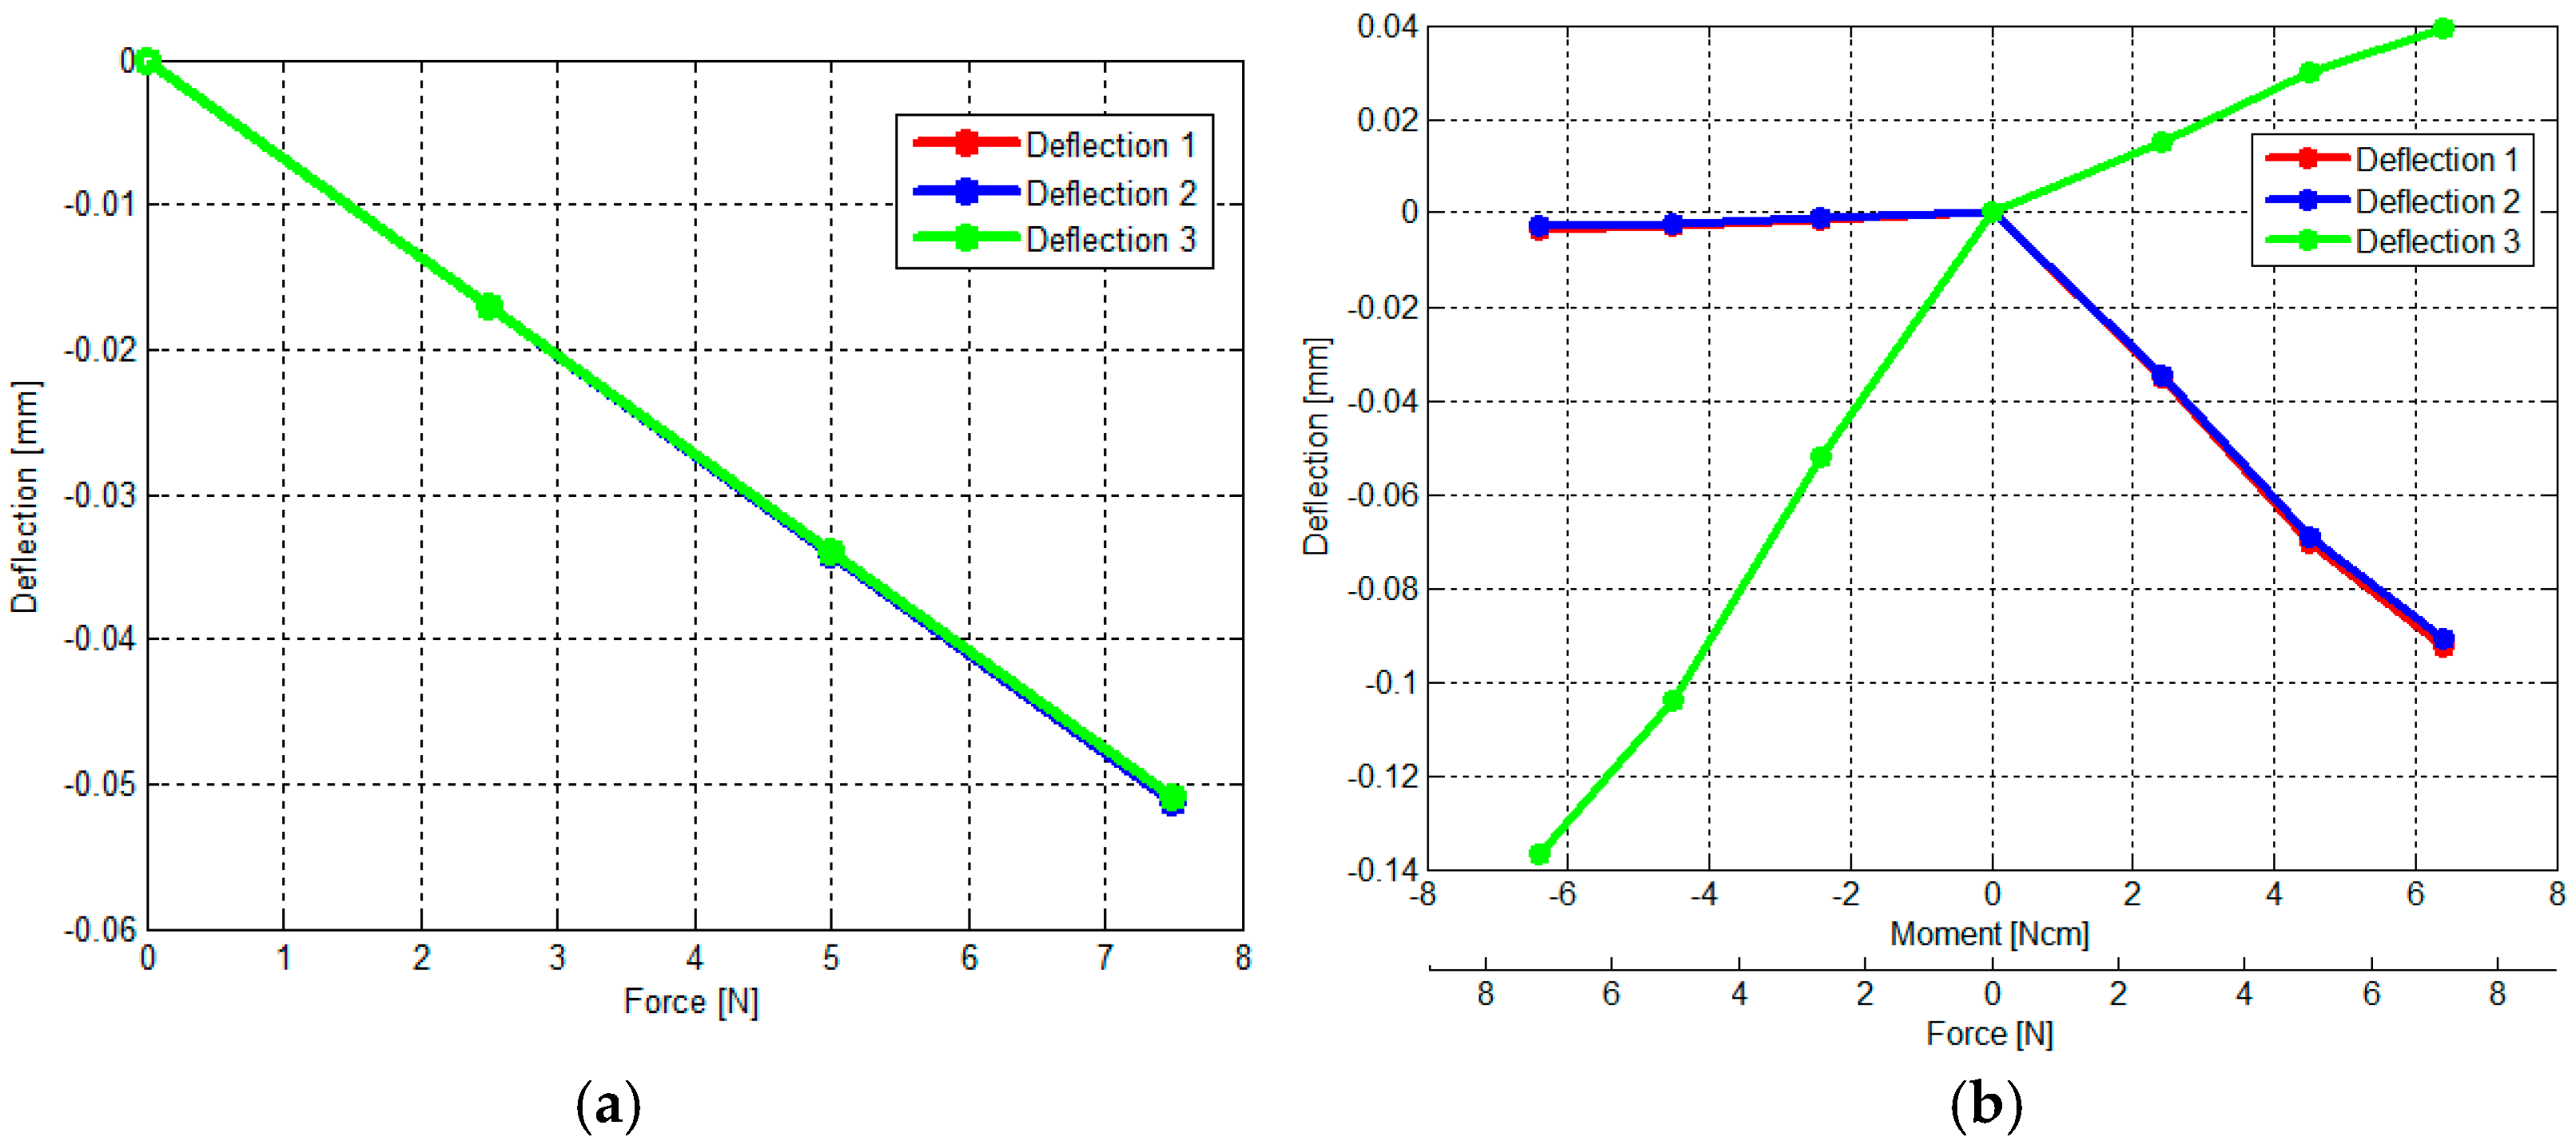
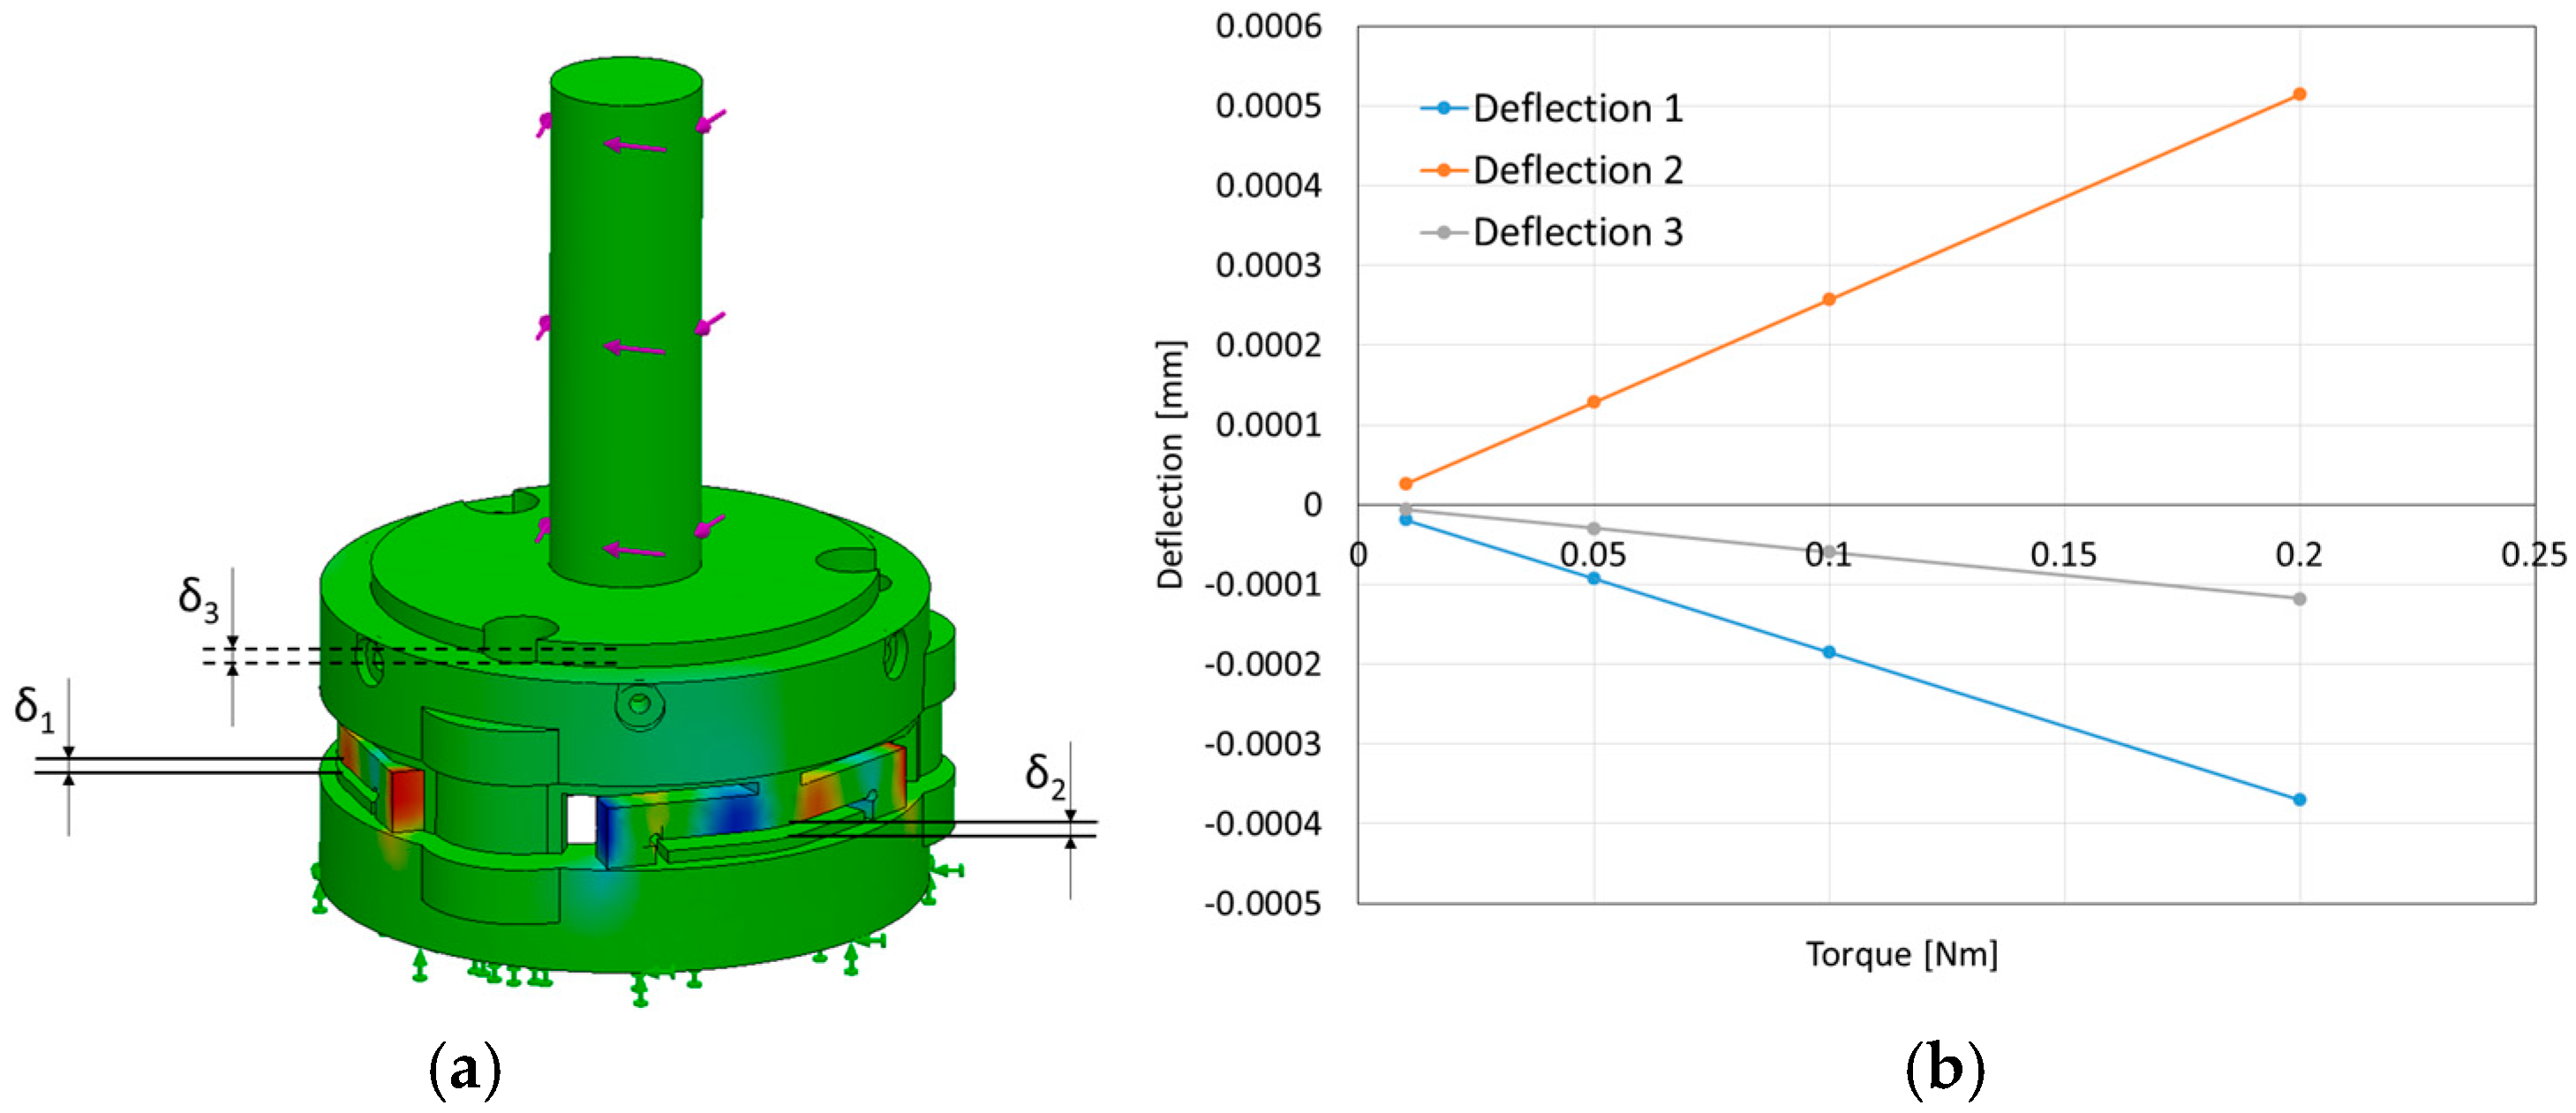
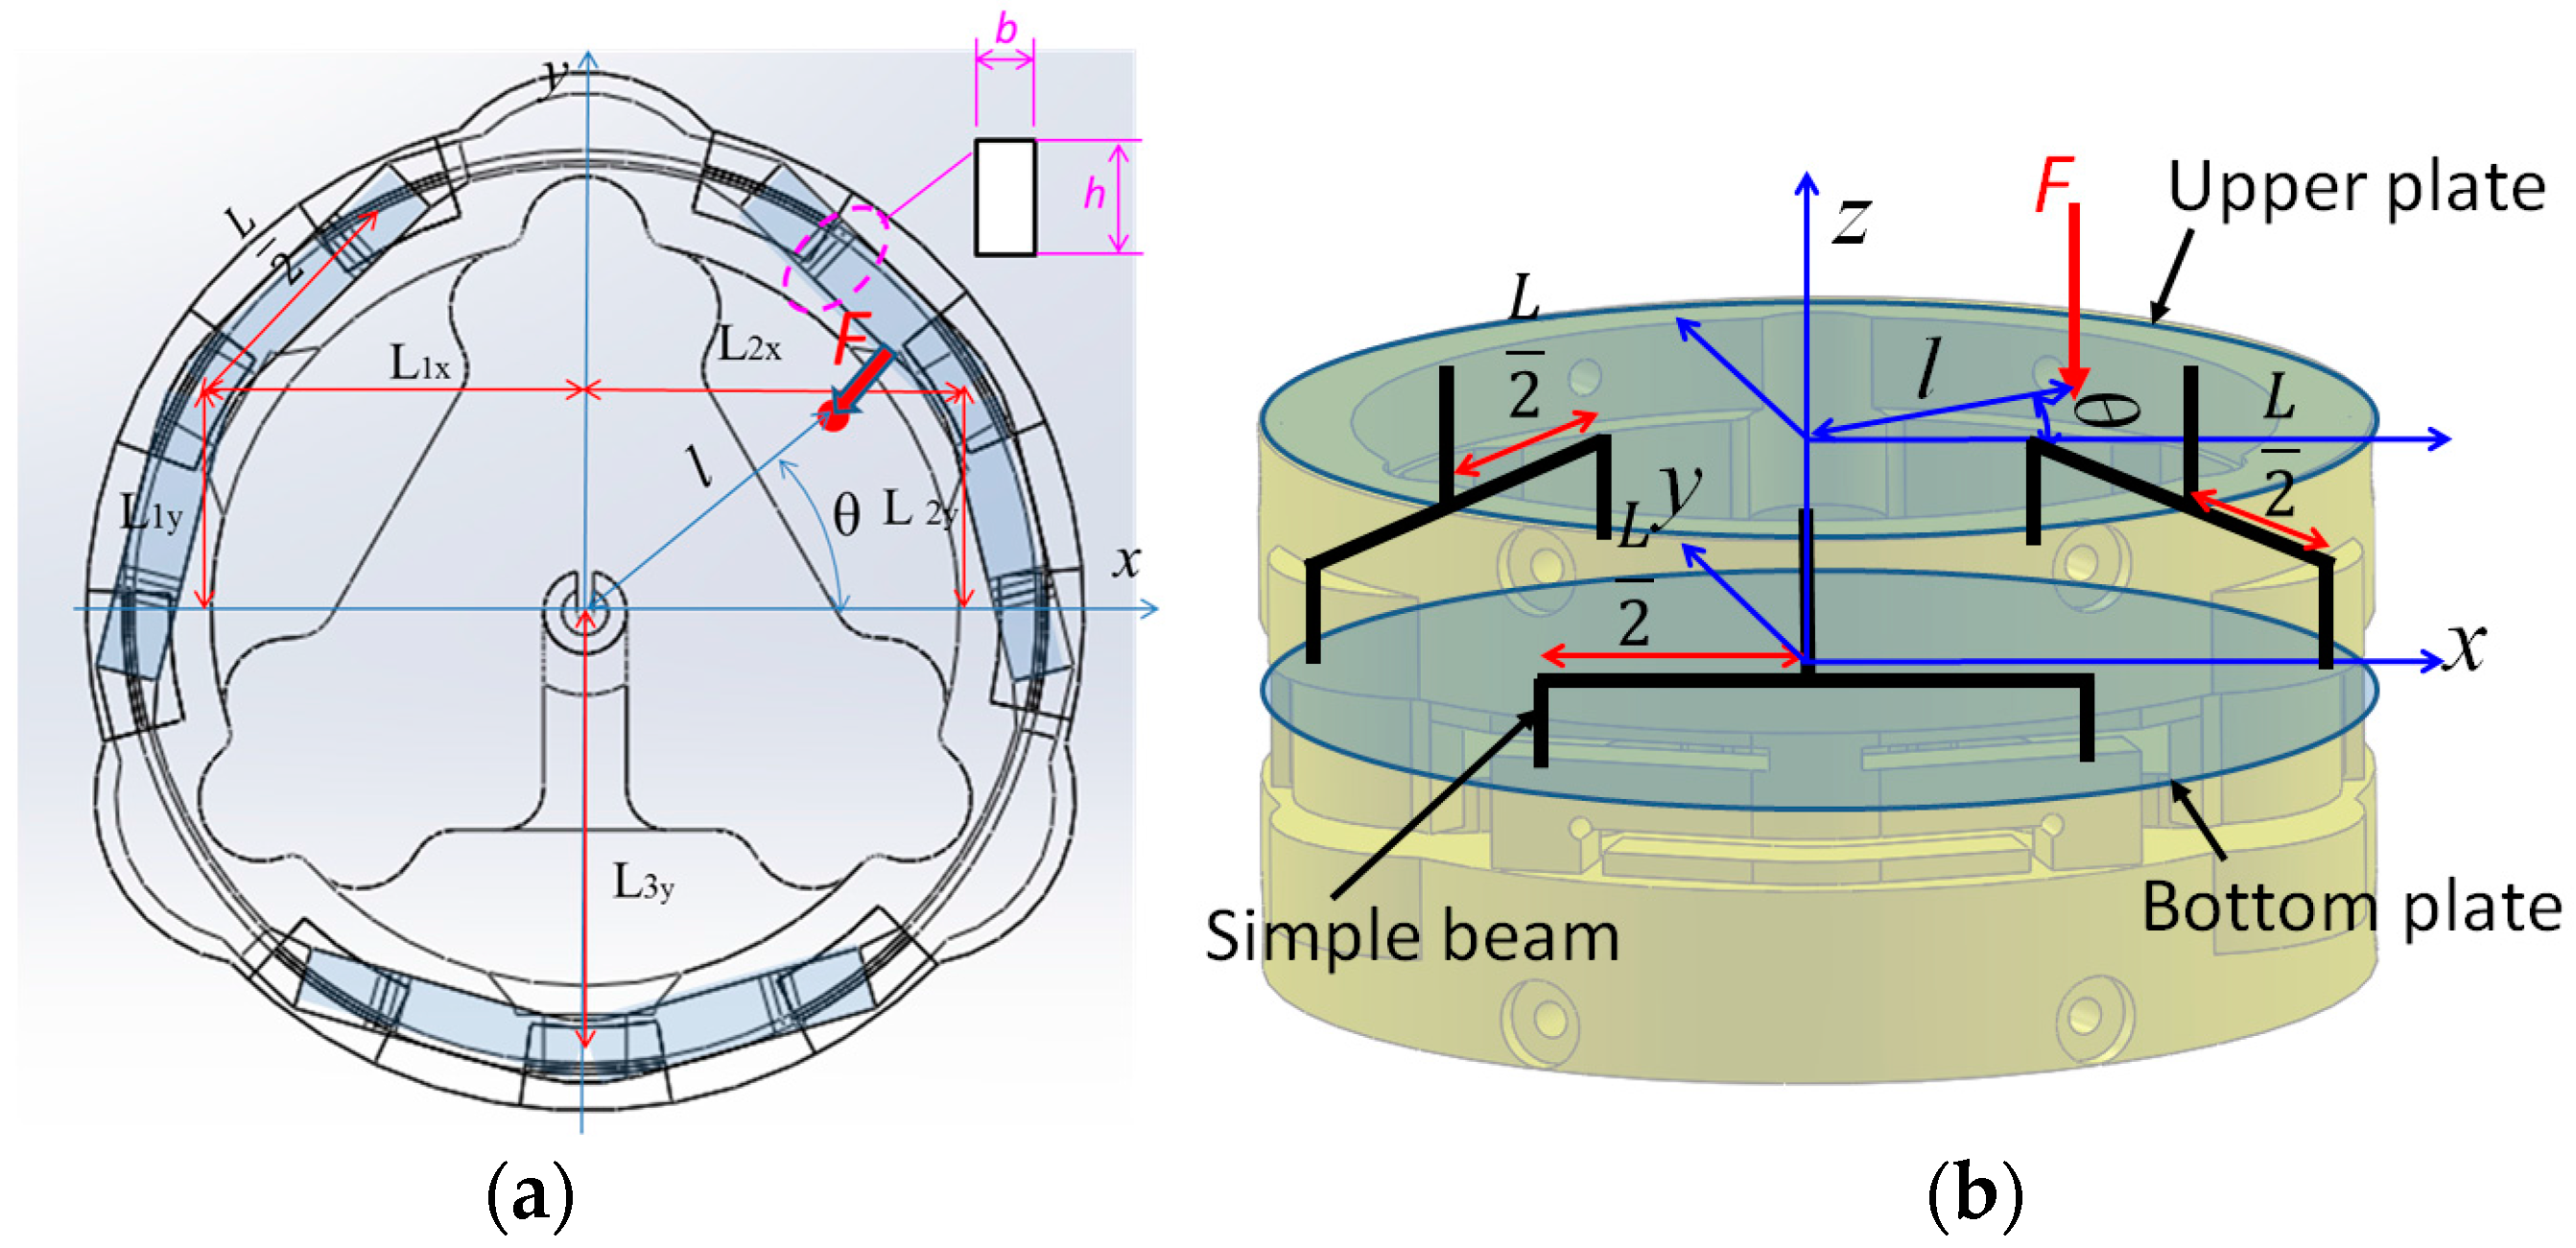
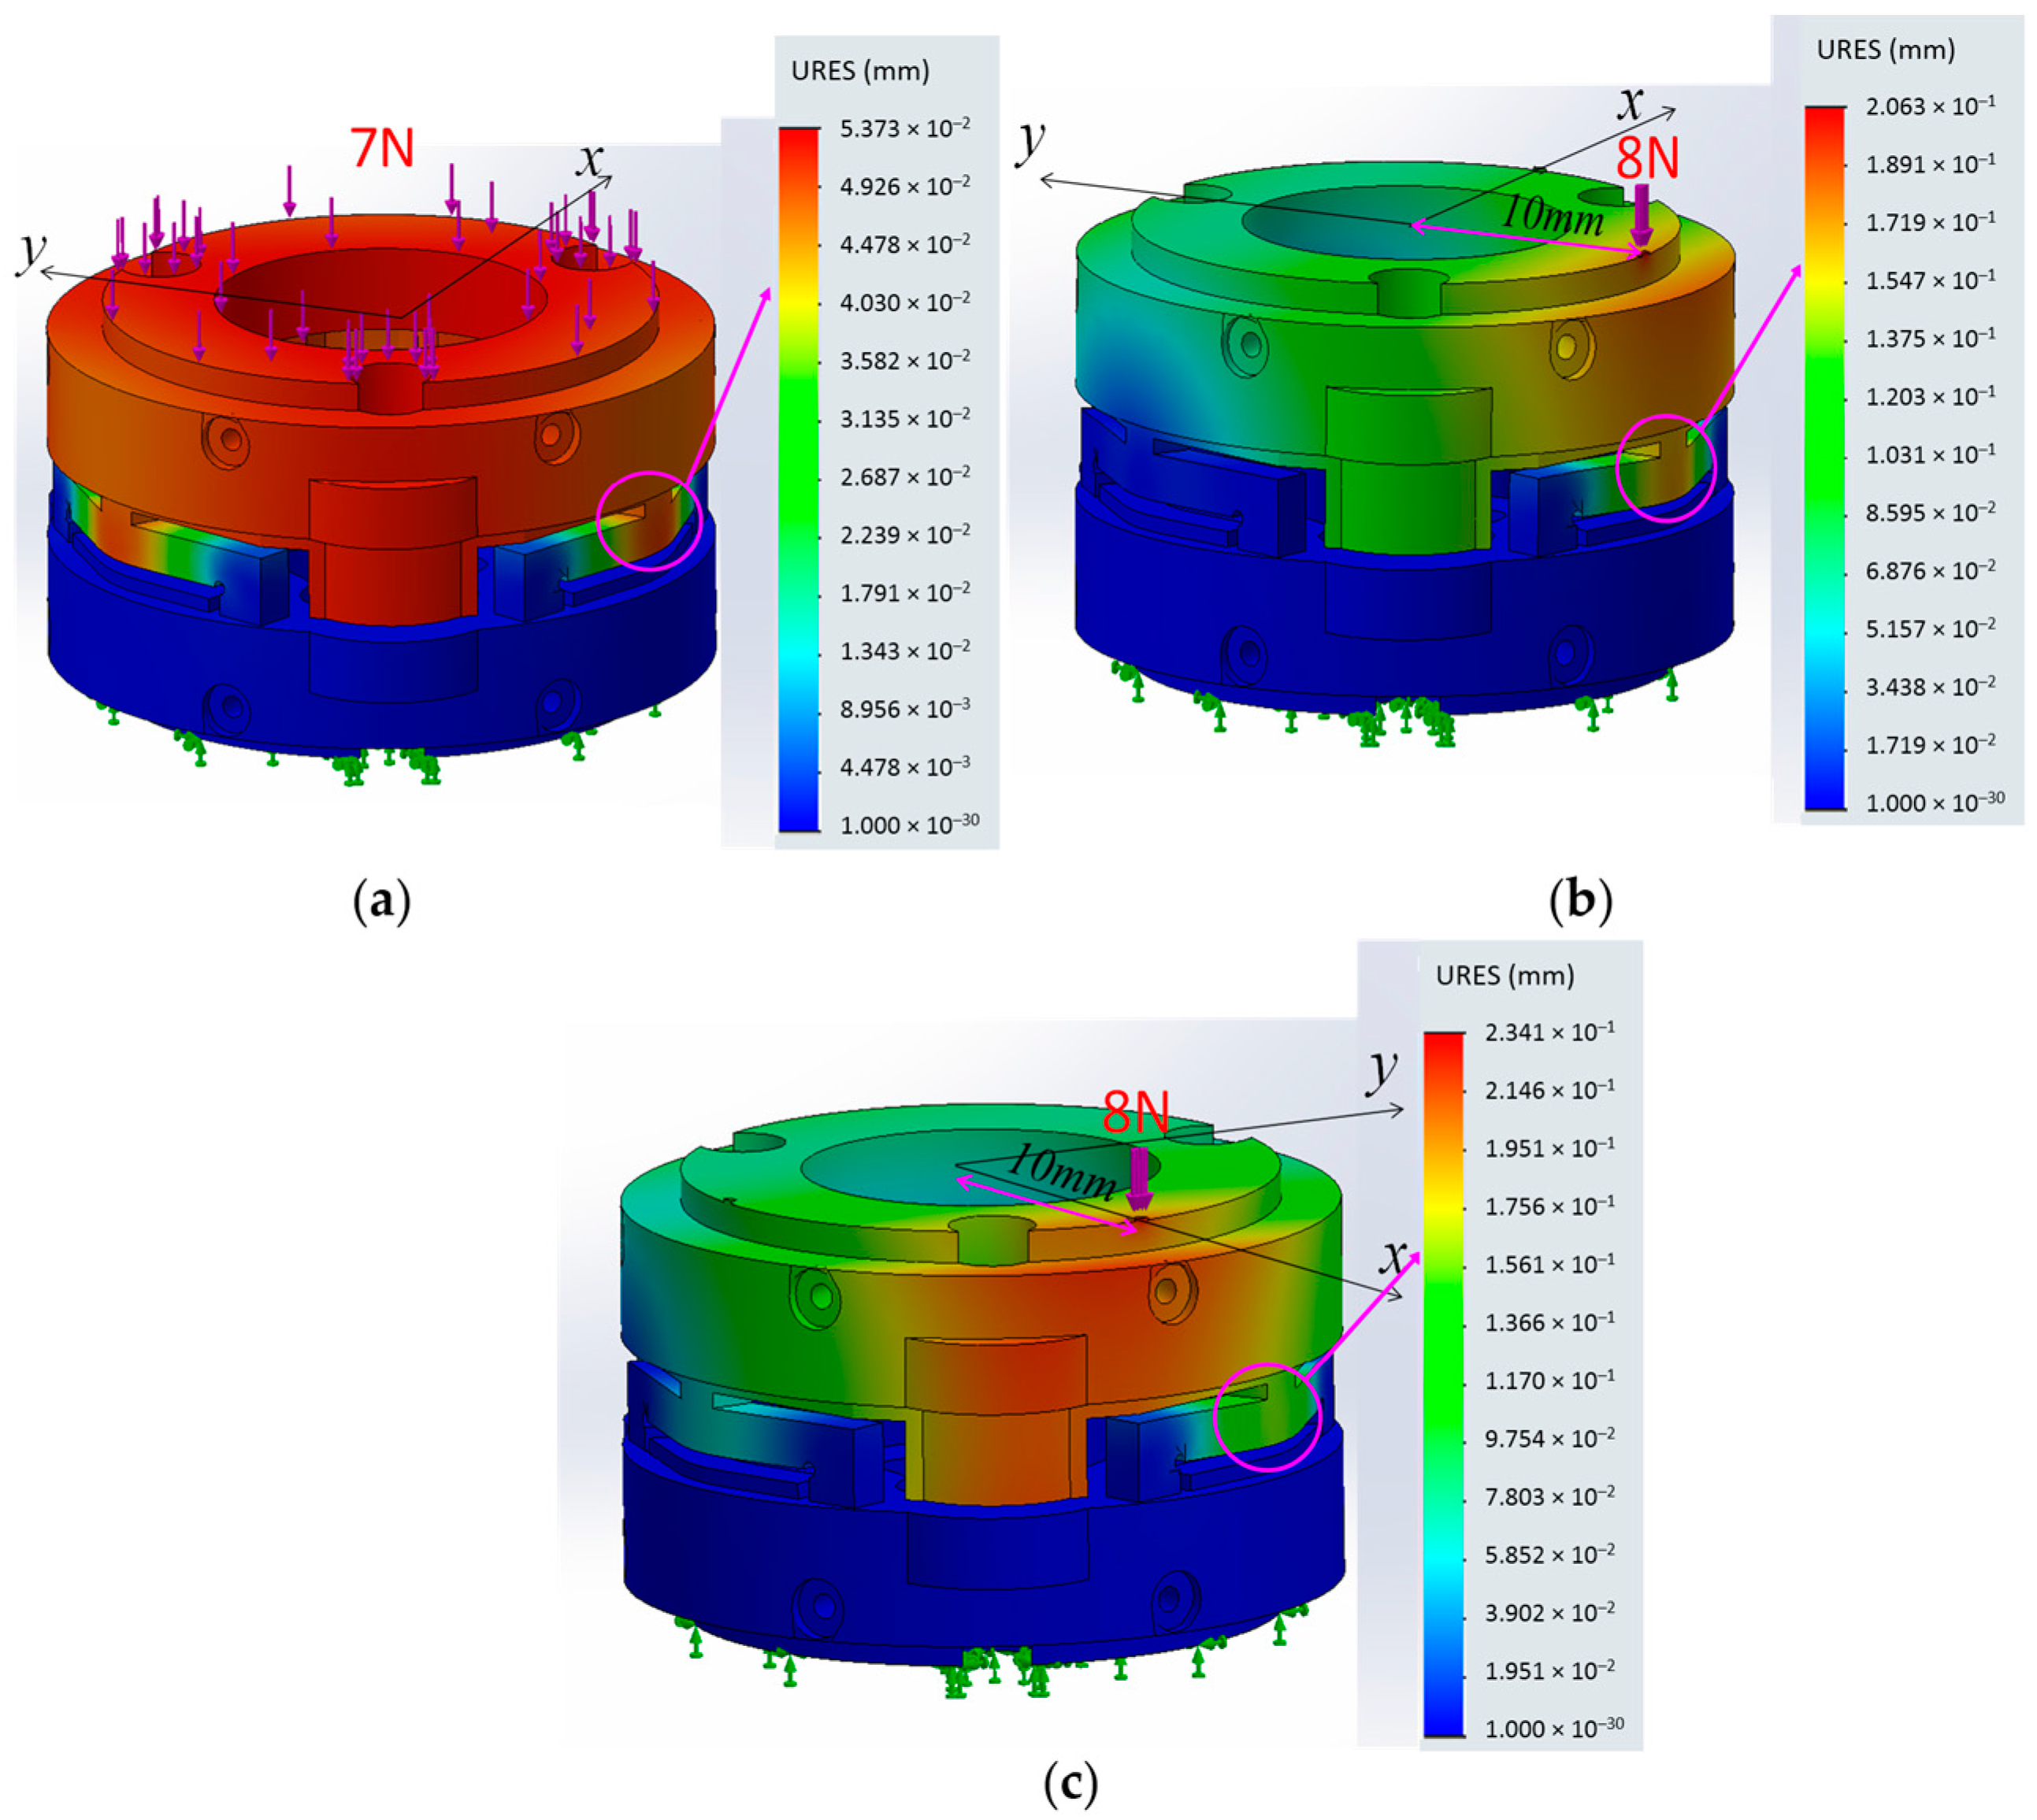
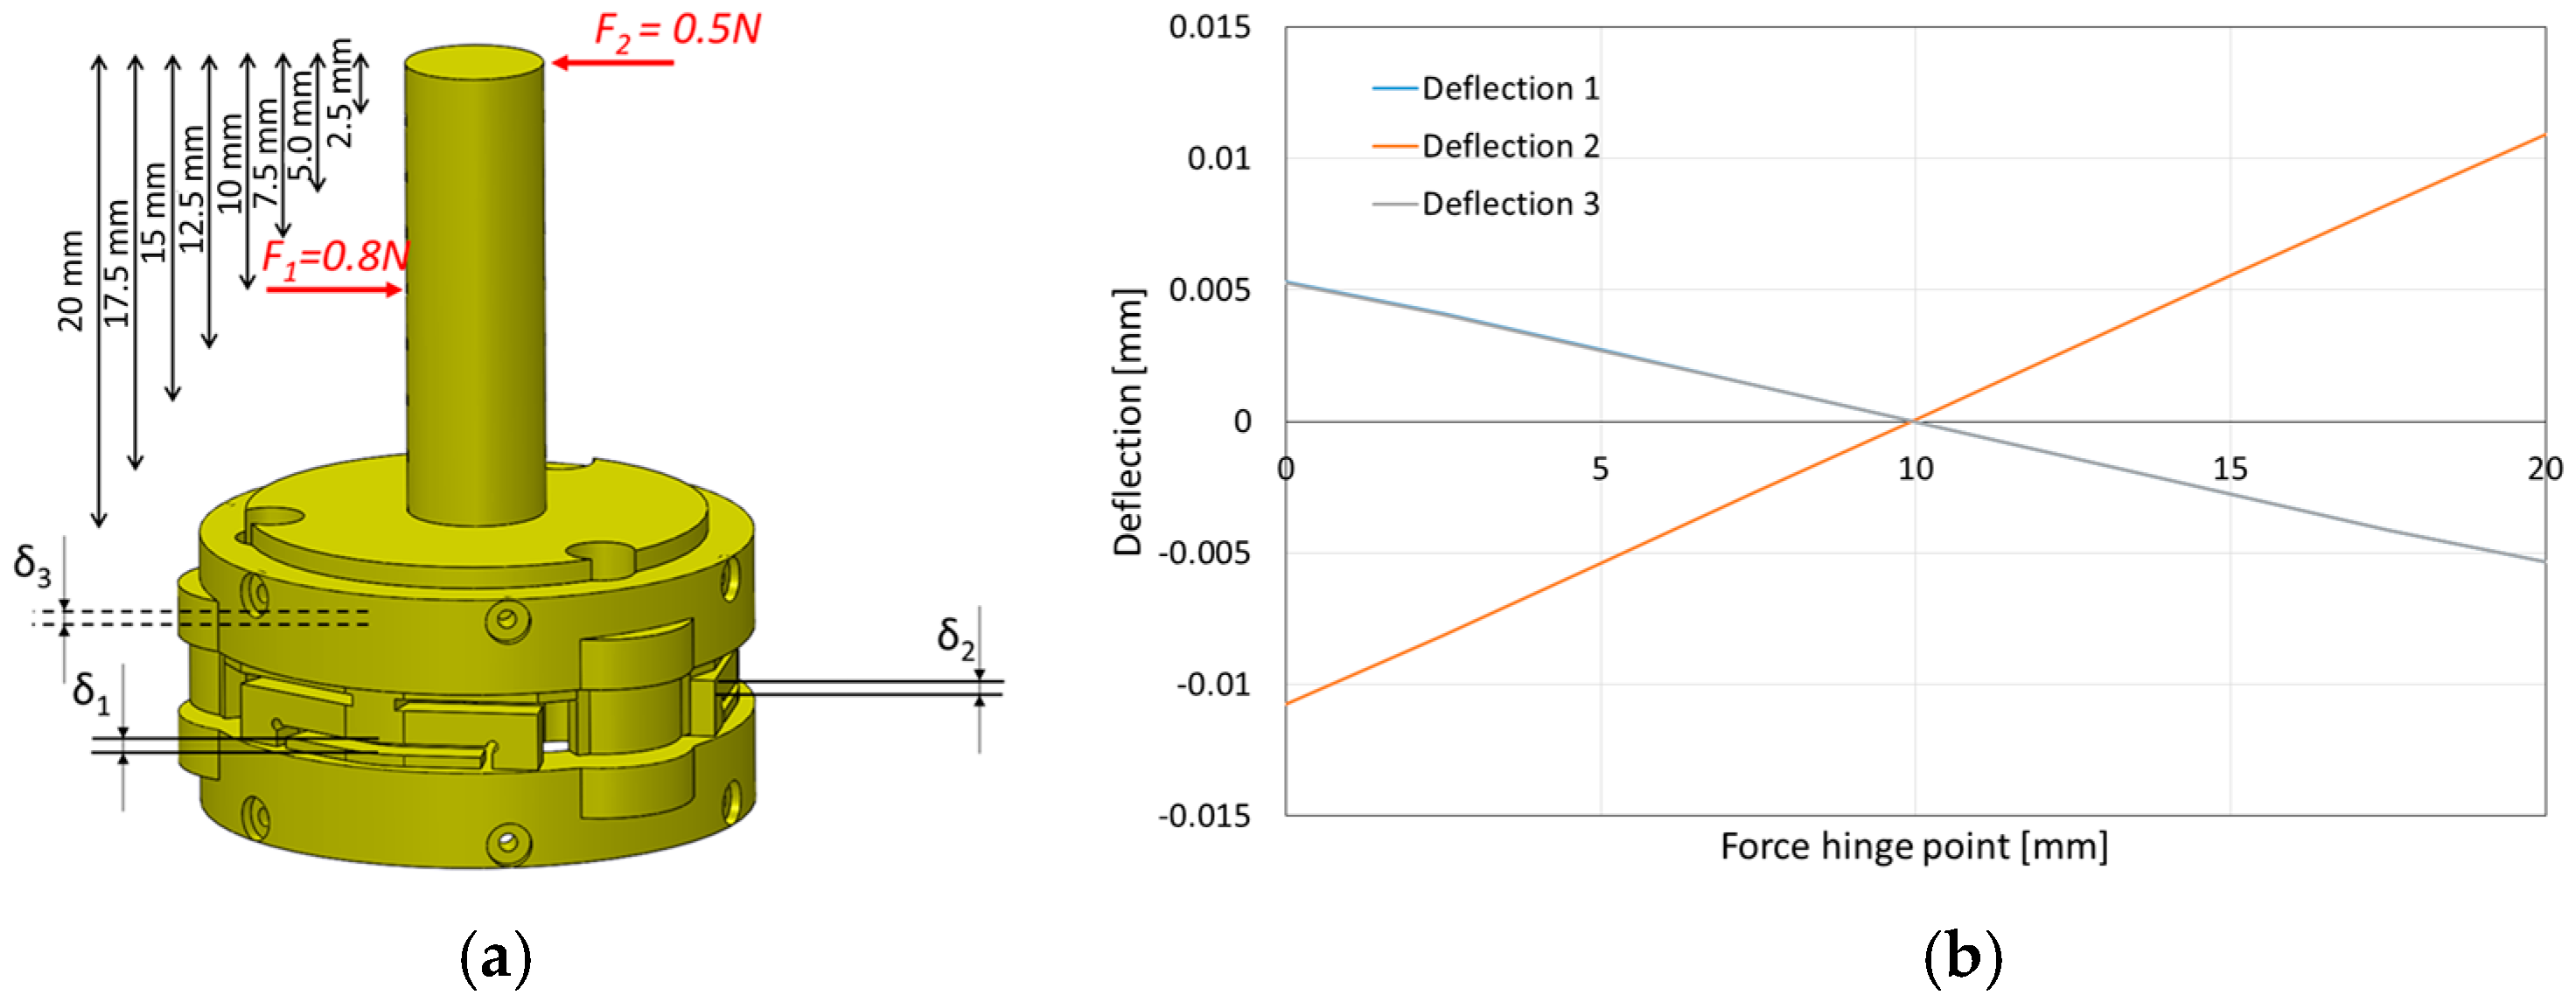
2.3.2. Model and Simulation for Sensor Structure

Depending on the desired measurement range of the force and moments, the sensor structure can be customized by choosing design parameters L, E, I, b and h as depicted in Figure 6 and in Equations (4)–(6). In this paper, to prove the efficiency of our proposed three-axis force sensor for the STIFF-FLOP arm, we designed the first prototype with a size and measurement range as shown in Table 1.
In our simulations, the values associated with the material properties for the 3D-printed beams as well as the remainder of the sensor structure were set based on the information provided by the 3D-printer manufacturer (PROJET VisiJet® EX200, 3D Systems Corporation), as follows: tensile modulus of 1283 MPa, mass density of 1020 kg/m3, and tensile strength of 42.5 MN/m2. In this simulation, we verified whether the sensor structure based on the three simply-supported beams could measure a certain range of force and moment components as summarized in Table 1. The simulation of exertion of force on the sensor structure implies a linear relationship between force and moment values and the deflections of the three beams (within the measurable ranges: −0.15 < δ < +0.15) (Figure 9 and Figure 10a–c).
The Multiple Linear Regression attempts to model the relationship between two or more independent variables and a dependent variable, by fitting a linear equation to the observed data [51]. In this implementation, every value of an independent variable (the deflections of the three beam) is associated with a value of the dependent variables, force Fz and moments Mx and My. Applying Multiple Linear Regression with independent variables δ1, δ2 and δ3 as shown in Figure 10a–c, the calibration matrix was calculated for Fz, Mx and My. As shown in Equations (14) and (15), from the deflections of the three beams δ1, δ2 and δ3, the estimated Fz, Mx and My can be obtained through the calculated calibration matrix.
Therefore, the force and moment components were estimated by multiplying the calibration matrix and the deflections of the three beam as shown in Figure 10d–f) and sensor’s performance parameters were calculated (accuracy (3%) and crosstalk (0.5%)).
[ C a l i b r a t i o n M a t r i x ] [ T h r e e B e a m D e f l e c t i o n s ] = [ F o r c e a n d M o m e n t s ]
[ k δ 11 k δ 12 k δ 13 k δ 21 k δ 22 k δ 23 k δ 31 k δ 32 k δ 33 ] [ δ 1 δ 2 δ 3 ] = [ F z M x M y ]

3. Sensor Calibration

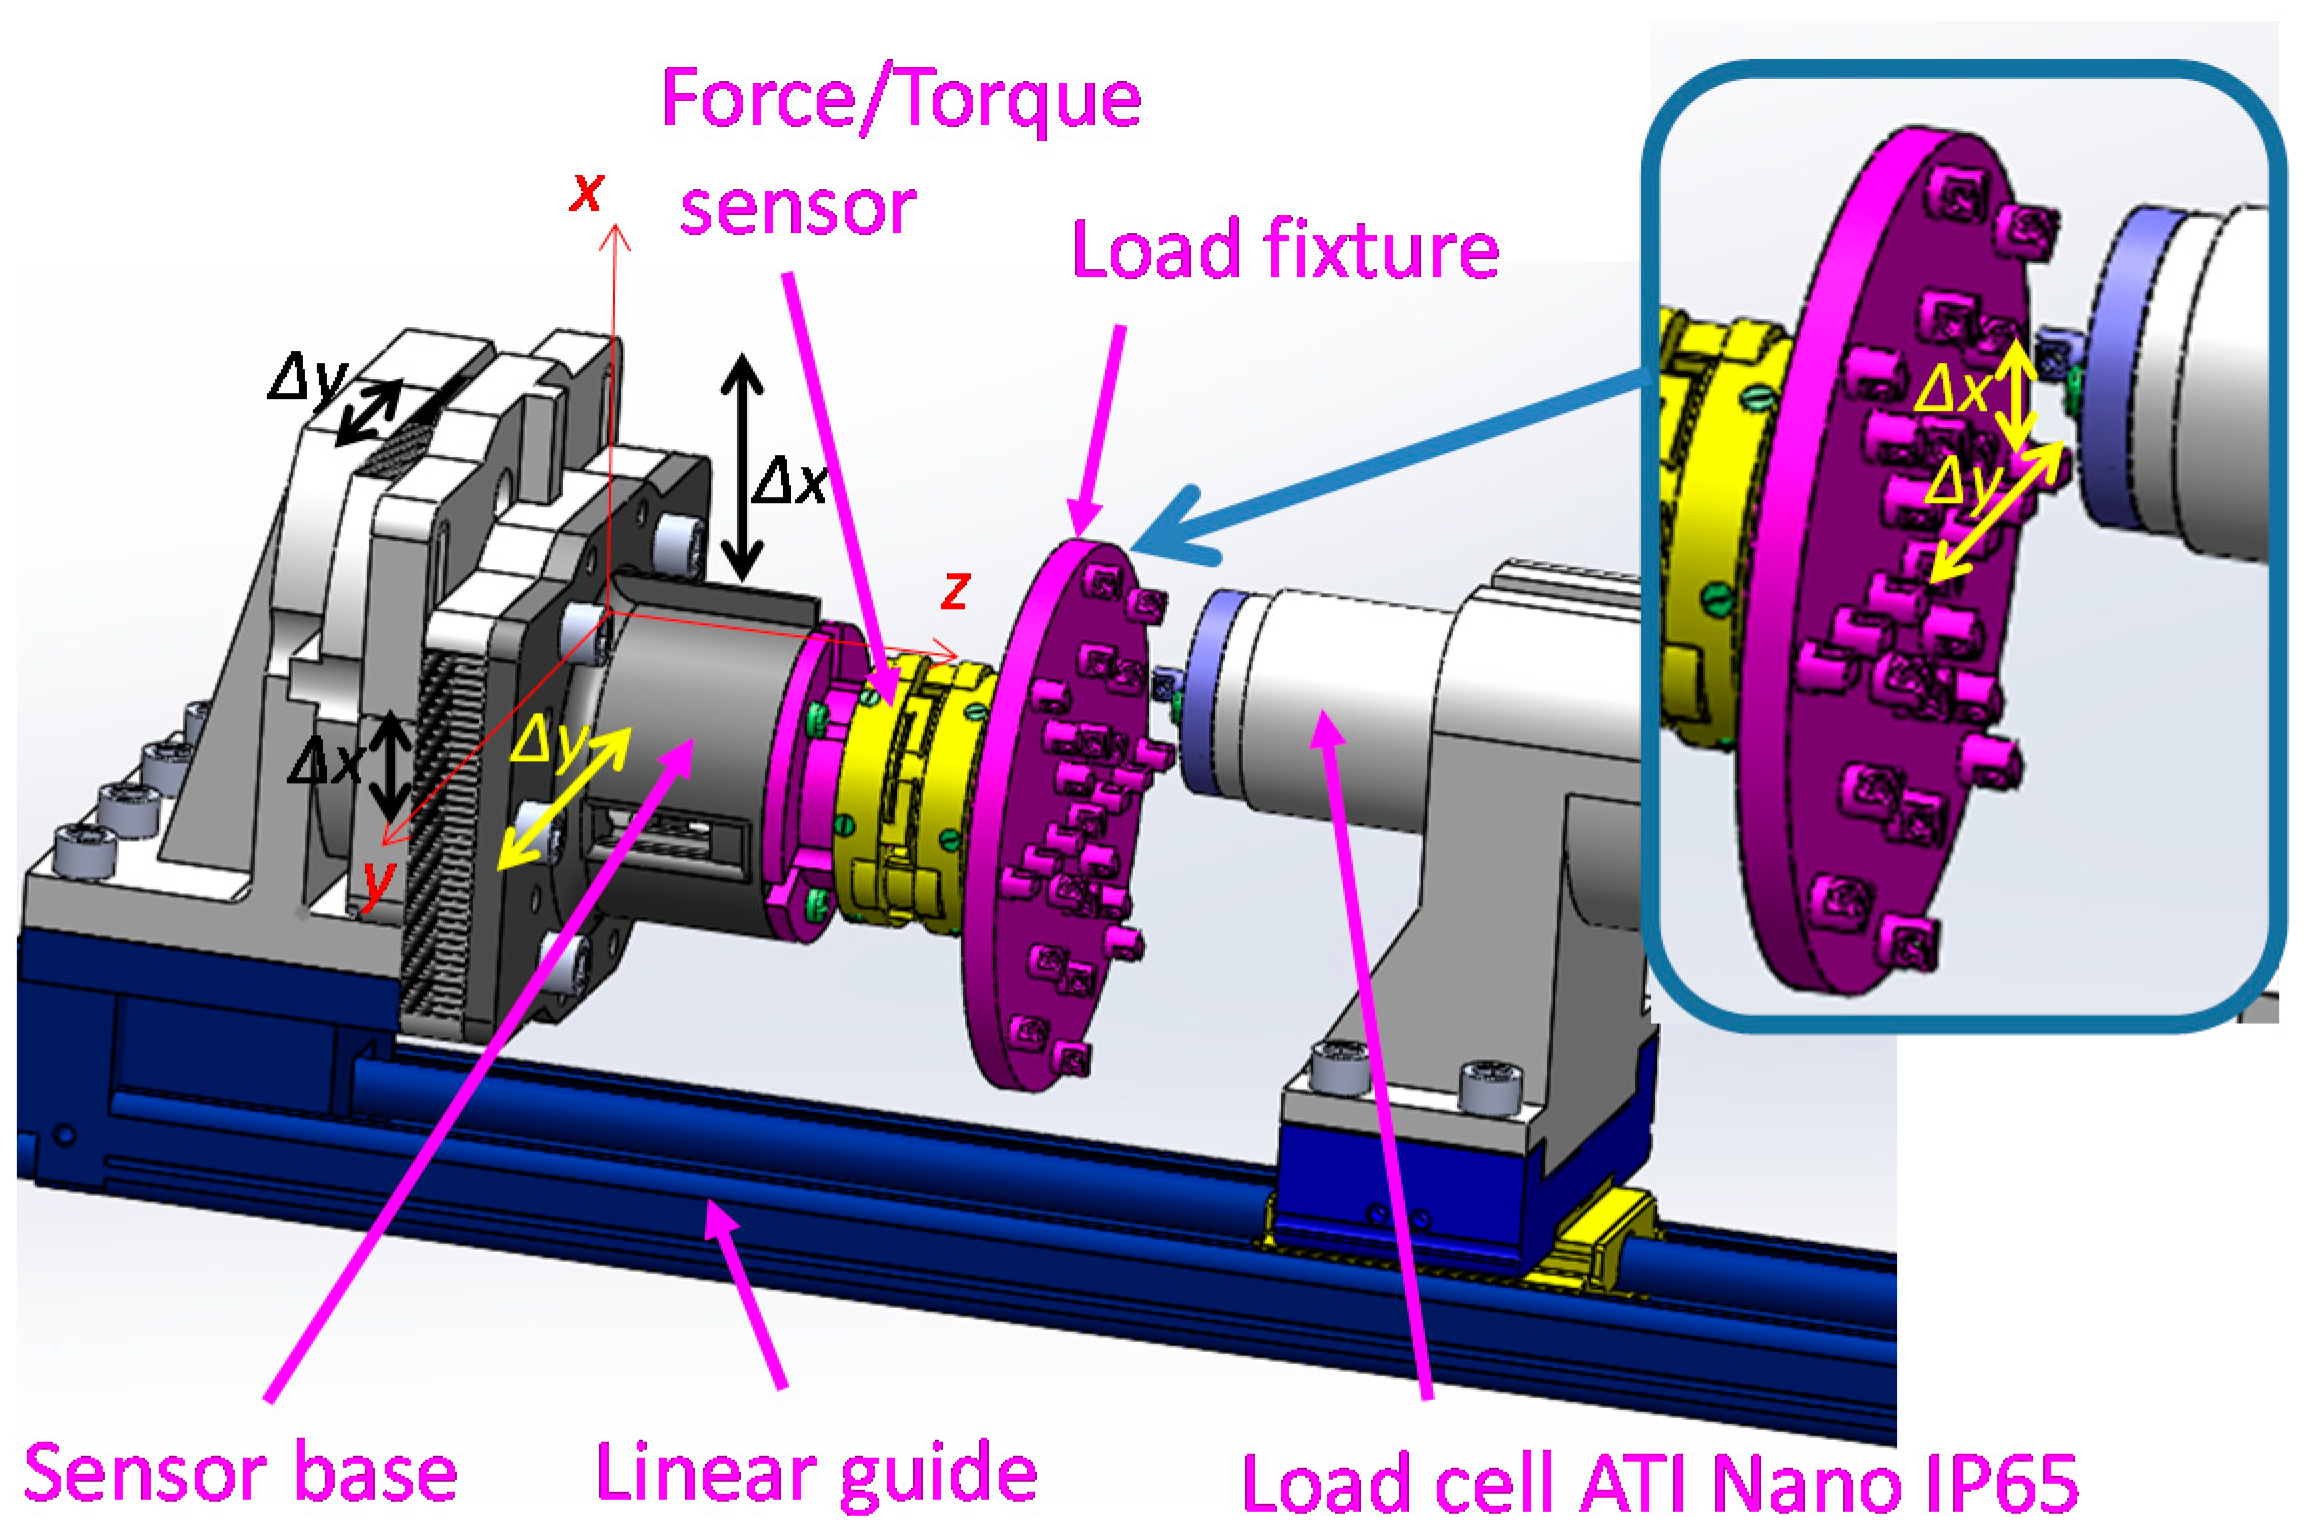
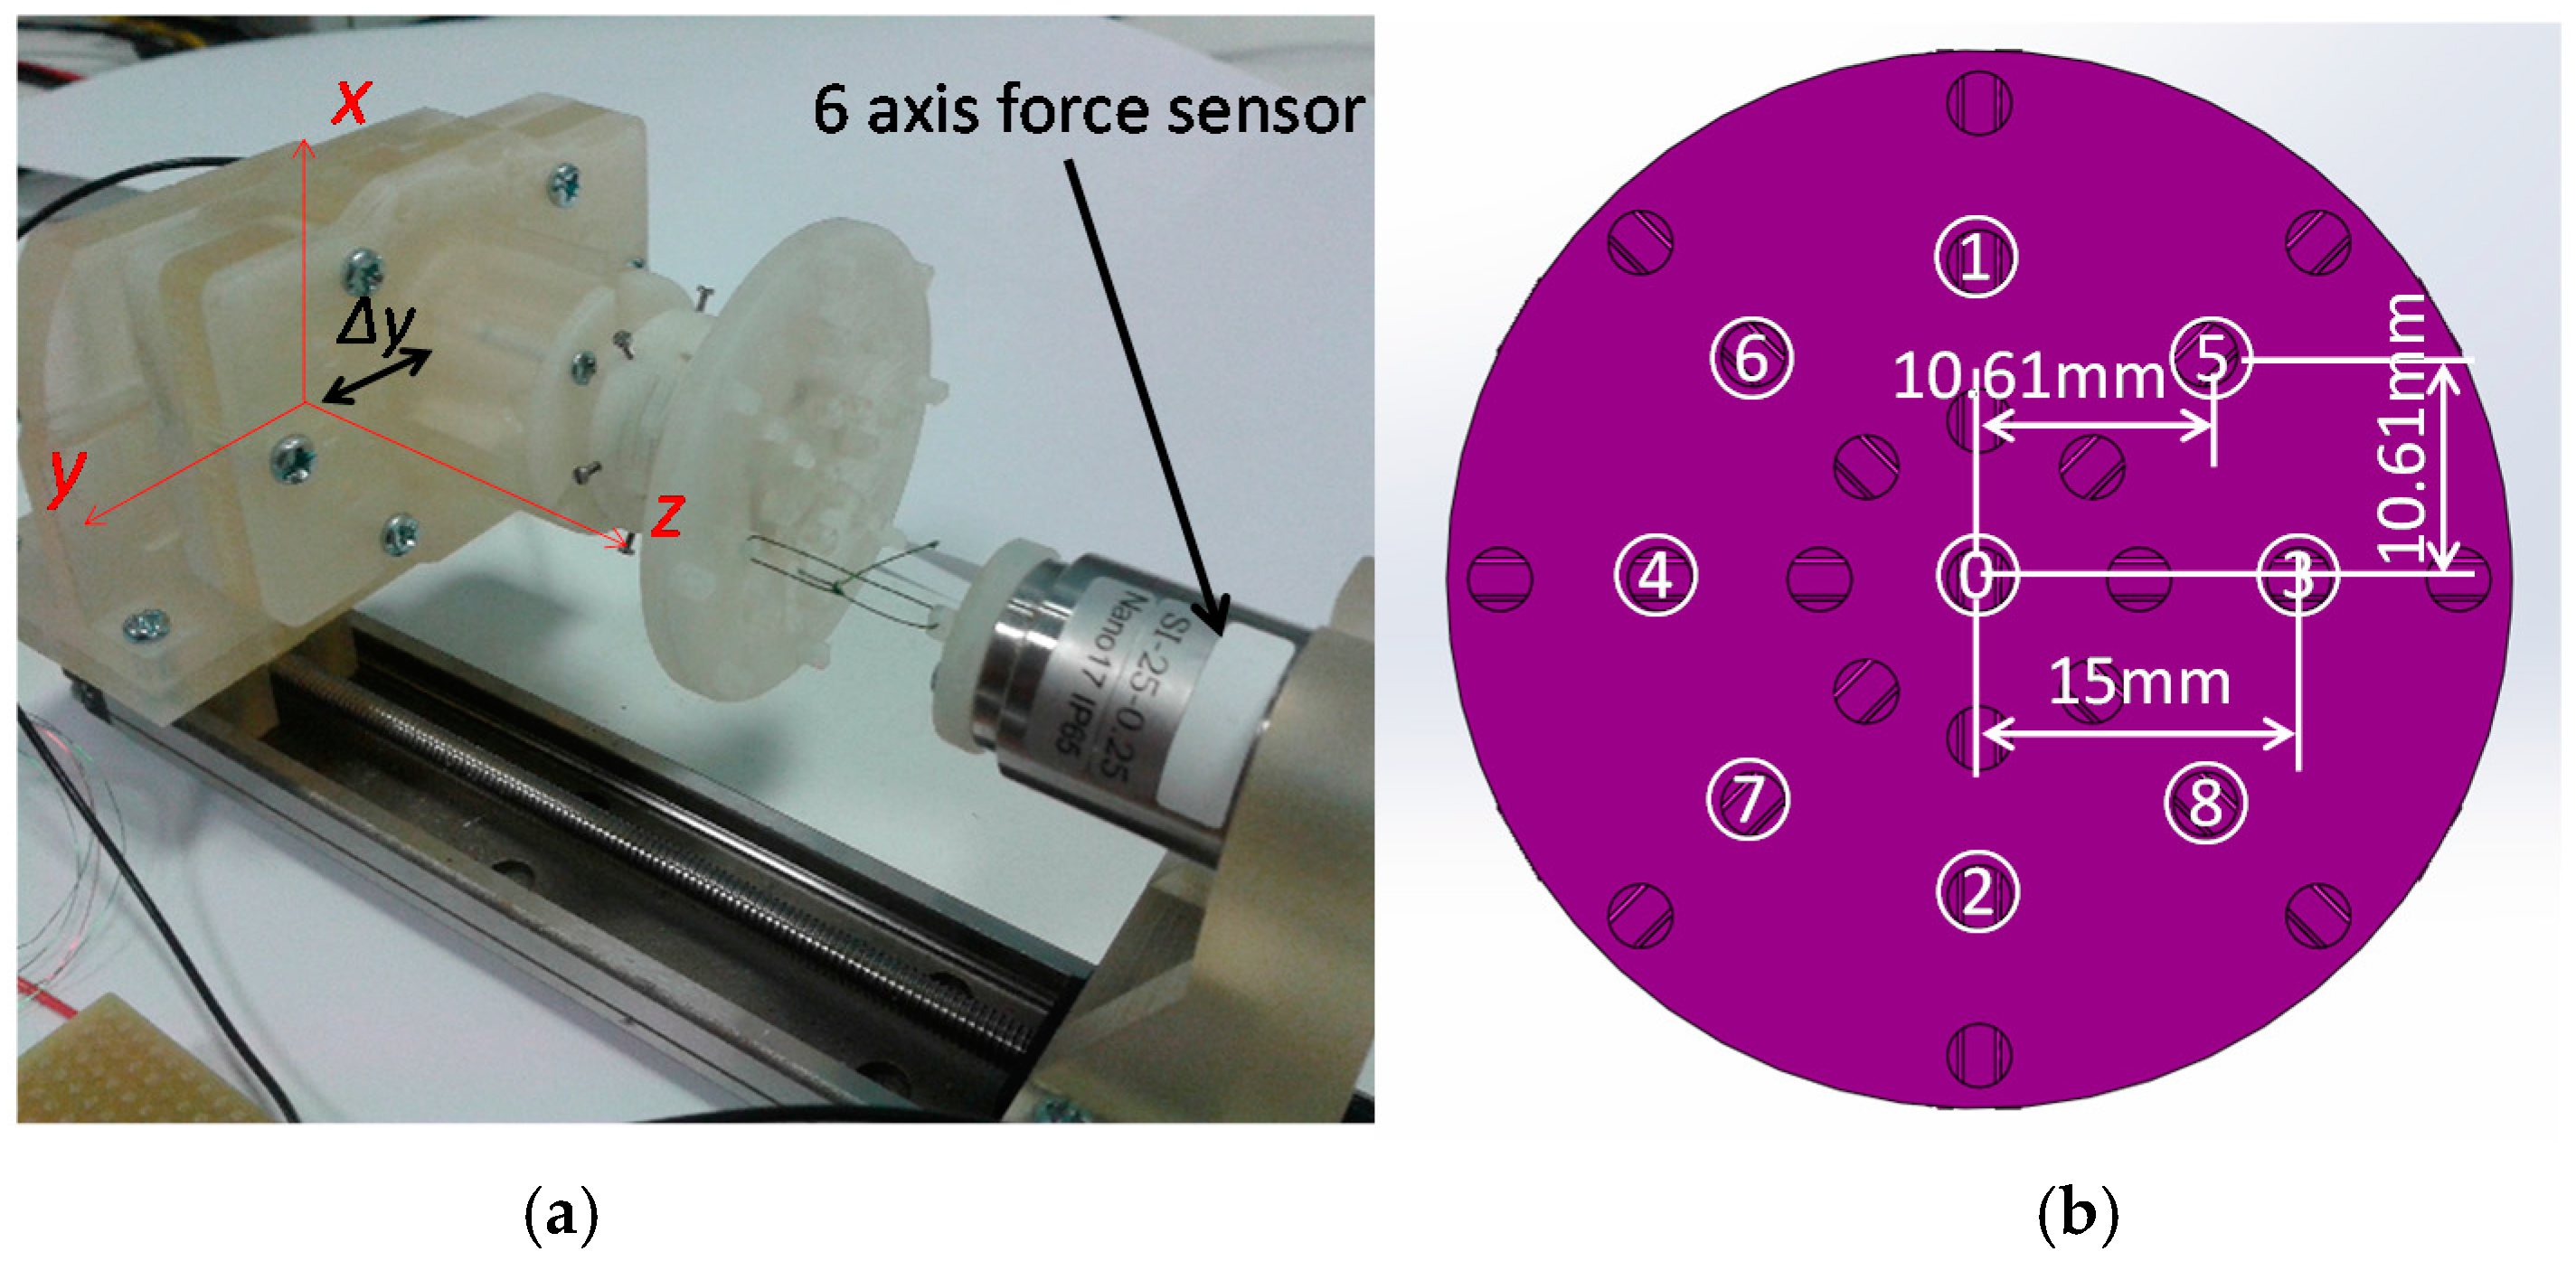
3.1. Setup for Calibration Experiments

Sensor calibration is the process of finding the relationship between a physical value and the output voltage of the sensor. In our application, the physical values are force and moment components: Fz, Mx and My. In order to find the relationship between the force and moment components and the output voltages of the three optoelectronic sensing elements, a calibration device is proposed as shown in Figure 11 and Figure 12. This device consists of a linear guide, a sensor base, a load fixture and a load cell (ATI Nano IP65). The force/torque sensor and the load fixture are mounted on the sensor base (Figure 11 and Figure 12). The sensor base can move along the x-axis and y-axis to investigate the three following conditions:
(1)
Force Fz along z-axis as depicted ⓪ (in Figure 12b);
(2)
Force Fz and moment Mx or My (denoted as (Fz, Mx) ①② or (Fz, My) ③④ (in Figure 12b)); and
(3)
Force Fz and both moments Mx and My (denoted as (Fz, Mx, My) ⑤⑥⑦⑧ (in Figure 12b)) while an actuator moves along the z-axis as shown in Figure 11 and Figure 12.
In these experiments, a tensile force and a moment are applied to find the relationship between physical force/moment from the load cell and the output voltages of the three optoelectronic sensing elements of our sensor. The moment is calculated by multiplying the tensile force and a distance as shown in Figure 12. The experimental results show the sensor structure has large hysteresis due to the use of ABS plastic materials (Figure 13) while loading and unloading force and moment values are consistent with the simulation results (Figure 10a–c).

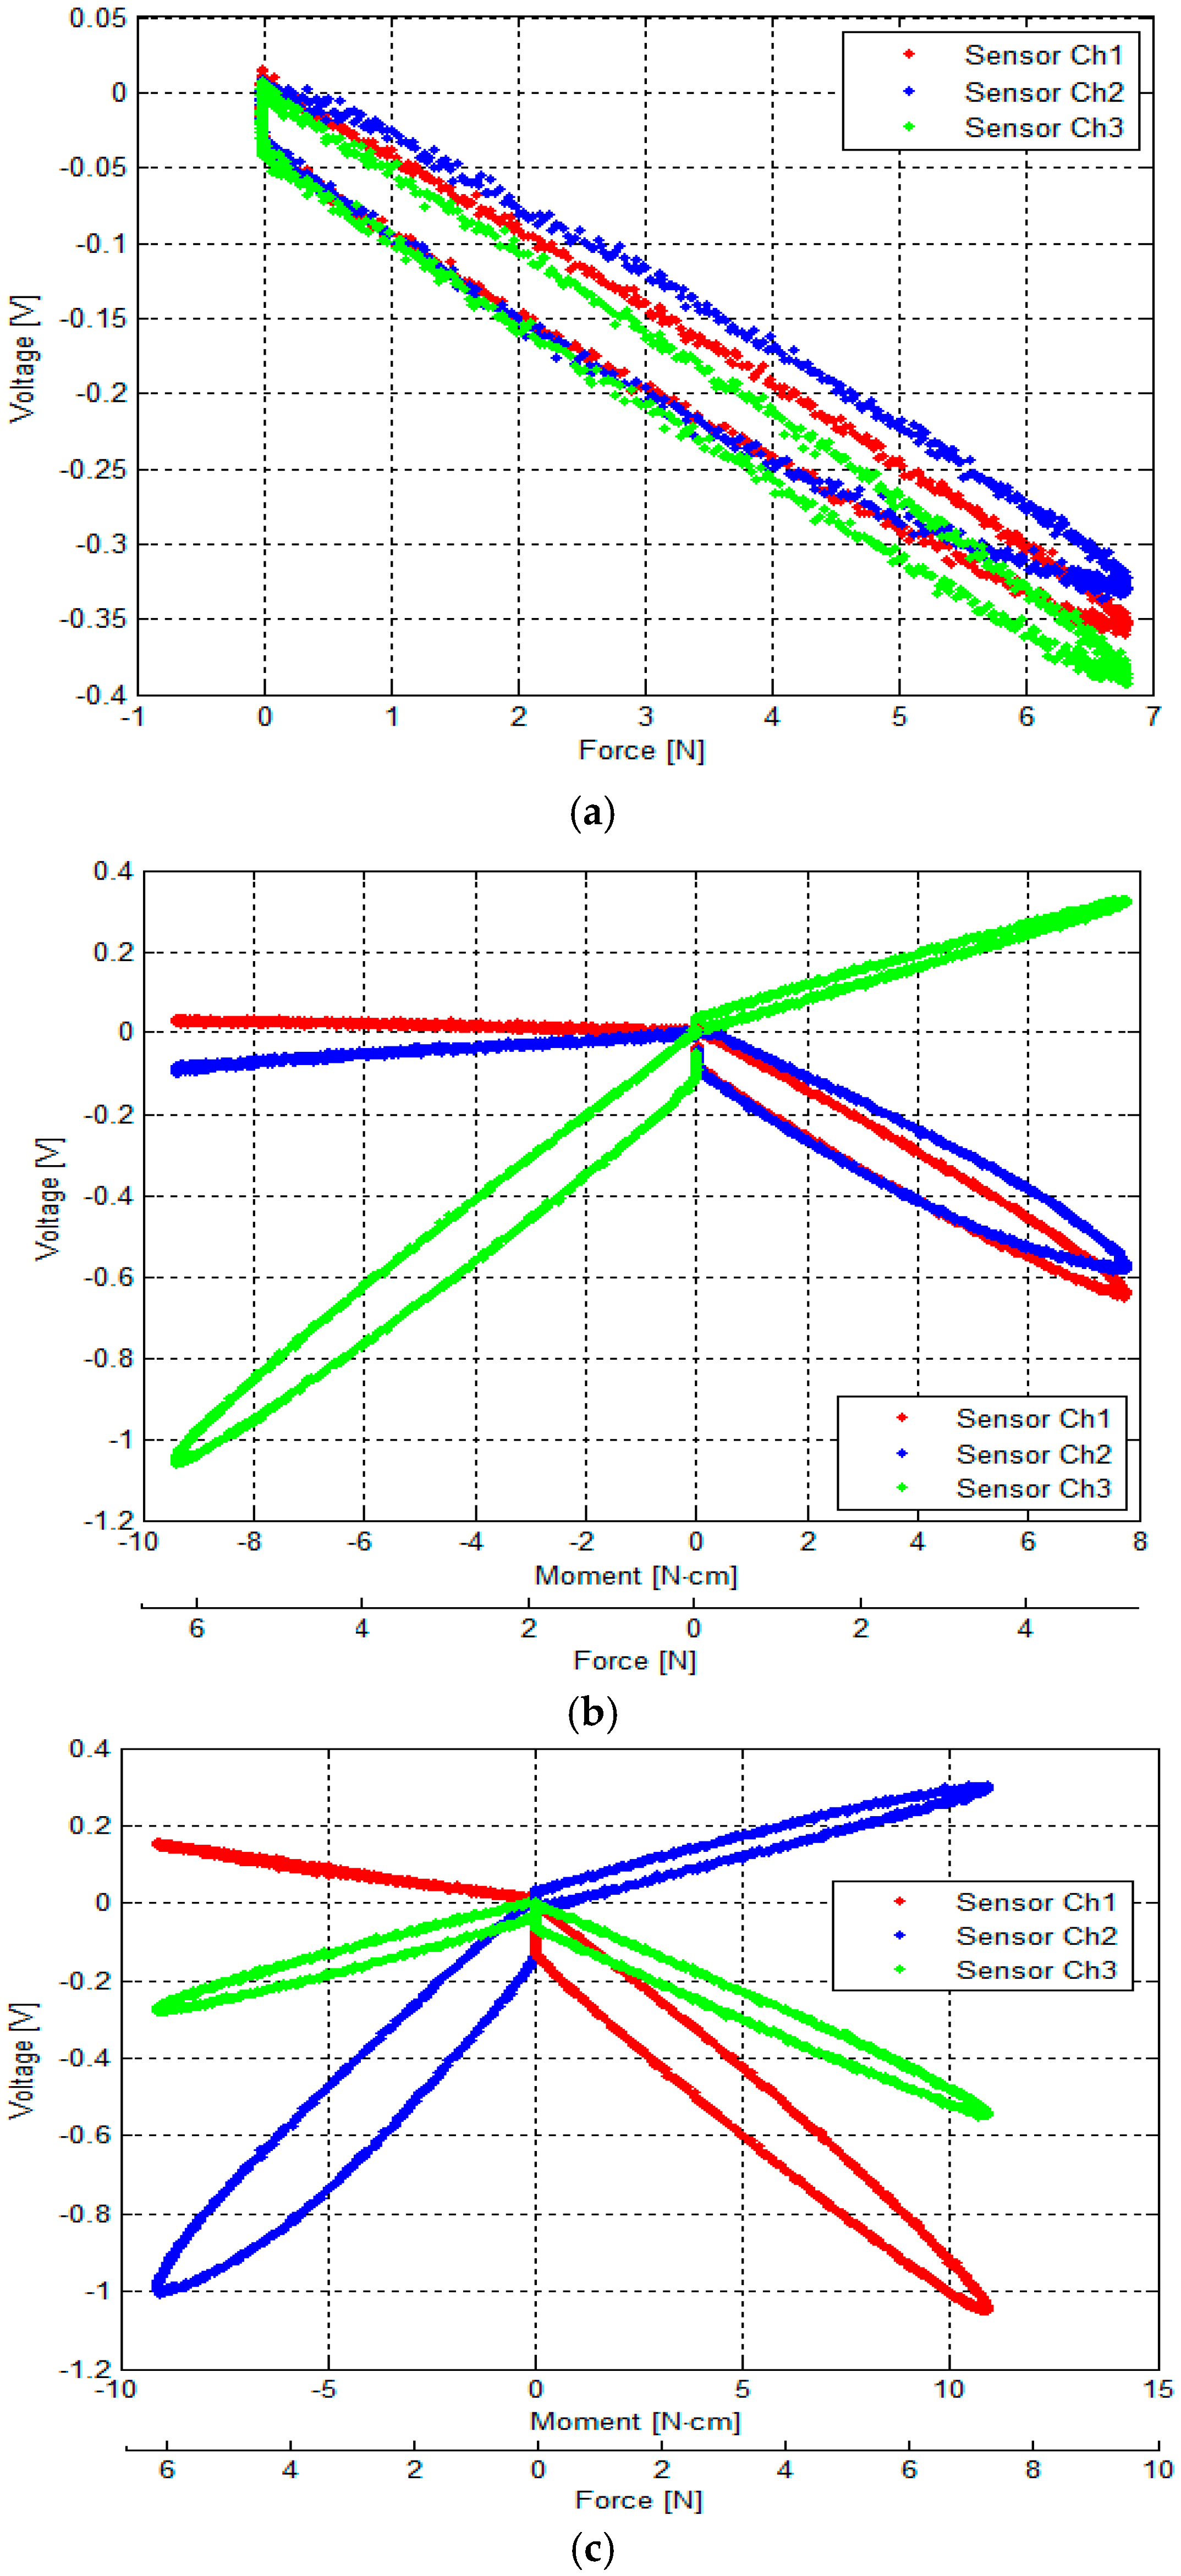
3.2. Calculation of Calibration Matrix by Analytical and Empirical Approaches

Sensor calibration was carried out using the calibration device, examining these three conditions. The results of the calibration are shown in Figure 13:
  • Figure 13a shows the relationship between the output voltages of the three optoelectronic sensing elements and Fz.
  • Figure 13b shows the relationship between output voltages of the three optoelectronic sensing elements and (Fz, Mx).
  • Figure 13c shows the relationship between the output voltages of the three optoelectronic sensing elements and (Fz, My).
All graphs show that the relationships between the physical values, Fz, (Fz, Mx), and (Fz, My), and the corresponding sensor output voltages are relatively linear, albeit suffering from noticeable hysteresis. It is noted that there is a degree of cross coupling between the sensing elements, i.e., the load on one axis produces a change in output on other axes. Here, each optoelectronic sensing element is individually calibrated with loads applied along each axis.
The calibration data are used to generate a calibration matrix, which is used to convert the output voltages to force and moment loading data. The three-by-three calibration matrix is multiplied by the three-element voltage vector (column) to obtain the calibrated, decoupled output (Equation (13)):
k v = [ 6.3846 6.8163 5.9703 3.4476 3.6808 6.4479 5.9376 6.3391 0 ]
[ C a l i b r a t i o n M a t r i x ] [ S e n s o r O u t p u t V o l t s ] = [ F o r c e a n d M o m e n t s ]
[ k e 11 k e 12 k e 13 k e 21 k e 22 k e 23 k e 31 k e 32 k e 33 ] [ v 1 v 2 v 3 ] = [ F z M x M y ]
k e = [ 5.6456 5.3600 5.5298 5.1774 2.9146 8.5146 7.4585 7.8664 0.7881 ]
From the experiment result as shown in Figure 13a, the three constants (m1, m2 and m3) are obtained experimentally, the analytical calibration matrix kv is calculated by Equation (13) and parameters (Table 1) as shown in Equation (16). At the same time, the calibration matrix ke is also calculated by empirical approach, Multiple Linear Regression.
Applying Multiple Linear Regression with independent variables v1, v2 and v3 as shown in Figure 13, the calibration matrix was calculated for Fz, Mx and My. As shown in Equations (17)–(19), from the sensor voltage samples v1, v2 and v3, the estimated Fz, Mx and My can be obtained through the calculated calibration matrix.
Although the analytically calculated calibration matrix (Equation (16)) is not exactly the same as the empirically obtained one (Equation (19)), they are considerably analogous.

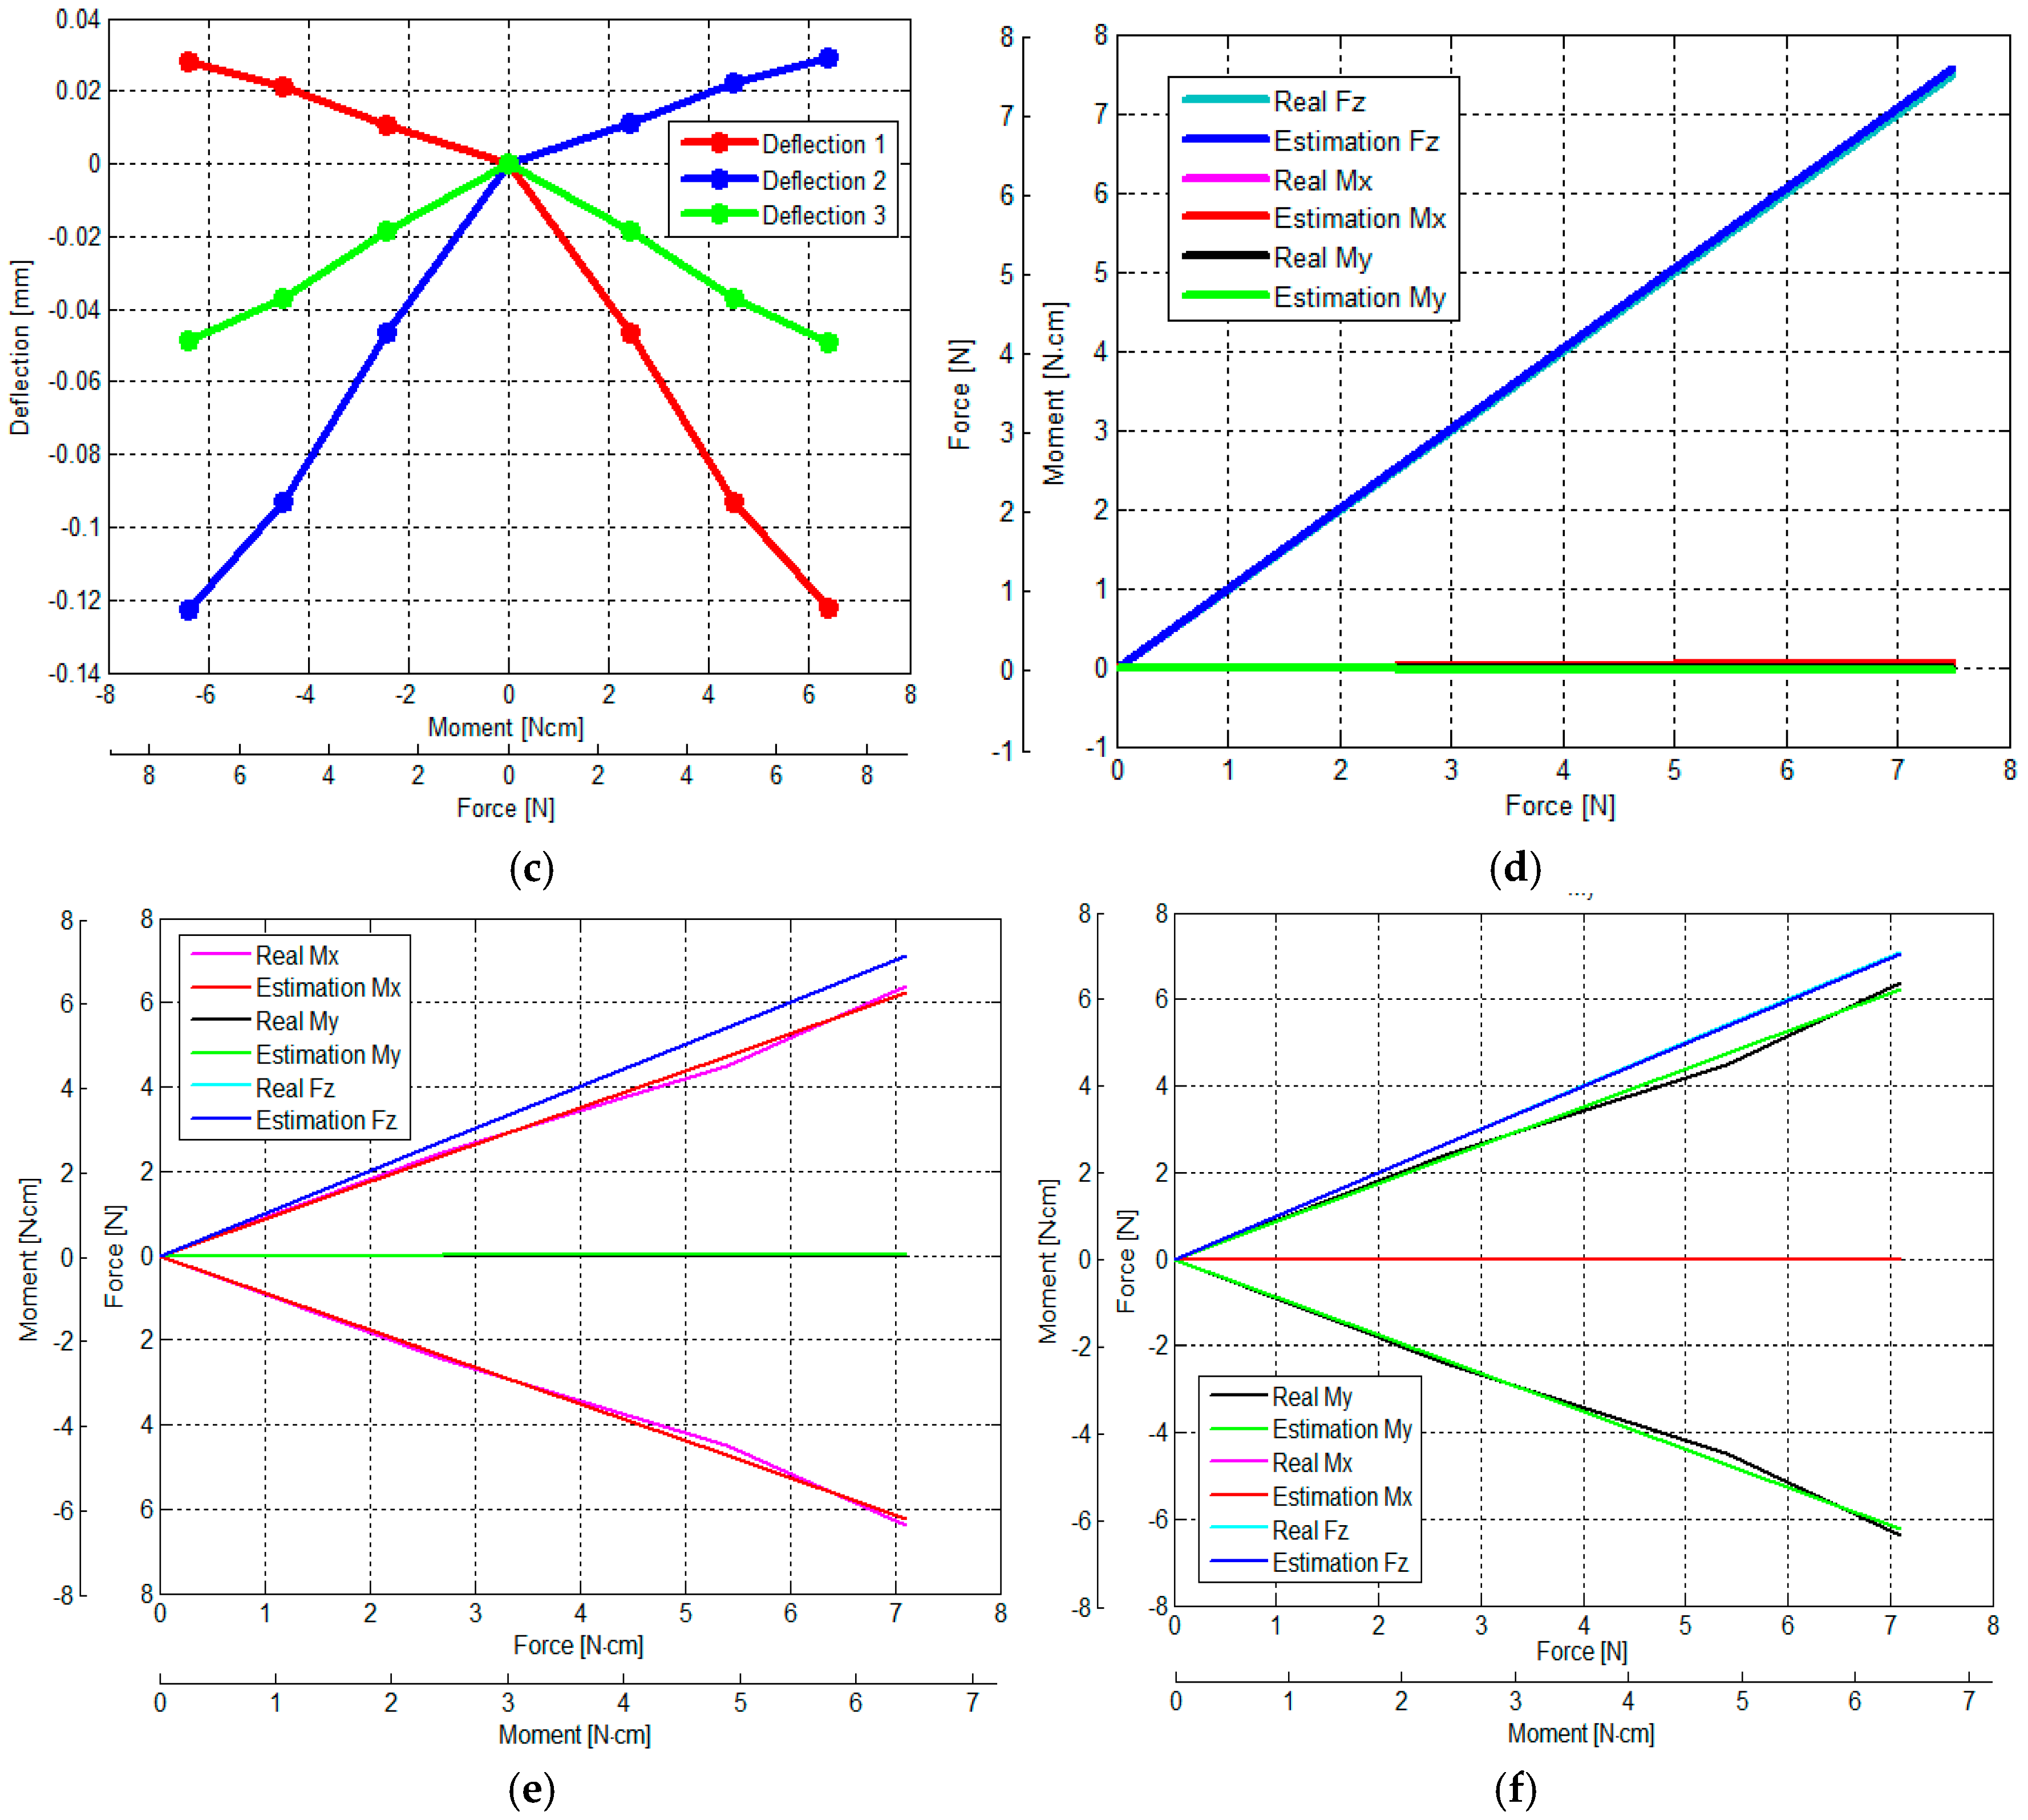
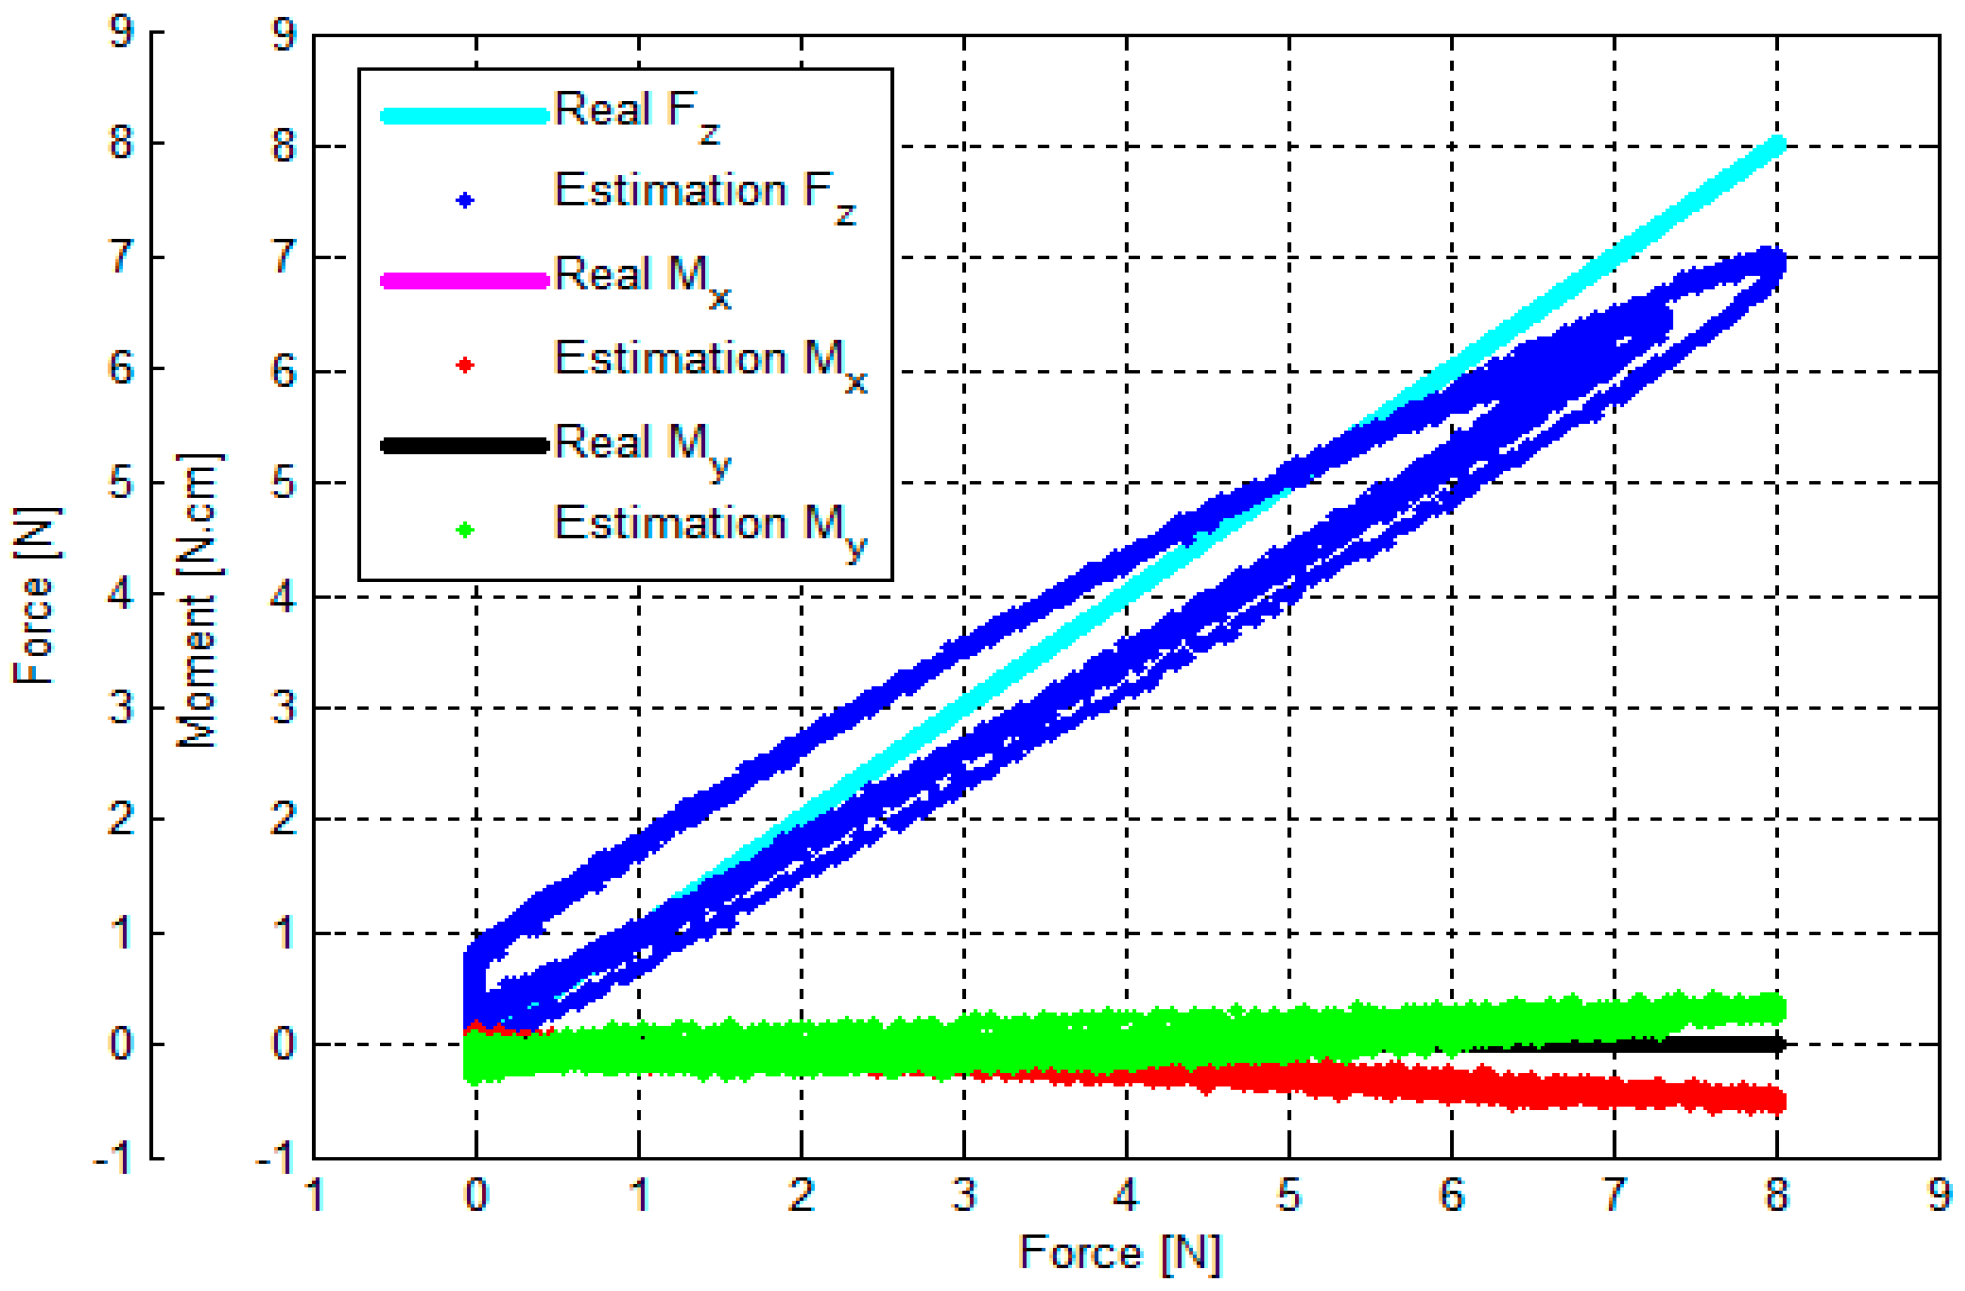
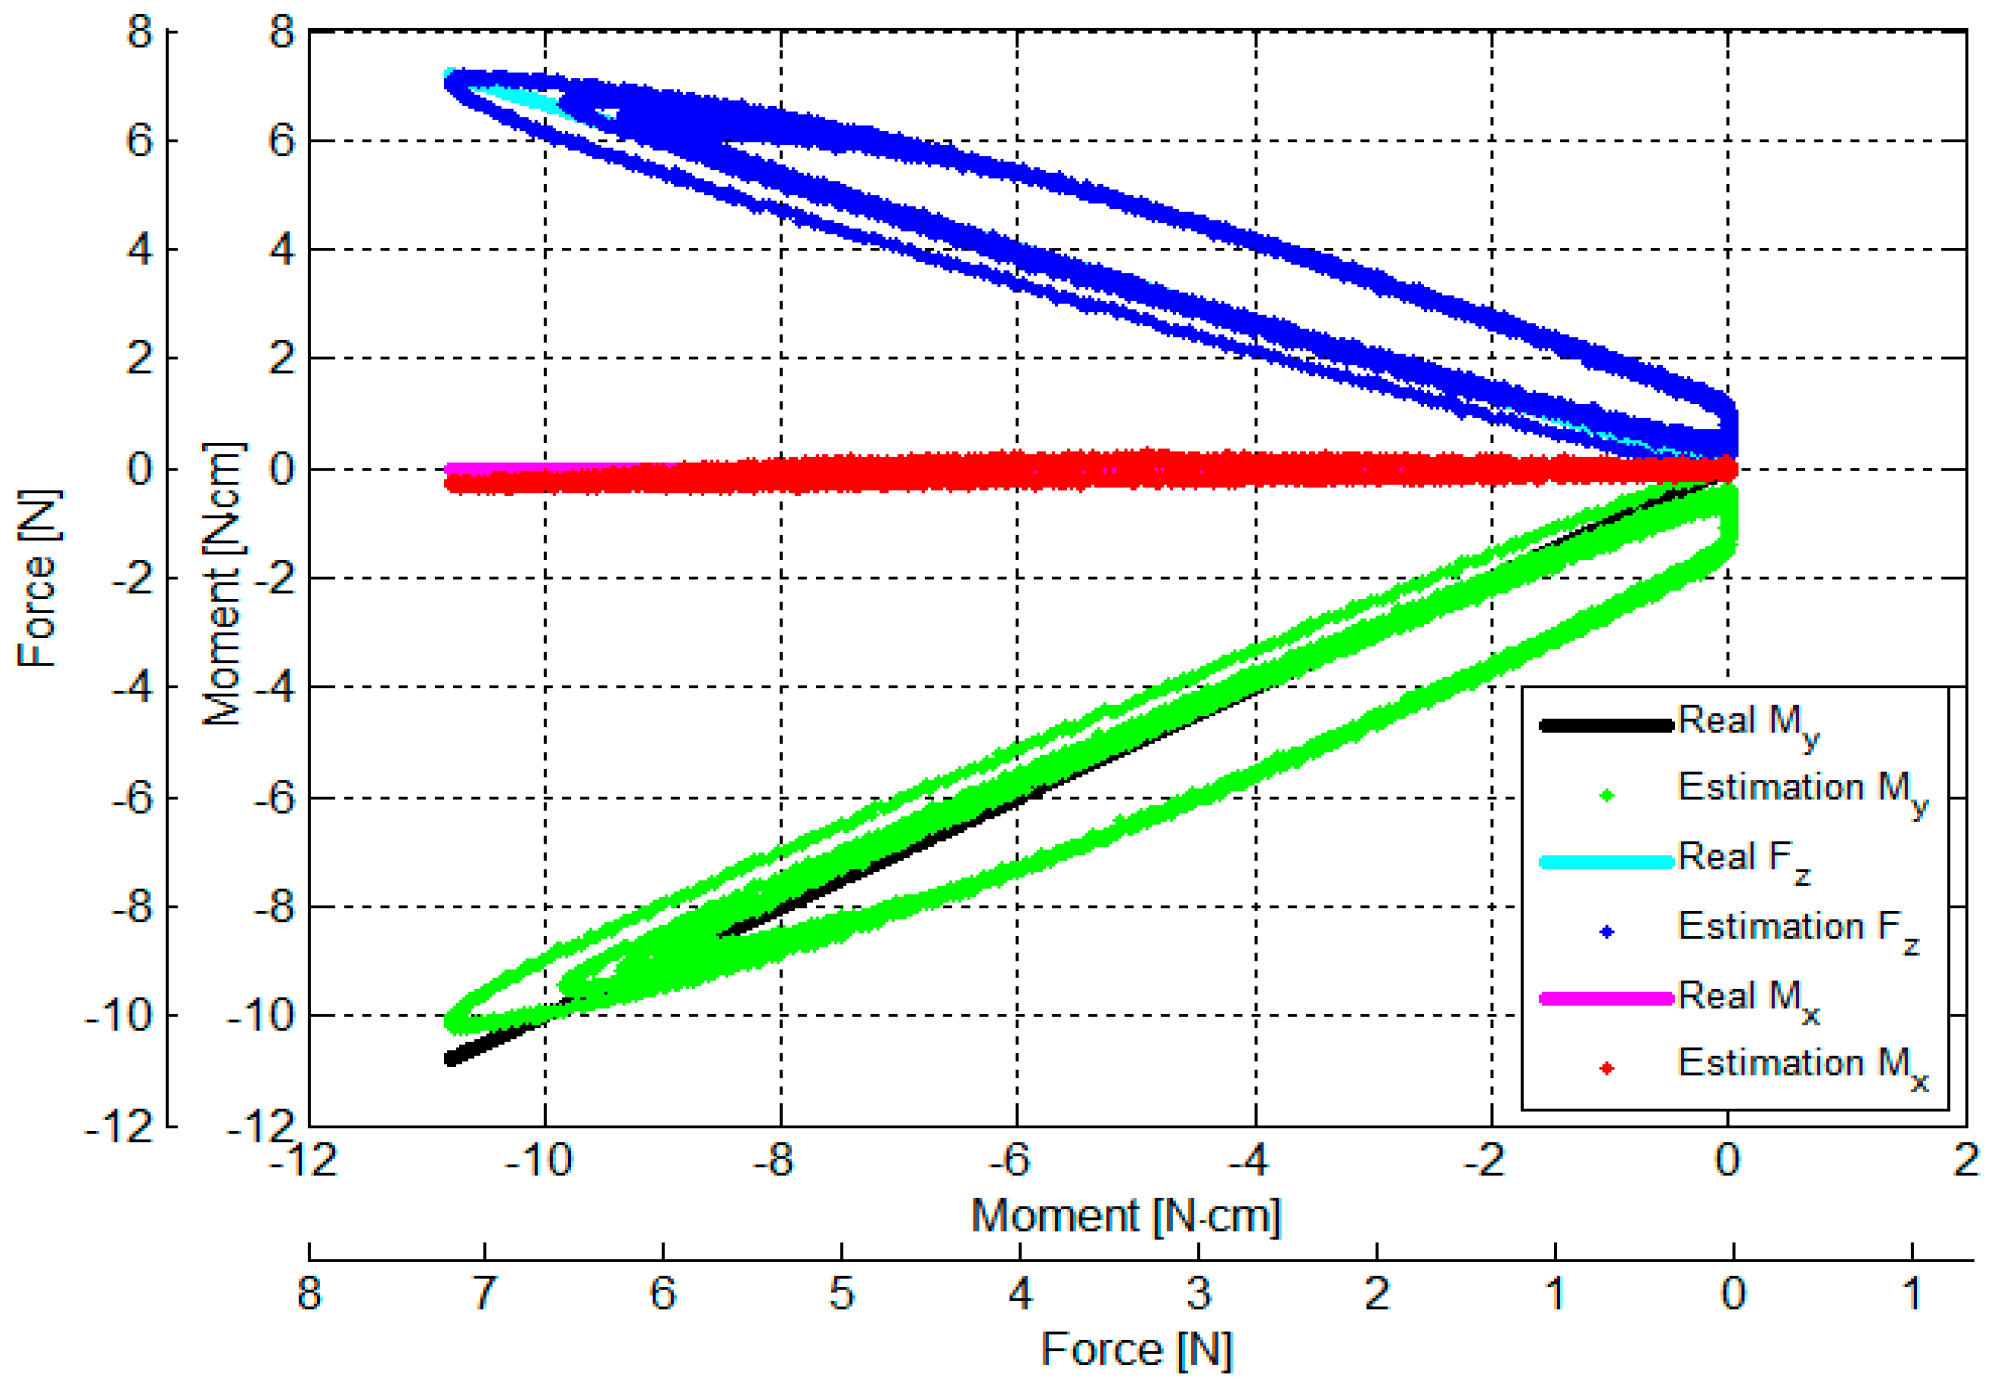
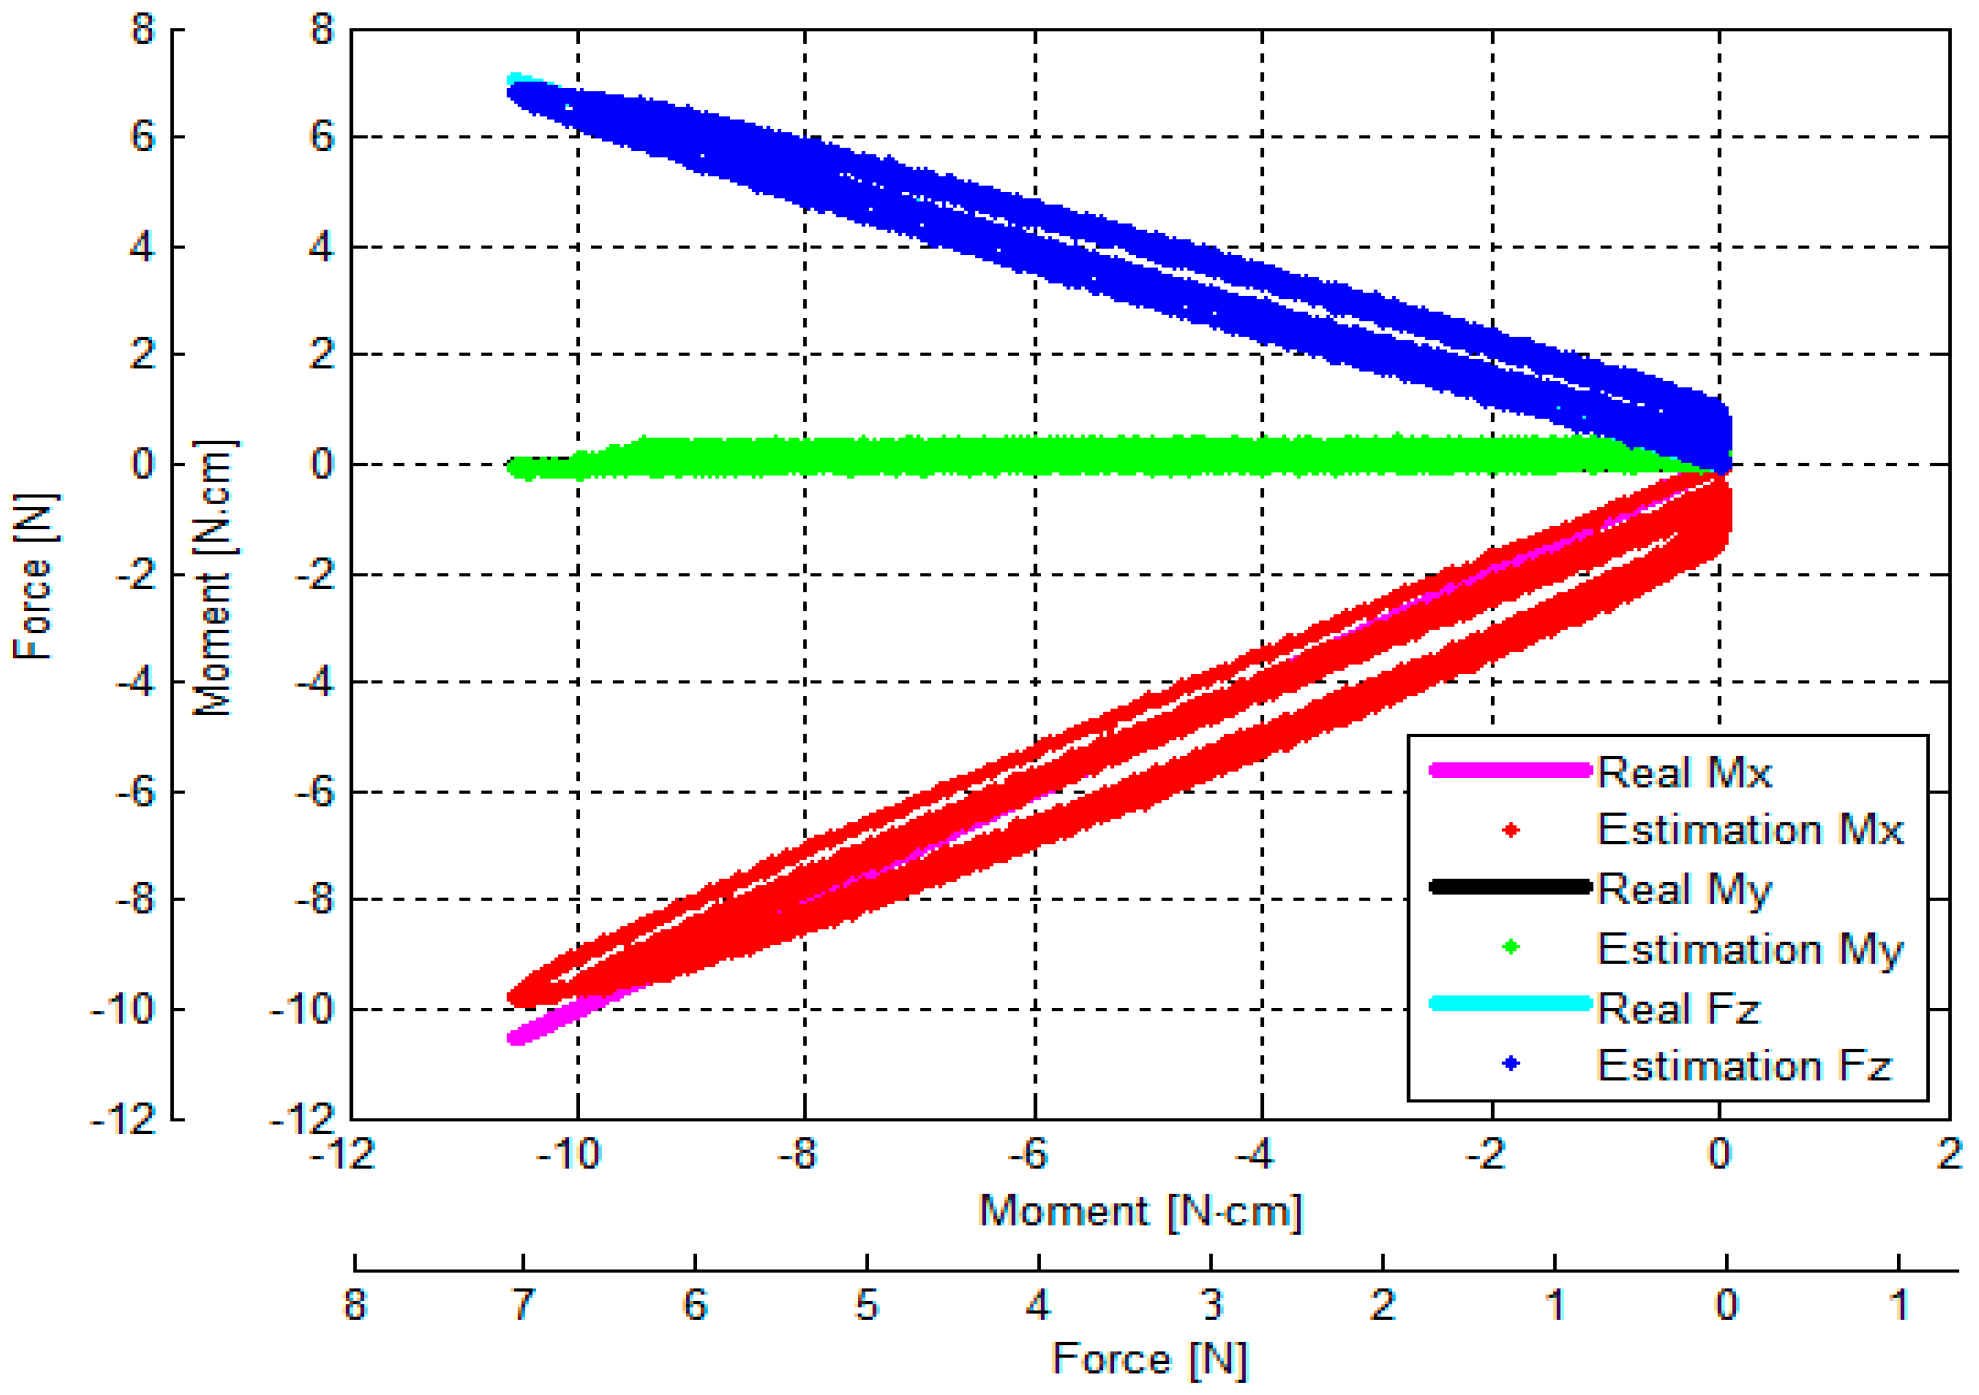
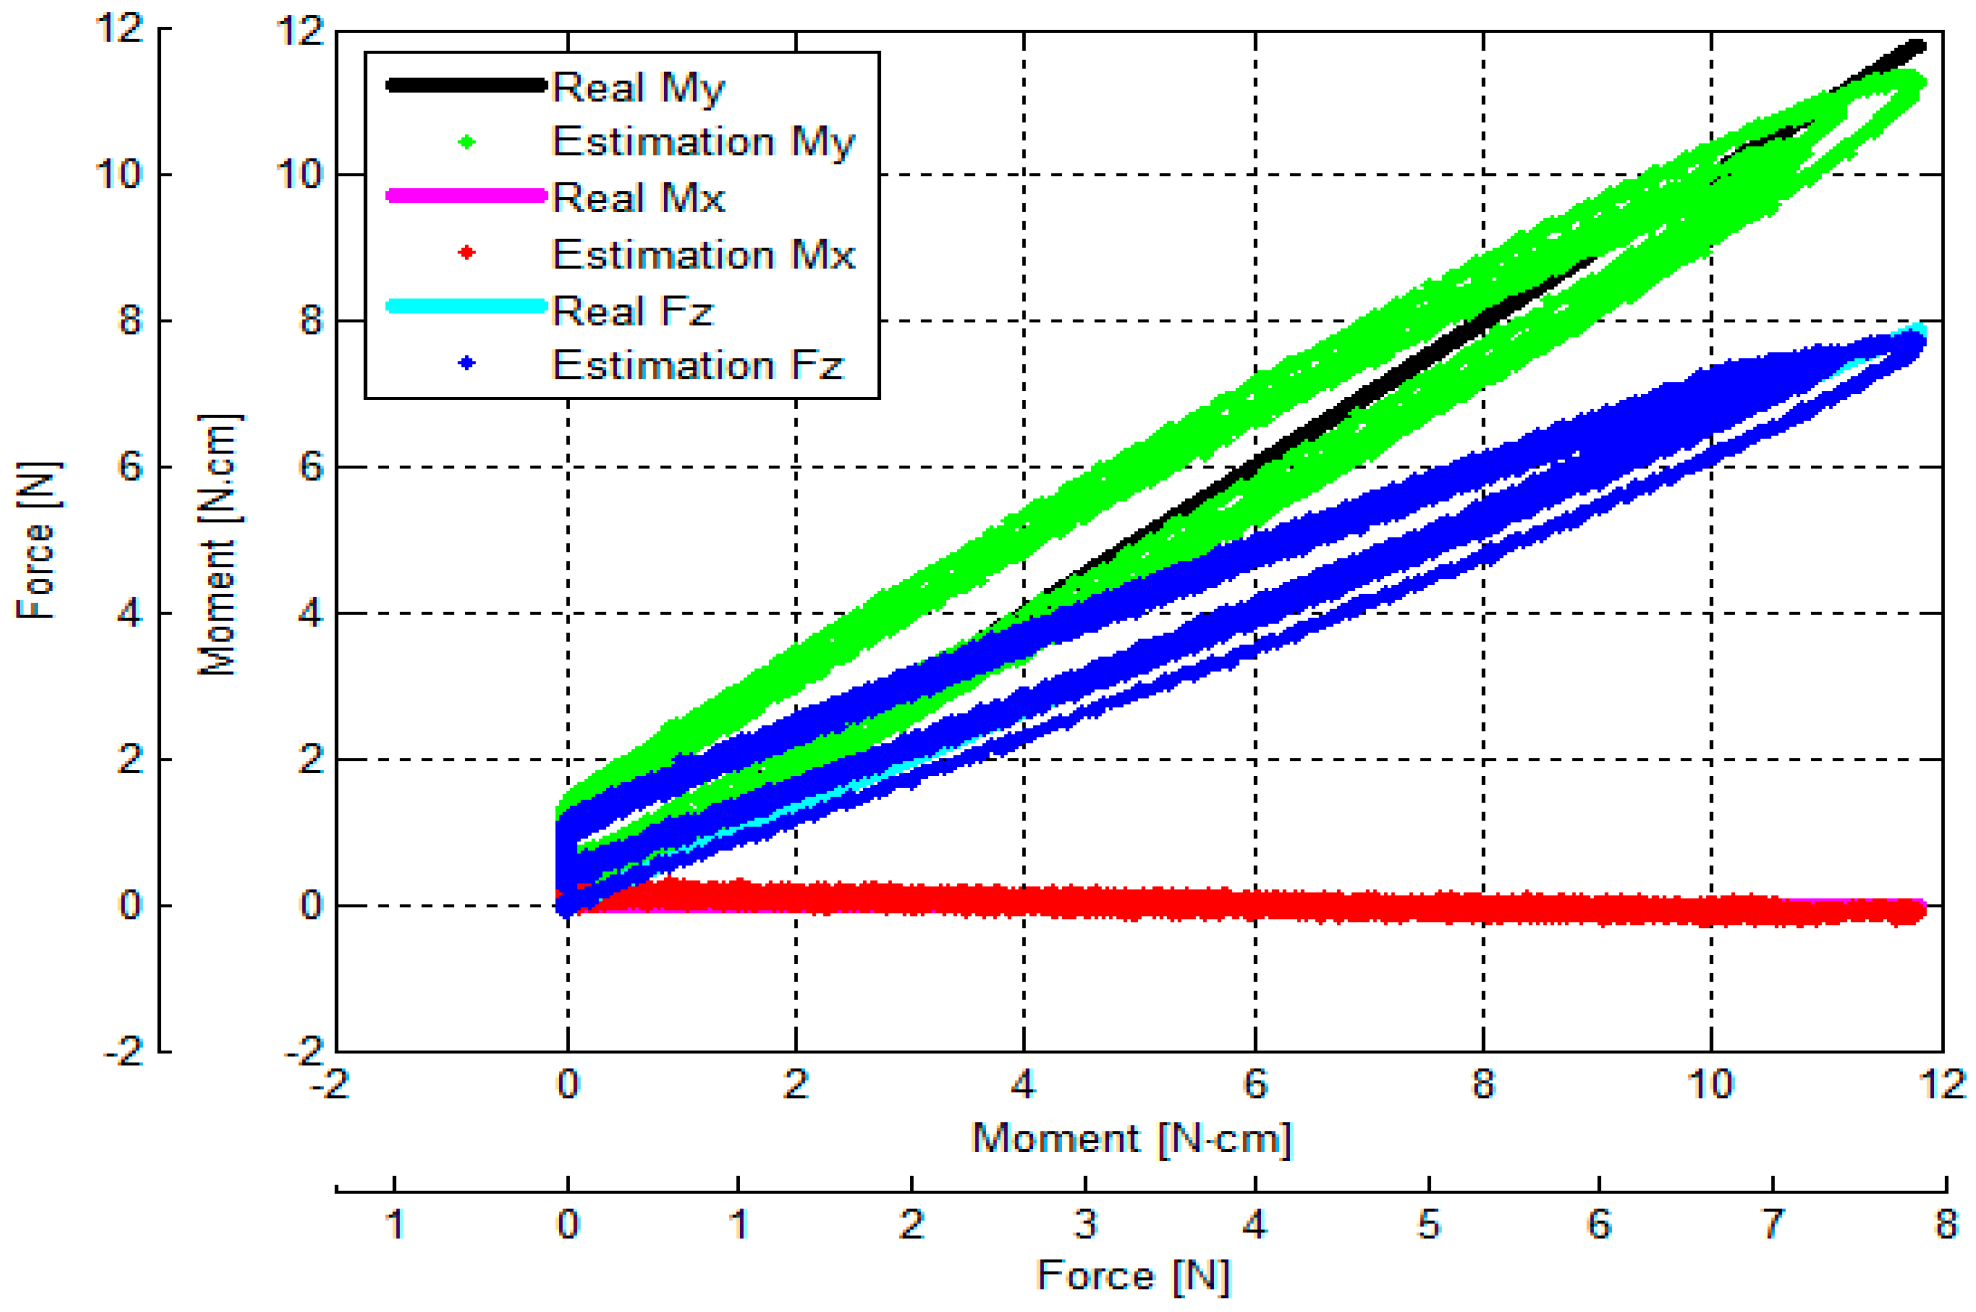
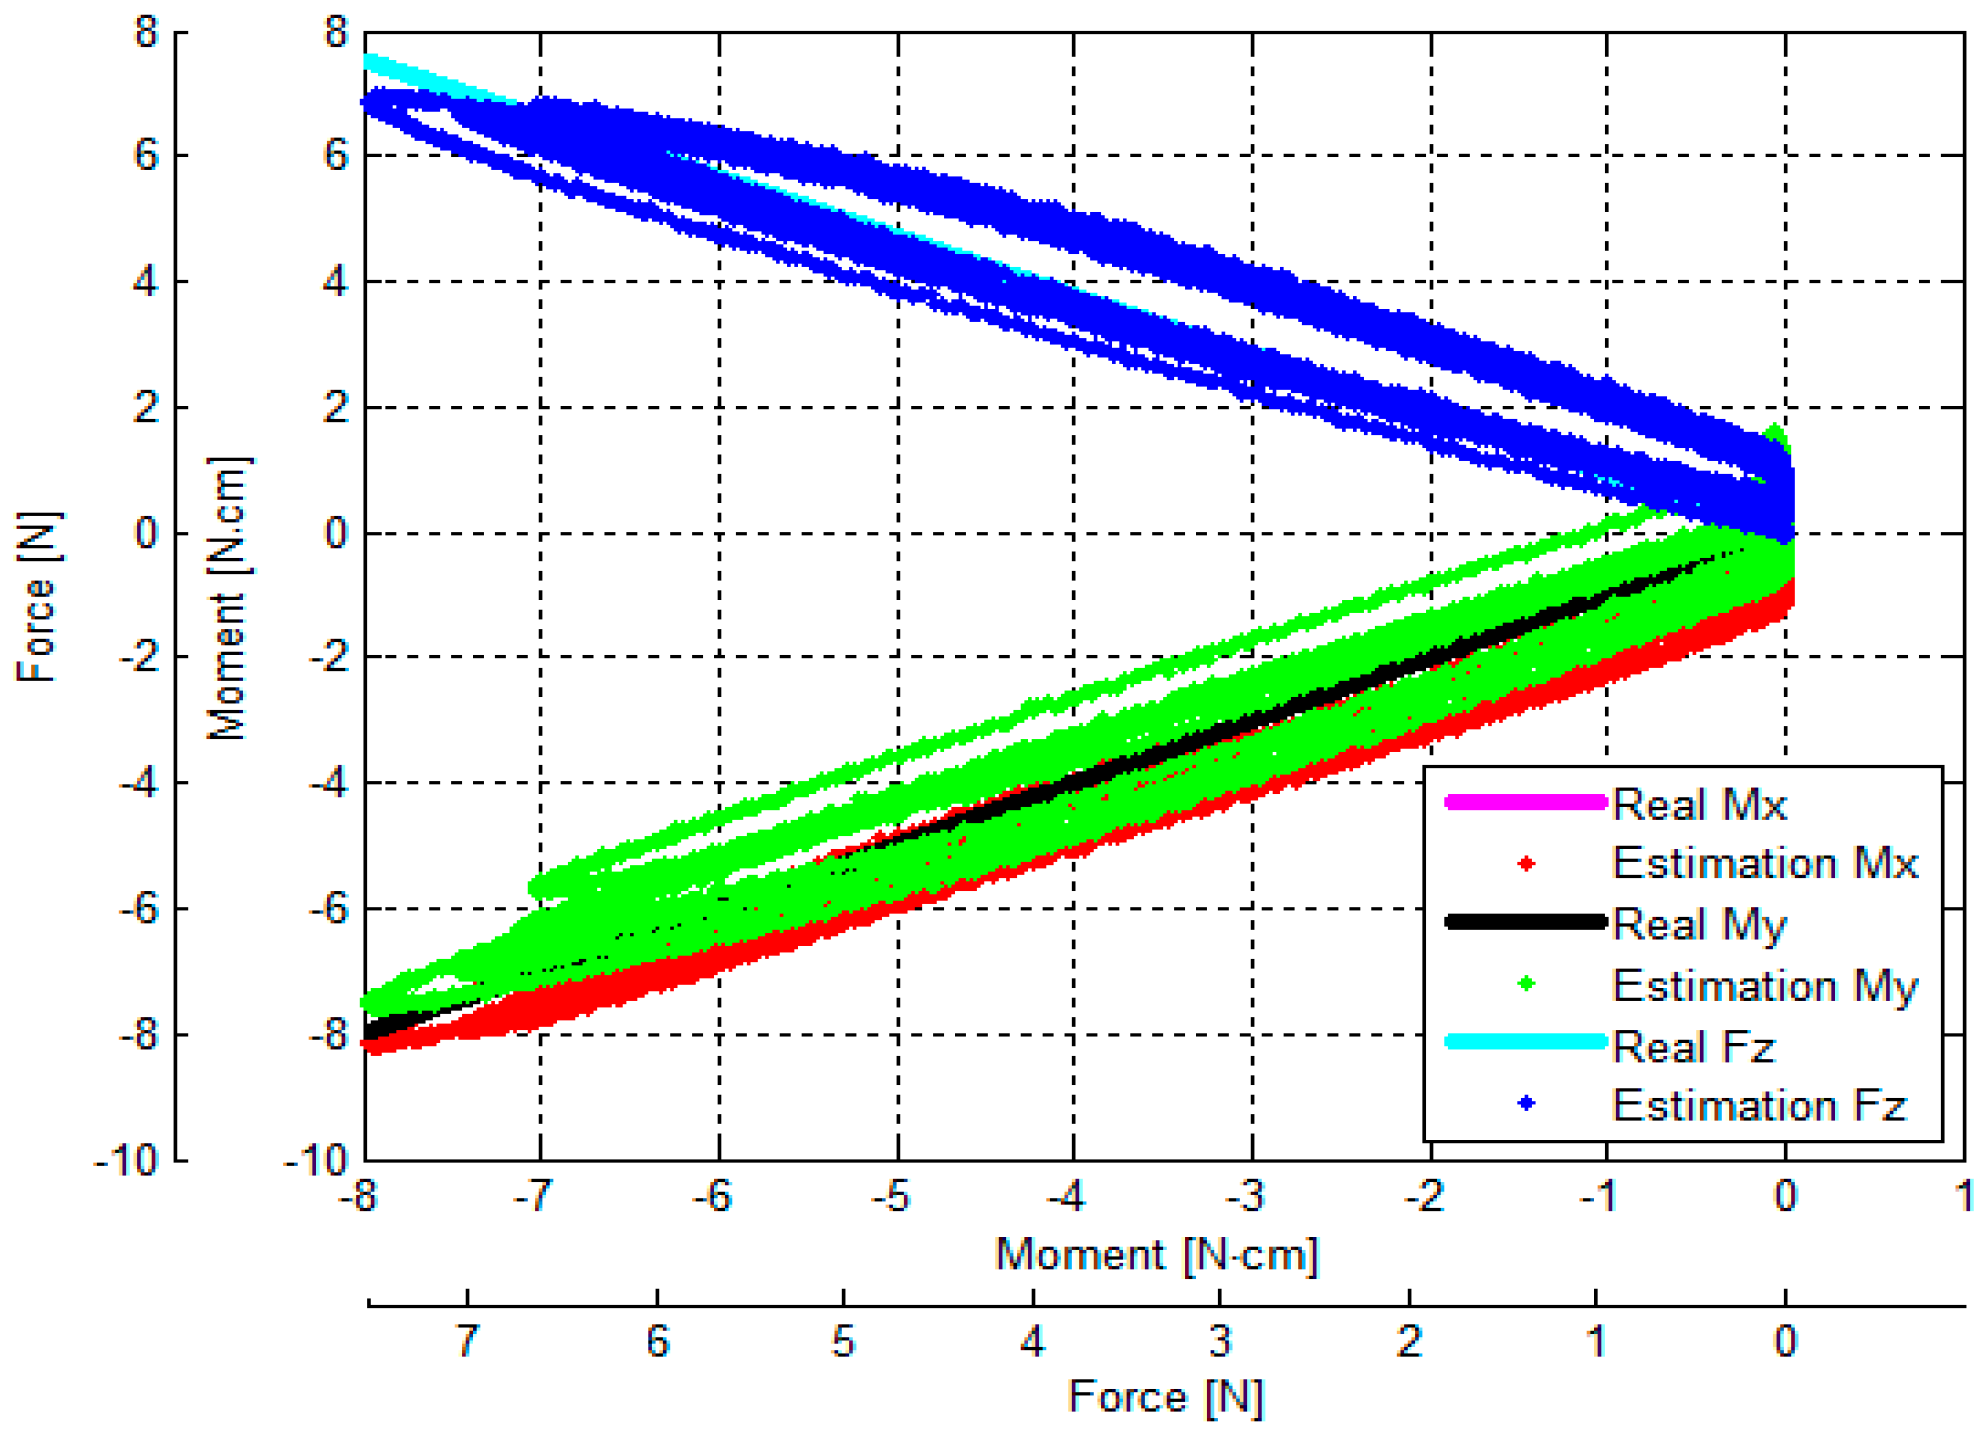
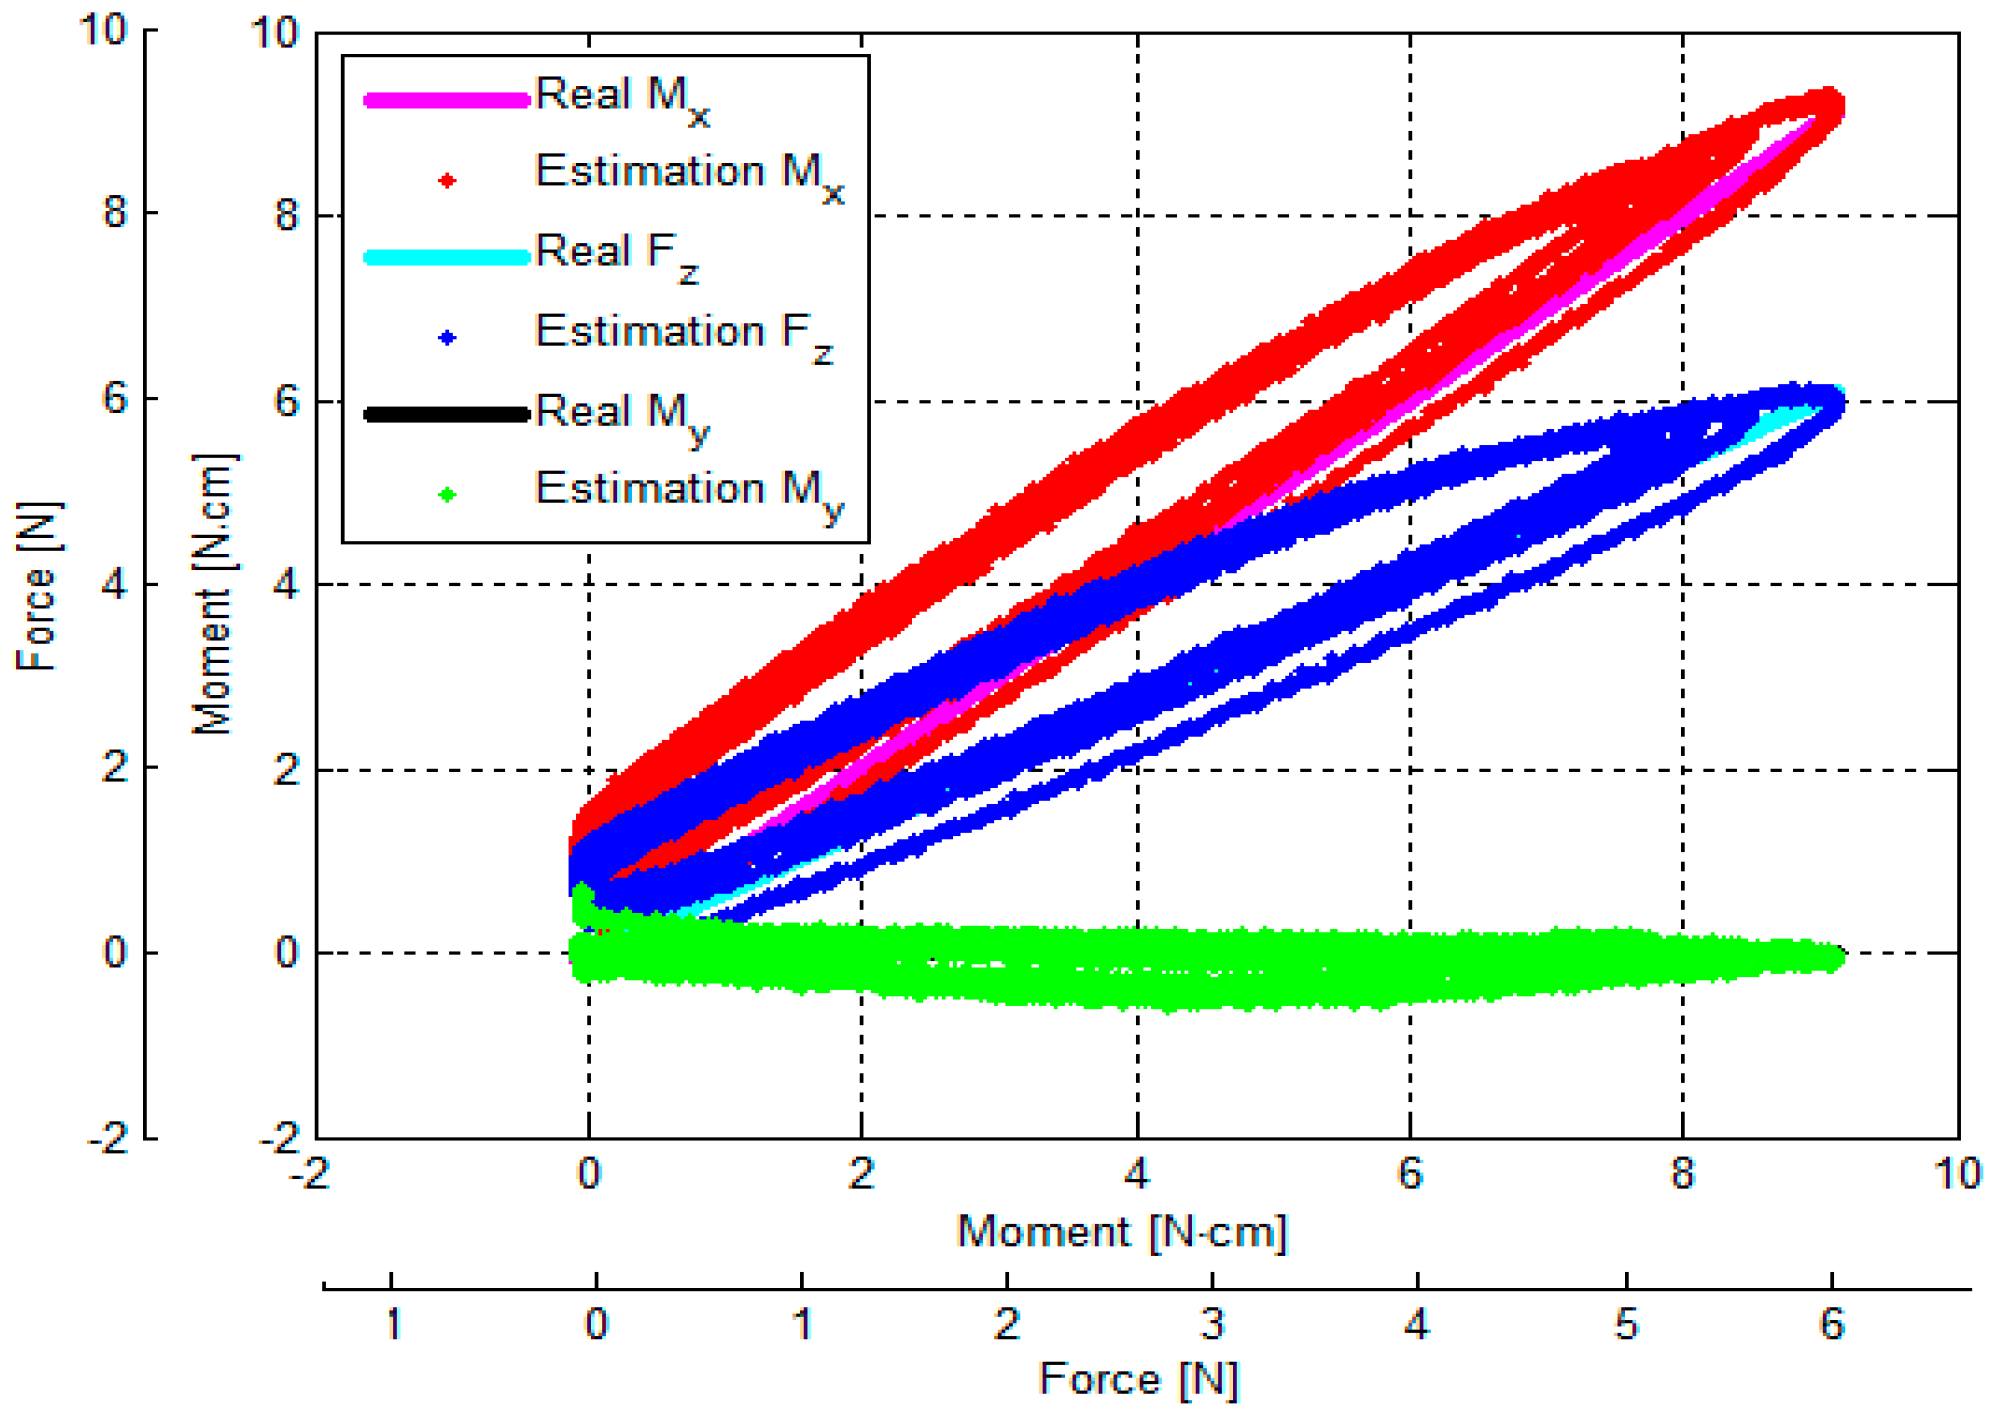
3.3. Verification of Calibration Matrix and Objective Evaluation of Our Proposed Force/Torque Sensor

In order to evaluate the proposed three-axis force/torque sensor objectively, sensor properties such as crosstalk, hysteresis, repeatability, and error should be examined. For these reasons, a set of experiments was carried out using the calibration device shown in Figure 11 and Figure 12. In order to verify our calibration matrix and evaluate the sensor properties, the loading/unloading calibration process was performed. The calibration considered the three conditions of the benchmark forces at the nine points, as explained in Section 3.1, and was performed five times at a linear guide speed of 0.15 mm/s consecutively.
(1)
Force Fz along z-axis ⓪ (in Figure 12b);
(2)
Force Fz and moment Mx or My (from now express as (Fz, Mx) ①② or (Fz, My) ③④) (in Figure 12b); and
(3)
Force Fz and both moments Mx and My (from now express as (Fz, Mx, My) ⑤⑥⑦⑧) (in Figure 12b).
The output voltages of the three optoelectronic sensing elements during the calibration process were recorded. Subsequently, estimated values of Fz, Mx and My were calculated by multiplying values of the voltage samples and the calibration matrix, presented in Equation (18). Overall, based on the experimental results, the Fz, Mx and My calculated by the calibration matrix are in agreement with the corresponding force values as measured by the ATI Nano17 IP65 force/torque sensor, as shown in Figure 14, Figure 15, Figure 16, Figure 17, Figure 18 and Figure 19.
As the cycle numbers increase, the knot of the two tendons becomes tied more strongly, so the tendon’s tension is slowly reduced until there is slack. For this reason, as shown in Figure 14, Figure 15, Figure 16, Figure 17, Figure 18 and Figure 19, applied external forces are decreasing at every cycle, and therefore do not obtain the same maximum applied force.
The estimated Fz, Mx, and My are compared with the benchmark results, shown in Figure 14, Figure 15, Figure 16, Figure 17, Figure 18 and Figure 19 and Table 2. It was observed that the maximum error Fz and Mx is around 1.8 N (22.5%) and 1.6 N·cm (17.7%), respectively, in the case of the benchmark (Fz, Mx) as depicted in Figure 12b(①) and Figure 15. The maximum error for My is around 1.7 N·cm (16%) for physical values, (Fz, My) as depicted in Figure 12b(③) and Figure 16, and Table 2.
The results of the repeatability test are presented in Table 3, showing the capability of the force sensor in reproducing the same condition of the force, and two moments. It can be seen that the maximum Fz and Mx repeatability is around 2.2% and 3.7%, respectively, in the case of the benchmark force (Fz, Mx) as depicted in Figure 12b(①) and Figure 15. The maximum My is around 2.9% in the case of the benchmark force (Fz, Mx, My) as depicted in Figure 12b(⑧) and shown in Table 3 and Figure 19.
The results of the hysteresis tests are shown in Table 3; an external force is applied onto the sensor from zero to the maximum value, and then released from the maximum to zero on the load fixture again. During one cycle, the sensor’s characteristic curves exhibit a considerable hysteresis as shown in Figure 14, Figure 15, Figure 16, Figure 17, Figure 18 and Figure 19. The hysteresis in the case of the benchmark forces (Fz, Mx) and (Fz, My) applied (Figure 12b(①,③) can be observed in Figure 15 and Figure 16, and maximum hysteresis values are shown in Table 3.
The crosstalk between the sensing elements was summarized in Table 4. When an external force is applied, e.g., Fz (force along the z-axis), the two moments Mx and My should ideally remain zero. Similarly, if (Fz, Mx) is applied on the sensor, My should ideally remain zero, and if (Fz, My) is applied on the sensor, Mx should remain zero. However, the results from the crosstalk experiments show that applying maximum values of force Fz and moments (Fz, Mx), and (Fz, My) respectively on the load fixture ⓪, ①, ②, ③, and ④, influences the other force/moment readouts, as shown in Figure 14, Figure 15, Figure 16, Figure 17 and Figure 18 and Table 4. When Fz, (Fz, Mx), and (Fz, Mx) are applied on the load fixture ⓪, ①, and ③, maximum crosstalk values arise along Mx of 0.078 N·cm/N and My of 0.054 N·cm/N (Figure 14), along My of 0.1284 N·cm/N and 9.26% (Figure 15), and along Mx of 0.0656 N·cm/N and 4.84% (Figure 16) can be observed.

4. Discussion

The calibration matrix was calculated analytically (Equation (16)) and compared with the empirically obtained one (Equation (19)). The analytically induced Equations (7)–(13) assumed the three deflections were measured on the centre points underneath the simply-supported beam where external force is transmitted to, as shown in the Figure 6. However, in the real sensor application, the optoelectronic sensors and the mirrors were attached closely to the centre of the sensor structure as shown in Figure 1 and Figure 2, and they were not positioned exactly at the centre and exactly toward the centre of the sensor structure. For these reasons, the simulation result (Figure 10b) and the experiment result (Figure 13b) are slightly different. Moreover, due to the hysteresis, the output voltage readings of the three optoelectronic sensing elements obtained from the loading and unloading processes are not exactly the same (Figure 13). However, the calibration matrix is calculated using the entire set of voltage readings from both loading and unloading, therefore the calibration matrices are not exactly the same.
The errors and the crosstalk are associated with hysteresis, as shown in Figure 13. Due to the hysteresis, the calculated calibration matrix causes the errors and crosstalk in values of the Fz, Mx, and My to be higher. It also negatively influences the repeatability of the sensor. As shown in Figure 14, Figure 15, Figure 16, Figure 17, Figure 18 and Figure 19, it is observed that due to hysteresis, the magnitudes of the estimation forces/moments are getting larger in comparison with real forces/moments, as cycle numbers increase. This explains why the repeatability errors of Fz, Mx, and My are relatively large. The static simulation result (Figure 10d–f) shows a low crosstalk of around less than 0.5% (note that the static simulation cannot show hysteresis properties). However, it is noted that the hysteresis level of the multi-axis force/torque sensor proposed in this study is higher than that seen in commercial sensors (such as ATI sensors). Hence, the use of metals in the fabrication of future sensors is planned, instead of the currently used ABS plastic materials (the sensor structure is fabricated from Visijet EX200 via a Projet HD 3000 3D production system.
Using our calibration device, Fz could be applied on the sensor independent of Mx and My. However, the pure bending moments Mx and My could not be independently exerted on the sensor. Hence, in our setup, we had to apply coupled force/moment values to our sensor to calibrate it. As such, in order to guarantee that the sensor readings are not affected by forces and torques that it does not measure (i.e., forces on the x and y directions and moment around the z direction), a set of simulations were carried out that are explained in the following (Figure 20 and Figure 21).
In the simulation, two opposing forces were applied to a shaft along the sensor’s z direction. The smaller force F2 was applied on the tip of the shaft (0.5 N), while an opposing force of higher magnitude F1 was applied along the shaft at different points (0.8 N). Since the two forces have different magnitudes, a net horizontal force was always resulted. However, the resulting moment depended on the point of application of F1. When the length of the lever arm at the point of application of F1 was such that the moment equalled the one generated by F2, the resulting moment was zero, while the resultant force was F2F1 = 0.3 N. It can be seen in Figure 20 that, at this point, the deflection of all three beams was negligible. Thus, this structure is not affected by these lateral forces.
Concerning the moment around the z direction, a similar simulation was carried out, which demonstrated that the sensor was also not affected noticeably by this element (Mz). Figure 21 shows the deflection of the three beams in this situation. It can be seen that the deflection is negligible (in the order of 10−7 m, around 100 times smaller than for a moment of similar magnitude around one of the other axes).
In the future, we will propose an advanced calibration device that can apply coupled force/torque as well as pure moments. In addition, advances in optoelectronics technology have allowed photo sensors to become highly miniaturized, whilst remaining very cheap. Small-sized optoelectronics were recently achieved; an example includes the NJL5901R-2, 1.0 × 1.4 × 0.6 mm3, by New Japan Radio Co., Ltd. (Tokyo, Japan). We, therefore, foresee that the size of our sensor structure can be further reduced [50].
It should be mentioned that, in Section 3.1, an ATI Nano IP65 six-axis force/torque sensor, which is a standard measurement device, was used for calibration. However, this sensor is not a high precision sensor, whose inaccuracies are around 1%. According to the measurement theory, the standard measurement device should be more precise than that of the calibrated sensor. Hence, in our future studies we will either use standard weights or a more precise six-axis force/torque sensor for the purpose of calibration.

5. Conclusions and Future Works

In this paper, details of an optoelectronic and simply-supported beam based three-axis force/torque sensor, which can be adapted to bespoke mechanical structures for the purpose of force/torque measurements within robot systems, have been described. An example application of our force/torque sensing concept to a flexible continuum cylindrical MIS (Minimally Invasive Surgery) manipulator (the STIFF-FLOP arm) has been presented, including its design, fabrication, and evaluation tests. In addition, a strategy to obtain the calibration matrix for reliable force prediction, applying the multiple linear regression method, is proposed. Finally, the effectiveness of the proposed three-axis force sensor has been validated through a set of experiments evaluating its properties such as crosstalk, hysteresis, repeatability and error.
Although, in this paper, we verified a sensor development method of building three-axis force/torque sensor based on optoelectronic technology and simply-supported beam, as future work, a metal structure will be considered to re-evaluate the sensor performance properties conducted in the Section 3.

Acknowledgments

The research leading to these results has received funding from the European Commission’s Seventh Framework Programme; project STIFF-FLOP (Grant No. 287728), and has received funding from the Wellcome Trust IEH Award (Grant No. 102431).

Author Contributions

Y.N. was responsible with the sensor development, the sensor fabrication, and the experiments. S.S. contributed to the development of the sensor electronics. J.B. worked on the mathematical model and sensor calibration. H.W. and J.H. provided information on the medical requirements and applications of the sensor. J.F. and D.S.C. contributed to the mechanical design of the sensor structure. H.L., K.A. and K.R. oversaw and advised the research.

Conflicts of Interest

The authors declare no conflict of interest and funding sponsors had no role in the design of the study; in the collection, analyses, or interpretation of data; in the writing of the manuscript, and in the decision to publish the results.

References

  1. Fernandez, R.; Payo, I.; Vazquez, A.S.; Becedas, J. Micro-vibration-based slip detection in tactile force sensors. Sensors 2014, 14, 709–730. [Google Scholar] [CrossRef] [PubMed]
  2. Cannata, G.; Maggiali, M. Design of a tactile sensor for robot hands. In Sensors: Focus on Tactile Force and Stress Sensors; InTech: Rijeka, Croatia, 2008. [Google Scholar]
  3. Cui, L.; Cupcic, U.; Dai, J.S. An optimization approach to teleoperation of the thumb of a humanoid robot hand: Kinematic mapping and calibration. J. Mech. Des. 2014, 136, 091005. [Google Scholar] [CrossRef]
  4. Kim, U.; Lee, D.; Yoon, W.; Hannaford, B.; Choi, H. Force sensor integrated surgical forceps for minimally invasive robotic surgery. IEEE Trans. Robot. 2015, 31, 1214–1224. [Google Scholar] [CrossRef]
  5. Lee, D.; Kim, U.; Choi, H. Development of multi-axial force sensing system for haptic feedback enabled minimally invasive robotic surgery. In Proceedings of the IEEE/RSJ International Conference on Intelligent Robots and Systems (IROS) 2014, Chicago, IL, USA, 14–18 September 2014.
  6. Polygerinos, P.; Ataollahi, A.; Schaeffter, T.; Seneviratne, L.D.; Althoefer, K. MRI-compatible intensity-modulated force sensor for cardiac catheterization procedures. IEEE Trans. Biomed. Eng. 2011, 58, 721–726. [Google Scholar] [CrossRef] [PubMed]
  7. Polygerinos, P.; Ataollahi, A.; Schaeffter, T.; Seneviratne, L.D.; Althoefer, K. Miniaturized triaxial optical fiber force sensor for MRI-guided minimally invasive surgery. In Proceedings of the IEEE International Conference on Robotics and Automation (ICRA) 2010, Anchorage, AK, USA, 3–8 May 2010.
  8. Shang, J.; Noonan, D.P.; Payne, C.; Clark, J.; Sodergren, M.H.; Darzi, A.; Yang, G.Z. An articulated universal joint based flexible access robot for minimally invasive surgery. In Proceedings of the IEEE International Conference on Robotics and Automation (ICRA) 2011, Shanghai, China, 9–13 May 2011.
  9. Degani, A.; Choset, H.; Zubiate, B.; Ota, T.; Zenati, M. Highly articulated robotic probe for minimally invasive surgery. In Proceedings of the 30th Annual International Conference of the IEEE Engineering in Medicine and Biology Society (EMBC) 2008, Vancouver, BC, Canada, 20–24 August 2008.
  10. Li, Z.; Yu, H.; Ren, H.; Chiu, P.W.Y.; Du, R. A novel constrained tendon-driven serpentine manipulator. In Proceedings of the IEEE/RSJ International Conference on Intelligent Robots and Systems (IROS) 2015, Hamburg, Germany, 28 September–2 October 2015.
  11. Xu, K.; Zhao, J.; Fu, M. Development of the SJTU unfoldable robotic system (SURS) for single port laparoscopy. IEEE/ASME Trans. Mechatron. 2015, 20, 2133–2145. [Google Scholar] [CrossRef]
  12. Noh, Y.; Liu, H.; Sareh, S.; Chathuranga, D.; Wurdemann, H.; Rhode, K.; Althoefer, K. Image-based optical miniaturized three-axis force sensor for cardiac catheterization. IEEE Sens. J. 2016, 16, 7924–7932. [Google Scholar] [CrossRef]
  13. Noh, Y.; Sareh, S.; Würdemann, H.; Liu, H.; Housden, J.; Rhode, K.; Althoefer, K. Three-axis fiber-optic body force sensor for flexible manipulators. IEEE Sens. J. 2015, 16, 1641–1651. [Google Scholar] [CrossRef]
  14. Noh, Y.; Secco, E.L.; Sareh, S.; Wurdemann, H.; Faragasso, A.; Back, J.; Liu, H.; Sklar, E.; Althoefer, K. A continuum body force sensor designed for flexible surgical robotics devices. In Proceedings of the 36th Annual International Conference of the IEEE Engineering in Medicine and Biology Society (EMBC) 2014, Chicago, IL, USA, 26–30 August 2014.
  15. Xie, H.; Liu, H.; Noh, Y.; Li, J.; Wang, S.; Kaspar, A. A fiber-optics-based body contact sensor for a flexible manipulator. IEEE Sens. J. 2015, 15, 3543–3550. [Google Scholar]
  16. Vithanage, D.; Wang, Z.; Noh, Y.; Nanayakkara, T.; Hirai, S. Robust real time material classification algorithm using soft three axis tactile sensor: Evaluation of the algorithm. In Proceedings of the IEEE/RSJ International Conference on Intelligent Robots and Systems (IROS) 2015, Hamburg, Germany, 28 September–2 October 2015.
  17. Assaf, T.; Roke, C.; Rossiter, J.; Pipe, T.; Melhuish, C. Seeing by touch: Evaluation of a soft biologically-inspired artificial fingertip in real-time active touch. Sensors 2014, 14, 2561–2577. [Google Scholar] [CrossRef] [PubMed]
  18. Song, A.; Wu, J.; Qin, G.; Huang, W. A novel self-decoupled four degree-of-freedom wrist force/torque sensor. Measurement 2007, 40, 883–891. [Google Scholar] [CrossRef]
  19. Ma, A.; Song, A.; Xiao, J. A robust static decoupling algorithm for 3-axis force sensors based on coupling error model and Ɛ-SVR. Sensors 2012, 12, 14537–14555. [Google Scholar] [CrossRef] [PubMed]
  20. Seibold, U.; Kubler, B.; Hirzinger, G. Prototype of instrument for minimally invasive surgery with 6-axis force sensing capability. In Proceedings of the IEEE International Conference on Robotics and Automation (ICRA) 2005, Barcelona, Spain, 18–22 April 2005.
  21. Haslinger, R.; Leyendecker, P.; Seibold, U. A fiberoptic force-torque-sensor for minimally invasive robotic surgery. In Proceedings of the IEEE International Conference on Robotics and Automation (ICRA) 2013, Karlsruhe, Germany, 6–10 May 2013.
  22. ATI Industrial Automation, Multi-axis Force/Torque Sensors. Available online: http://www.ati-ia.com/products/ft/sensors.aspx (accessed on 5 November 2016).
  23. Flavigne, D.; Perdereau, V. A learning-free method for anthropomorphic grasping. In Proceedings of the IEEE/RSJ International Conference on Intelligent Robots and Systems (IROS) 2013, Tokyo, Japan, 3–7 November 2013.
  24. Koiva, R.; Zenker, M.; Schurmann, C.; Haschke, R.; Ritter, H.J. A highly sensitive 3D-shaped tactile sensor. In Proceedings of the IEEE/ASME International Conference on Advanced Intelligent Mechatronics (AIM) 2013, Wollongong, Australia, 9–12 July 2013.
  25. Fraś, J.; Czarnowski, J.; Maciaś, M.; Główka, J.; Cianchetti, M.; Menciassi, A. new STIFF-FLOP module construction idea for improved actuation and sensing. In Proceedings of the IEEE International Conference on Robotics and Automation (ICRA) 2015, Seattle, WA, USA, 26–30 May 2015.
  26. Gerboni, G.; Ranzani, T.; Diodato, A.; Ciuti, G.; Cianchetti, M.; Menciassi, A. Modular soft mechatronic manipulator for minimally invasive surgery (MIS): Overall architecture and development of a fully integrated soft module. Meccanica 2015, 50, 2865–2878. [Google Scholar] [CrossRef]
  27. Ranzani, T.; Gerboni, G.; Cianchetti, M.; Menciassi, A. A bioinspired soft manipulator for minimally invasive surgery. Bioinspir. Biomim. 2015, 10, 035008. [Google Scholar] [CrossRef] [PubMed]
  28. Sareh, S.; Noh, Y.; Li, M.; Ranzani, T.; Liu, H.; Althoefer, K. Macro-bend optical sensing for pose measurement in soft robot arms. Smart Mater. Struct 2015, 24, 125024. [Google Scholar] [CrossRef]
  29. Sareh, S.; Noh, Y.; Ranzani, T.; Wurdemann, H.; Liu, H.; Althoefer, K. A 7.5mm Steiner chain fiber-optic system for multi-segment flex sensing. In Proceedings of the IEEE/RSJ International Conference on Intelligent Robots and Systems (IROS) 2015, Hamburg, Germany, 28 September–2 October 2015.
  30. Sklar, E.; Sareh, S.; Secco, E.; Faragasso, A.; Althoefer, K. A non-linear model for predicting tip position of a pliable robot arm segment using bending sensor data. Sens. Transducers 2016, 199, 52–61. [Google Scholar]
  31. Noh, Y.; Sareh, S.; Back, J.; Wurdemann, H.A.; Ranzani, T.; Secco, E.L.; Faragasso, A.; Liu, H.; Althoefer, K. A three-axial body force sensor for flexible manipulators. In Proceedings of the IEEE International Conference on Robotics and Automation (ICRA) 2014, Hong Kong, China, 31 May–7 June 2014.
  32. Sareh, S.; Jiang, A.; Faragasso, A.; Noh, Y.; Nanayakkara, T.; Dasgupta, P.; Seneviratne, L.D.; Wurdemann, H.A.; Althoefer, K. Bio-inspired tactile sensor sleeve for surgical soft manipulators. In Proceedings of the IEEE International Conference on Robotics and Automation (ICRA) 2014, Hong Kong, China, 31 May–7 June 2014.
  33. Jia, Y.; Chen, X.; Ni, Q.; Li, L.; Ju, C. Dependence of the impact response of polyvinylidene fluoride sensors on their supporting materials’ elasticity. Sensors 2013, 13, 8669–8678. [Google Scholar] [CrossRef] [PubMed]
  34. Dao, D.V.; Toriyama, T.; Wells, J.; Sugiyama, S. Silicon piezoresistive six-degree of freedom micro force-moment sensor. Sens. Mater. 2003, 15, 113–135. [Google Scholar]
  35. Pacheco, C.J.; Bruno, A.C. A noncontact force sensor based on a fibre bragg grating and its application for corrosion measurement. Sensors 2013, 13, 11476–11489. [Google Scholar] [CrossRef] [PubMed]
  36. Tar, A.; Cserey, G. Development of a low cost 3d optical compliant tactile force sensor. In Proceedings of the IEEE/ASME International Conference on Advanced Intelligent Mechatronics (AIM) 2011, Budapest, Hungary, 3–7 July 2011.
  37. De Maria, G.; Natale, C.; Pirozzi, S. Force/tactile sensor for robotic applications. Sens. Actuators A Phys. 2012, 175, 60–72. [Google Scholar] [CrossRef]
  38. Palli, G.; Moriello, L.; Scarcia, U.; Melchiorri, C. Development of an optoelectronic 6-axis force/torque sensor for robotic applications. Sens. Actuators A Phys. 2014, 220, 333–346. [Google Scholar] [CrossRef]
  39. Beer, F., Jr.; Johnston, E.R. Mechanics of Materials, 4th ed.; McGraw-Hill: New York, NY, USA, 2006. [Google Scholar]
  40. Gu, G.; Shin, Y.; Son, J.; Kim, J. Design and characterization of a photo-sensor based force measurement unit (FMU). Sens. Actuators A Phys. 2012, 182, 49–56. [Google Scholar] [CrossRef]
  41. Kim, J.; Kim, K.; Kim, S. Note: A compact three-axis optical force/torque sensor using photo-interrupters. Rev. Sci. Instrum. 2013, 84, 126109. [Google Scholar] [CrossRef] [PubMed]
  42. Gafford, J.B.; Wood, R.J.; Walsh, C.J. Self-assembling, low-cost, and modular mm-scale force sensor. IEEE Sens. J. 2016, 16, 69–76. [Google Scholar] [CrossRef]
  43. Palli, G.; Pirozzi, S. A miniaturized optical force sensor for tendon-driven mechatronic systems: Design and experimental evaluation. Mechatronics 2012, 22, 1097–1111. [Google Scholar] [CrossRef]
  44. Noh, Y.; Shimomura, A.; Segawa, M.; Ishii, H.; Solis, J.; Takanishi, A.; Hatake, K. Development of tension/compression detection sensor system designed to acquire quantitative force information while training the airway management task. In Proceedings of the IEEE/ASME International Conference on Advanced Intelligent Mechatronics (AIM) 2009, Singapore, 14–17 July 2009.
  45. Noh, Y.; Nagahiro, K.; Ogura, Y.; Ishii, H.; Solis, J.; Hatake, K.; Takanishi, A. Development of the Airway Management Training System WKA-1 designed to embed arrays of Sensors into a Conventional Mannequin. In Proceedings of the IEEE/RSJ International Conference on Intelligent Robots and Systems (IROS) 2007, San Diego, CA, USA, 29 October 2007–2 November 2007 2007.
  46. Cobp Photo Reflector. Available online: http://www.njr.com/semicon/PDF/NJL5901R-2_E.pdf (accessed on 5 November 2016).
  47. Reiley, C.E.; Akinbiyi, T.; Burschka, D.; Chang, D.C.; Okamura, A.M.; Yuh, D.D. Effects of visual force feedback on robot-assisted surgical task performance. J. Thorac. Cardiovasc. Surg. 2008, 135, 196–202. [Google Scholar] [CrossRef] [PubMed]
  48. Wagner, C.R.; Stylopoulos, N.; Jackson, P.G.; Howe, R.D. The benefit of force feedback in surgery: Examination of blunt dissection. Presence Teleoper. Virtual Environ. 2007, 16, 252–262. [Google Scholar] [CrossRef]
  49. Kitagawa, M.; Dokko, D.; Okamura, A.M.; Yuh, D.D. Effect of sensory substitution on suture-manipulation forces for robotic surgical systems. J. Thoracic Cardiovasc. Surg. 2005, 129, 151–158. [Google Scholar] [CrossRef] [PubMed]
  50. QRE113 Miniature Reflective Object Sensor Datasheet. Available online: https://www.fairchild-semi.com/datasheets/QR/QRE1113.pdf (accessed on 5 November 2016).
  51. Nathans, L.L.; Oswald, F.L.; Nimon, K. Interpreting multiple linear regression: A guidebook of variable importance. Pract. Assess. Res. Eval. 2012, 17, 1–19. [Google Scholar]
Figure 1. Assembly design for three axis force/torque sensor using three optoelectronic sensors and three mirrors, optoelectronic sensor, QRE1113, Fairchild Semiconductor Corp. (South Portland, ME, USA).
Sensors 16 01936 g001
Figure 2. Fabricated three-axis force/torque sensor.
Sensors 16 01936 g002
Figure 3. Flexible continuum manipulators: STIFF-FLOP arm with force/torque sensors.
Sensors 16 01936 g003
Figure 4. Measurable force and moment components on (a) the force/torque sensor and (b) simplified sensor structure model (of simply-supported beam).
Sensors 16 01936 g004
Figure 5. Screw mechanism of three-axis force torque sensor: (a) The STIFF-FLOP manipulator with screw mechanism; (b) Three-axis force/torque sensor (left) and three-axis force sensor (right) with screw mechanism.
Sensors 16 01936 g005
Figure 6. Sensor structure (section of simply-supported beam) dimension and design variables (L = 6 mm, L1x = 9.3 mm, L1y = 5.4 mm, L2x = 9.3 mm, L2y = 5.4 mm, L3y = 10.8 mm, h = 1.5 mm, and b = 1.5 mm): (a) The top view; (b) The side view.
Sensors 16 01936 g006
Figure 7. (a) Experimental setup to find optimized distance between an optoelectronic sensor and a mirror; (b) The inverting amplifier circuit with an optical sensor (R1 = 100 Ω, R2 = 5 kΩ, R3 = variable resistor for offset, Rin = 100 Ω, and Rf = 9 kΩ).
Sensors 16 01936 g007
Figure 8. Characteristic curve of output voltage of optoelectronic sensor according to changing d: (a) Without amplifier; (b) With amplifier.
Sensors 16 01936 g008
Figure 9. The FEM Simulation (the simulations performed using Solidworks FEM Simulation tool): (a) when Fz is applied on the upper plate, the simply-supported beam deflects around δ = 0.05 mm; (b) when Fz and Mx are applied on the upper plate, the simply-supported beam deflects around δ = 0.15 mm; and (c) when Fz and My are applied on the upper plate, the simply-supported beam deflects around δ = 0.15 mm.
Sensors 16 01936 g009
Figure 10. The simulation results describing simply-supported beam deflections and sensor’s accuracy and crosstalk evaluation: (a) when Fz is applied on the upper plate, the simply-supported beam deflects around δ = 0.05 mm (see also Figure 9a); (b) when Force Fz and Moment Mx are applied on the upper plate, the simply-supported beam deflects around δ = 0.15 mm as shown (see also Figure 9b); (c) when Force Fz and Moment My are applied on the upper plate, the simply-supported beam deflects around δ = 0.15 mm (see also Figure 9c); (d) when Fz is applied on the upper plate maximum error Fz is around 1% and crosstalk Mx and My are less than 0.5% (the sensor accuracy and crosstalk simulated by FEM simulation) (see also Figure 9a); (e) similarly when Force Fz and Moment Mx are applied on the upper plate, maximum error Mx is around 3% and crosstalk My is less than 0.5% (see also Figure 9b); and (f) when Force Fz and Moment My are applied on the upper plate, maximum error My is around 3% and crosstalk Mx is less than 0.5% (see also Figure 9c).
Sensors 16 01936 g010aSensors 16 01936 g010b
Figure 11. Assembly design of sensor calibration device.
Sensors 16 01936 g011
Figure 12. Sensor calibration device: it can apply compressive force by a load tip and tensile force by a wire, at the numbered points on the load fixture. (a) Sensor calibration device; (b) Detail description of the load fixture as shown in Figure 11.
Sensors 16 01936 g012
Figure 13. Characteristic curves between the physical loads (force/moment) and the output voltage of the force sensor: (a) Between the load (Fz) and the output voltages of the force sensor: external force was applied to and released from point ⓪ by the sensor calibration device as shown in Figure 12b; (b) between the loads (Fz, Mx) and the output voltage of the force sensor: external force was applied to and released from points ① and ②; and (c) between the loads (Fz, My) and the output voltage of the force sensor: External force was applied to and released from points ③ and ④.
Sensors 16 01936 g013
Figure 14. Comparison between real and estimated Fz values: an external force was applied to and released from point ⓪ by the sensor calibration device as shown in Figure 12 (note that the values of Mx and My overlap, being both zero at all times).
Sensors 16 01936 g014
Figure 15. Comparison between real (Fz, Mx) and estimated (Fz, Mx): external force was applied to and released from point ① obtained by the sensor calibration device as shown in Figure 12.
Sensors 16 01936 g015
Figure 16. Comparison between real (Fz, My) values and estimated (Fz, My): external force was applied to and released from point ③ obtained by the sensor calibration device as shown in Figure 12.
Sensors 16 01936 g016
Figure 17. Comparison between real (Fz, Mx) and estimated (Fz, Mx): external force was applied to and released from point ② obtained by the sensor calibration device as shown in Figure 12.
Sensors 16 01936 g017
Figure 18. Comparison between real (Fz, My) values and estimated (Fz, My): external force was applied to and released from point ④ obtained by the sensor calibration device as shown in Figure 12.
Sensors 16 01936 g018
Figure 19. Comparison between real (Fz, Mx, My) values and estimated (Fz, Mx, My): external force was applied to and released from point ⑧ obtained by the sensor calibration device as shown in Figure 12.
Sensors 16 01936 g019
Figure 20. Effect of horizontal forces on the deflection of sensor beams. (a) Simulation of force application; (b) Deflections as a function of different amounts of applied moment (the resultant force is constant).
Sensors 16 01936 g020
Figure 21. Effect of moment around the z-direction on sensor beam deflection. (a) Simulation; (b) Deflection of the beams as a function of applied moment.
Sensors 16 01936 g021
Table 1. Measurable Range of Force Fz, and Moments Mx and My.
Force and Moment RangesSensor Structure Size, Height H and Diameter DSensor Structure’s Design Variables
Fz ±7 NH = 12 mm
D = 24 mm
L = 6 mm, L1x = 9.3 mm, L1y = 5.4 mm, L2x = 9.3 mm, L2y = 5.4 mm, L3y = 10.8 mm, h = 1.5 mm, and b = 1.5 mm
Mx ±8.0 N·cm
My ±8.0 N·cm
Table 2. Sensor Performance Property: Range and Error.
Force/MomentRangeMaximum Error
Fz±8.0 N1.8 N (22.5%)
Mx±9.0 N·cm1.6 N·cm (17.7% )
My±11.0 N·cm1.7 N·cm (16.0%)
Table 3. Sensor Performance: Repeatability and Hysteresis.
Force/MomentRepeatabilityHysteresis
Fz2.2%28.7 %
Mx3.7%22.6%
My2.9%21.1%
Table 4. Sensor performance property: Crosstalk.
Force/Moment Applied
FzFz MxFz My
Force/MomentMx,y/Fz (N·cm/N)My/Fz (N·cm/N) My/Mx (%)Mx/Fz (N·cm/N)Mx/My (%)
FzFzFzFz
Mx0.078 Mx0.06564.84
My0.054 0.1284 9.26My

