
Fine-Scale Population Estimation by 3D Reconstruction of Urban Residential Buildings


Abstract
:1. Introduction
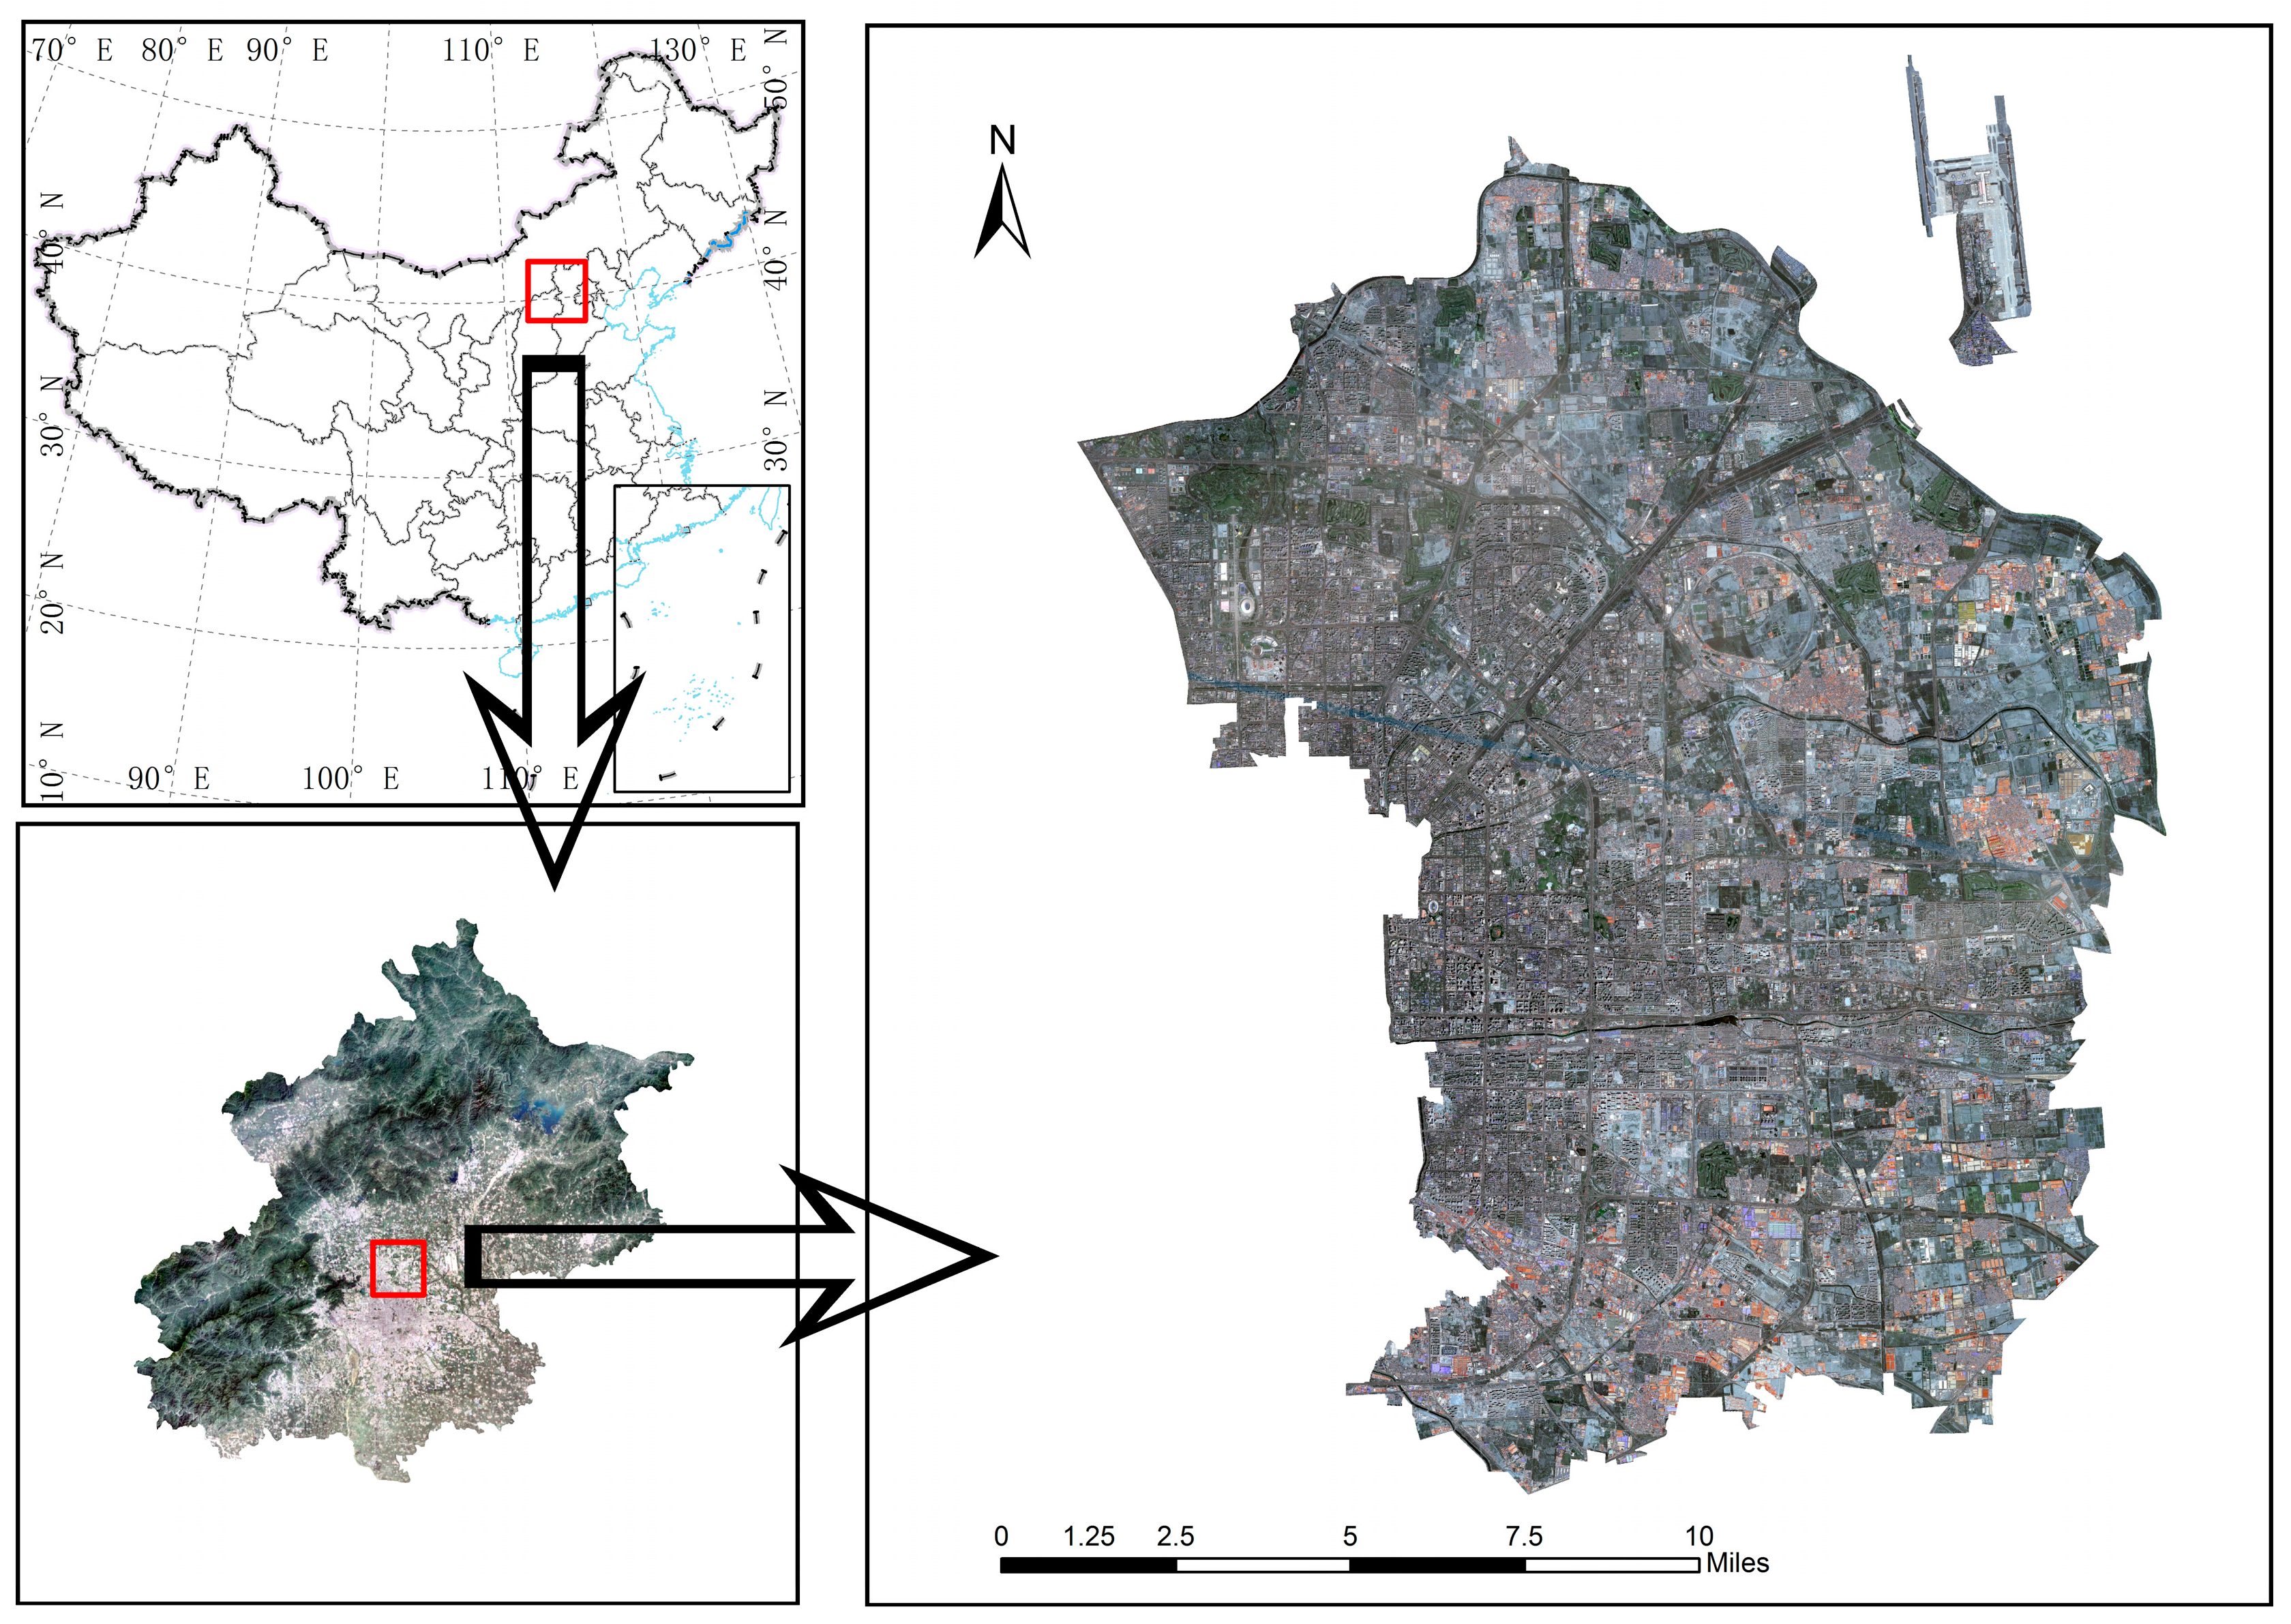
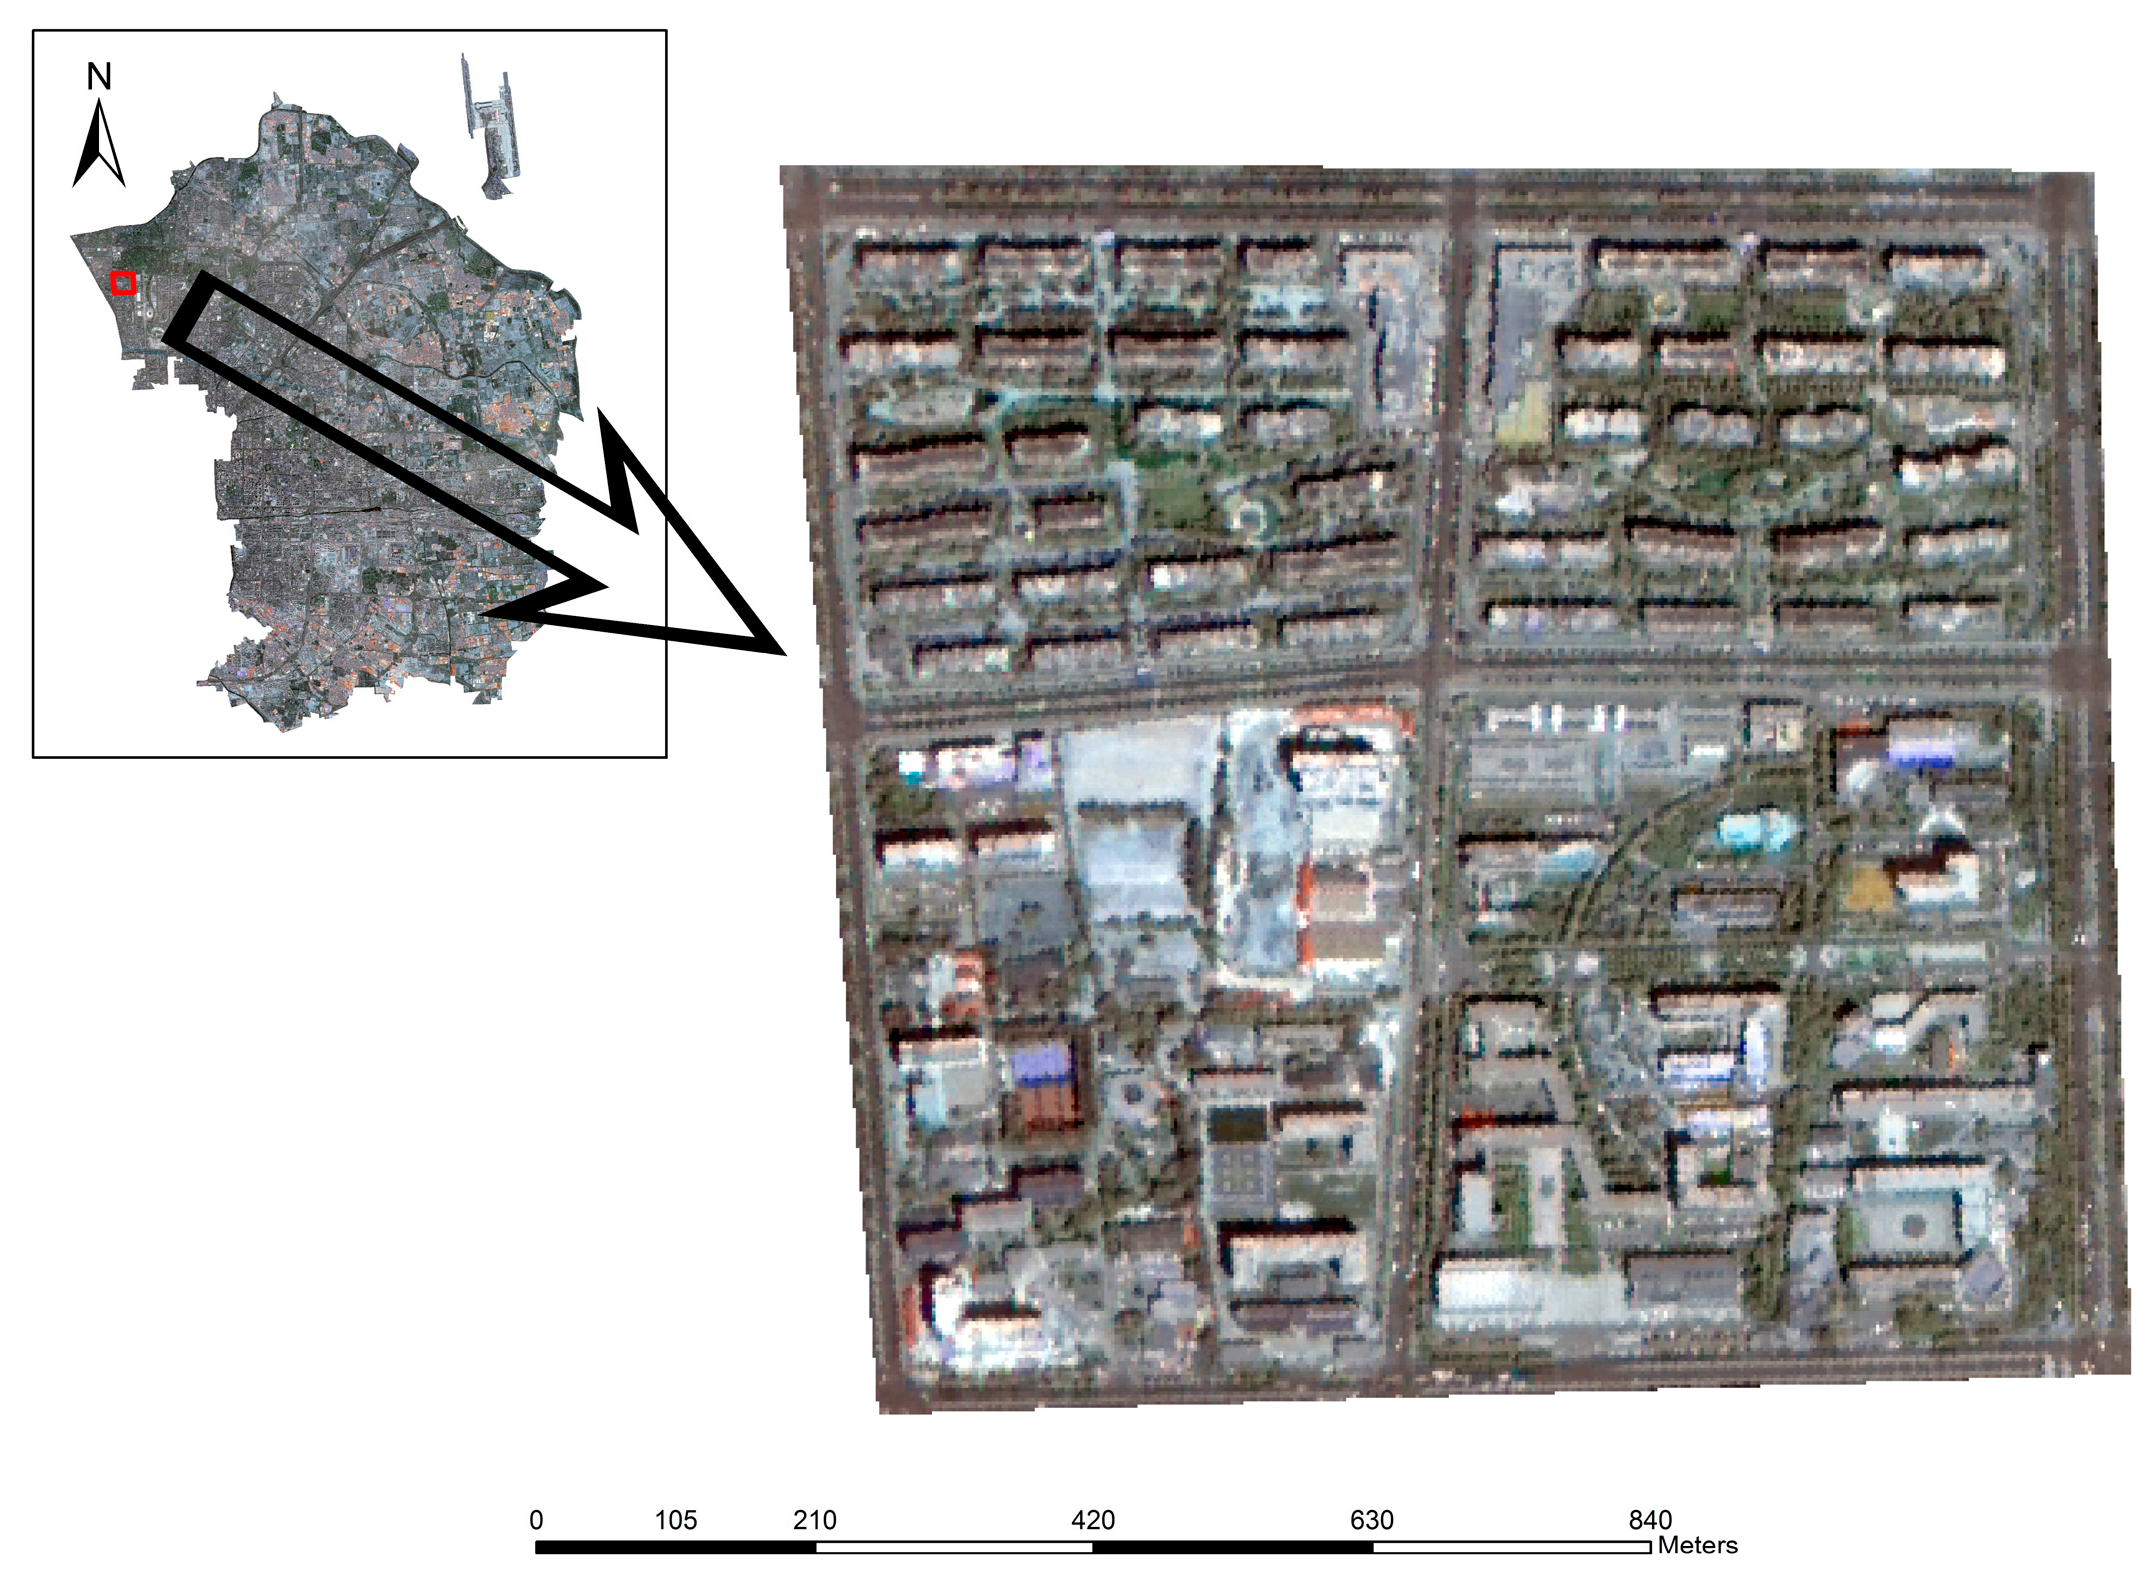
2. Study Area and Dataset
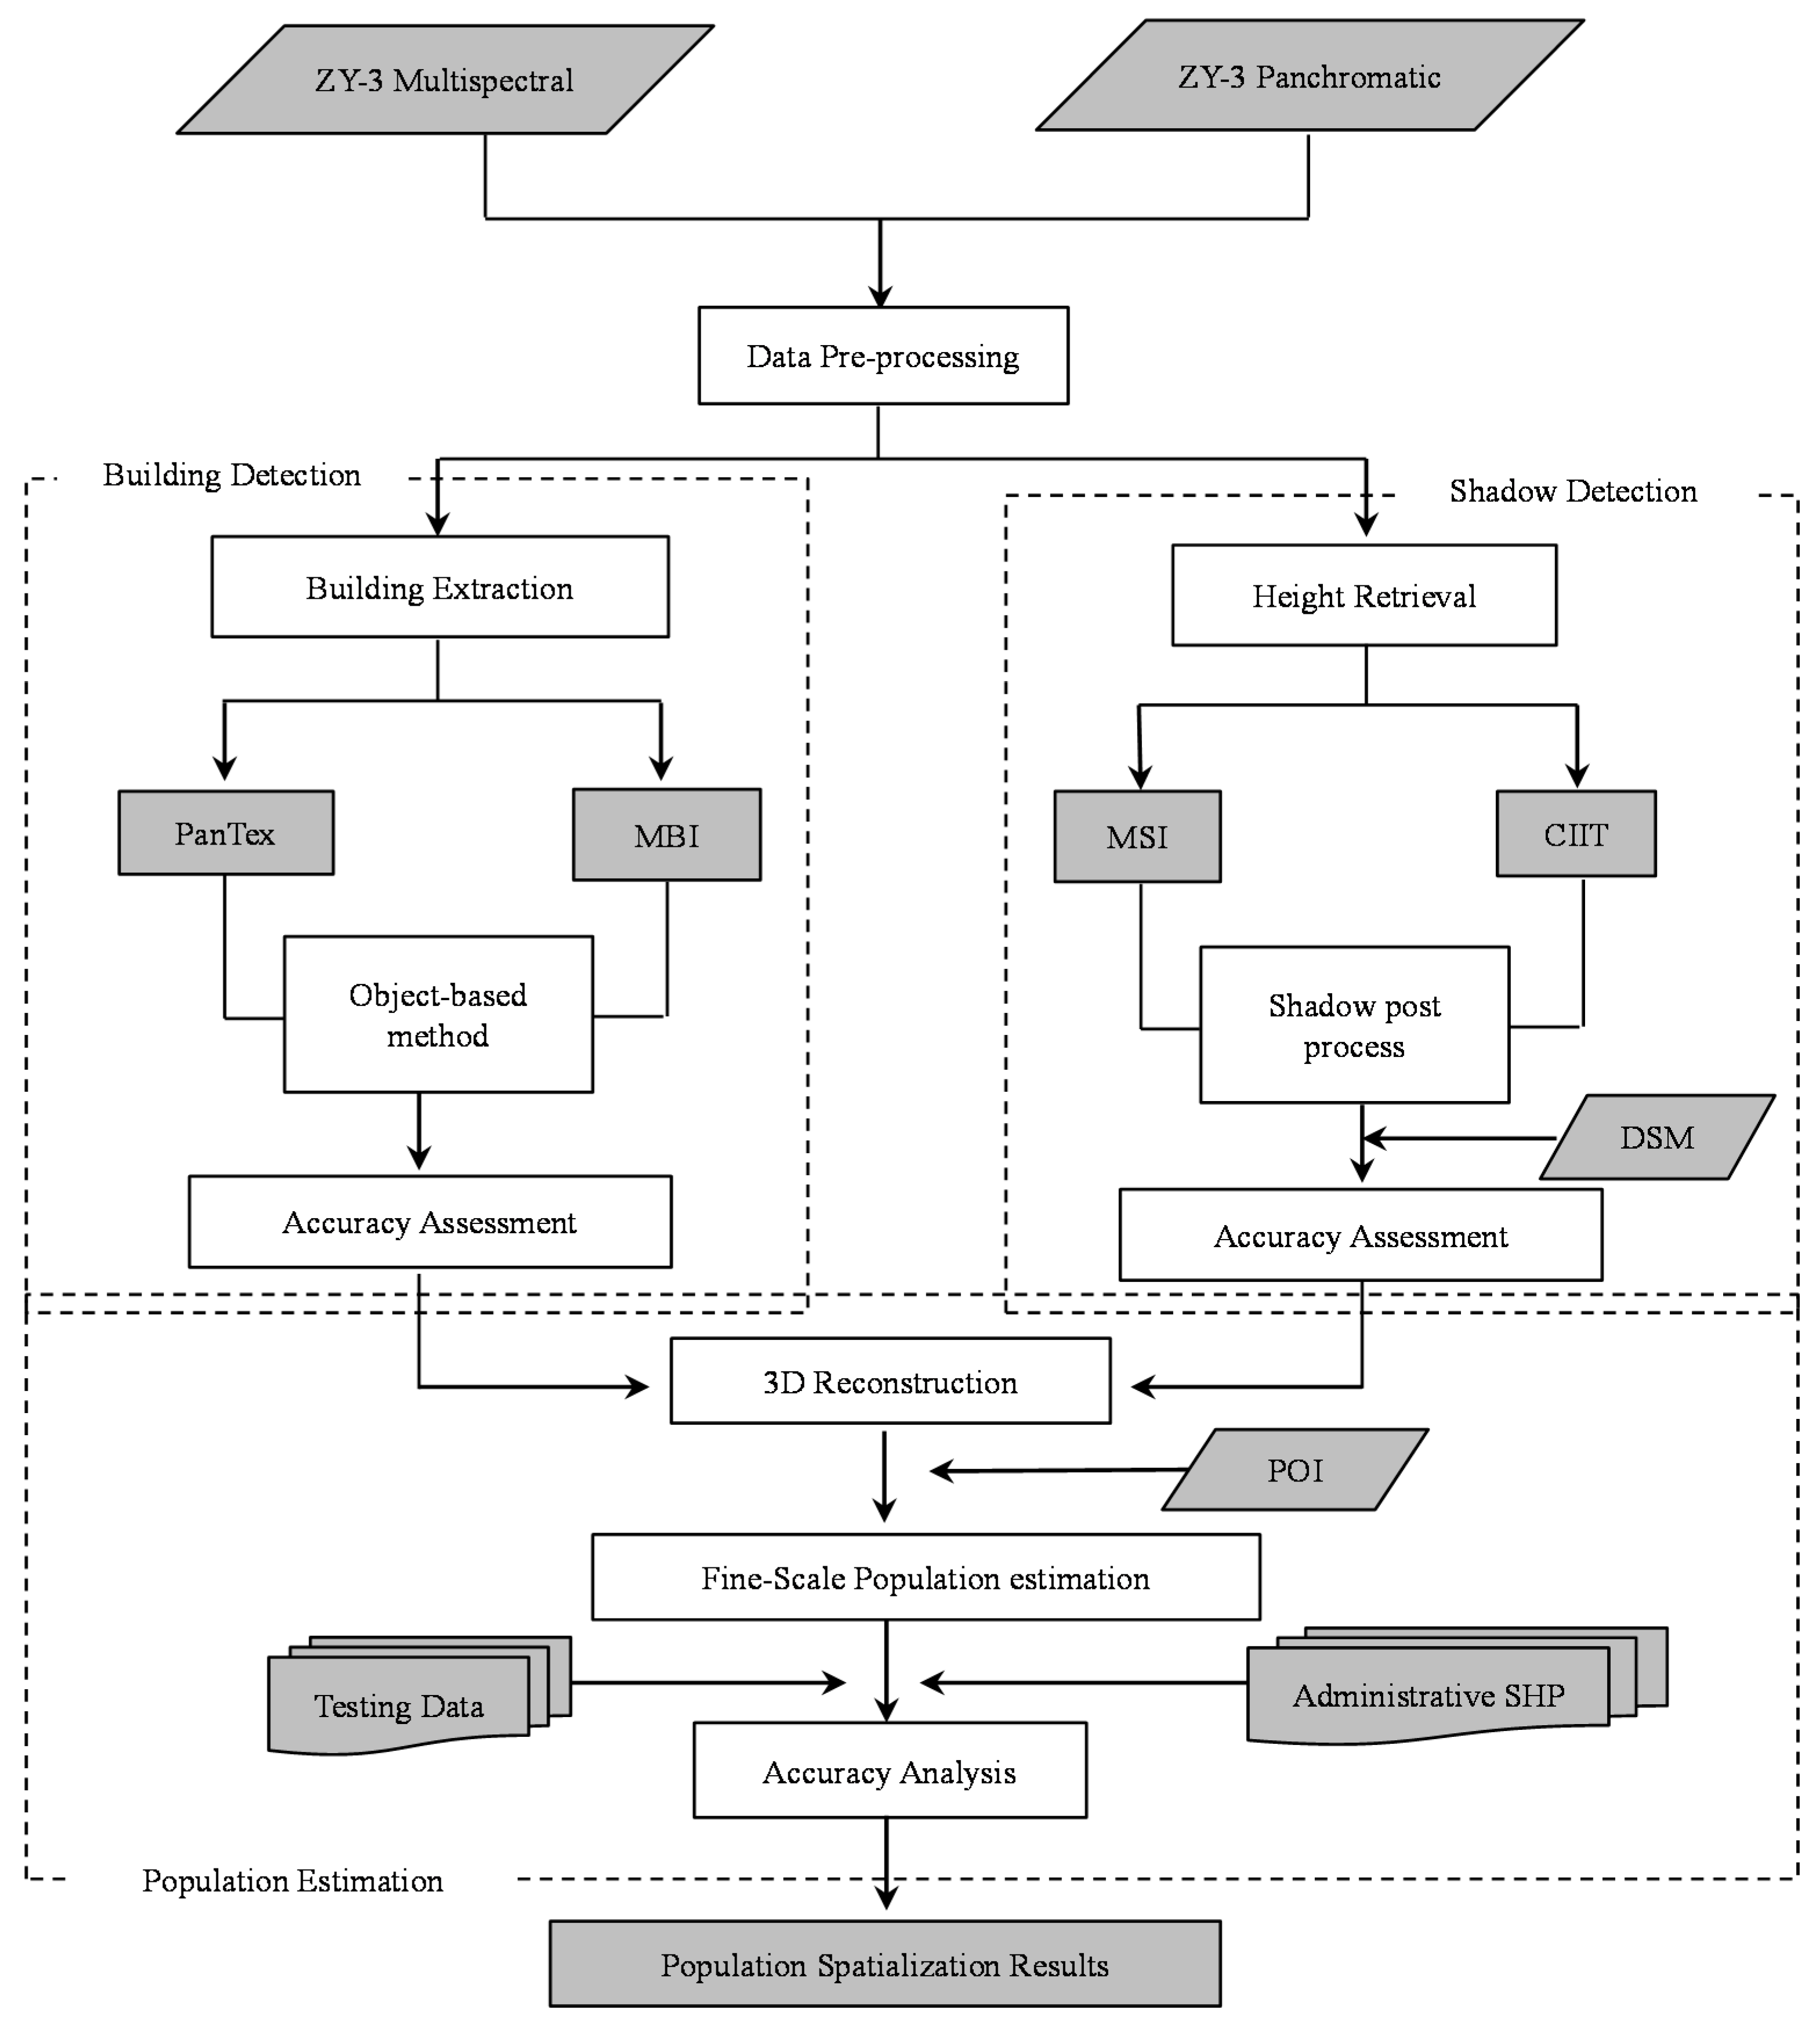
3. Methodology
3.1. Data Preprocessing
3.2. Building Extraction
3.2.1. PanTex Calculation
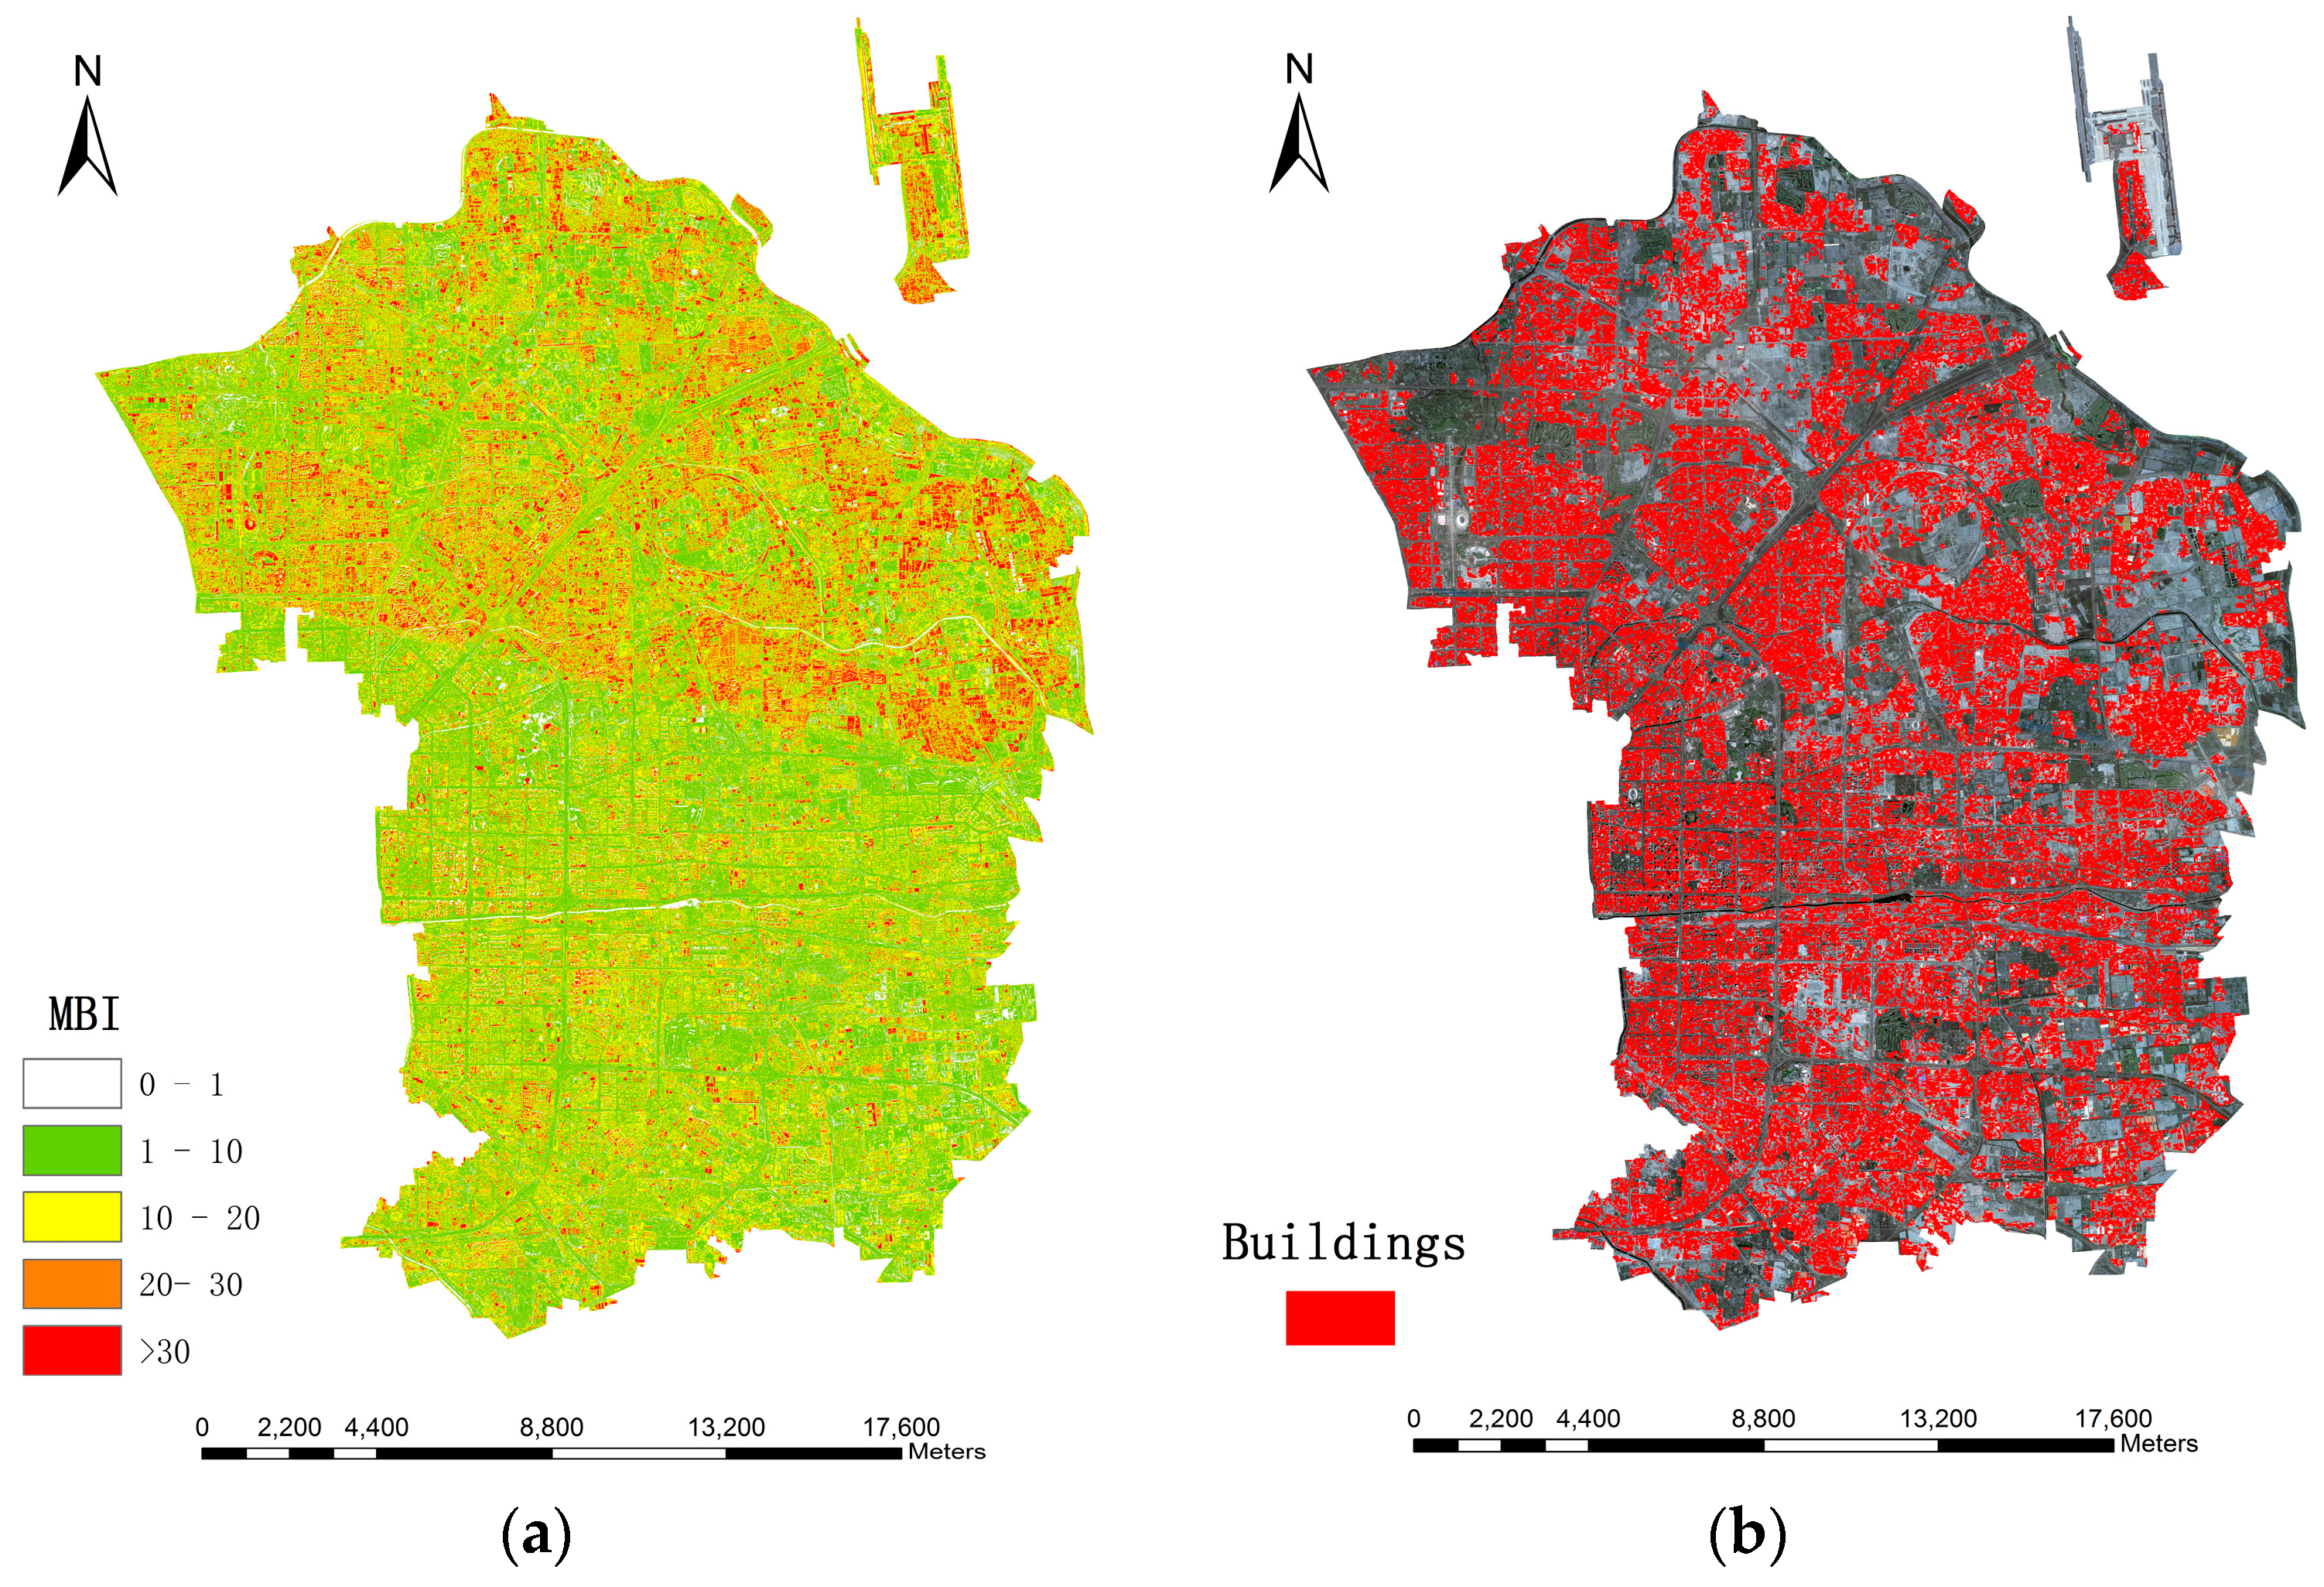
3.2.2. MBI Calculation
3.2.3. Object-Based Method to Extract Buildings
3.2.4. Residential Building Refinement
3.3. Height Retrieval
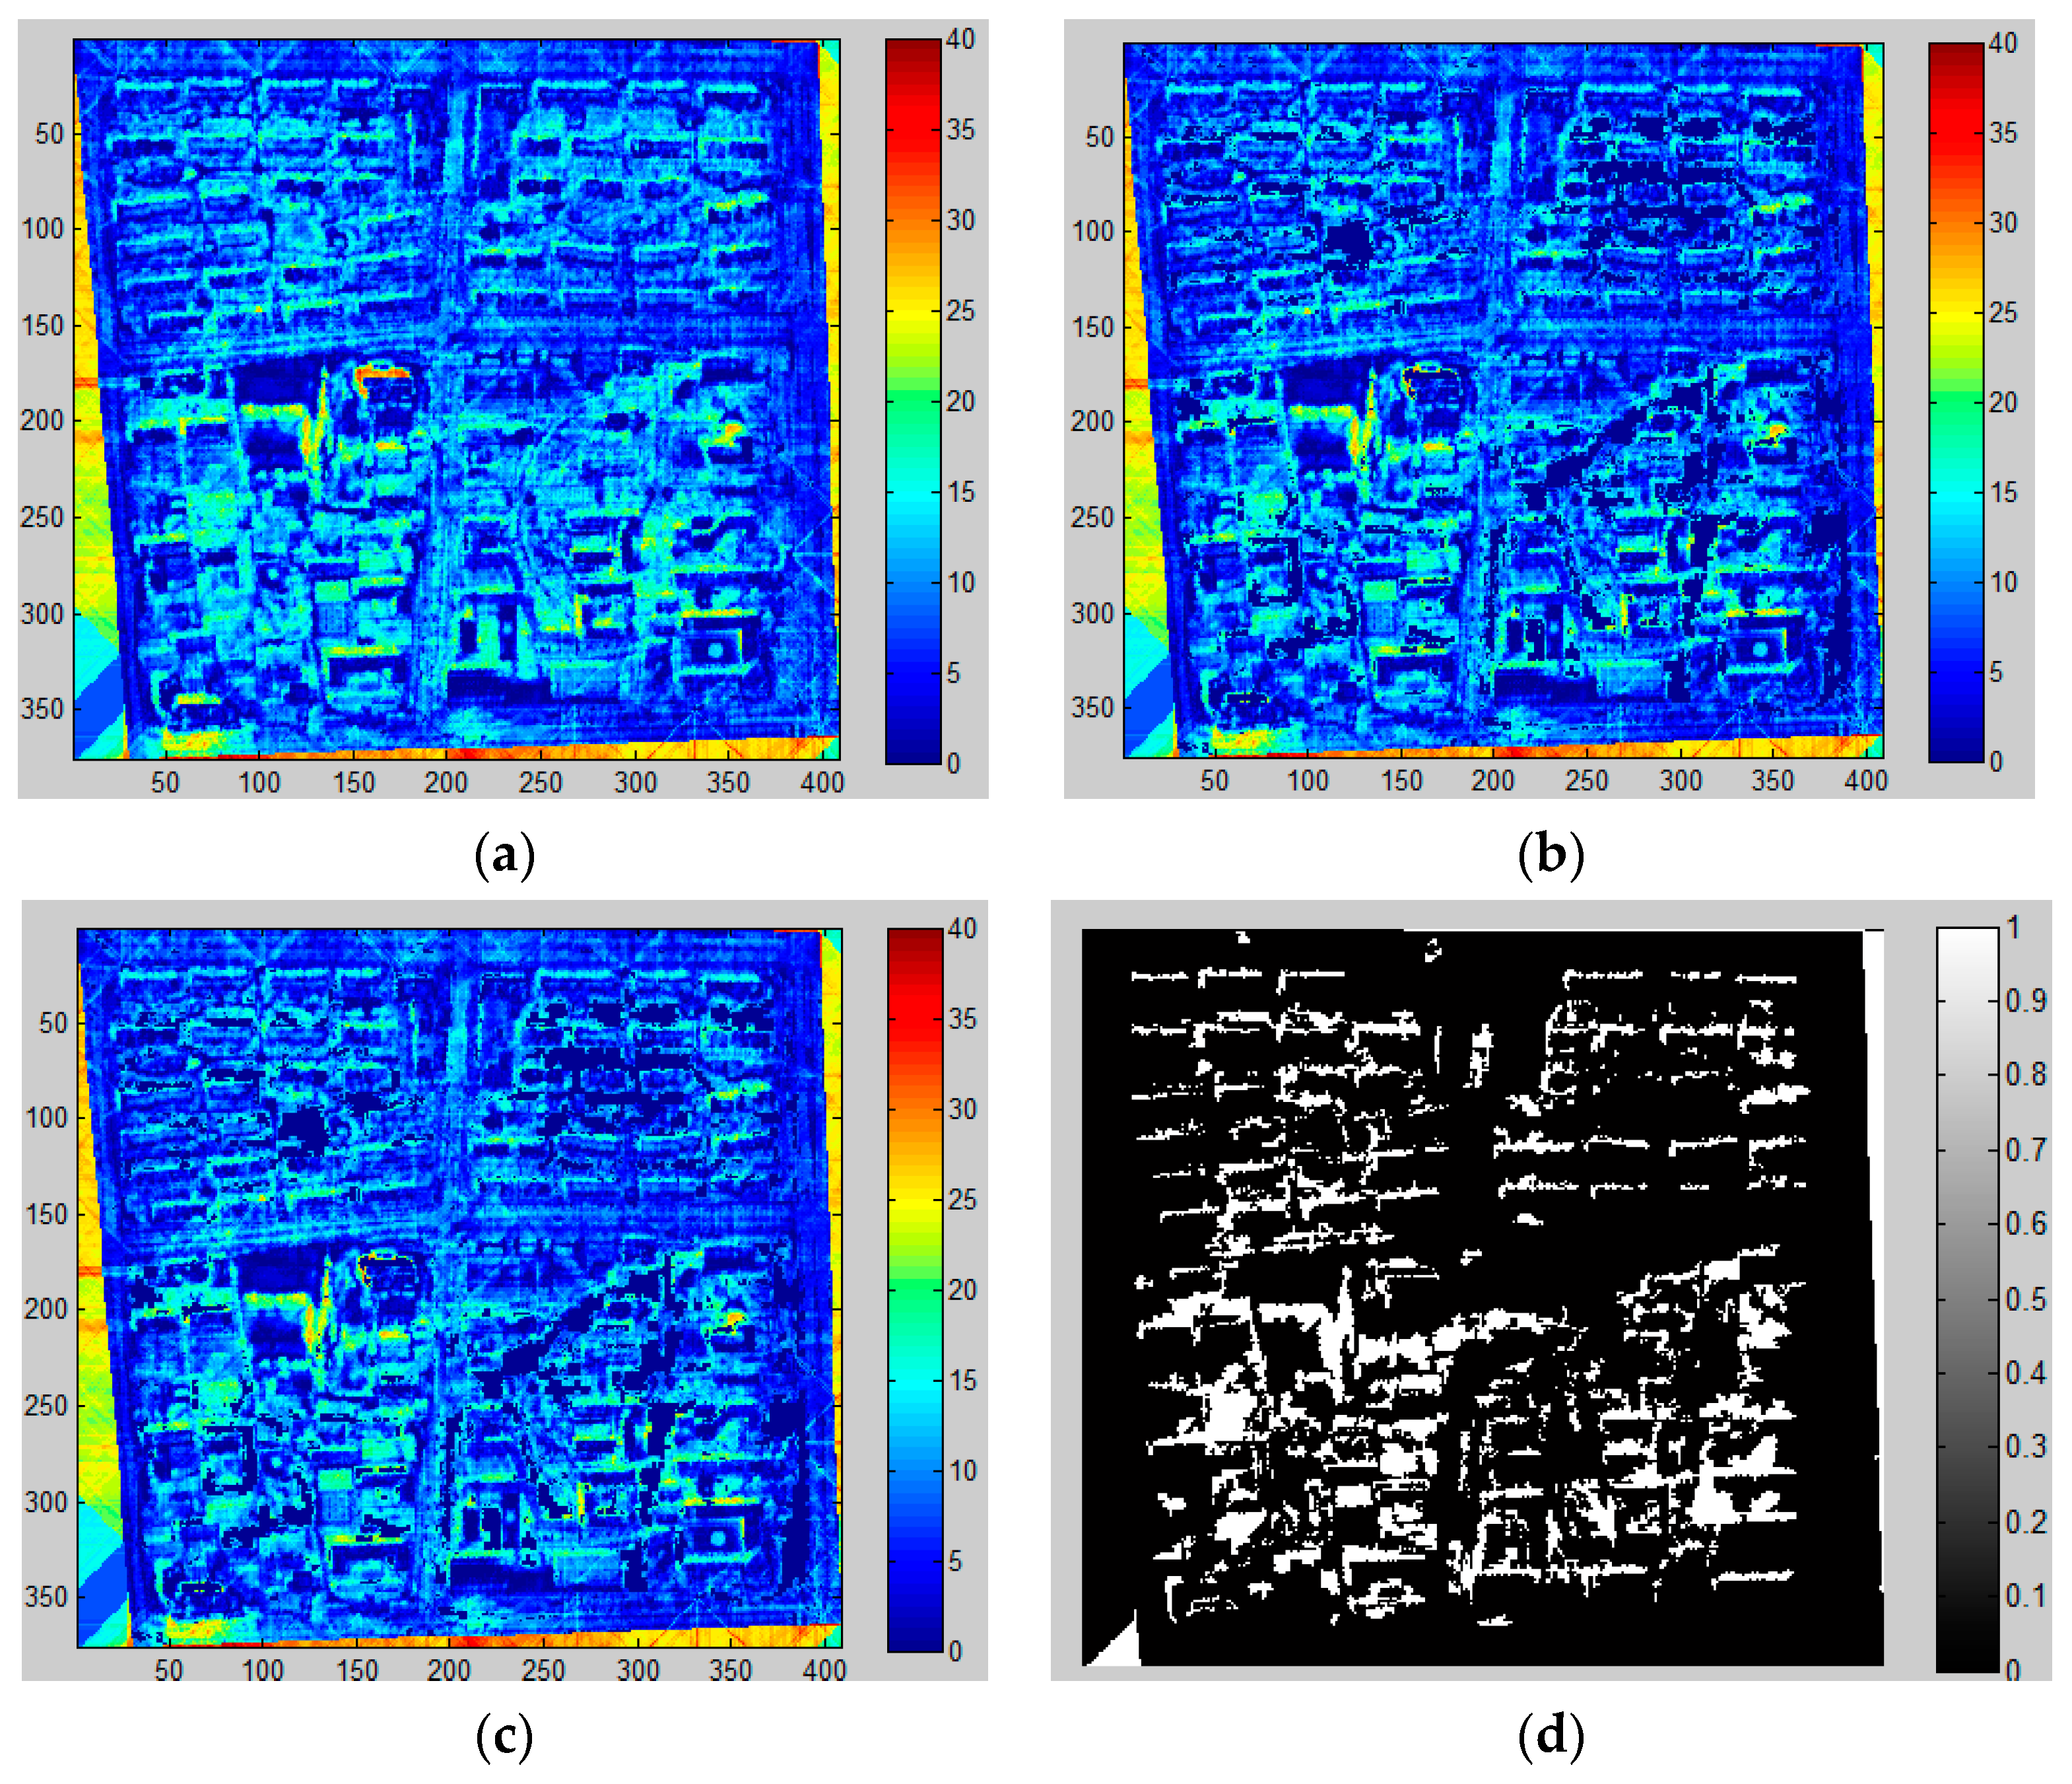
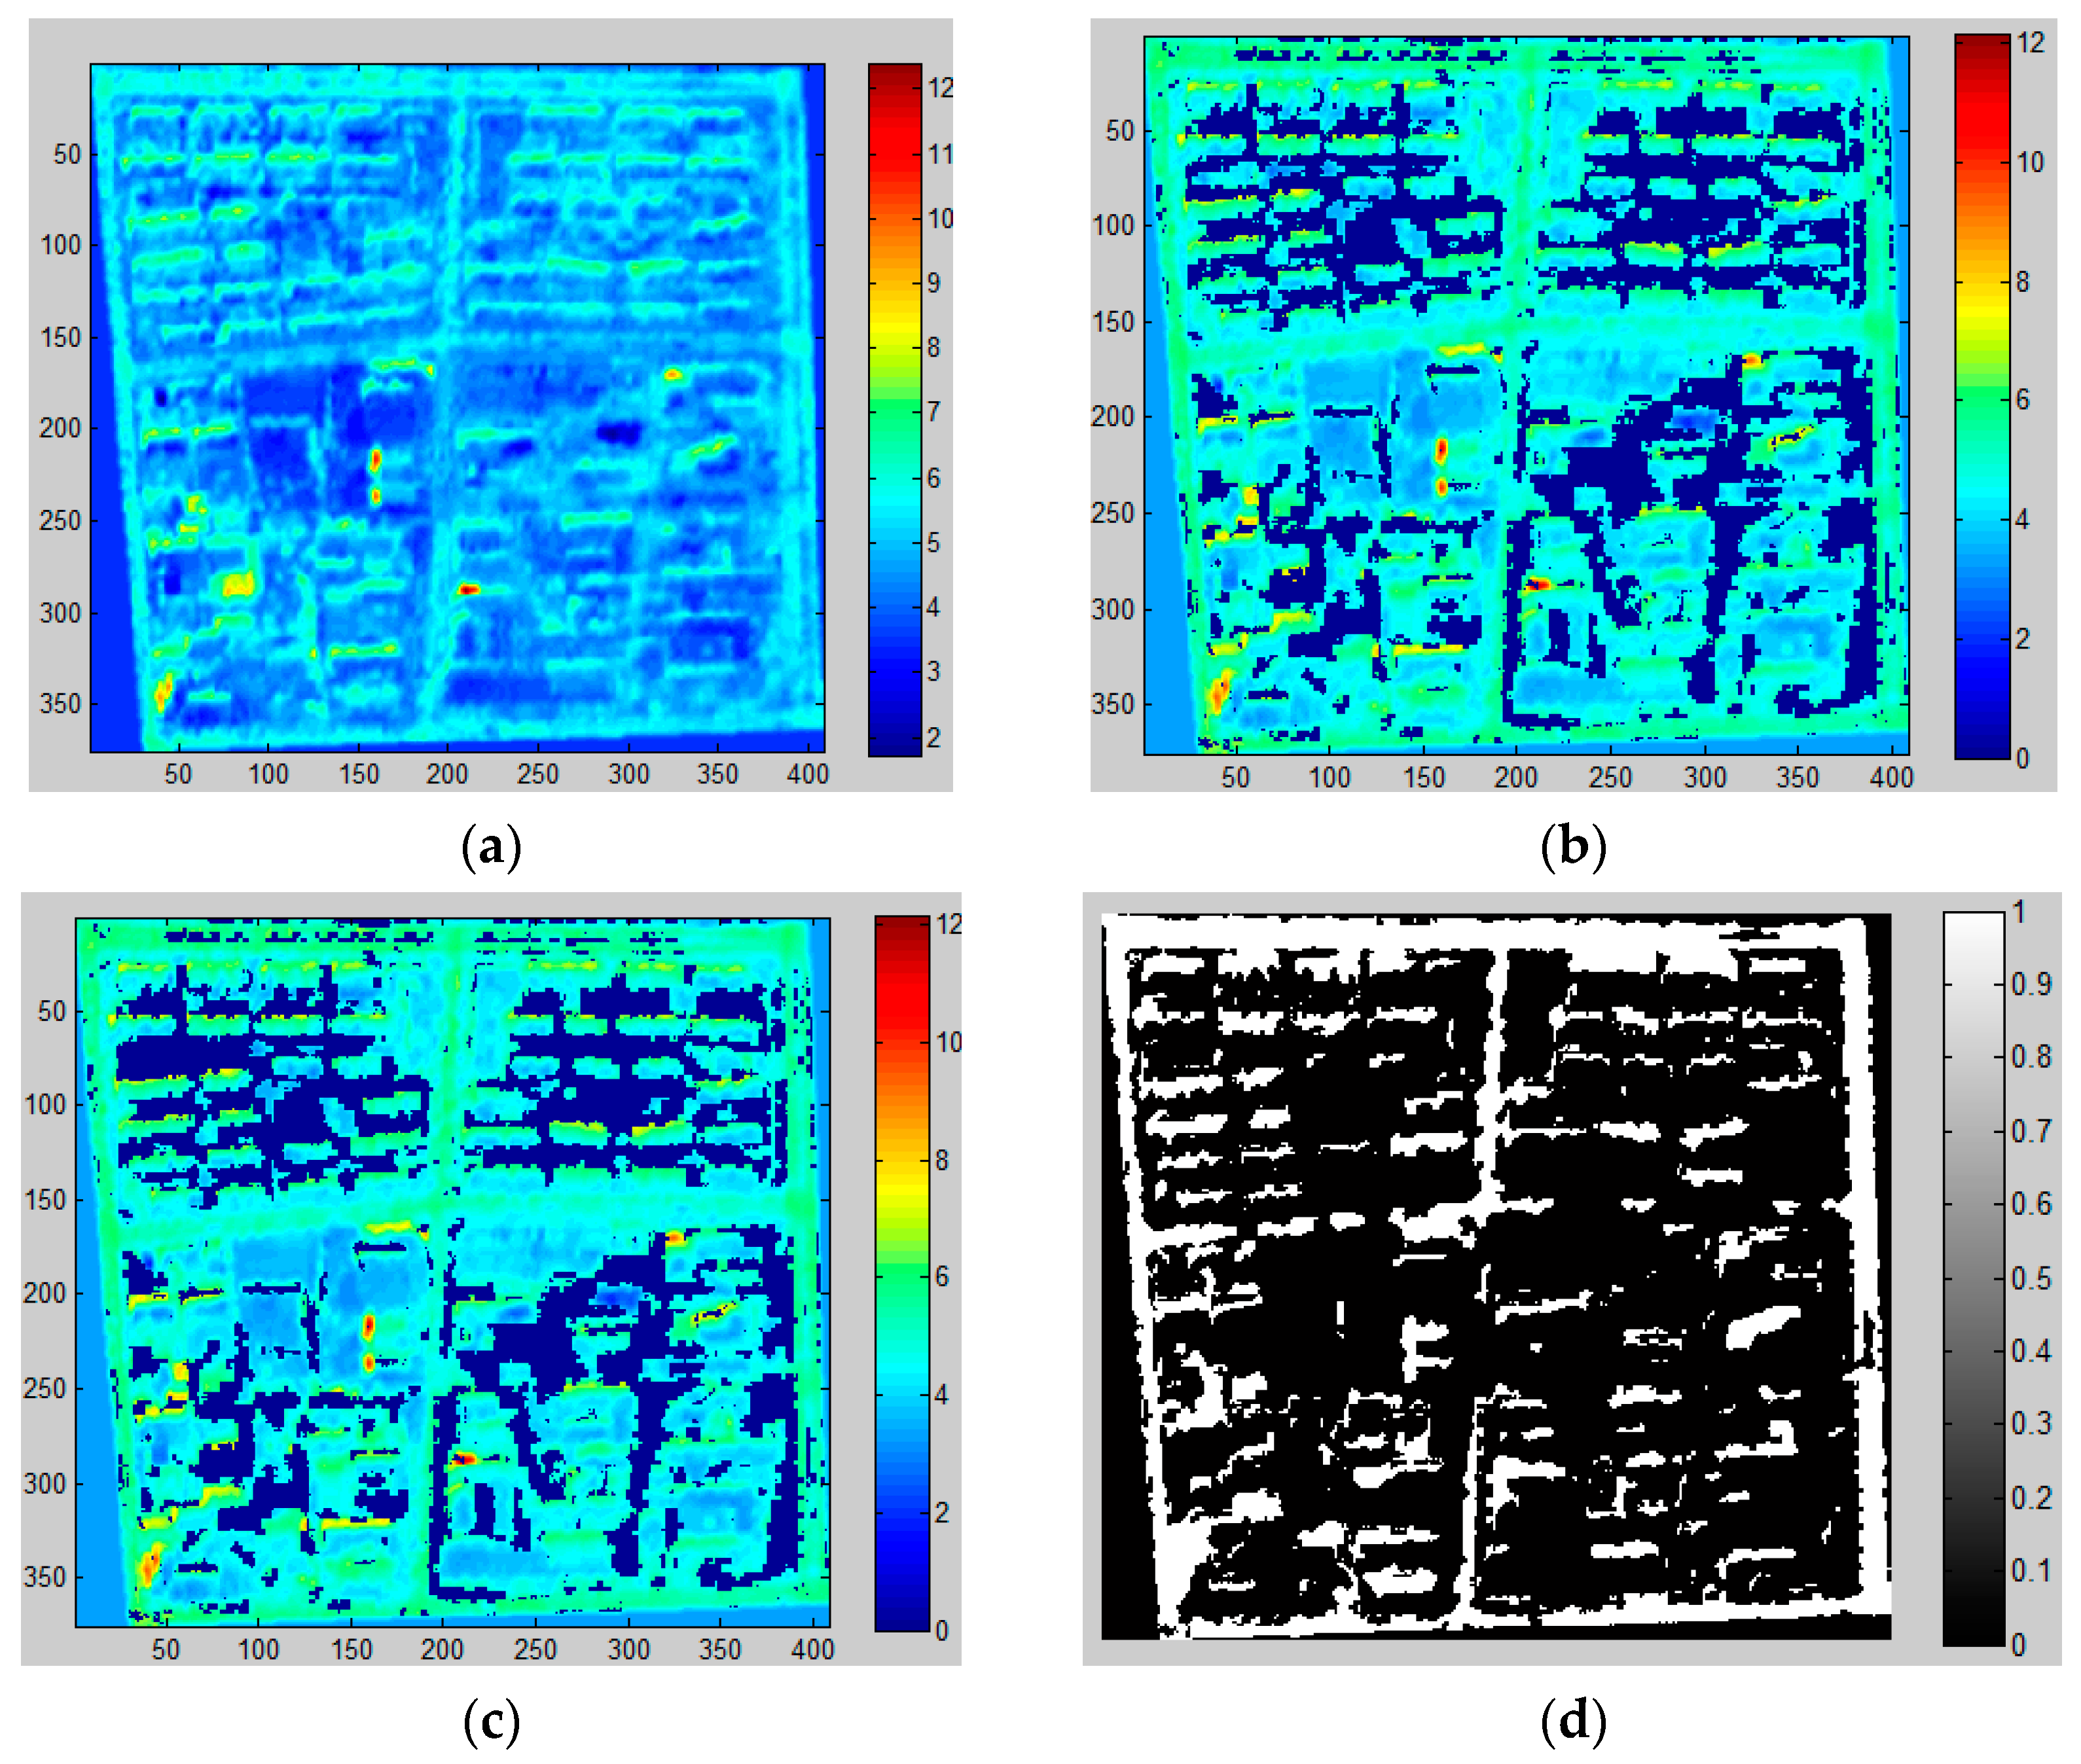
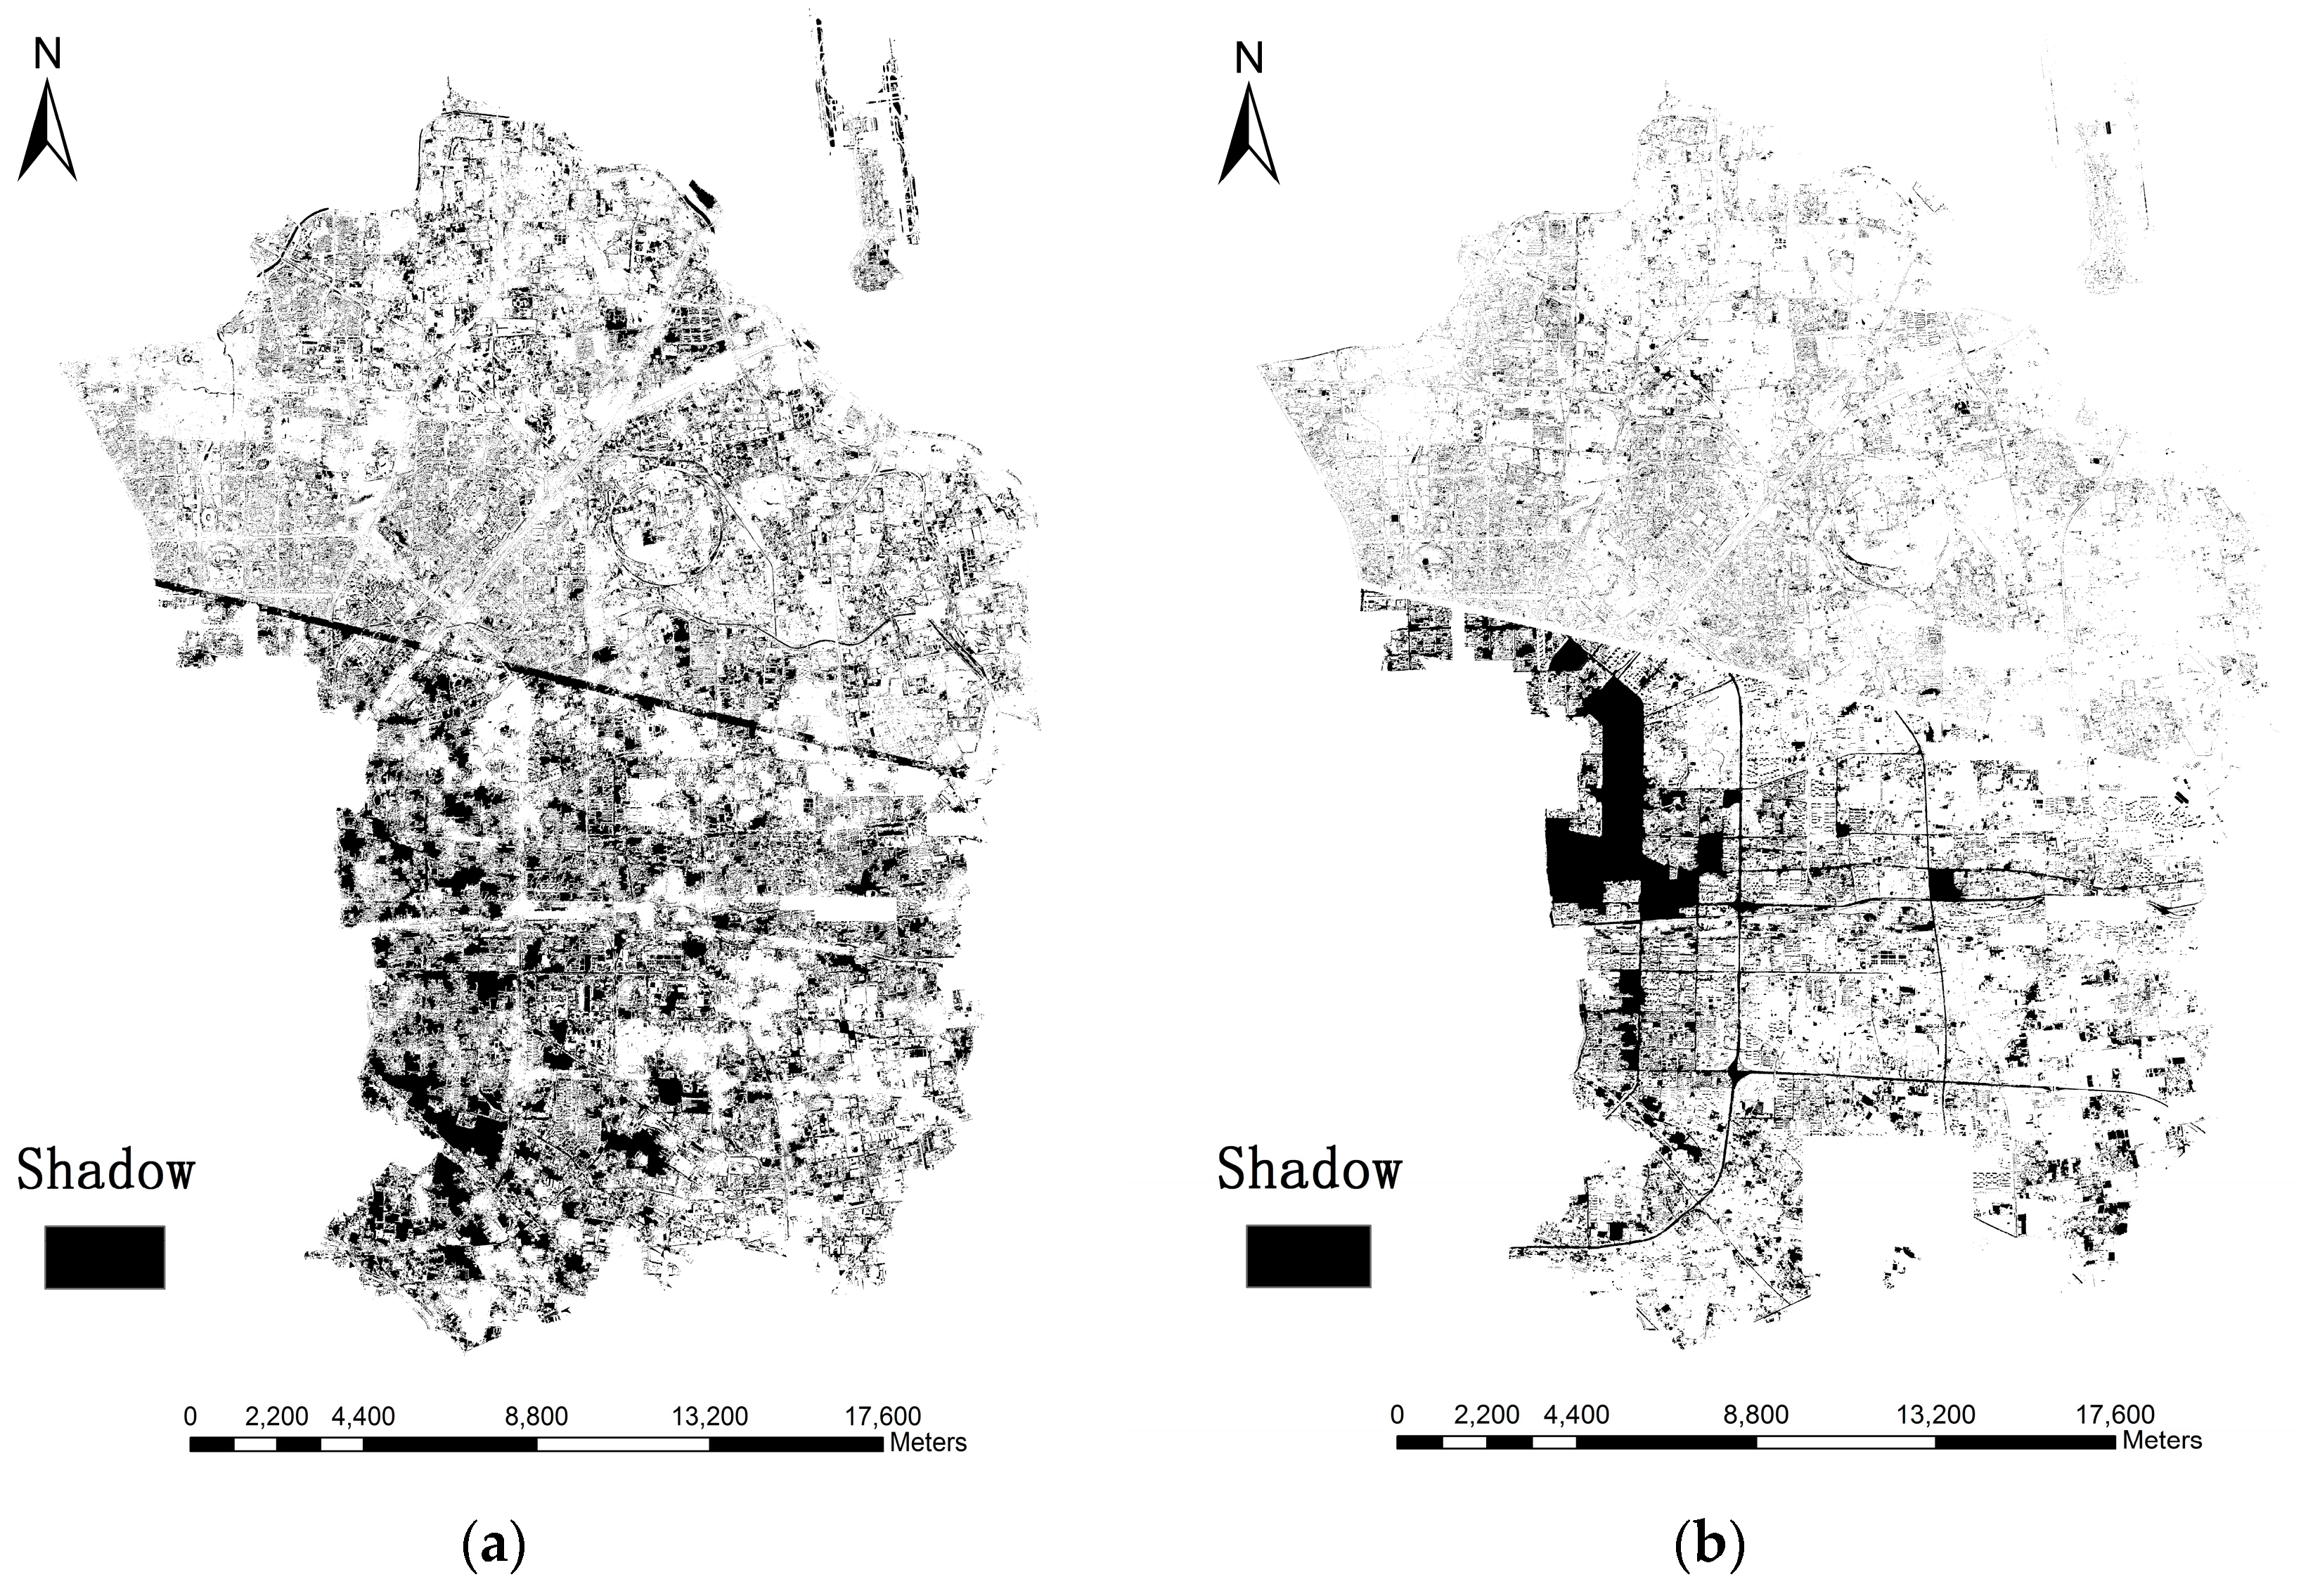
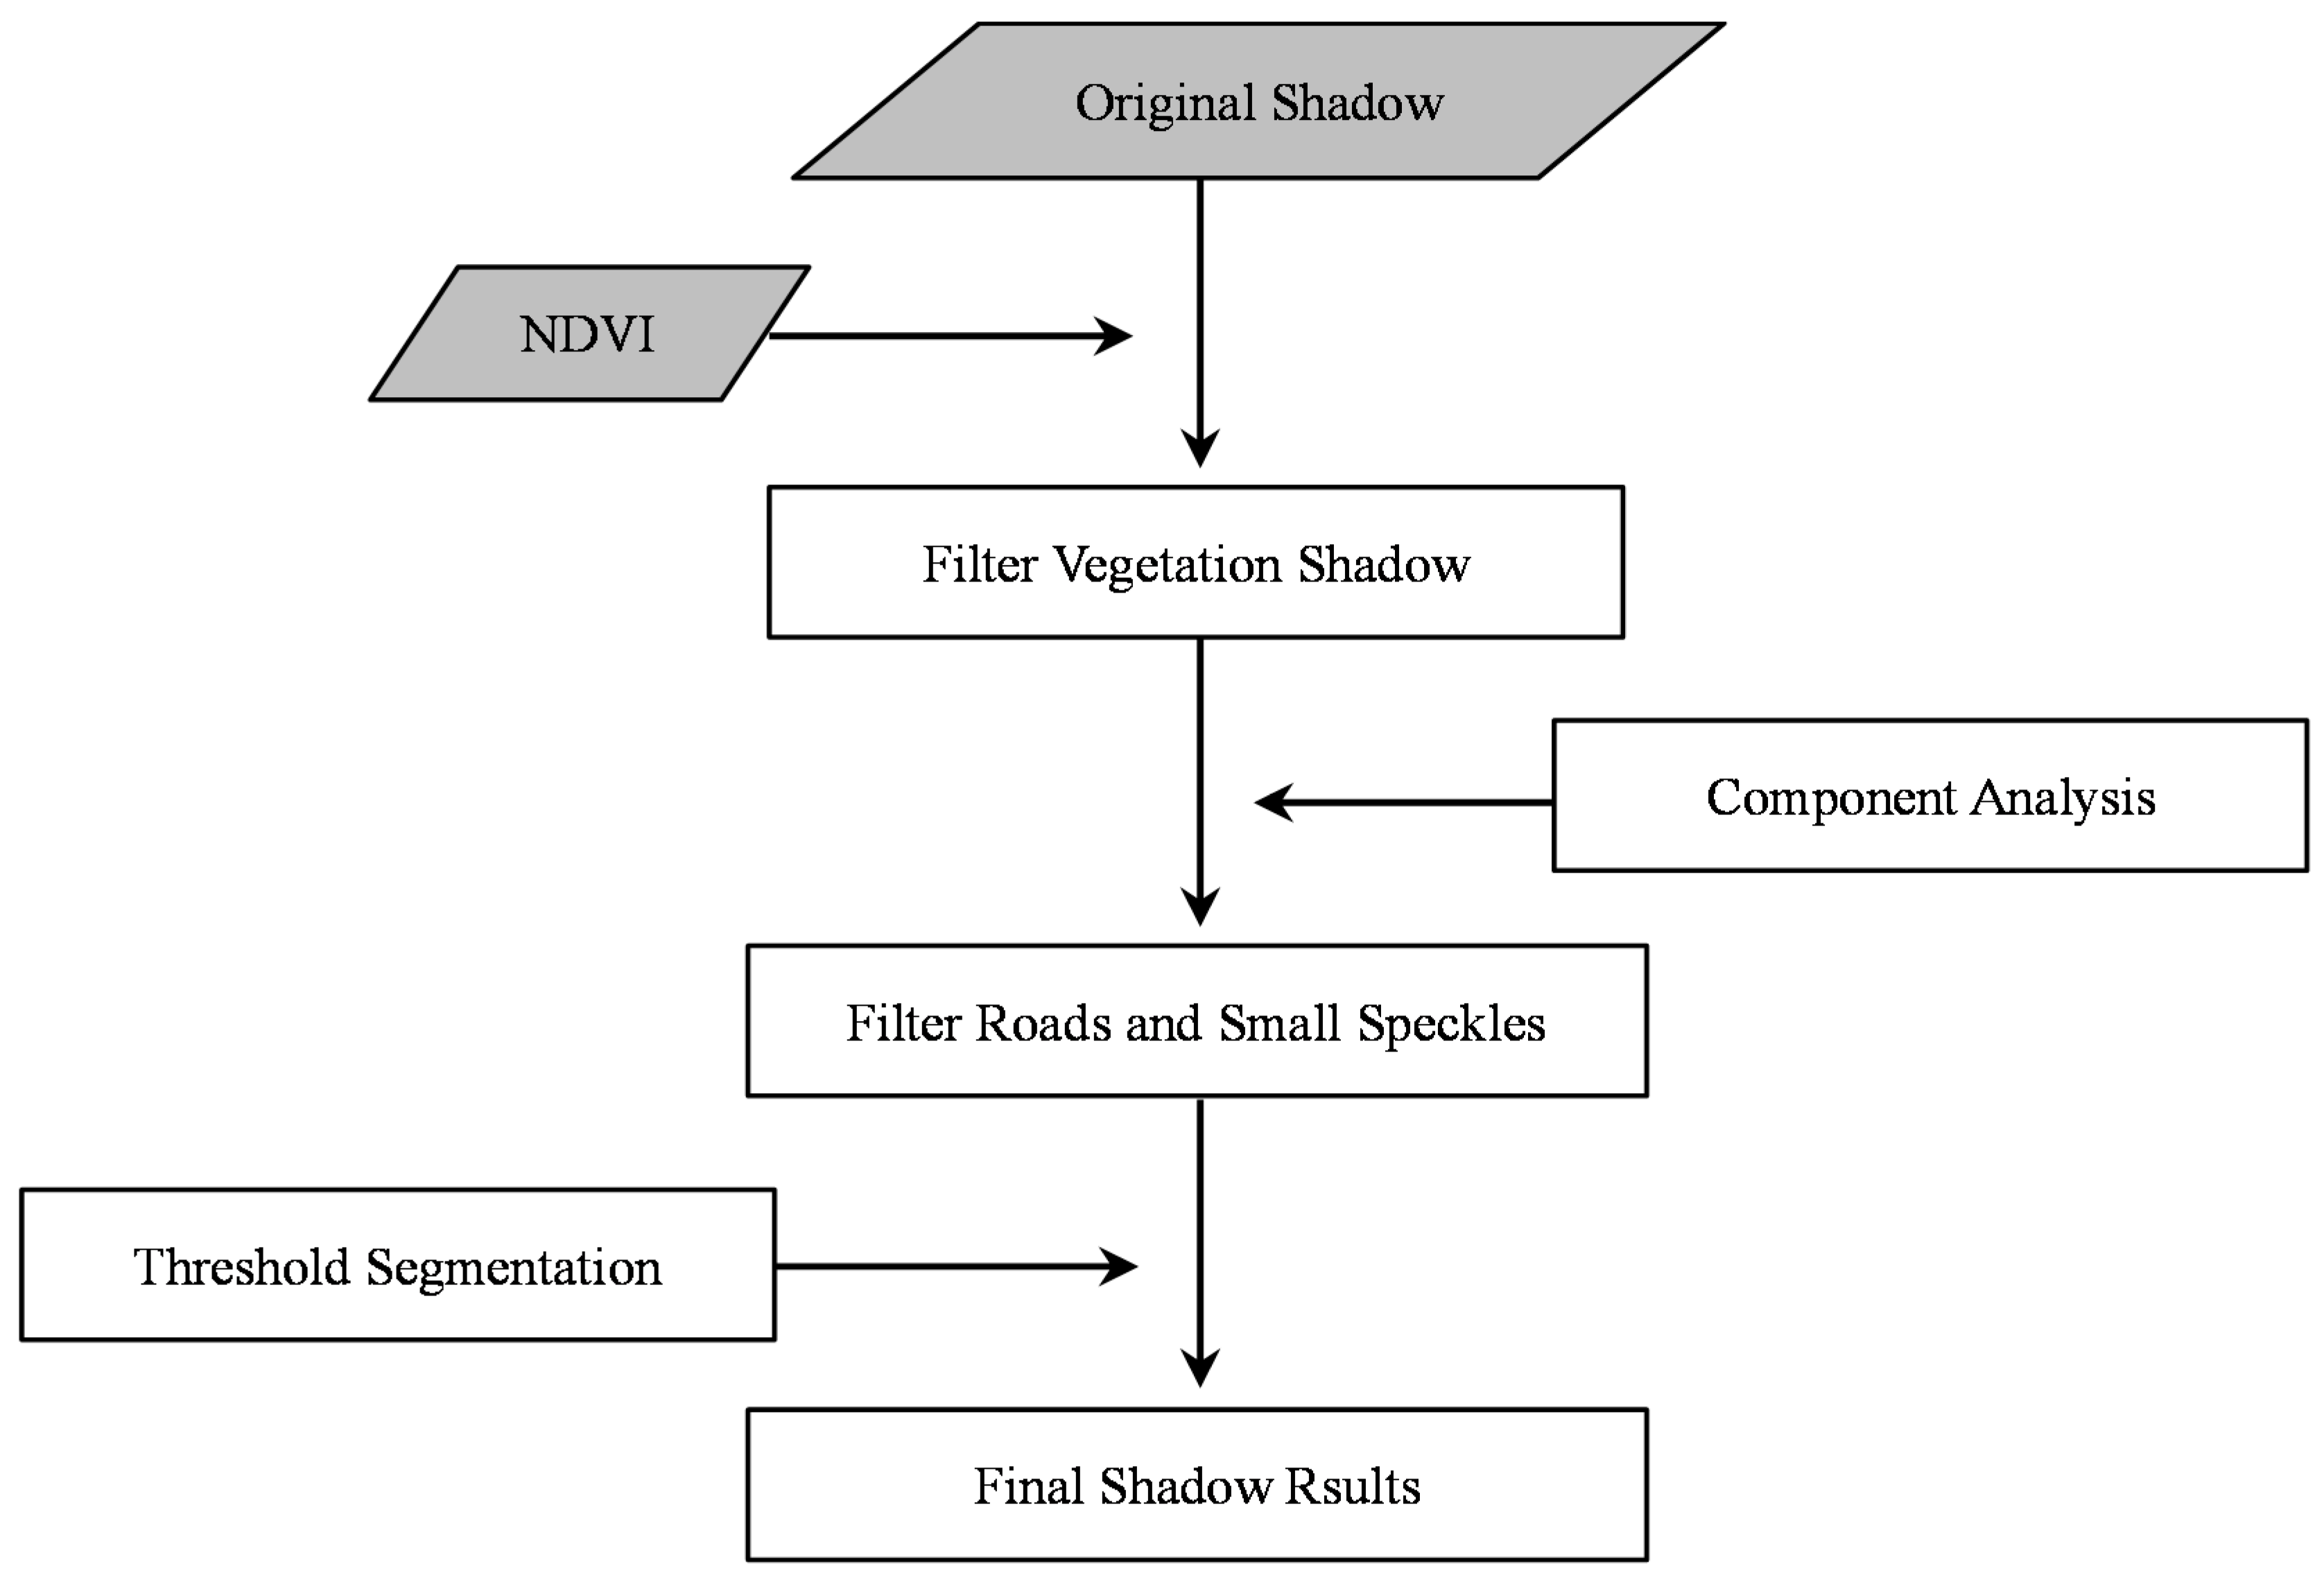
3.3.1. Shadow Extraction
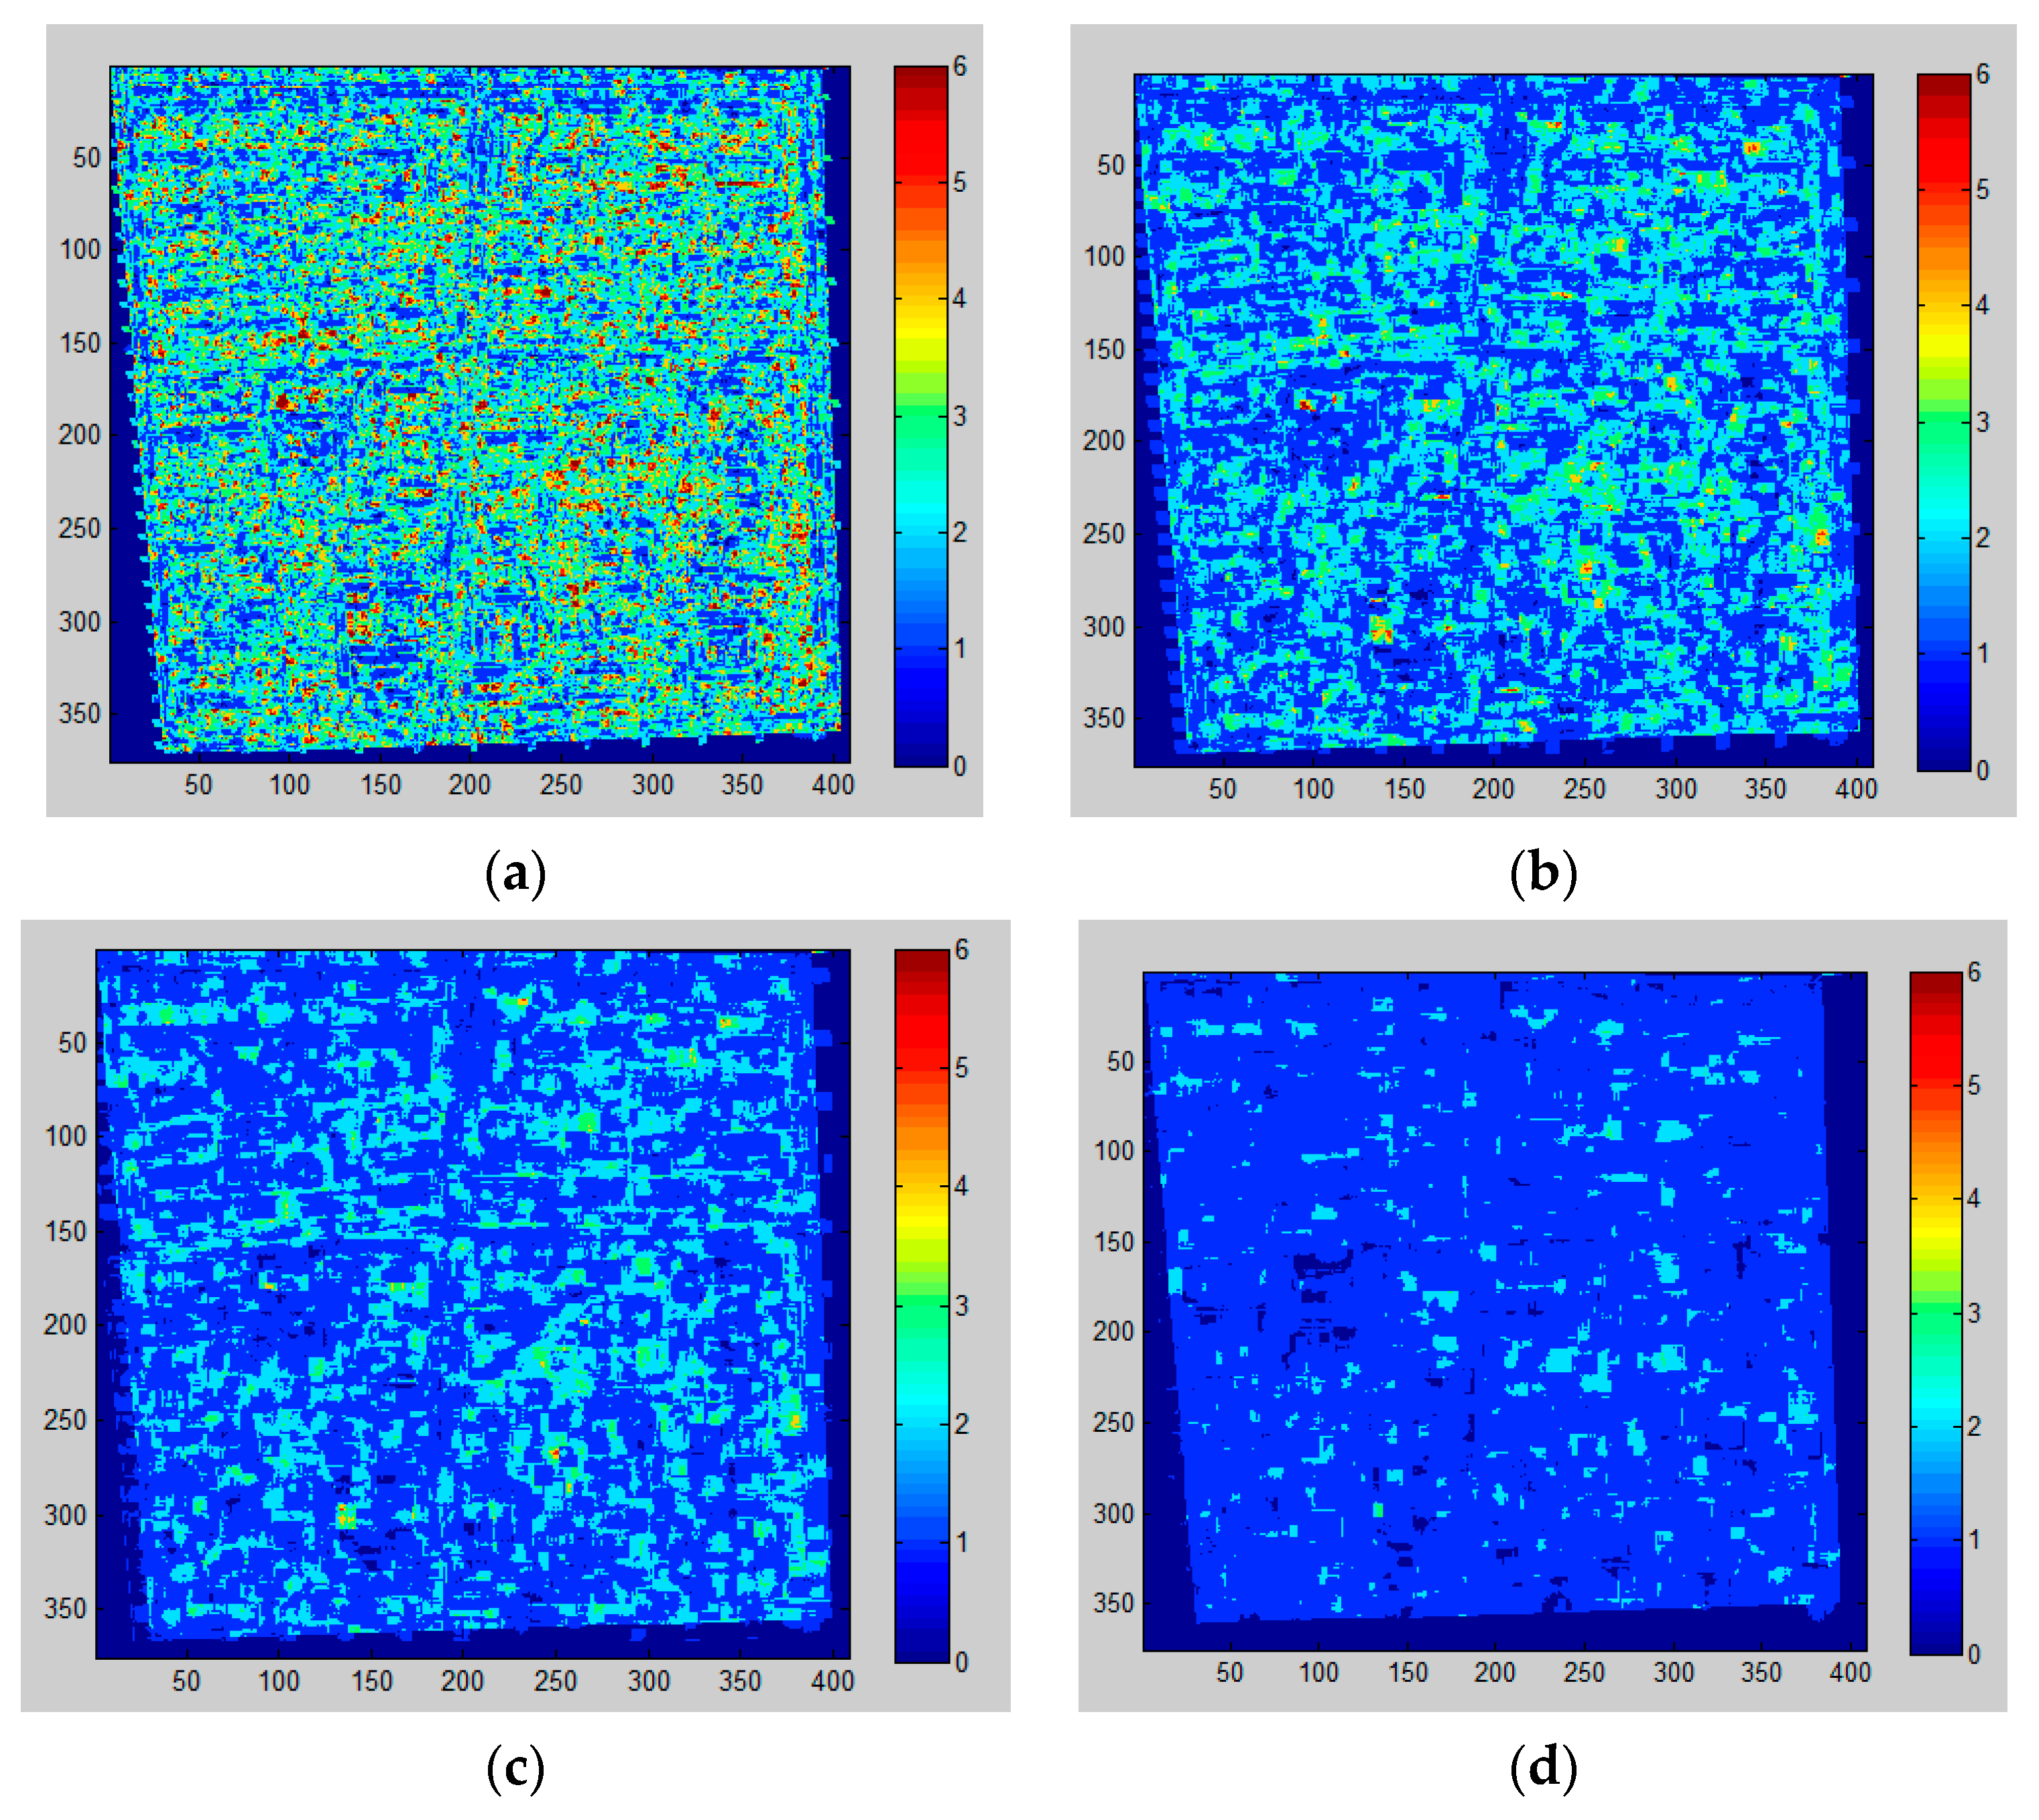
3.3.2. Shadow Length Calculation
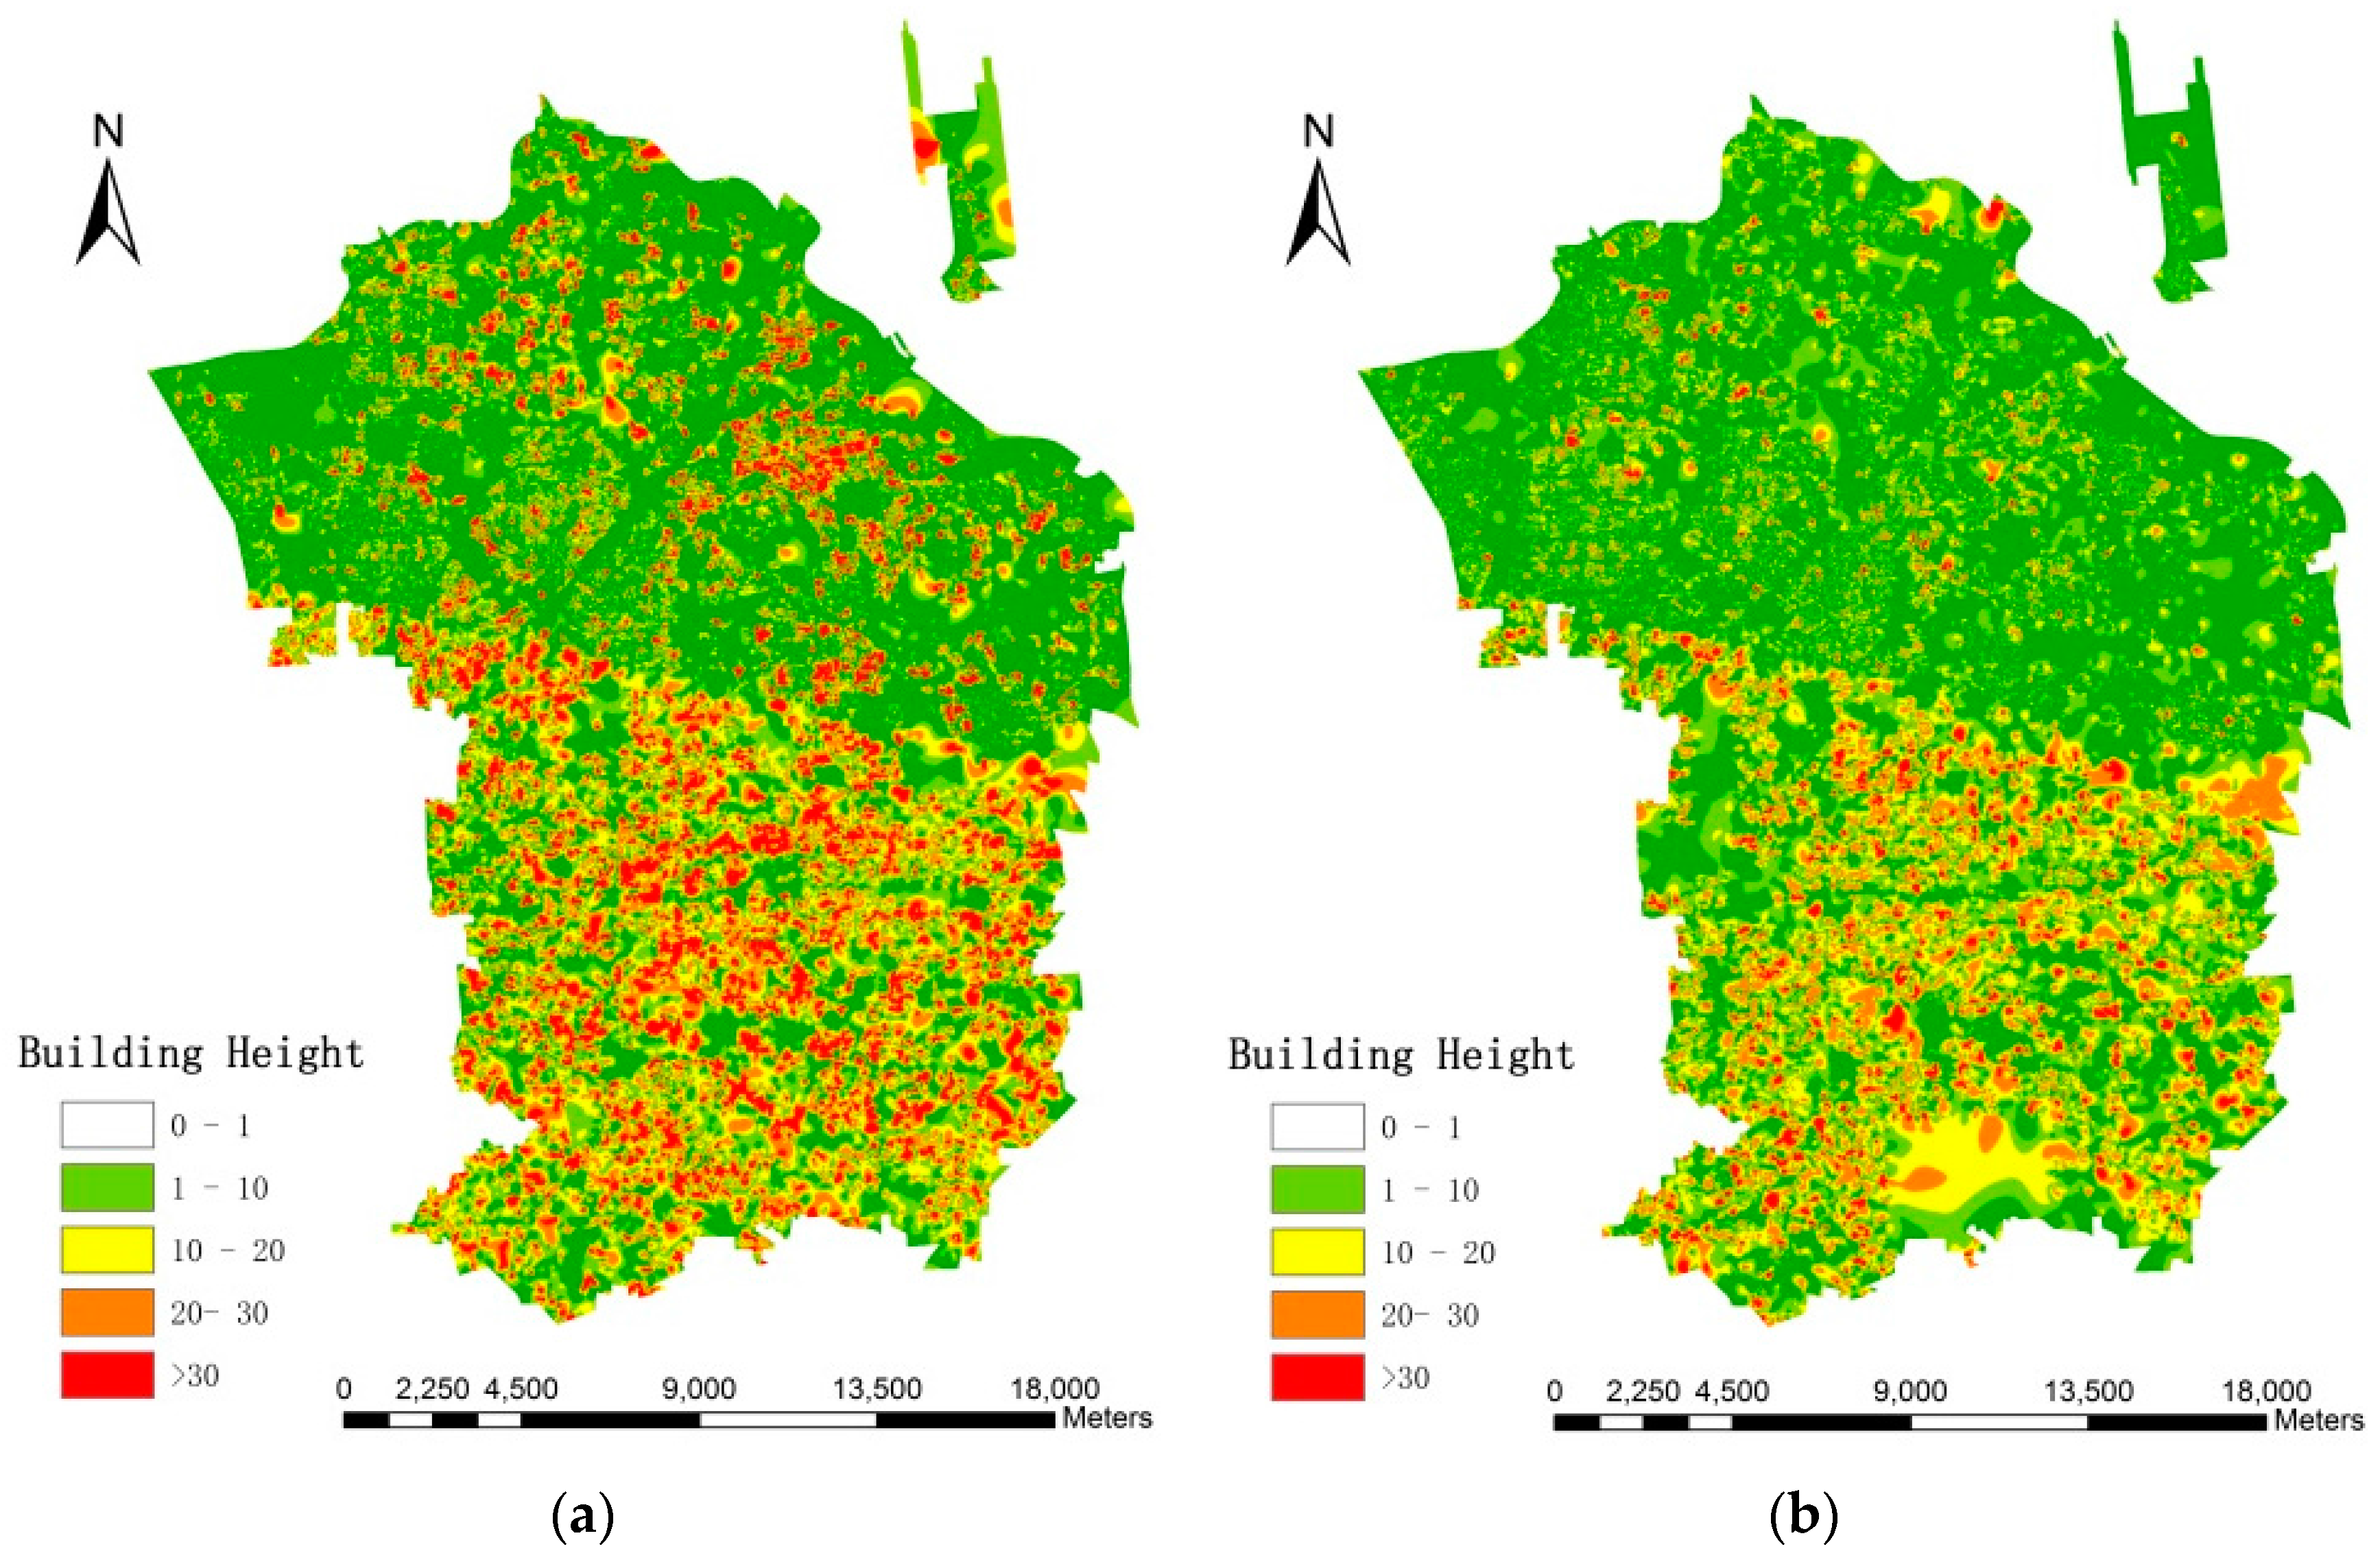
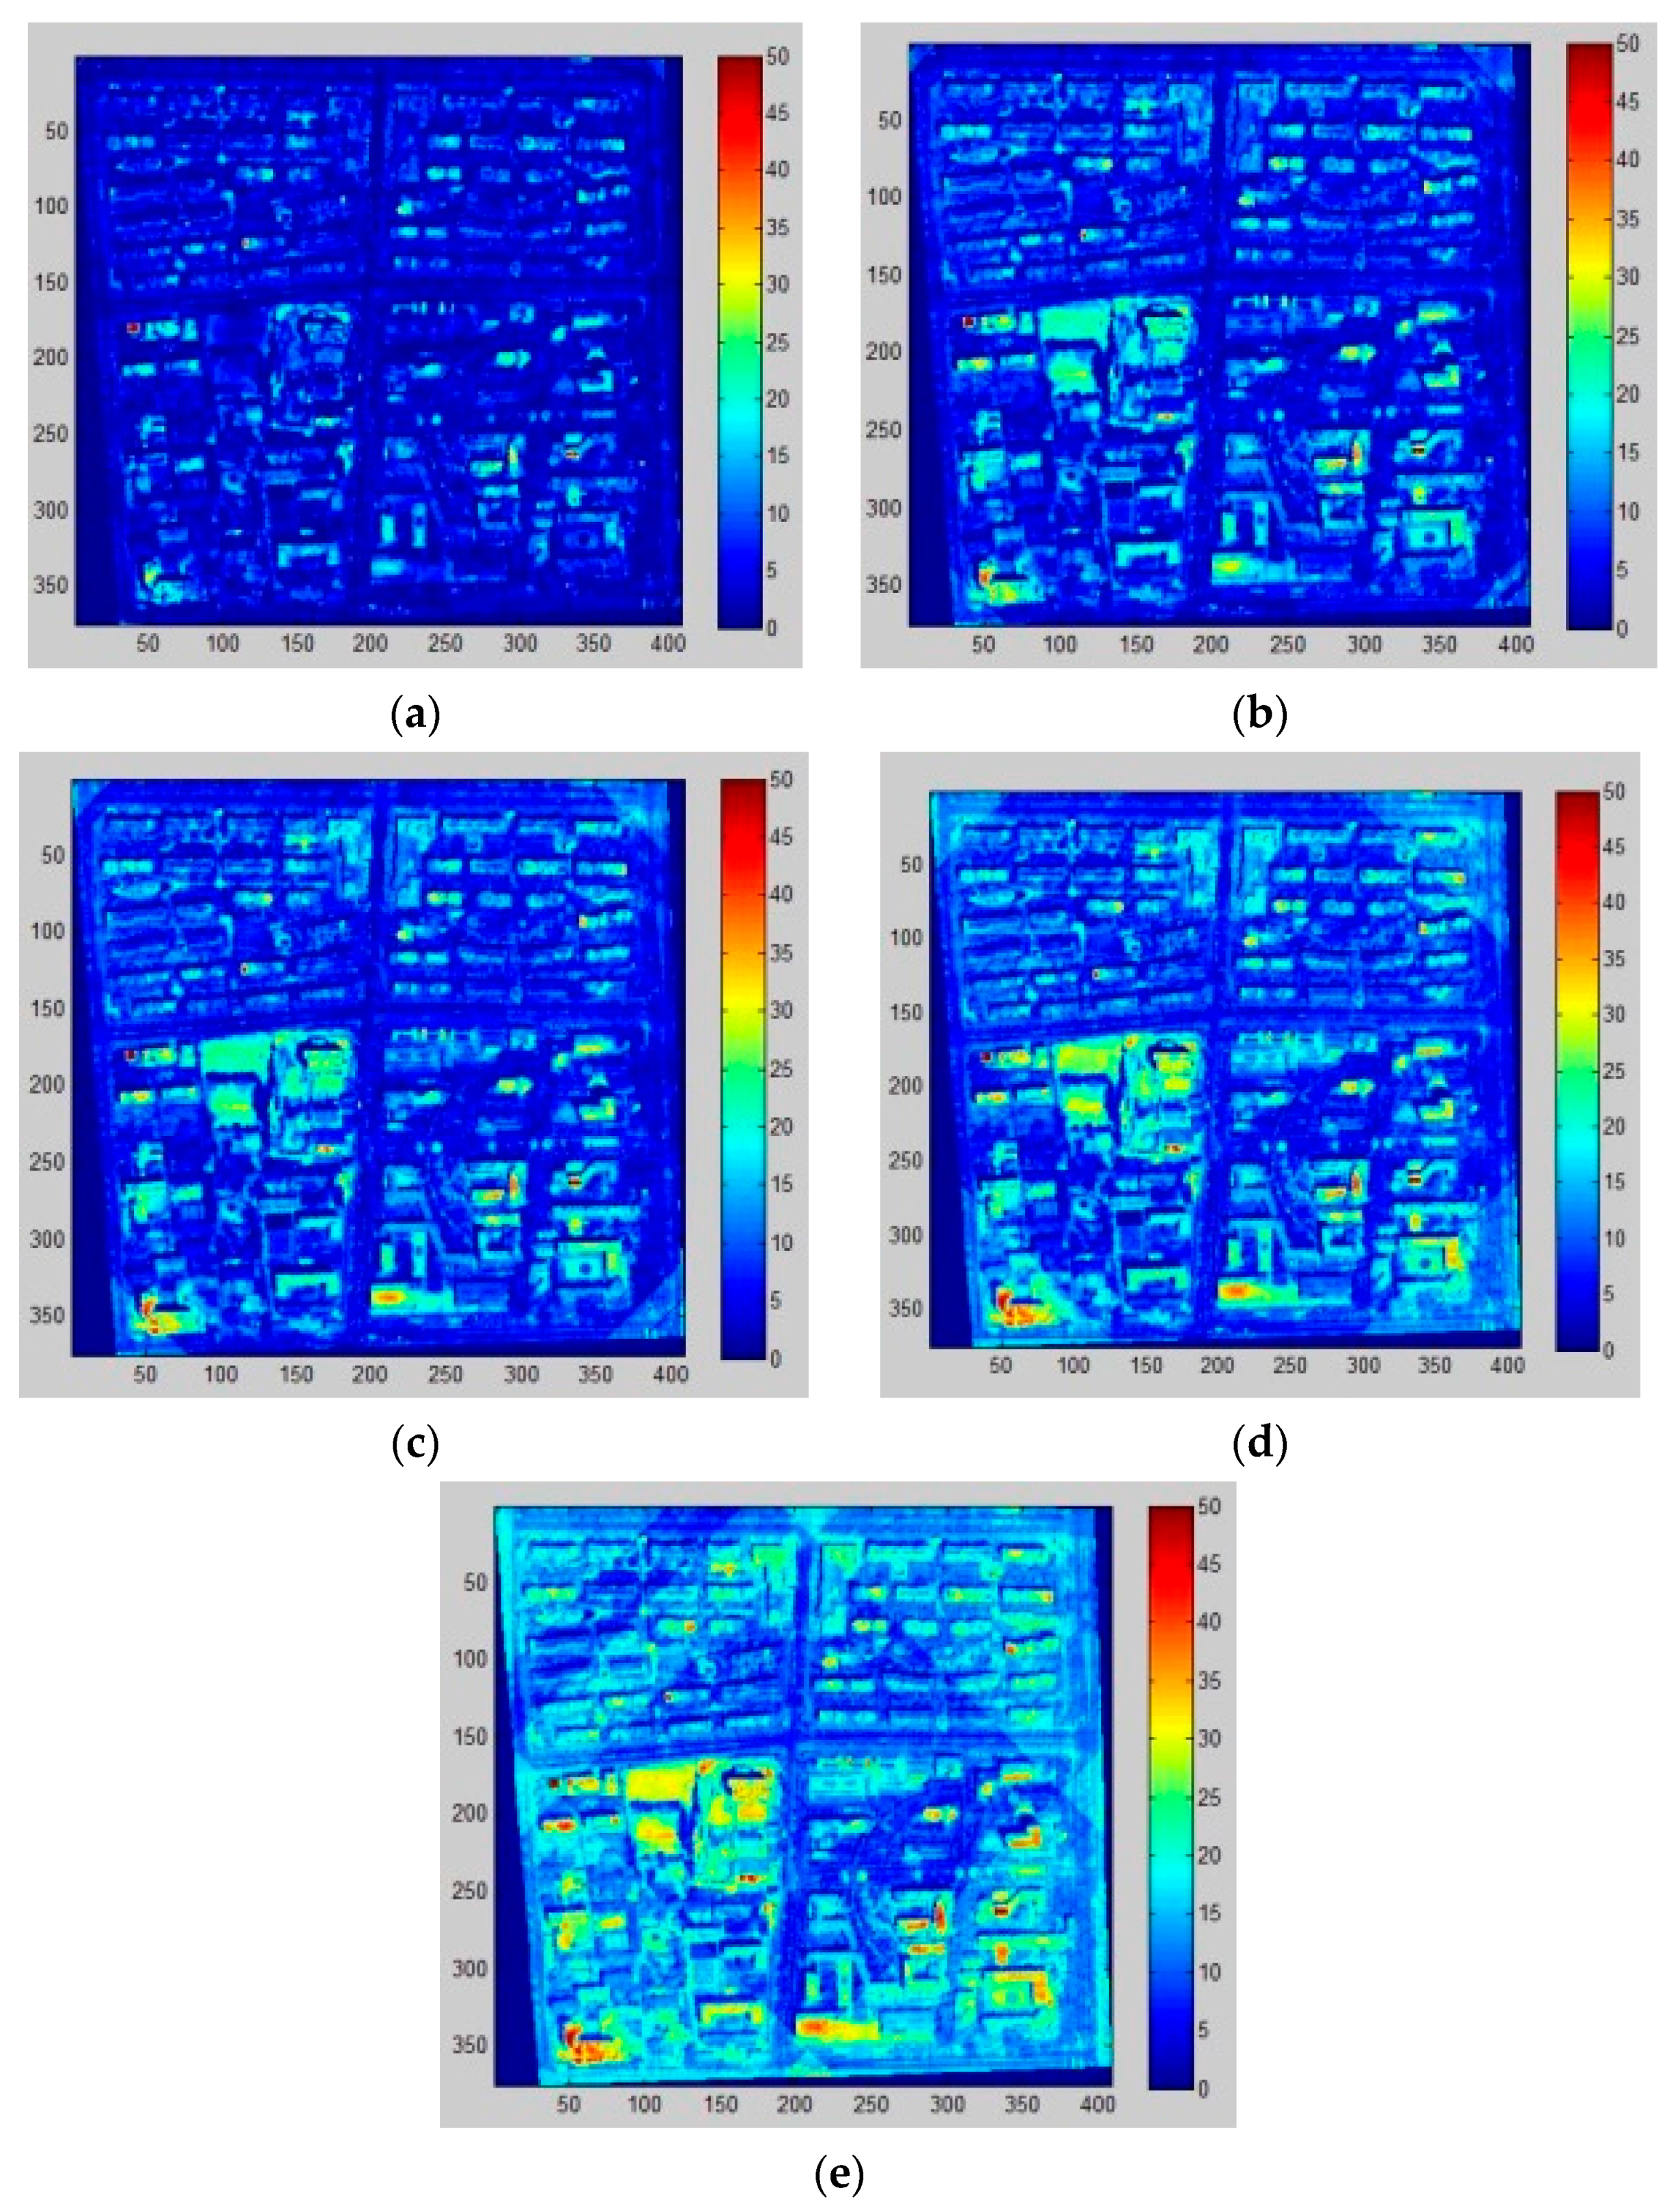
3.3.3. Building Height Estimation
3.4. Population Estimation
3.5. Accuracy Analysis
4. Comparison and Experimental Results
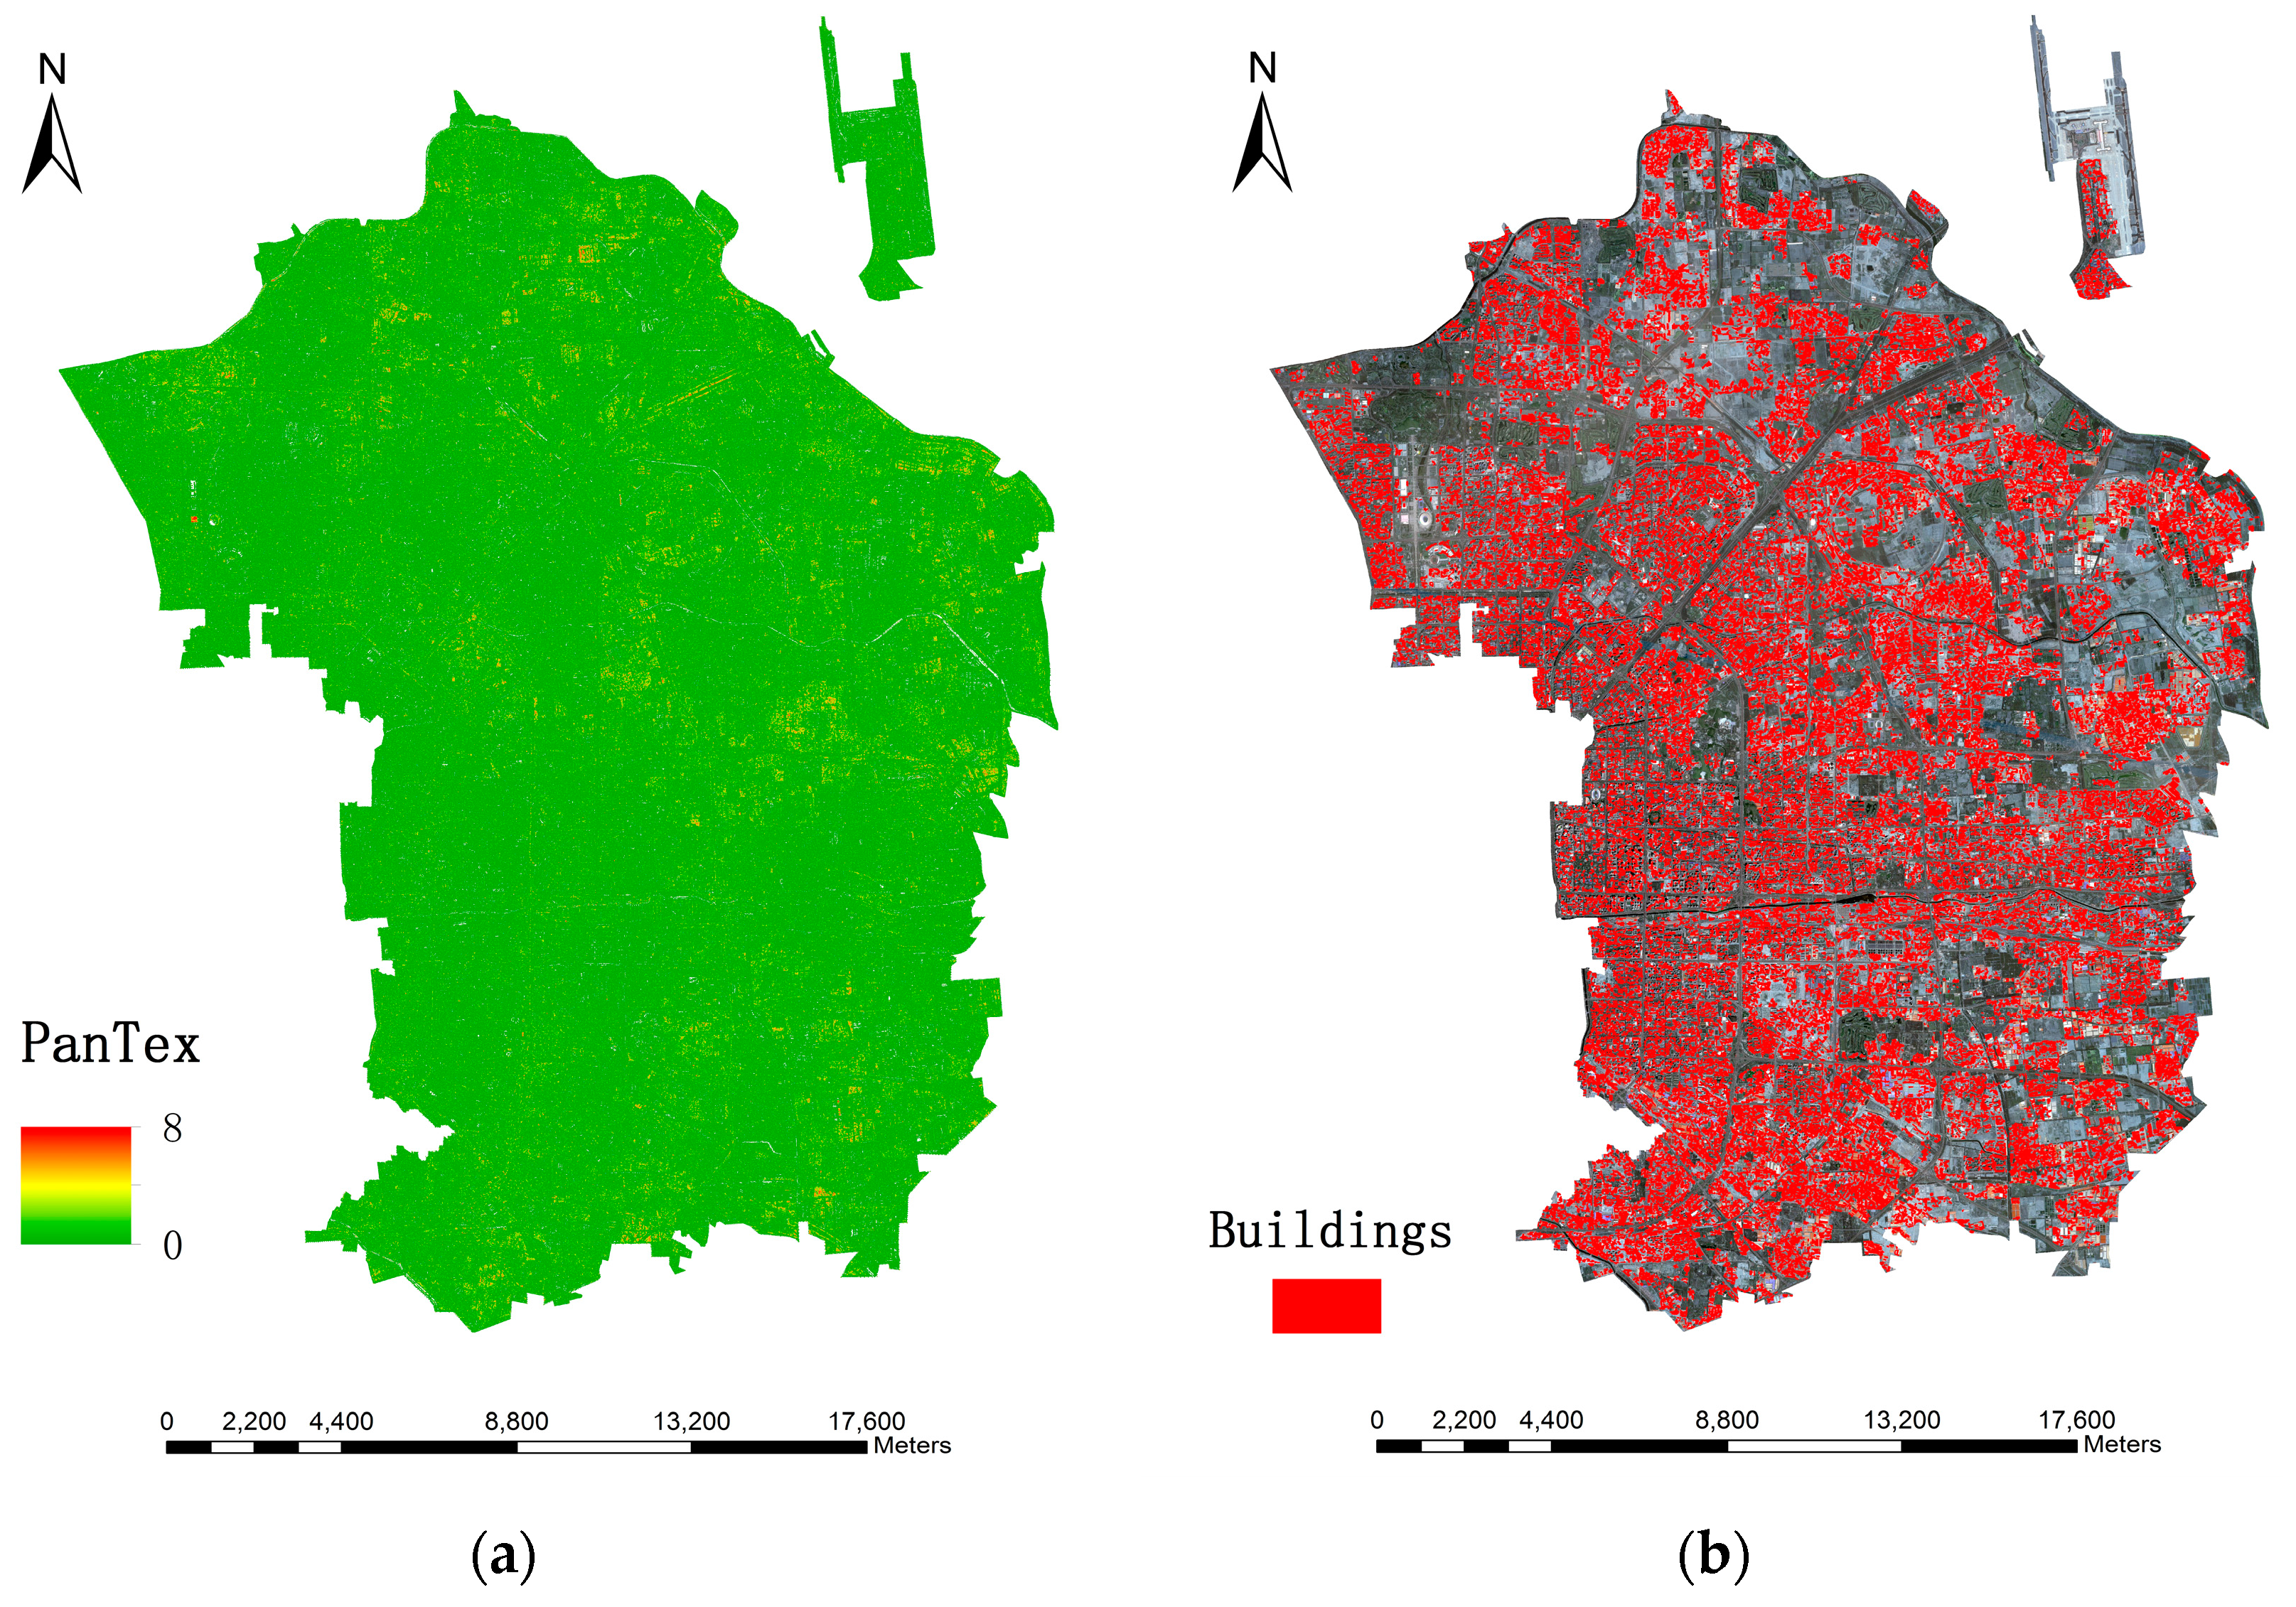
4.1. Building Extraction Results
4.2. Height Retrieval Results
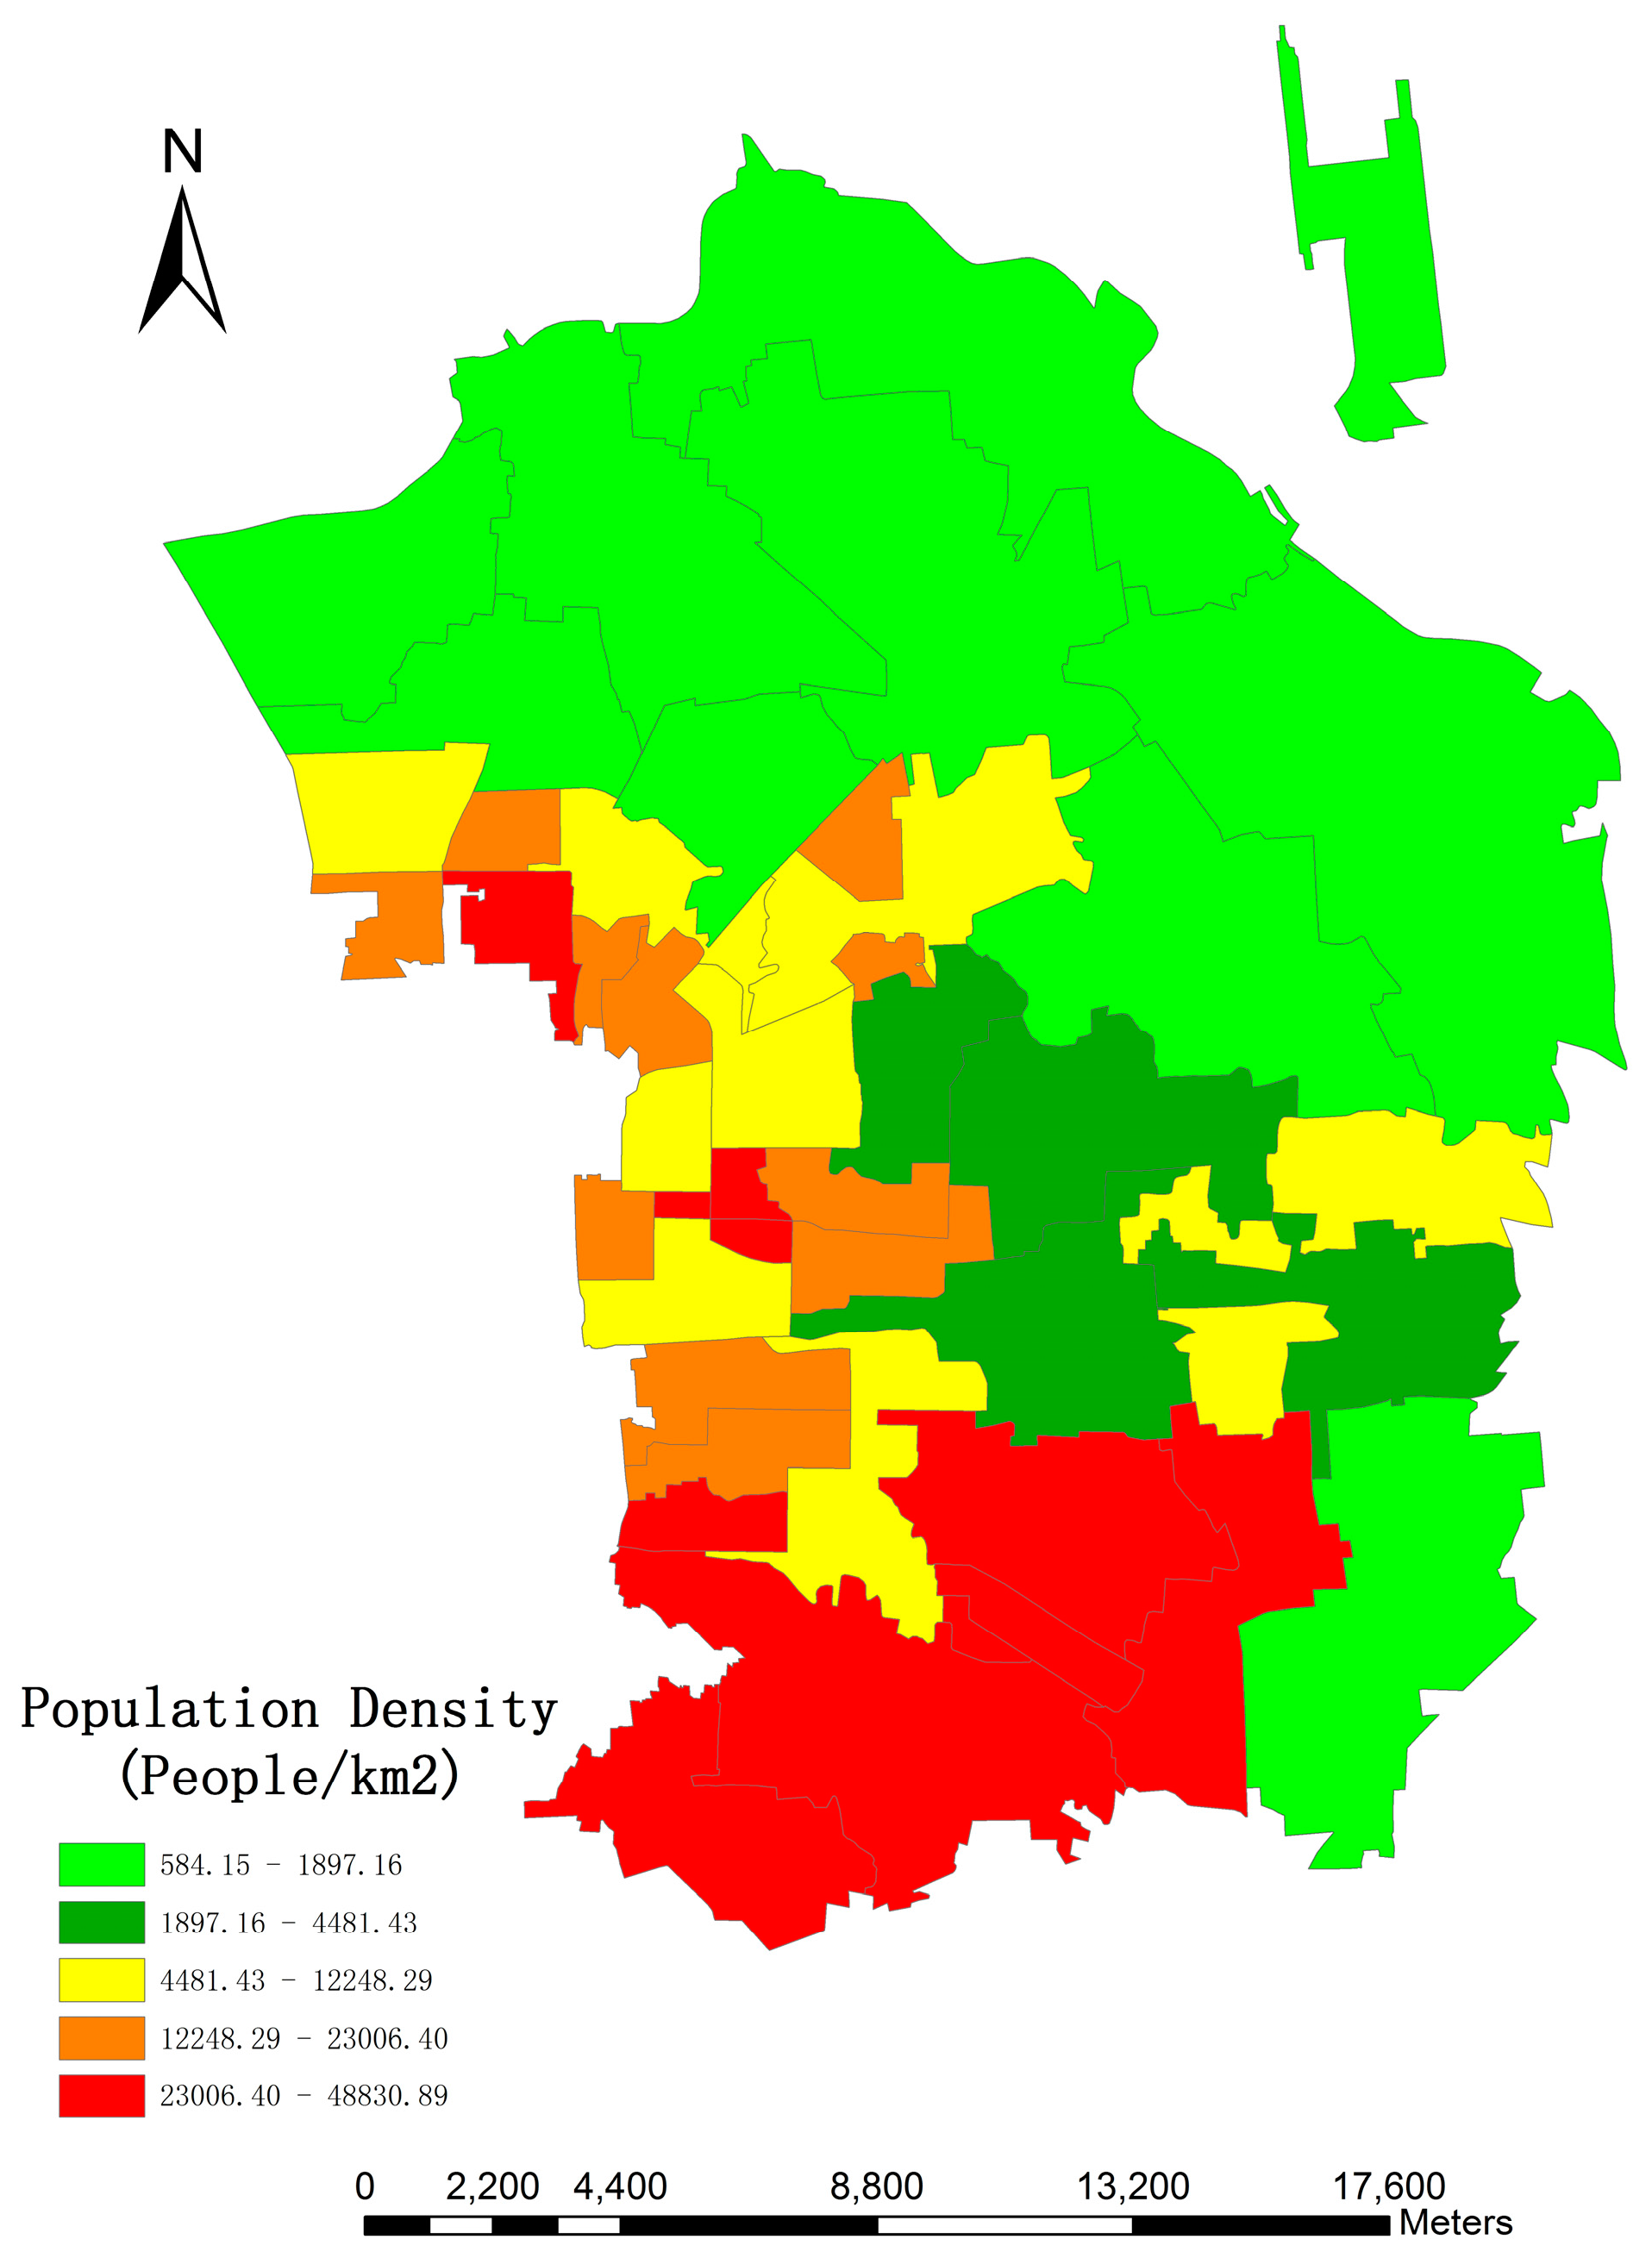
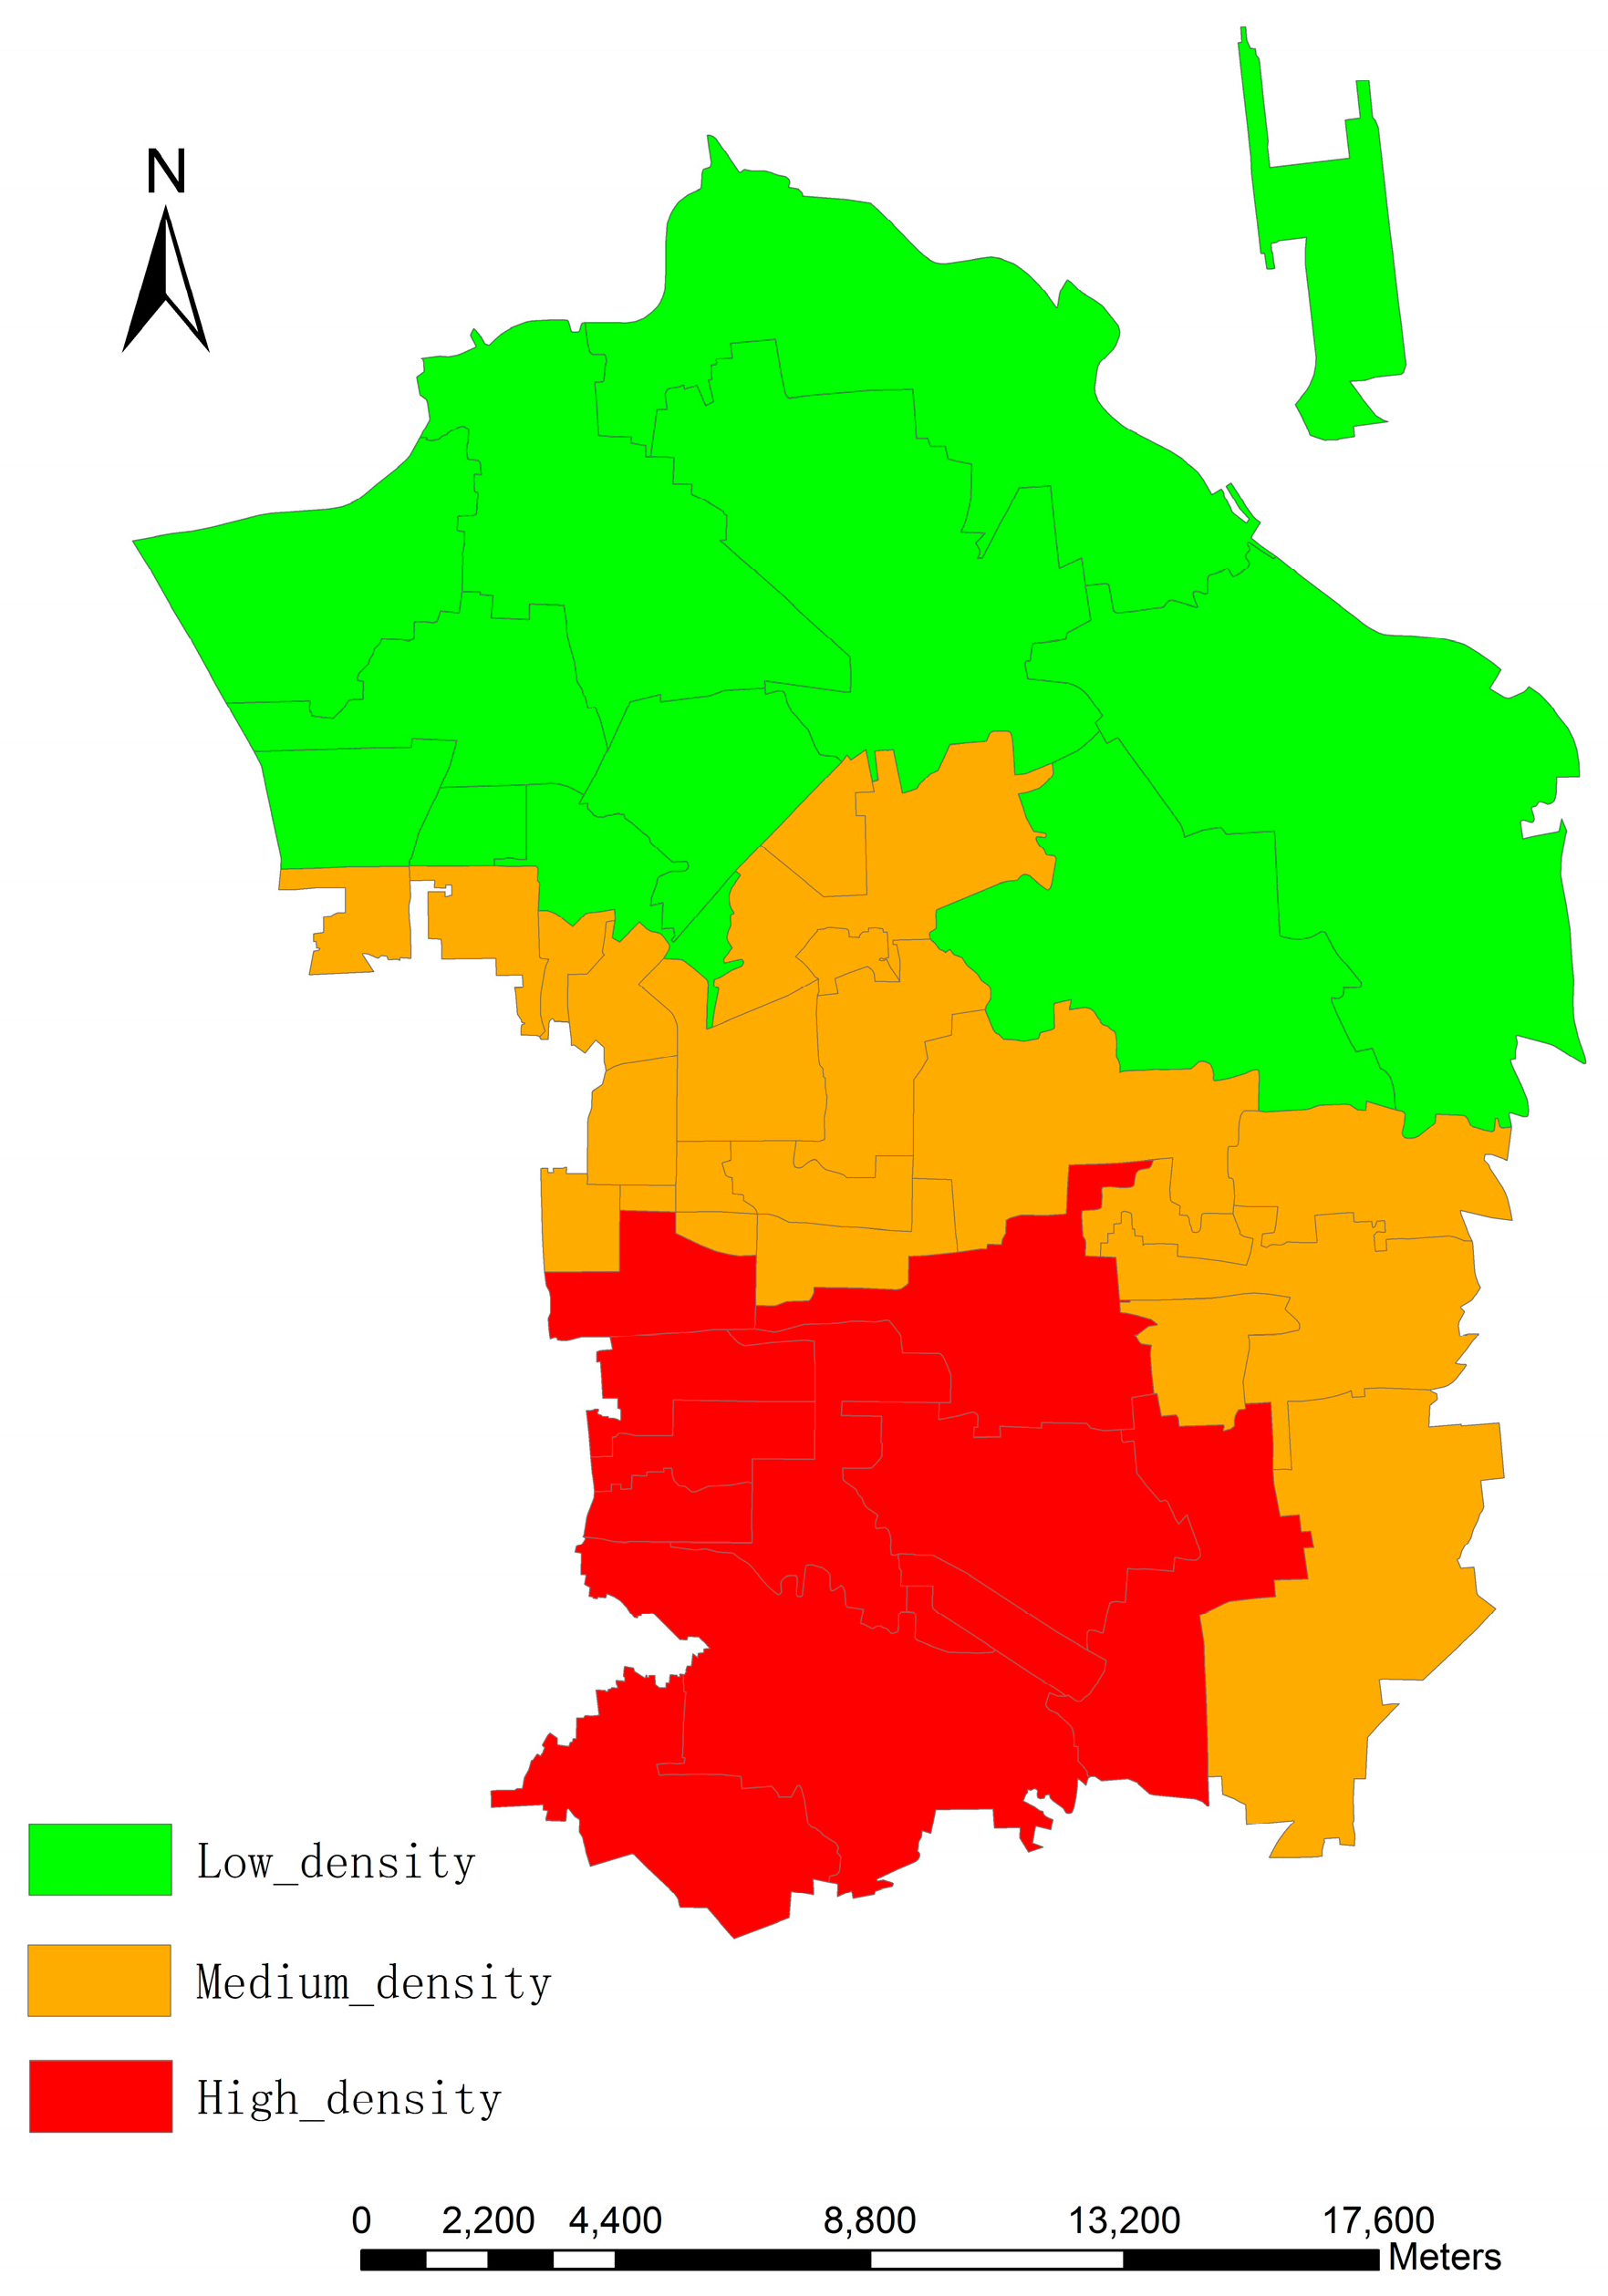
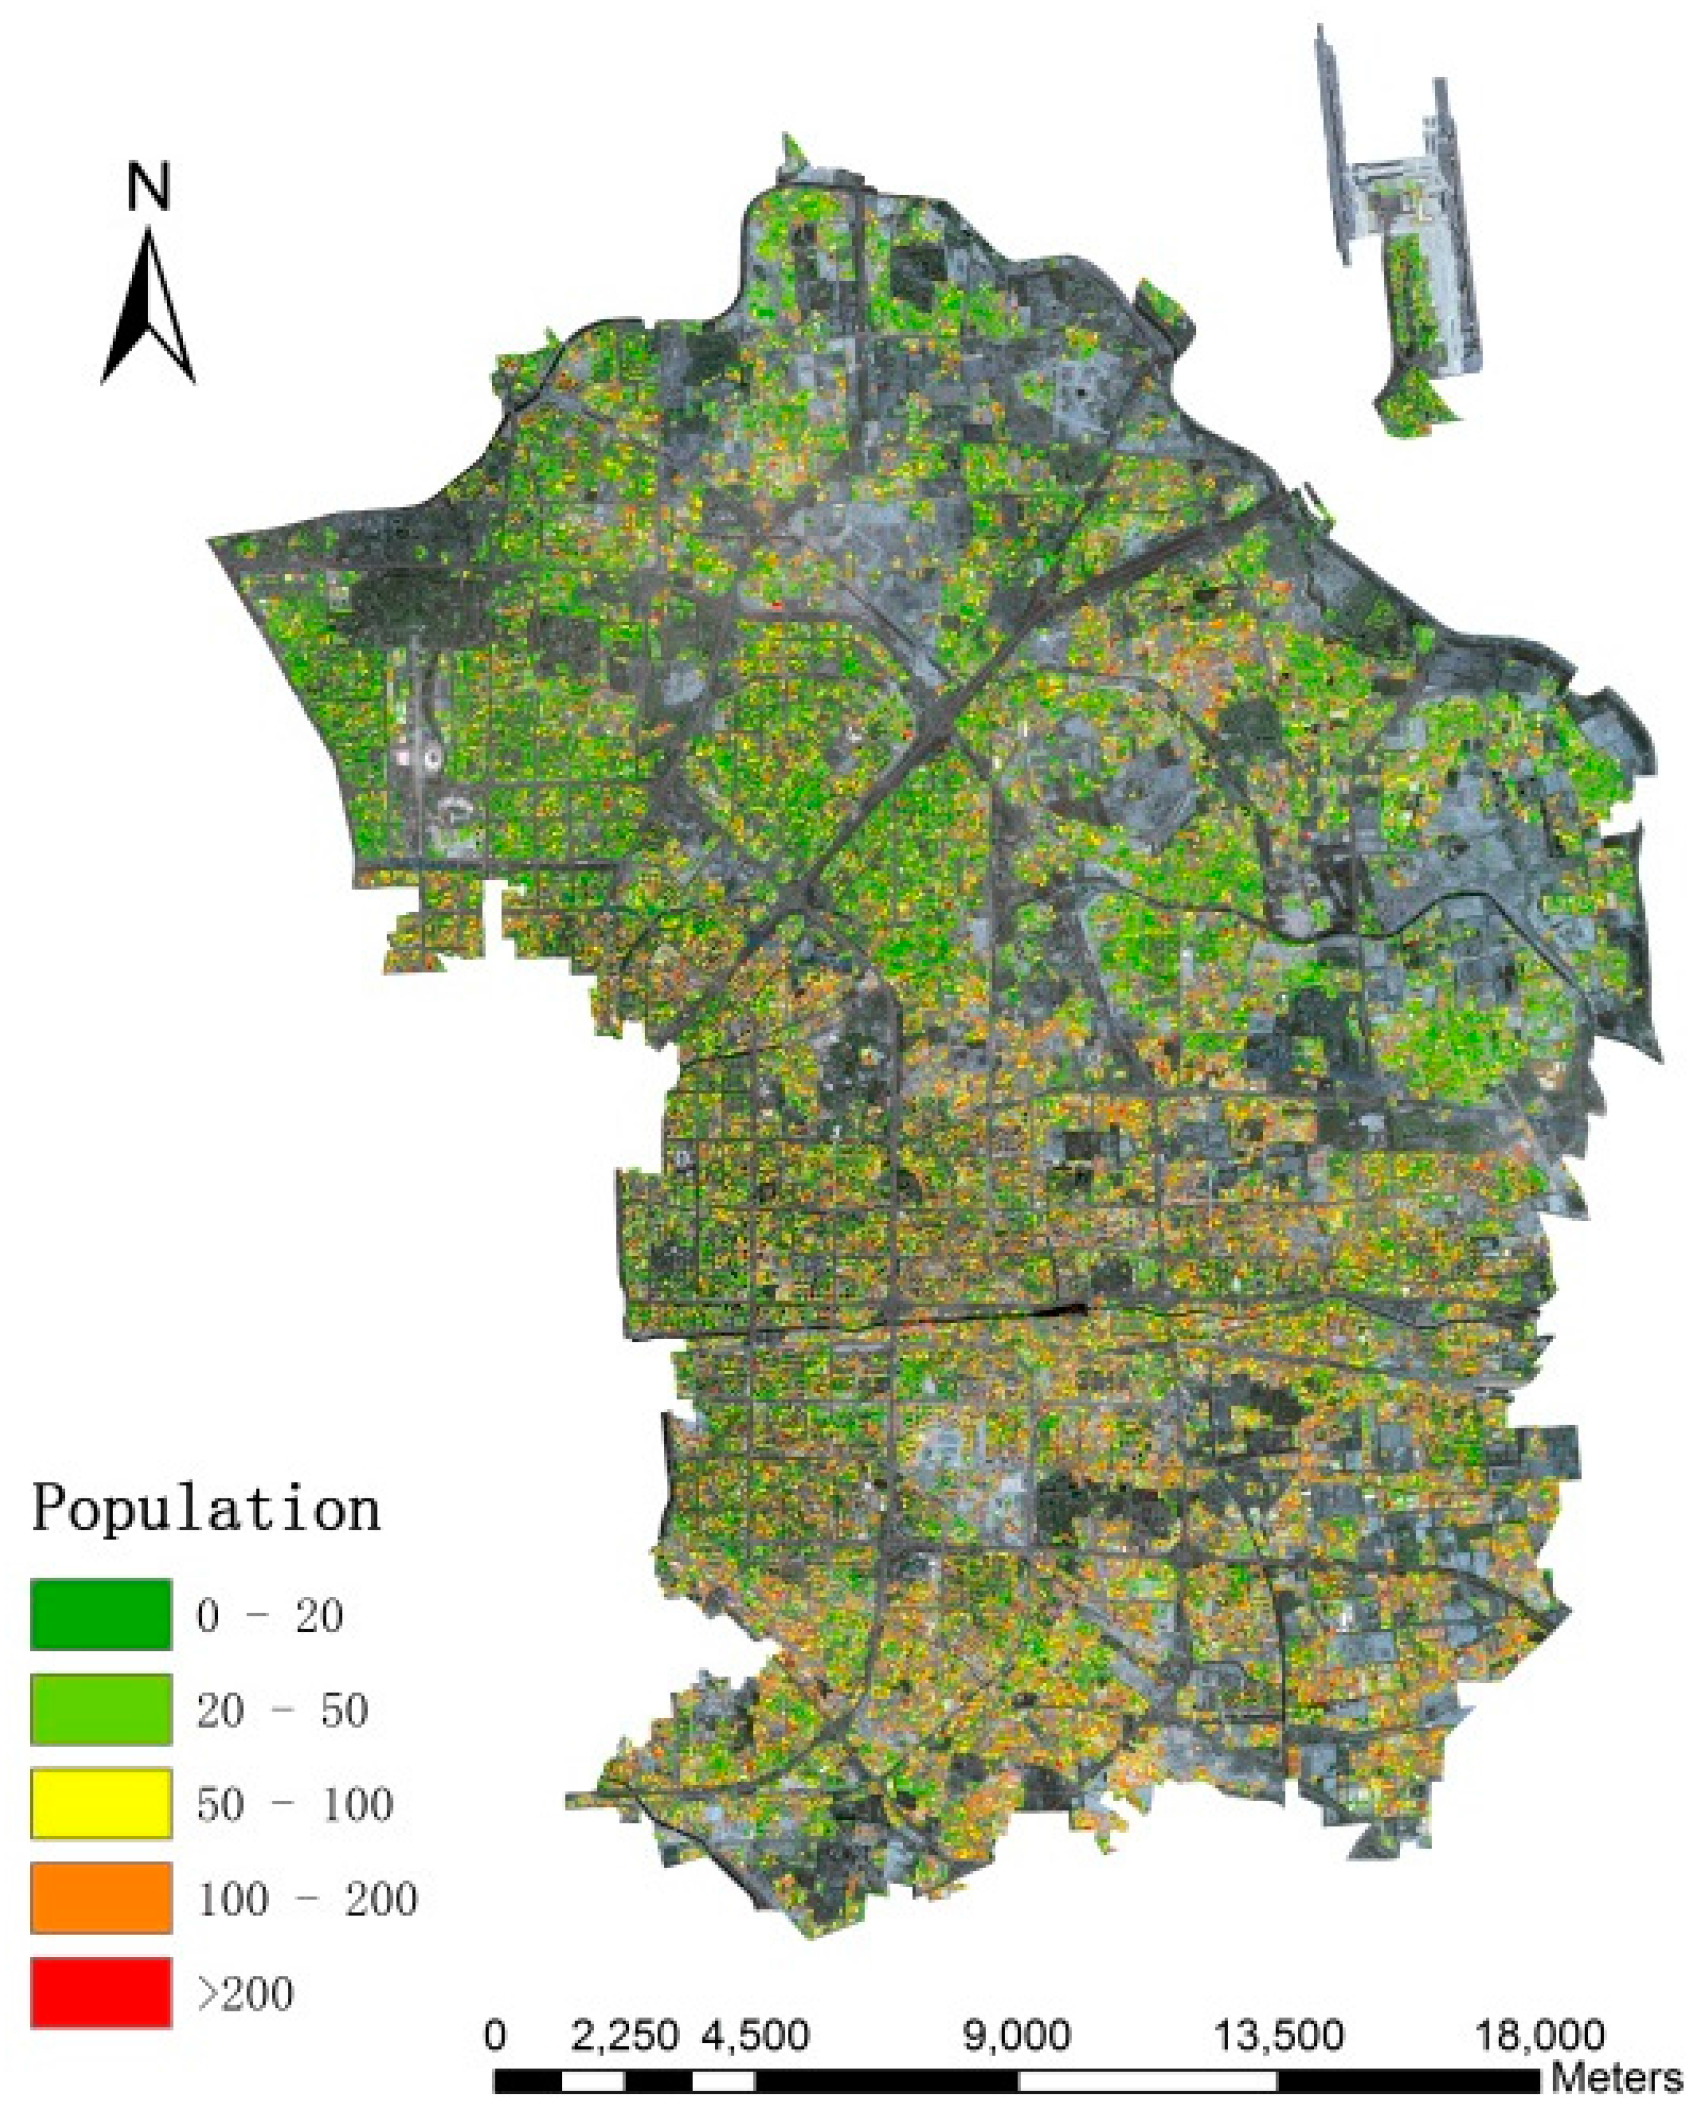
4.3. Fine-Scale Population Spatialization Results
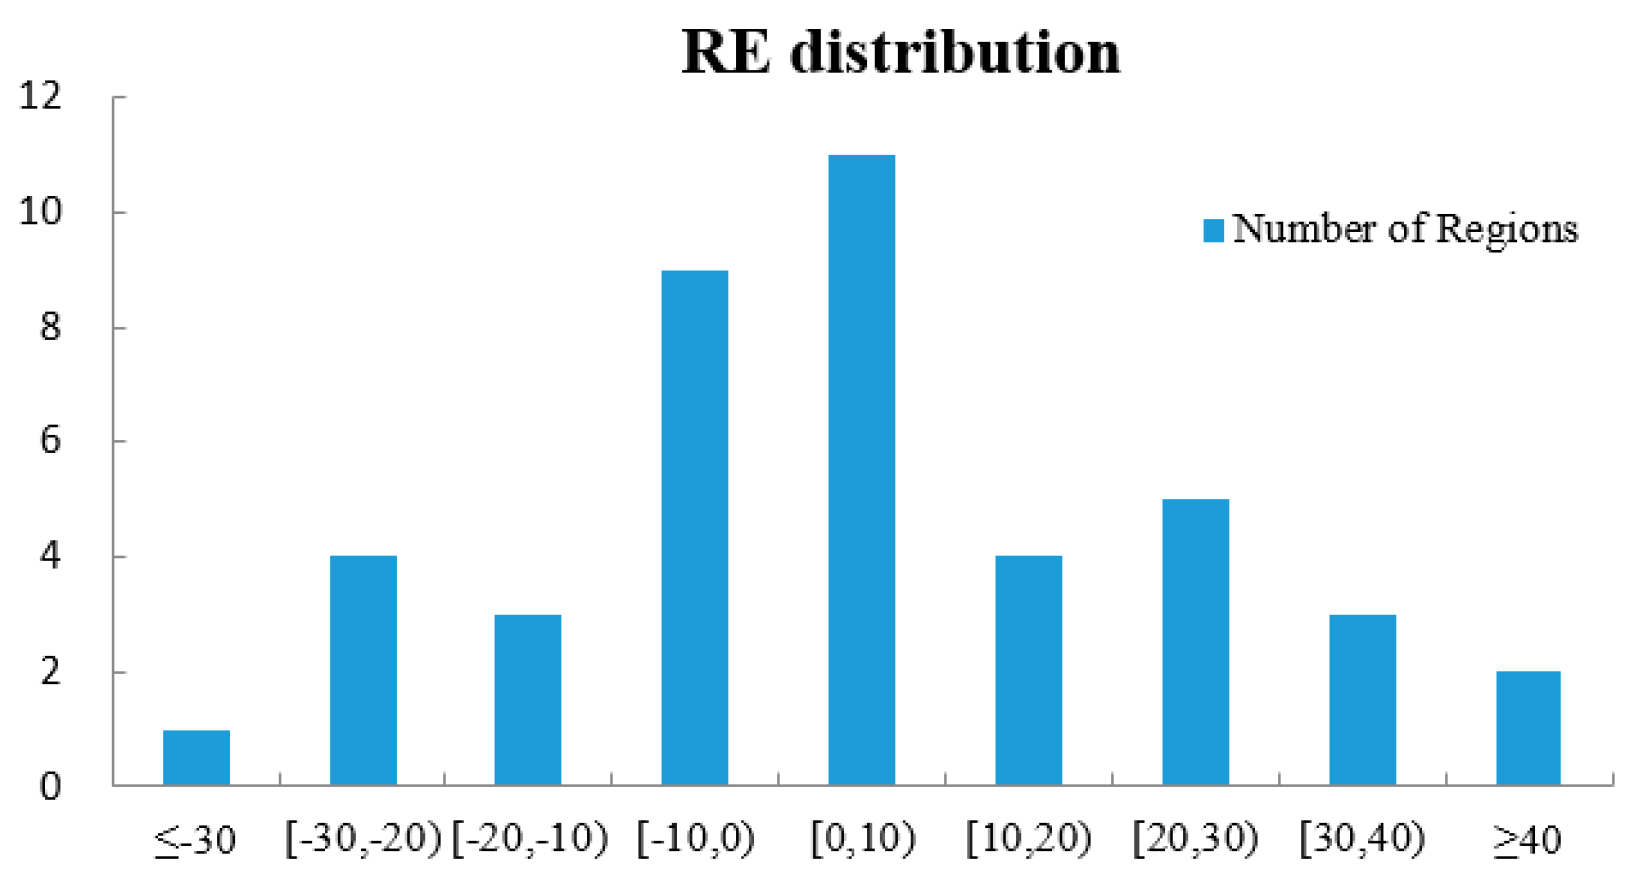
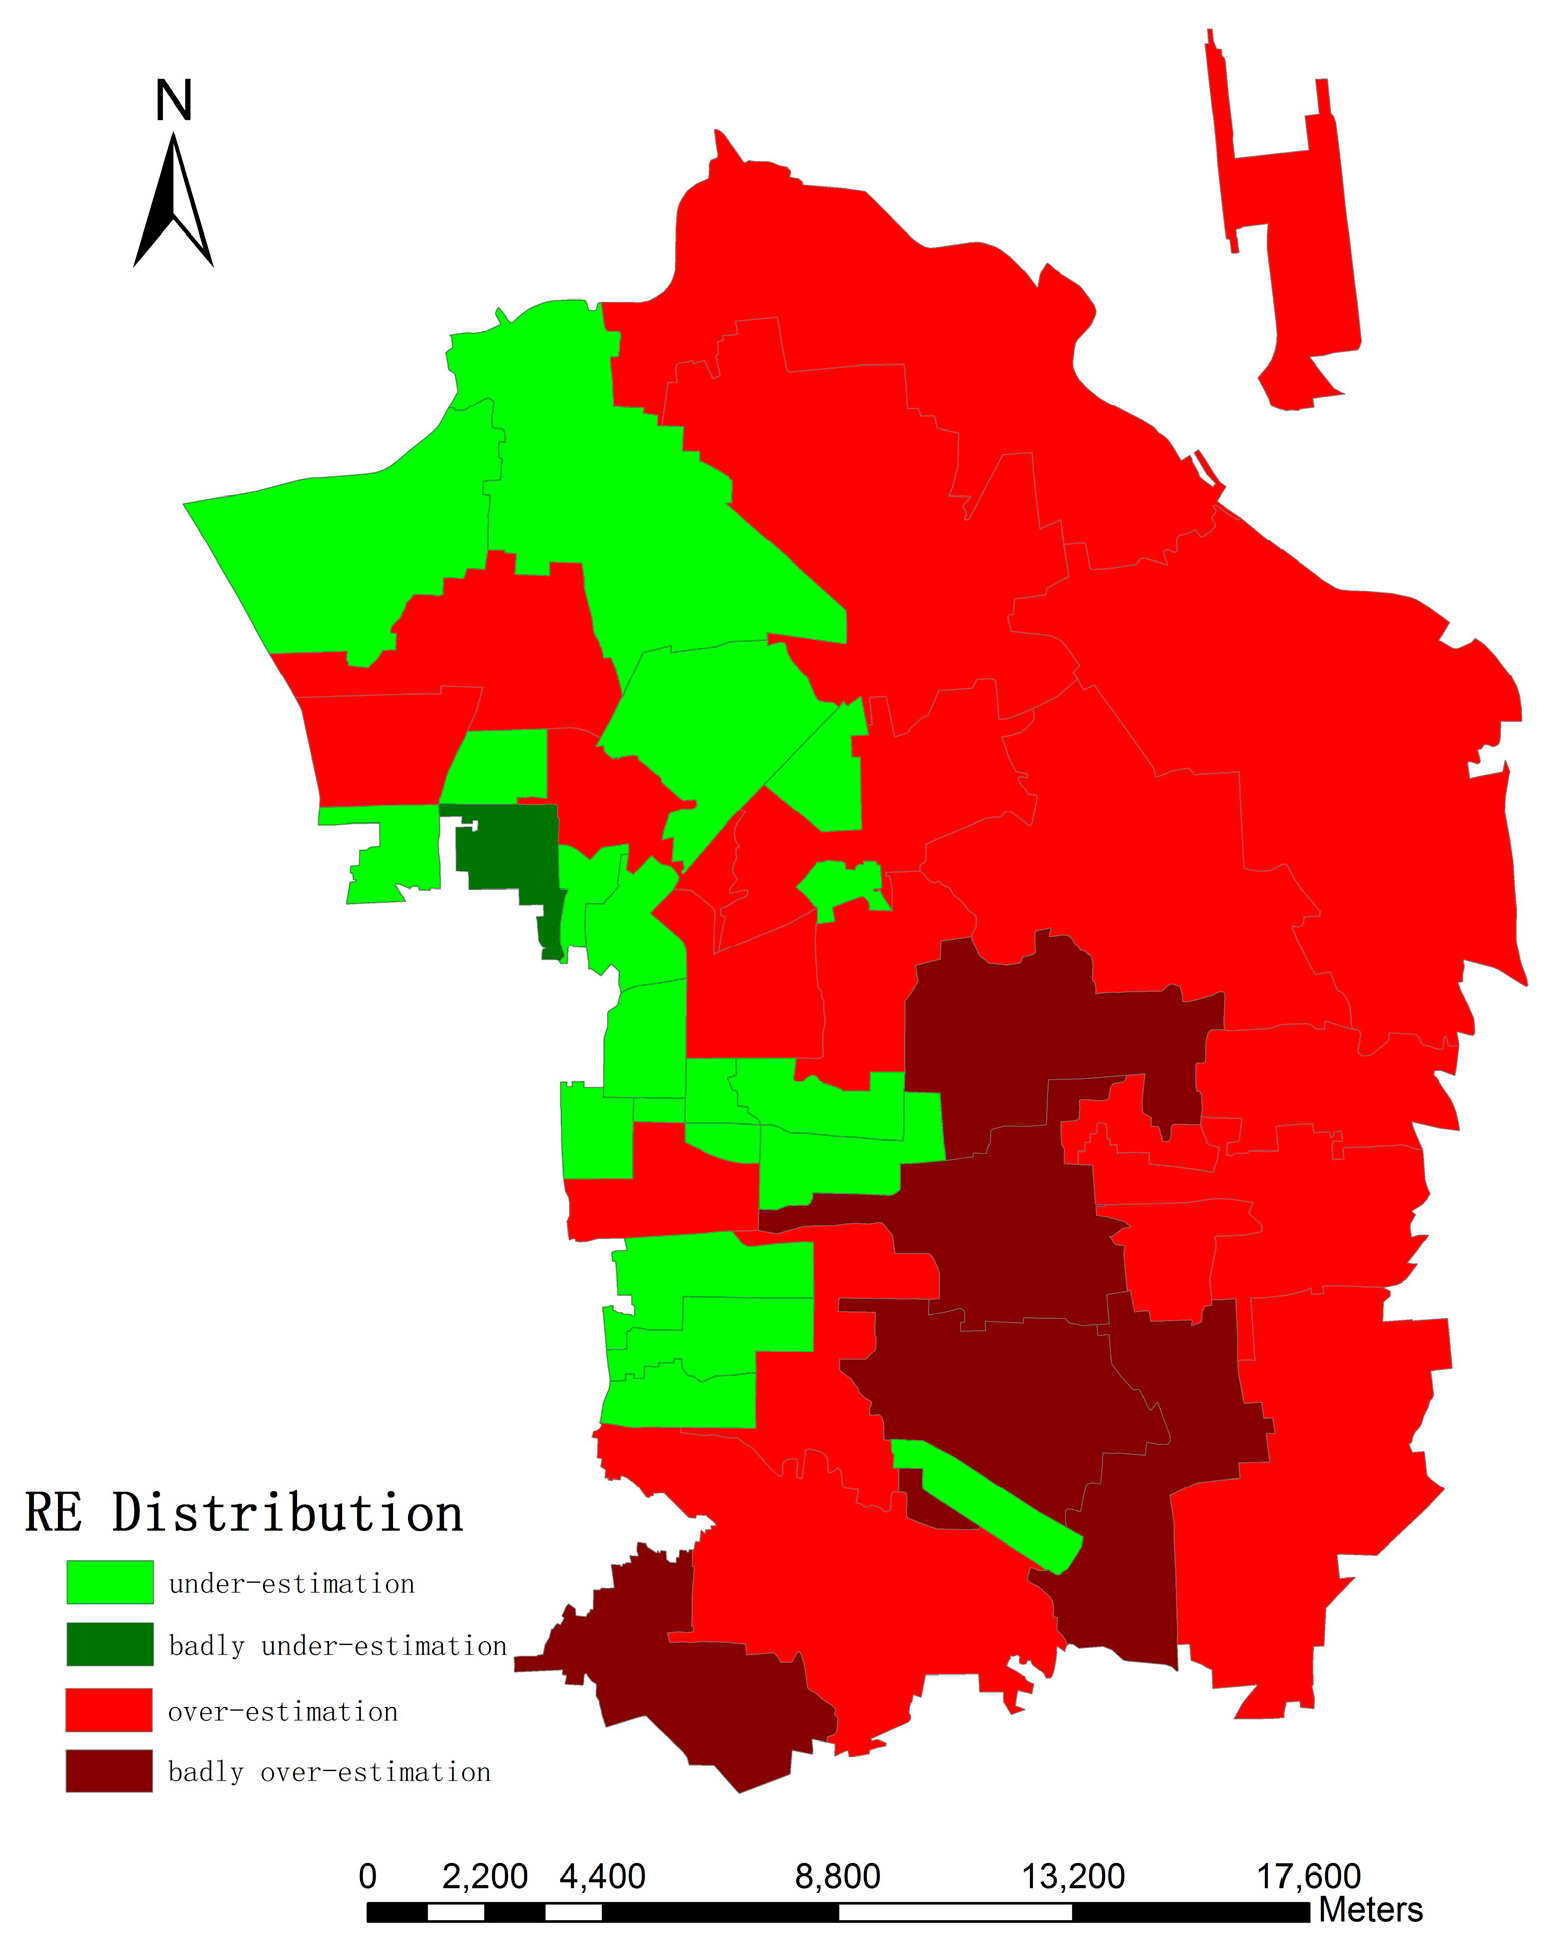
4.4. Accuracy Analysis
5. Discussion
6. Conclusions
Acknowledgments
Author Contributions
Conflicts of Interest
References
- Hoque, N. An evaluation of population estimates for counties and places in Texas for 2000. In Applied Demography in the 21st Century; Springer: Dordrecht, The Netherlands, 2008; pp. 125–148. [Google Scholar]
- Clark, C. Urban population densities. J. R. Stat. Soc. Ser. A (Gen.) 1951, 114, 490–496. [Google Scholar] [CrossRef]
- Newling, B.E. The spatial variation of urban population densities. Geogr. Rev. 1969, 59, 242–252. [Google Scholar] [CrossRef]
- Parr, J.B. A population-density approach to regional spatial structure. Urban Stud. 1985, 22, 289–303. [Google Scholar] [CrossRef]
- Tobler, W. Linear pycnophylactic reallocation comment on a paper by D. Martin. Int. J. Geogr. Inf. Sci. 1999, 13, 85–90. [Google Scholar] [CrossRef]
- Wu, S.-S.; Qiu, X.; Wang, L. Population estimation methods in GIS and remote sensing: A review. GISci. Remote Sens. 2005, 42, 80–96. [Google Scholar] [CrossRef]
- Tobler, W.R. Smooth pycnophylactic interpolation for geographical regions. J. Am. Stat. Assoc. 1979, 74, 519–530. [Google Scholar] [CrossRef] [PubMed]
- Lam, N.S.-N. Spatial interpolation methods: A review. Am. Cartogr. 1983, 10, 129–150. [Google Scholar] [CrossRef]
- Rase, W.-D. Volume-preserving interpolation of a smooth surface from polygon-related data. J. Geogr. Syst. 2001, 3, 199–213. [Google Scholar] [CrossRef]
- Wright, J.K. A method of mapping densities of population: With Cape Cod as an example. Geogr. Rev. 1936, 26, 103–110. [Google Scholar] [CrossRef]
- Langford, M.; Maguire, D.J.; Unwin, D.J. The areal interpolation problem: Estimating population using remote sensing in a GIS framework. In Handling Geographical Information: Methodology and Potential Applications; Longman Publishing Group: London, UK, 1991; pp. 55–77. [Google Scholar]
- Yuan, Y.; Smith, R.M.; Limp, W.F. Remodeling census population with spatial information from Landsat TM imagery. Comput. Environ. Urban Syst. 1997, 21, 245–258. [Google Scholar] [CrossRef]
- Eicher, C.L.; Brewer, C.A. Dasymetric mapping and areal interpolation: Implementation and evaluation. Cartogr. Geogr. Inf. Sci. 2001, 28, 125–138. [Google Scholar] [CrossRef]
- Mennis, J. Generating surface models of population using dasymetric mapping. Prof. Geogr. 2003, 55, 31–42. [Google Scholar]
- Zandbergen, P.A.; Ignizio, D.A. Comparison of dasymetric mapping techniques for small-area population estimates. Cartogr. Geogr. Inf. Sci. 2010, 37, 199–214. [Google Scholar] [CrossRef]
- Nagle, N.N.; Buttenfield, B.P.; Leyk, S.; Spielman, S. Dasymetric modeling and uncertainty. Ann. Assoc. Am. Geogr. 2014, 104, 80–95. [Google Scholar] [CrossRef] [PubMed]
- Stevens, F.R.; Gaughan, A.E.; Linard, C.; Tatem, A.J. Disaggregating census data for population mapping using random forests with remotely-sensed and ancillary data. PLoS ONE 2015, 10, e0107042. [Google Scholar] [CrossRef] [PubMed]
- Mennis, J. Dasymetric mapping for estimating population in small areas. Geogr. Compass 2009, 3, 727–745. [Google Scholar] [CrossRef]
- Kraus, S.P.; Senger, L.W.; Ryerson, J.M. Estimating population from photographically determined residential land use types. Remote Sens. Environ. 1974, 3, 35–42. [Google Scholar] [CrossRef]
- Tobler, W.R. Satellite confirmation of settlement size coefficients. Area 1969, 1, 30–34. [Google Scholar]
- Prosperie, L.; Eyton, R. The relationship between brightness values from a nighttime satellite image and Texas county population. Southwest. Geogr. 2000, 4, 16–29. [Google Scholar]
- Lo, C. Urban indicators of China from radiance-calibrated digital DMSP-OLS nighttime images. Ann. Assoc. Am. Geogr. 2002, 92, 225–240. [Google Scholar] [CrossRef]
- Zeng, C.; Zhou, Y.; Wang, S.; Yan, F.; Zhao, Q. Population spatialization in China based on night-time imagery and land use data. Int. J. Remote Sens. 2011, 32, 9599–9620. [Google Scholar] [CrossRef]
- Weber, C. Per-zone classification of urban land cover for urban population estimation. In Environmental Remote Sensing from Regional to Global Scales; Wiley: Hoboken, NJ, USA, 1994; pp. 142–148. [Google Scholar]
- Langford, M.; Harvey, J.T. The use of remotely sensed data for spatial disaggregation of published census population counts. In Proceedings of the IEEE/ISPRS Joint Workshop 2001 Remote Sensing and Data Fusion over Urban Areas, Rome, Italy, 8–9 November 2001.
- Lo, C.P. Zone-based estimation of population and housing units from satellite-generated land use/land cover maps. In Remotely Sensed Cities; CRC Press: Boca Raton, FL, USA, 2003; pp. 157–180. [Google Scholar]
- Porter, P.W. Population Distribution and Land Use in Liberia. Ph.D. Thesis, London School of Economics, London, UK, 1956. [Google Scholar]
- Collins, W.G.; El-Beik, A. Population census with the aid of aerial photographs: An experiment in the city of Leeds. Photogramm. Rec. 1971, 7, 16–26. [Google Scholar] [CrossRef]
- Lo, C.; Chan, H. Rural population estimation from aerial photographs [Hong Kong]. Photogramm. Eng. Remote Sens. 1980, 46, 337–345. [Google Scholar]
- Lo, C. A raster approach to population estimation using high-altitude aerial and space photographs. Remote Sens. Environ. 1989, 27, 59–71. [Google Scholar] [CrossRef]
- Iisaka, J.; Hegedus, E. Population estimation from Landsat imagery. Remote Sens. Environ. 1982, 12, 259–272. [Google Scholar] [CrossRef]
- Lo, C. Automated population and dwelling unit estimation from high-resolution satellite images: A GIS approach. Remote Sens. 1995, 16, 17–34. [Google Scholar] [CrossRef]
- Harvey, J. Estimating census district populations from satellite imagery: Some approaches and limitations. Int. J. Remote Sens. 2002, 23, 2071–2095. [Google Scholar] [CrossRef]
- Lu, D.; Weng, Q.; Li, G. Residential population estimation using a remote sensing derived impervious surface approach. Int. J. Remote Sens. 2006, 27, 3553–3570. [Google Scholar] [CrossRef]
- Li, G.; Weng, Q. Using Landsat ETM+ Imagery to Measure Population Density in Indianapolis, Indiana, USA. Photogram. Eng. Remote Sens. 2005, 71, 947–958. [Google Scholar] [CrossRef]
- Dobson, J.E.; Bright, E.A.; Coleman, P.R.; Durfee, R.C.; Worley, B.A. LandScan: A global population database for estimating populations at risk. Photogram. Eng. Remote Sens. 2000, 66, 849–857. [Google Scholar]
- Liu, X.; Clarke, K. Estimation of residential population using high resolution satellite imagery. In Proceedings of the 3rd Symposium on Remote Sensing of Urban Areas, Istanbul, Turkey, 11–13 June 2002.
- Balk, D.; Deichmann, U.; Yetman, G.; Pozzi, F.; Hay, S.; Nelson, A. Determining global population distribution: Methods, applications and data. Adv. Parasitol. 2006, 62, 119–156. [Google Scholar] [PubMed]
- Lu, J.; Guldmann, J.-M. Landscape ecology, land-use structure, and population density: Case study of the Columbus Metropolitan Area. Landsc. Urban Plan. 2012, 105, 74–85. [Google Scholar] [CrossRef]
- Li, G.; Weng, Q. Fine-scale population estimation: How Landsat ETM+ imagery can improve population distribution mapping. Can. J. Remote Sens. 2010, 36, 155–165. [Google Scholar] [CrossRef]
- Leyk, S.; Nagle, N.N.; Buttenfield, B.P. Maximum entropy dasymetric modeling for demographic small area estimation. Geogr. Anal. 2013, 45, 285–306. [Google Scholar] [CrossRef]
- Bakillah, M.; Liang, S.; Mobasheri, A.; Arsanjani, J.J.; Zipf, A. Fine-resolution population mapping using OpenStreetMap points-of-interest. Int. J. Geogr. Inf. Sci. 2014, 28, 1940–1963. [Google Scholar] [CrossRef]
- Qiu, F.; Sridharan, H.; Chun, Y. Spatial autoregressive model for population estimation at the census block level using LIDAR-derived building volume information. Cartogr. Geogr. Inf. Sci. 2010, 37, 239–257. [Google Scholar] [CrossRef]
- Silván-Cárdenas, J.L.; Wang, L.; Rogerson, P.; Wu, C.; Feng, T.; Kamphaus, B.D. Assessing fine-spatial-resolution remote sensing for small-area population estimation. Int. J. Remote Sens. 2010, 31, 5605–5634. [Google Scholar] [CrossRef]
- Wu, S.-S.; Wang, L.; Qiu, X. Incorporating GIS building data and census housing statistics for sub-block-level population estimation. Prof. Geogr. 2008, 60, 121–135. [Google Scholar] [CrossRef]
- Alahmadi, M.; Atkinson, P.M.; Martin, D. A comparison of small-area population estimation techniques using built-area and height data, Riyadh, Saudi Arabia. IEEE J. Sel. Top. Appl. Earth Observ. Remote Sens. 2016, 9, 1959–1969. [Google Scholar] [CrossRef]
- Xie, Y.; Weng, A.; Weng, Q. Population estimation of urban residential communities using remotely sensed morphologic data. IEEE Geosci. Remote Sens. Lett. 2015, 12, 1111–1115. [Google Scholar]
- Gamba, P.; Tupin, F.; Weng, Q. Introduction to the issue on remote sensing of human settlements: Status and challenges. IEEE J. Sel. Top. Appl. Earth Observ. Remote Sens. 2008, 1, 82–86. [Google Scholar] [CrossRef]
- Huang, X.; Zhang, L. A multidirectional and multiscale morphological index for automatic building extraction from multispectral geoeye-1 imagery. Photogram. Eng. Remote Sens. 2011, 77, 721–732. [Google Scholar] [CrossRef]
- Huang, X.; Zhang, L. Morphological building/shadow index for building extraction from high-resolution imagery over urban areas. IEEE J. Sel. Top. Appl. Earth Observ. Remote Sens. 2012, 5, 161–172. [Google Scholar] [CrossRef]
- Jin, X.; Davis, C.H. Automated building extraction from high-resolution satellite imagery in urban areas using structural, contextual, and spectral information. EURASIP J. Adv. Signal Process. 2005, 2005, 1–11. [Google Scholar] [CrossRef]
- Myint, S.W.; Gober, P.; Brazel, A.; Grossman-Clarke, S.; Weng, Q. Per-pixel vs. object-based classification of urban land cover extraction using high spatial resolution imagery. Remote Sens. Environ. 2011, 115, 1145–1161. [Google Scholar] [CrossRef]
- Langford, M. An evaluation of small area population estimation techniques using open access ancillary data. Geogr. Anal. 2013, 45, 324–344. [Google Scholar] [CrossRef]
- Pesaresi, M.; Gerhardinger, A.; Kayitakire, F. A robust built-up area presence index by anisotropic rotation-invariant textural measure. IEEE J. Sel. Top. Appl. Earth Observ. Remote Sens. 2008, 1, 180–192. [Google Scholar] [CrossRef]
- Azar, D.; Engstrom, R.; Graesser, J.; Comenetz, J. Generation of fine-scale population layers using multi-resolution satellite imagery and geospatial data. Remote Sens. Environ. 2013, 130, 219–232. [Google Scholar] [CrossRef]
- Haralick, R.M.; Shanmugam, K.; Dinstein, I.H. Textural features for image classification. IEEE Trans. Syst. Man Cybern. 1973, 3, 610–621. [Google Scholar] [CrossRef]
- Cheng, L.; Gong, J.; Li, M.; Liu, Y. 3D building model reconstruction from multi-view aerial imagery and lidar data. Photogram. Eng. Remote Sens. 2011, 77, 125–139. [Google Scholar] [CrossRef]
- Xiao, Y.; Lim, S.K.; Tan, T.S.; Tay, S.C. Feature extraction using very high resolution satellite imagery. In Proceedings of the 2004 IEEE International Geoscience and Remote Sensing Symposium (IGARSS’04), Anchorage, AK, USA, 20–24 September 2004.
- Kim, T.; Muller, J.-P.A. Automated building height estimation and object extraction from multiresolution imagery. In Proceedings of the SPIE’s 1995 Symposium on OE/Aerospace Sensing and Dual Use Photonics: International Society for Optics and Photonics, Orlando, FL, USA, 17–20 April 1995.
- Kim, T.; Muller, J.-P. A technique for 3D building reconstruction. Photogram. Eng. Remote Sens. 1998, 64, 923–930. [Google Scholar]
- Wang, J.; Wang, X. Information extraction of building height and density based on quick bird image in Kunming, China. In Proceedings of the IEEE Urban Remote Sensing Event 2009 Joint, Shanghai, China, 20–22 May 2009.
- Wang, X.; Yu, X.; Ling, F. Building heights estimation using ZY3 data—A case study of Shanghai, China. In Proceedings of the 2014 IEEE International Geoscience and Remote Sensing Symposium (IGARSS), Quebec City, QC, Canada, 13–18 July 2014.
- Lee, T.; Kim, T. Automatic building height extraction by volumetric shadow analysis of monoscopic imagery. Int. J. Remote Sens. 2013, 34, 5834–5850. [Google Scholar] [CrossRef]
- Turlapaty, A.; Gokaraju, B.; Du, Q.; Younan, N.H.; Aanstoos, J.V. A hybrid approach for building extraction from spaceborne multi-angular optical imagery. IEEE J. Sel. Top. Appl. Earth Observ. Remote Sens. 2012, 5, 89–100. [Google Scholar] [CrossRef]
- Zhuang, D.-F.; Liu, M.-L.; Deng, X.-Z. Spatialization model of population based on dataset of land use and land cover change in China. Chin. Geogr. Sci. 2002, 12, 114–119. [Google Scholar] [CrossRef]
- Sarabandi, P.; Yamazaki, F.; Matsuoka, M.; Kiremidjian, A. Shadow detection and radiometric restoration in satellite high resolution images. IGARSS 2004, 6, 3744–3747. [Google Scholar]
- Cai, D.; Li, M.; Bao, Z.; Chen, Z.; Wei, W.; Zhang, H. Study on shadow detection method on high resolution remote sensing image based on HIS space transformation and NDVI index. In Proceedings of the 2010 18th International Conference on Geoinformatics, Beijing, China, 18–20 June 2010.
- Huang, J.; Xie, W.; Tang, L. Detection of and compensation for shadows in colored urban aerial images. In Proceedings of the IEEE 2004 Fifth World Congress on Intelligent Control and Automation (2004 WCICA), Hangzhou, China, 15–19 June 2004.
- Kurita, T.; Otsu, N.; Abdelmalek, N. Maximum likelihood thresholding based on population mixture models. Pattern Recognit. 1992, 25, 1231–1240. [Google Scholar] [CrossRef]
- Batista e Silva, F.; Gallego, J.; Lavalle, C. A high-resolution population grid map for Europe. J. Maps 2013, 9, 16–28. [Google Scholar] [CrossRef]
- Al-Ahmadia, K.; Heppenstallb, A.; Seeb, L.; Hoggb, J. Modeling urban growth dynamics using cellular automata and GIS. In Proceedings of the Third National GIS Symposium in Saudi Arabia, Khobar, Saudi Arabia, 7–9 April 2008.


| Camera Mode | Panchromatic (pan) |
|---|---|
| Multispectral (mux) | |
| Spatial resolution | pan: 2.1 m, mux: 5.8 m |
| Wavelength (nm) | pan: 450–800 |
| mux: blue: 450–520, green: 520–590, red: 630–690, NIR: 770–890 | |
| Image width (km) | pan: 50 × 50, mux: 52 × 52 |
| Cloud-cover degree | 0% |
| Orbit number | 18,862 |
| Procedure | PanTex | MBI |
|---|---|---|
| Multiresolution segmentation | scale: 25 | |
| shape: 0.6 | ||
| compactness: 0.4 | ||
| Classification | PanTex ≥ 1.45 | MBI ≥ 6 |
| brightness ≥ 136 | ||
| NDVI < 0.1 | ||
| 1.5 ≤ length/width ratio ≤ 4.5 | ||
| rectangular fit ≥ 0.6 | ||
| shape index ≤ 2.6 | ||
| Post-processing | reference: object | |
| mode: growing | ||
| value: 0.5 | ||
| box size in X and Y: 5 | ||
| User Class/Sample | Buildings | Non-Buildings | Sum |
|---|---|---|---|
| Confusion Matrix | |||
| Buildings | 158 | 57 | 215 |
| Non-buildings | 29 | 330 | 359 |
| Sum | 187 | 387 | |
| Accuracy | |||
| Producer | 0.85 | 0.85 | |
| User | 0.73 | 0.92 | |
| Kappa per class | 0.75 | 0.86 | |
| Totals | |||
| Overall Accuracy | 0.85 | ||
| Kappa | 0.66 | ||
| User Class/Sample | Buildings | Non-Buildings | Sum |
|---|---|---|---|
| Confusion Matrix | |||
| Buildings | 86 | 55 | 141 |
| Non-buildings | 100 | 333 | 433 |
| Sum | 186 | 388 | |
| Accuracy | |||
| Producer | 0.46 | 0.86 | |
| User | 0.61 | 0.77 | |
| Kappa per class | 0.29 | 0.43 | |
| Totals | |||
| Overall accuracy | 0.73 | ||
| Kappa | 0.34 | ||
| Absolute Error (m) | CIIT | Percentage (%) | MSI | Percentage (%) |
|---|---|---|---|---|
| ≥12.5 | 25 | 4.36 | 7 | 1.22 |
| [10.0, 12.5) | 58 | 10.10 | 38 | 6.62 |
| [7.5, 10.0) | 66 | 11.50 | 52 | 9.06 |
| [5.0, 7.5) | 93 | 16.20 | 101 | 17.60 |
| [2.5, 5.0) | 124 | 21.60 | 145 | 25.26 |
| [0, 2.5) | 208 | 36.24 | 231 | 40.24 |
| Total | 574 | 100 | 574 | 100 |
| No. | Region Name | Population (Statistics) | Dwelling Objects | Population (Model) | RE (%) |
|---|---|---|---|---|---|
| 1 | Anzhen Sub-district | 48,467 | 711 | 46,031.227 | −5.03 |
| 2 | Olympic Village Sub-district | 57,509 | 1771 | 55,101.244 | −4.19 |
| 3 | Changying Sub-district | 24,770 | 1240 | 32,120.220 | +29.67 |
| 4 | Chaowai Sub-district | 43,162 | 496 | 39,569.780 | −8.32 |
| 5 | Chaoyangbalizhuang Sub-district | 85,897 | 1049 | 61,229.257 | −28.72 |
| 6 | Cuigezhuang Sub-district | 24,448 | 4691 | 30,771.512 | +25.87 |
| 7 | Datun Sub-district | 71,615 | 2345 | 77,291.336 | +7.93 |
| 8 | Dongba Village | 37,907 | 4732 | 38,612.750 | +1.86 |
| 9 | Dongfeng Sub-district | 30,926 | 1187 | 37,596.391 | +21.57 |
| 10 | Dougezhuang Village | 12,719 | 2178 | 18,841.690 | +48.14 |
| 11 | Fatou Sub-district | 31,964 | 735 | 29,591.992 | −7.42 |
| 12 | Gaobeidian District | 48,234 | 2969 | 71,468.861 | +48.17 |
| 13 | Guanzhuang Sub-district | 57,269 | 2853 | 73,120.667 | +27.68 |
| 14 | Hepingjie Sub-district | 98,710 | 881 | 59,449.281 | −39.77 |
| 15 | Heizhuanghu Village | 49,681 | 3806 | 51,199.561 | +3.06 |
| 16 | Hujialou Sub-district | 64,264 | 416 | 49,410.197 | −23.11 |
| 17 | Jianwai Sub-district | 42,302 | 1265 | 54,101.568 | +27.89 |
| 18 | Jiangtai Sub-district | 26,119 | 2200 | 28,267.330 | +8.23 |
| 19 | Jianzhan Sub-district | 59,144 | 6891 | 60,010.514 | +1.47 |
| 20 | Jingsong Sub-district | 73,200 | 1003 | 59,991.594 | −18.04 |
| 21 | Jiuxianqiao Sub-district | 69,146 | 1297 | 70,233.239 | +1.57 |
| 22 | Laiguangying Sub-district | 47,269 | 3889 | 51,471.291 | +8.89 |
| 23 | Liulitun Sub-district | 62,168 | 891 | 48,996.313 | −21.19 |
| 24 | Maizidian Sub-district | 21,674 | 954 | 24,664.127 | +13.80 |
| 25 | Nanmofang Sub-district | 59,499 | 2014 | 70,155.476 | +17.91 |
| 26 | Panjiayuan Sub-district | 81,055 | 762 | 59,981.261 | −26.00 |
| 27 | Pingfang Sub-district | 33,492 | 2673 | 46,781.497 | +39.08 |
| 28 | Sanjianfang Sub-district | 71,011 | 1443 | 78,501.201 | +10.55 |
| 29 | Sanlitun Sub-district | 38,285 | 728 | 36,799.497 | −3.88 |
| 30 | Shibalidian Sub-district | 38,950 | 6658 | 41,719.462 | +7.11 |
| 31 | Beijing Airport Sub-district | 24,735 | 832 | 25,184.881 | +1.82 |
| 32 | Shuangjing Sub-district | 72,360 | 1063 | 66,849.199 | −7.62 |
| 33 | Sunhe Sub-district | 21,979 | 3760 | 26,109.591 | +18.79 |
| 34 | Taiyanggong Sub-district | 45,381 | 1147 | 48,487.497 | +6.85 |
| 35 | Tuanjiehu Sub-district | 36,869 | 264 | 33,996.495 | −7.79 |
| 36 | Wangsiying Village | 19,517 | 2394 | 27,106.487 | +38.89 |
| 37 | Wangjing Sub-district | 82,815 | 2321 | 82,599.481 | −0.26 |
| 38 | Xiangheyuan Sub-district | 34,636 | 350 | 32,841.498 | −5.18 |
| 39 | Xiaoguan Sub-district | 51,401 | 663 | 45,998.869 | −10.51 |
| 40 | Xiaohongmen Sub-district | 29,112 | 2100 | 40,009.487 | +37.43 |
| 41 | Yayuncun Sub-district | 48,858 | 858 | 53,299.819 | +9.09 |
| 42 | Zuojiazhuang Sub-district | 67,016 | 799 | 59,996.794 | −10.47 |
| Total | 2,045,535 | 81,279 | 2,045,560.434 | - |
© 2016 by the authors; licensee MDPI, Basel, Switzerland. This article is an open access article distributed under the terms and conditions of the Creative Commons Attribution (CC-BY) license (http://creativecommons.org/licenses/by/4.0/).
Share and Cite
Wang, S.; Tian, Y.; Zhou, Y.; Liu, W.; Lin, C. Fine-Scale Population Estimation by 3D Reconstruction of Urban Residential Buildings. Sensors 2016, 16, 1755. https://doi.org/10.3390/s16101755
Wang S, Tian Y, Zhou Y, Liu W, Lin C. Fine-Scale Population Estimation by 3D Reconstruction of Urban Residential Buildings. Sensors. 2016; 16(10):1755. https://doi.org/10.3390/s16101755
Chicago/Turabian StyleWang, Shixin, Ye Tian, Yi Zhou, Wenliang Liu, and Chenxi Lin. 2016. "Fine-Scale Population Estimation by 3D Reconstruction of Urban Residential Buildings" Sensors 16, no. 10: 1755. https://doi.org/10.3390/s16101755
APA StyleWang, S., Tian, Y., Zhou, Y., Liu, W., & Lin, C. (2016). Fine-Scale Population Estimation by 3D Reconstruction of Urban Residential Buildings. Sensors, 16(10), 1755. https://doi.org/10.3390/s16101755