
Multi-Sensor Data Fusion Using a Relevance Vector Machine Based on an Ant Colony for Gearbox Fault Detection


Abstract
:1. Introduction
2. Theoretical Background
2.1. RVM Classifier
2.2. RVM Parameter Optimization by ACO

3. Features Extraction
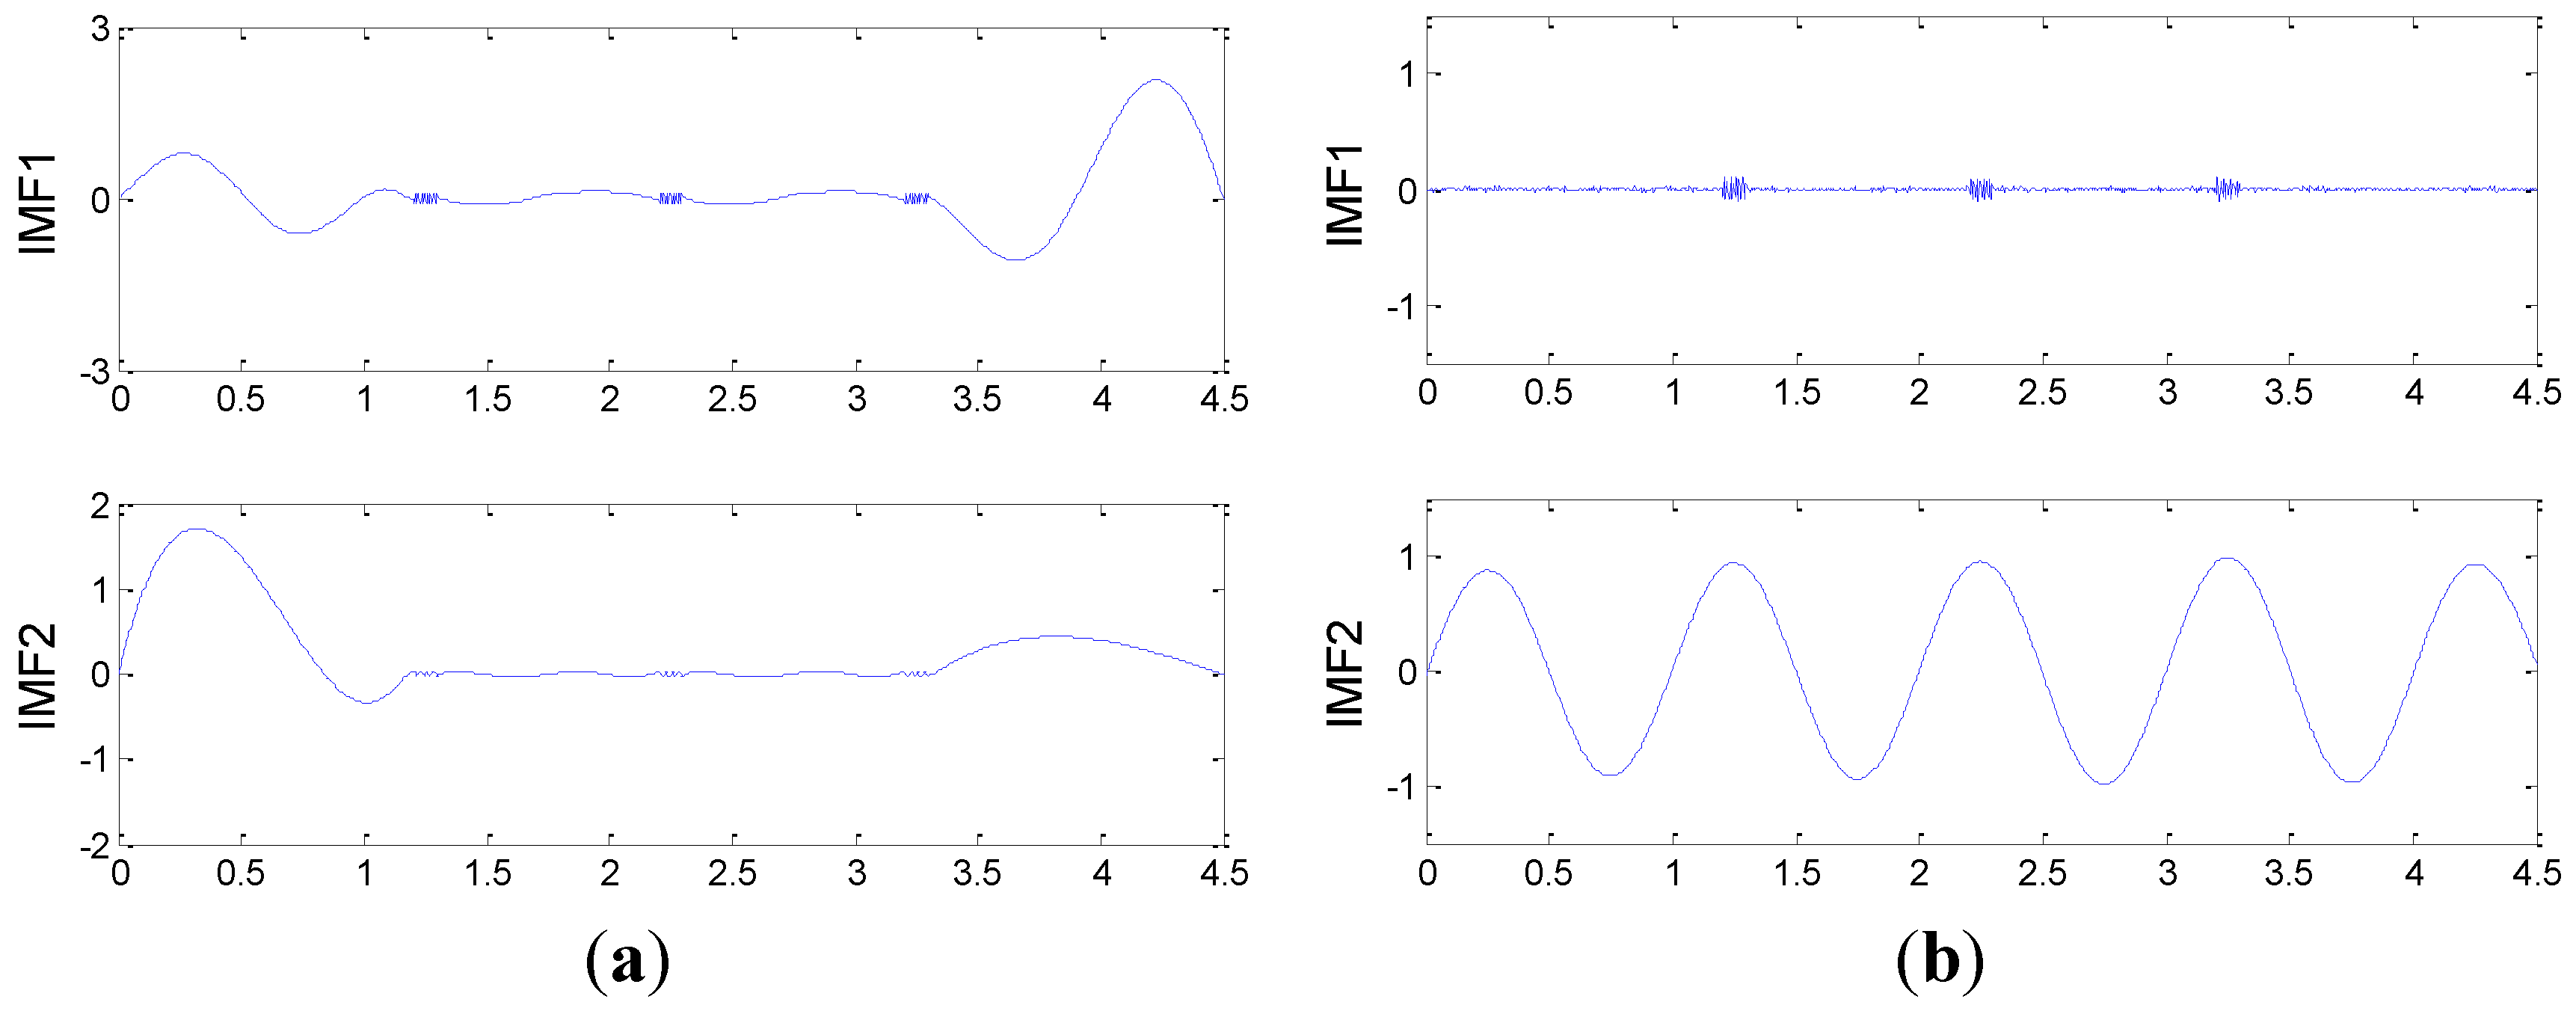
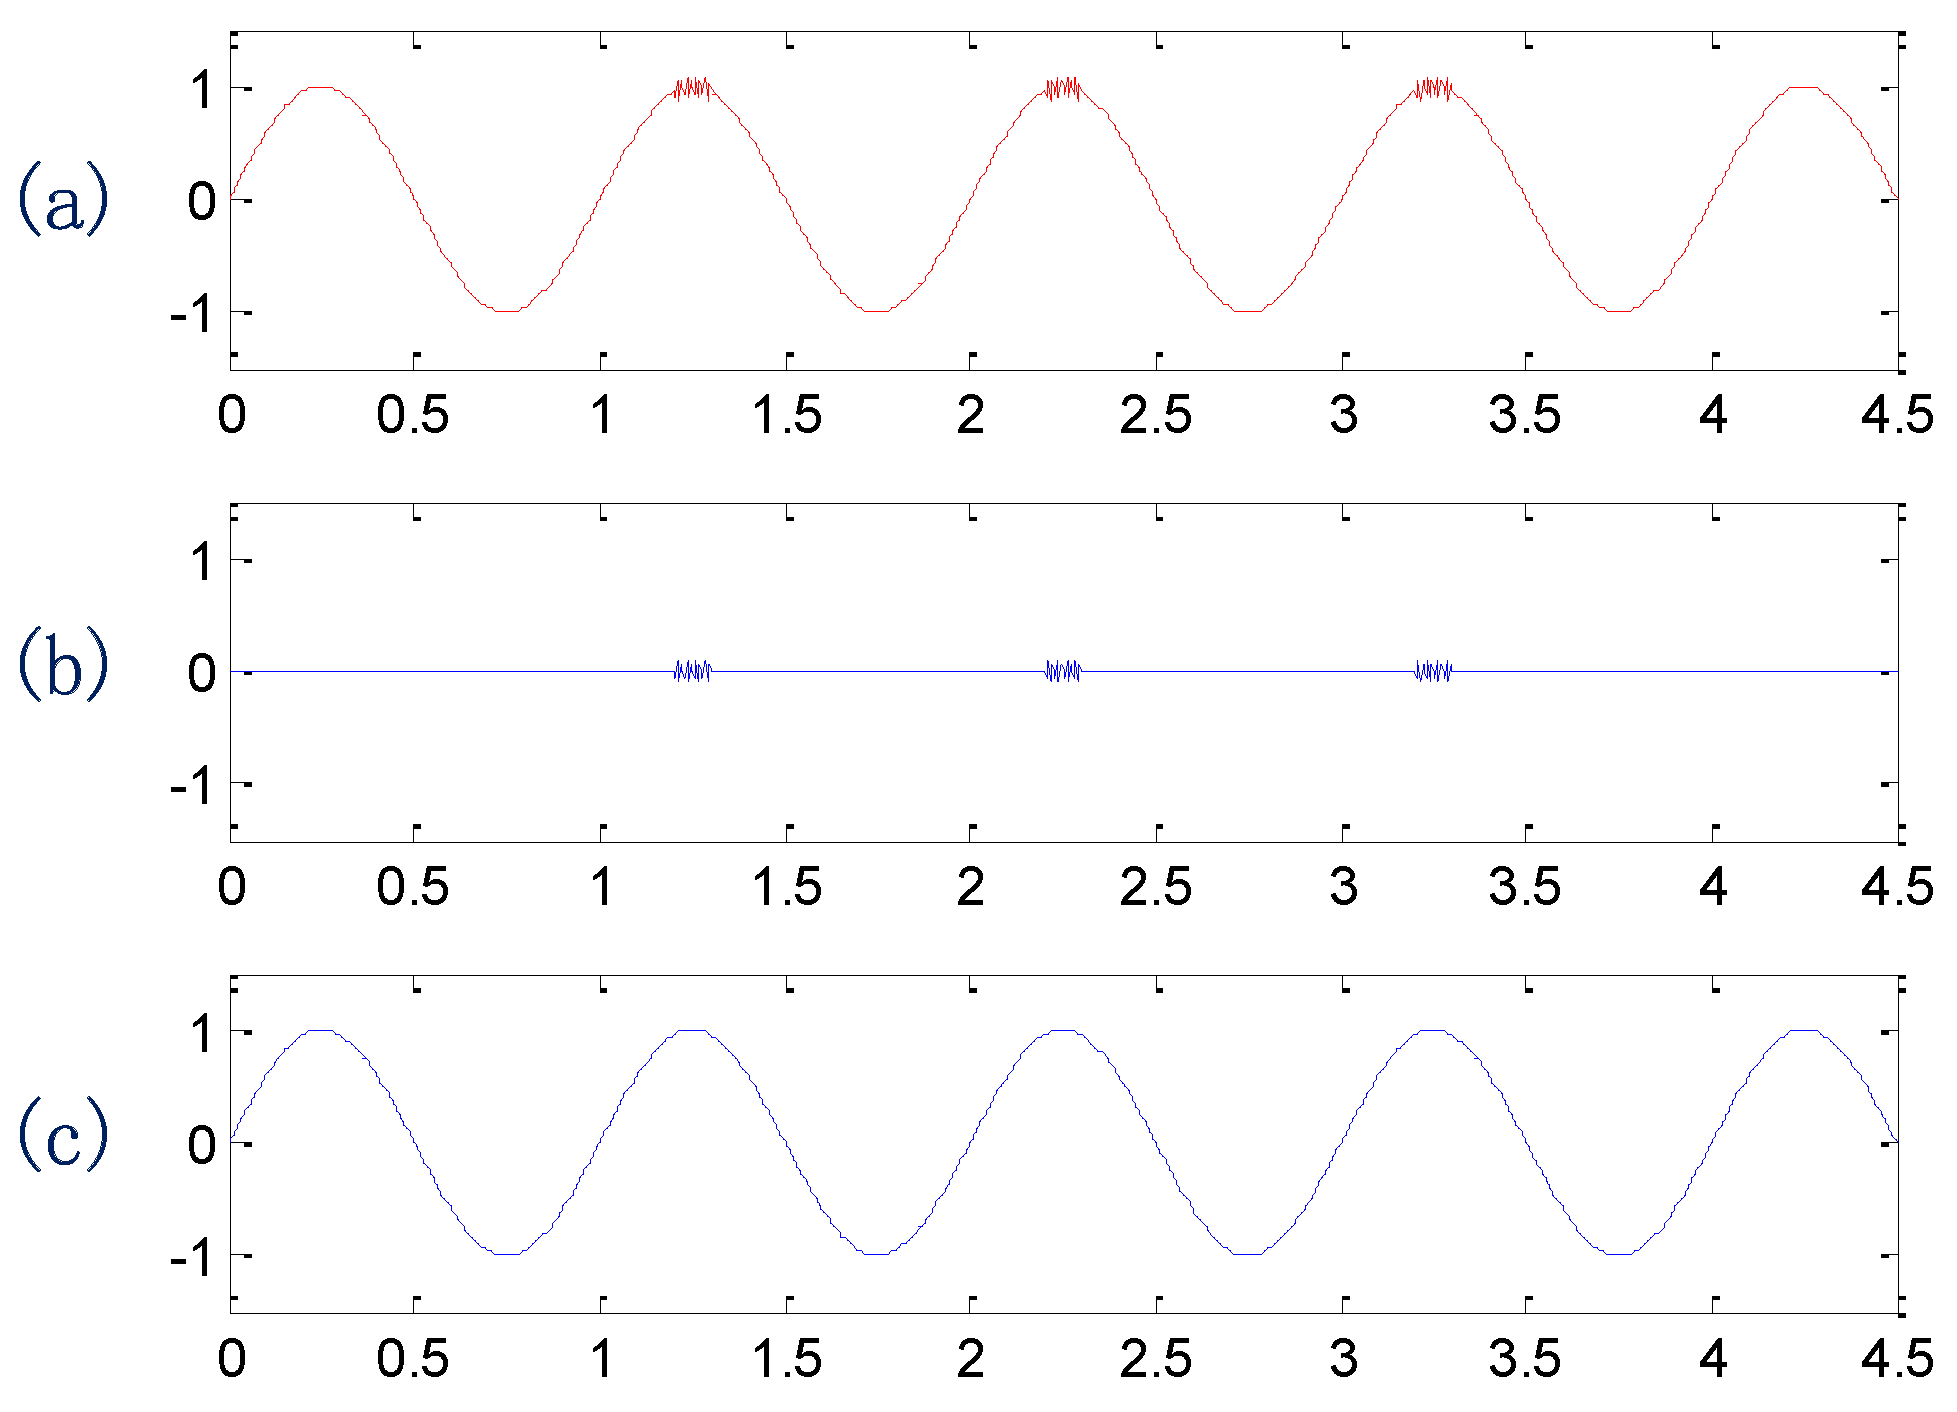
3.1. Signal Preprocessing Based on EEMD

3.2. Statistical Feature Extraction Based on DET
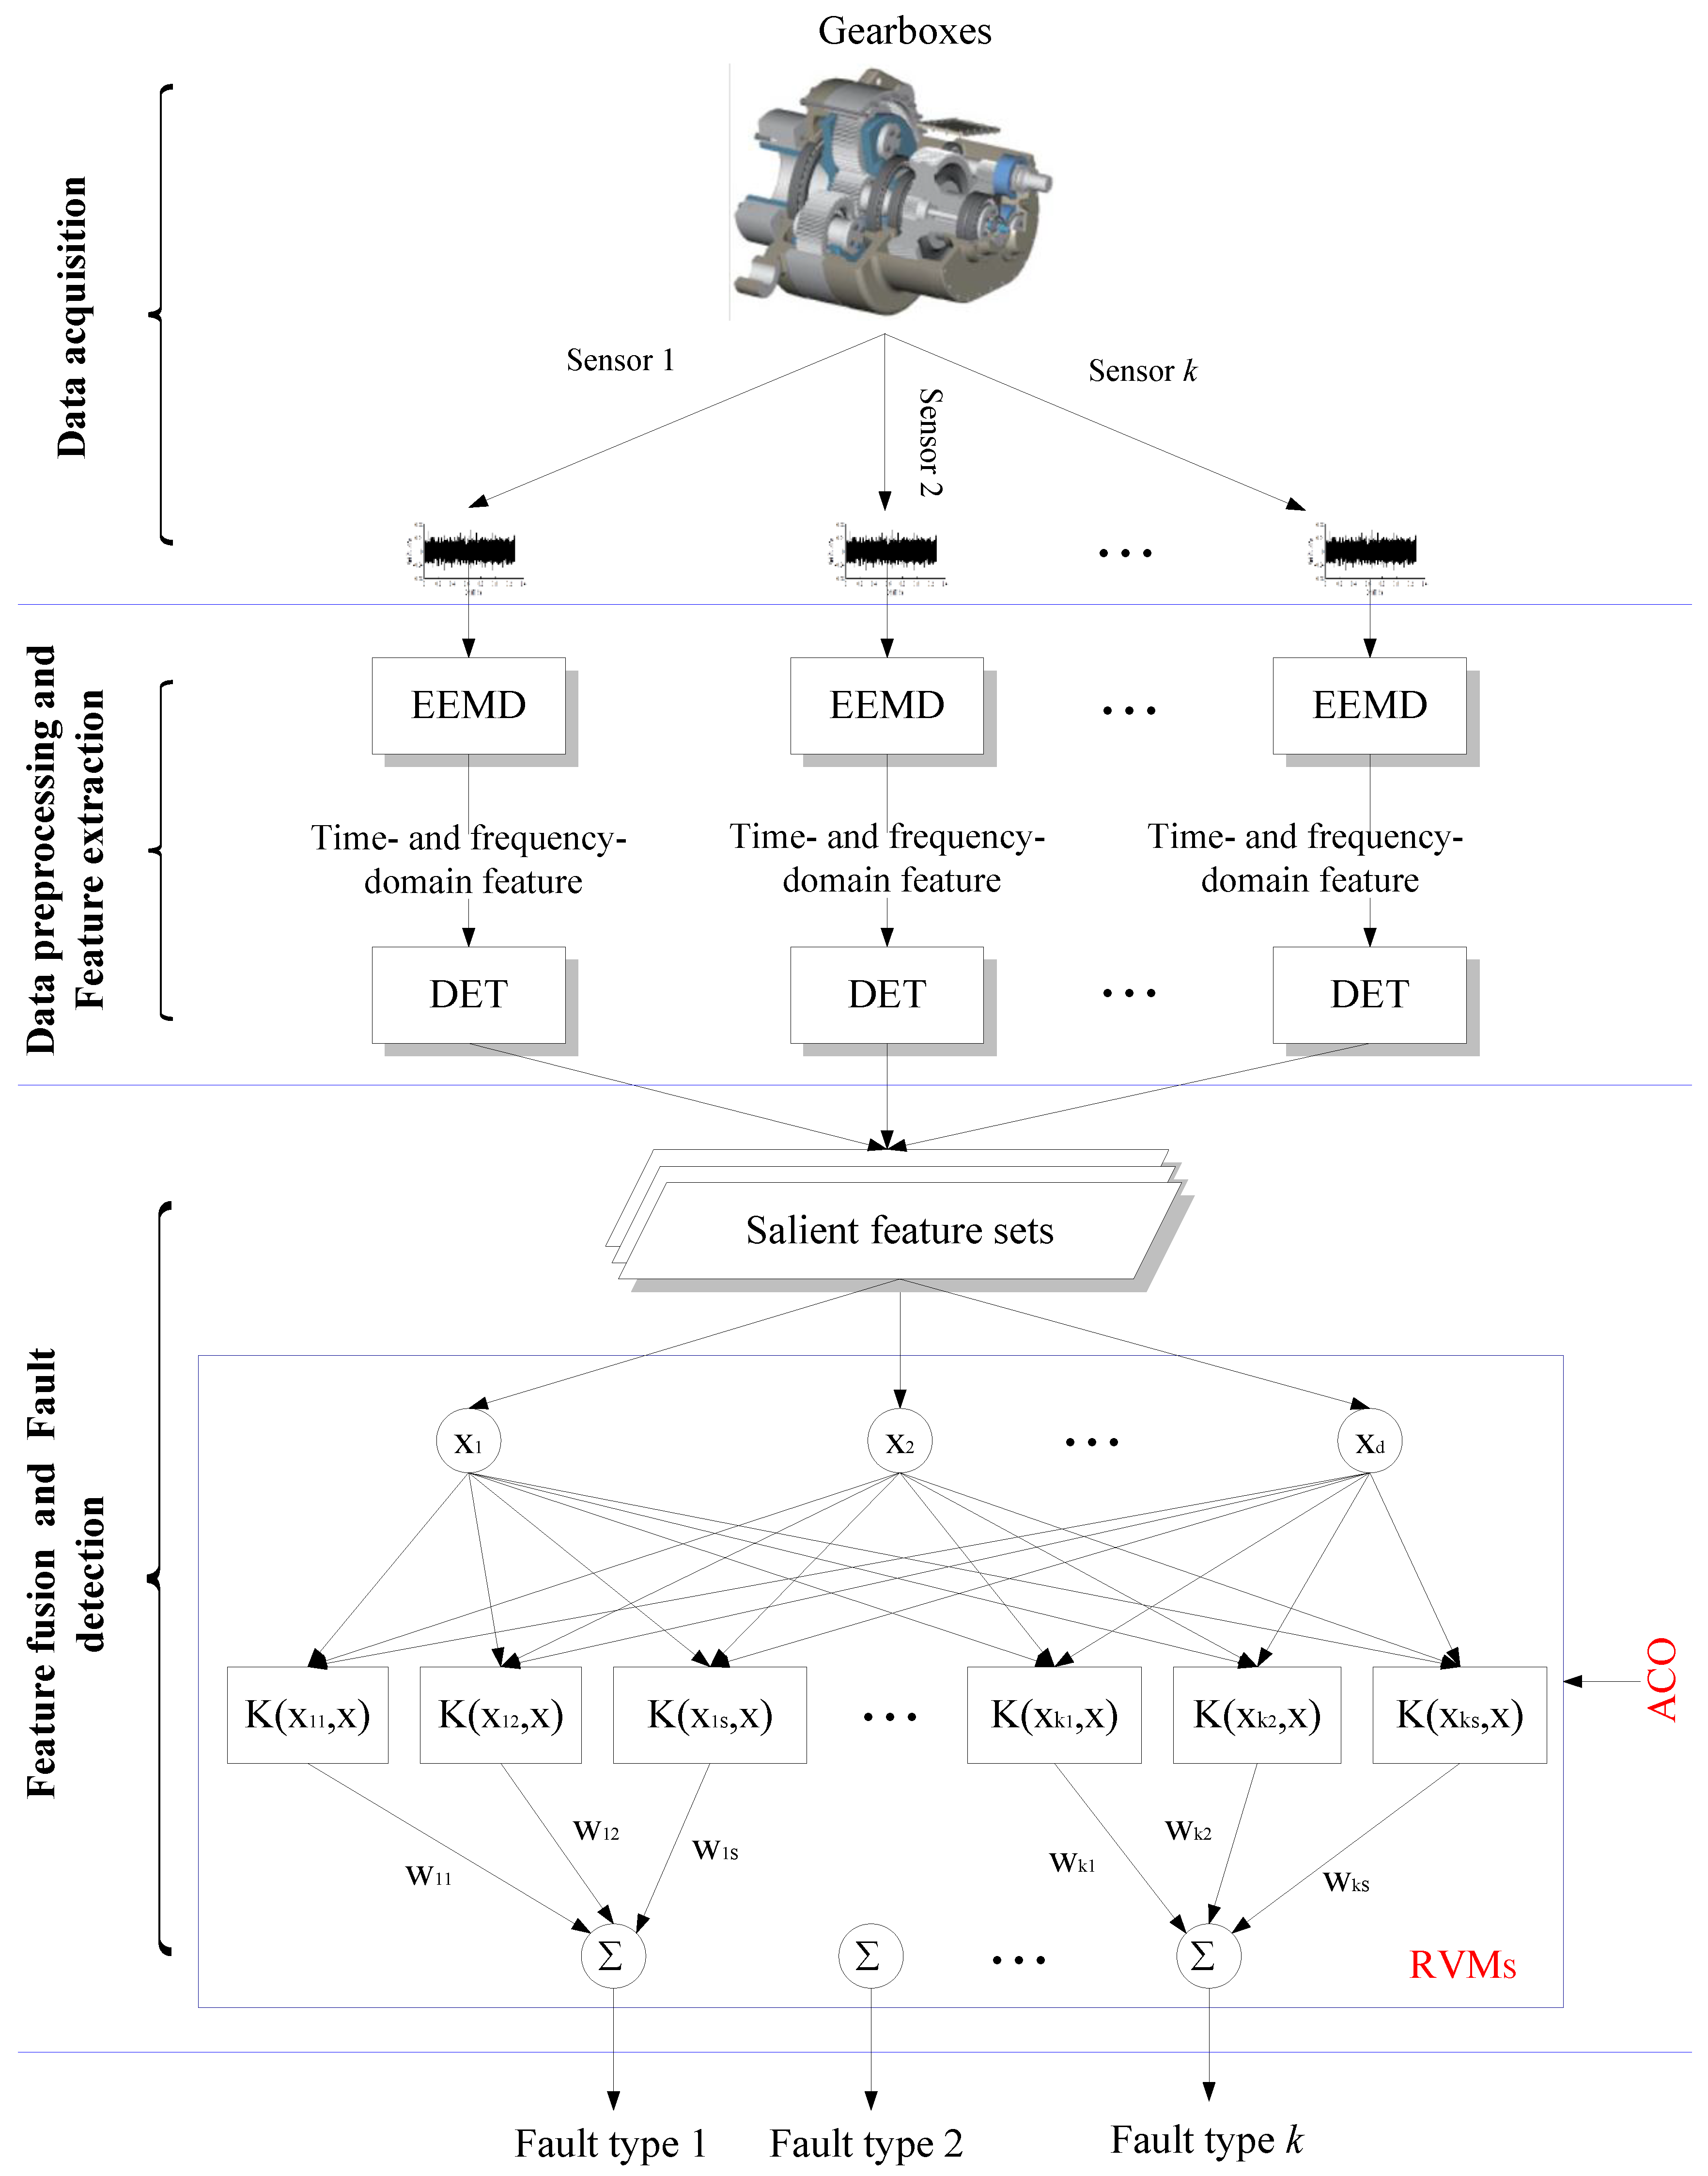
4. Strategy

- Step 1:
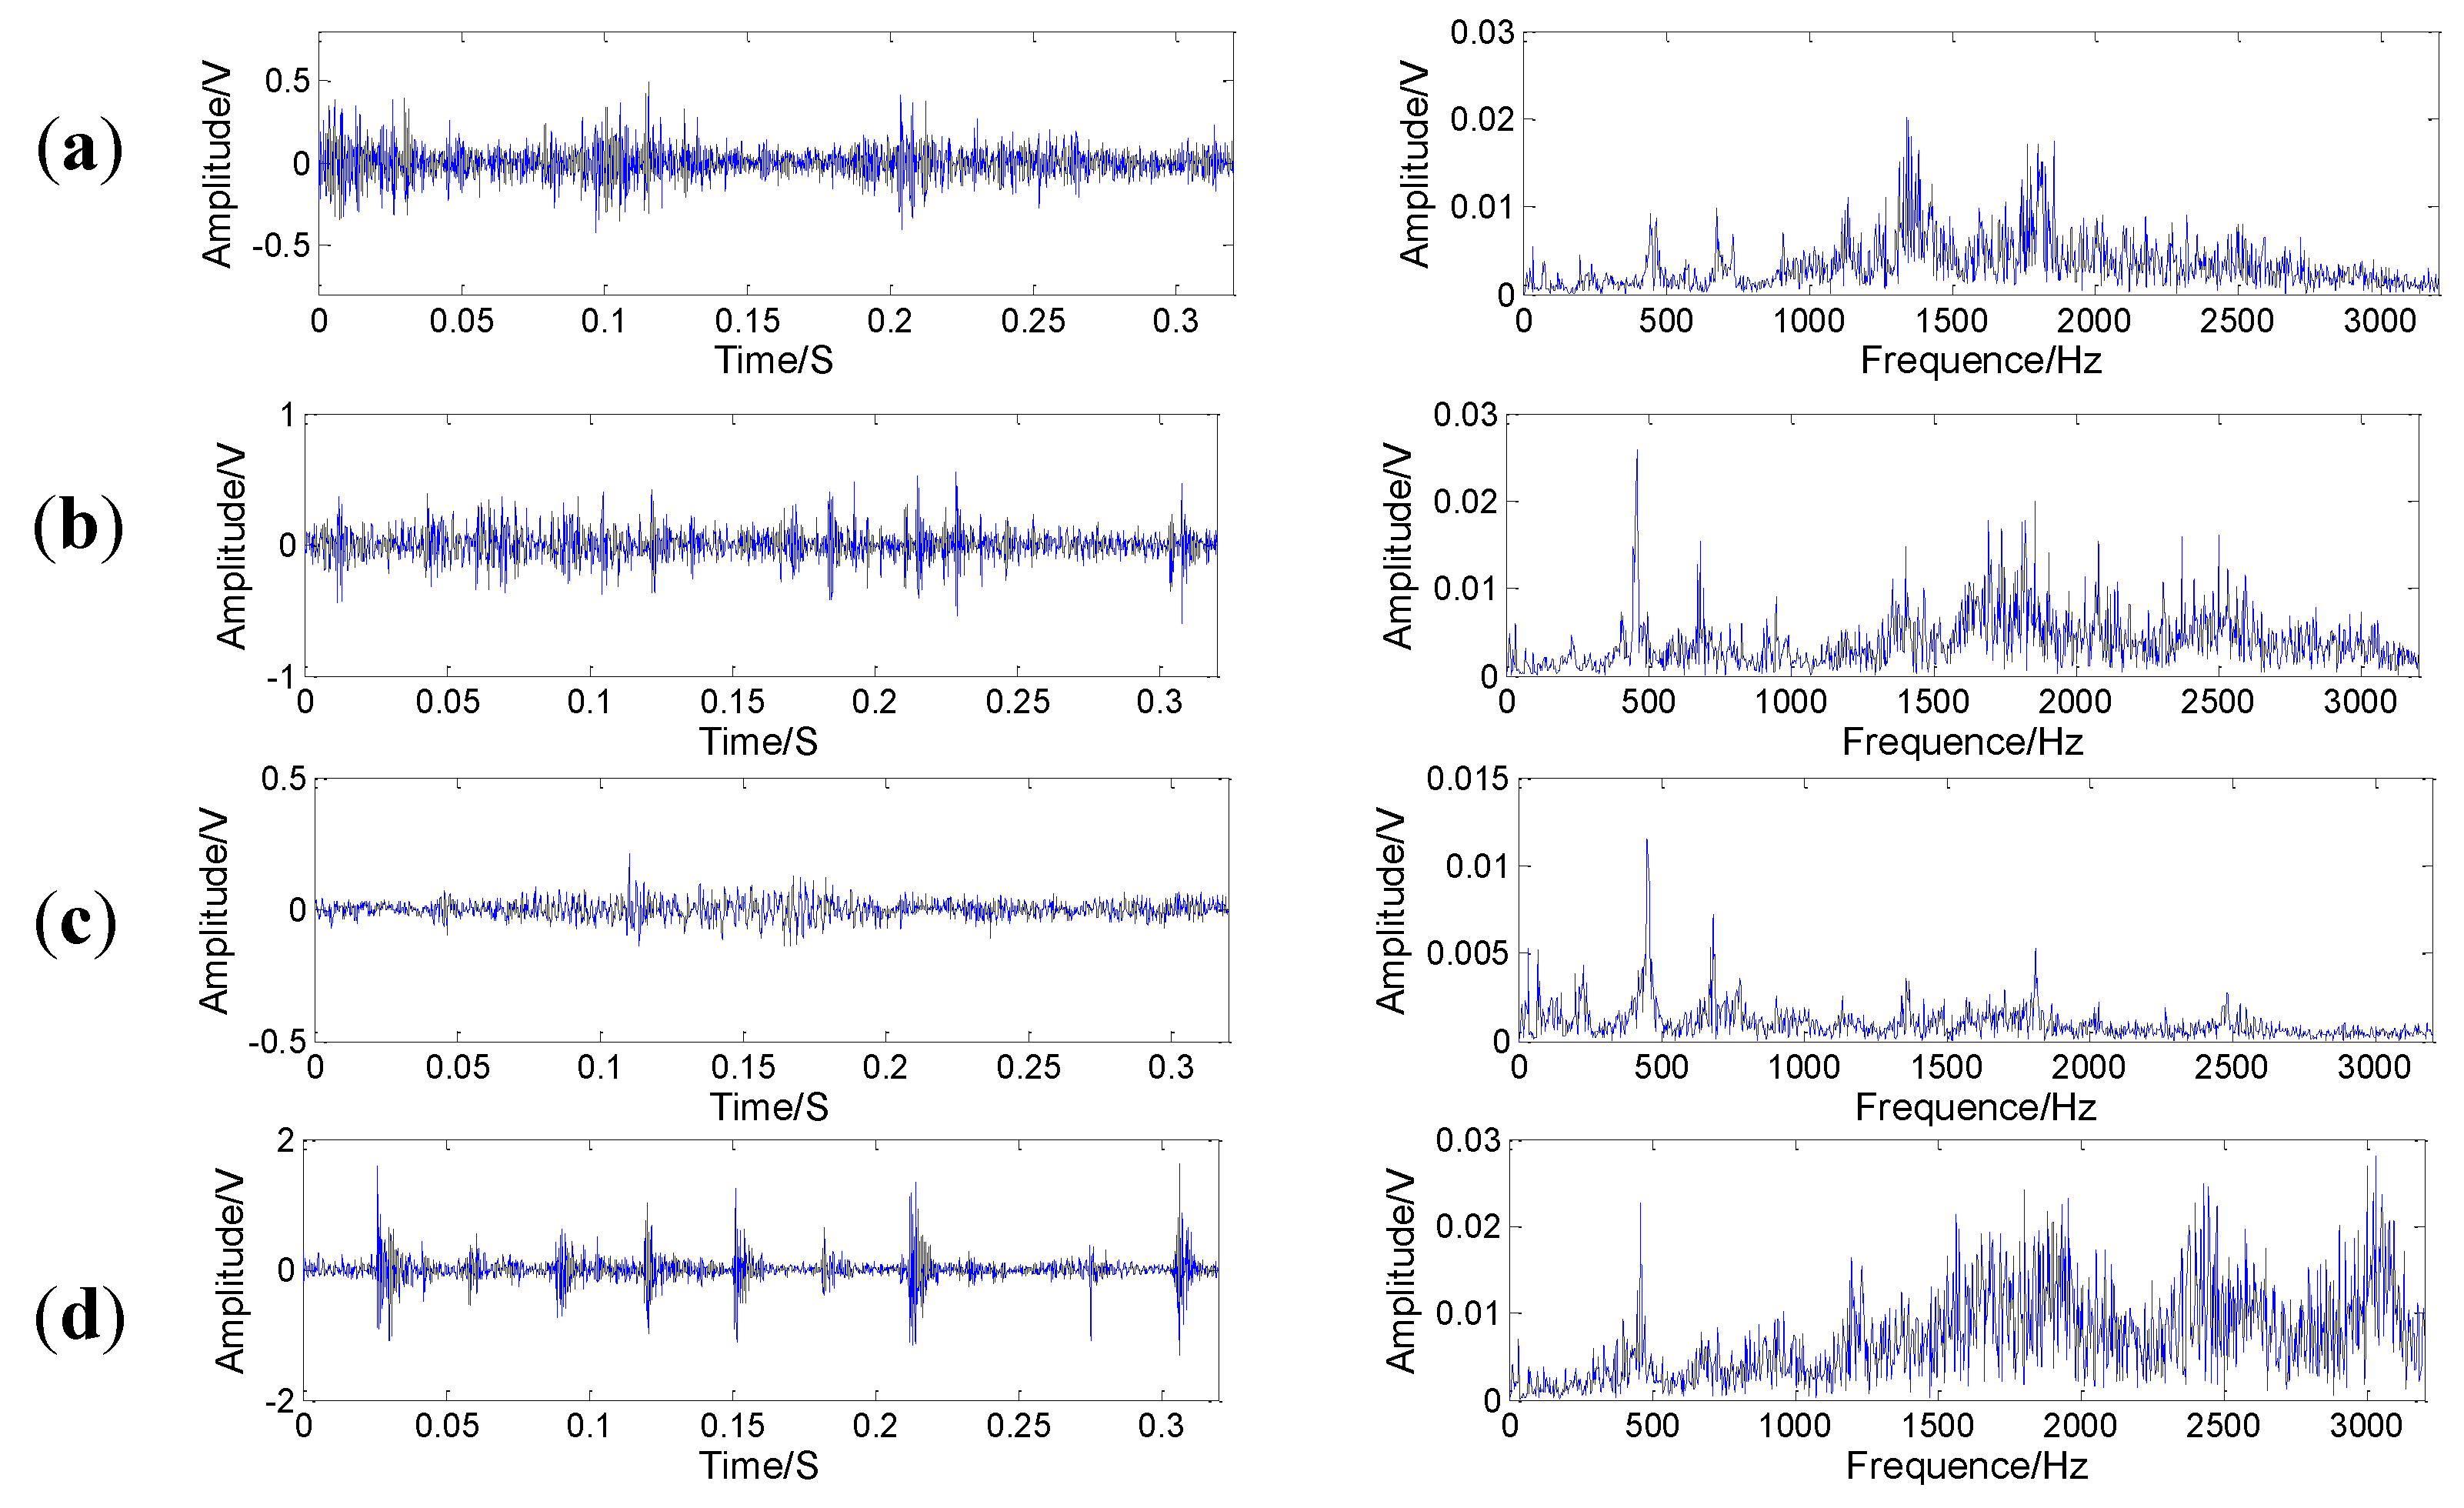
- Collect vibration signals from different sensors mounted on healthy and faulty gearboxes.
- Step 2:
- Determine the appropriate interval time, partition the collected data of various states into segments (for instance the collected data are partitioned into parts as their sampling time is and interval time is ).
- Step 3:
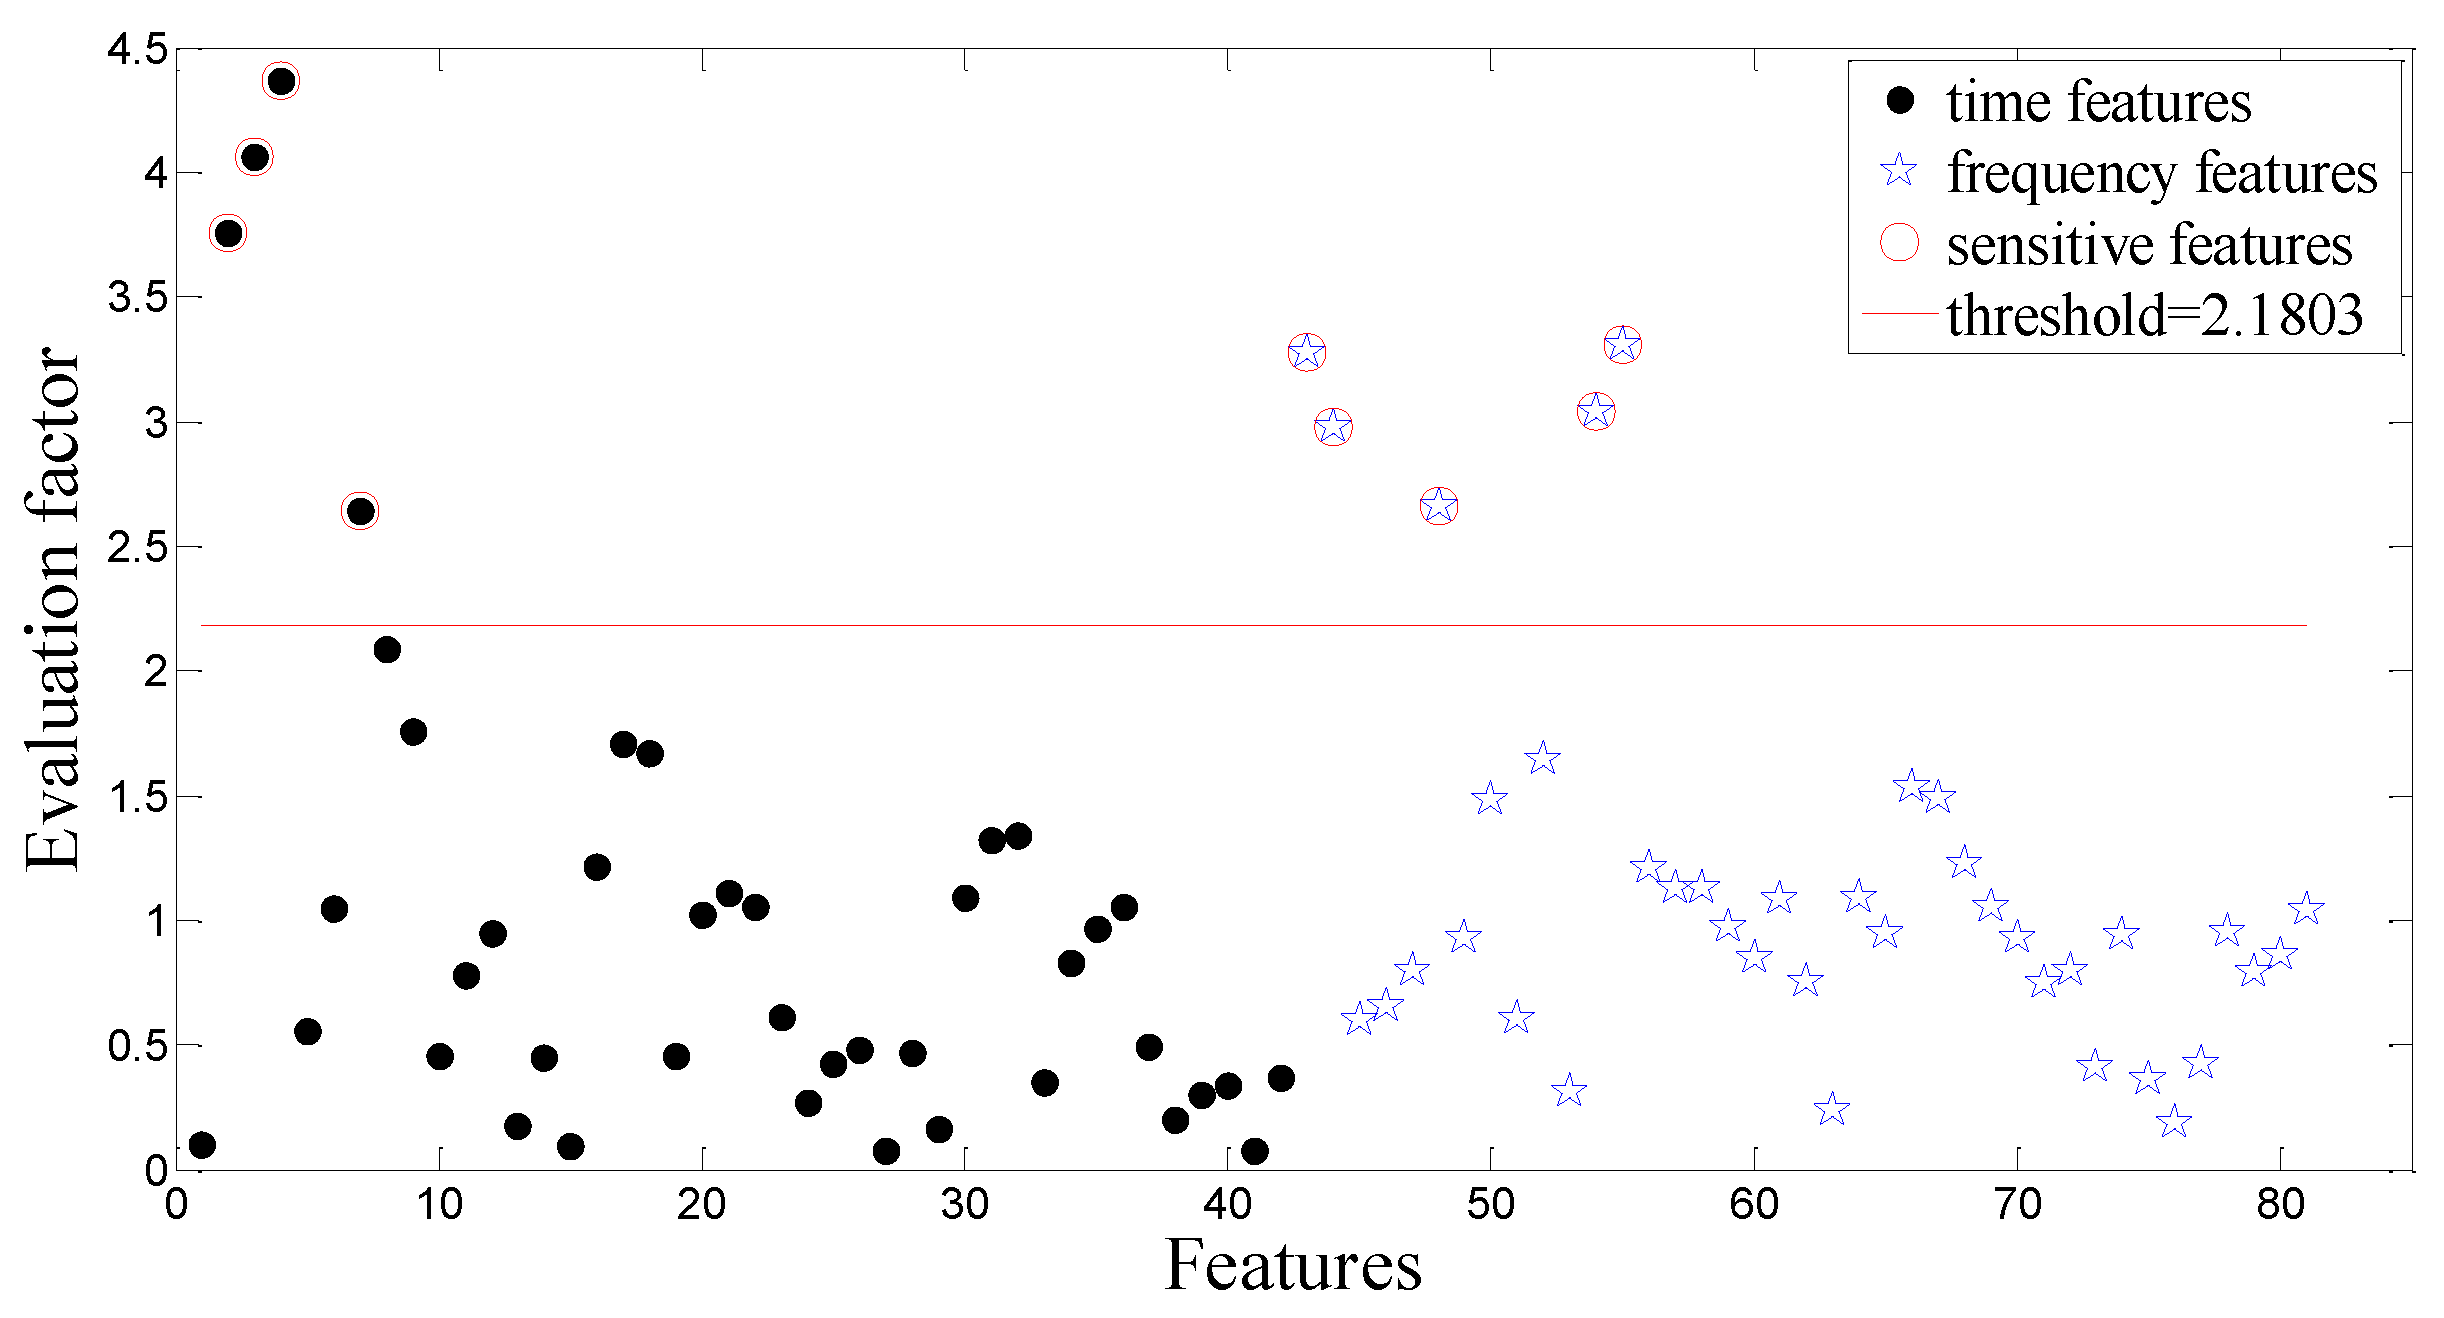
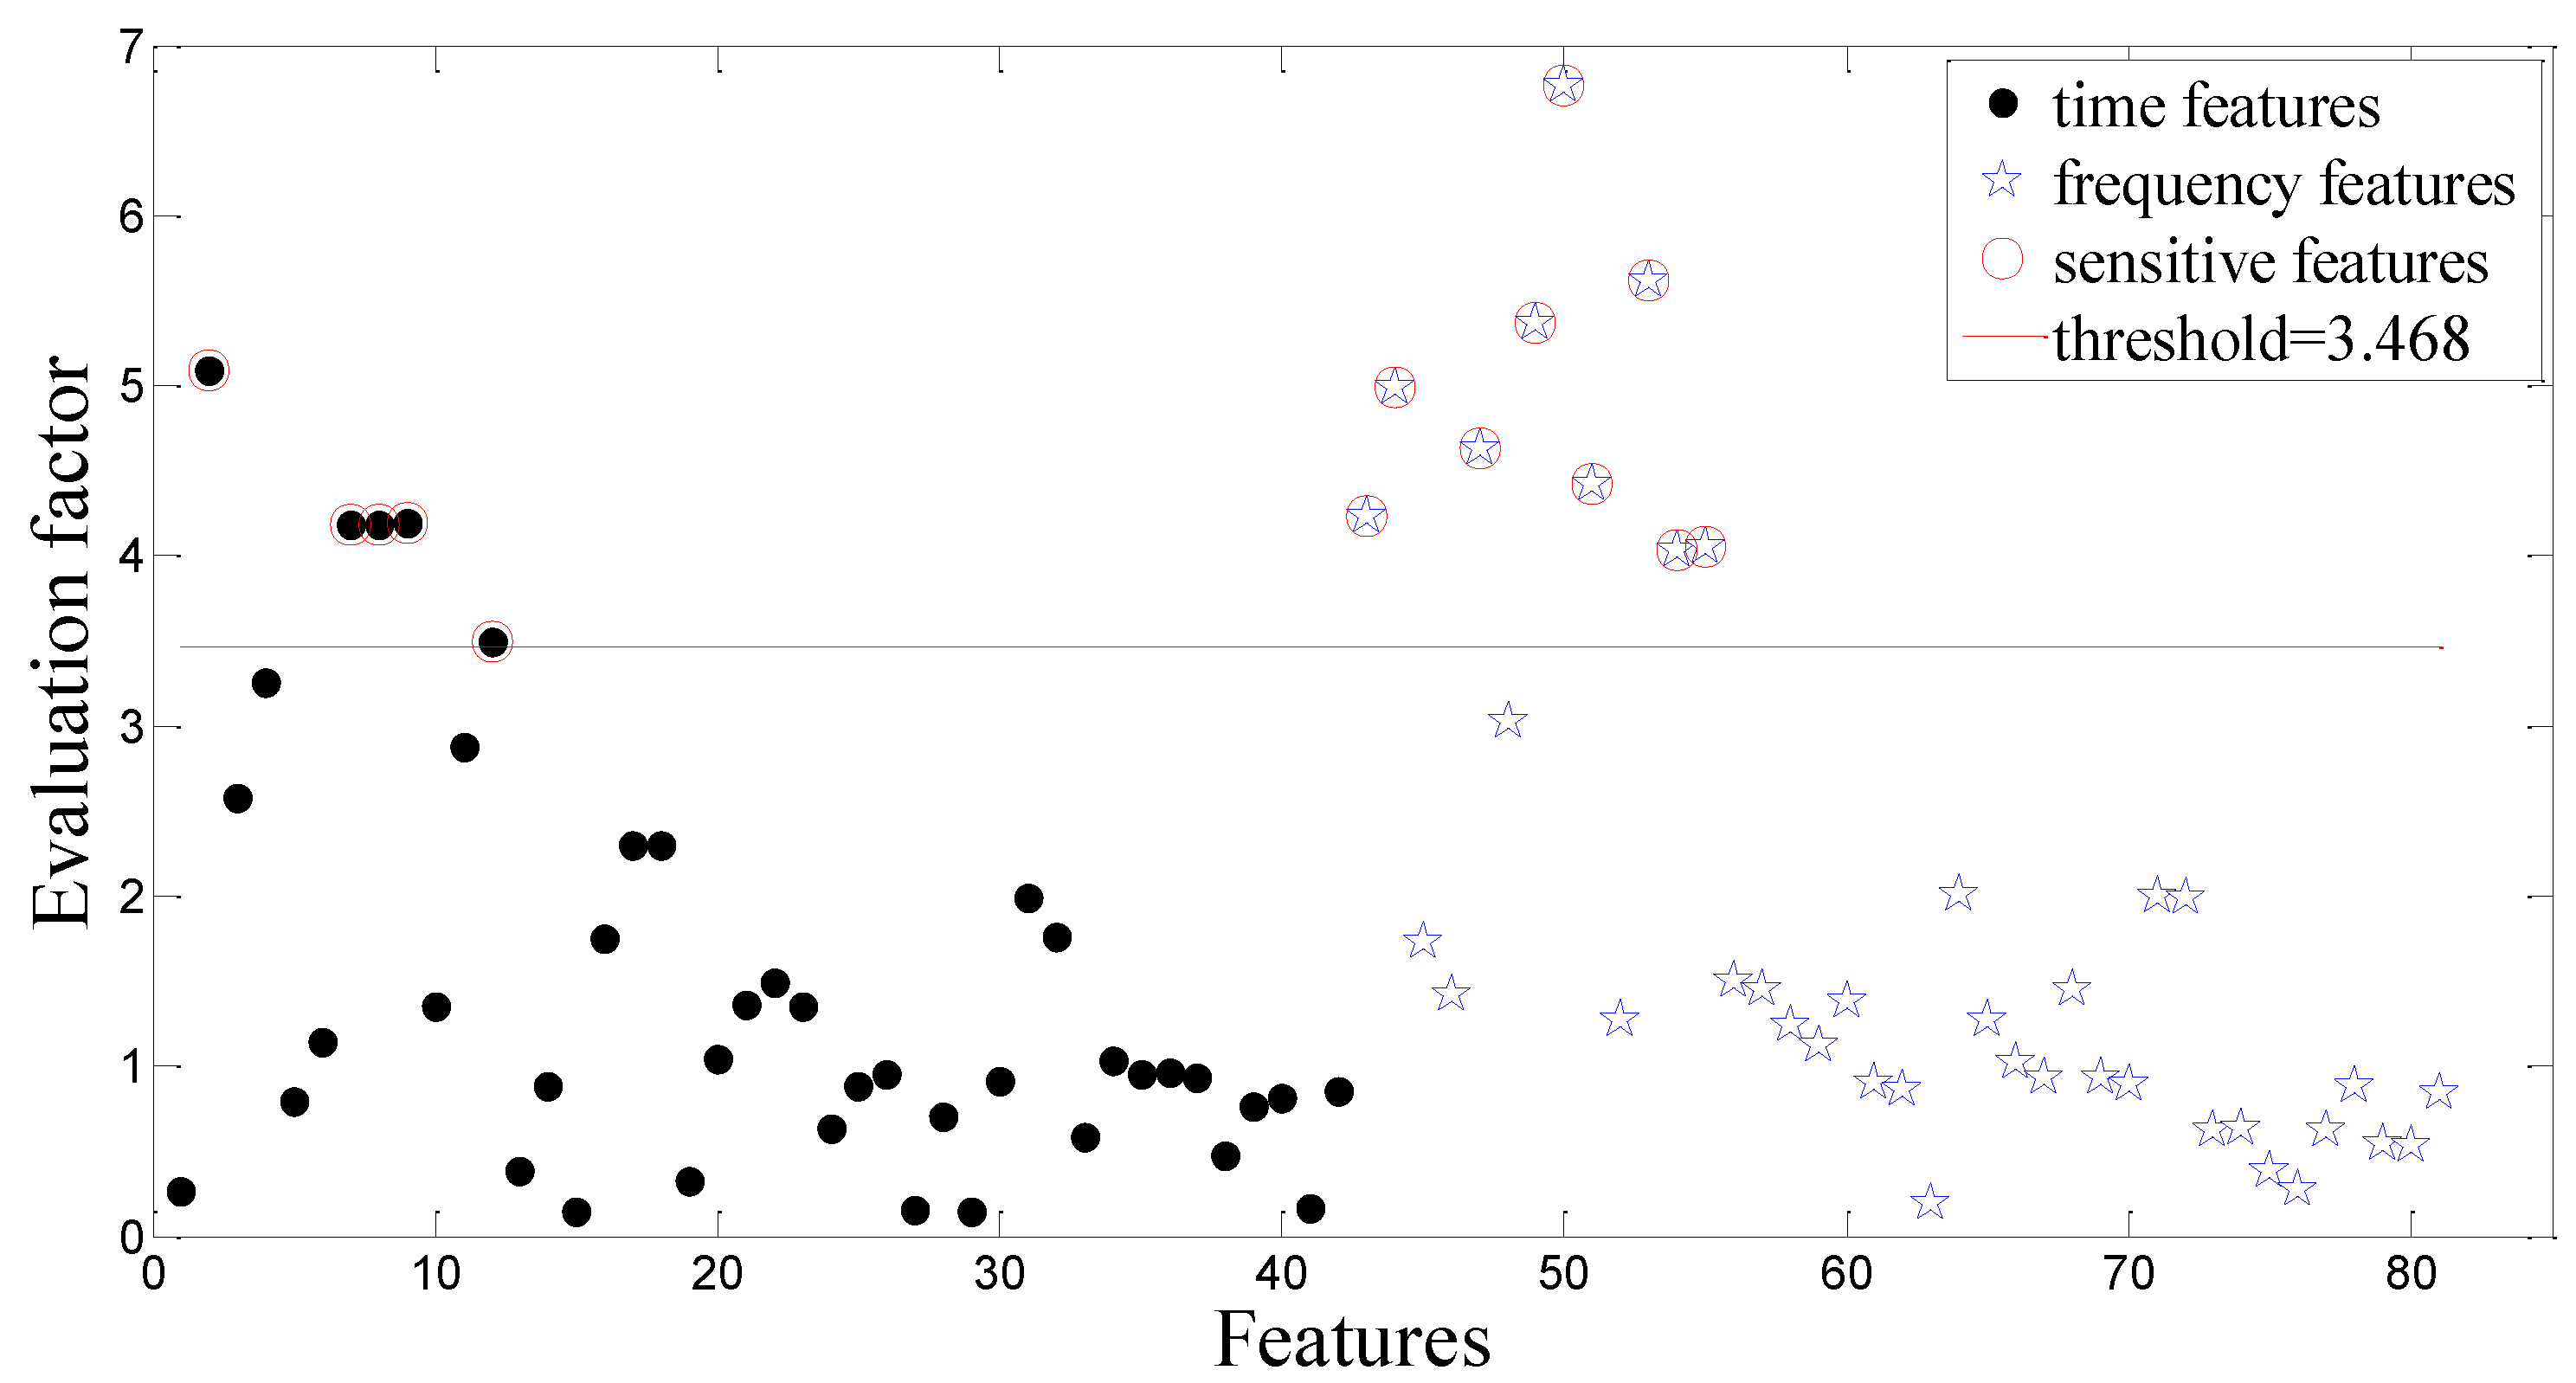
- Preprocess each segment by EEMD and obtain their IMFs. Calculate 27 statistic feature including time- and frequency-domain features of the first three IMFs, and the DET is used to select dominant features for each data segment. All segments are fused as samples that are further divided into two subsets, the training samples and testing samples.
- Step 4:
- Using the training samples, the width factor of RVM is optimized by the ACO algorithm according to the procedure described in Section 2.2.
- Step 5:
- Test the well trained RVM to make decision. As a result, the operating conditions of the tested gearbox can be determined.
5. Case Studies

| Dataset | Number of Training Samples | Number of Testing Samples | Length of Each Sample | Condition |
|---|---|---|---|---|
| A | 30 | 20 | 2048 | normal |
| 30 | 20 | 2048 | worn tooth | |
| 30 | 20 | 2048 | broken tooth | |
| 30 | 20 | 2048 | missing teeth | |
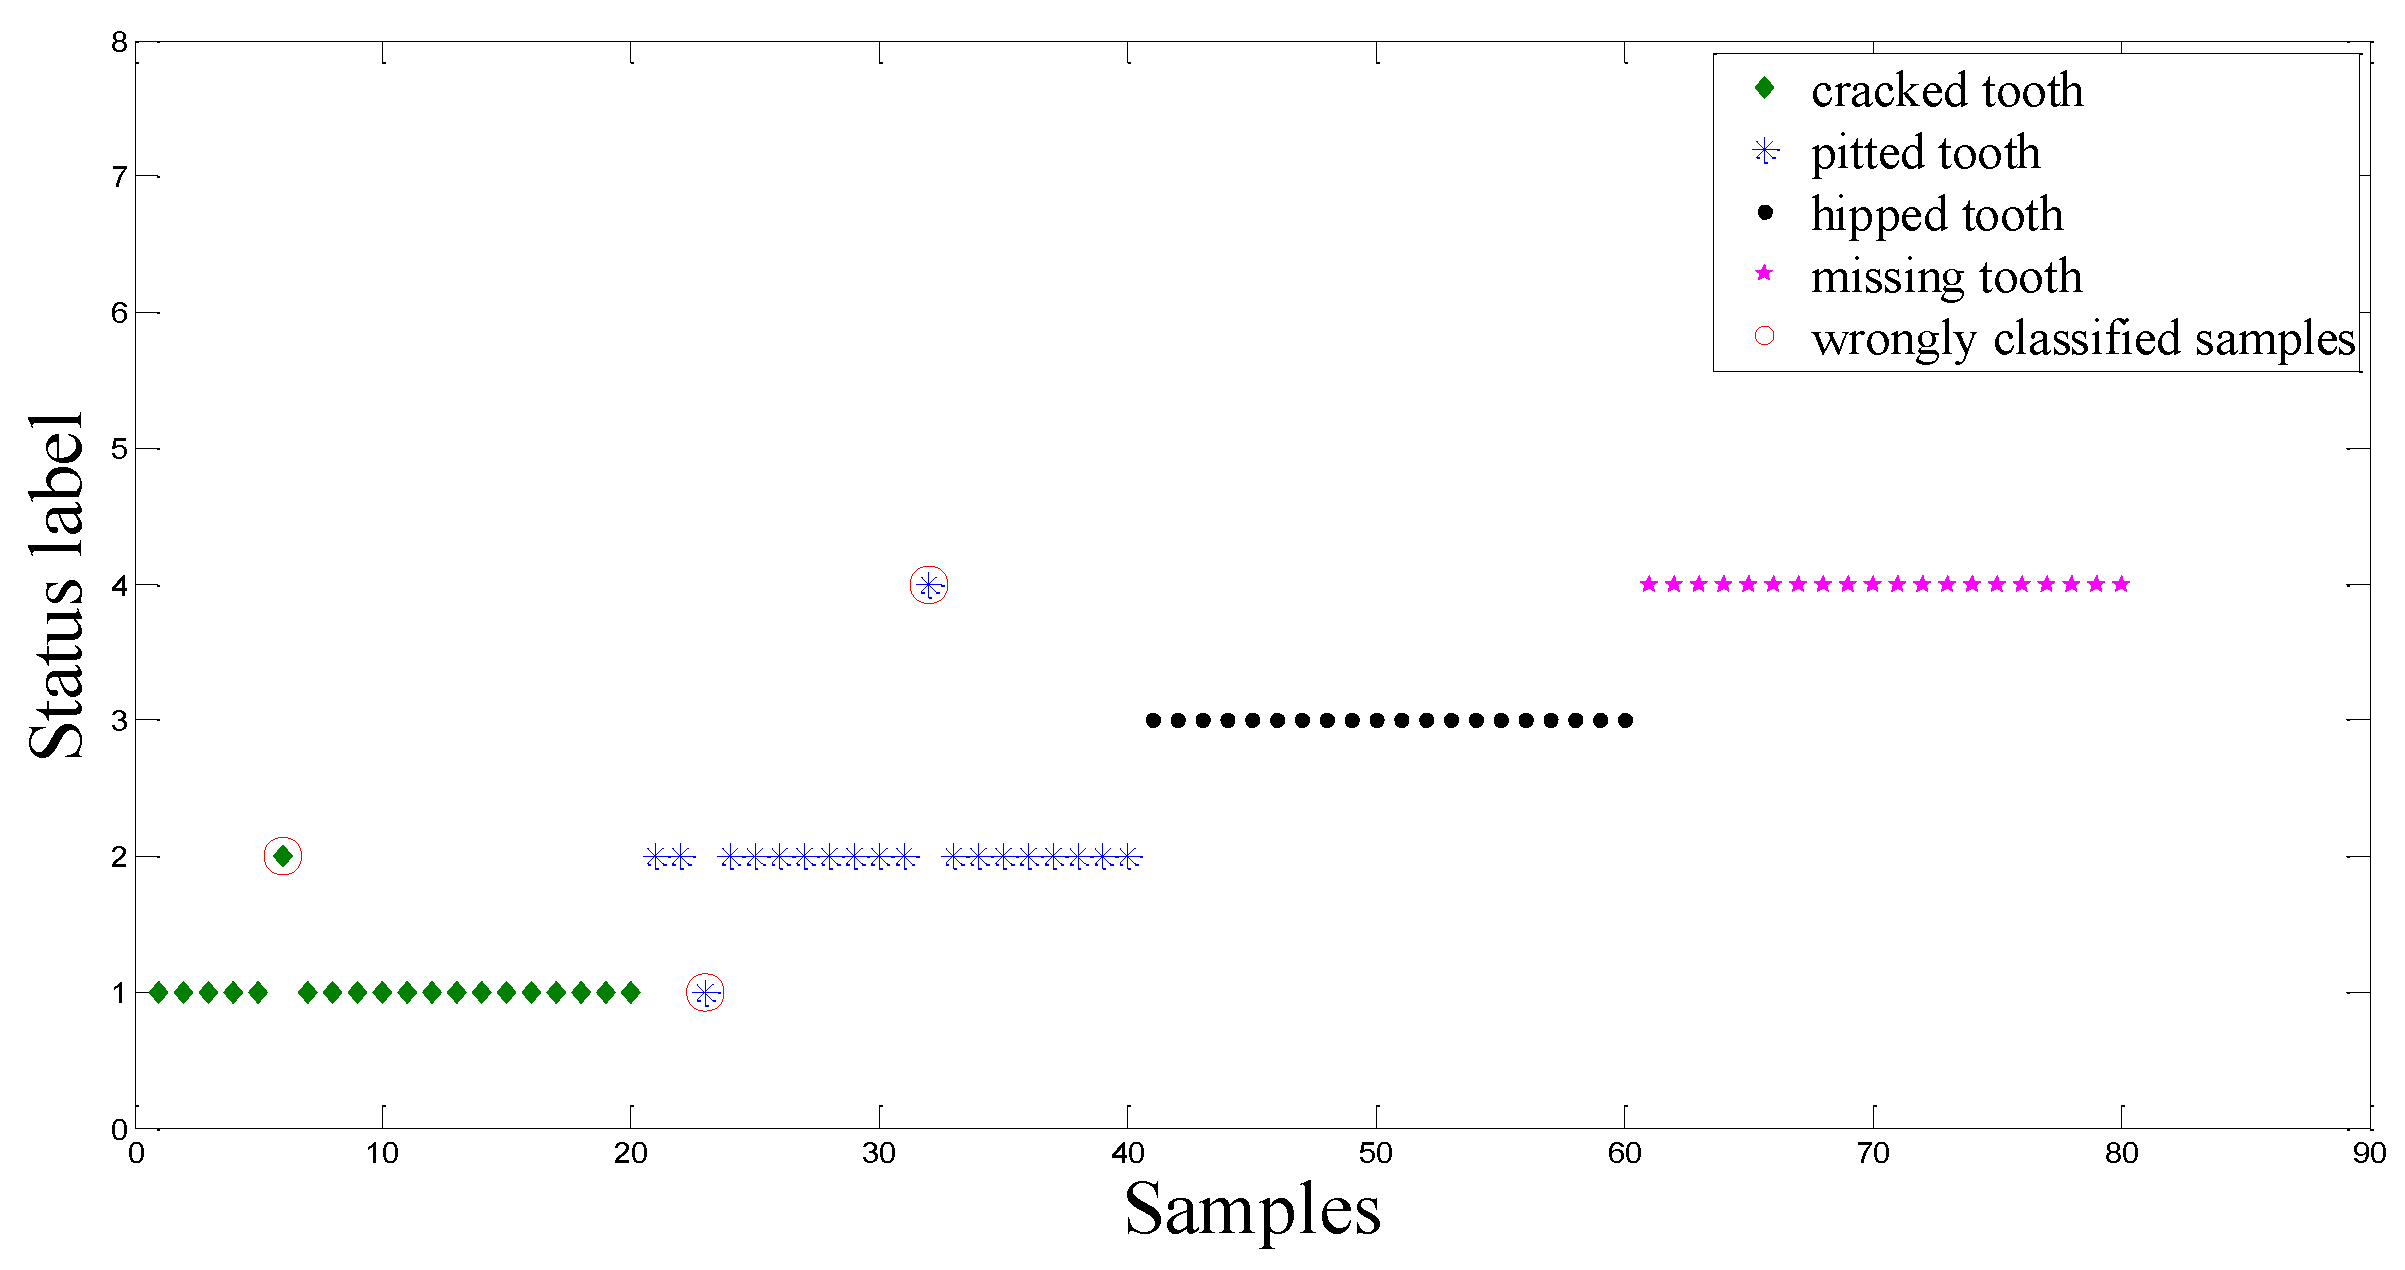
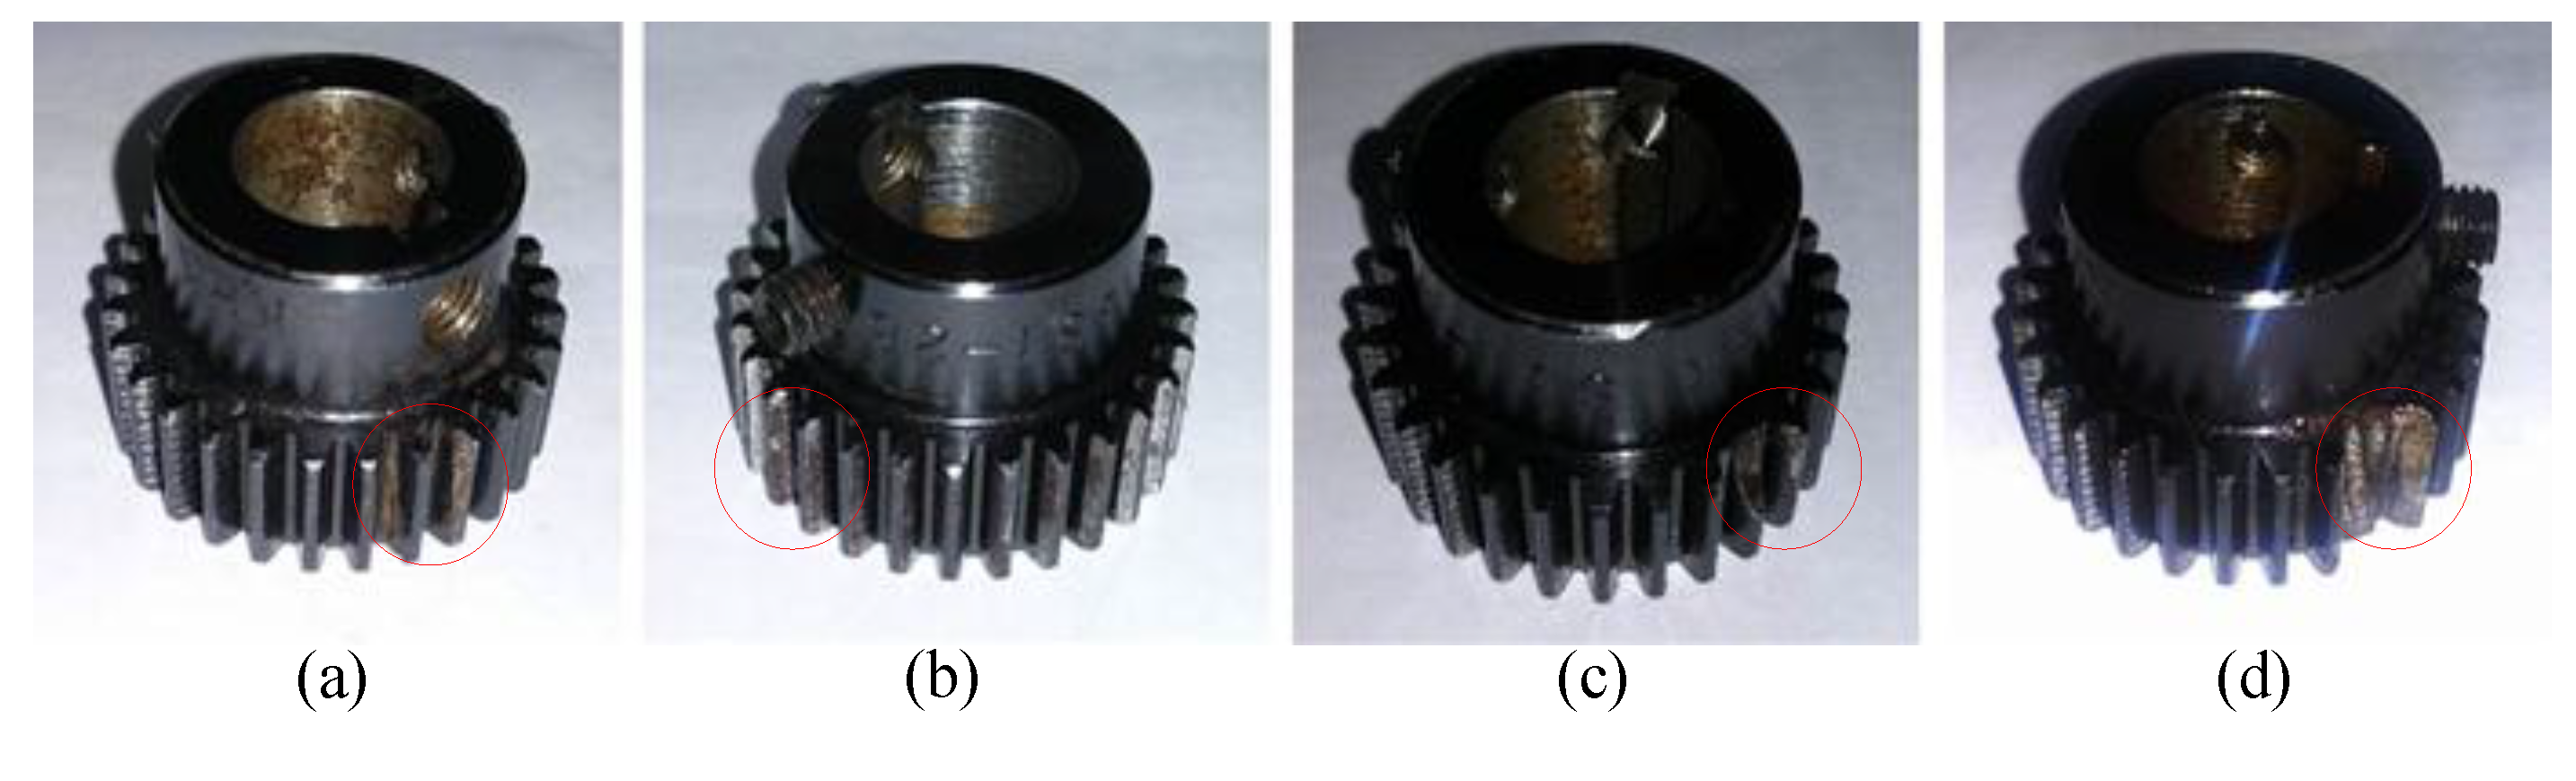
| B | 30 | 20 | 4096 | cracked tooth |
| 30 | 20 | 4096 | pitted tooth | |
| 30 | 20 | 4096 | chipped tooth | |
| 30 | 20 | 4096 | missing tooth |
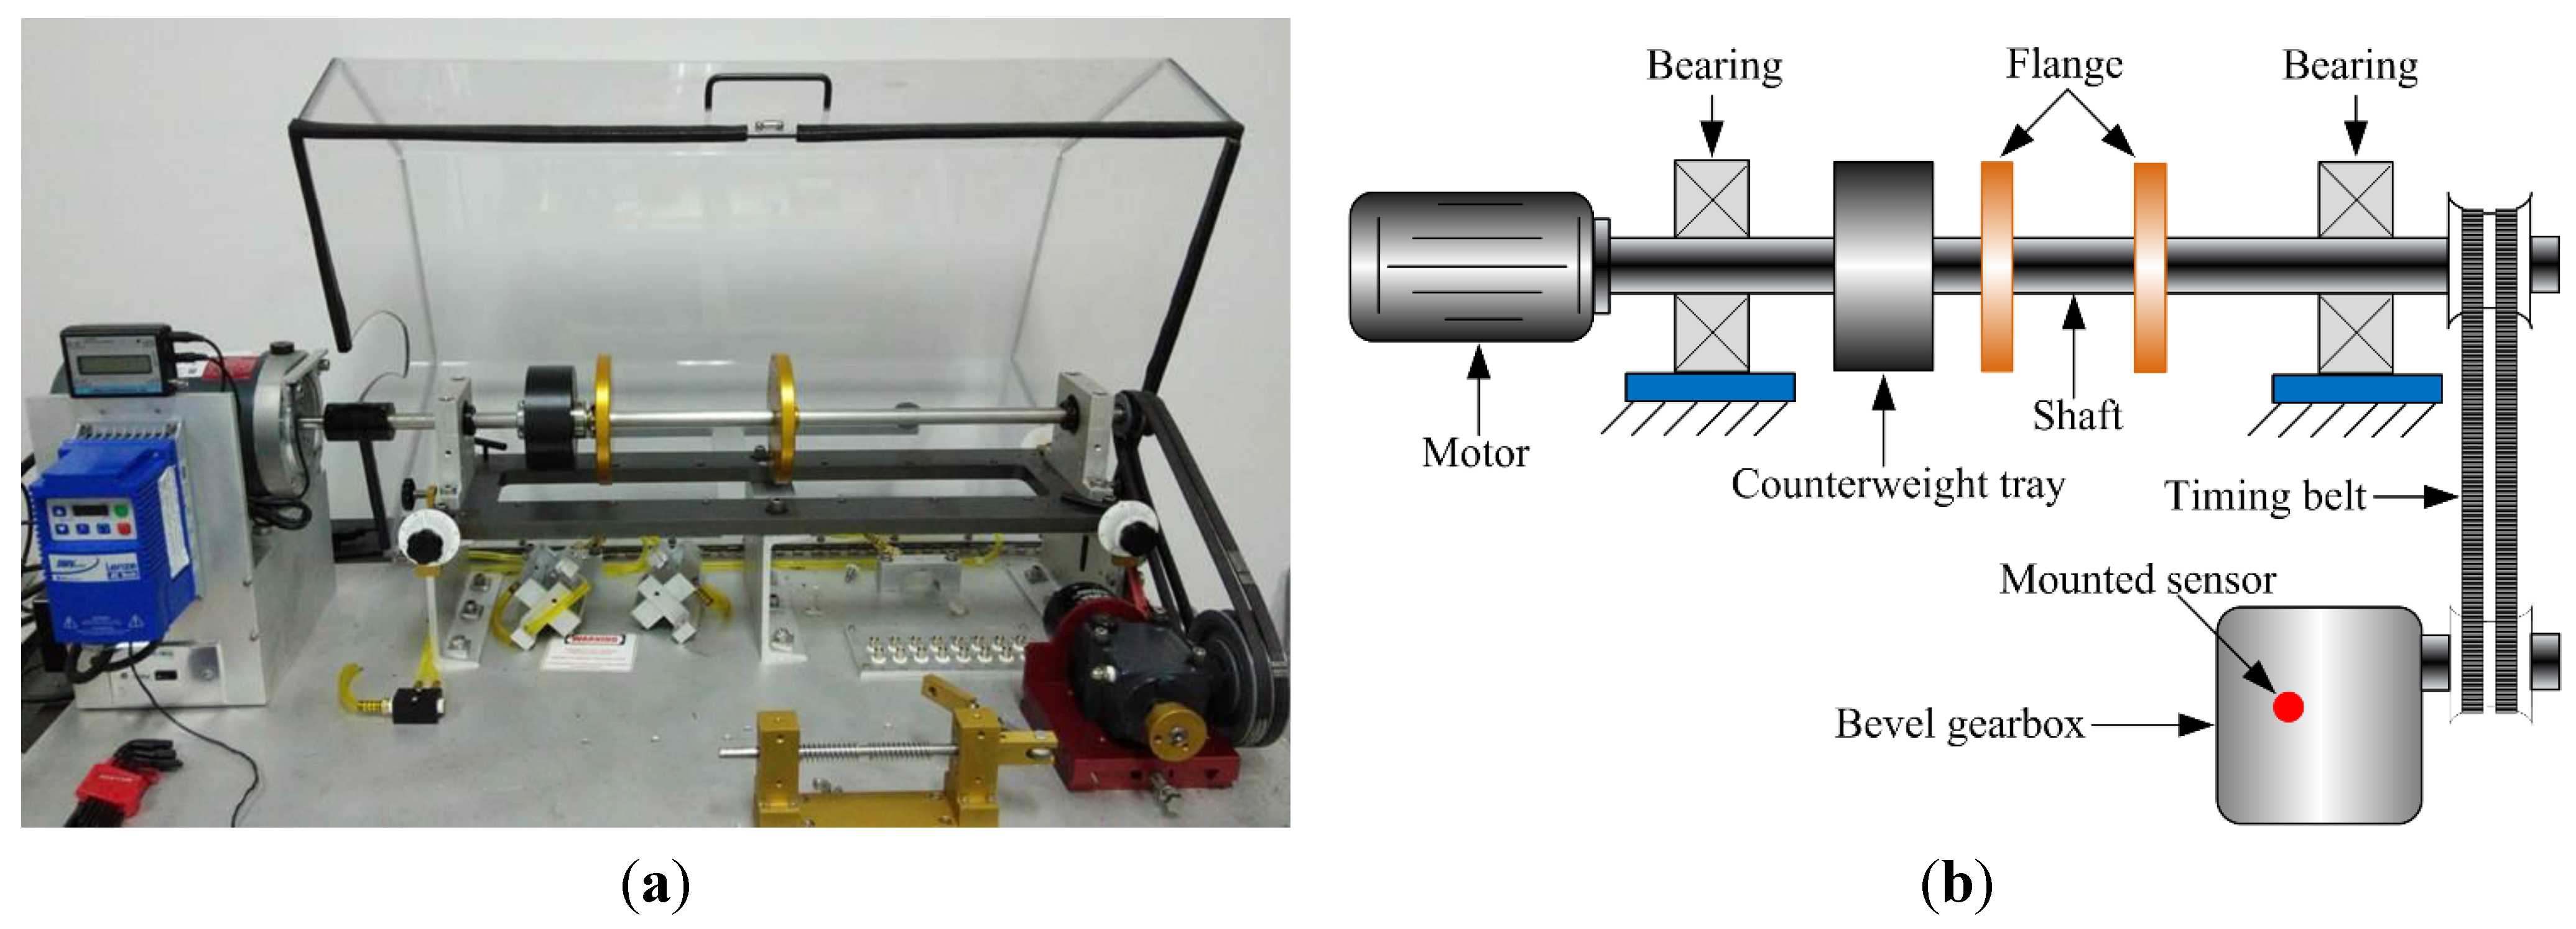
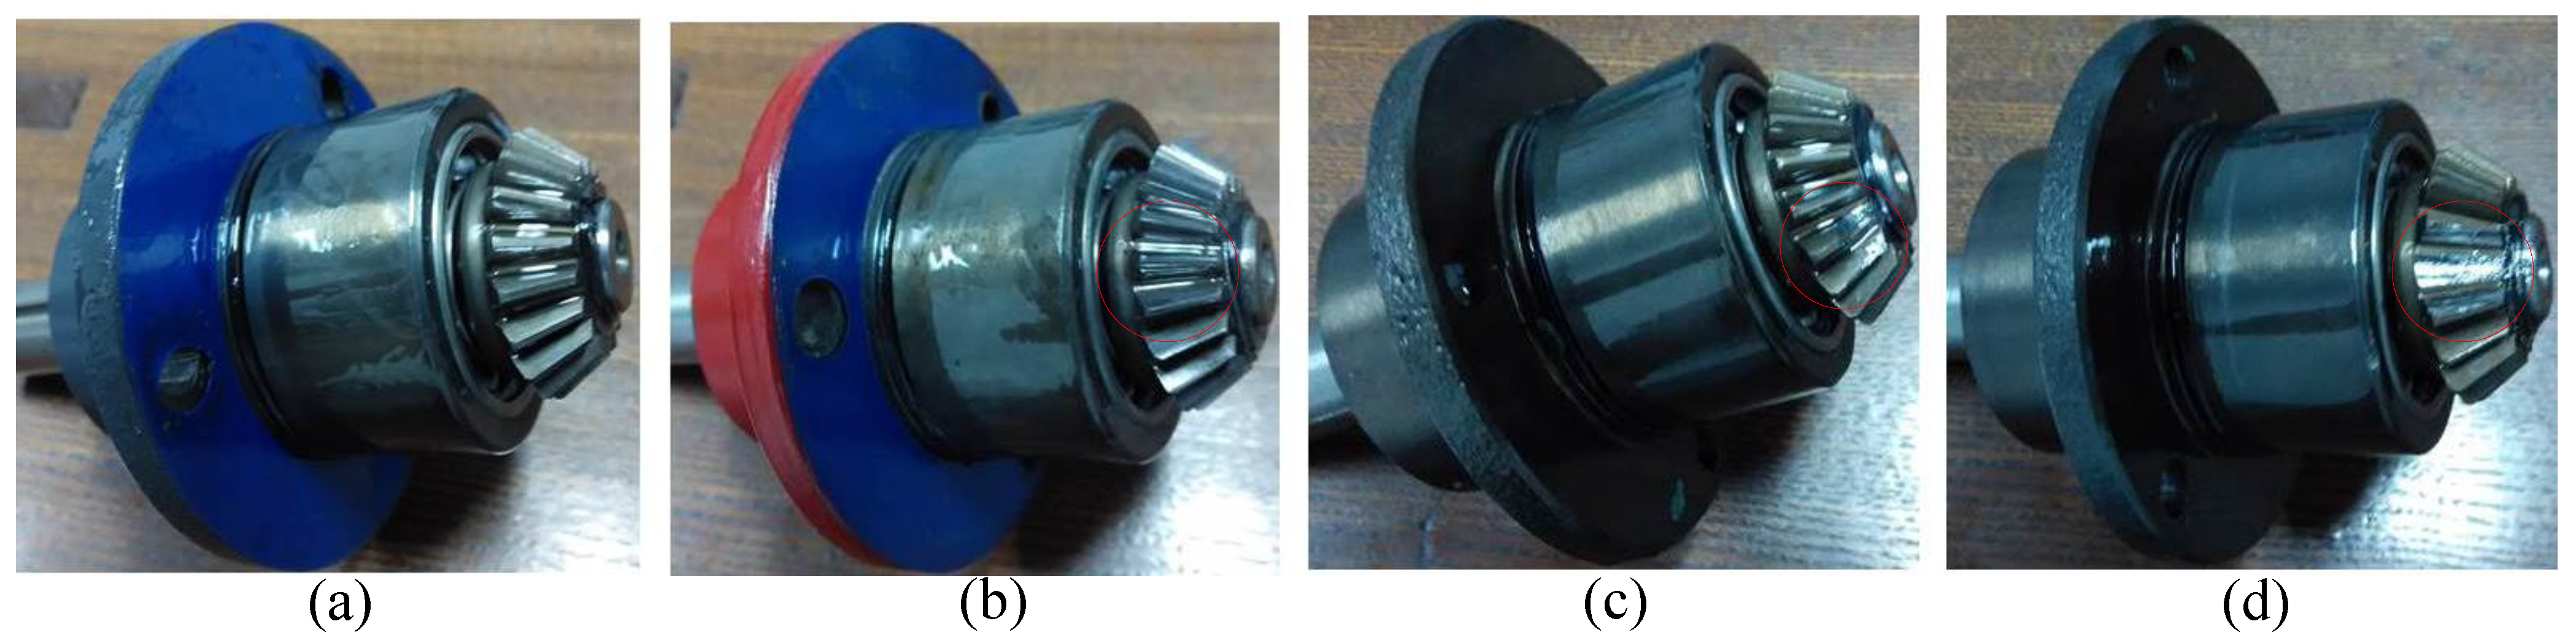
5.1. Case 1: Bevel Gearbox Fault Detection
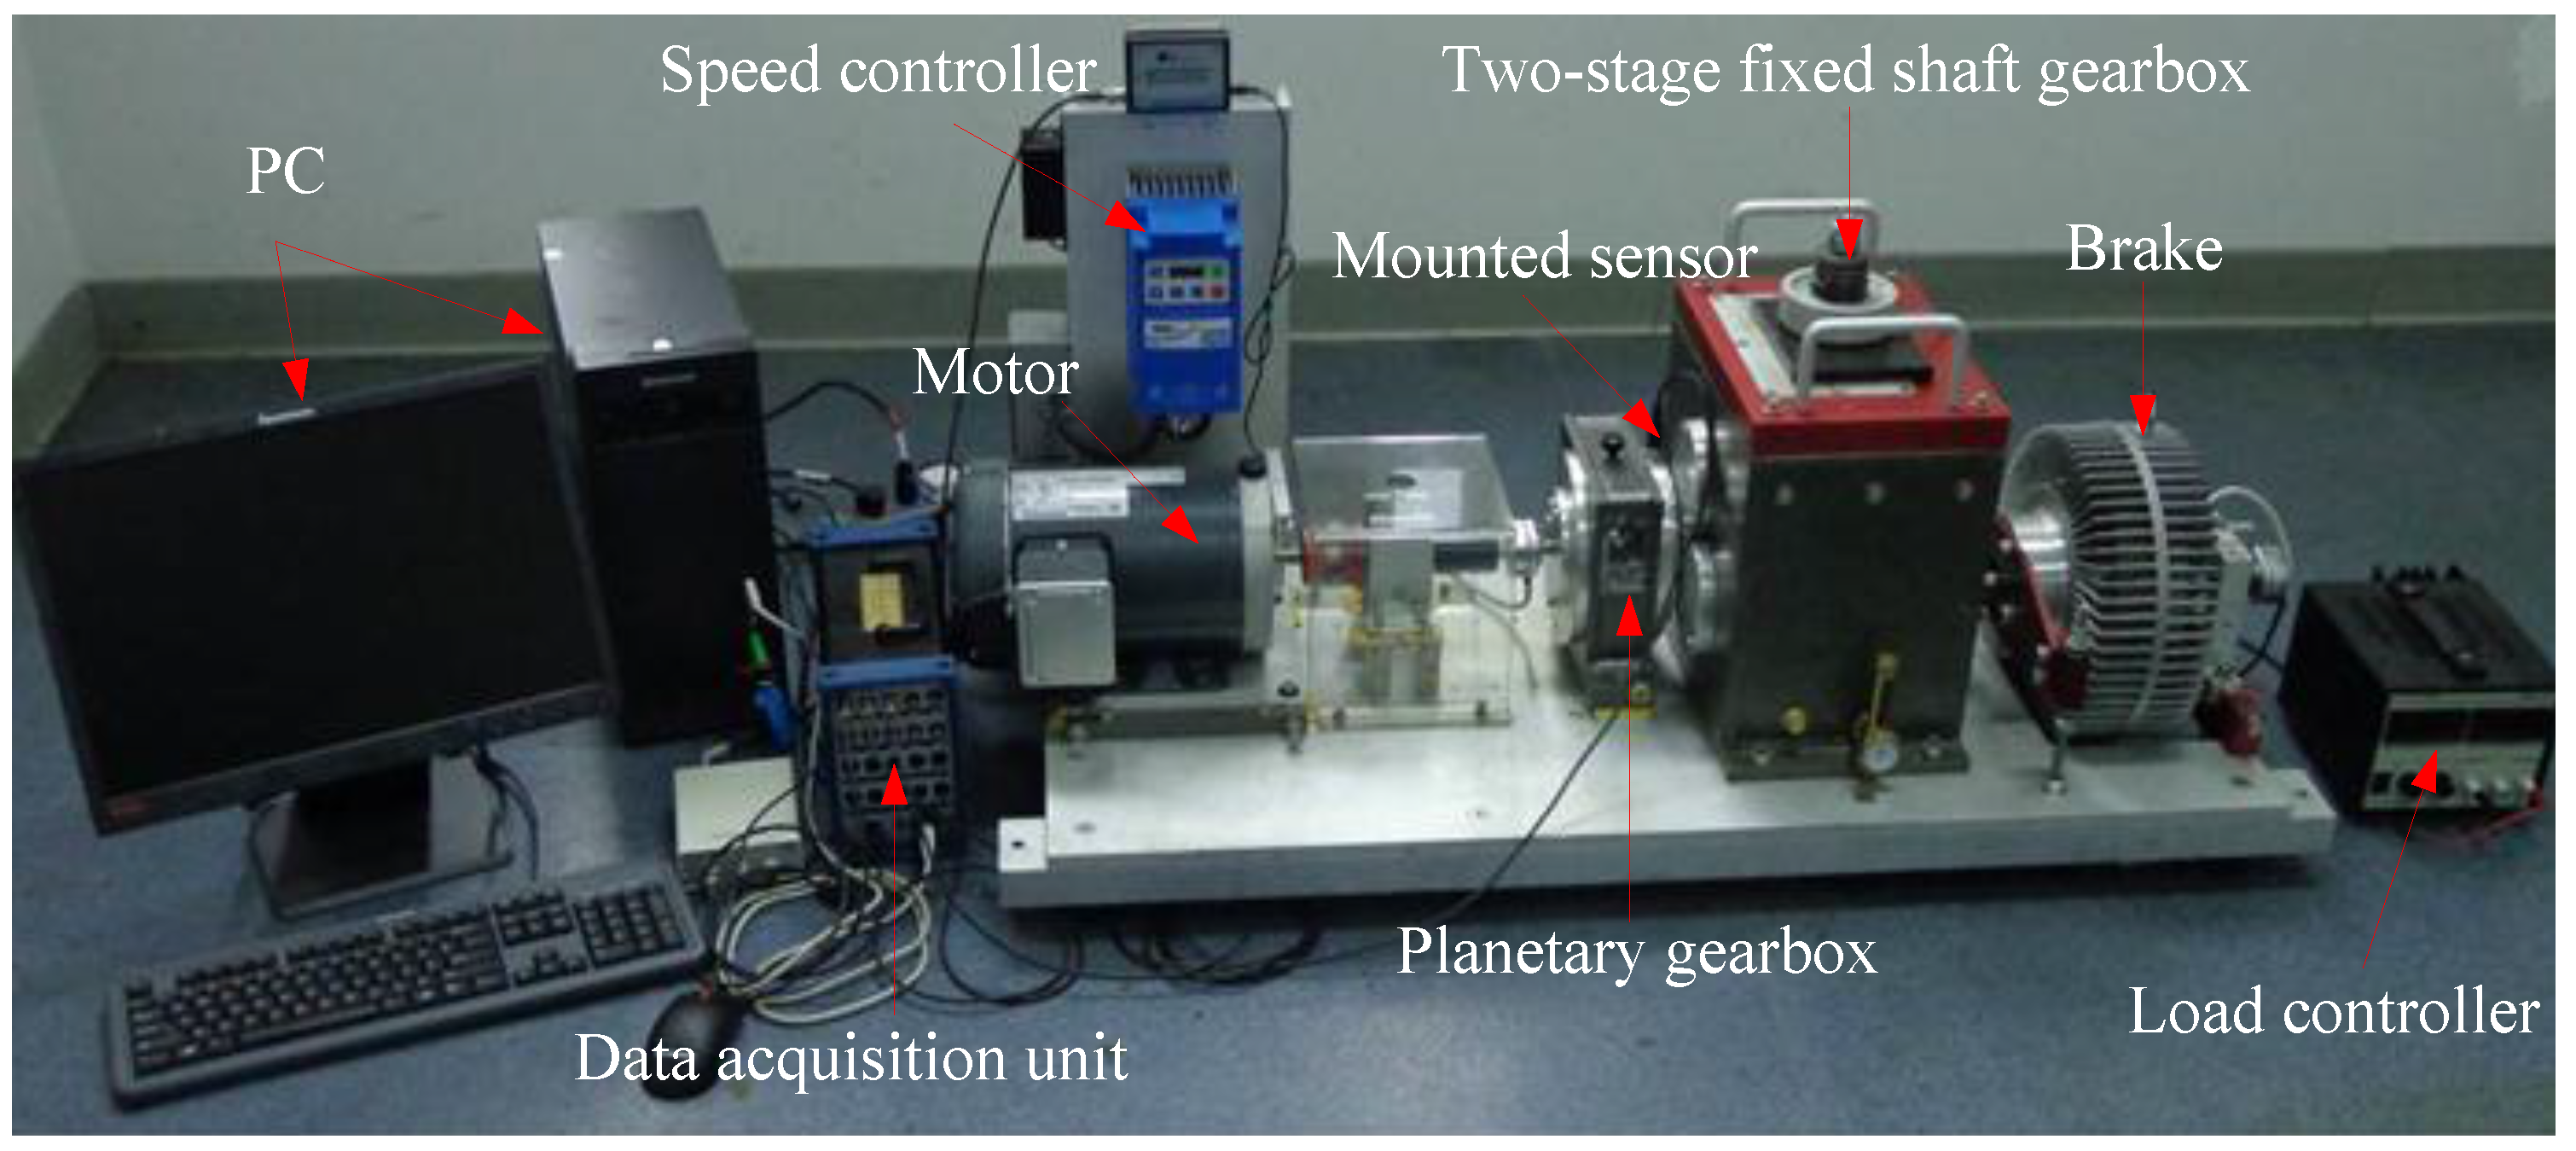
5.1.1. Experimental Systems and Data Acquisition

| Material | Steel/Steel |
|---|---|
| Number of teeth (z/z1) | 27/18 |
| Pressure angle (°) | 20 |
| Big gear pitch diameter (inch) | 1.6875 |
| Small gear pitch diameter (inch) | 1.125 |
| Big gear contact Angle (°) | 56°19’ |
| Small gear contact Angle (°) | 33°41’ |


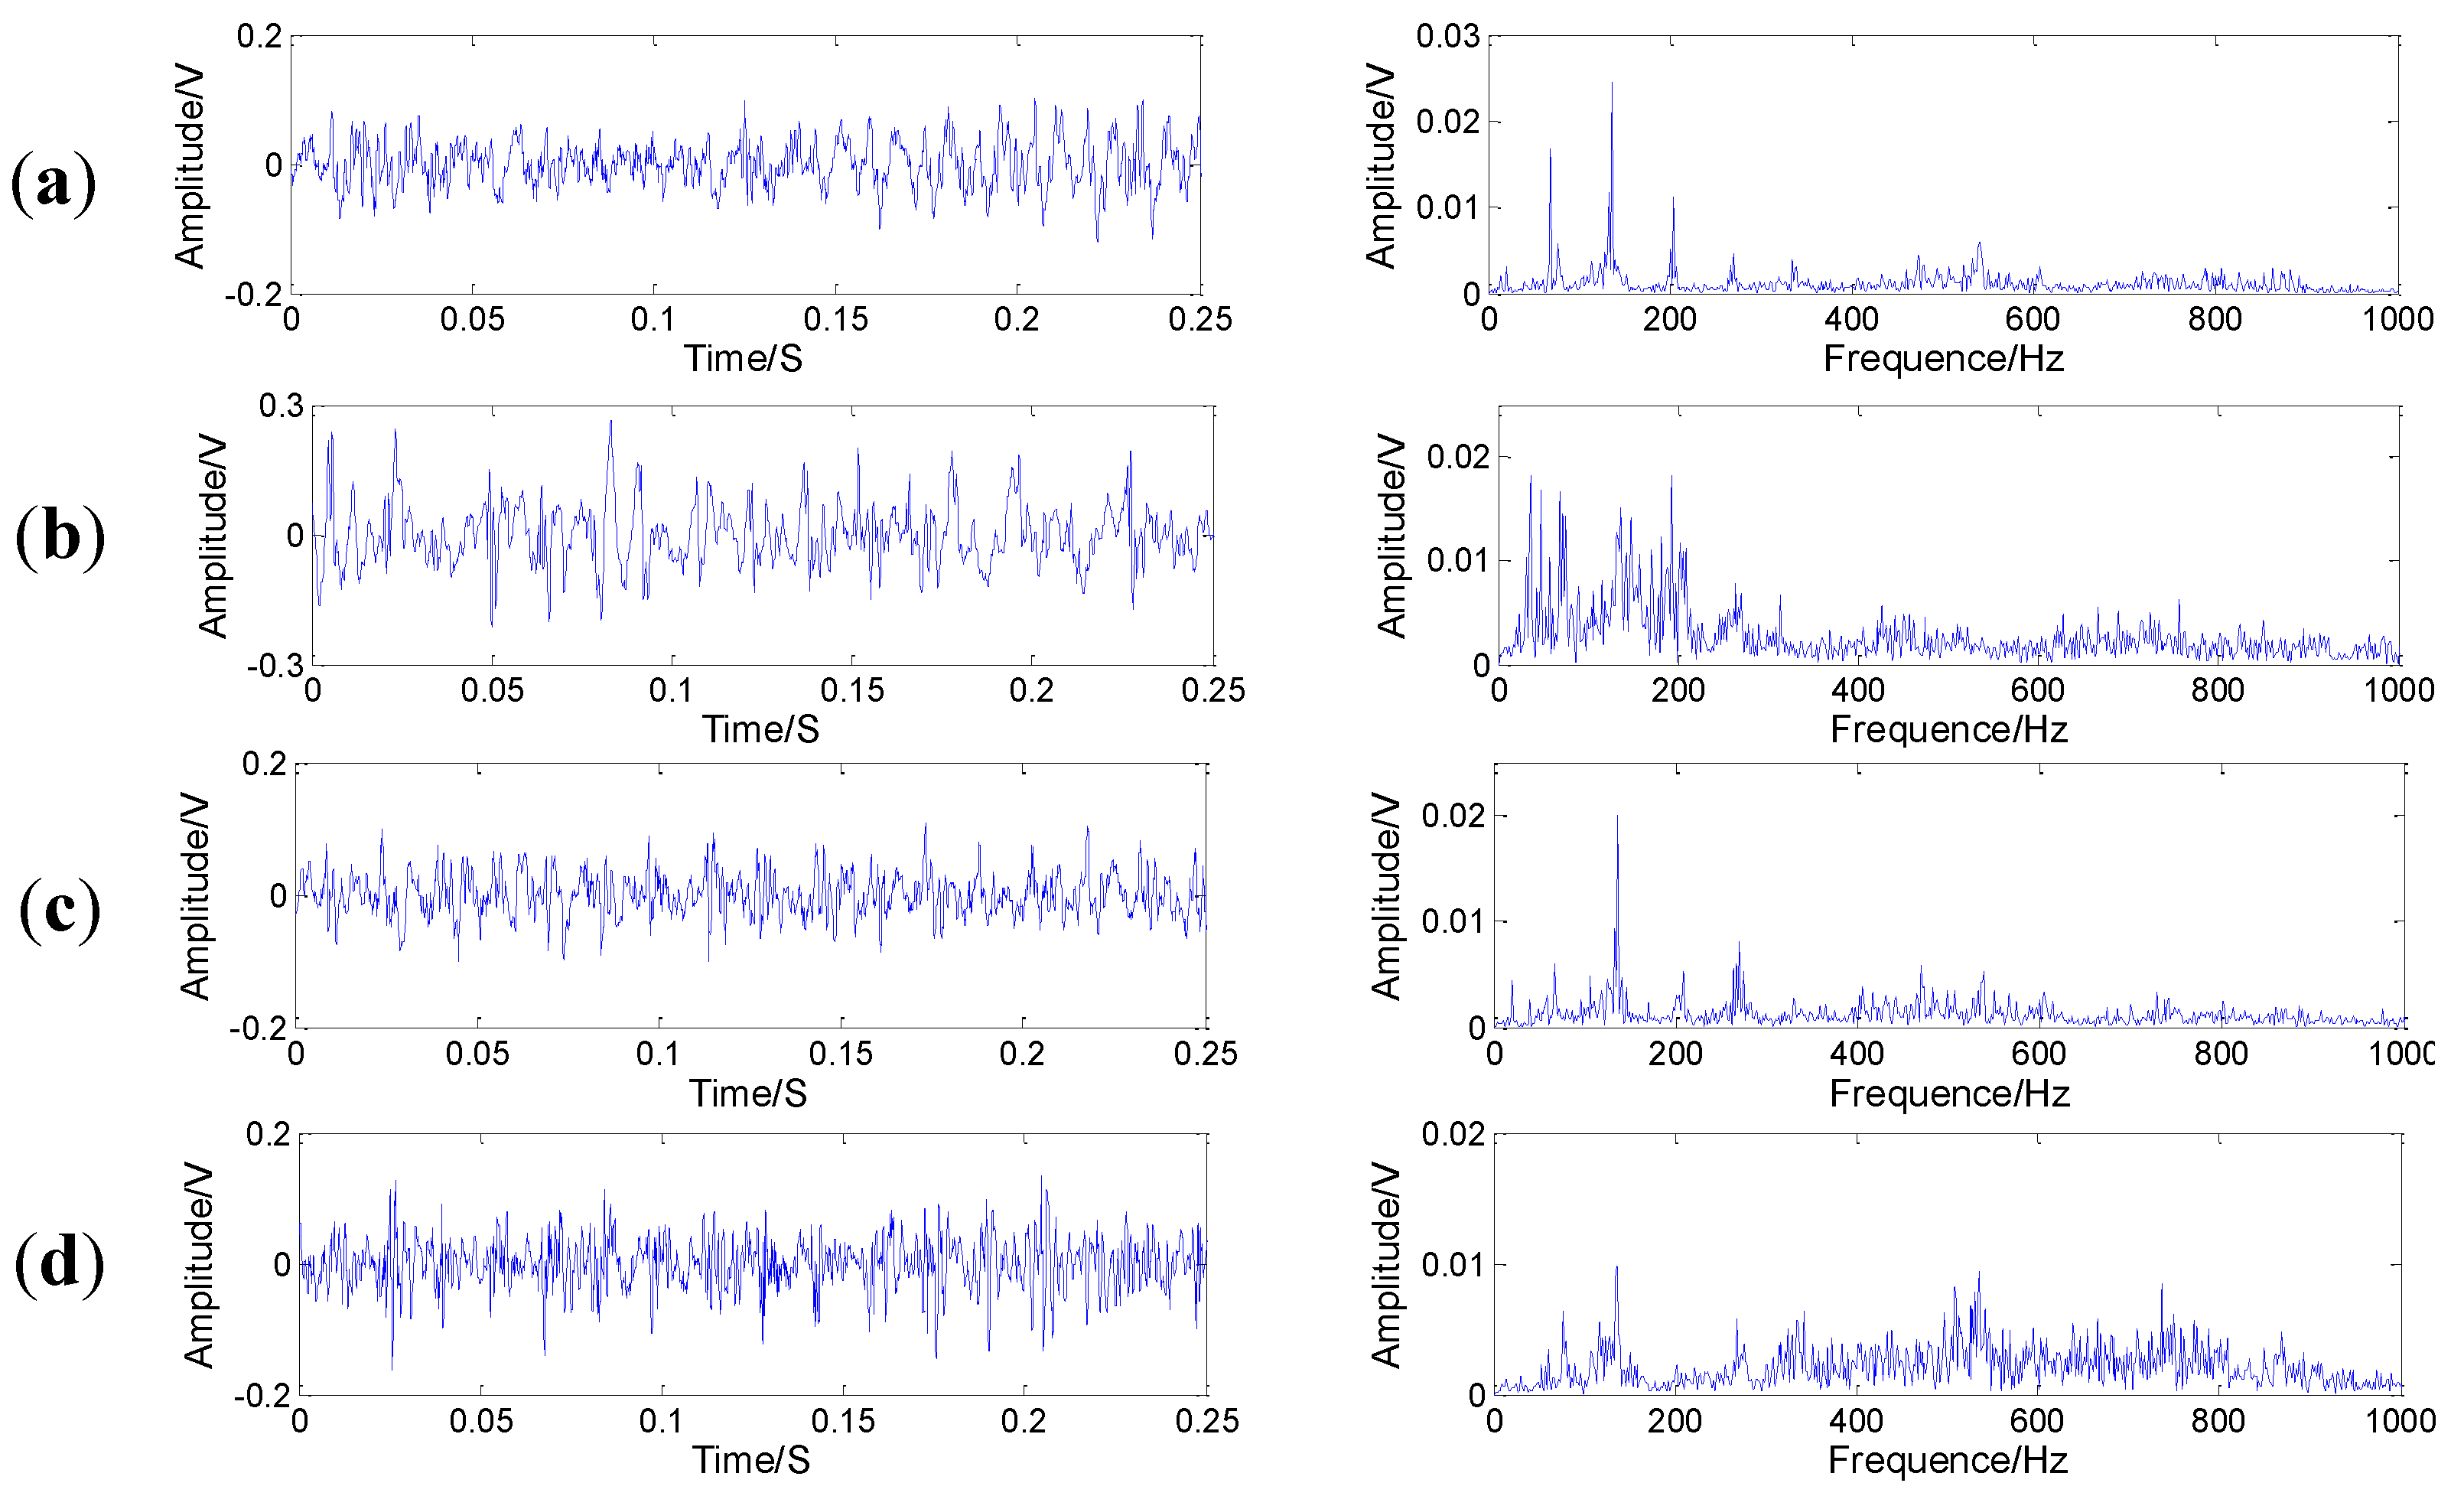
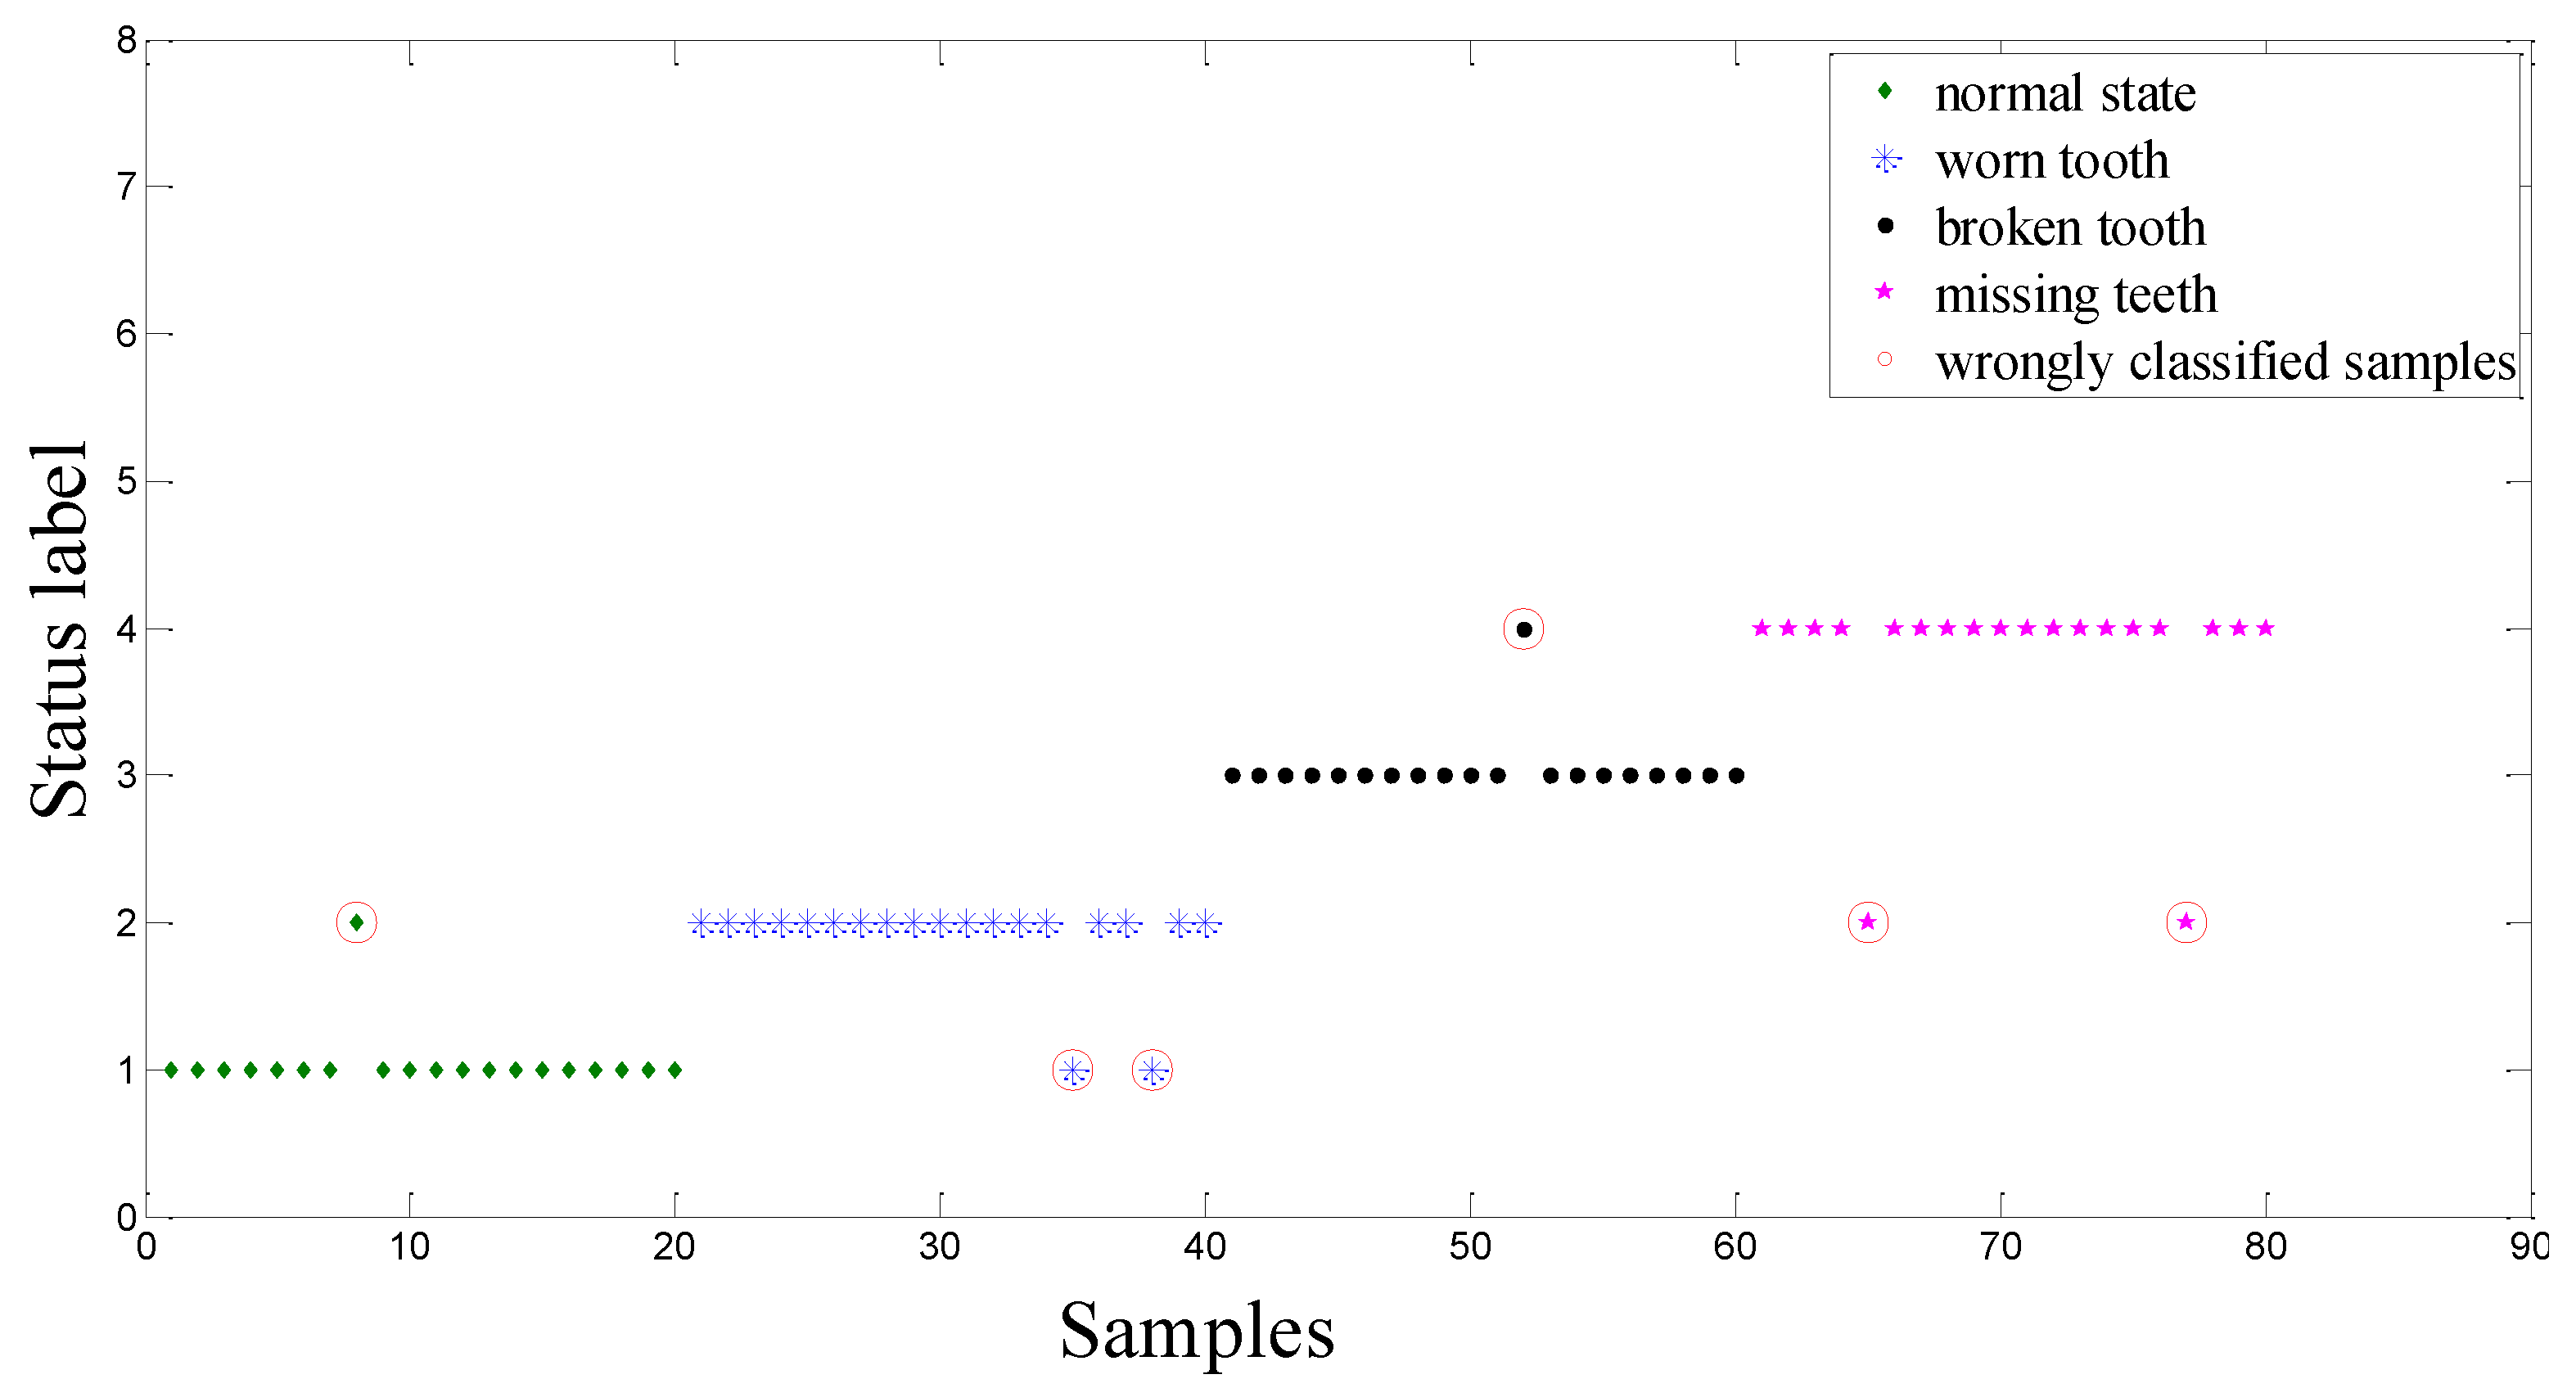
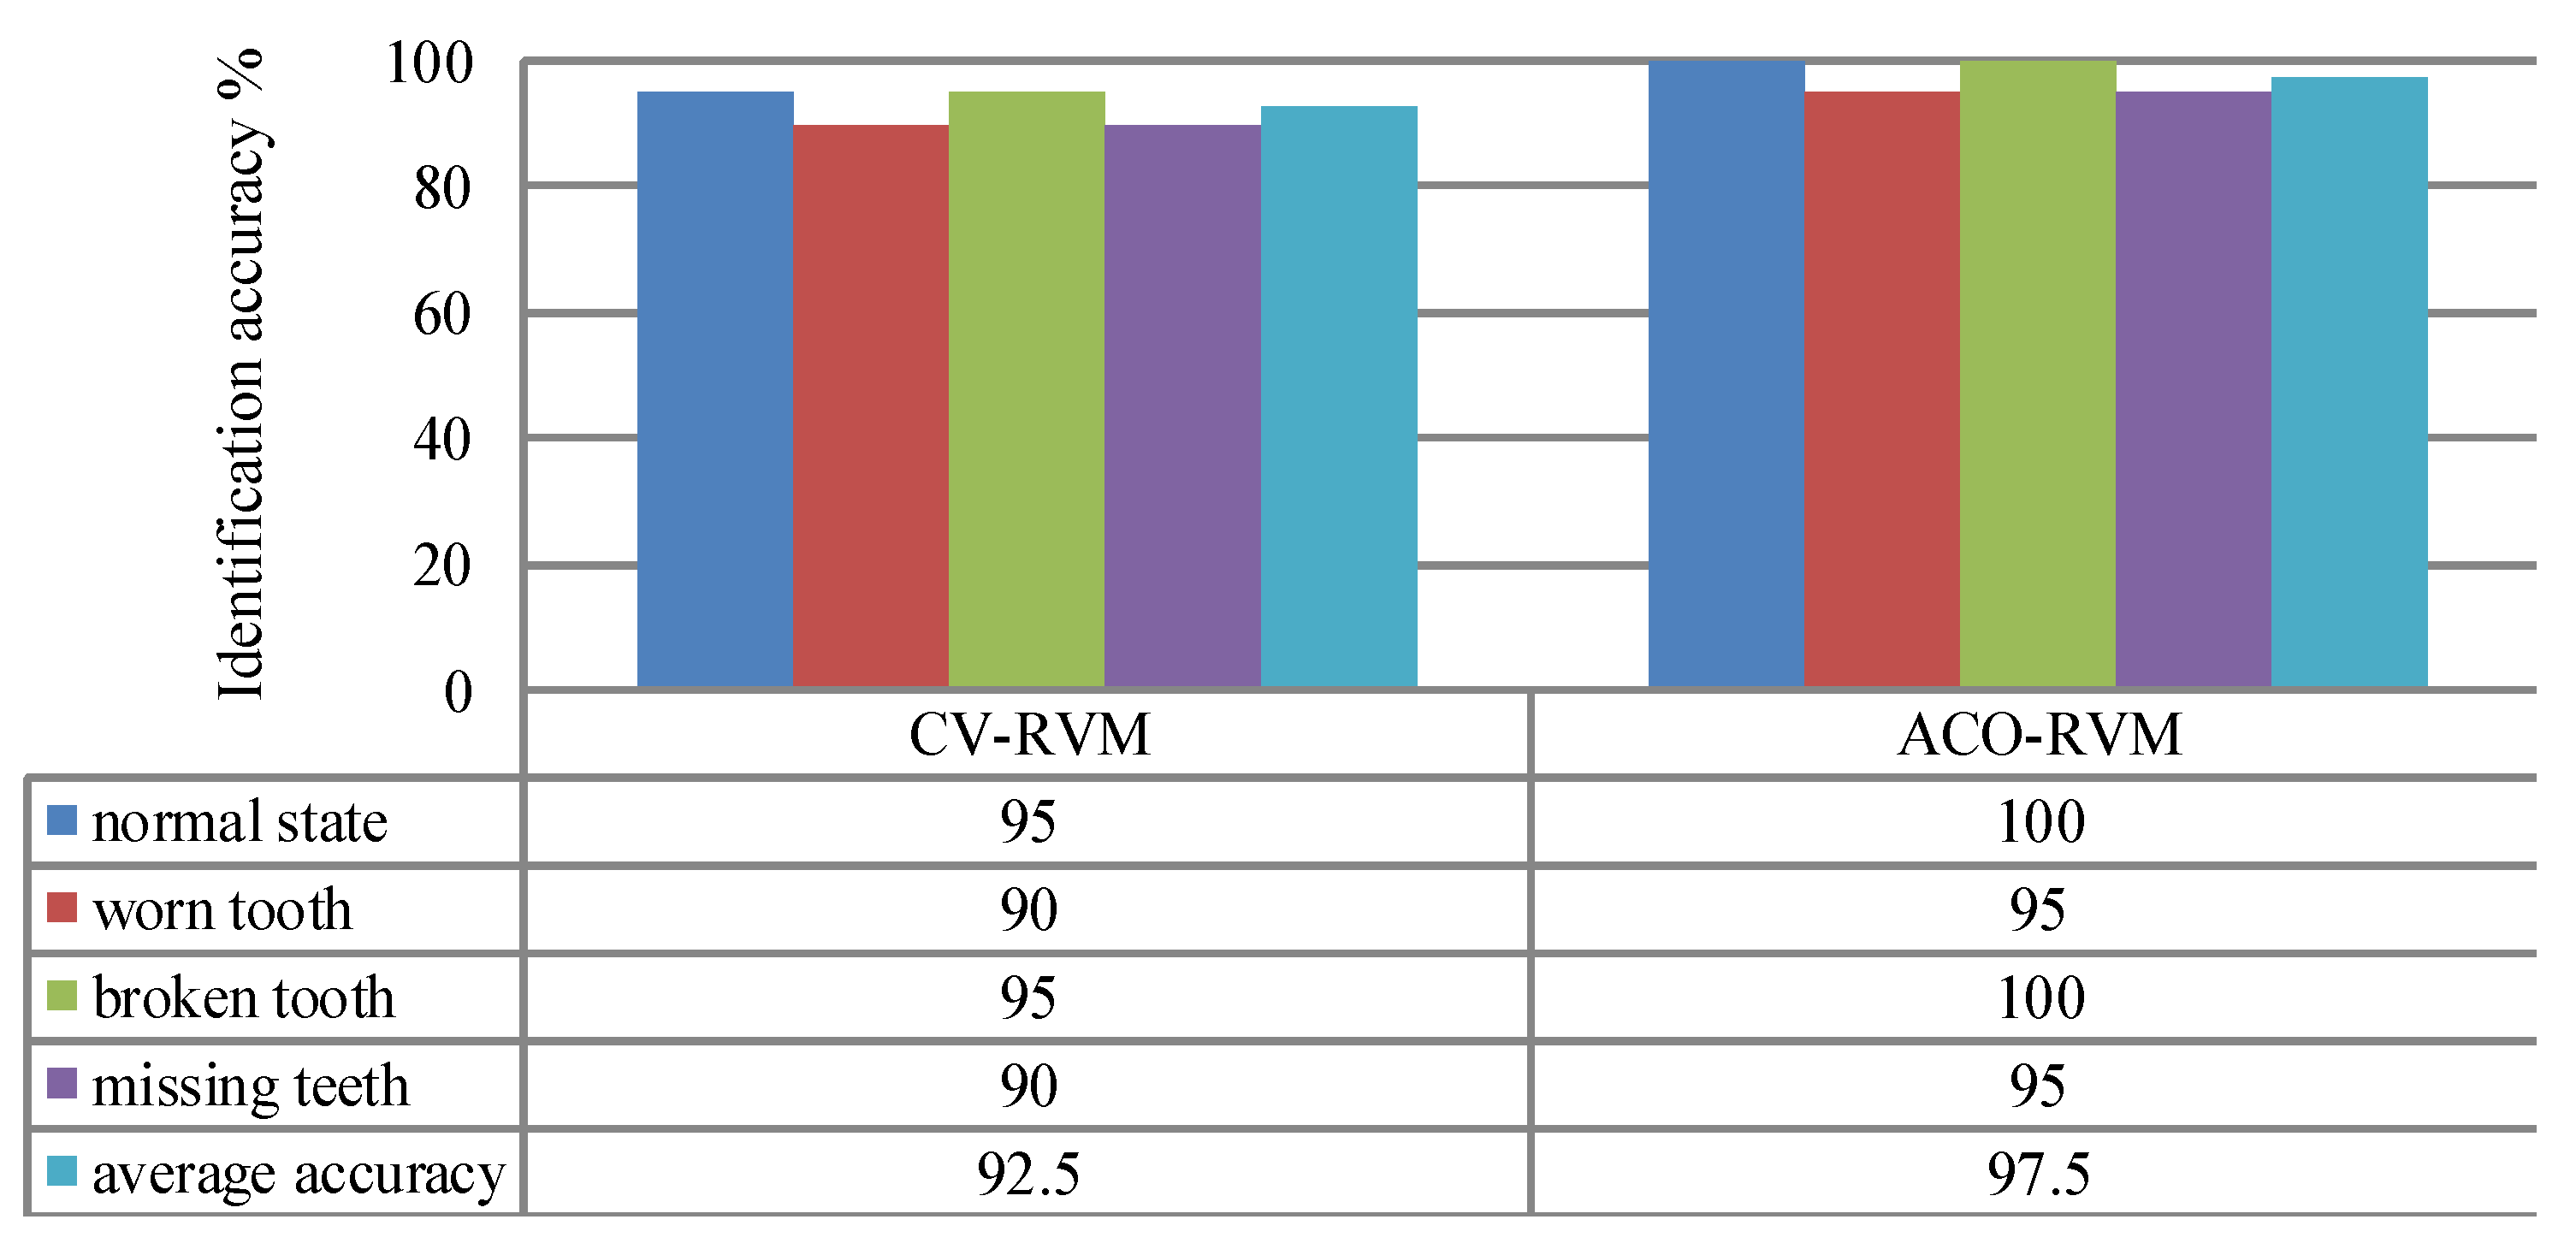
5.1.2. Experimental Results and Analysis


5.2. Case 2: Planetary Gearbox Fault Detection
5.2.1. Experimental Systems and Data Acquisition

| Material | Steel/Steel |
|---|---|
| Number of teeth on the sun gear (z) | 28 |
| Number of teeth on the planet gear (z) | 36 |
| Number of teeth on the ring gear (z) | 100 |
| Pressure angle (°) | 20 |
| Number of planet gear | 4 |
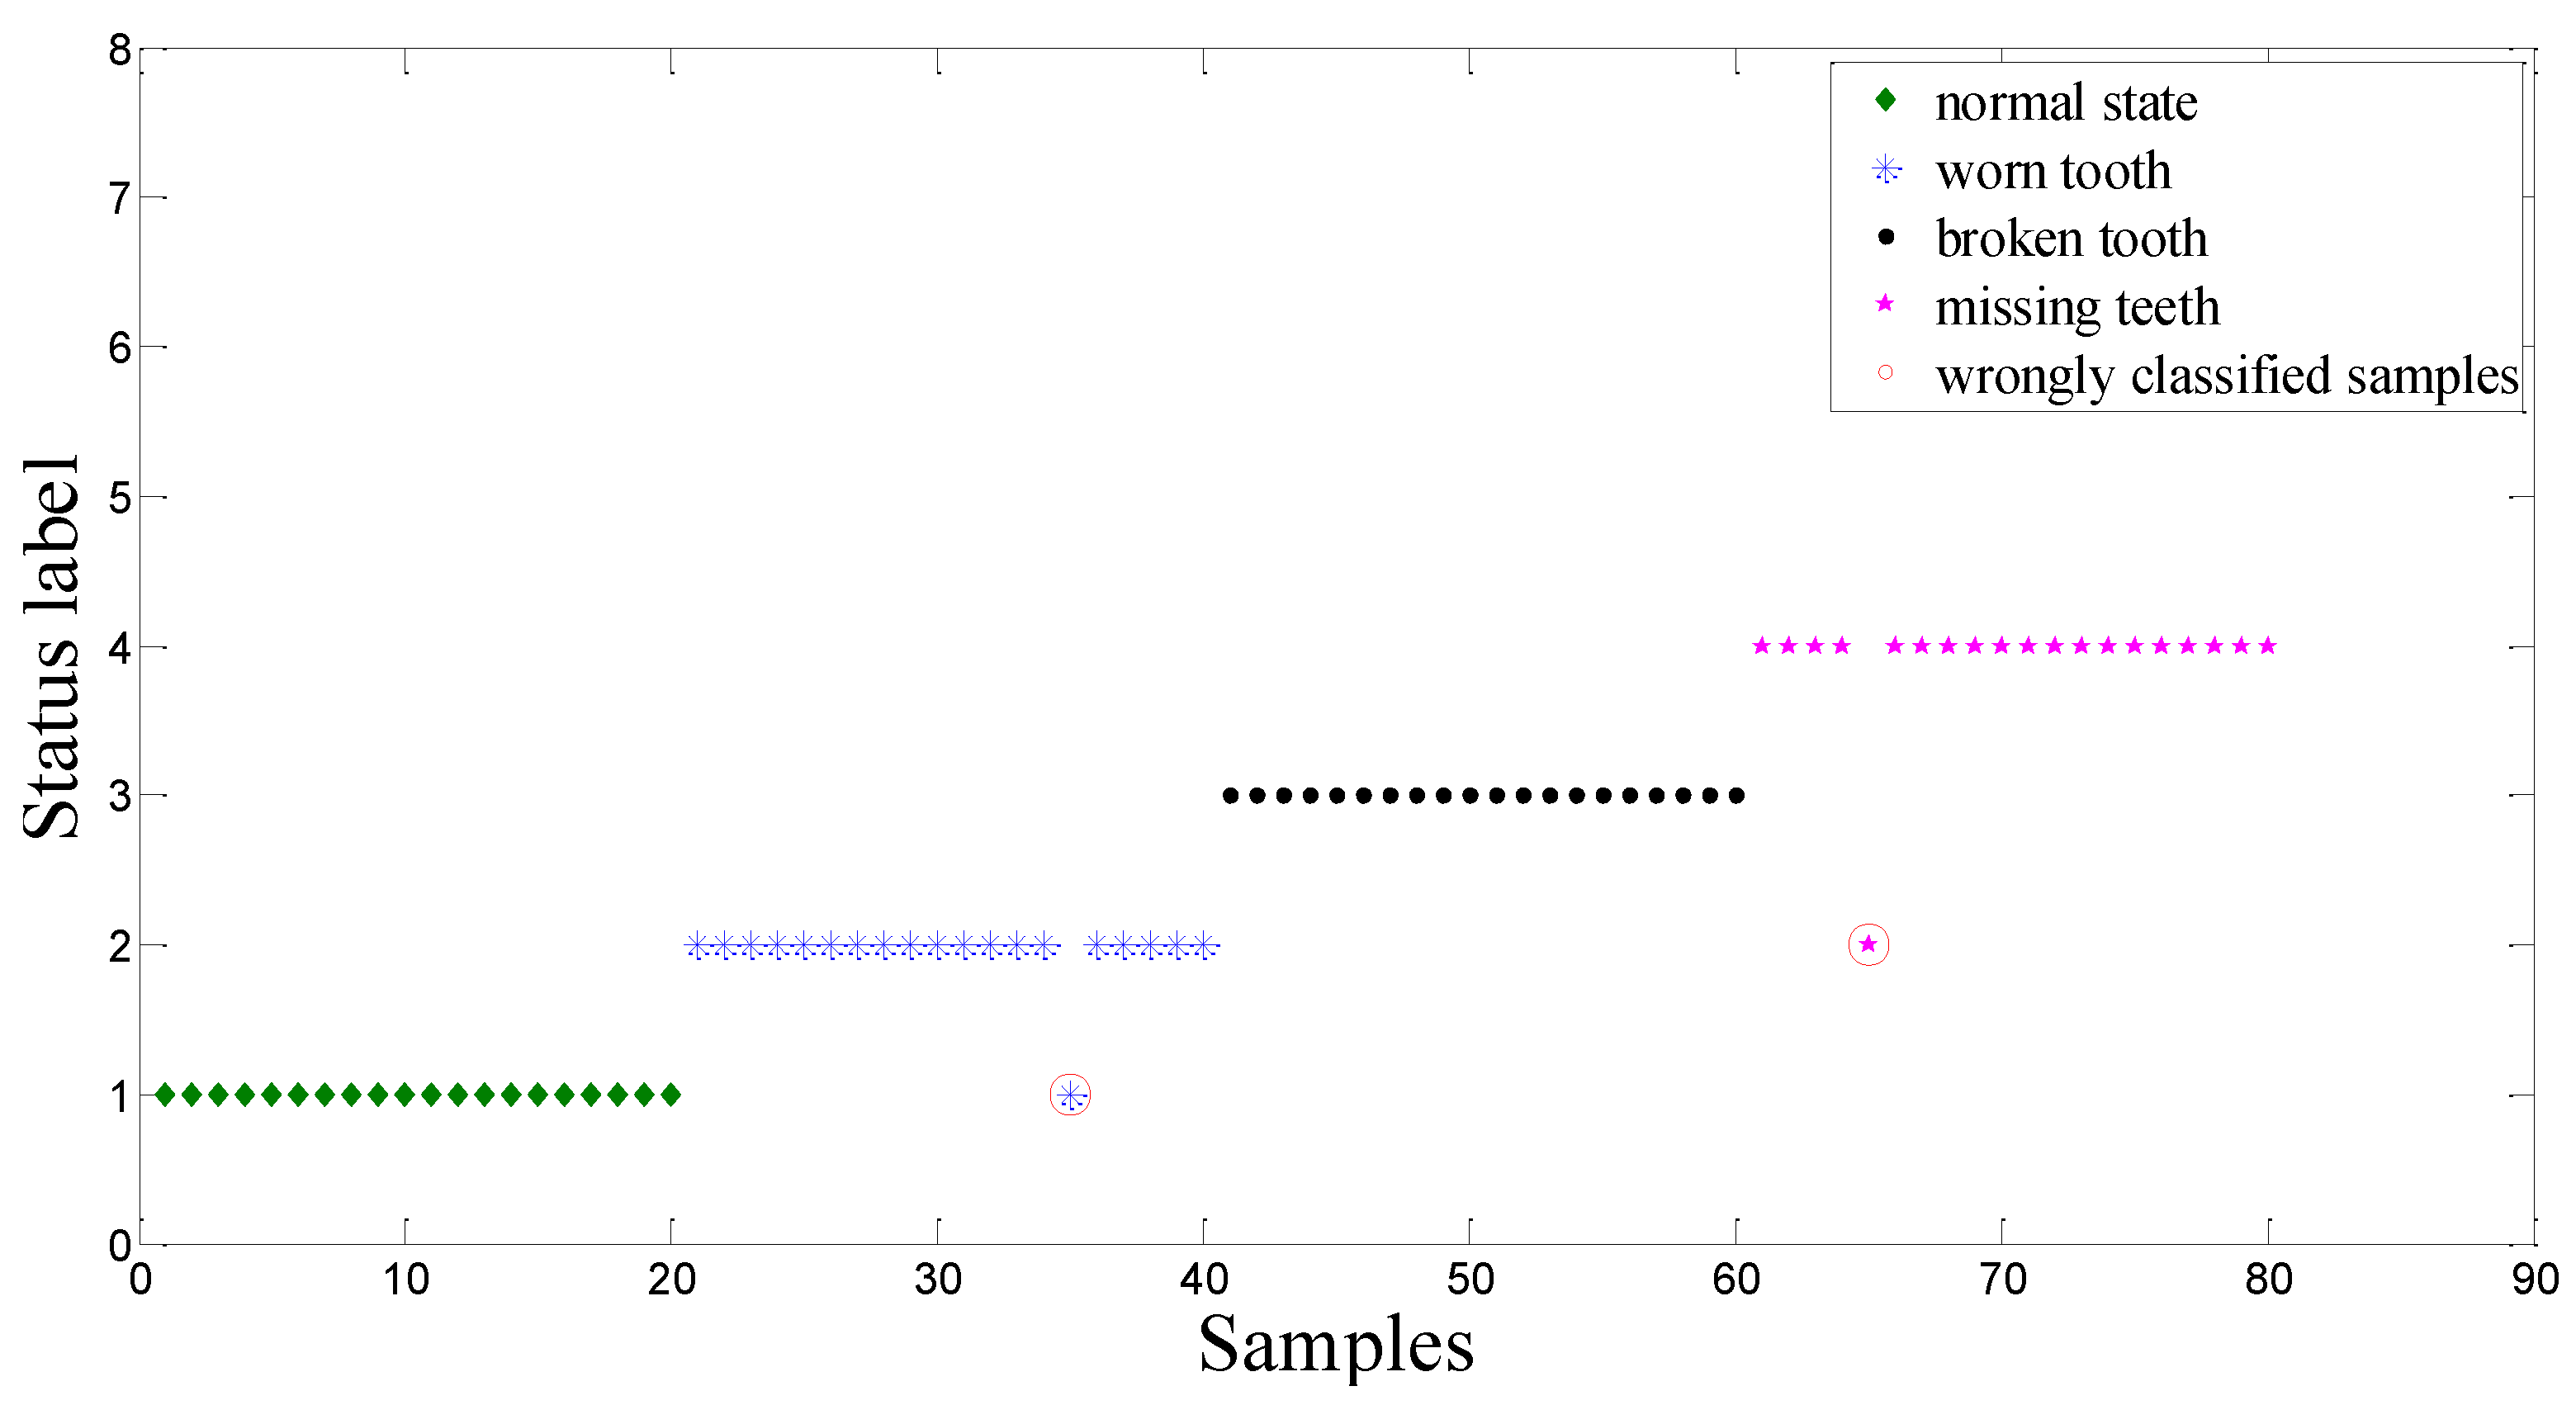
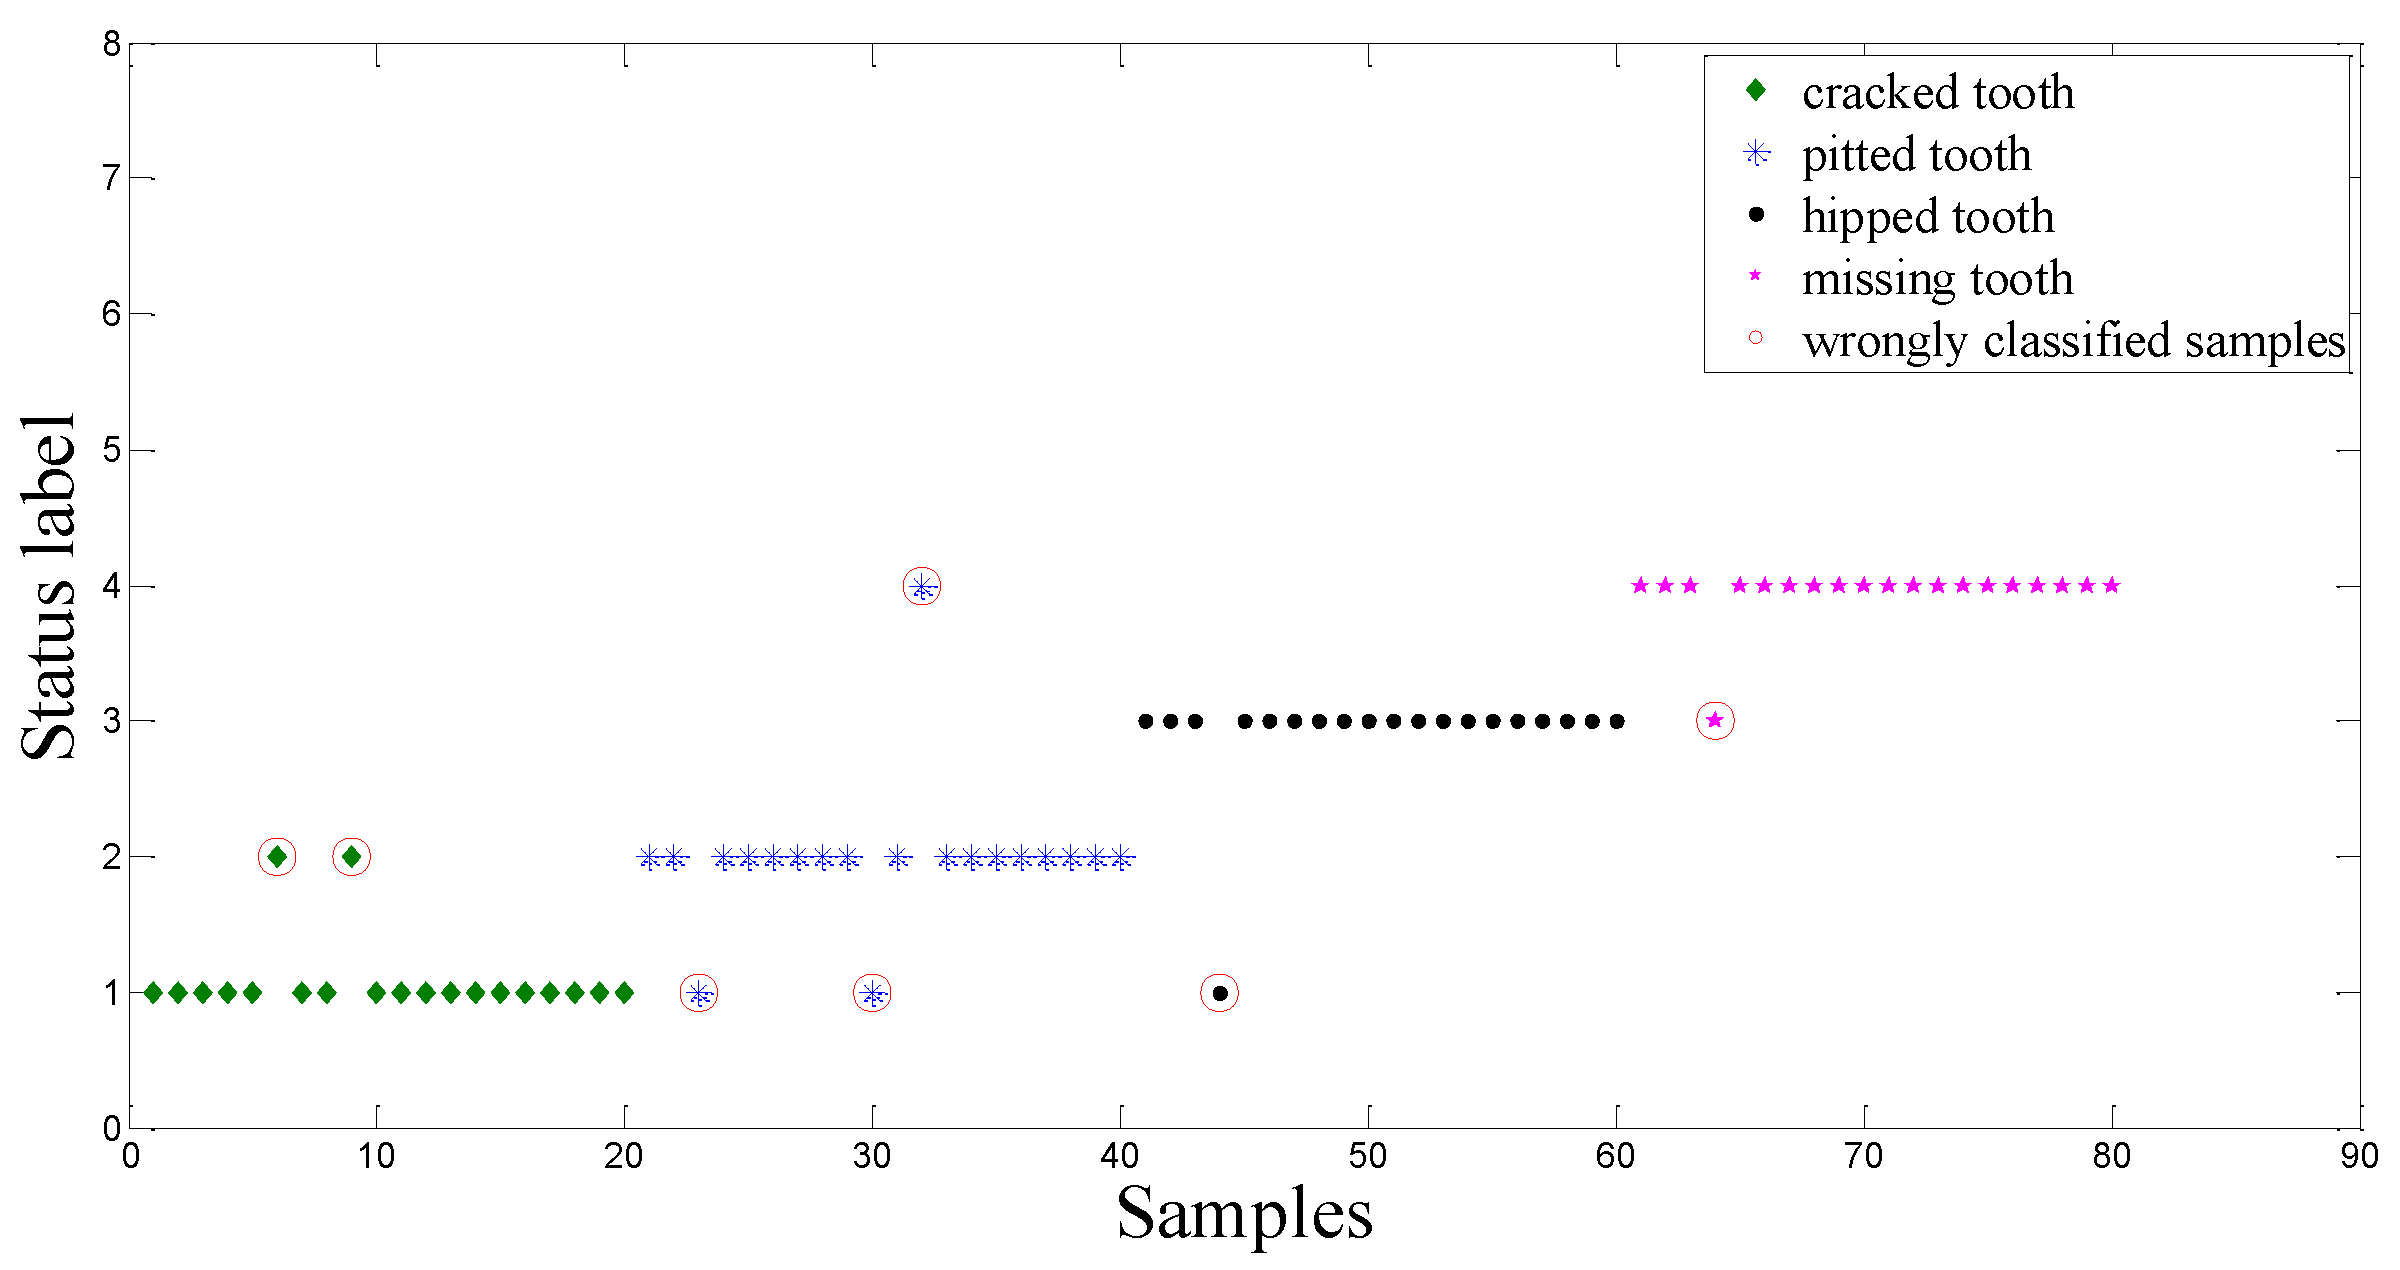
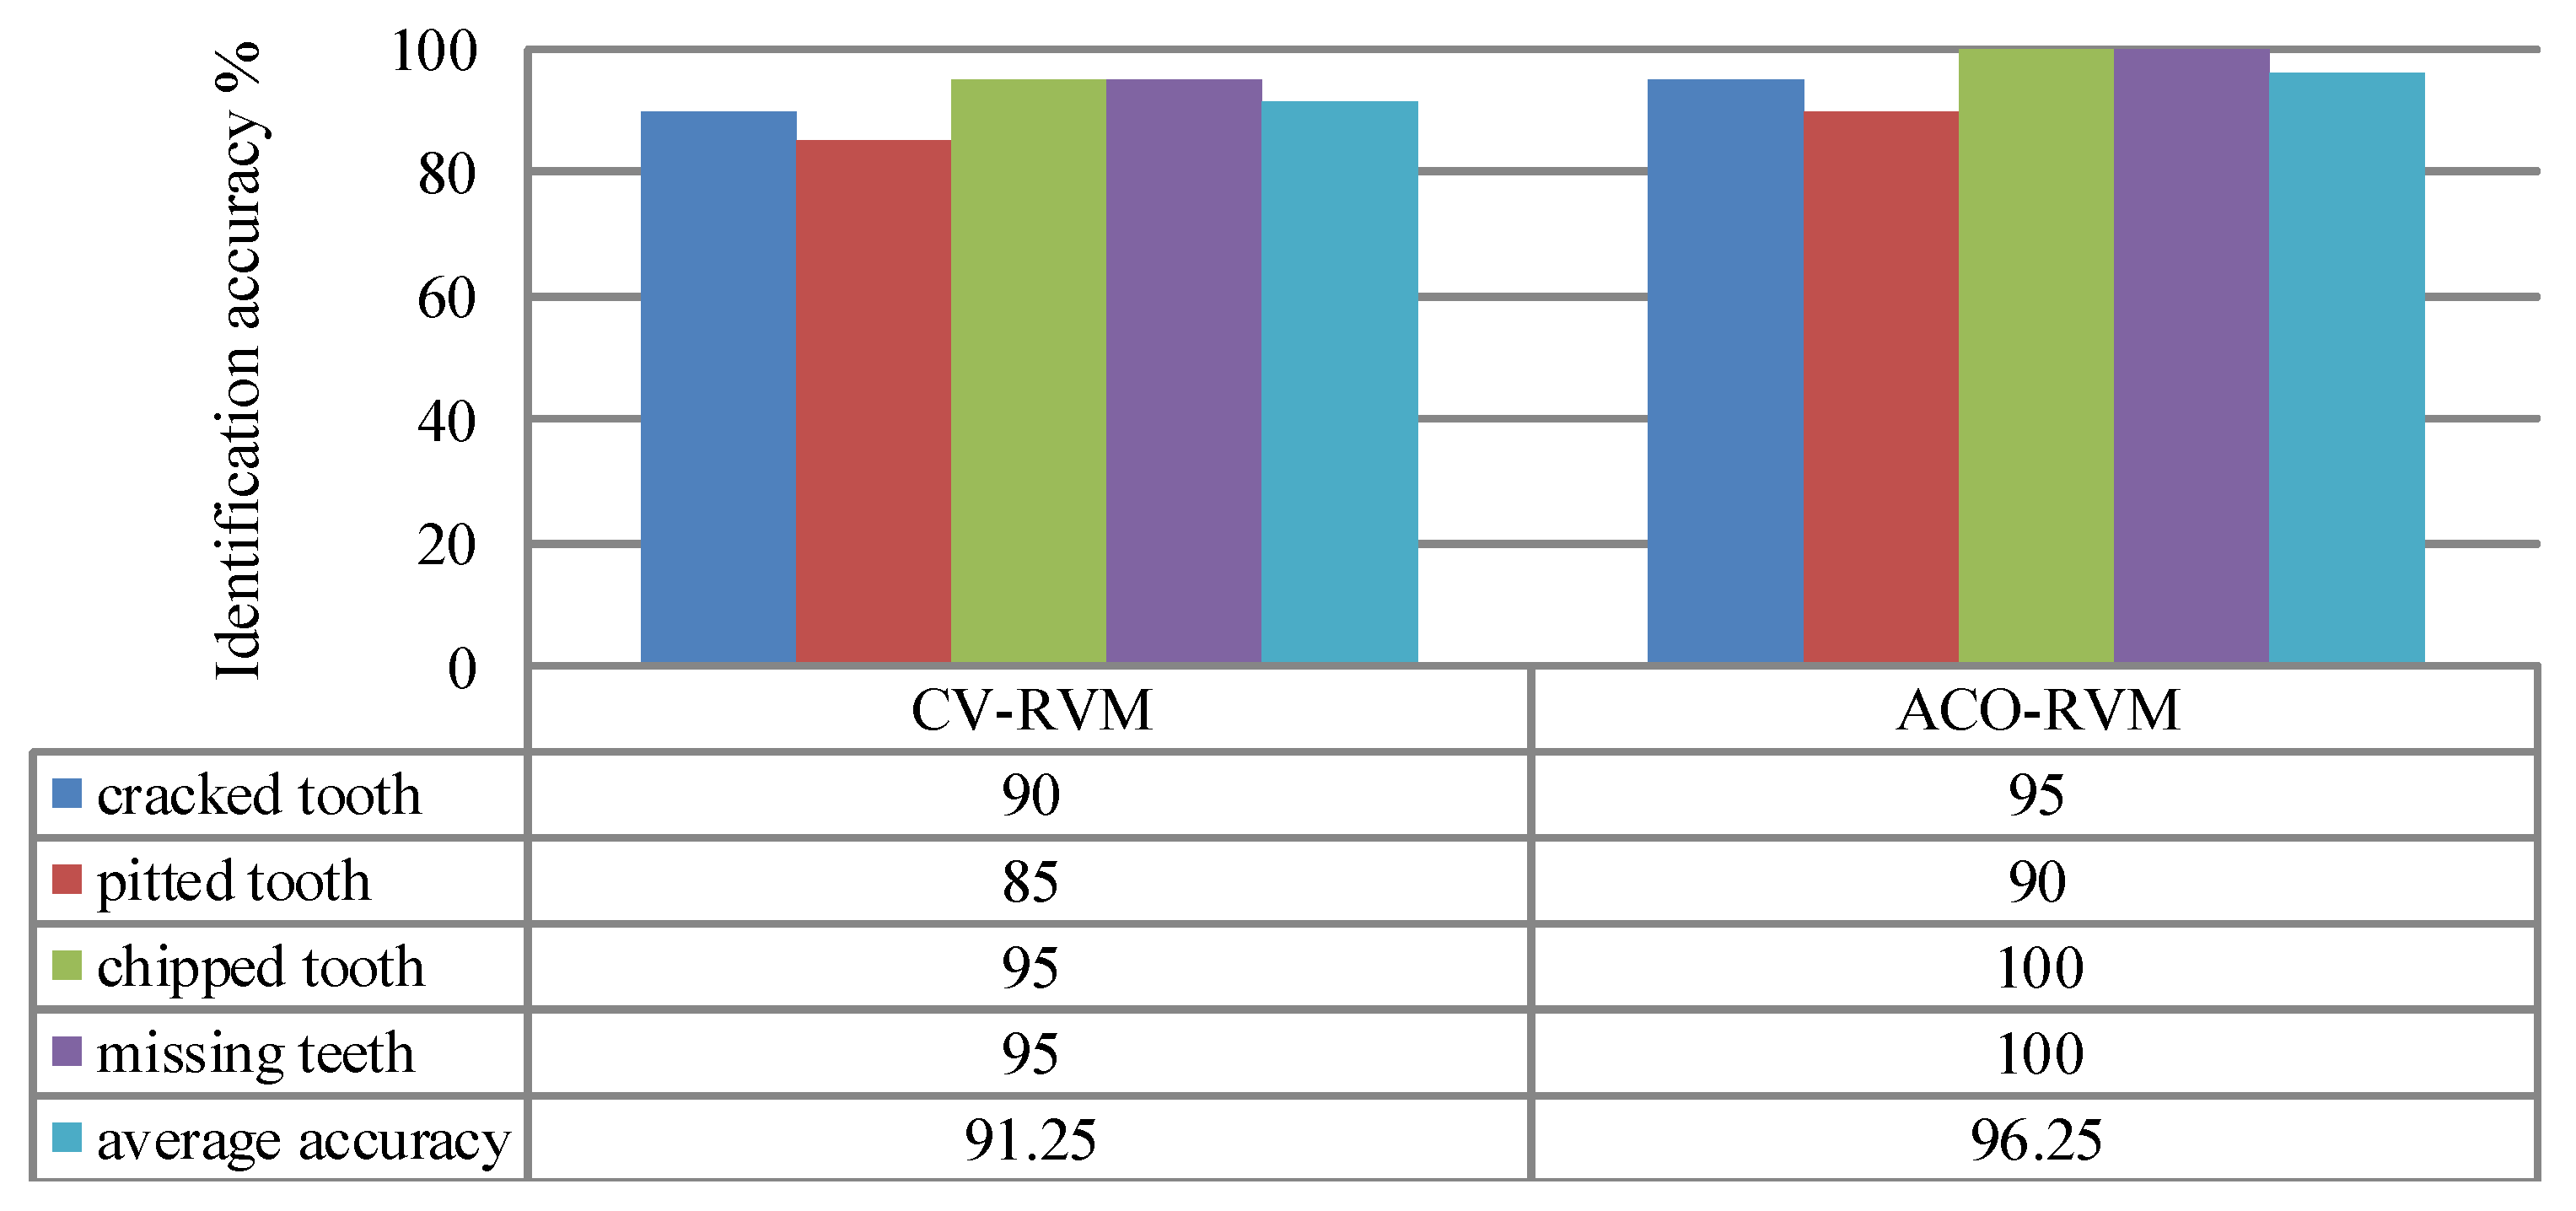
5.2.2. Experimental Results and Analysis


6. Conclusions
Acknowledgments
Author Contributions
Conflicts of Interest
References
- Li, Z.; Yan, X.; Yuan, C.; Peng, Z.; Li, L. Virtual prototype and experimental research on gear multi-fault diagnosis using wavelet autoregressive model and principal component analysis method. Mech. Syst. Signal Process. 2011, 25, 2589–2607. [Google Scholar] [CrossRef]
- Kar, C.; Mohanty, A.R. Gearbox health monitoring through multiresolution Fourier transform of vibration and current signals. Struct. Health Monit. 2006, 5, 195–200. [Google Scholar] [CrossRef]
- Luo, J.S.; Yu, D.J.; Liang, M. Application of multi-scale chirplet path pursuit and fractional Fourier transform for gear fault detection in speed up and speed-down processes. J. Sound Vib. 2012, 331, 4971–4986. [Google Scholar] [CrossRef]
- Byder, N.; Ball, A. Detection of gear failures via vibration and acoustics signals using wavelet transform. Mech. Syst. Signal Process. 2003, 17, 787–804. [Google Scholar] [CrossRef]
- Kar, C.; Mohanty, A.R. Monitoring gear vibrations through motor current signature analysis and wavelet transform. Mech. Syst. Signal Process. 2006, 20, 158–187. [Google Scholar] [CrossRef]
- Fan, X.F.; Zuo, M.J. Gearbox fault detection using Hilbert and wavelet packet transform. Mech. Syst. Signal Process. 2006, 20, 966–982. [Google Scholar] [CrossRef]
- Feng, Z.P.; Liang, M.; Zhang, Y.; Hou, S. Fault diagnosis for wind turbine planetary gearboxes via demodulation analysis based on ensemble empirical mode decomposition and energy separation. Renew. Energy 2012, 47, 112–126. [Google Scholar] [CrossRef]
- El-Koujok, M.; Benammar, M.; Meskin, N.; Al-Naemi, M.; Langari, R. Multiple sensor fault diagnosis by evolving data-driven approach. Inf. Sci. 2014, 259, 346–358. [Google Scholar] [CrossRef]
- Safizadeh, M.S.; Latifi, S.K. Using multi-sensor data fusion for vibration fault diagnosis of rolling element bearings by accelerometer and load cell. Inf. Fusion 2014, 18, 1–8. [Google Scholar] [CrossRef]
- Turlapaty, A.C.; Anantharaj, V.G.; Younan, N.H.; Turk, F.J. Precipitation data fusion using vector space transformation and artificial neural networks. Pattern Recognit. Lett. 2010, 31, 1184–1200. [Google Scholar] [CrossRef]
- Hou, Z.J.; Lian, Z.W.; Yao, Y.; Yuan, X. Cooling-load prediction by the combination of rough set theory and an artificial neural-network based on data-fusion technique. Appl. Energy 2006, 83, 1033–1046. [Google Scholar] [CrossRef]
- Kuo, R.J. Multi-sensor integration for on-line tool wear estimation through artificial neural networks and fuzzy neural network. Eng. Appl. Artif. Intell. 2000, 13, 249–261. [Google Scholar] [CrossRef]
- Chen, Y.M.; Huang, H.C. Fuzzy logic approach to multisensor data association. Math. Comput. Simul. 2000, 52, 399–412. [Google Scholar] [CrossRef]
- Ambrosio, P.; Mort, N. A hybrid Kalman filter-fuzzy logic architecture for multisensory data fusion. In Proceedings of the IEEE International Symposium on Intelligent Control (ISIC’01), Mexico City, Mexico, 5–7 September 2001; pp. 364–369.
- Banerjee, T.P.; Das, S. Multi-sensor data fusion using support vector machine for motor fault detection. Inf. Sci. 2012, 217, 96–107. [Google Scholar] [CrossRef]
- Samanta, B. Gear fault detection using artificial neural networks and support vector machines with genetic algorithms. Mech. Syst. Signal Process. 2004, 18, 625–644. [Google Scholar] [CrossRef]
- Mercer, J. Functions of positive and negative type and their connection with the theory of integral equation. Philos. Trans. R. Soc. London A 1999, 209, 415–446. [Google Scholar] [CrossRef]
- Tipping, M. Sparse Bayesian learning and the relevance vector machine. J. Mach. Learn. Res. 2001, 1, 211–244. [Google Scholar]
- Smola, A.; Schőlkhopf, B. A tutorial on support vector regression. Stat. Comput. 2004, 14, 199–222. [Google Scholar] [CrossRef]
- Schőlkhopf, B.; Smola, A.J. Learning with Kernels: Support Vector Machines, Regularization, Optimization, and Beyond; MIT Press: Cambridge, UK, 2002. [Google Scholar]
- Zhou, Y.; Zhao, H.; Pan, X.; Shang, Li. Deception detecting from speech signal using relevance vector machine and non-linear dynamics features. Neurocomputing 2015, 151, 1042–1052. [Google Scholar] [CrossRef]
- Lei, Y.G.; Liu, Z.Y.; Wu, X.H. Health condition identification of multi-stage planetary gearboxes using a mRVM-based method. Mechan. Syst. Signal Process. 2015, 60, 289–300. [Google Scholar] [CrossRef]
- Achmad, W.; Bo-Suk, Y. Application of relevance vector machine and survival probability to machine degradation assessment. Expert Syst. Appl. 2011, 38, 2592–2599. [Google Scholar]
- Yan, J.; Liu, Y.Q.; Han, S.; Liu, M. Wind power grouping forecasts and its uncertainty analysis using optimized relevance vector machine. Renew. Sustain. Energy Rev. 2013, 27, 613–621. [Google Scholar] [CrossRef]
- Dorigo, M.; Maniezzo, V.; Colorni, A. Ant system: optimization by a colony of cooperating agents. IEEE Trans. SMC Part B 1996, 26, 29–41. [Google Scholar] [CrossRef] [PubMed]
- Mackay, D.J.C. The evidence framework applied to classification networks. Neural Comput. 1992, 4, 720–736. [Google Scholar] [CrossRef]
- Zhang, X.L.; Chen, X.F.; He, Z.J. An ACO-based algorithm for parameter optimization of support vector machines. Expert Syst. Appl. 2010, 37, 6618–6628. [Google Scholar] [CrossRef]
- Lei, Y.G.; Lin, J.; He, Z.J.; Zuo, J. A review on empirical mode decomposition in fault diagnosis of rotating machinery. Mech. Syst. Signal Process. 2013, 35, 108–126. [Google Scholar] [CrossRef]
- Multi-fault classification based on wavelet SVM with PSO algorithm to analyze vibration signals from rolling element bearings. Neurocomputing 2013, 99, 399–410.
- Yang, B.S.; Han, T.; An, J.L. ART-KOHONEN neural network for fault diagnosis of rotating machinery. Mech. Syst. Signal Process. 2004, 18, 645–657. [Google Scholar] [CrossRef]
- Chaari, F.; Fakhfakh, T.; Haddar, M. Dynamic analysis of a planetary gear failure caused by tooth pitting and cracking. J. Fail. Anal. Prev. 2006, 6, 73–78. [Google Scholar] [CrossRef]
© 2015 by the authors; licensee MDPI, Basel, Switzerland. This article is an open access article distributed under the terms and conditions of the Creative Commons Attribution license (http://creativecommons.org/licenses/by/4.0/).
Share and Cite
Liu, Z.; Guo, W.; Tang, Z.; Chen, Y. Multi-Sensor Data Fusion Using a Relevance Vector Machine Based on an Ant Colony for Gearbox Fault Detection. Sensors 2015, 15, 21857-21875. https://doi.org/10.3390/s150921857
Liu Z, Guo W, Tang Z, Chen Y. Multi-Sensor Data Fusion Using a Relevance Vector Machine Based on an Ant Colony for Gearbox Fault Detection. Sensors. 2015; 15(9):21857-21875. https://doi.org/10.3390/s150921857
Chicago/Turabian StyleLiu, Zhiwen, Wei Guo, Zhangchun Tang, and Yongqiang Chen. 2015. "Multi-Sensor Data Fusion Using a Relevance Vector Machine Based on an Ant Colony for Gearbox Fault Detection" Sensors 15, no. 9: 21857-21875. https://doi.org/10.3390/s150921857
APA StyleLiu, Z., Guo, W., Tang, Z., & Chen, Y. (2015). Multi-Sensor Data Fusion Using a Relevance Vector Machine Based on an Ant Colony for Gearbox Fault Detection. Sensors, 15(9), 21857-21875. https://doi.org/10.3390/s150921857