1. Introduction
To help cope with the rapid increase in the human population and future demands on worldwide food security, automation in agriculture is necessary. For example, there is a need to develop automatic systems for plant enumeration in fruit and nut tree seedling crops to save human resources and improve yield estimation. Most sensors used in agriculture have limited resolution, and cannot acquire the full scope of available plant and soil information. Advanced sensors, like cameras, that can characterize spatial and color information of natural objects play a crucial role in the future development of agricultural automation [
1,
2,
3].
In the fruit and nut tree nursery industry, accurate counts of tree seedlings are very important in their production management and commerce [
4,
5]. Disease resistant tree rootstocks are planted from seeds in an outdoor nursery and they are later grafted to have fruit, which is a different cultivar from the disease resistant cultivar of the root system (
i.e., to combine the best features of two cultivars). Variability in germination rate and consumption by birds create uncertainty in the number of marketable seedlings available for sale. Traditionally, human workers must manually count the seedlings each spring after they have grown large enough to be safe from the birds and the final crop stand is stable. This method is slow, tedious, and costly for workers to perform. Additionally, while this method can be accurate when carefully conducted, in practice, human error and bias are still present and can lower the accuracy of the final count, particularly when workers get fatigued or distracted.
Recently, methods for plant population and spacing measurement using machine vision have been introduced for different kinds of plants. A daylight sensing system is presented in [
4] to measure early growth stage corn populations. The algorithms used in the system include steps for image sequencing to merge information between consecutive video frames, vegetation segmentation using a truncated ellipsoidal decision surface and a Bayesian classifier, and plant counting based on the total number of plant pixels and their median positions. The image sequencing step in this study does not consider the case of a camera perspective change, however. In [
5], algorithms for automatically measuring corn plant spacing at early growth stages are introduced. Plant morphological features, plant color, and the crop row centerline are among multiple sources of information utilized by the algorithms for corn plant detection and localization. This work points out that the estimated interplant spacing errors are due to crop damage and sampling platform vibration, which caused mosaicking errors. A machine vision-based corn plant spacing and population measurement system is presented in [
6]. Algorithm steps in this paper include image sequencing using SIFT (Scale Invariant Feature Transform) feature matching, vegetation segmentation based on color channels, corn plant center detection using a skeletonizing algorithm, and calculation of corn spacing and plant count. This algorithm yields satisfactory results with images captured from the top view. In [
7], we had proposed a mobile platform that utilizes active optical sensing devices (LIDAR and light curtain transmission) to detect, localize, and classify trees. Promising results in our recent work helped system designers select the most reliable sensor for accurate detection of trees in a nursery and to automate labor-intensive tasks, such as weeding, without damaging crops.
In recent years, high-resolution remote-sensing techniques have been utilized in agricultural automation for counting mature trees. An automatic approach for counting olive trees is introduced in [
8] with very high spatial remote sensing images. This approach contains two main steps: The olive trees are first isolated from other objects in the image based on a Gaussian process classifier with different morphological and textural features; candidate blobs of olive trees are then considered valid if their sizes are in a range specified by a prior knowledge of the real size of trees. In [
9], a method for counting palm trees in Unmanned Aerial Vehicles (UAV) images is presented. To detect palm trees, SIFT keypoints are extracted from the images, and then analyzed by an Extreme Learning Machine (ELM) classifier. The ELM classifier uses prior knowledge trained on palm and non-palm keypoints. The output of this step is a list of palm keypoints that are then merged using an active contour method to produce the shape of each tree. Local binary patterns are used to distinguish palm trees from other objects based on their shapes. A general image processing method for counting any tree in high-resolution satellite images is described in [
10]. Steps used in this method include HSI (hue, saturation, intensity) color space transform of the original image, image smoothing, thresholding of the extracted hue image, histogram equalization for HSI channels, candidate region detection, delineation, and tree counting.
This paper presents an uncalibrated camera system for fast and accurate plant counting in an outdoor field and incorporates a single high quality camera, an embedded microcontroller to automate the image capturing process, and a computer vision algorithm. The algorithm includes the steps of orthographic plant projection based on a perspective transform, plant segmentation using excessive green, plant detection by utilizing projection histograms, and plant counting that compensates for overlapping areas between consecutive images (to avoid double-counting). Both the camera and microcontroller were mounted on an ATV (all-terrain vehicle) and the images were analyzed offline.
Compared to previously described systems, the advantages of the proposed system are: It is easy to setup without requiring any camera calibration, it is robust to shadows in the background (e.g., soil, plant residue, and plants in other rows) and, among the target plants, it powerfully copes with noise and foliage occlusion, and is suited for use on a mobile vehicle in the field where row paths are rough and camera vibration common. The ATV platform was used in this paper to simulate the normal orchard tractors that the system was designed to be mount on. The objective was to have a system that can be mounted on a tractor and the counting done as part of the existing field operations. The most compatible existing operation is the fertilization step that is done at the same time as the counting.
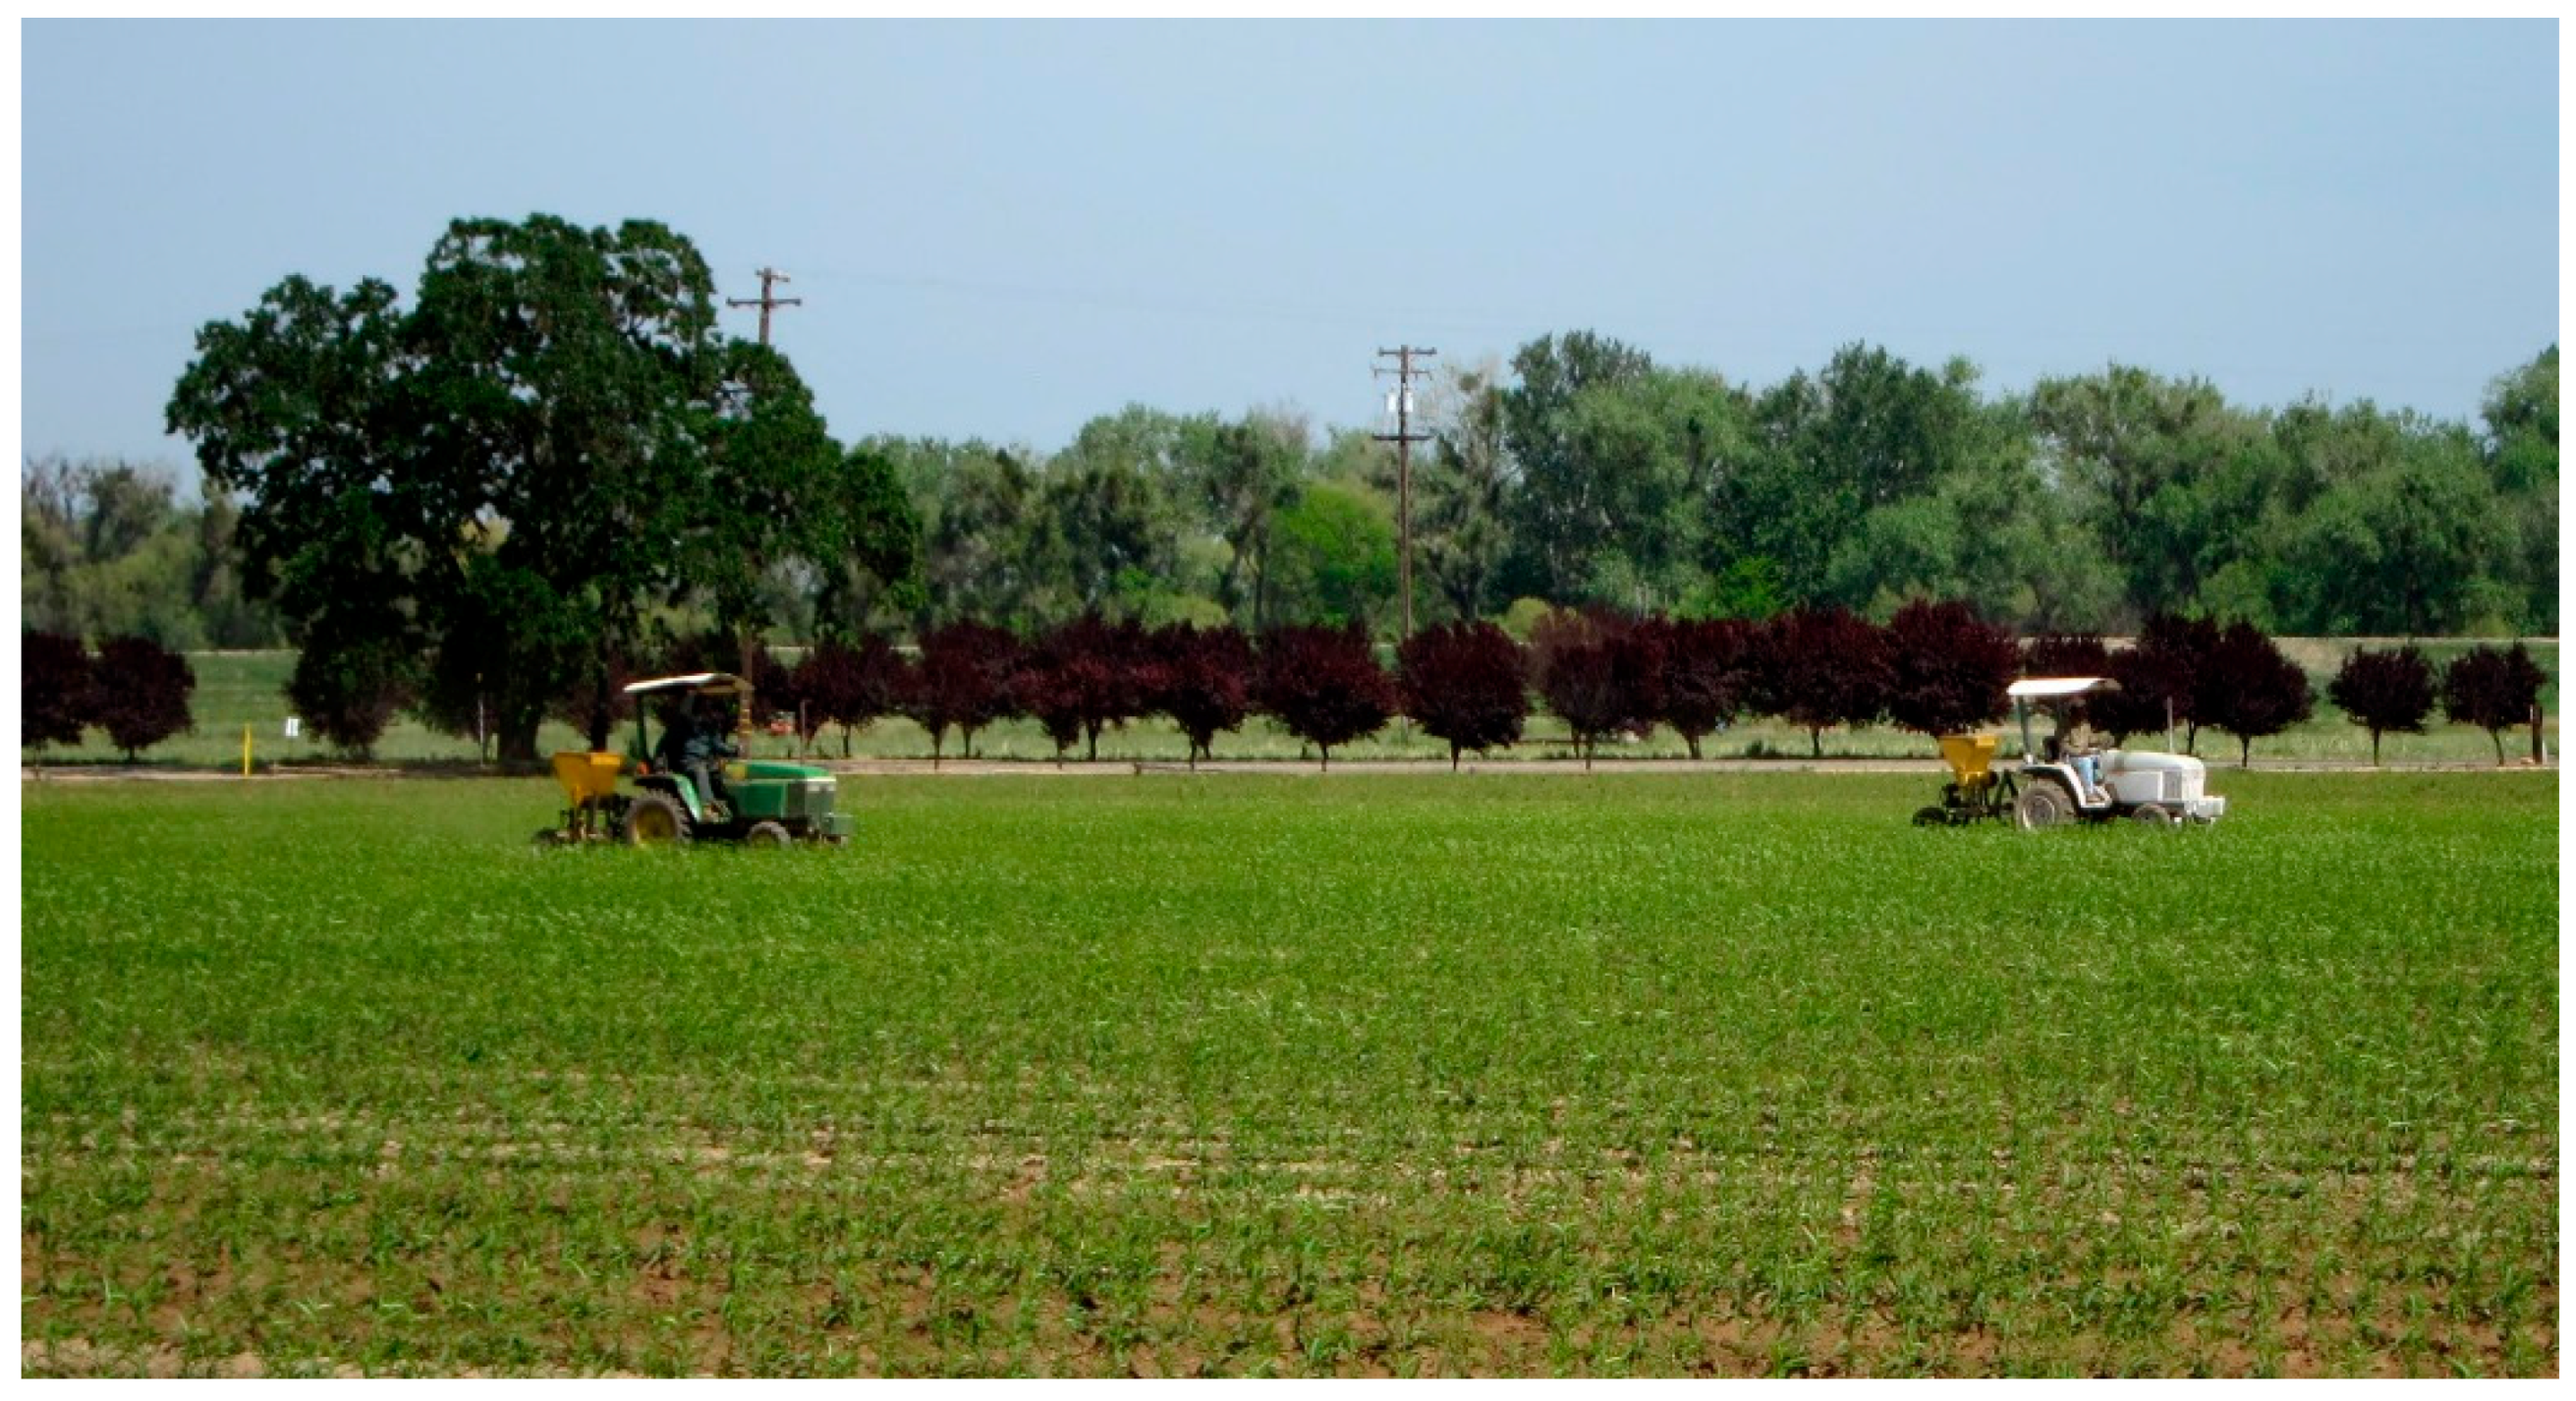
Figure 1 shows two small tractors performing the fertilization step at the same time as plant counting. This step is compatible because the tractors travel each row and are generating minimal dust. It is also the main argument against a single purpose UAV because by adding a machine vision module onto the front of the tractor shown in
Figure 1, we can also count plants in an existing trip of a ground vehicle that is traveling each row.
This paper is organized as follows: In
Section 2, we describe the system design and the proposed algorithm. The algorithm is detailed in
Section 3 and
Section 4 for plant counting for a single image and on an image sequence, respectively.
Section 5 presents the experimental results of the system. Finally, this paper draws to a conclusion and discusses future work in
Section 6 and
Section 7, respectively.
Figure 1.
Tractors are performing the fertilization step at the same time as the counting, at Sierra Gold Nurseries, CA, USA.
Figure 1.
Tractors are performing the fertilization step at the same time as the counting, at Sierra Gold Nurseries, CA, USA.
2. System Design and Algorithms
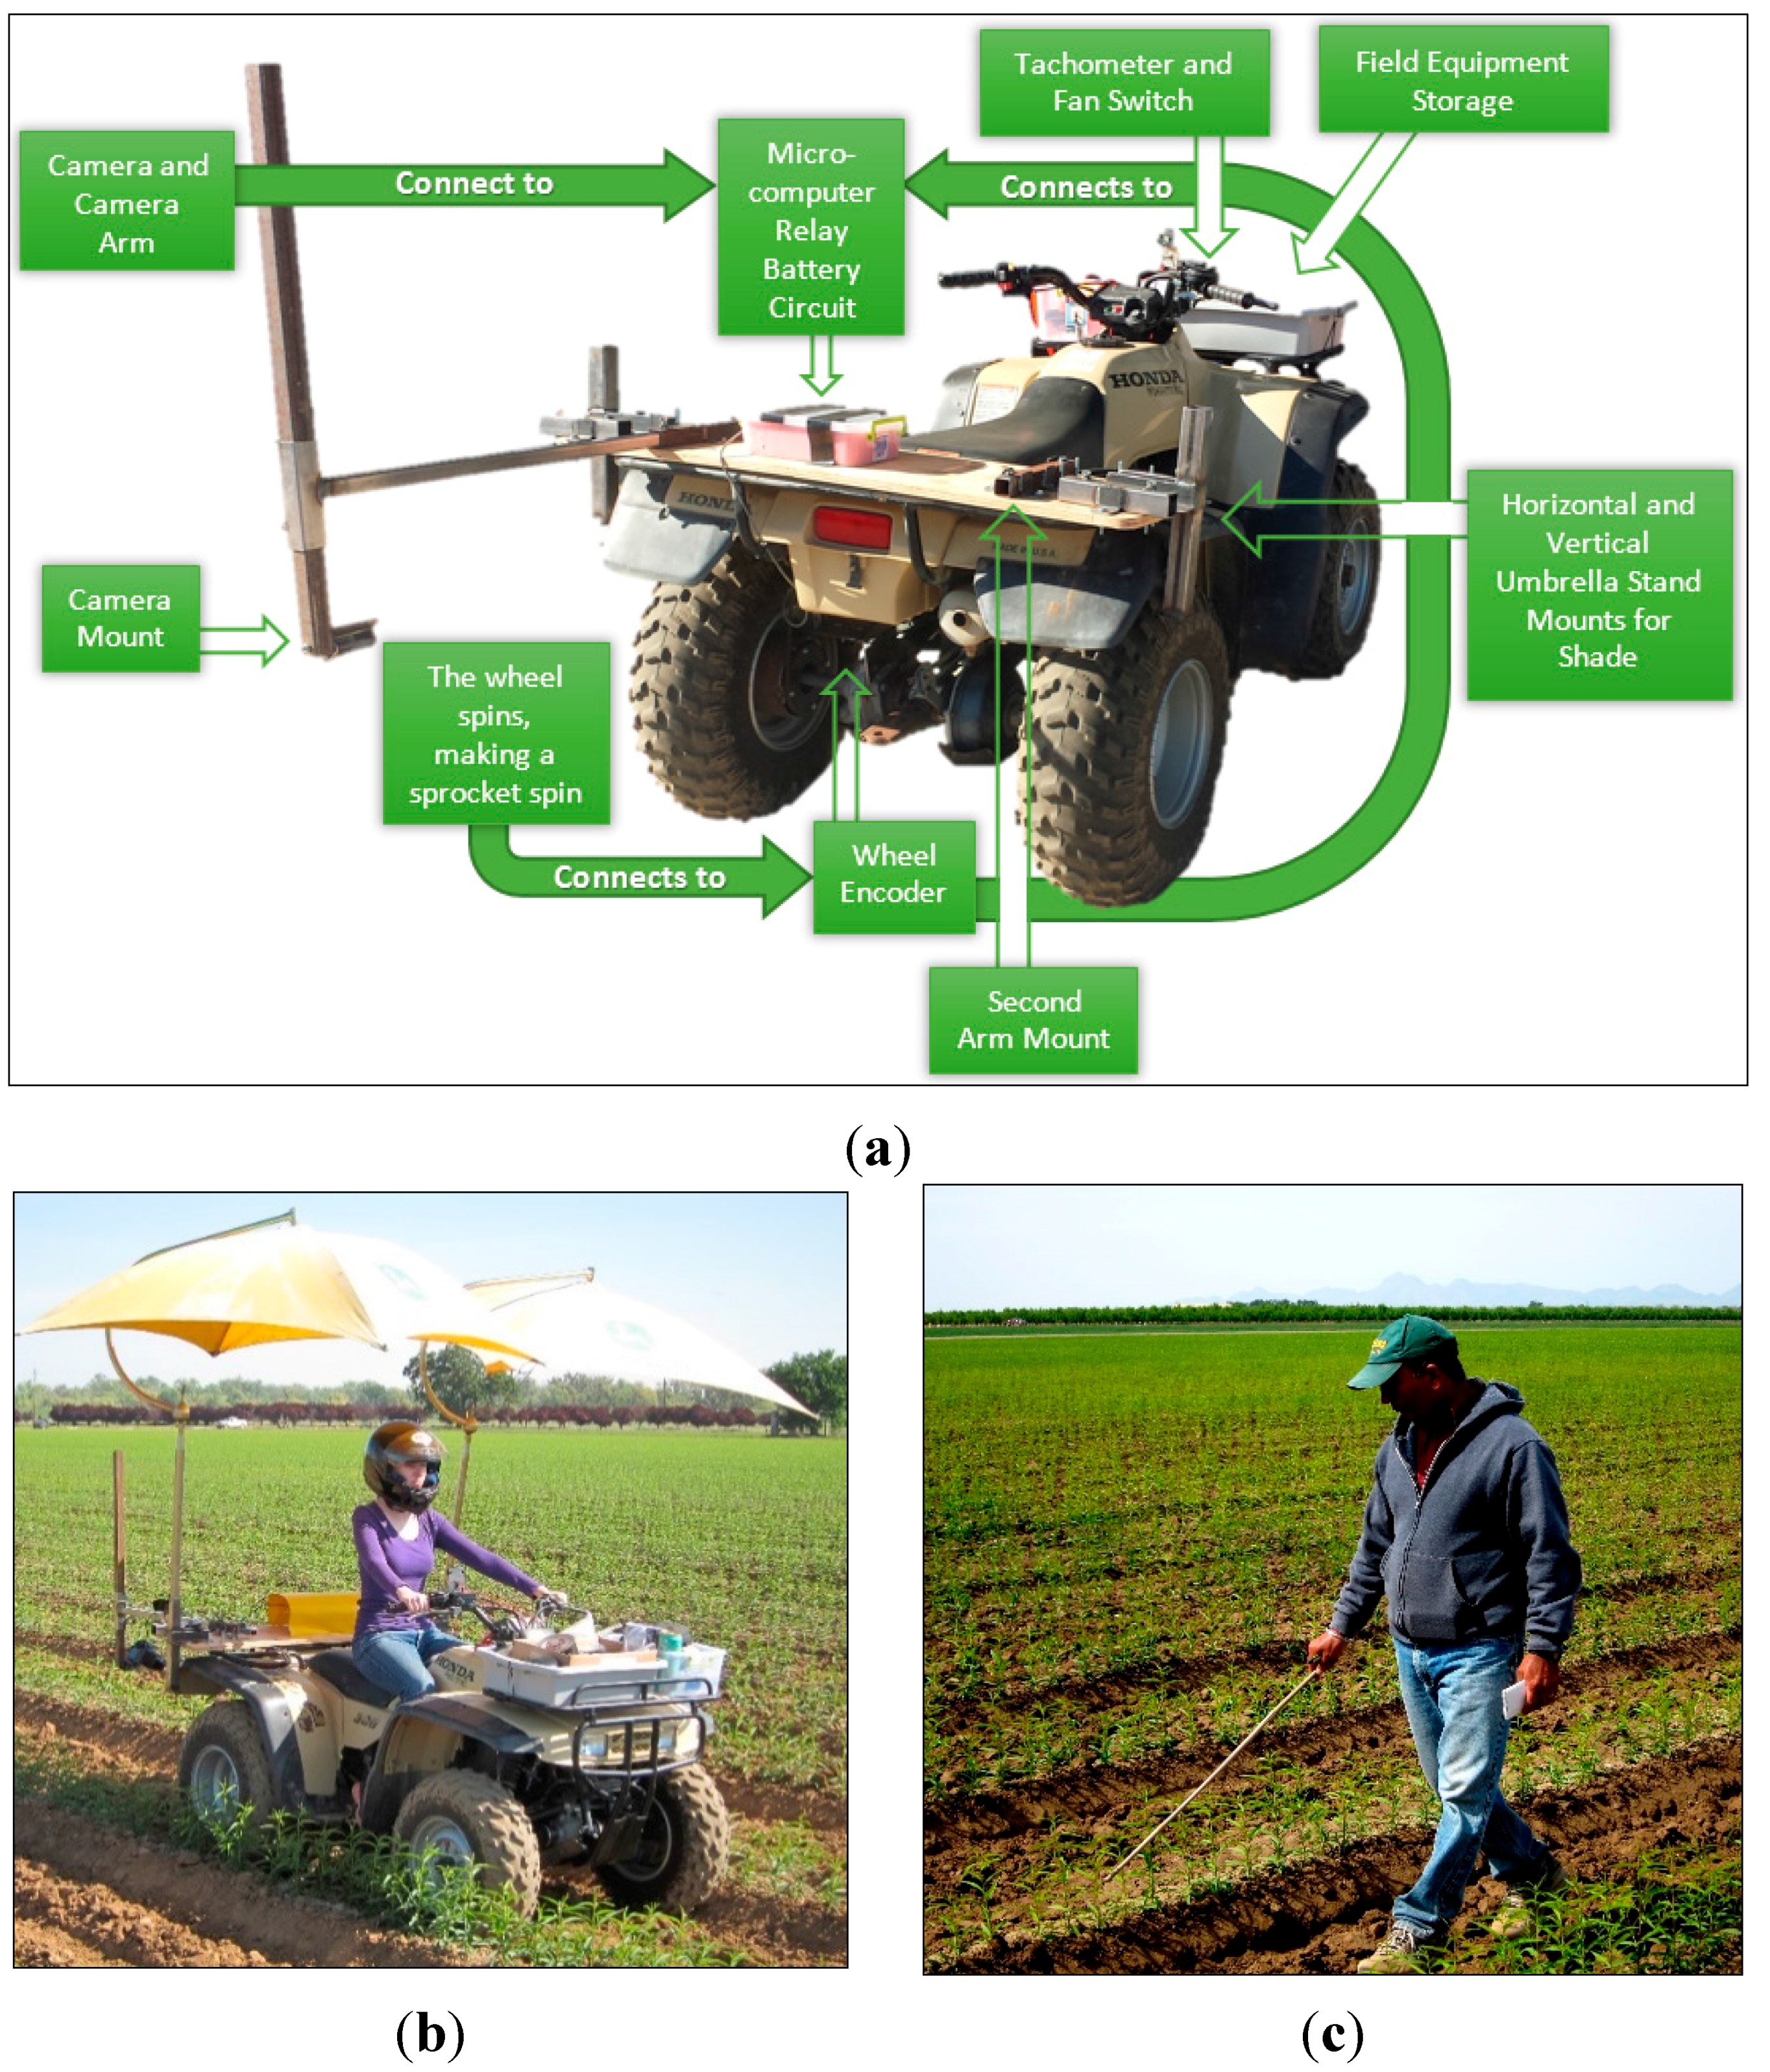
In the experimental system an ATV was used to simulate a tractor, as the base platform. The mobile vehicle had an attached arm to hold a camera, and a rotary shaft encoder was mounted on the wheel axle for odometry sensing. Image data are based on 24-bit digital color images taken by an electrically controlled, high-resolution, digital single-lens reflex camera (model EOS Rebel T3, Canon Inc., Tokyo, Japan). The camera was equipped with a zoom lens (model EF-S 18–55 mm 1:3.5–5.6 IS II, Canon Inc., Tokyo, Japan) aimed at the target plants and held fixed on the arm mounted to the mobile vehicle at an orientation of approximately 60° relative to the ground plane. An embedded microcontroller (model Raspberry Pi version 1 model B+, Raspberry Pi Foundation, UK) was used to activate the camera via a solid-state relay. The odometry signal was an input into the microcontroller to control the distance travelled between image acquisition events. A control algorithm was created to allow the microcontroller to trigger image acquisition by the camera at set spatial intervals. Because a difference in image resolution might dramatically affect the processing speed of the whole system from image transfer, plant segmentation, feature detection, and calculation of homography transformation matrix, the resolution 640 × 480 was selected as the best trade-off between speed and quality, so that accurate results can be obtained in an acceptable length of processing time. All camera parameters, including aperture, focal length, shutter speed, white balance, and ISO were manually set to have the best quality images in an outdoor scene.
Figure 2 shows all details of the devices on the ATV, including the arm to mount the camera, the microcontroller with a relay and the wheel encoder.
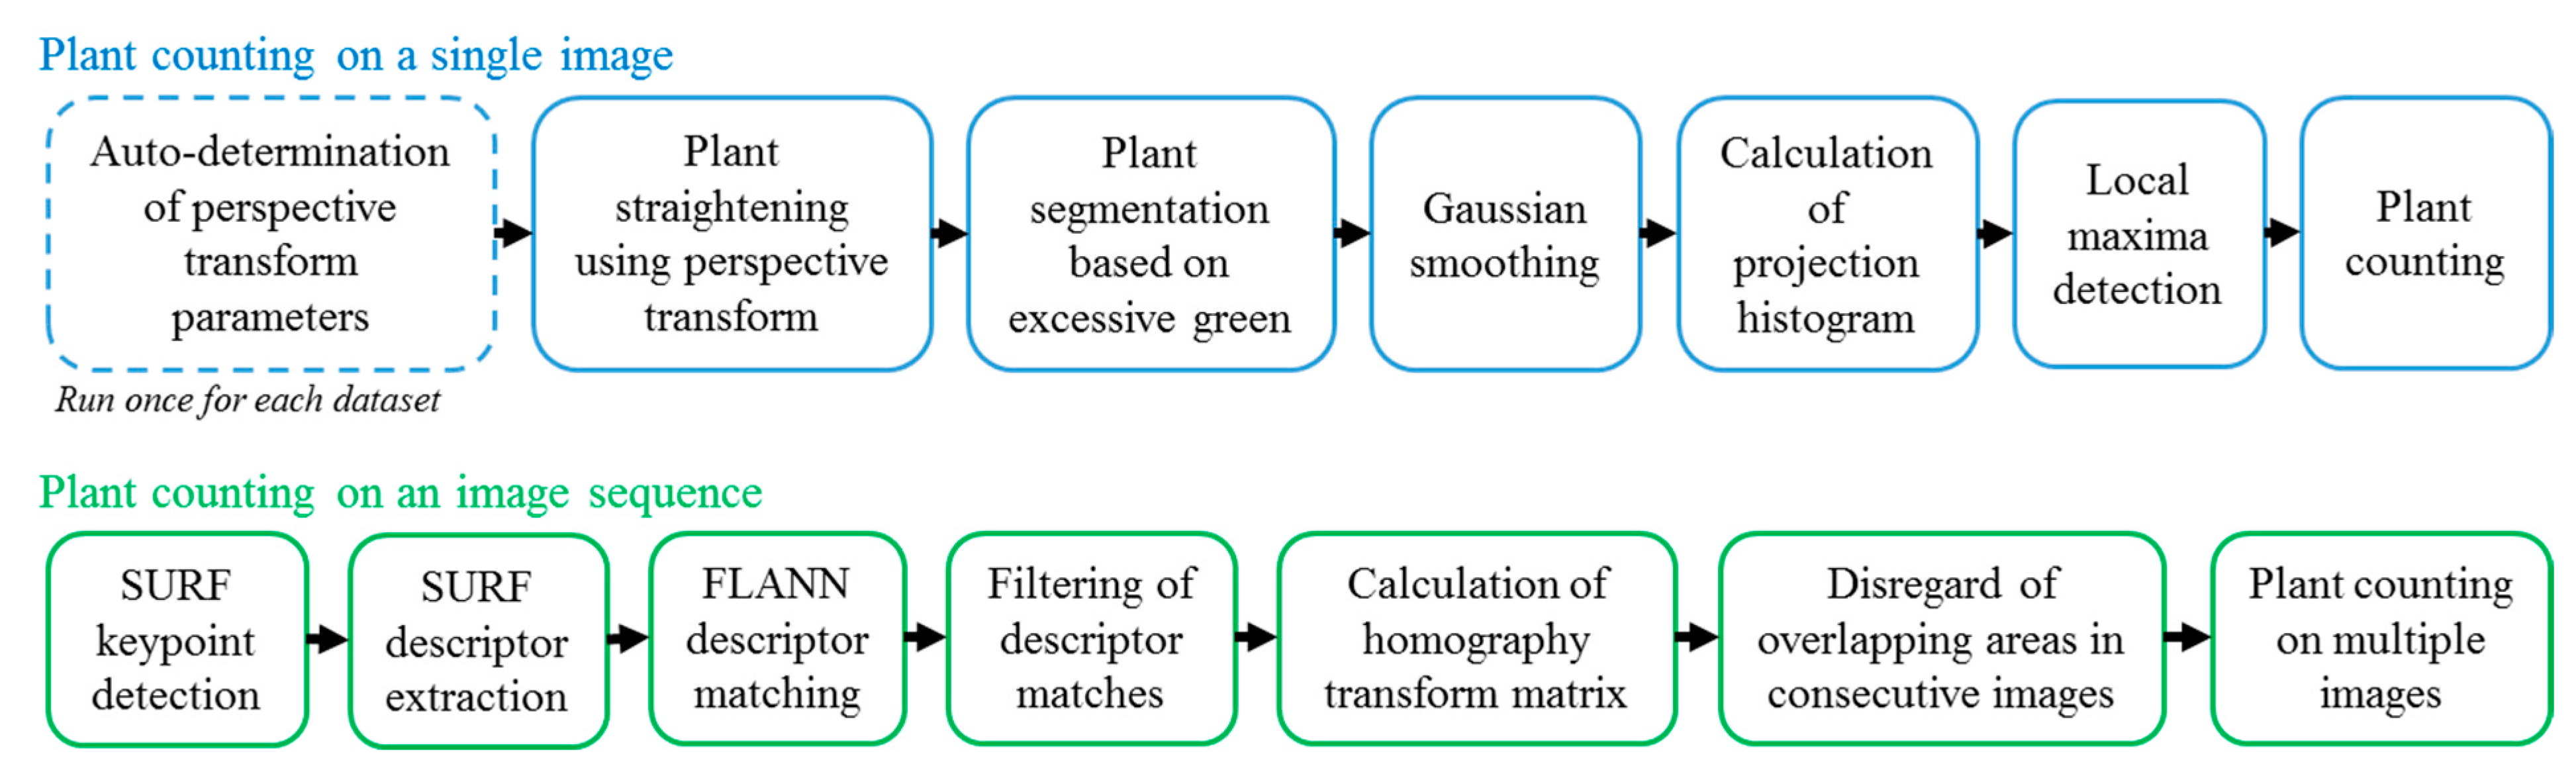
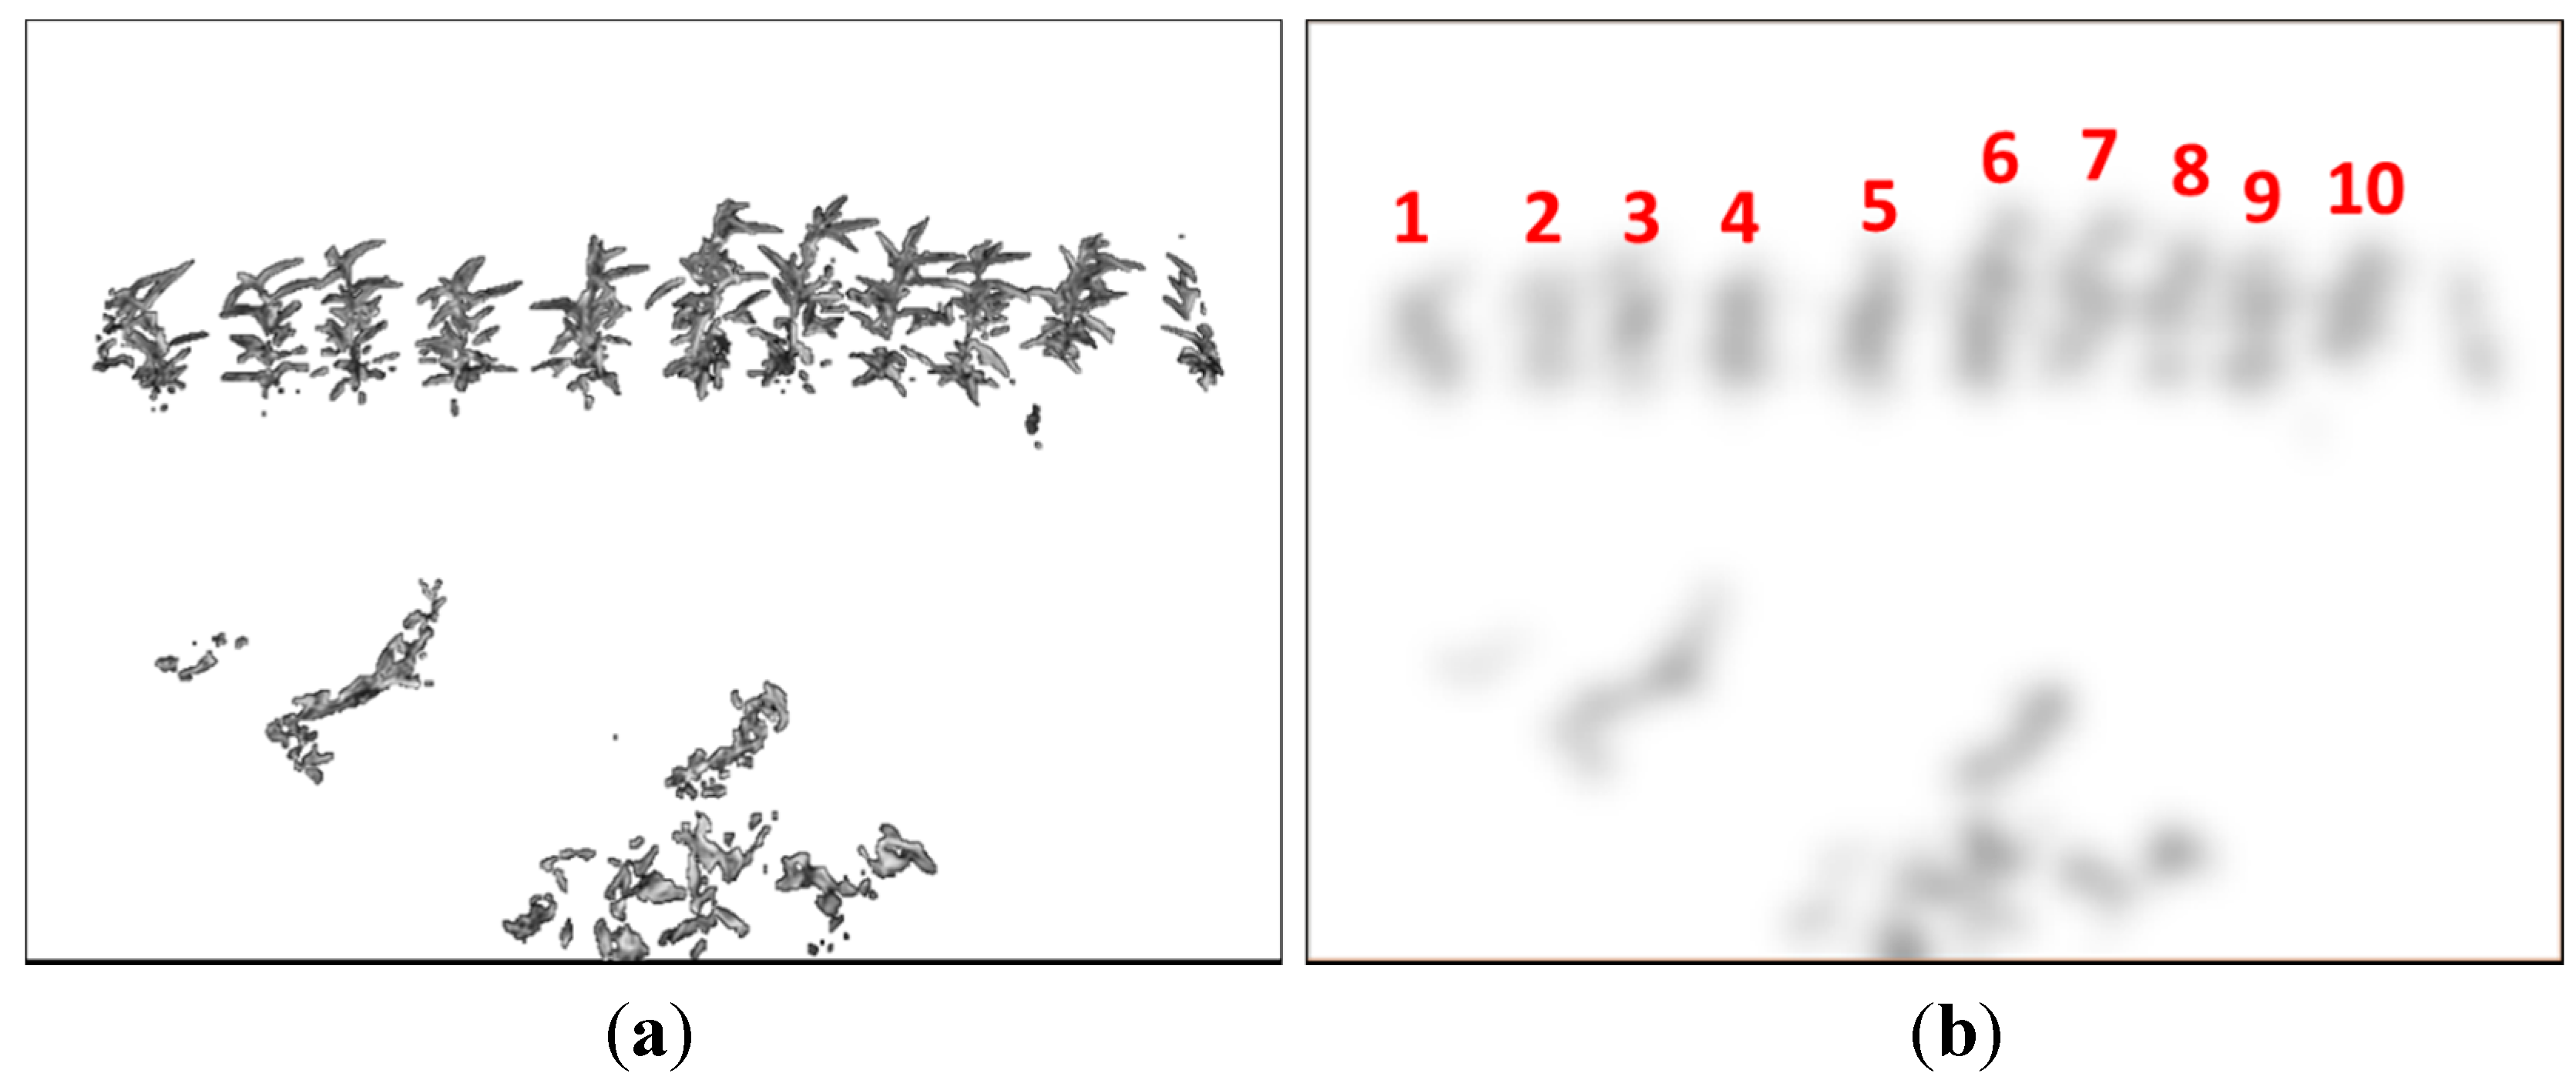
The algorithm contains steps of perspective transform (with automatic determination of parameters) for orthographic plant projection, excessive green color segmentation, Gaussian smoothing, projection histogram, and local maxima detection for plant counting for a single image. To overcome potential problems with double-counting of plants in an image sequence, SURF (Speeded Up Robust Features) keypoint detection, SURF descriptor extraction [
11], FLANN (Fast Library for Approximate Nearest Neighbors) descriptor matching [
12], filtering of descriptor matches, and calculation of homography transform were utilized with GPU implementations.
Figure 3 shows a block diagram of the proposed algorithm.
Figure 2.
(a) The ATV with an arm to mount the camera, the wheel encoder, and the microcontroller to activate the camera via a relay; (b) the vehicle in operation capturing pictures of plants; and (c) manual counting of plants by a staff person.
Figure 2.
(a) The ATV with an arm to mount the camera, the wheel encoder, and the microcontroller to activate the camera via a relay; (b) the vehicle in operation capturing pictures of plants; and (c) manual counting of plants by a staff person.
Figure 3.
Flowchart representation of the algorithm.
Figure 3.
Flowchart representation of the algorithm.
4. Plant Counting in an Image Sequence
Once the number of plants in each image is determined, the accumulated count in all images in a sequence is determined using a special method to avoid double-counting of trees between images. To serve this purpose, the homography transformation between every two successive images is considered. SURF is one of the best algorithms for keypoint detection and descriptor extraction and it is being used successfully in the applications of object recognition [
18], image stitching [
19], 3D reconstruction [
20], and background motion compensation [
21,
22]. In this paper, SURF was utilized for the calculation of the homography transformation matrix, because it is fast to compute and has good performance when based on integral images and an integer approximation of the determinant of Hessian blob detector. The extracted SURF descriptors are matched between two consecutive images using FLANN, which allows fast and accurate nearest neighbor searches in high dimensional spaces. Furthermore, it can select the optimal matching parameters automatically without any tuning from users. Good matches are thenceforth obtained based on the condition of common distance,
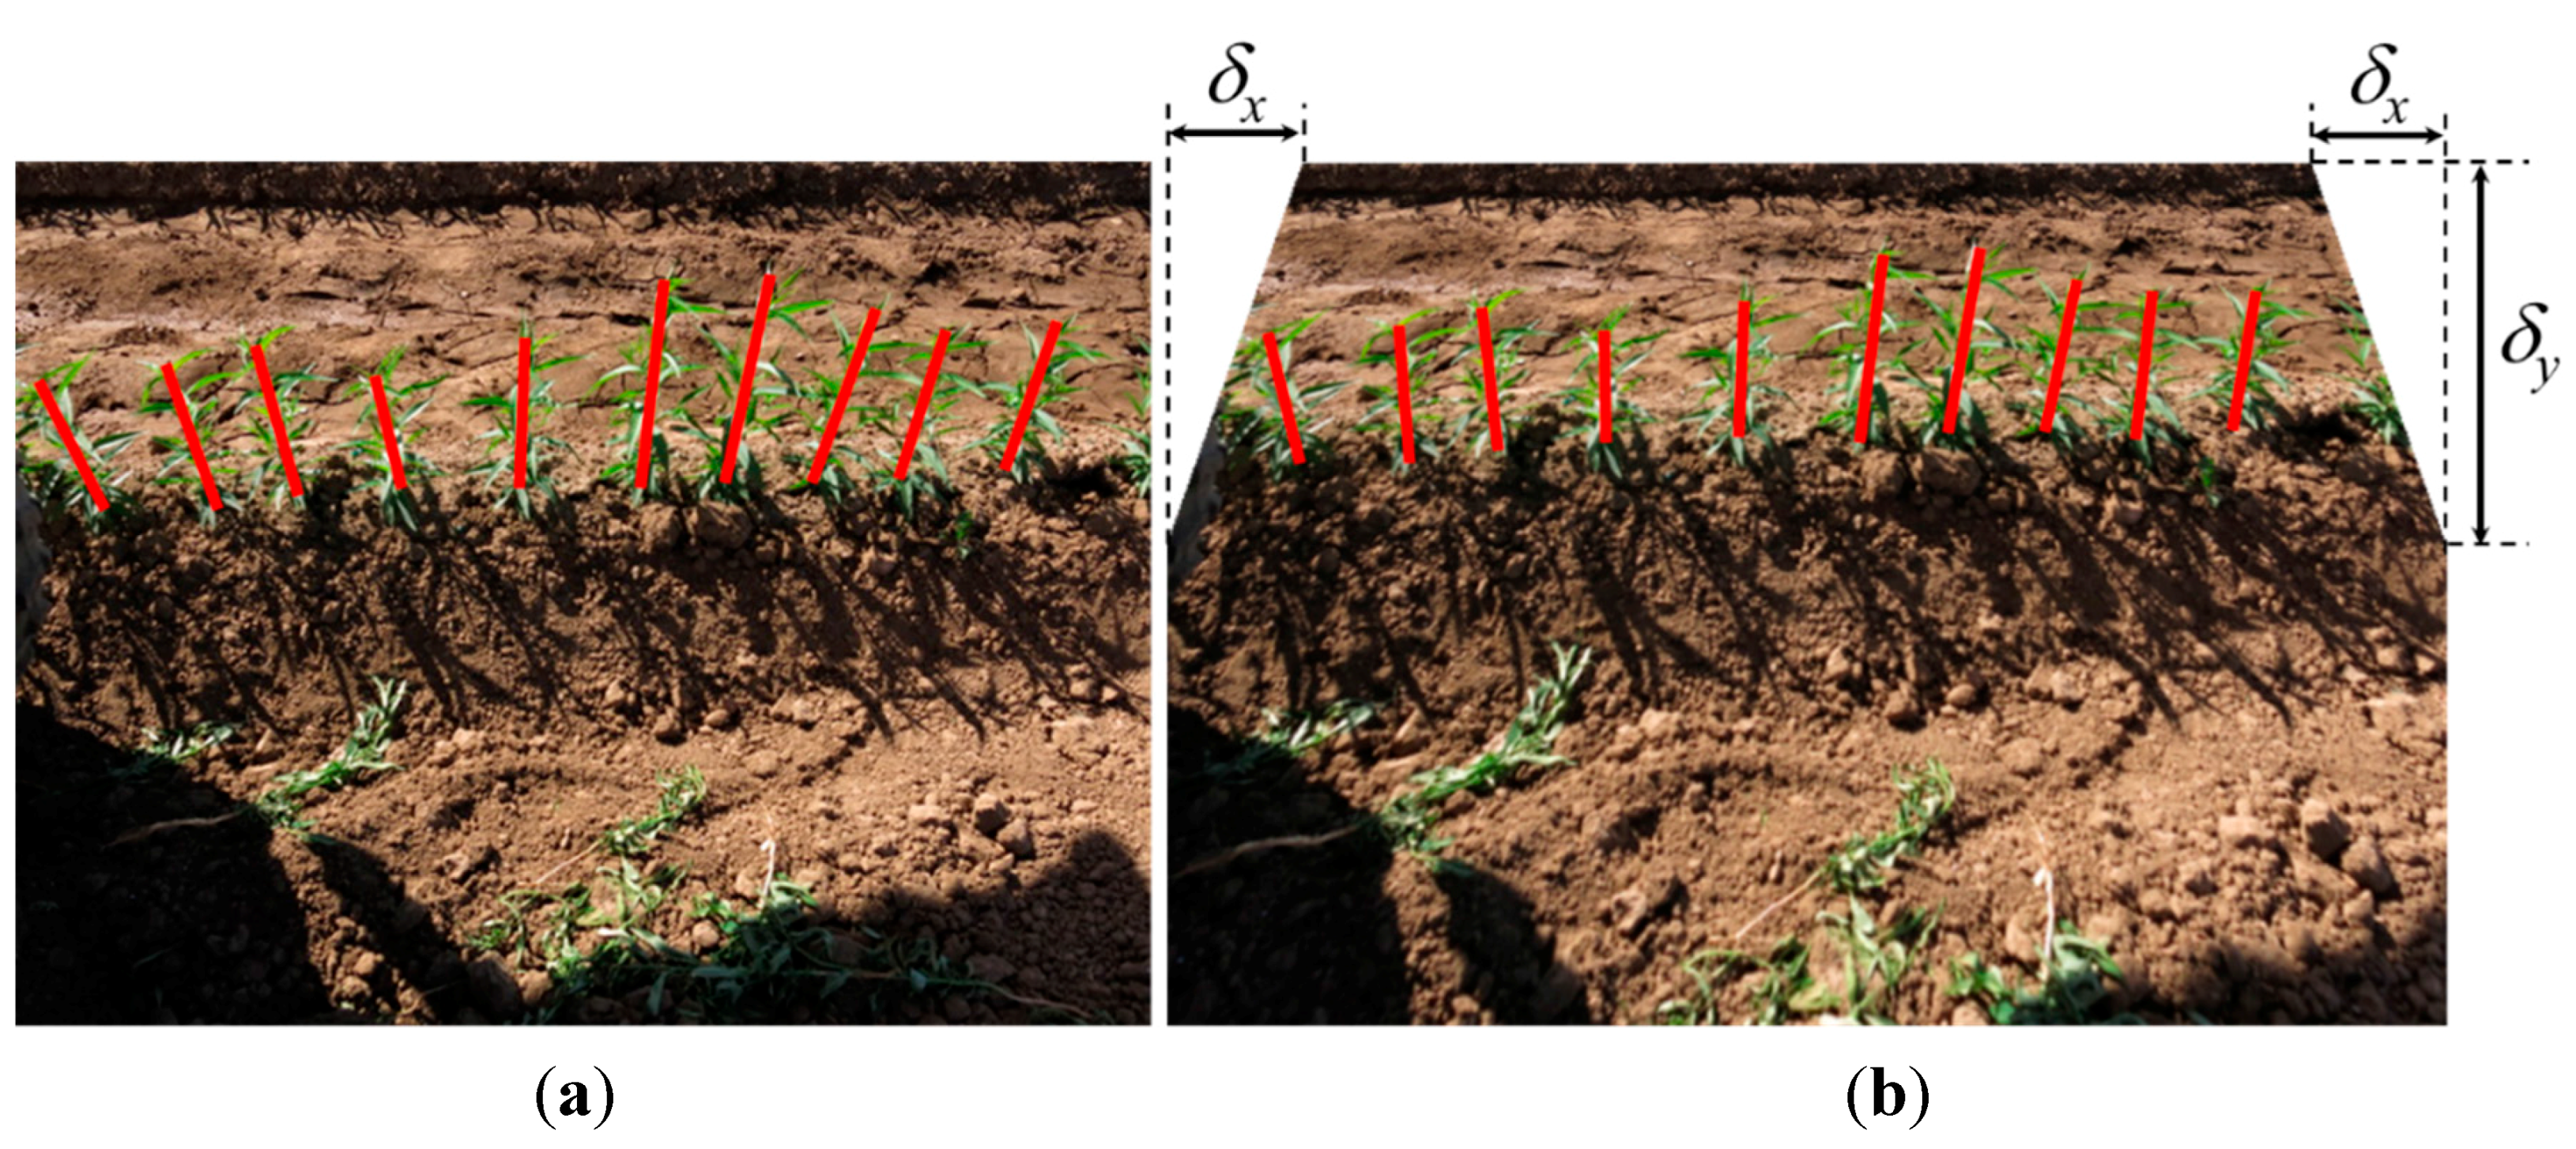
i.e., the matches having distances less than a minimum distance threshold will be discarded. In our case, a vehicle is moving along a field row and taking pictures of plants, two consecutive images of the same planar ground surface can be related by homography. The good matches obtained are used as the input to find a homography transformation between each set of successive images, without the need for camera calibration. Once the homography transformation matrix is found, camera translation with respect to vehicle’s horizontal movement can be extracted to estimate the overlap between successive images and avoid double-counting of plants. Defining
It−1(
x,
y) = [
xt−1,
yt−1, 1]
T and
It(x, y) = [
xt,
yt, 1]
T the image points as time
t − 1 and
t, a homography
H is represented through
where
h13 is the coefficient of
x-translation and that is the parameter we want to utilize for estimating the overlapping between successive images. It is noted that the scaling parameters
h11 and
h22 approach 1 because there are no zoom-in or zoom-out operators from the camera and the vehicle is travelling along the plant row. In our case, an affine homography is considered an appropriate model of image displacement and is a special type of a general homography where
h31 and
h32 are close to 0 and
h33 approaches 1. In this paper, the Hessian threshold for the keypoint detector was fixed to 400,
i.e., the features having a Hessian value larger than this threshold are retained. A RANSAC-based method was used to estimate the homography matrix so as to
where
N is the total number of keypoints and
is the image point
i at time
t. Local maxima positions of plants are then compared to the
x-translation parameter
h13 to determine whether they are double-counted. Due to the effect of camera distortion (i.e., the plants at the image border are less straight than those closer to image center), this determination step requires a “buffer” for the plants at the image border to reduce the amount of counting errors. When
h13 > 0, the comparison (
il −
b >
h13) implies that the plant at the local maxima position
il (obtained from the Equation (7)) is considered double-counted if its difference from the buffer
b is greater than
h13. When
h13 ≤ 0, the comparison (
il +
b <
W +
h13) is to check if the plant at
il is double-counted, where
W is image width. The buffer
b can be estimated automatically based on half of the average of distances between two neighbor local maxima.
5. Experimental Results
A computer (CPU model Core i7 at 3.4 GHz, Intel Co., Santa Clara, CA, USA, with 12-GB DDR3 random-access-memory) was used for all processing steps, except that an 1152 core GPU (model GeForce GTX 760, NVidia Co., Santa Clara, CA, USA) graphics card was utilized for implementing the GPU-based SURF descriptor extraction and FLANN matching algorithms. Experiments were conducted on 941 images containing 9915 juvenile
Prunus persica L. “Nemaguard” peach trees (approximately 10.54 plants per image). Accounting for image overlap, the 941 images contained 2178 distinct peach trees when double-counting was eliminated. The images of the juvenile peach trees were collected from seven rows, with a 10 cm in-row plant distance between two neighboring plants, in an outdoor tree nursery (Sierra Gold Nurseries, Yuba City, CA, USA).
Table 1 shows information for the datasets used in the experimental results, where Sets 1, 2, and 3 (namely, Group 1) were taken on the same day and Sets 4 to Set 7 (namely, Group 2) were acquired on another day. The maximum plant height was approximately 30 cm, and 40 cm in Groups 1 and 2, respectively. The overlap between two consecutive images was increased from approximately 60% in Group 1 to approximately 90% in Group 2. These plant images were selected as examples of plants covered by shadow (from human, other plants, or random objects), green and other objects in the background, small plants, and different plant sizes.
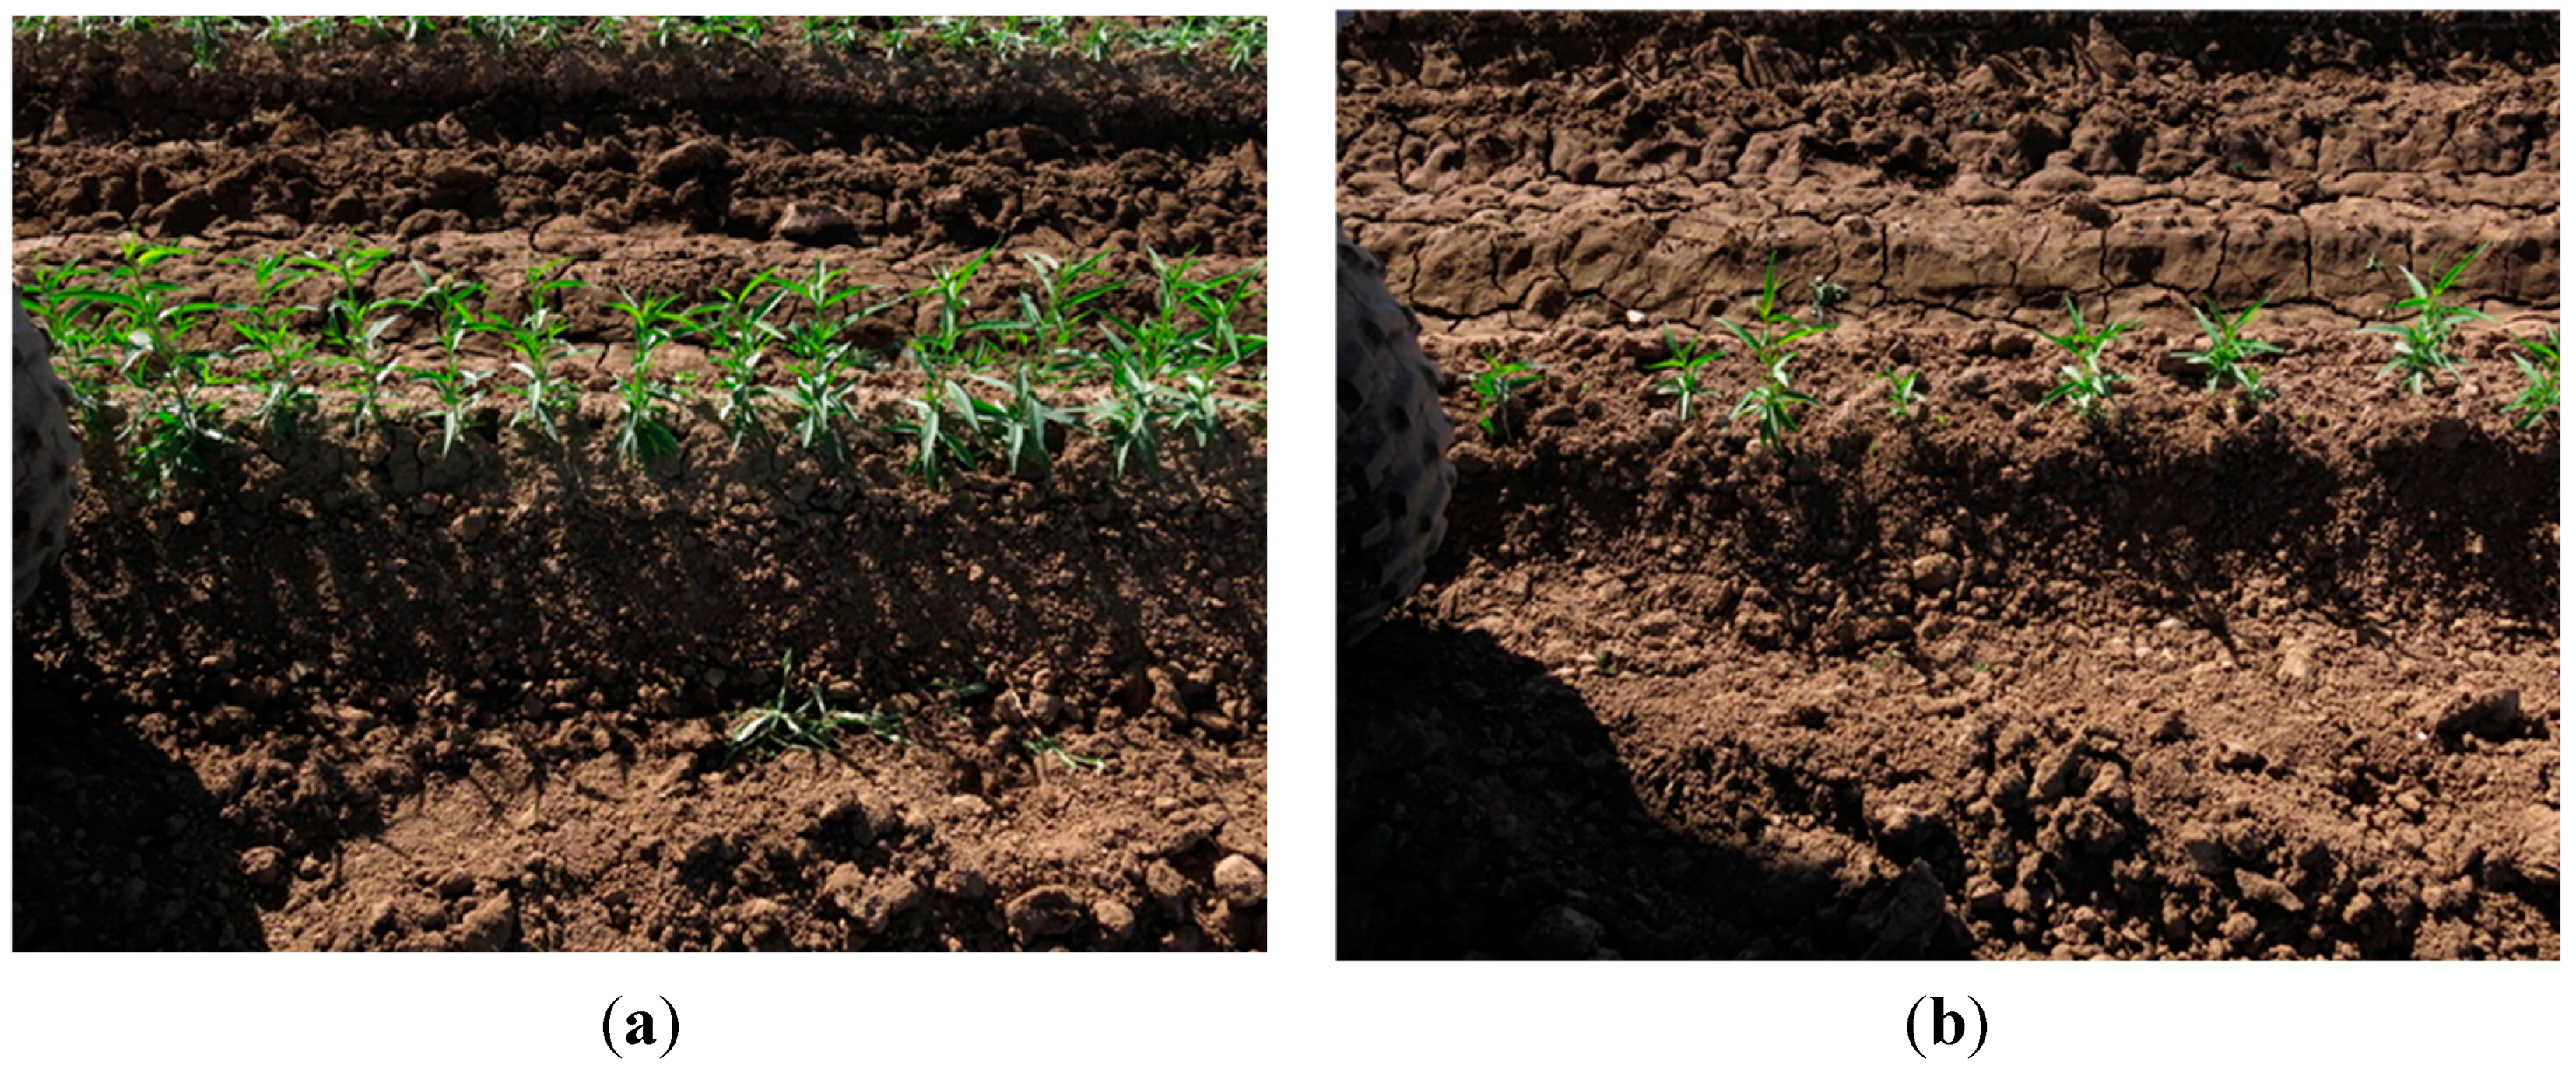
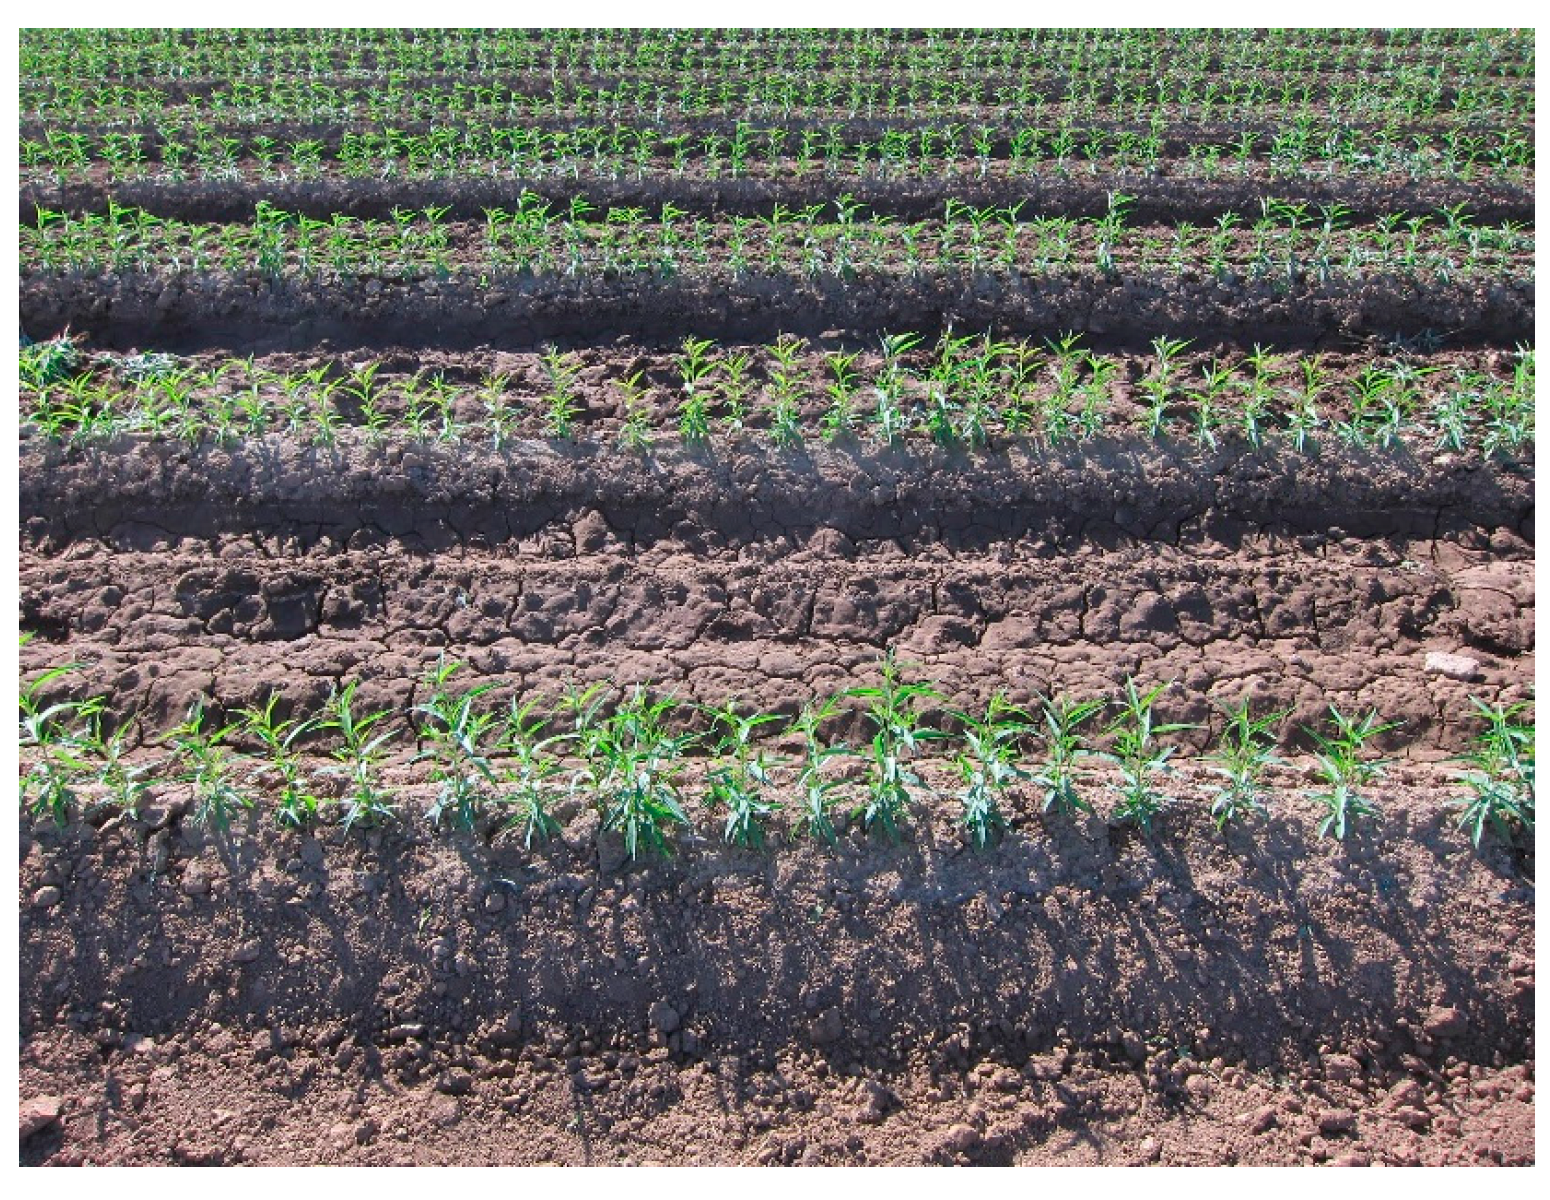
Figure 6 presents sample images showing examples of the green plant residue between the rows of plants, a second row of trees at the back (
Figure 6a) and eight small plants (
Figure 6b). In this study, the ground truth number of plants and overlap of images were measured manually. The number of small plants was defined based on a maximum plant height of 15 cm. It is noted that there were no plants imaged in shadow from Sets 3 to 7, and no additional objects on the background in Set 3. In the final design of our system on a tractor, a metal tunnel will be used to eliminate the current issues of shadows and green objects (
i.e., the adjacent row) in the background. The purpose of presenting results of these critical issues here was to experimentally show the robustness of the proposed algorithm. In the experiments, all parameters were fixed (
i.e., not optimized image by image) in order to have consistent results between different images and datasets.
Table 1.
List of datasets and their detail information for experiments.
Table 1.
List of datasets and their detail information for experiments.
| Set 1 | Set 2 | Set 3 | Set 4 | Set 5 | Set 6 | Set 7 | Total |
|---|
| # images | All | 121 | 127 | 93 | 150 | 150 | 150 | 150 | 941 |
| Containing shadows | 18 | 3 | 0 | 0 | 0 | 0 | 0 | 21 |
| Containing green material on the background | 6 | 10 | 46 | 150 | 150 | 150 | 150 | 662 |
| Containing other objects on the background | 3 | 5 | 0 | 13 | 13 | 6 | 9 | 49 |
| Containing small plants | 18 | 21 | 12 | 6 | 5 | 11 | 34 | 107 |
| # plants | In individual images | 1469 | 1481 | 1154 | 1398 | 1402 | 1505 | 1506 | 9915 |
| In the image sequence | 609 | 505 | 525 | 160 | 136 | 94 | 149 | 2178 |
| With shadows in individual images | 46 | 7 | 0 | 0 | 0 | 0 | 0 | 53 |
| Of small size in individual images | 26 | 42 | 13 | 6 | 5 | 15 | 53 | 160 |
| Average image overlap | 59.2% | 64.7% | 53.8% | 89.4% | 91.1% | 93.8% | 90.4% | |
Figure 6.
Sample images of green objects in the background (a) where there is plant residue on the soil and plants in the next row; and small plants (b).
Figure 6.
Sample images of green objects in the background (a) where there is plant residue on the soil and plants in the next row; and small plants (b).
Table 2 shows the average plant counting accuracies in both plant counting within a single image and for an image sequence, where double-counting was avoided. Within a single image, on average 0.51 counting mistakes out of 10.54 plants per image (
i.e., an average accuracy of 95.2%) were observed. Accuracies obtained when excluding the challenging cases 95.4% (shadows), 95.4% (additional green objects), 95.3% (other objects), and 95.3% (small plants) were approximately equivalent to the overall performance, demonstrating the robustness of the method. Notice that the underlined numbers in
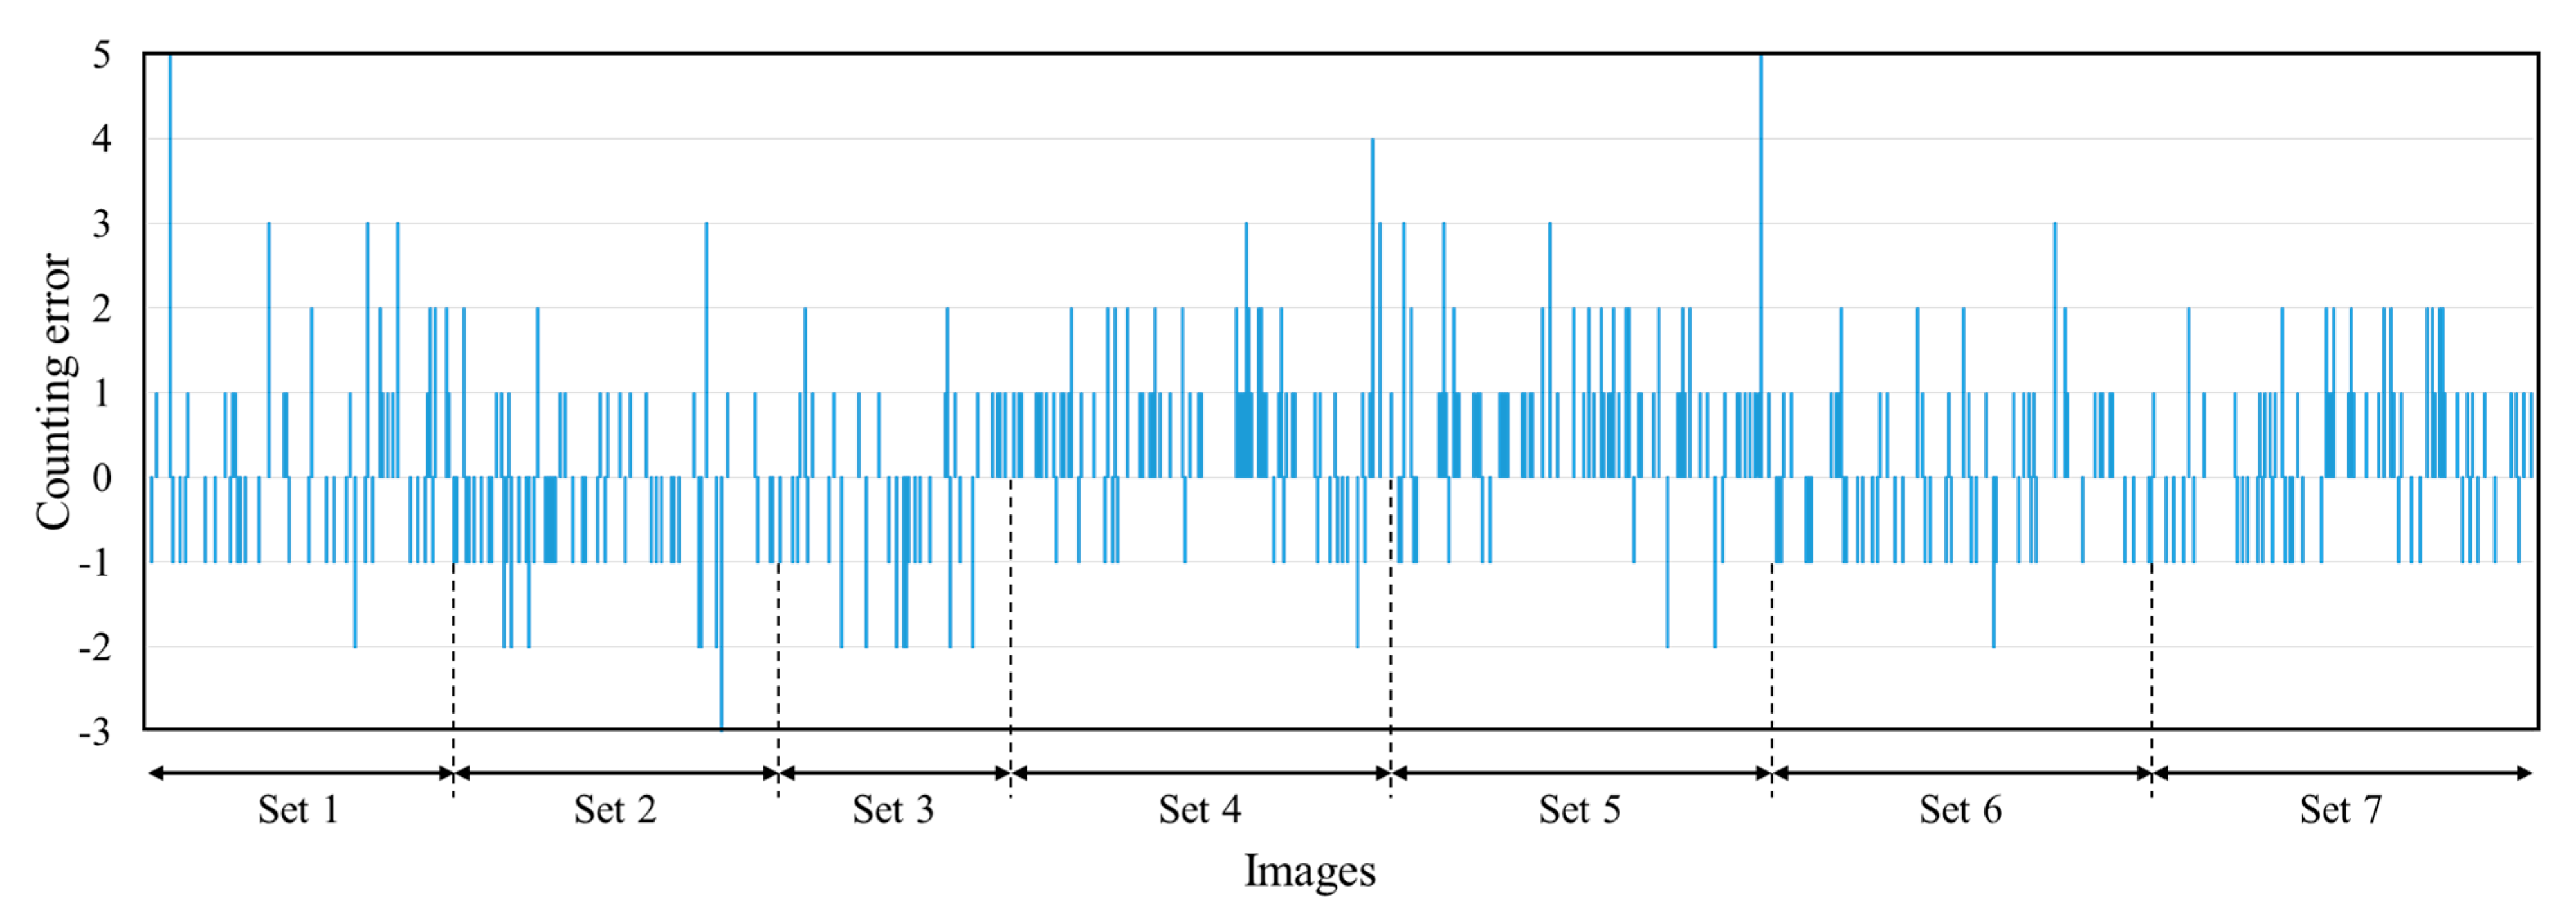
Table 2 for the cases of “shadow” and “green objects” were taken from those without the exclusion. In an image sequence, when double-counting was minimized, an accuracy of 98% in all images was achieved. This accuracy is better than the single image performance because, on average, errors in a sequence of overlapped images compensate for one another. The plant counting error in every image is shown in
Figure 7. The maximum estimation error was five plants and was mostly associated with high levels of foliage occlusion. By estimating the homography transformation between consecutive images, the proposed system also produced knowledge on the amount of image overlap. Comparing the actual overlap to that estimated by homography, we obtained an average error of only 2.54%. The average processing time for all steps in the software algorithm was approximately 300 ms per image pair.
Table 2.
Average counting accuracy and the estimated image overlap using a homography transform.
Table 2.
Average counting accuracy and the estimated image overlap using a homography transform.
| Set 1 | Set 2 | Set 3 | Set 4 | Set 5 | Set 6 | Set 7 | Avg.* |
|---|
| Within single images | w.r.t. individual images | 95.8% | 95.5% | 96.4% | 93.8% | 93.6% | 95.8% | 95.3% | 95.2% |
| Avg. count errors per image | 0.51 | 0.52 | 0.44 | 0.57 | 0.60 | 0.42 | 0.47 | 0.51 |
| Std. Dev. of count errors per image | 0.82 | 0.67 | 0.67 | 0.74 | 0.83 | 0.59 | 0.63 | 0.72 |
| Excluding the case of shadows | 96.2% | 95.8% | 96.4% | 93.8% | 93.6% | 95.8% | 95.3% | 95.4% |
| Excluding the case of green objects on the background | 95.7% | 95.5% | 96.7% | - | - | - | - | 95.4% |
| Excluding the case of other objects on the background | 95.6% | 95.6% | 96.4% | 93.9% | 93.7% | 96.1% | 95.8% | 95.3% |
| Excluding the case of small plants | 95.8% | 95.4% | 96.5% | 94.0% | 93.9% | 96.2% | 95.4% | 95.3% |
| For an image sequence | 99.2% | 98.2% | 99.2% | 96.3% | 95.6% | 99% | 98.6% | 98% |
| Estimated image overlap | 57.1% | 62.1% | 58.7% | 87.6% | 88.6% | 91.7% | 88.6% | |
Figure 7.
Tree counting errors in 941 images.
Figure 7.
Tree counting errors in 941 images.
Comparisons in terms of counting accuracy and system characteristics between our method and the other two methods in [
4,
6] (where corn plants were used) are shown in
Table 3. The results are presented with respect to counting in individual images, and for an image sequence using our peach tree data. In the method [
4], the block matching based image sequencing algorithm was not applicable to our data, which were captured from a camera held at an angle of 60°. Due to a large number of incorrect matches yielded by the block matching based algorithm, our image sequencing algorithm (without the perspective transform) was substituted for the block matching in [
4] to allow comparison of subsequent steps. The accuracies yielded by [
4] were significantly lower than ours. The iterative rules based on the number of pixels and positions were sensitive to plant size and plant center locations. Additionally, these rules required parameter tuning for refining plant and background regions. Similarly, in the method from [
6], when the top view was used, it led to plant counting errors when the direct image sequencing was utilized without the perspective transform. Using skeletonization for plant center detection, the method in [
6] yielded a high error rate when there was foliage occlusion. For individual images, our system yielded an average accuracy of 95.2% (0.51 ± 0.72 count errors per image) compared to 86.9% (1.38 ± 1.34) for the method of [
4] and 71.4% (2.05 ± 1.96) for the method in [
6]. In the case of the image sequence, our total accuracy (98%) was substantially better than those of the other two methods (77.8% and 71.9%). It is worth mentioning that our method was able to work well with less than 60% image overlapping compared to 85% of [
4].
Table 3.
Accuracy and system characteristics comparison of the proposed method to [
4,
6].
Table 3.
Accuracy and system characteristics comparison of the proposed method to [4,6].
| The Method of [4] | The Method of [6] | The Proposed Method |
|---|
| Accuracy comparison (using peach tree seedling data) |
| Within individual images | w.r.t. individual images | 86.9% | 71.4% | 95.2% |
| Avg. count errors per image | 1.38 | 2.05 | 0.51 |
| Std. Dev. of count errors per image | 1.34 | 1.96 | 0.72 |
| In an image sequence | 77.8% | 71.9% | 98% |
| System characteristics |
| Plant size (growth stage) | V3 to V4 growth stages * | Early to V3 growth stages * | Early growth stage to 40 cm height |
| Camera view | Top view | Top view | Perspective view at an angle of 60° |
| Image overlap | 85% | n/a | 54% to 91% |
| Method | Image sequencing | Block matching (substituted by our image sequencing method without perspective transform) | SIFT feature matching, homography transform | SURF descriptor extraction, RANSAC feature matching, homography transform |
| Plant segmentation | Bayesian classification on color spaces | Bayesian classification on color spaces | Excessive green |
| Plant counting | Iterative rules based on the number of pixels and positions | Skeletonization for plant center detection | Perspective transform, Gaussian smoothing, projection histogram |


