1. Introduction
Optical temperature-sensing devices have been widely researched to promote their application in electrical power stations, oil refineries, coal mines, and fire detection, as they have been shown to overcome the interference of strong electromagnetic noise, hazardous sparks, or corrosive environments inaccessible to traditional temperature-measurement methods such as thermocouple detectors [
1,
2,
3,
4,
5]. Sensors built based on the fluorescence intensity ratio (FIR) technique have attracted particular attention due to their ability to reduce dependence on measurement conditions and improve accuracy and resolution. FIR functions independent of fluorescence loss or fluctuations in excitation intensity can be applied to fluorescence systems in which two closely spaced energy levels with separations of the order of thermal energy are involved, following a Boltzmann-type population distribution [
1,
6,
7]. Optical temperature sensors using the FIR technique are mainly focused on fluoride and oxides matrixes [
8,
9,
10,
11,
12,
13,
14]. The fluoride matrixes possesses higher fluorescence efficiency and lower excitation power; however, the maximum operating temperature is usually low. On the contrary, the oxides matrices can operate at high temperature, although the fluorescence intensity is lower.
Upconversion emissions of rare earth ion-doped materials are typically utilized to realize FIR measurement because of the large amount of coupled energy levels in many rare earth ions and the easily accessible upconversion luminescence with near-infrared radiation from low-cost, commercially available diodes. Xu
et al. [
8], for example, reported the FIR of Ho
3+ using two blue emissions from coupled energy levels of
5G
6/
5F
1 and
5F
2,3/
3K
8 and found that Ho
3+-Yb
3+-codoped CaWO
4 possessed higher absolute sensitivity due to a larger energy gap between the thermally coupled
5G
6/
5F
1 and
5F
2,3/
3K
8 levels of Ho
3+ ions. The paired energy levels of
3F
2 and
3F
3 in Tm
3+ ions have also been used to investigate temperature-dependent red upconversion emissions and corresponding FIR properties [
9]. The FIR properties of green upconversion emissions ascribed to paired energy levels of
2H
11/2 and
4S
3/2 in Er
3+-doped materials, in particular, have been quite widely studied [
10,
11,
12,
13,
14].
In addition to the intrinsic thermally coupled energy levels of rare earth ions, the pair energy levels of Stark sublevels can also be thermally coupled and used to investigate FIR
versus temperature characteristics [
15,
16,
17,
18]. Baxter
et al. [
17], for example, used the coupled energy levels of
2F
5/2(a) and
2F
5/2(b) by Stark split of
2F
5/2 levels in Yb
3+ ions to study FIR properties of Yb
3+-doped silica fiber. Feng
et al. [
18] investigated the FIR properties of Er
3+-doped fluoride glass using coupled Stark sublevels of
4S
3/2(1) and
4S
3/2(2) in Er
3+ ions.
In this study, four thermally coupled energy levels of Er3+ ions based on the Stark sublevels were simultaneously observed in Er3+-Yb3+-Mo6+-codoped TiO2 phosphors. FIR properties of the four coupled energy levels from green and red emissions in Er3+-Yb3+-Mo6+-codoped TiO2 phosphors were studied as a function of temperature in the range of 307–673 K. The effects of the energy gap of thermally coupled energy levels, FIR value, and upconversion emission intensity on the sensitivity and accuracy of the optical temperature sensor are discussed in an effort to explore potential developments in optical temperature-sensor technology based on different FIR routes in an independent system.
3. Results and Discussion
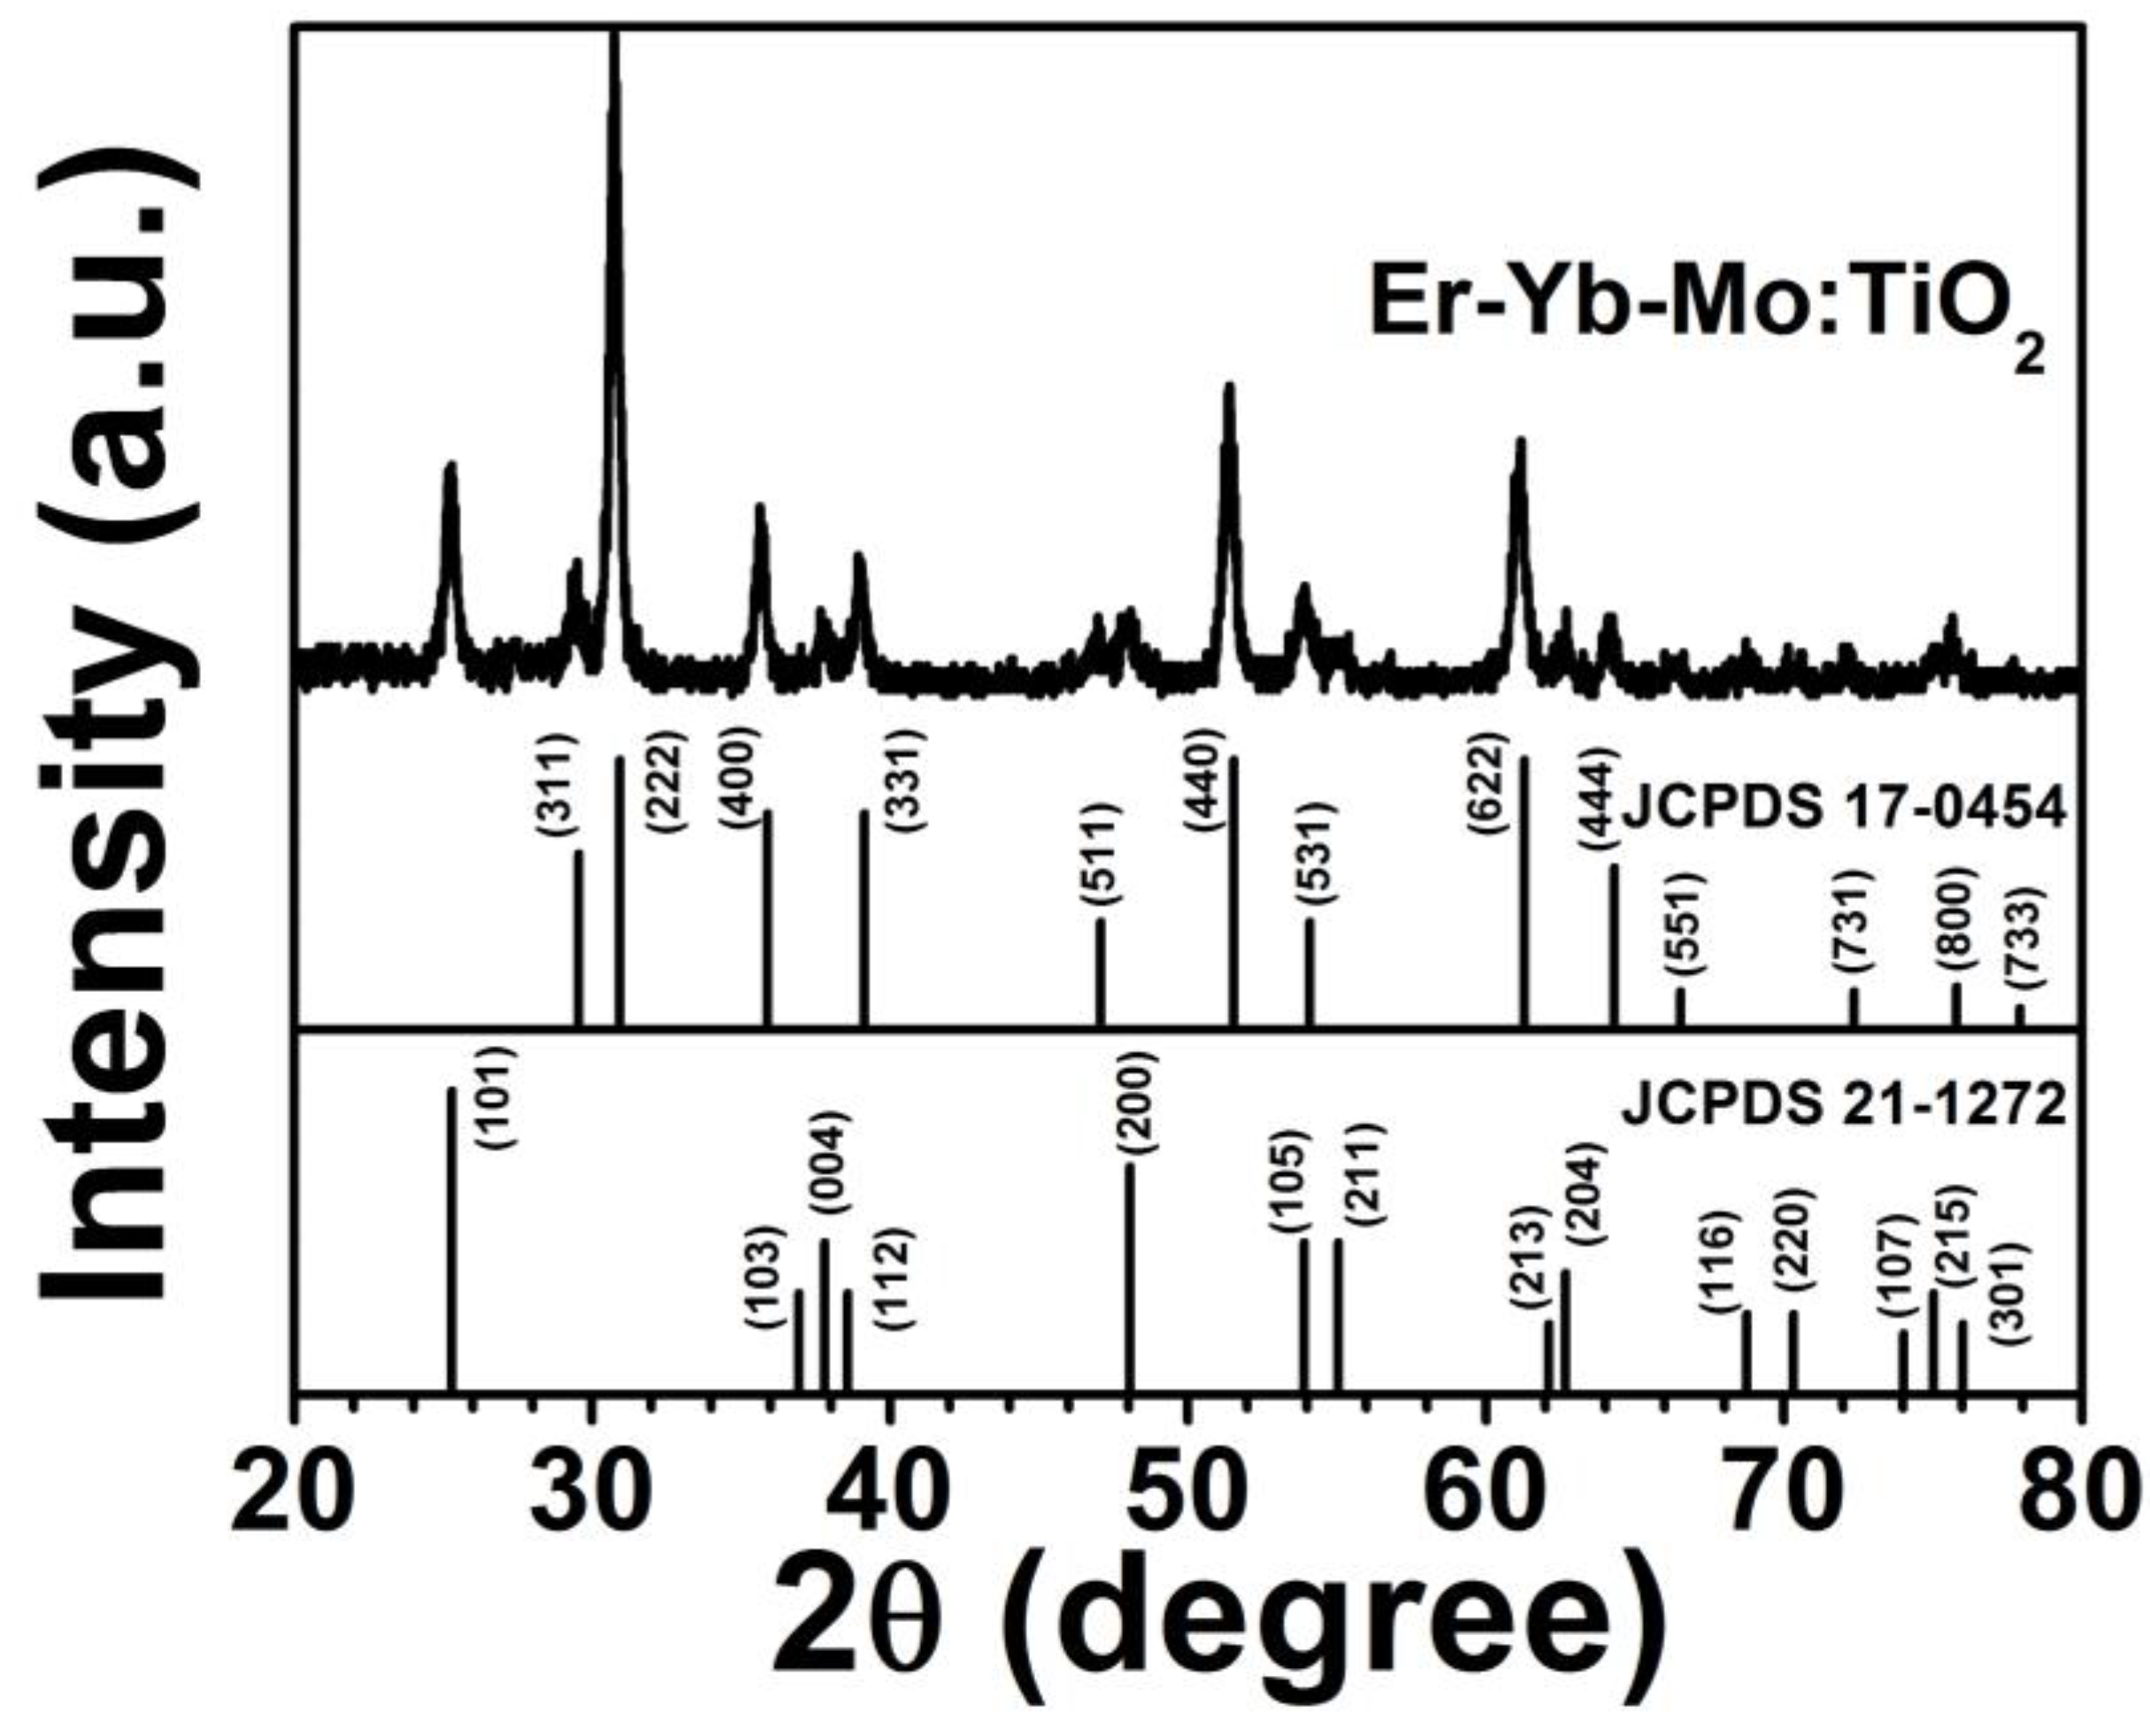
Figure 1 shows XRD patterns of the Er
3+-Yb
3+-Mo
6+-codoped TiO
2 phosphor samples. The XRD pattern observed was characteristic of the anatase phase of TiO
2 (JCPDS No. 21-1272) and the face-centered cubic phase of Yb
2Ti
2O
7 (JCPDS No. 17-0454) referenced below. There was no diffraction peak of Mo compounds, and the main diffraction peak shifted toward small angles, indicating Mo
6+ stochastically located at the interstitial sites of the matrix lattice as a solution element.
Figure 1.
XRD pattern of Er3+-Yb3+-Mo6+ codoped TiO2.
Figure 1.
XRD pattern of Er3+-Yb3+-Mo6+ codoped TiO2.
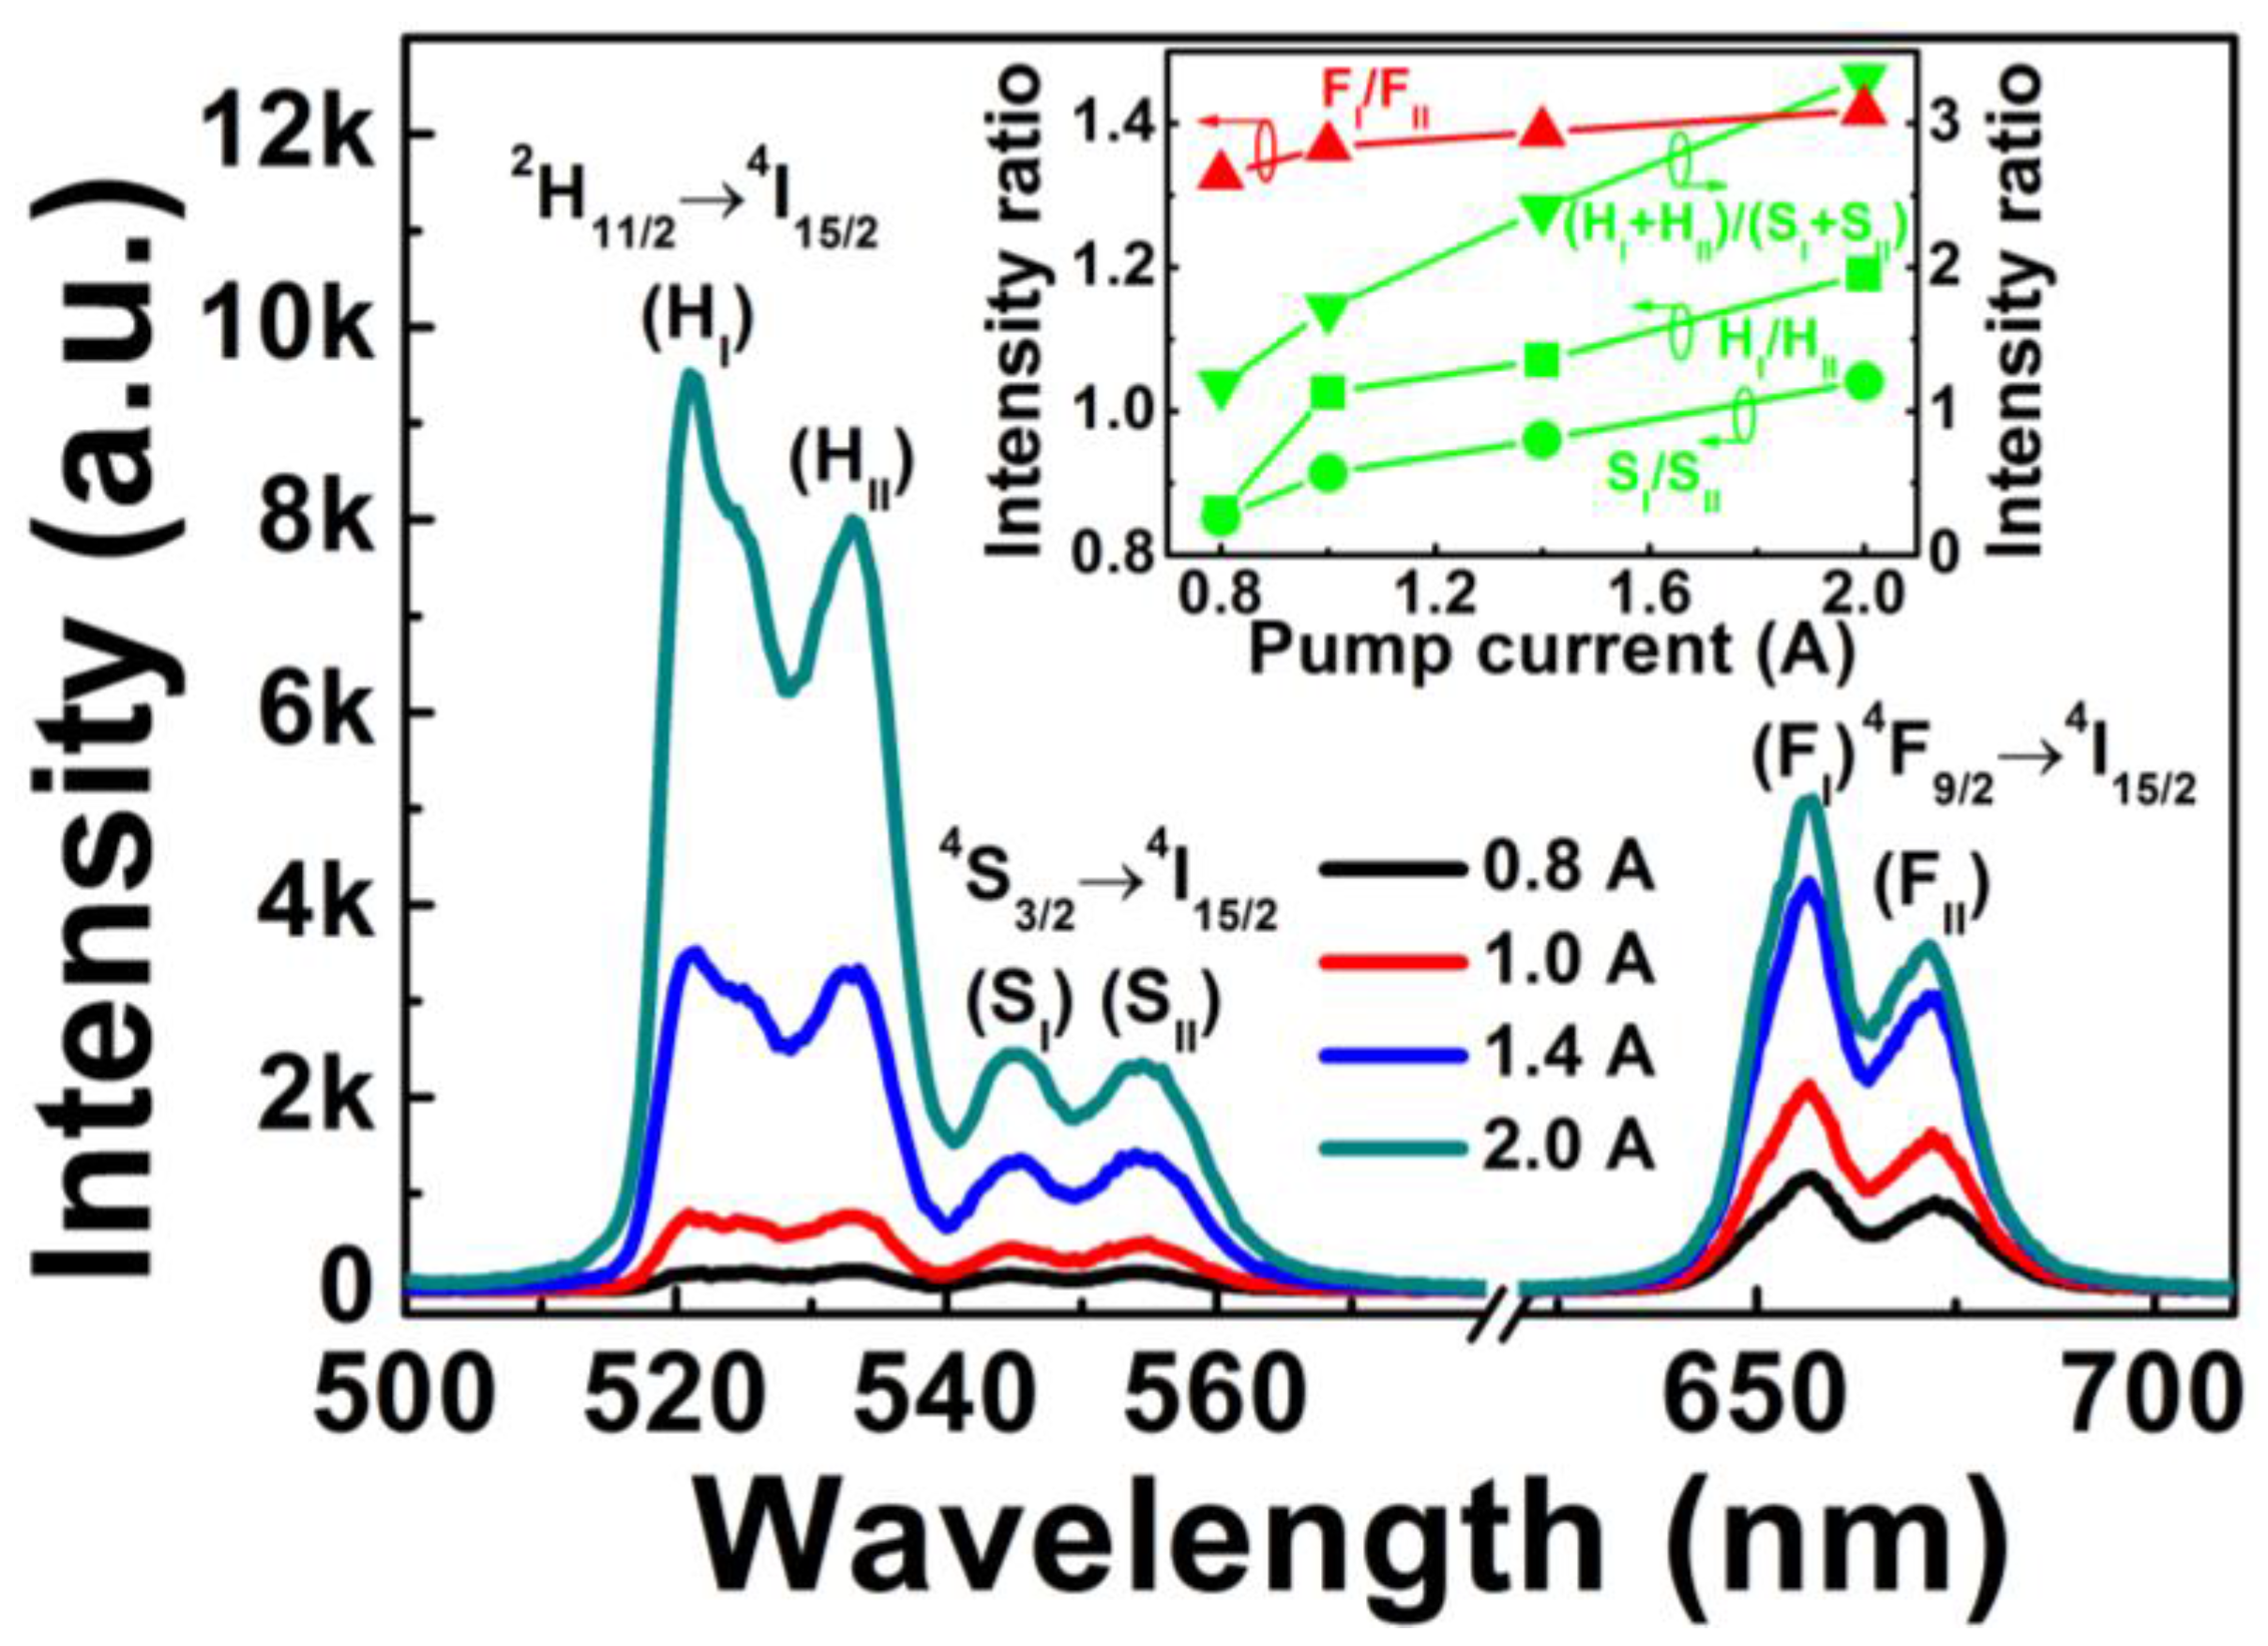
Figure 2 shows the upconversion emission spectra of Er
3+-Yb
3+-Mo
6+-codoped TiO
2 under different pump currents. Green and red upconversion emissions were observed in the wavelengths of 500–540 nm, 540–580 nm, and 620–710 nm, corresponding to
2H
11/2→
4I
15/2,
4S
3/2→
4I
15/2, and
4F
9/2→
4I
15/2 transitions of Er
3+ ions, respectively. Each transition (
2H
11/2→
4I
15/2,
4S
3/2→
4I
15/2, and
4F
9/2→
4I
15/2) was divided into two emission peaks, which indicated
2H
11/2,
4S
3/2, and
4F
9/2 levels of Er
3+ split into three coupled Stark sublevels of
2H
11/2(I)·(H
I) and
2H
11/2(II)·(H
II),
4S
3/2(I)·(S
I) and
4S
3/2(II)·(S
II), and
4F
9/2(I)·(F
I) and
4F
9/2(II)·(F
II), respectively, due to the effect of crystal field environment on Er
3+ ions. As the LD pump current increased from 0.8 to 2.0 A, the position and number of upconversion emission peaks did not change, whereas the intensity of green and red emissions markedly increased due to the increase in excitation power.
Figure 2.
Upconversion emissions spectra of Er3+-Yb3+-Mo6+-codoped TiO2 with different pump currents. Inset shows corresponding upconversion emission intensity ratios versus the pump current.
Figure 2.
Upconversion emissions spectra of Er3+-Yb3+-Mo6+-codoped TiO2 with different pump currents. Inset shows corresponding upconversion emission intensity ratios versus the pump current.
The inset in
Figure 2 shows the upconversion emission intensity ratios of H
I/H
II, S
I/S
II, F
I/F
II, and (H
I + H
II)/(S
I + S
II)
versus the pump current. All intensity ratios of H
I/H
II, S
I/S
II, F
I/F
II and (H
I + H
II)/(S
I + S
II) increased alongside the pump current, implying that the nonradiative processes of Er
3+ in Er
3+-Yb
3+-Mo
6+-codoped TiO
2 phosphor can partially transform pump energy into heat energy, therefore elevating the phosphor temperature. The temperature variation induced by increasing the pump current caused changes in the intensity ratio [
19]; this suggests that the temperature-dependent intensity ratio for the four coupled energy levels of H
I/H
II, S
I/S
II, F
I/F
II, and (H
I + H
II)/(S
I + S
II) can be utilized for optical temperature sensing.
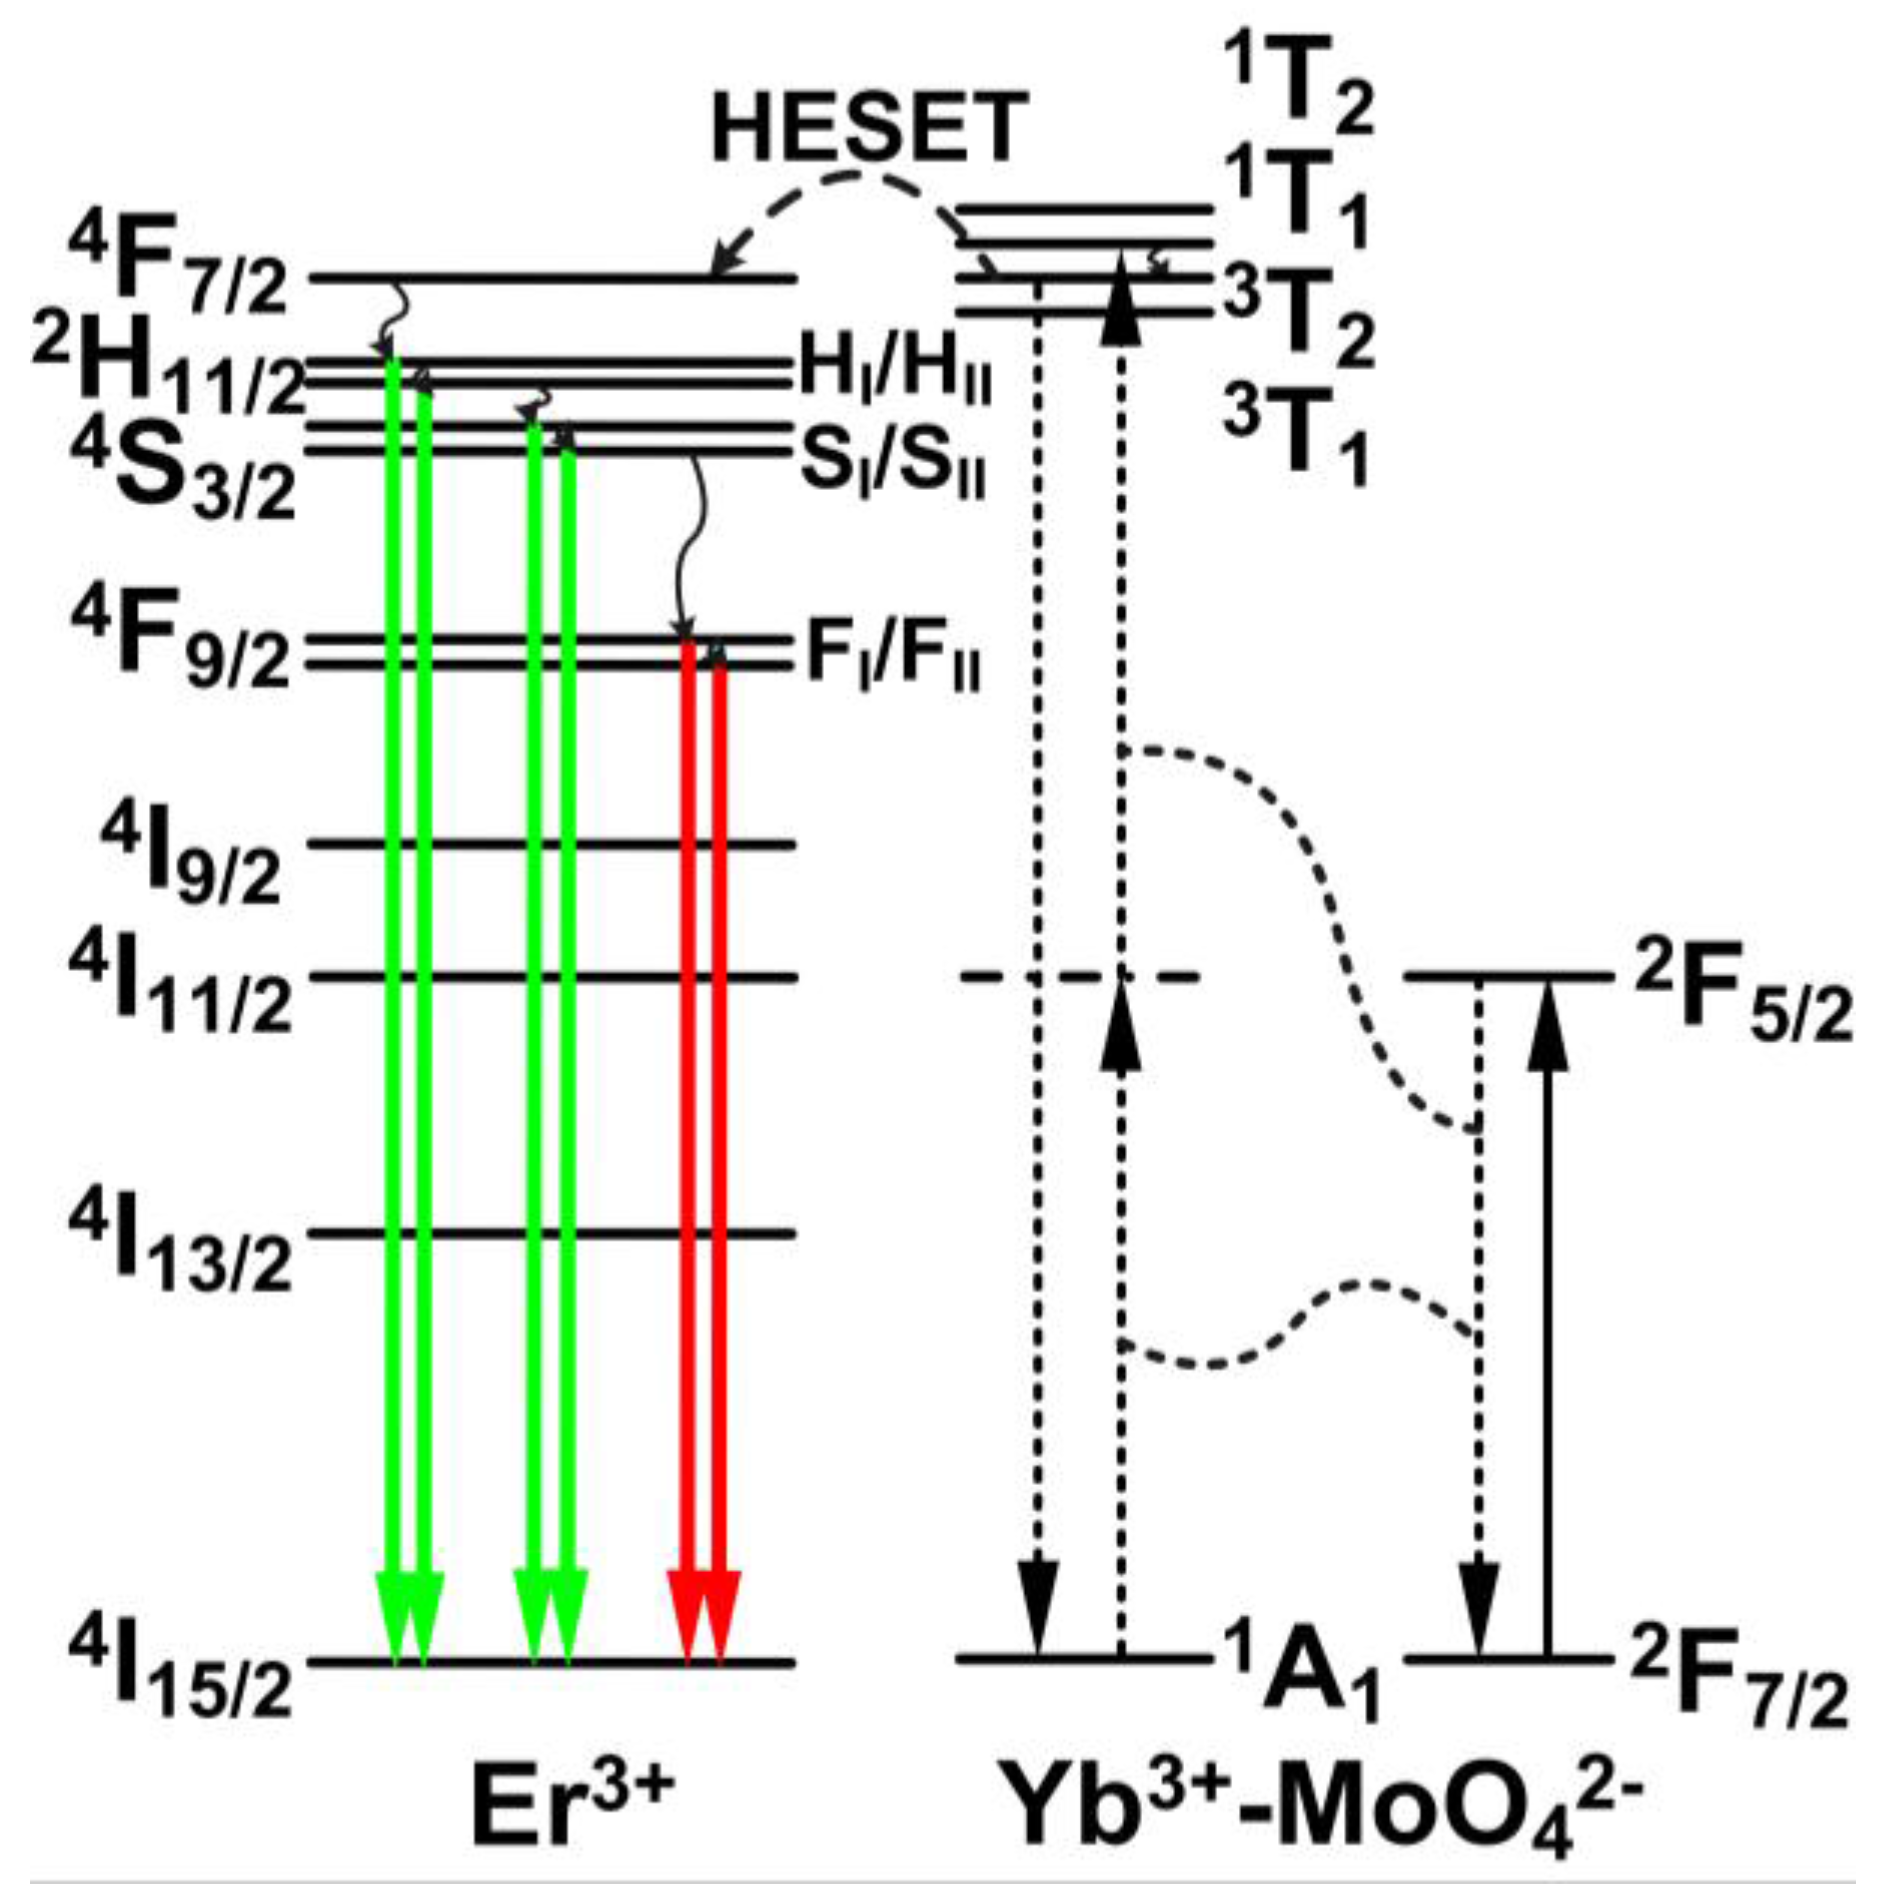
Figure 3 shows a schematic energy level diagram of the Er
3+-Yb
3+-Mo
6+-codoped TiO
2 phosphors under 976 nm LD excitation. The upconversion mechanism of Er
3+ after the addition of Mo
6+ was reported in a previous study on the sensitization of the Yb
3+-MoO
42− dimer to Er
3+ [
20,
21,
22]. Through a cooperative sensitization process in the Yb
3+-MoO
42− dimer, two excited Yb
3+ ions nonradiatively transfer their energy to MoO
42−. This process is followed by a high excited state energy transfer (HESET) to the
4F
7/2 level of Er
3+ ions. After nonradiative relaxations from
4F
7/2 to the Stark sublevels of H
I, H
II, S
I and S
II, green upconversion emissions are produced by transitions of H
I/H
II/S
I/S
II→
4I
15/2. The nonradiative relaxation from S
II to F
I and F
II levels and subsequent transitions of F
I/F
II→
4I
15/2 generate red emissions.
Figure 3.
Schematic energy level diagram of Er3+-Yb3+-Mo6+-codoped TiO2 phosphors under 976 nm LD excitation. Wavy arrows indicate nonradiative relaxation.
Figure 3.
Schematic energy level diagram of Er3+-Yb3+-Mo6+-codoped TiO2 phosphors under 976 nm LD excitation. Wavy arrows indicate nonradiative relaxation.
In order to distinguish the effects of temperature from the pump current on the intensity ratio (
Figure 2), the upconversion emission properties of Er
3+-Yb
3+-Mo
6+-codoped TiO
2 were measured under different temperatures.
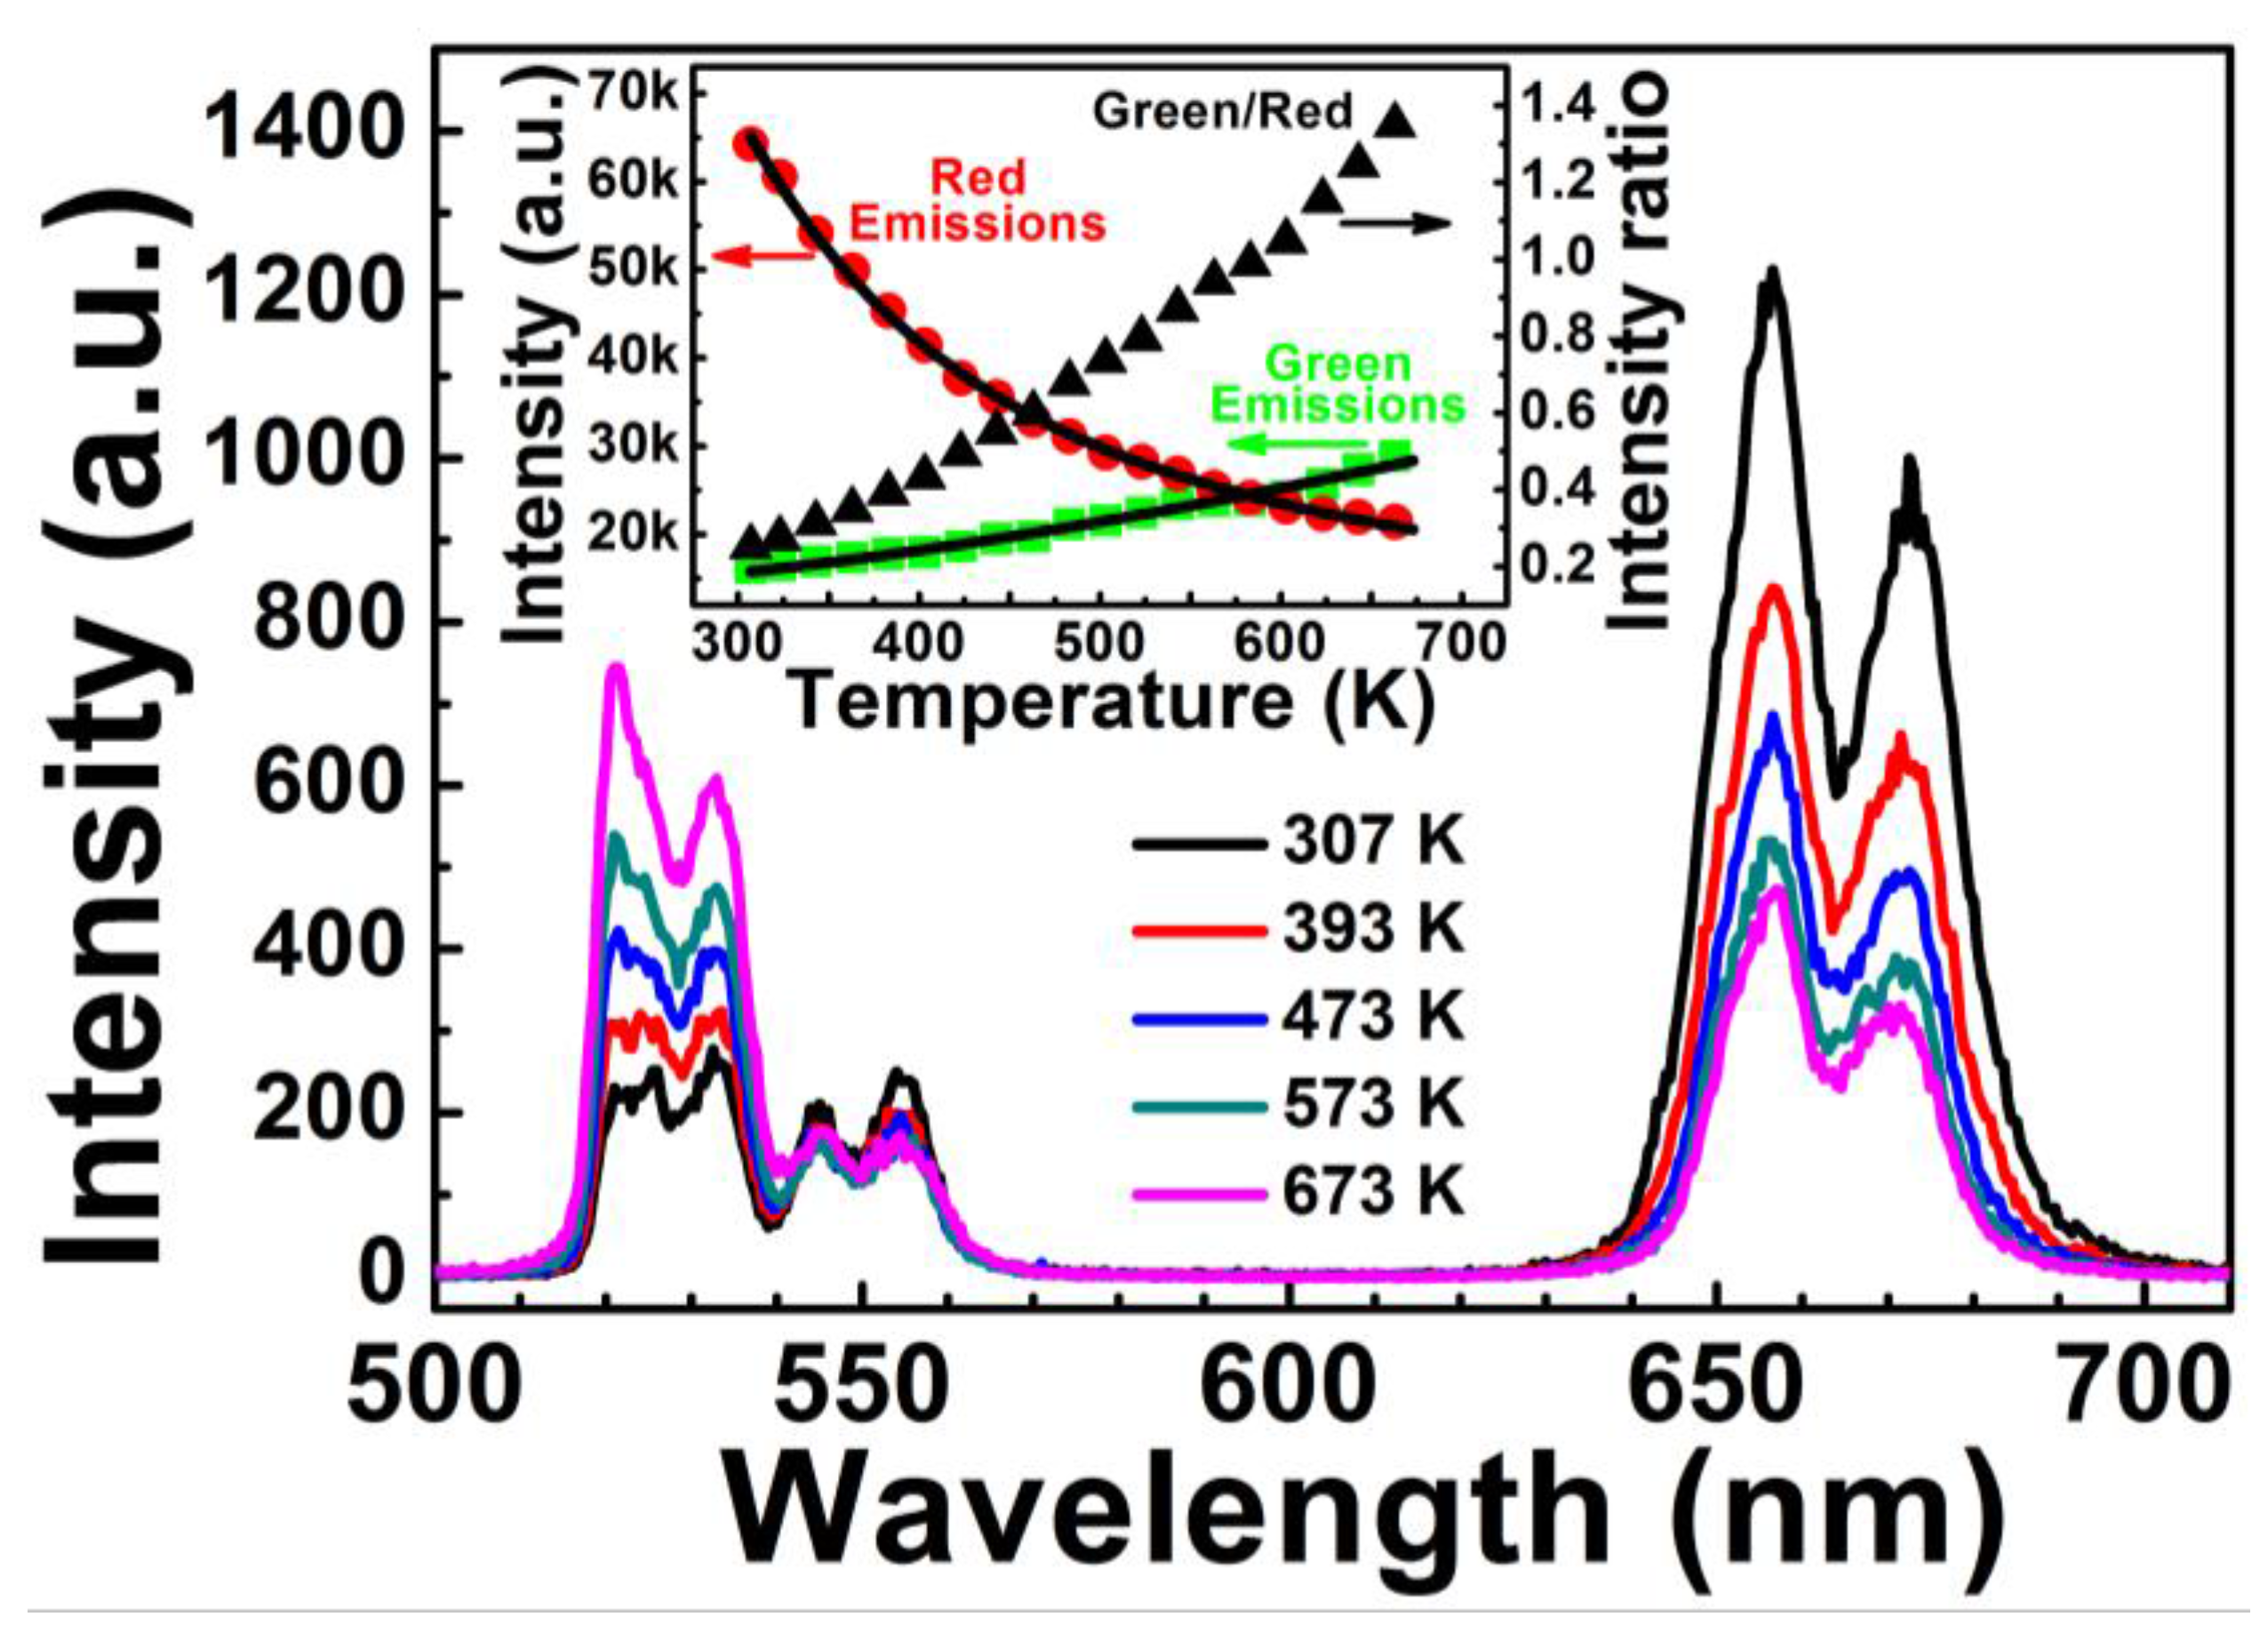
Figure 4 shows the upconversion emissions spectra of Er
3+-Yb
3+-Mo
6+-codoped TiO
2 at measured temperatures between 307 and 673 K. Changes in temperature had no influence on the bands of green and red emissions from
2H
11/2/
4S
3/2→
4I
15/2 and
4F
9/2→
4I
15/2 transitions of Er
3+ between 500 to 580 nm and 620 to 700 nm, respectively; the intensity varied with temperature, however. The inset in
Figure 4 shows the intensity of green and red emissions and the intensity ratio of green to red emissions as a function of temperature. The intensity of red emissions decreased with increasing temperature, in accordance with the classical theory of thermal quenching. Temperature-dependent intensity of the red emissions can be expressed as follows [
23]:
where
T is the absolute temperature, and
I(
T) and
I(0) are the fluorescence intensities at temperatures of
T and 0 K, respectively; Δ
E′ is the activation energy,
k is the Boltzmann constant, and
A is a constant. The temperature-dependent intensity of red emissions fits well to Equation (1), where Δ
E′
(FI+FII) = 0.074 eV.
Conversely, the intensity of green emissions increased with increasing temperature, which does not satisfy the classical theory of thermal quenching, likely due to the increased Yb
3+ absorption cross-section at elevated temperatures [
22,
24]. A general theoretical description of the green upconversion emission can be given by [
22]:
where
B is a constant, and
hν is the phonon energy participating in the multiphonon-assisted excitation. The dependence of green upconversion emissions on temperature fits well to Equation (2). The
Igreen/
Ired value increased with temperature, causing the color to turn from red to green with elevated temperature.
Figure 4.
Upconversion emissions spectra of Er3+-Yb3+-Mo6+-codoped TiO2 at different temperatures. Inset shows the integrated intensity of green and red emissions and the intensity ratio of green to red emissions as a function of temperature. The solid lines for the temperature-dependent intensity of red and green emissions are fitting curves by Equations (1) and (2).
According to previous research [
1], the relative population of two “thermally coupled” energy levels with separation of the order of thermal energy follows a Boltzmann-type population distribution, causing variation in the transitions of two closely spaced levels at elevated temperature if pumped through a continuous light source. After populations are thermalized at two closely spaced levels, the FIR of upconversion emissions (
R) related to the transitions of both levels can be written as follows:
where
Iupper,
Ilower,
Nupper, and
Nlower are the fluorescence intensity and number of ions for the upper and lower thermalizing energy levels, respectively; Δ
E is the energy gap between two coupled levels, and
C is a constant relative to the degeneracy, emission cross-section, and angular frequency of corresponding transitions. Equation (3) suggests that FIR is related to the energy gap Δ
E and temperature
T.
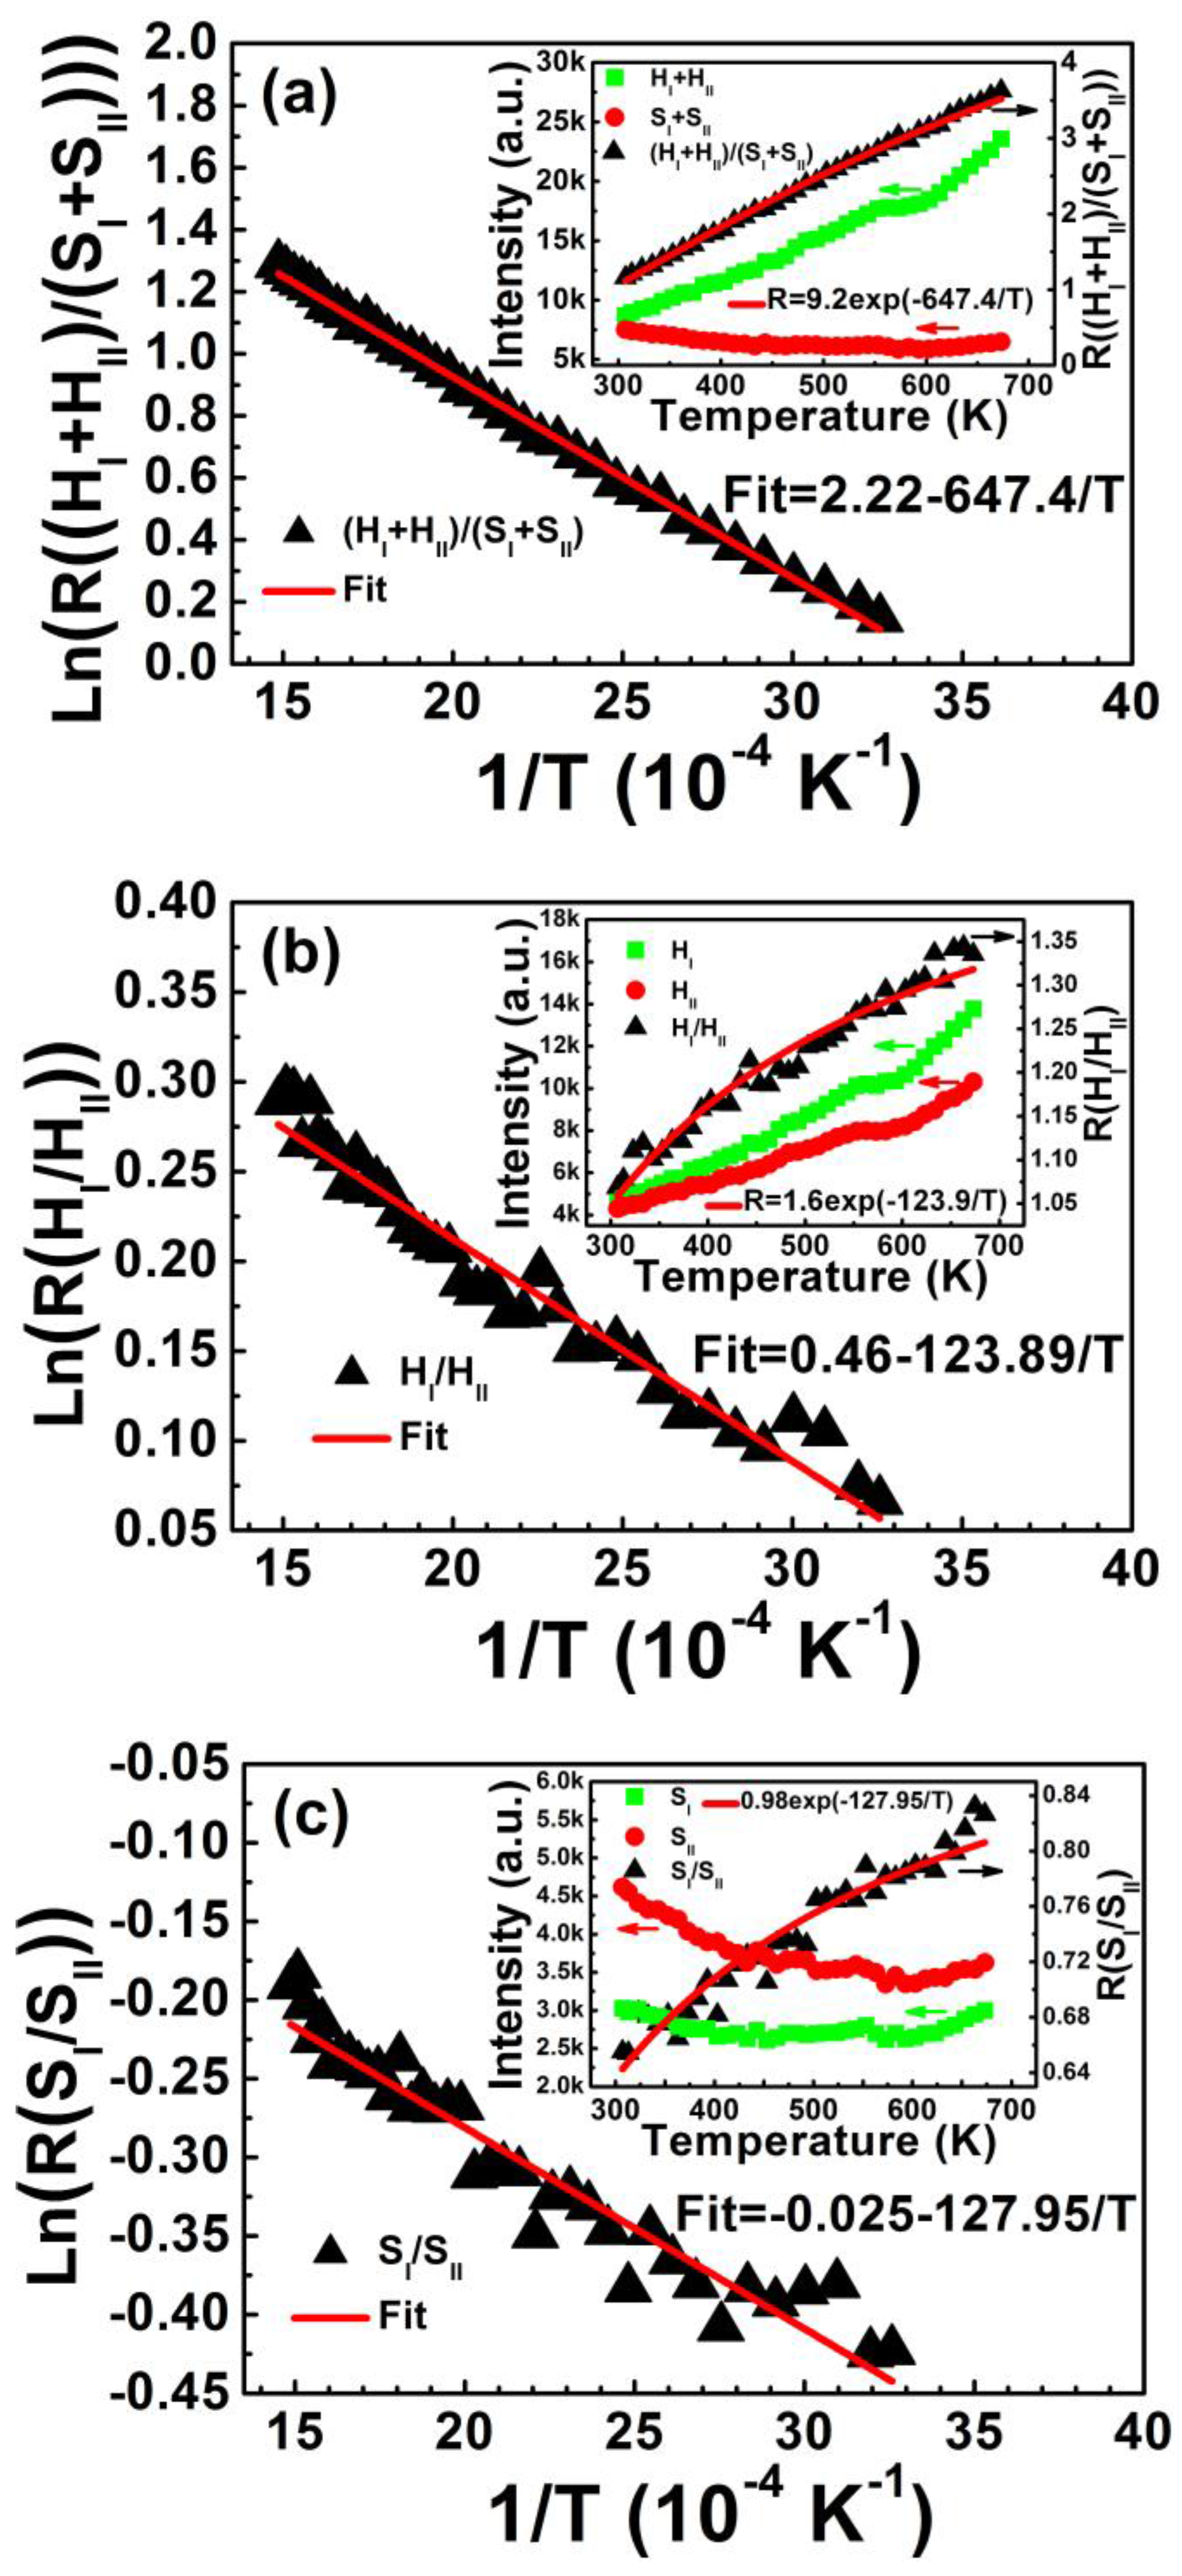
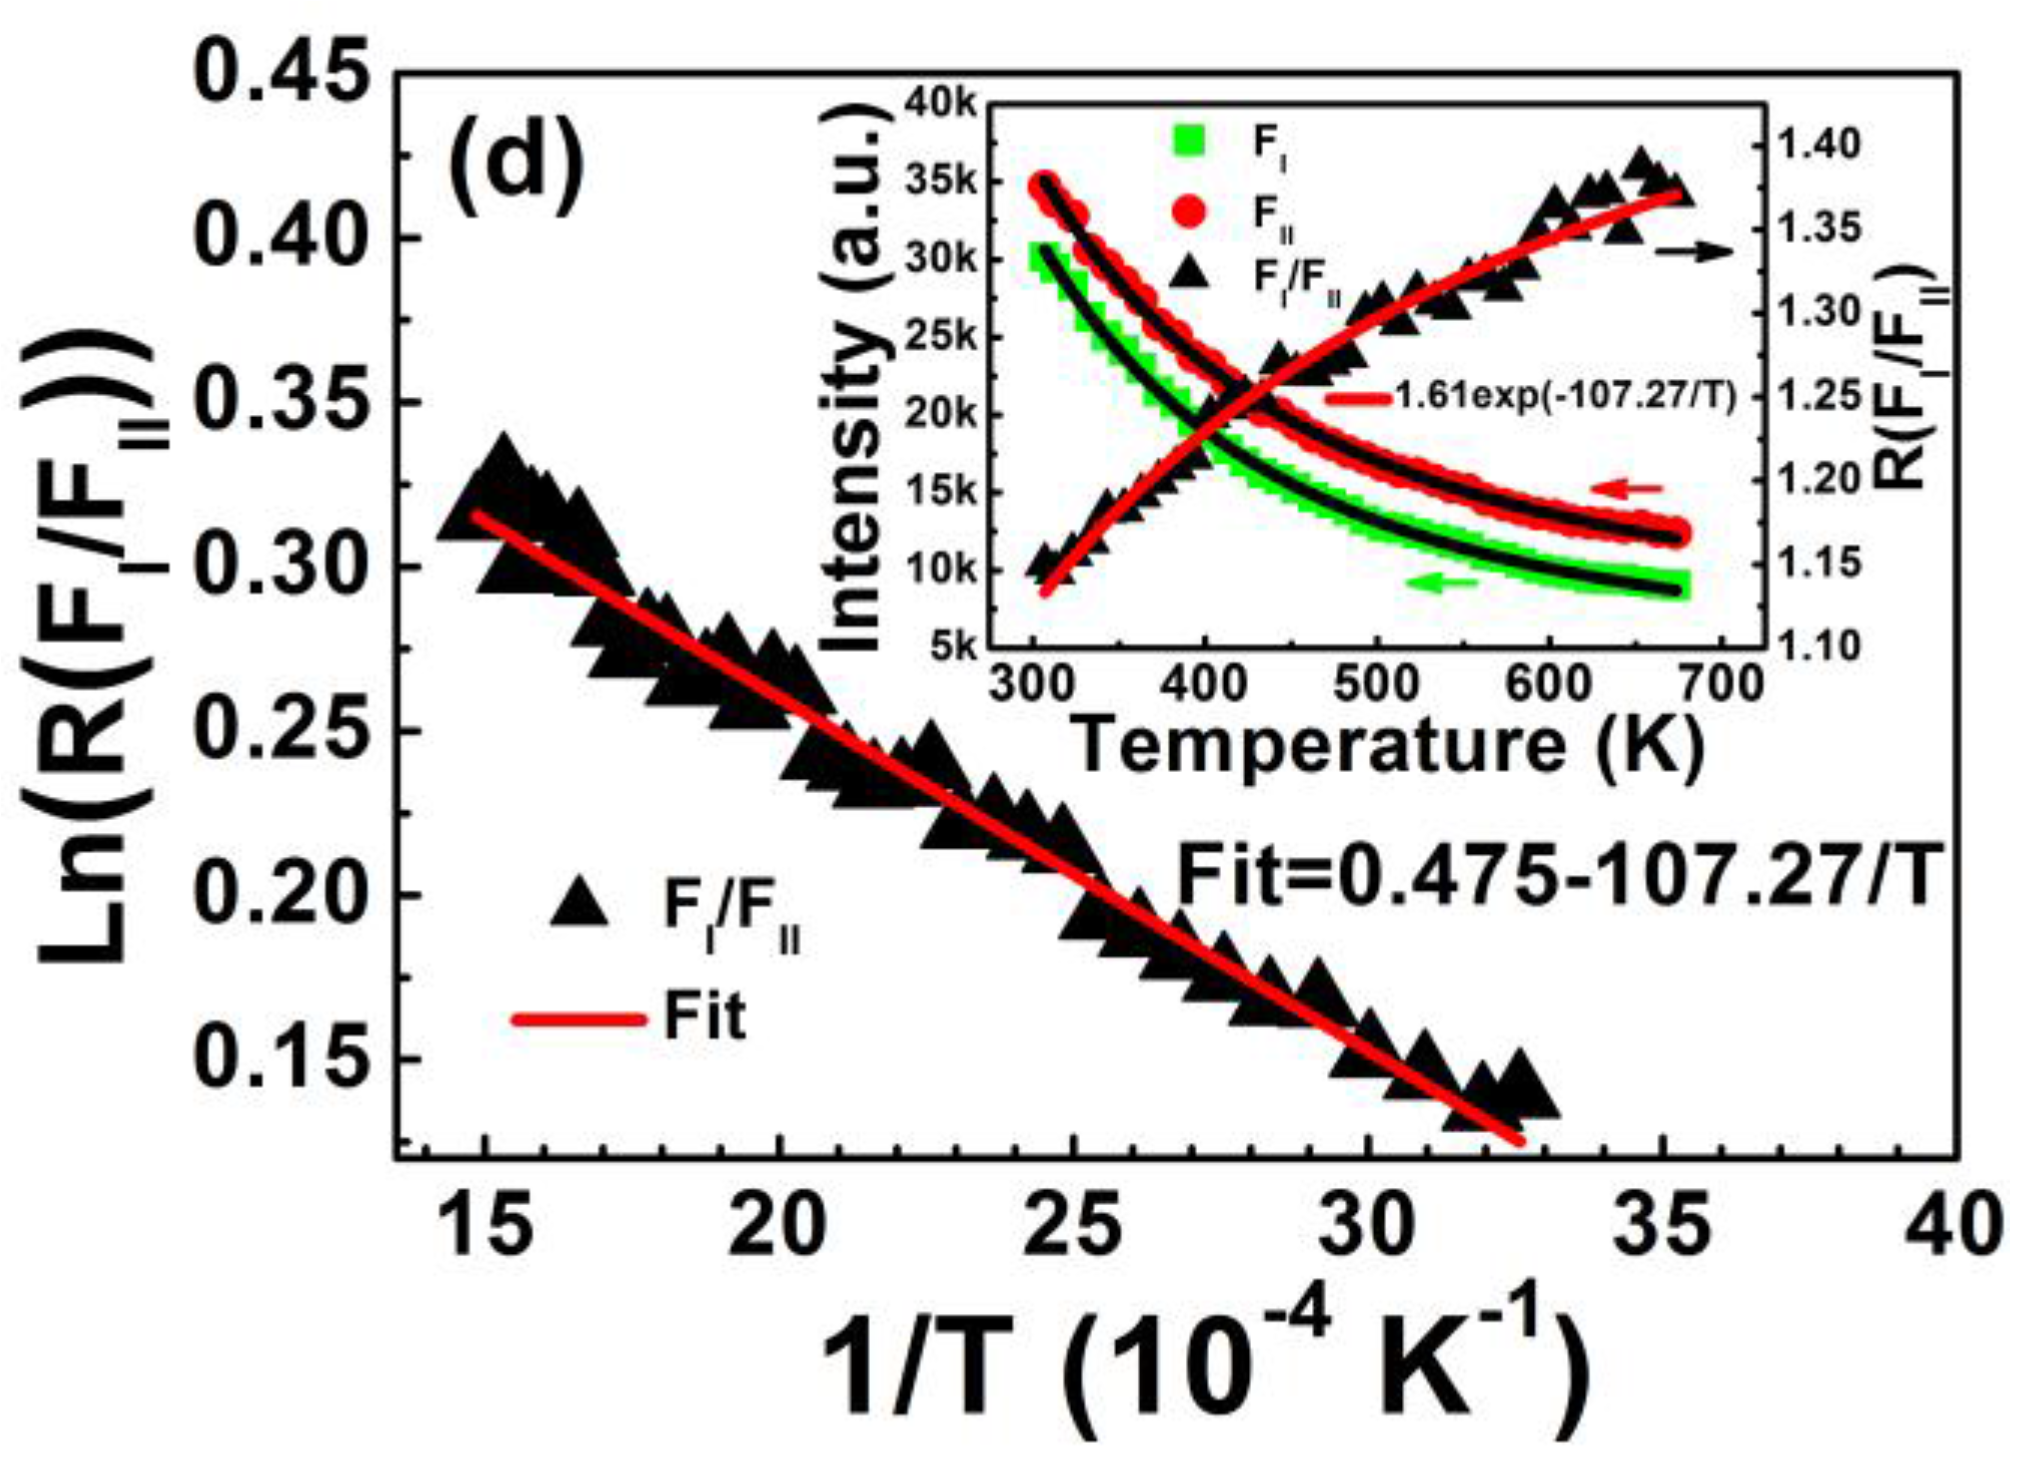
Figure 5 shows FIR plots of (H
I + H
II)/(S
I + S
II), H
I/H
II, S
I/S
II, and F
I/F
II as a function of inverse absolute temperature from 307 to 673 K. The inset shows corresponding upconversion emission intensity and the intensity ratio relative to temperature. The experimental data fits well to Equation (3). Energy gaps Δ
E of the four coupled energy levels of (H
I + H
II)/(S
I + S
II), H
I/H
II, S
I/S
II, and F
I/F
II are calculated in
Table 1. The decreased intensity of two red emissions with elevated temperature, shown in the inset of
Figure 5d, can also be fitted to Equation (1). The activation energy of F
I and F
II levels is calculated as Δ
E′
FI = 0.069 eV and Δ
E′
FII = 0.080 eV, which is consistent with the average activation energy of (F
I + F
II) level (Δ
E′
(FI+FII) = 0.074 eV) shown in
Figure 4.
Figure 5.
FIR plots of (a) (HI + HII)/(SI + SII); (b) HI/HII; (c) SI/SII; and (d) FI/FII as a function of inverse temperature in the range of 307–673 K. Insets show corresponding upconversion emission intensity and intensity ratio relative to temperature. FIR plots are fitted by Equation (3) and the temperature-dependent intensities of red emissions in (d) are fitted by Equation (1).
Table 1.
Energy gap of coupled energy levels ΔE, pre-exponential factor C, maximum sensitivity Smax, temperature of maximum sensitivity Tmax and upconversion emission intensity for the four coupled energy levels of (HI + HII)/(SI + SII), HI/HII, SI/SII and FI/FII.
Table 1.
Energy gap of coupled energy levels ΔE, pre-exponential factor C, maximum sensitivity Smax, temperature of maximum sensitivity Tmax and upconversion emission intensity for the four coupled energy levels of (HI + HII)/(SI + SII), HI/HII, SI/SII and FI/FII.
| Coupled Energy Levels | (HI + HII)/(SI + SII) | HI/HII | SI/SII | FI/FII |
|---|
| ΔE (eV) | 0.0558 | 0.0107 | 0.0110 | 0.0093 |
| C | 9.2 | 1.6 | 0.98 | 1.61 |
| Smax (10−4·K−1) | 76.7 | 69.7 | 41.4 | 81.0 |
| Tmax (K) | 324 | 62 | 64 | 54 |
| Upconversion intensity | Higher | Higher | Low | Highest |
For optical temperature-sensing applications, it is crucial to know the rate at which the FIR changes with temperature, known as the absolute sensitivity
Sa, which is expressed as follows [
1]:
Equation (4) makes clear that the appropriate selection of two thermally coupled energy levels with a suitable energy difference Δ
E is very important. Larger Δ
E benefits absolute sensitivity and accurate measurement of emission intensity, due to the decrease of fluorescence peak overlap originating from the two individual thermally coupled energy levels. Knowing this, the absolute sensitivity
Sa when using coupled energy levels of (H
I + H
II)/(S
I + S
II) (with the largest possible Δ
E = 0.0558 eV) is higher than those using the other three coupled levels, as shown in
Table 1. The energy gap Δ
E must be not too large, though, or thermalization no longer occurs.
Considering practical applications, it is extremely useful to be aware of variations in sensitivity with temperature. Relative sensitivity
Sr is expressed [
25]:
Compared to absolute sensitivity
Sa, relative sensitivity
Sr is dependent on not only energy gap Δ
E, but also the intensity ratio FIR. Equation (3) indicates that larger FIR causes larger
C. Thus, larger Δ
E and FIR (or
C) contribute to higher
Sr.
Table 1 also shows pre-exponential factor
C values for the four pair energy levels (H
I + H
II)/(S
I + S
II), H
I/H
II, S
I/S
II, and F
I/F
II. The coupled energy levels of (H
I + H
II)/(S
I + S
II) processed larger relative sensitivity
Sr than those of H
I/H
II, F
I/F
II, or S
I/S
II.
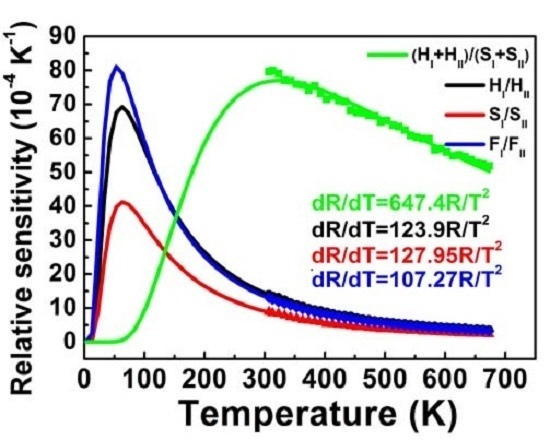
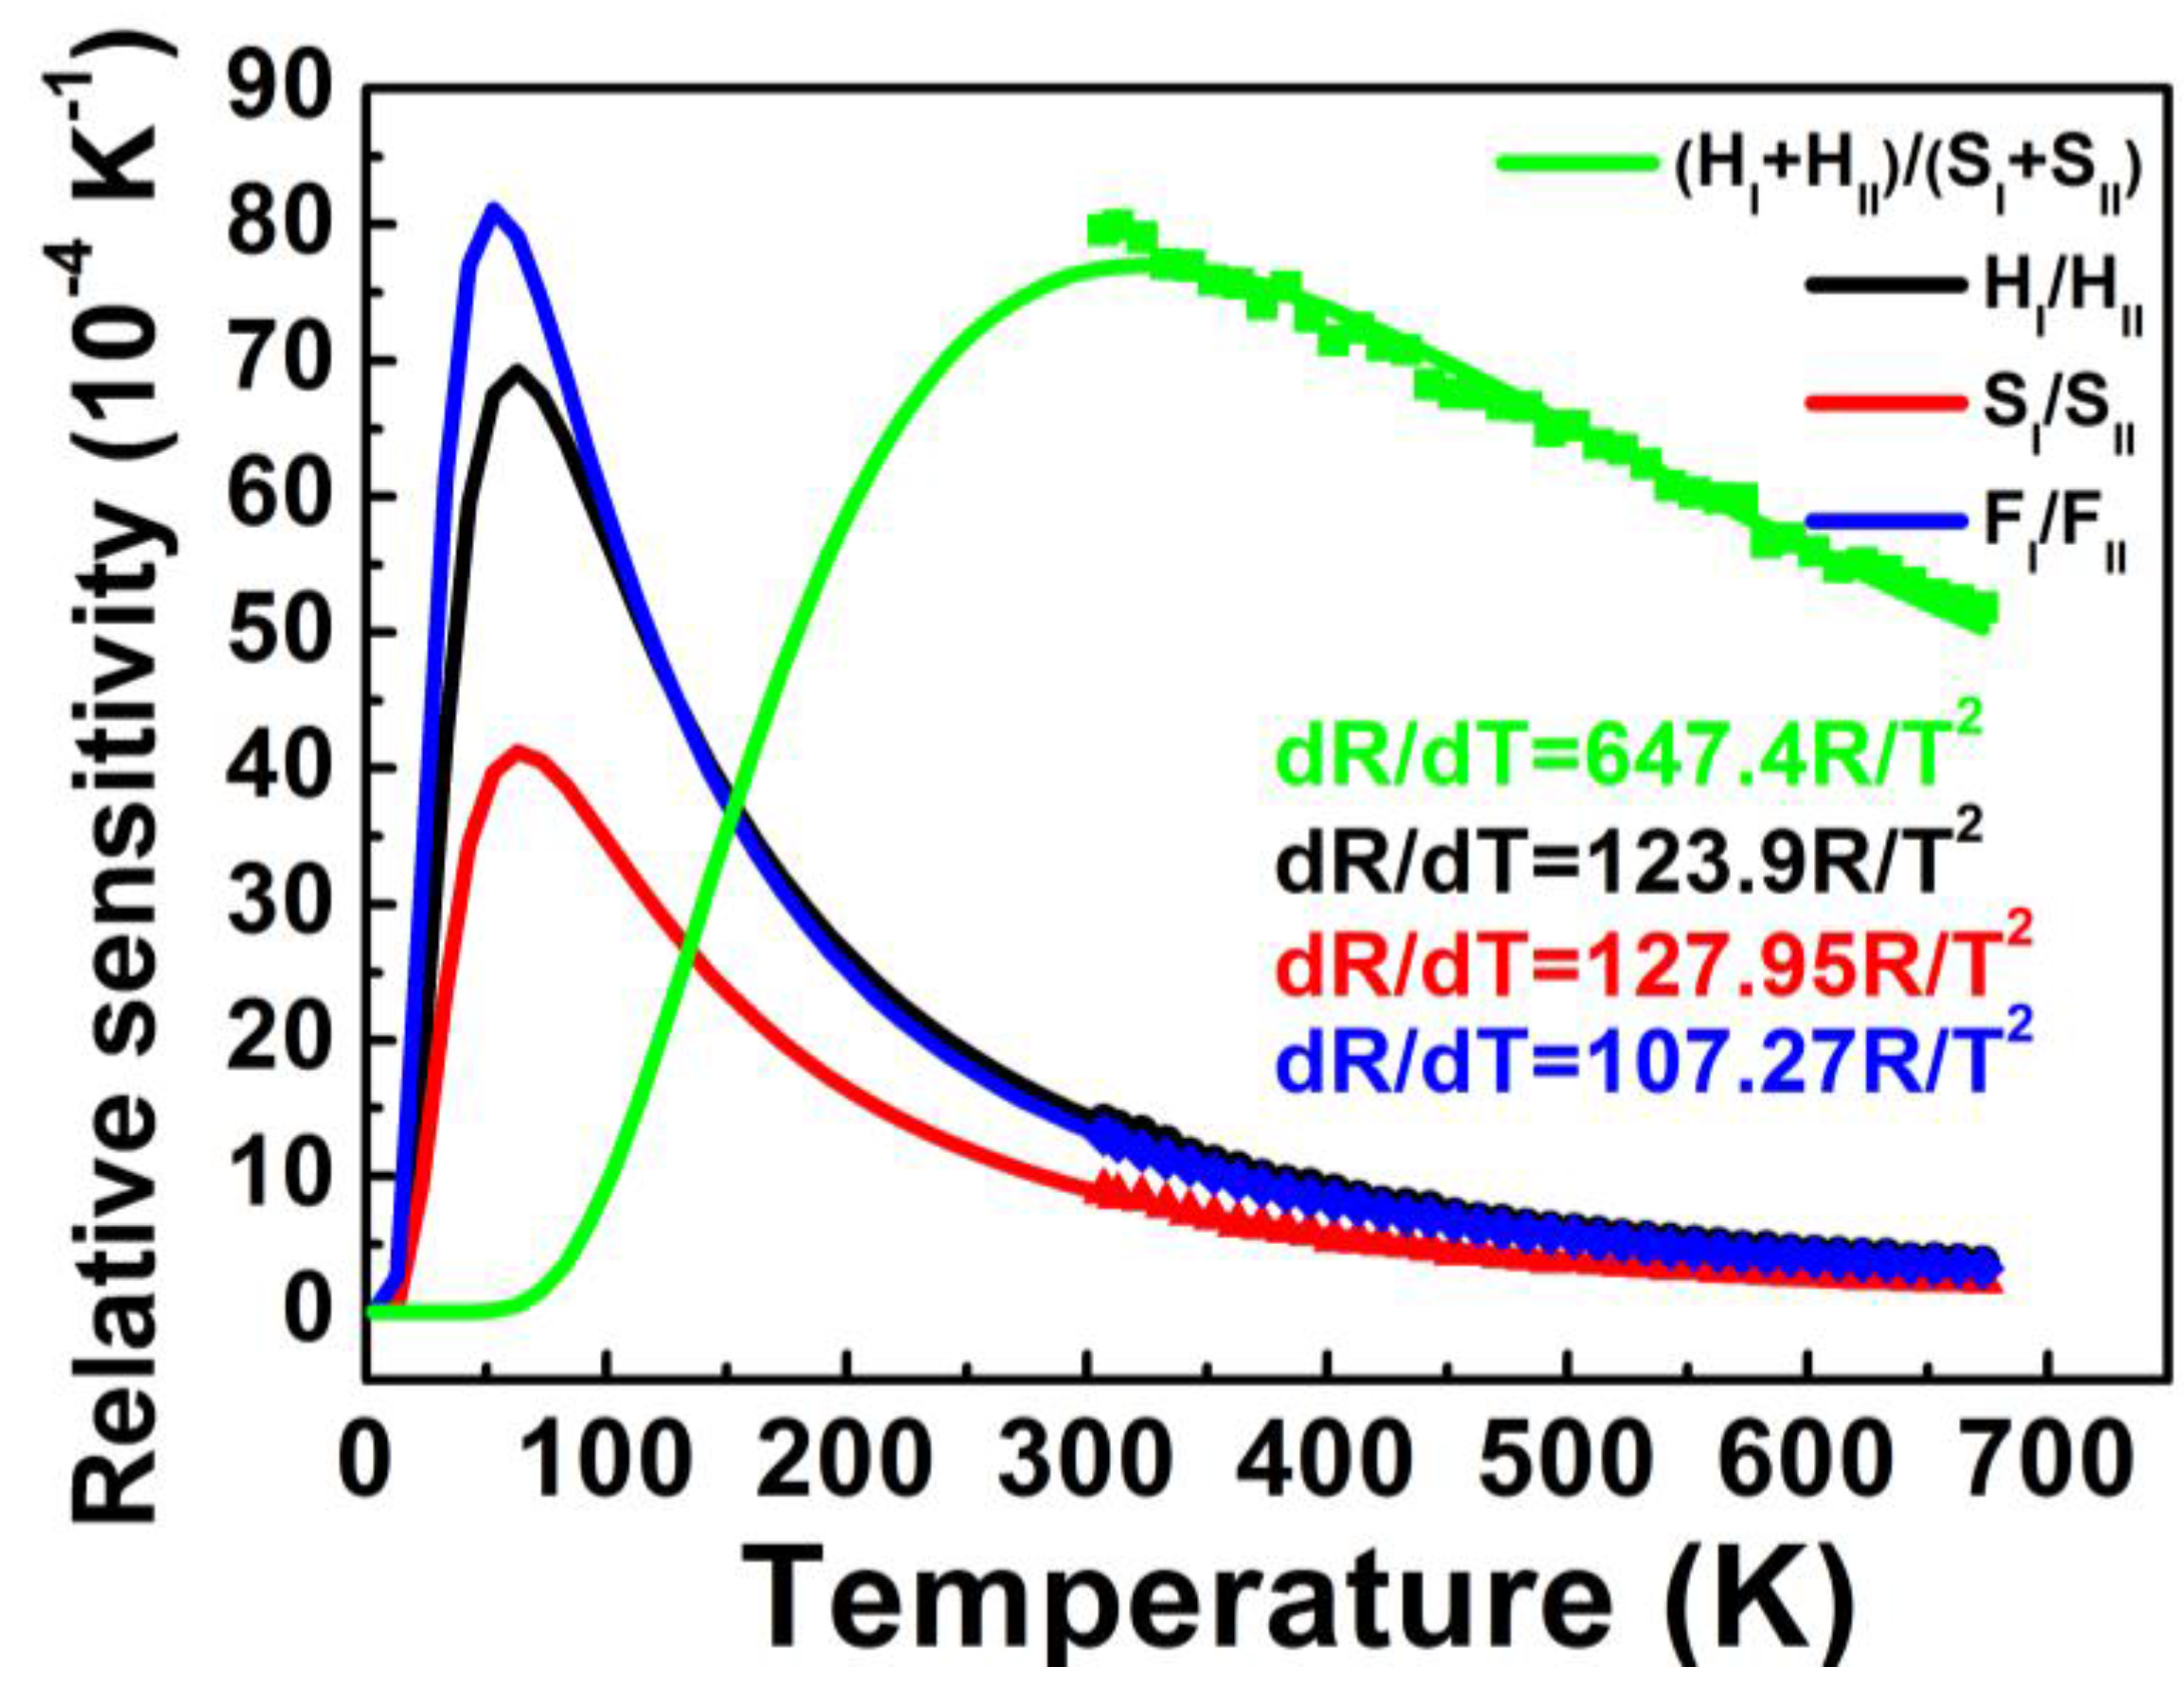
Sr as a function of temperature for the four coupled energy levels calculated by Equation (5) is shown in
Figure 6, in accordance with the above results in the measured temperature range 307–673 K.
Figure 6.
Relative sensitivities Sr as a function of temperature for the four coupled energy levels of (HI + HII)/(SI + SII), HI/HII, SI/SII and FI/FII. Closed symbols are the experimental data and the lines are the theoretical values calculated by Equation (5).
Figure 6.
Relative sensitivities Sr as a function of temperature for the four coupled energy levels of (HI + HII)/(SI + SII), HI/HII, SI/SII and FI/FII. Closed symbols are the experimental data and the lines are the theoretical values calculated by Equation (5).
Maximum sensitivity
Smax and temperature
Tmax, at which the sensor has maximum sensitivity
Smax, are of utmost importance because these two parameters indicate the highest sensitivity properties and optimum operating temperature range of optical thermal sensors. According to Equation (5),
Smax and
Tmax can be calculated by
as follows:
Equation (6) indicates that a larger pre-exponential factor
C and smaller energy difference Δ
E of coupled energy levels help to increase
Smax. Equation (7) shows that
Tmax is relative to the energy difference Δ
E, in which the sensor with a larger Δ
E has a higher
Tmax.
Smax and
Tmax for the four coupled energy levels are shown in
Table 1. The highest
Tmax was found for (H
I + H
II)/(S
I + S
II) coupled energy levels used for thermal sensing, due to a larger Δ
E. The relatively larger
C and smallest Δ
E in F
I/F
II coupled energy levels used for thermal sensing resulted in the highest sensitivity
Smax.
Temperature measurement error can be calculated using the relation [
8,
26]:
Larger
Sr and smaller Δ
R imply better accuracy. As shown in
Figure 6, larger
Sr at a higher temperature for coupled energy levels of (H
I + H
II)/(S
I + S
II) led to a better accuracy in the high temperature range. Likewise, better accuracy can be expected in the low temperature range using H
I/H
II, S
I/S
II and F
I/F
II coupled energy levels for thermal sensing.
The separation of two coupled energy levels Δ
E should be large enough to avoid overlap of the two fluorescence emissions and to produce efficient luminescence for feasible and accurate intensity measurement. The efficient luminescence of Er
3+-doped materials also contributes to the ready detection of luminescence and Δ
R accuracy, where only low excitation power is needed.
Table 1 shows where (H
I + H
II)/(S
I + S
II) coupled energy levels had the highest accuracy of all samples, due to a larger Δ
E and the strongest luminescence intensity; conversely, S
I/S
II coupled energy levels had the lowest accuracy, evidenced by a smaller Δ
E and the lowest luminescence intensity, which are altogether consistent with the results shown in
Figure 5.


