Article

Development of a Wireless and Passive SAW-Based Chemical Sensor for Organophosphorous Compound Detection

1
Zhejiang University of Media and Communications, Hangzhou 310018, China
2
State Key Laboratory of Acoustics, Institute of Acoustics, Chinese Academy of Sciences, No.21, North 4th Ring West Road, Beijing 100190, China
3
State Key Laboratory of NBC Protection for Civilian, Yangfang, Changping District, Beijing 102205, China
*
Author to whom correspondence should be addressed.
Sensors 2015, 15(12), 30187-30198; https://doi.org/10.3390/s151229793
Submission received: 29 October 2015 / Revised: 20 November 2015 / Accepted: 30 November 2015 / Published: 3 December 2015
(This article belongs to the Section Chemical Sensors)

Abstract

:
A new wireless and passive surface acoustic wave (SAW)-based chemical sensor for organophosphorous compound (OC) detection is presented. A 434 MHz reflective delay line configuration composed by single phase unidirectional transducers (SPUDTs) and three shorted reflectors was fabricated on YZ LiNbO3 piezoelectric substrate as the sensor element. A thin fluoroalcoholpolysiloxane (SXFA) film acted as the sensitive interface deposited onto the SAW propagation path between the second and last reflectors of the SAW device. The first reflector was used for the temperature compensation utilizing the difference method. The adsorption between the SXFA and OC molecules modulates the SAW propagation, especially for the time delay of the SAW, hence, the phase shifts of the reflection peaks from the corresponding reflectors can be used to characterize the target OC. Prior to the sensor fabrication, the coupling of modes (COM) and perturbation theory were utilized to predict the SAW device performance and the gas adsorption. Referring to a frequency-modulated continuous wave (FMCW)-based reader unit, the developed SAW chemical sensor was wirelessly characterized in gas exposure experiments for dimethylmethylphosphonate (DMMP) detection. Sensor performance parameters such as phase sensitivity, repeatability, linearity, and temperature compensation were evaluated experimentally.

Graphical Abstract

1. Introduction

Obviously, chemical sensors with high sensitivity and fast response for organophosphorous compound (OC) detection in real time are necessary for responding to the threats of terrorism and environmental pollution. Among a wide range of available chemical sensors, surface acoustic wave (SAW)-based chemical sensors exhibit many unique advantages such as high sensitivity, ambient-temperature operation, fast response, low cost, easy reproducibility, and good stability [1,2,3,4,5,6]. Typical SAW-based chemical sensor systems are composed of a differential SAW oscillator array and a chemical interface coated onto the SAW propagation path of the sensing SAW device. The SAW propagation is modulated as the vapor is adsorbed selectively and reversibly on the chemical interface. The corresponding shift in SAW velocity induces changes in the differential oscillation frequency, which are used to characterize the target vapor. Many SAW chemical sensor prototypes have been reported, and even commercialized in OC sensing [7]. In addition to the above characteristics and working configuration, the SAW sensor exhibits another unique advantage, which is the option of implementing wireless and passive measurements for gas sensing. Recently, a variety of passive and wireless sensors for many physical quantities like temperature, pressure, torque, strain, and even moisture were realized using SAW technology [8,9,10,11,12]. In particular, Wang et al. proposed some passive SAW-based sensors for wirelessly sensing some toxic or harmful gases like CO2, NO2, and some other volatile organic compounds, where the phase signal from the reflectors of the SAW reflective delay line configuration induced by the gas adsorption between the sensitive interface and target gas was picked for gas sensing. Clear sensor responses were observed in wireless measurements [13,14,15,16]. Lieberzeit et al. reported some considerations on wireless and passive SAW sensors utilizing RFID tags for mass-sensitive detection of humidity and vapors, with a detection limit down to 50 ppm for tetrachloroethene and 1% for relative humidity [17]. Huang et al. developed a passive wireless hydrogen SAW sensor utilizing Pt-coated ZnO nanorods [18]. Westafer et al. presented the characterization of a dispersive SAW reflective delay line for sensing ozone in air at ppb concentration [19]. The above works provide a good starting point for development of a real practical wireless and passive SAW chemical sensor.
In this paper, a wireless and passive SAW chemical sensor system was developed for OC sensing referring to a frequency-modulated continuous wave (FMCW)-based reader unit. The schematic and working principle of the sensor are illustrated in Figure 1. The proposed sensor system is composed of a SXFA-coated SAW reflective delay line, FMCW-based reader unit, and the connected antennas. The use of fluoroalcoholpolysiloxane (SXFA) was frequently reported for chemical interfaces for OC detection because of its low crystallinity and glass transition temperature, and high permeability [20,21]. The SAW reflective delay line acted as the sensor chip, in which single phase unidirectional transducers (SPUDTs) and three shorted grating reflectors were placed in a row along the SAW propagation direction on an YZ LiNbO3 piezoelectric substrate. SXFA film was coated onto the surface between the second and third reflectors of the SAW device for DMMP sensing. The first reflector of the SAW device was used for temperature compensation utilizing the difference method. When the SPUDTs receive electromagnetic (EM) energy from the reader unit through the connected antenna, the SAW is generated by the SPUDTs through the piezoelectric effect, and propagates towards the reflectors. The propagating SAW is reflected partially from the reflectors, and reconverted into EM waves by the SPUDTs and transmitted to the reader unit. The adsorbed OCs in the SXFA film modulate the SAW propagation, resulting in shifts in SAW velocity and attenuation, and changes in time delay of the reflection peaks from the reflectors. Therefore, target OC concentrations can be extracted by evaluating the differential phase signals, Φsensor, as Φsensor = 2 × π × f × (Δτ32 − w × Δτ21), where f is the operation sensor frequency, Δτ32 and Δτ21 are the measured changes in time delays among the three reflection peaks from the peaks including the information of environmental temperature and target species concentration, and w is the ratio of the second-to-third reflector distance to the first-to-second reflector distance [13]. It is obvious that the proposed chemical sensor presents many advantages:
  • The sensor chip is maintenance-free because it is passive, and does not require any power supply to operate;
  • The working environment can be very hazardous such as contaminated and high voltage areas because of the wireless measurement;
  • Temperature compensation can be accomplished well by using the sensor chip design through the differential method [13,14,15].
Prior to the sensor fabrication, the coupling of modes (COM) and perturbation theory were utilized to predict the SAW device performance and describe the gas adsorption of the sensor. Then, the developed SAW chemical sensor system was characterized wirelessly in DMMP gas experiments. The phase sensitivity, repeatability, and temperature compensation were investigated experimentally.
Figure 1. Schematic and working principle of the proposed SAW chemical sensor.
Sensors 15 29793 g001

2. Design Considerations
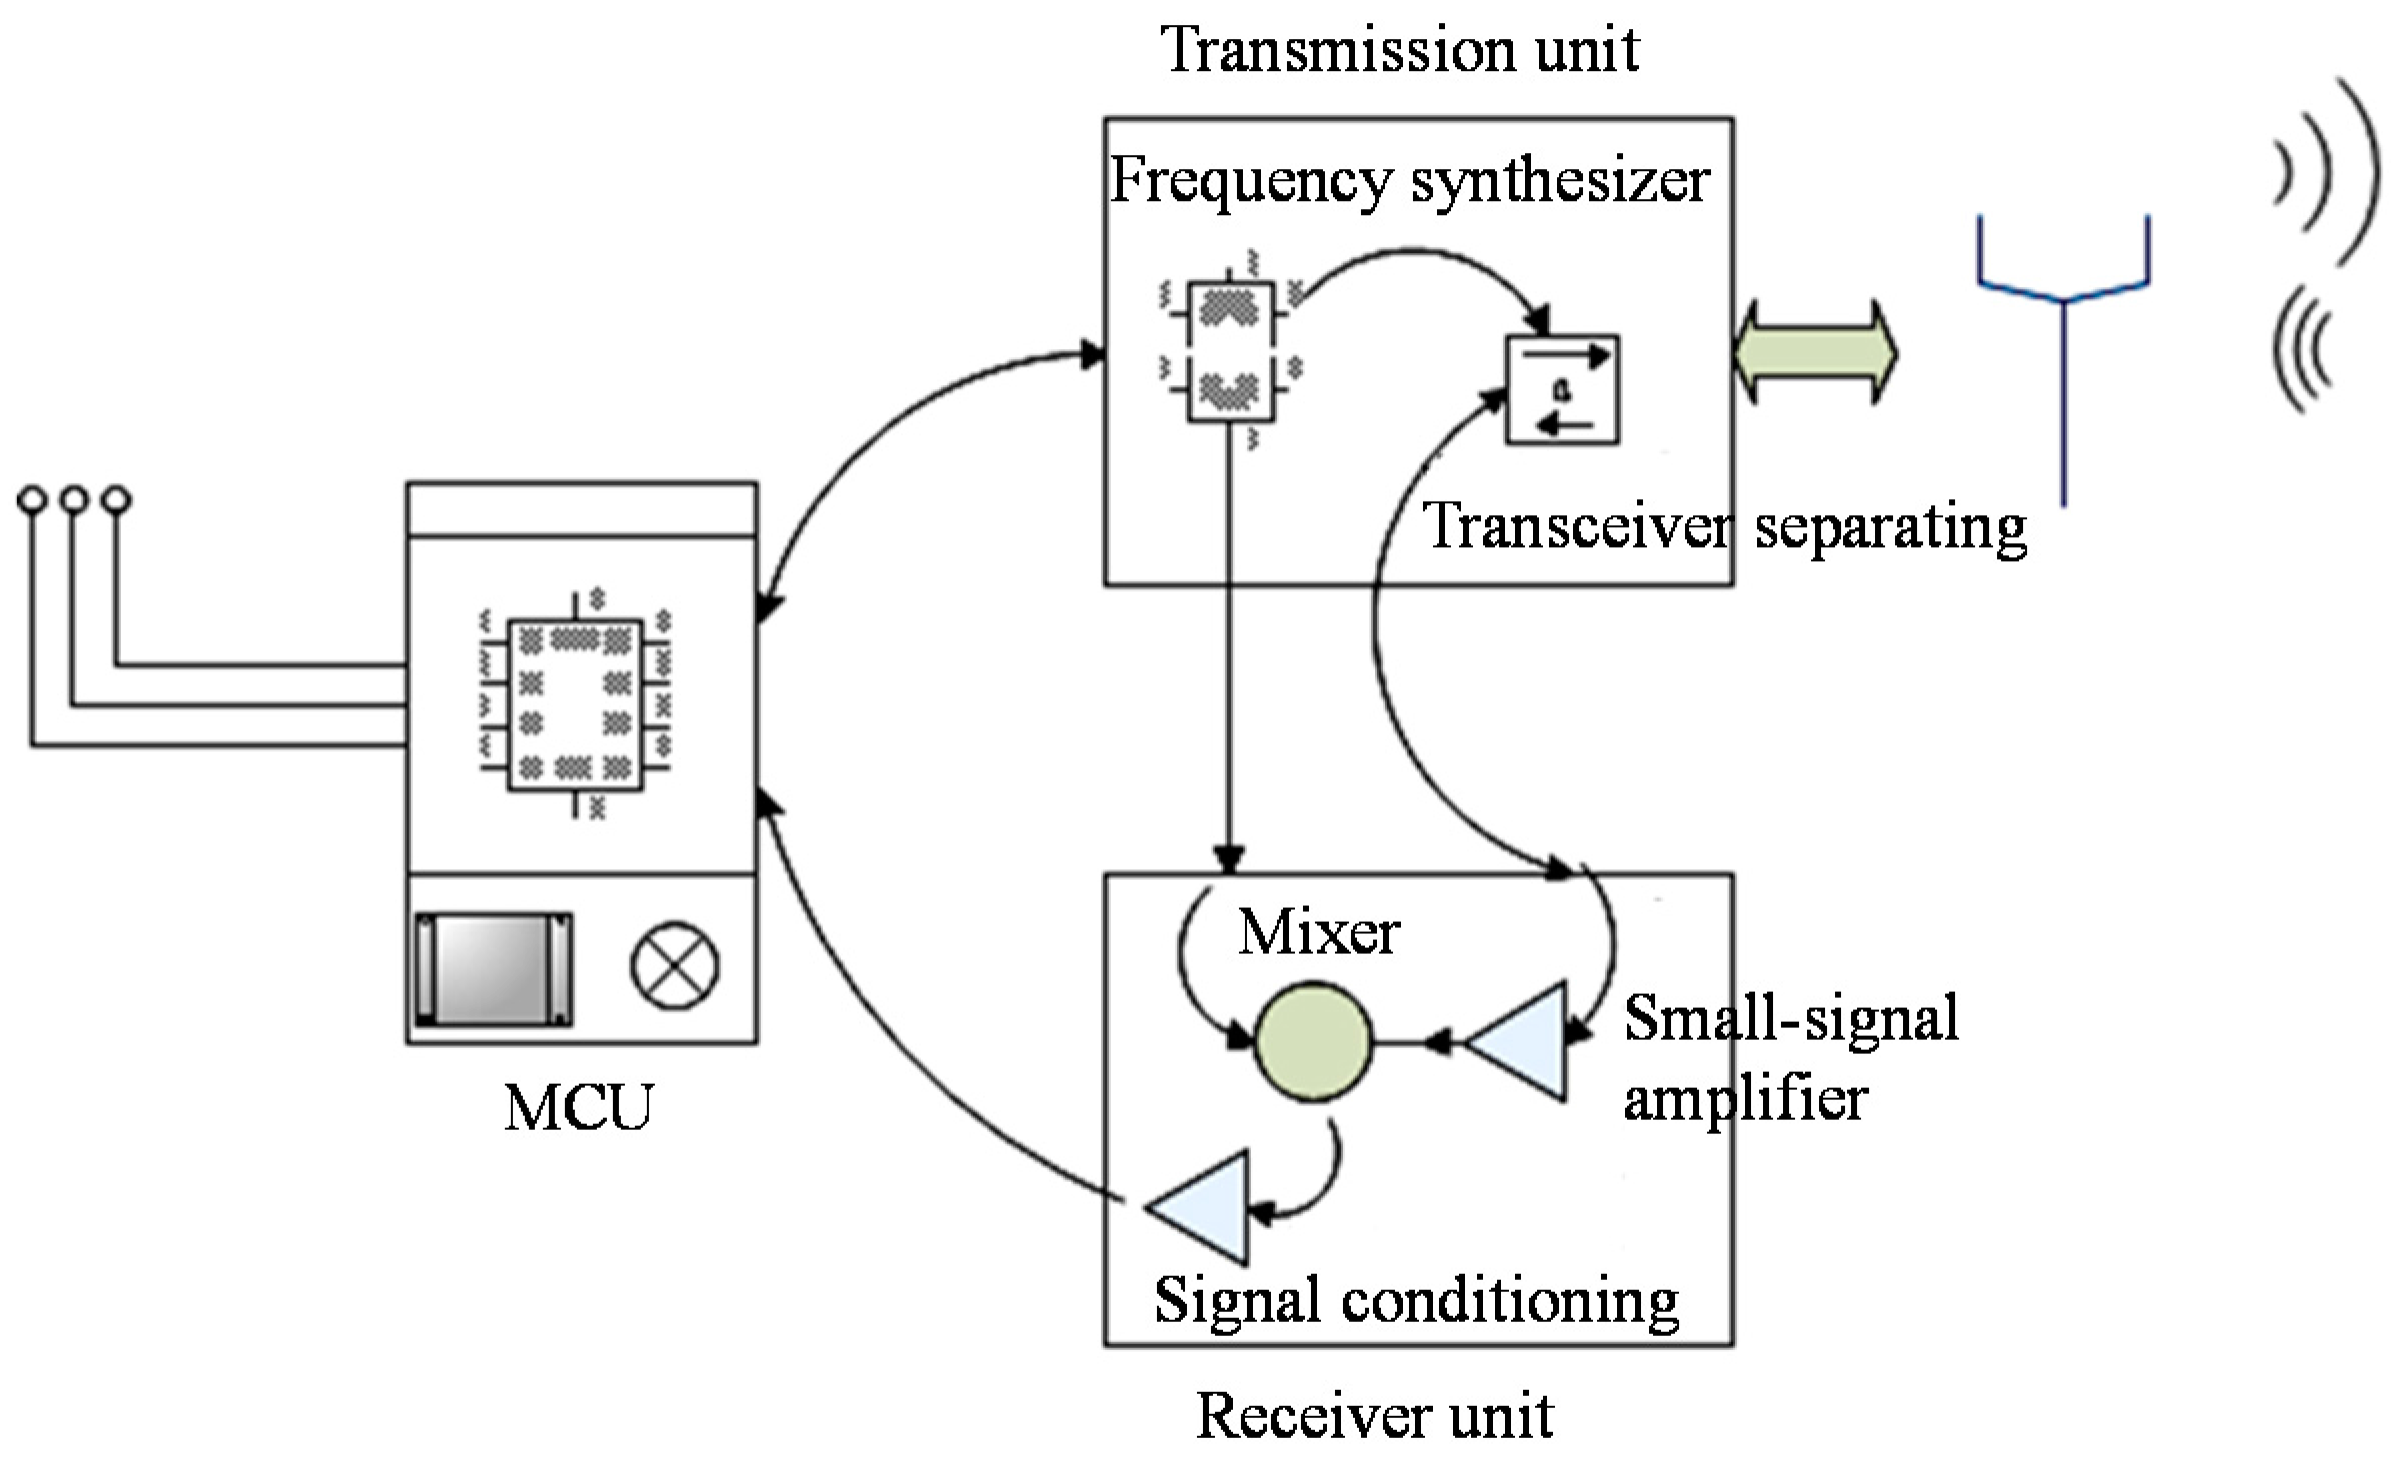
2.1. Reader Unit

Impulse radar interrogation units are usually applied for wireless sensor systems because of their simple structure. However, due to the required fast sampling and switching circuitry, they are costly. Therefore, the frequency stepped continuous wave (FSCW) radar technique, which generates a continuously variable frequency sine wave excitation signal was utilized in this study [22]. Using impulse signals in the frequency domain instead of those in the time domain, the speed requirements of the AD chip were greatly reduced, and as a result, the cost of the sensor system decreases. A schematic of the FSCW-based reader unit is presented in Figure 2. The main control unit (MCU) consists of a single chip microprocessor (SCM: C8051F065) and its auxiliary circuitry. The signal transmission unit was composed of frequency synthesizer and transceiver separating parts. The frequency synthesizer primarily produces sine wave signals with different frequency for the local oscillator (LO) port of the transmission and mixer circuit. The transceiver separating part is targeted to separate the high-frequency transmission signal and the reception signal, making them flow forward following the predetermined signal without interfering or conflicting with each other. The signal receiver unit was mainly composed of a small-signal amplifier, mixer and signal conditioning circuits. The small-signal amplifier circuit is set to amplify the received signal, and prevent noise from drowning the signal. The mixer circuit is used for mixing the received signal and the LO signal, modulating the received signal to a low frequency range which can be sampled. The signal rectifying circuit is responsible for amplifying and rectifying the low frequency signal from the mixer, and ensuring that the signal conforms to the requirements of the follow-up AD sample circuit.
Figure 2. The structure of the used FSCW reader unit.
Sensors 15 29793 g002
The module diagrams of the corresponding PC modeling software include the T/F conversion, reflection peak extraction, phase determination, and model building. Among the four sectors of the PC modeling software, the time/frequency (T/F) conversion part mainly works for converting signals in the time domain to frequency domain by using the fast Fourier transform (FFT). Before FFT, some preprocessing steps such as zero-padding and windowing to the time domain data should be done. The reflection peak extraction section is mainly responsible for extracting the peak position in the frequency domain of the three reflected signal peaks from the reflectors of the SAW device. As to the distortion in phase determination caused by the phase exceeding 360°, the phase model reported in [23] is utilized, which eliminates the distortion of phase and increasing the accuracy of detection by setting three reflectors to obtain the differential time-delay. Combining the detection results of the phase detection module, the phases of the three reflected signals could be acquired and determined, respectively, and sent to the model building part, which is designed to determine the curve of the relation between phase shift and temperature and gas adsorption [24].

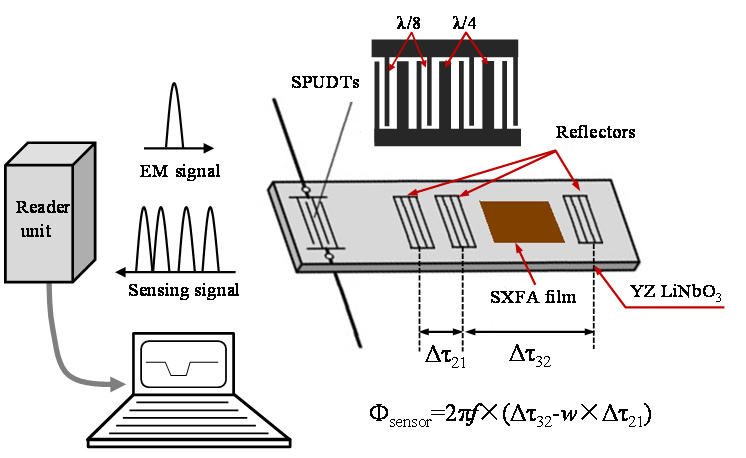
2.2. Design on the SAW Sensor Chip

A SAW reflective delay line configuration was used as the sensor chip in the proposed chemical sensor system. High signal-to-noise (S/N), low insertion loss, sharp reflection peaks in the time domain, and few spurious noises are required for sensor performance improvement [23]. Hence, an YZ LiNbO3 piezoelectric crystal was chosen as the substrate owing to its large electromechanical coupling factor K2 (4.5%), which allows strong reflectivity for the reflectors and lower insertion loss. Single phase unidirectional transducers (SPUDTs), which direct most of the SAW energy to the direction of the reflectors were used to structure the SAW device. Hence, improved S/N and lower insertion loss were achieved. Shorted grating reflectors were adopted owing to their strong reflectivity [25].
The operation frequency of the sensor is set to 434 MHz, to also meet the requirement of the sweep frequency bandwidth (less than 30 MHz) of the reader unit, and to obtain sharp reflection peaks in the time domain, the finger pairs in the SPUDTs was designed as 15, that means the transducer has 15 periods. As mentioned in Figure 1, three shorted grating reflectors were placed in the SAW propagation path, whereby the third reflector was used for gas sensing where the SXFA film was coated onto the surface between the second and third reflector, and the first one was used for temperature compensation. Additionally, to keep adequate separation between environmental noise echoes and reflection peaks, the time interval between the SPUDTs and the first reflector was designed to larger than 1.2 μs. Also, to achieve equal amplitude for all the reflection peaks in the time domain, the reflector lengths were appropriately controlled, that is, the farther away from the SPUDTs, the longer the reflector is. To eliminate the phase distortion, the difference in time delay between the first and second reflector is designed to 0.15 μs, and the ratio of second-to-third reflector distance to first-to-second reflector distance is set to 13. Details of the design parameters of the SAW device are listed in Table 1.
Table 1. Design parameters for the SAW device.
Design ParametersValue
Operation frequency (MHz)434
Piezoelectric substrate YZ LiNbO3
Thickness of the Al electrodes (nm)300
Distance between SPUDT and the first reflector (λ: wavelength)250.25
Distance between the second and the third reflector (λ)399.75
The length of the second reflector(λ)2.25
Acoustic velocity (m/s)3492
Aperture (λ)80
Number of SPUDT finger pairs15
Distance between the first and the second reflector (λ)30.75
Length of the first reflector (λ)2.25
Length of the third reflector (λ)4.25
To predict the device performance, the typical coupling of modes (COM) theory, which provides a very efficient way of optimizing SAW devices [25], was utilized. For simulation of the SAW reflective delay line configuration composed by SPUDTs and three shorted grating reflectors, the COM model was utilized to analyze the SPUDTs and reflectors, respectively. By using the extracted mixed P-matrix of the SPUDTs, reflectors, and the gaps among the SPUDTs and reflectors, the admittance matrix of whole device Y ( Y = [ y 11 y 12 y 21 y 22 ] ) can be deduced, and then, the reflection coefficient S11 of the SAW device can be obtained by:
S 11 = ( Y G y 11 ) × ( Y G + y 22 ) + y 12 × y 21 ( Y G + y 11 ) × ( Y G + y 22 ) y 12 × y 21
where YG is the resource and load inductance.
Using the parameters listed in Table 1 and the FFT program, the SAW device used for gas sensing was simulated to obtain the S11 in the time domain. Figure 3a shows the simulated S11 in time domain in the case of YZ LiNbO3, aluminum SPUDTs with 15 finger pairs and 100λ aperture size, and three shorted grating reflectors. Three reflection peaks from the three reflectors are observed clearly in the time domain.
Figure 3. Simulated (a) and measured (b) S11 in time domain of the SAW device.
Sensors 15 29793 g003

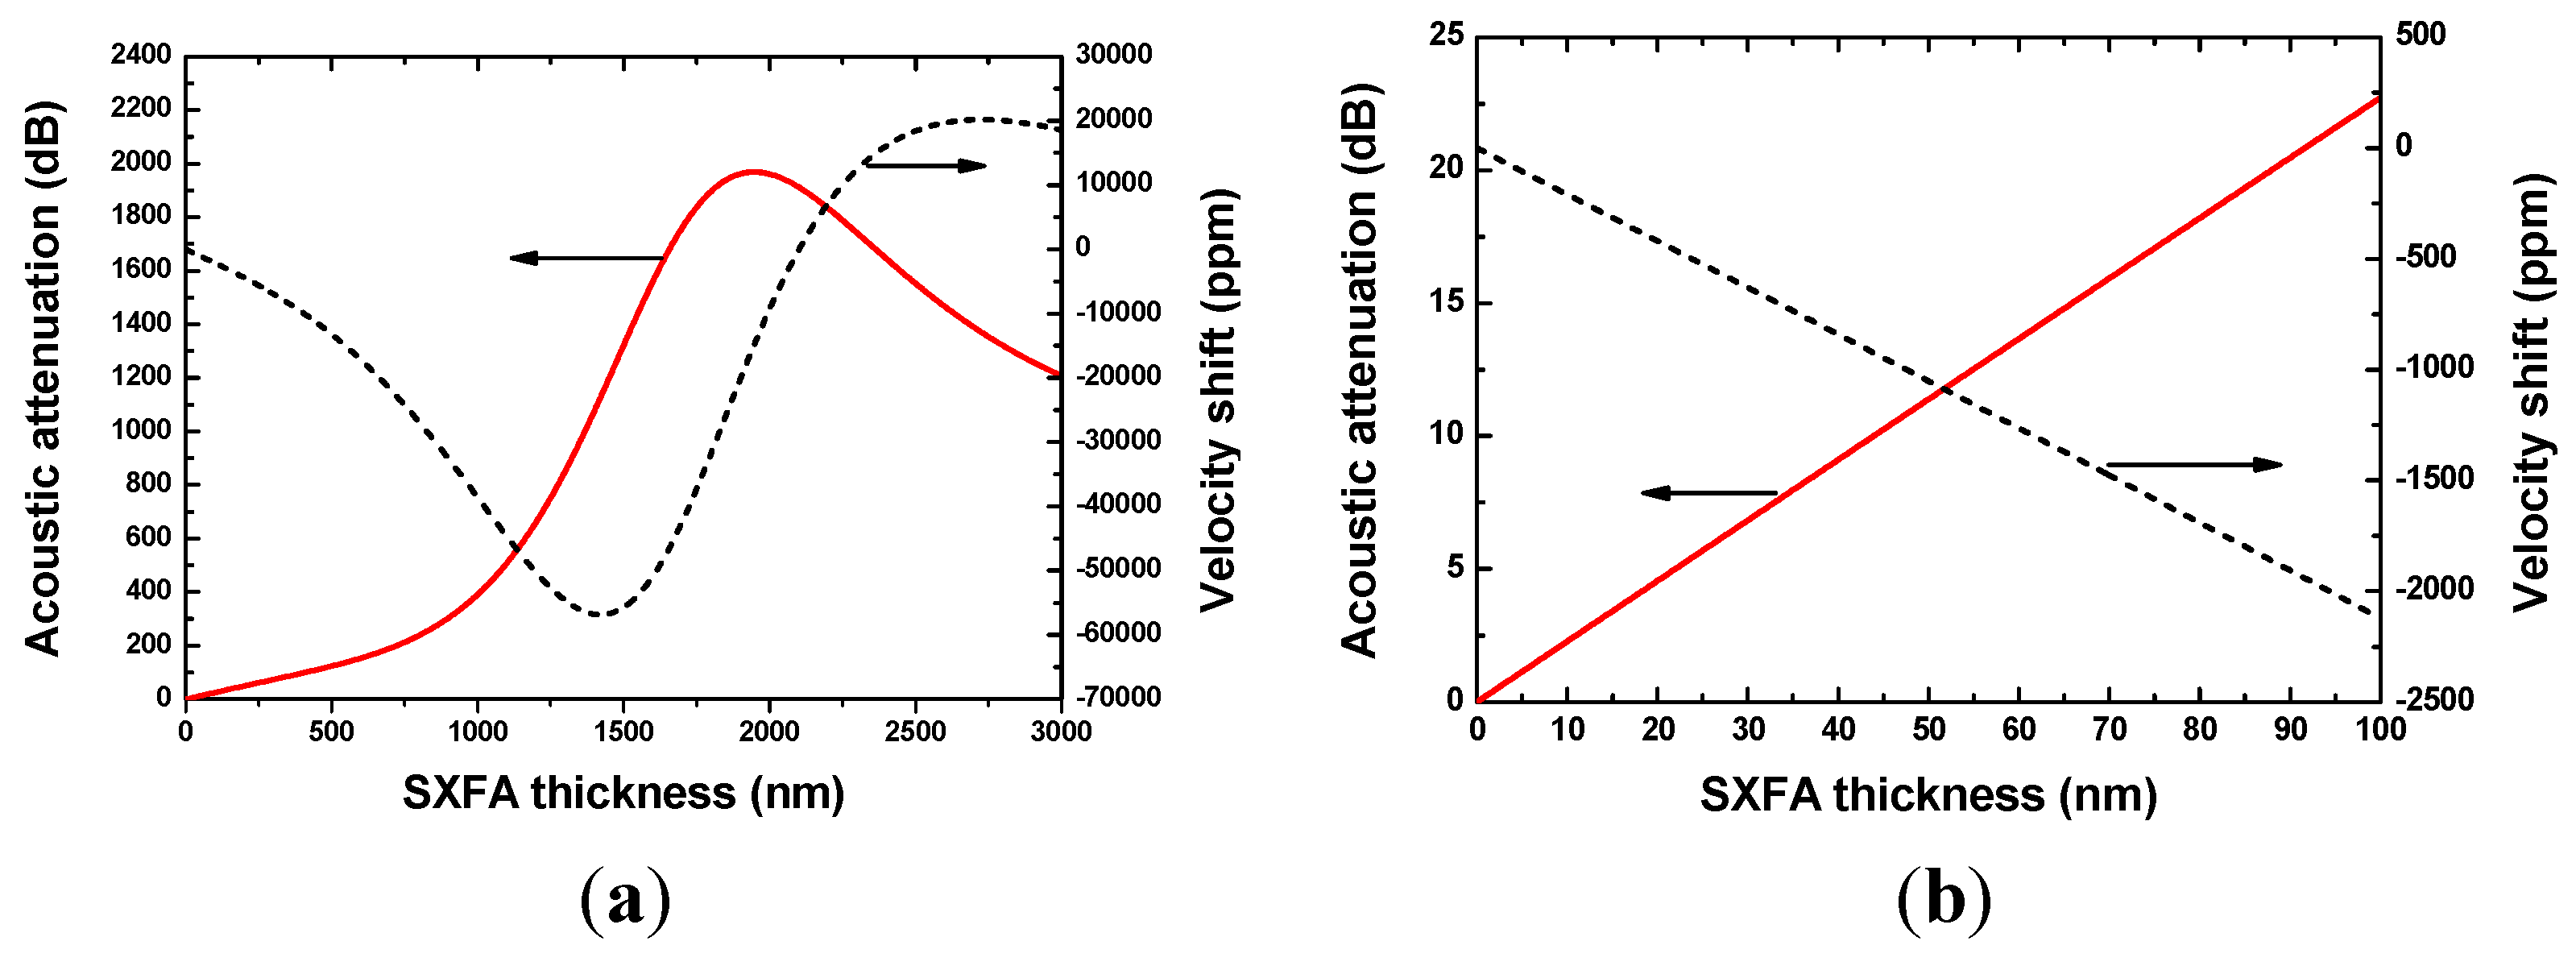
2.3. Theoretical Analysis of the Sensor Response

As described in Figure 1, the adsorption between the SXFA and DMMP modulates SAW propagation. As a polymer material, SXFA offers excellent selectivity, lower detection limits, and ambient-temperature operation, however, the viscoelastic nature of the SXFA will induce nonlinearity in the sensor response and additional acoustic attenuations in the process of SXFA deposition and gas adsorption, so prior to sensor development, it is essential to predict the sensor response of the SXFA-coated chemical sensor. Actually, perturbation theory was frequently used to describe the polymer-coated SAW chemical sensor, which provide a good way to optimize the sensor configuration [26]. The perturbation on SAW propagation from the sensitive interface deposition can be analyzed by:
Δ γ / k 0 = Δ α / k 0 j Δ v / v 0 = i = 1 3 c i β i M i ω tanh ( j β i h ) β i = ω ρ E i / v 0 2 M i E 1 = 4 G ( 3 K + G ) 3 K + G , E 2 = G , E 3 = 0 M 1 = M 2 = G , M 3 = K
where k0 and v0 denote the unperturbed wave number and SAW velocity, respectively. Δγ/k0 represents the fractional perturbation in the complex wave propagation factor, Δα/k0 notes the change in attenuation per wave number, while Δv/v0 is the fractional change in propagation velocity. The terms c and ρ are the SAW-film coupling parameter and the density of polymer material, and h is the polymer thickness. G and K denote the shear horizontal (SH) modulus and the bulk modulus, which specify the viscoelastic properties of the polymer. Usually they are both complex numbers, and their real parts represent the storage moduli, whereas the imaginary parts mean the loss moduli.
Then, the density ρ and thickness h of the polymer sensitive interface will vary with the concentration of the adsorbed species C:
ρ ( C )   = ρ 0 + κ C v / ( 1 + κ C v / ρ v ) h ( C )   = h 0 ( 1 + κ C v / ρ v )
where Cv is the gas concentration, and κ is the partition coefficient that was well defined by Grate et al. [27]. ρ0 and ρv are the densities of the polymer material and target gases.
SXFA is a glassy-rubbery polymer material with density of 1.447 g/cm3, and its shear modulus G and bulk modulus K are 9.3 × 10⁹ Pa + 1.2 × 10⁹ Pa and 10 × 109 Pa + 10 × 109 Pa, respectively [20]. Dimethylmethylphosphonate (DMMP) with density of 1.145 g/cm3 and molecular weight of 124 was assumed as the target gas. The DMMP concentration is assumed to 0~1000 mg/m3 in the simulation. The partition coefficient logκ of SXFA towards to DMMP is around 6.4 [20]. As for wireless sensing, the operation sensor frequency is set to 434 MHz. Hence, the effect on SAW propagation from the SXFA deposition can be simulated using Equations (2) and (3), as shown in Figure 4. The induced acoustic attenuation in the SXFA deposition process was computed by using the expression Δα/k0 × L/0.0183 [20], where L is the SXFA coated acoustic wave propagation path length (~350λ). In Figure 4, the existed resonation phenomenon in velocity shift and loss change demonstrates the viscoelastic characteristics of the SXFA. It is well known that larger acoustic attenuation will seriously affect the sensor performance. To reduce the acoustic attenuation (less than 10 dB), SXFA thickness was advised to be less than 50 nm. Additionally, under the given SXFA thickness of 50 nm, the relationship among the acoustic attenuation, velocity shift and adsorbed DMMP concentration was calculated as shown in Figure 5. Like Figure 4, the viscoelastic nature of the SXFA itself also leads to a obvious resonance phenomenon, that is, nonlinear velocity shifts and larger acoustic wave attenuation will occur at higher gas concentrations. Obviously, in trace gas concentrations of less than 200 mg/m3, the induced acoustic wave attenuation is low enough to be neglected, and the shift in velocity is linear, that is a mean linear sensor response will be expected.
Figure 4. The effect on SAW propagation of the SXFA deposition at (a) thicker SXFA and (b) thin SXFA film.
Sensors 15 29793 g004
Figure 5. The effect on SAW propagation in the gas adsorption at (a) high and (b) low DMMP concentration.
Sensors 15 29793 g005

3. Technique Realization
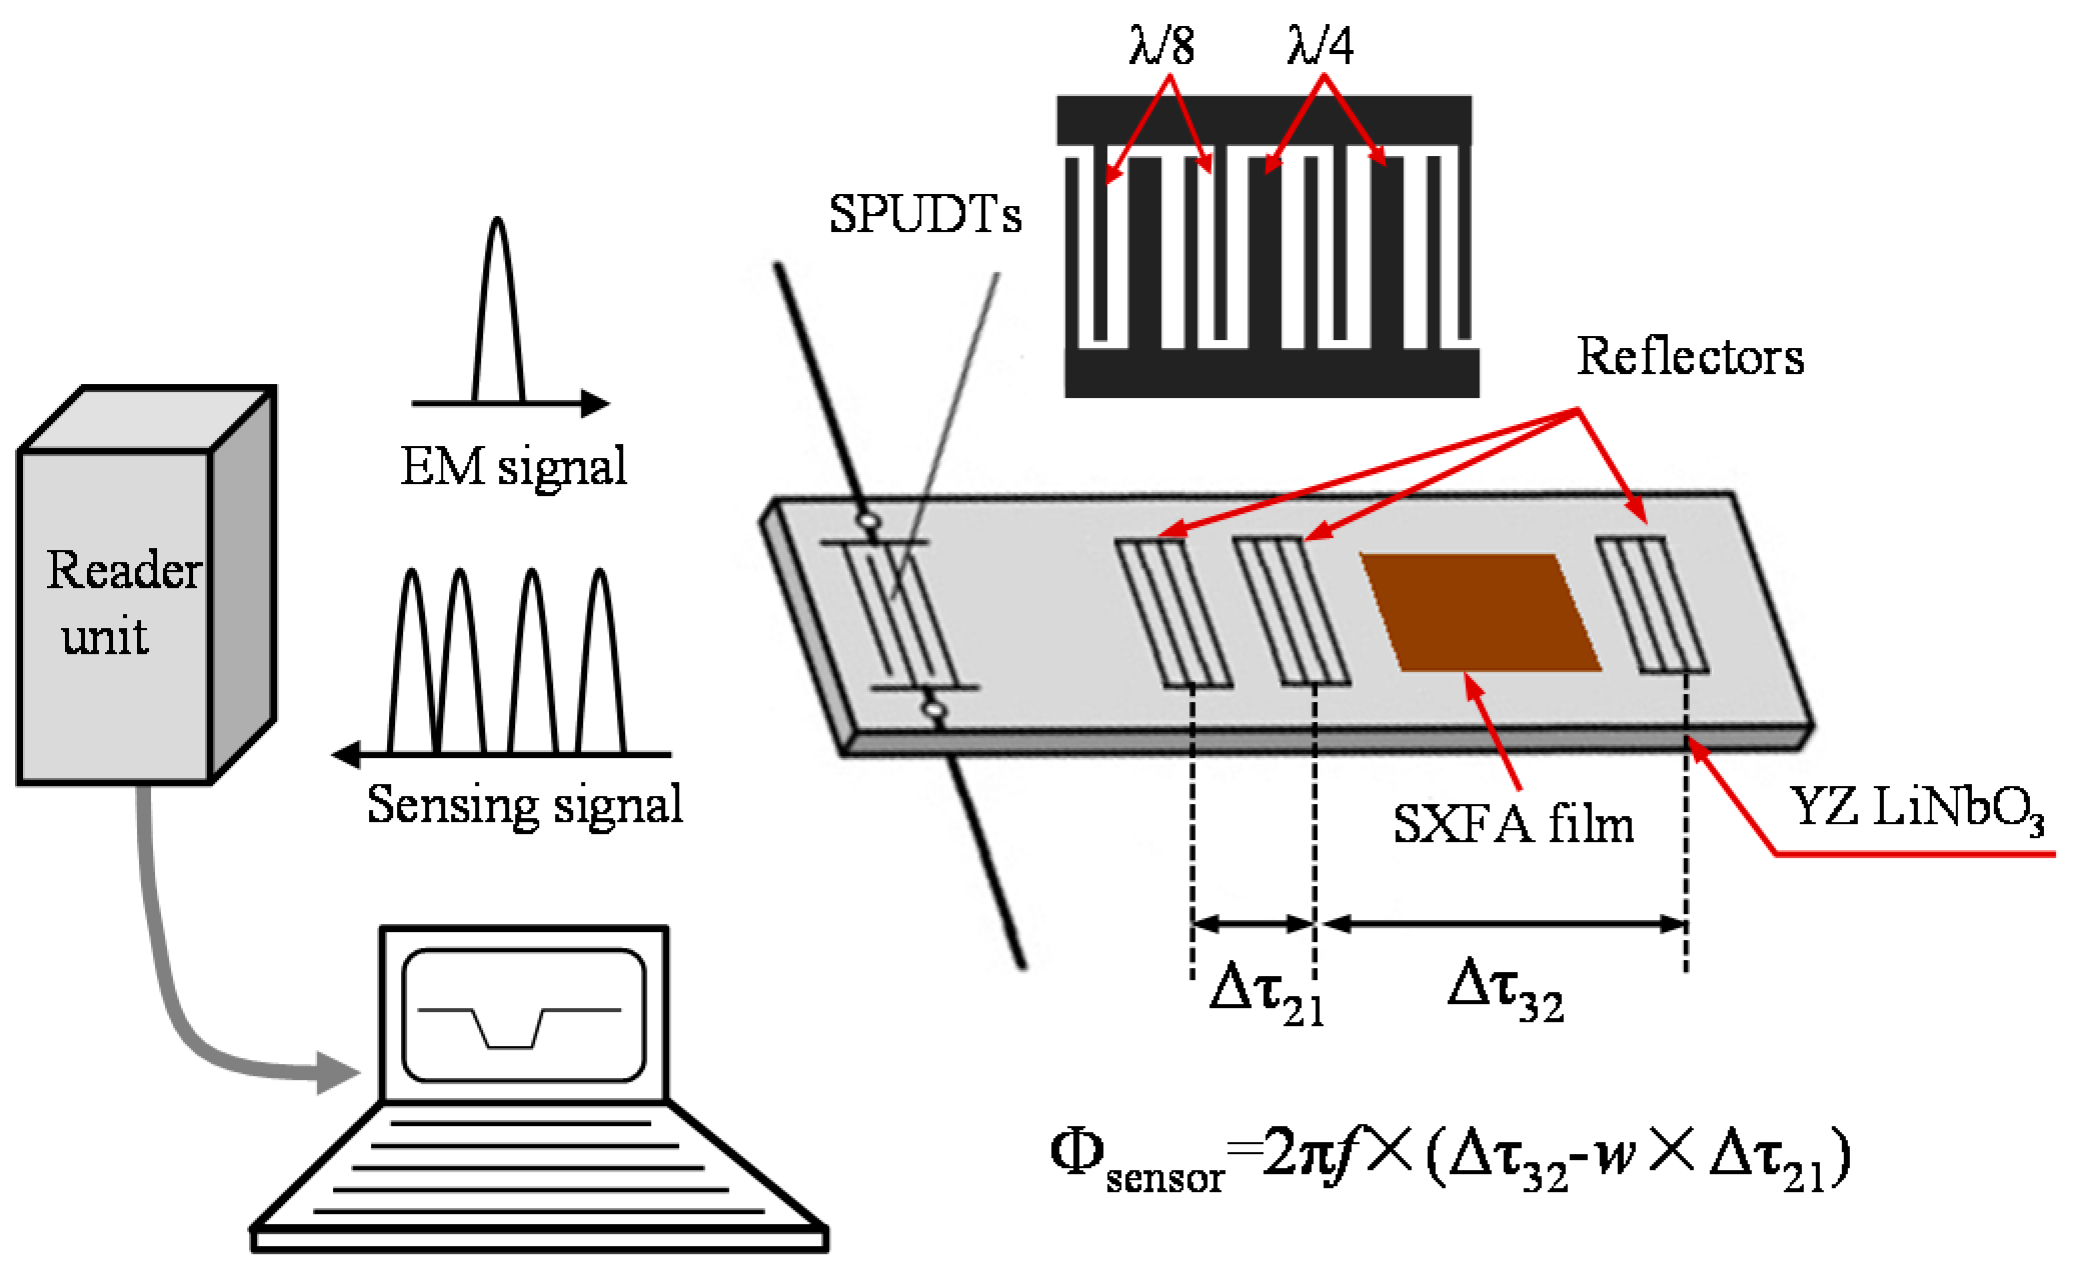
3.1. SAW Sensor

Using the design parameters mentioned in Table 1, the SAW reflective delay line configuration was reproducibly fabricated on a YZ LiNbO3 piezoelectric substrate as the sensor element as shown in Figure 1. Three hundred nm Al-strips were deposited onto the YZ-LiNbO3 substrate utilizing standard photolithographic techniques. After the device dicing-sawing, the SAW devices were characterized by using a network analyzer, as shown in Figure 3b.Three reflection peaks were clearly observed from the reflectors in the time domain, which shows high S/N ratio, sharp peaks, and few spurious signals. The first reflection peak appears at 1.1935 μs, and the corresponding amplitude of S11 is 38.4 dB. The second and the last reflection peaks occurred at 1.35 μs and 3.215 μs with S11 amplitudes of 38.7 dB and 38.54 dB, respectively. Good uniformity was observed in all of the amplitudes of the reflection peaks. Also, the measured results agree well with the COM simulation.
In our work, SXFA was chosen as the sensitive interface for DMMP detection, which was coated onto the LiNbO3 substrate surface of the developed SAW reflective delay line by means of solvent-evaporation. Here, the SXFA was synthesized by reaction of polyallylmethylsiloxane andhexafluoro-acetone (HFA). The solvent-evaporating method was applied for the SXFA coating owing to its simple operation and low cost. Usually, the effectiveness of the solvent evaporating method to produce a stable polymer coating is significantly determined by the solvent type. In this study, toluene was utilized as the solvent. Before the SXFA coating, the YZ LiNbO3 surface was cleaned of any contaminants by a routine cleaning procedure involving rinsing in piranha solution (V(H2SO4):V(H2O2) = 3:1), a DI water rinse and drying by N2. Then, a 0.1 μL solution of 0.8 g/L SXFA/toluene was deposited on the cleaned piezoelectric substrate surface between the second and third reflectors three consecutive times at different place along the SAW propagation path between the second and third reflector. The deposited SXFA was characterized by using the atomic force microscopy (AFM) which approximately demonstrated the surface roughness, and its thickness is measured as ~41 nm. It is clear that there are some obvious changes in time delay and amplitude of S11 of the third reflection peaks before and after SXFA deposition, as depicted in Figure 6. Because of the mass loading effect of the SXFA coating, the velocity along the SAW propagation path between the second and third reflector decreases, leading to an increase in delay time. Also, the viscoelastic nature of the SXFA induces acoustic wave attenuation, resulting in a decrease in the amplitude of the third reflection peak.
Figure 6. The measured S11 of the SAW device before and after SXFA coating.
Sensors 15 29793 g006
Also, For wireless measurement, two 2-dimensional planar antennas (18 cm × 5 cm) operating at 434 MHz central frequency and 30 MHz bandwidth were made from a 0.4 mm thick FR4 substrate (dielectric constant k = 4.2) with Cu electrodes and electrically connected to the SAW sensor chip and reader unit. Based on the design considerations described in Section 2.1, the 434 MHz FSCW-based reader unit was fabricated, as shown in Figure 7.

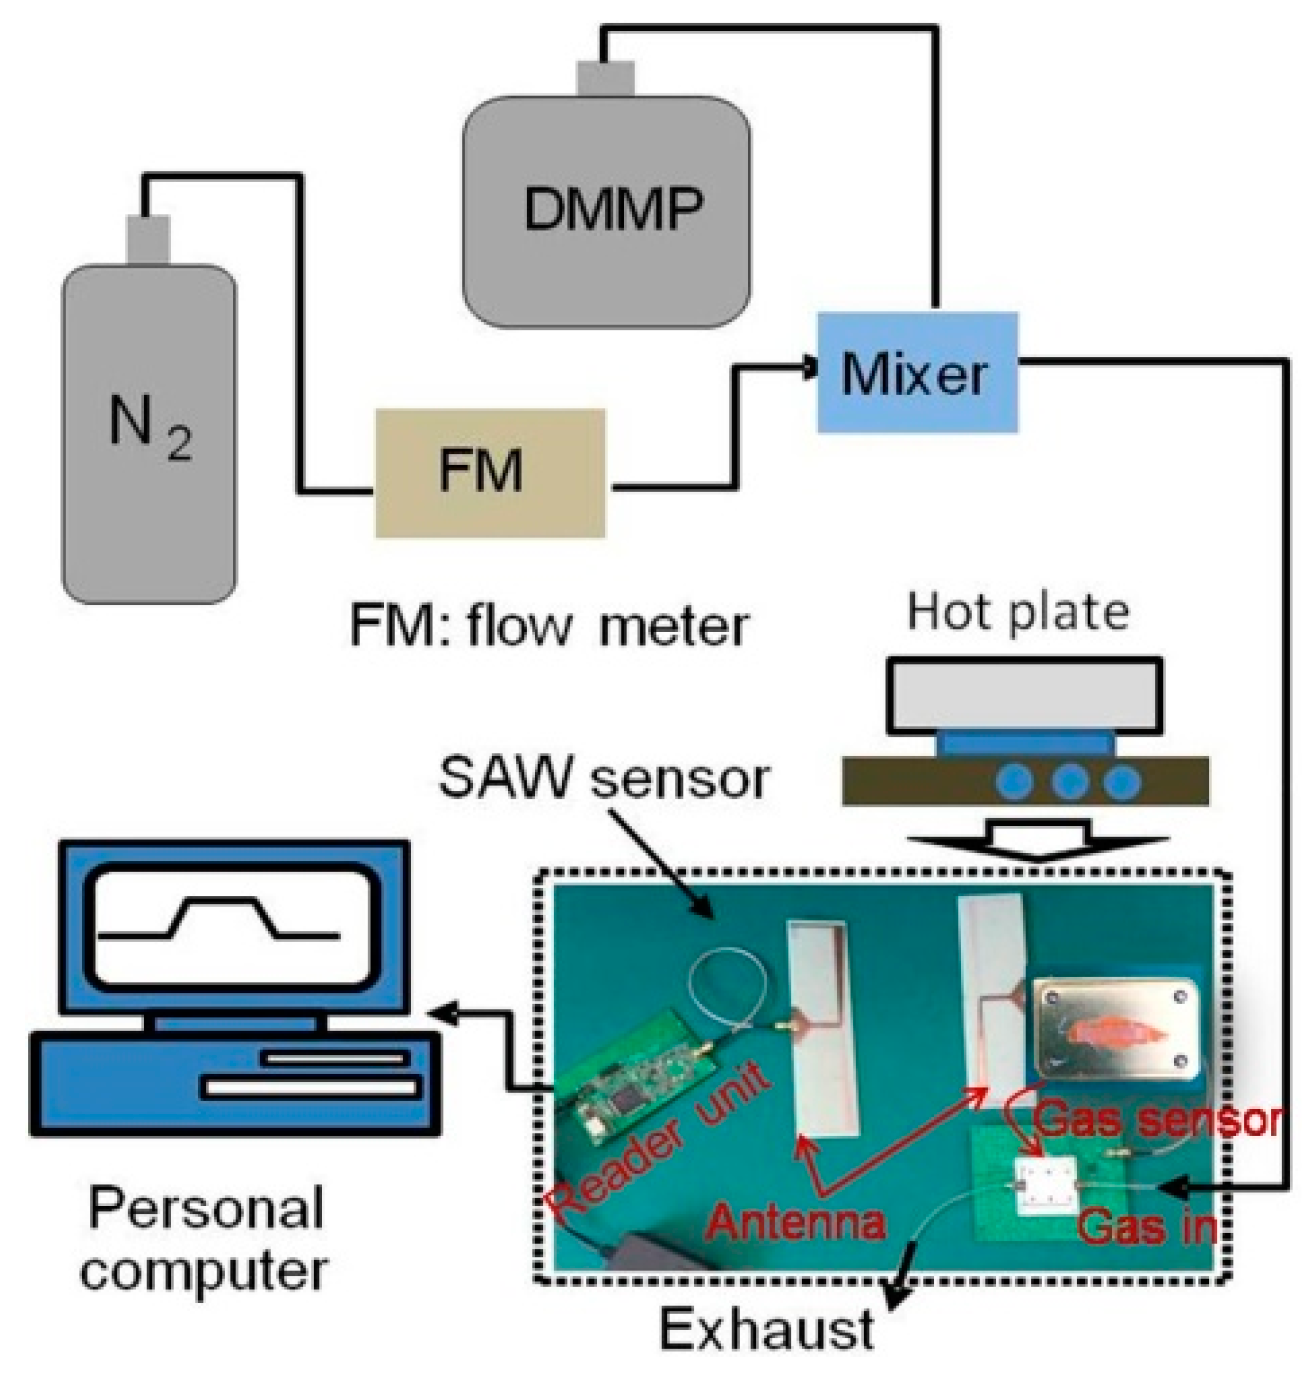
3.2. Sensor Experimental Setup

Then, the developed SXFA coated SAW sensor chip was placed in a surface nickel-plated 500 mL aluminum gas chamber with two separate gas channels, and connected to the antenna.The completed wireless SAW chemical sensor system was composed of the FSCW-based reader unit, SXFA-coated sensor, and connected antennas. The experimental setup shown in Figure 7 consists of the wireless sensor system, dual channel gas flow controller system, hot plate, and thermometer. The SAW sensor was exposed to N2 and DMMP gas alternately via the gas path. The sensor signals were acquired by the reader unit and processed by the self-compiled software in the personal computer in real time.
Figure 7. The experimental set up for characterizing the wireless SAW sensor.
Sensors 15 29793 g007

4. Wireless Measurement of the SAW Sensor

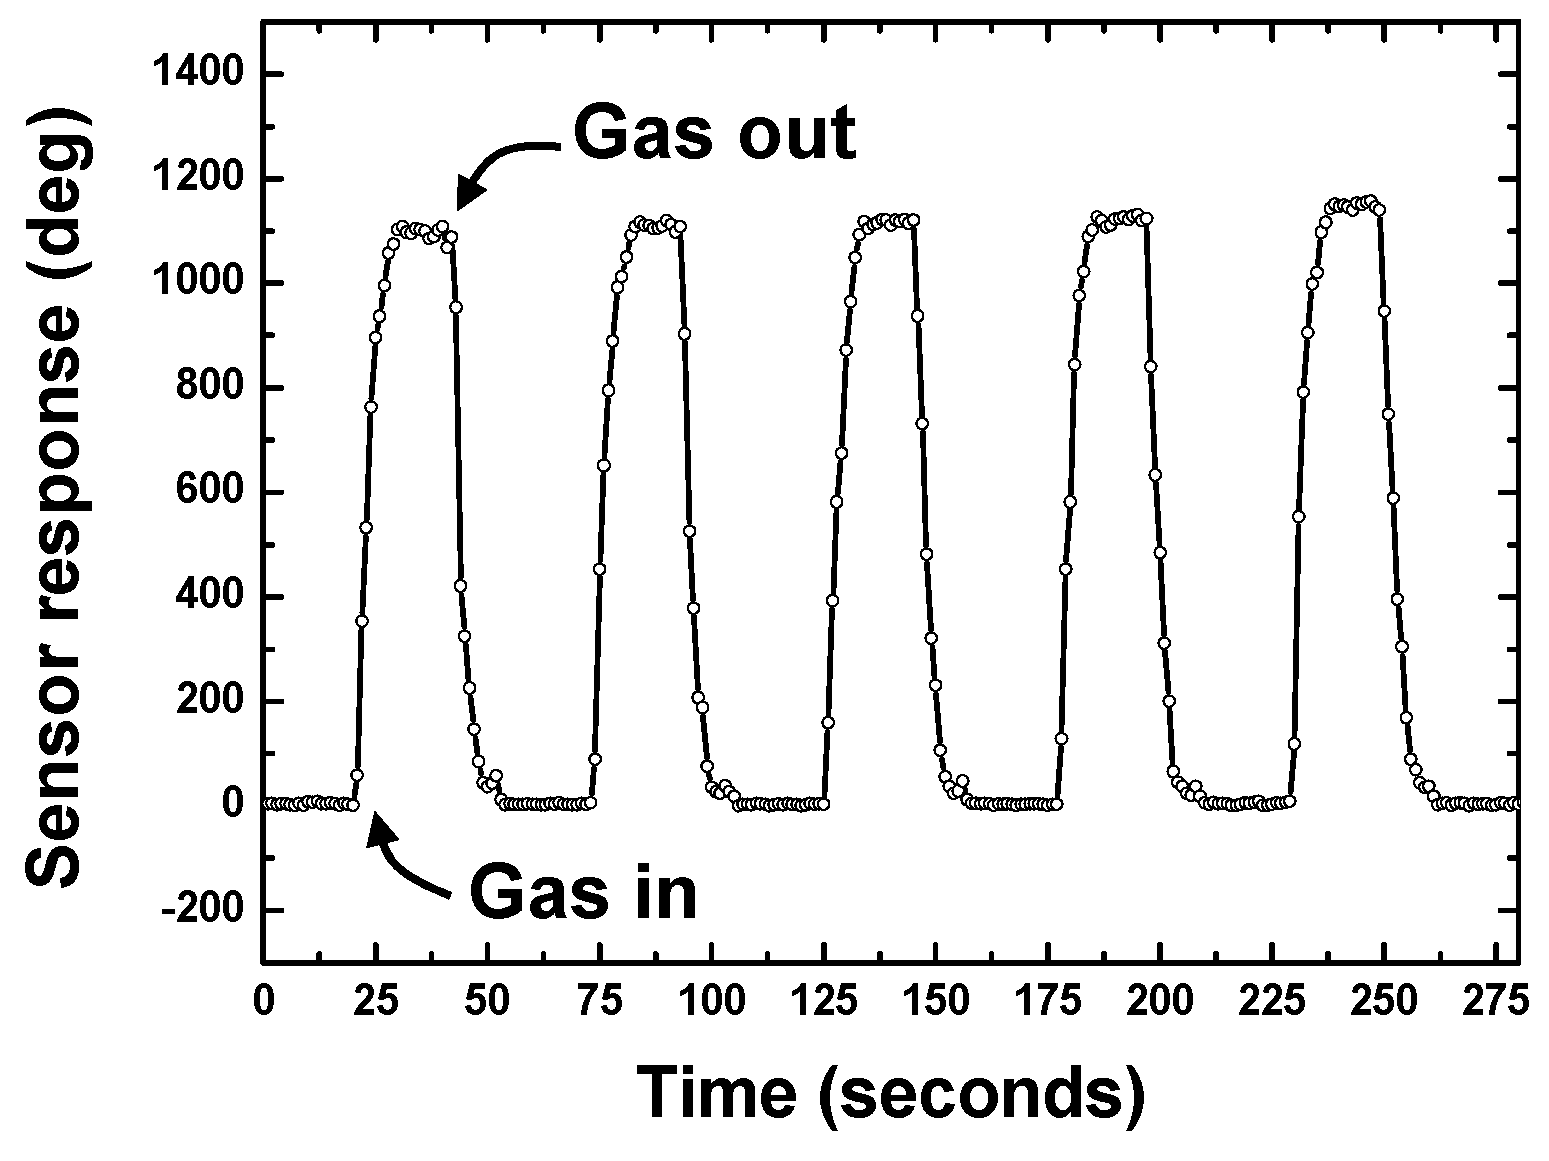
4.1. DMMP Adsorption

Before gas sensing experiments, the basic phase noise of the sensor system, which is from the Gaussian noise in the wireless measurement, was measured at ~20 cm request distance, ~±2° of phase noise was observed 120 s.
Then, the developed SXFA-coated wireless and passive sensor was used for DMMP sensing to investigate its repeatability. The reflection peak S11 of the sensor chip was picked by the reader unit at ~20 cm request distance. The adsorbed DMMP molecules in SXFA film induced time deviations of the resultant reflection peaks, and the corresponding phase signal was picked up and recorded to evaluate the DMMP concentration because the phase signal provides much higher resolution over the time shift of the reflection peak. Figure 8 shows a typical phase response profile obtained from five consecutive 50 s on-off exposures to 50 mg/m3 DMMP in pure N2 at room temperature (25°C) and a gas flow speed of 1 L/min. Here, the phase response was recordedevery1 s so that one point on the graph corresponds to a 1-sinterval.The sensor response plotted in Figure 8 denoted a rapid response rise on exposure to DMMP that reaches approximately 80% of the equilibrium (saturation) value in 7 s. When the gas was removed by the N2, the phase response returned to ~70% of its initial baseline value within 6 s. Relatively fast rise and fall times were observed. Also, it is obvious that the developed sensor shows excellent repeatability of the response to DMMP.
Figure 8. The repeatability measurement of the sensor system.
Sensors 15 29793 g008

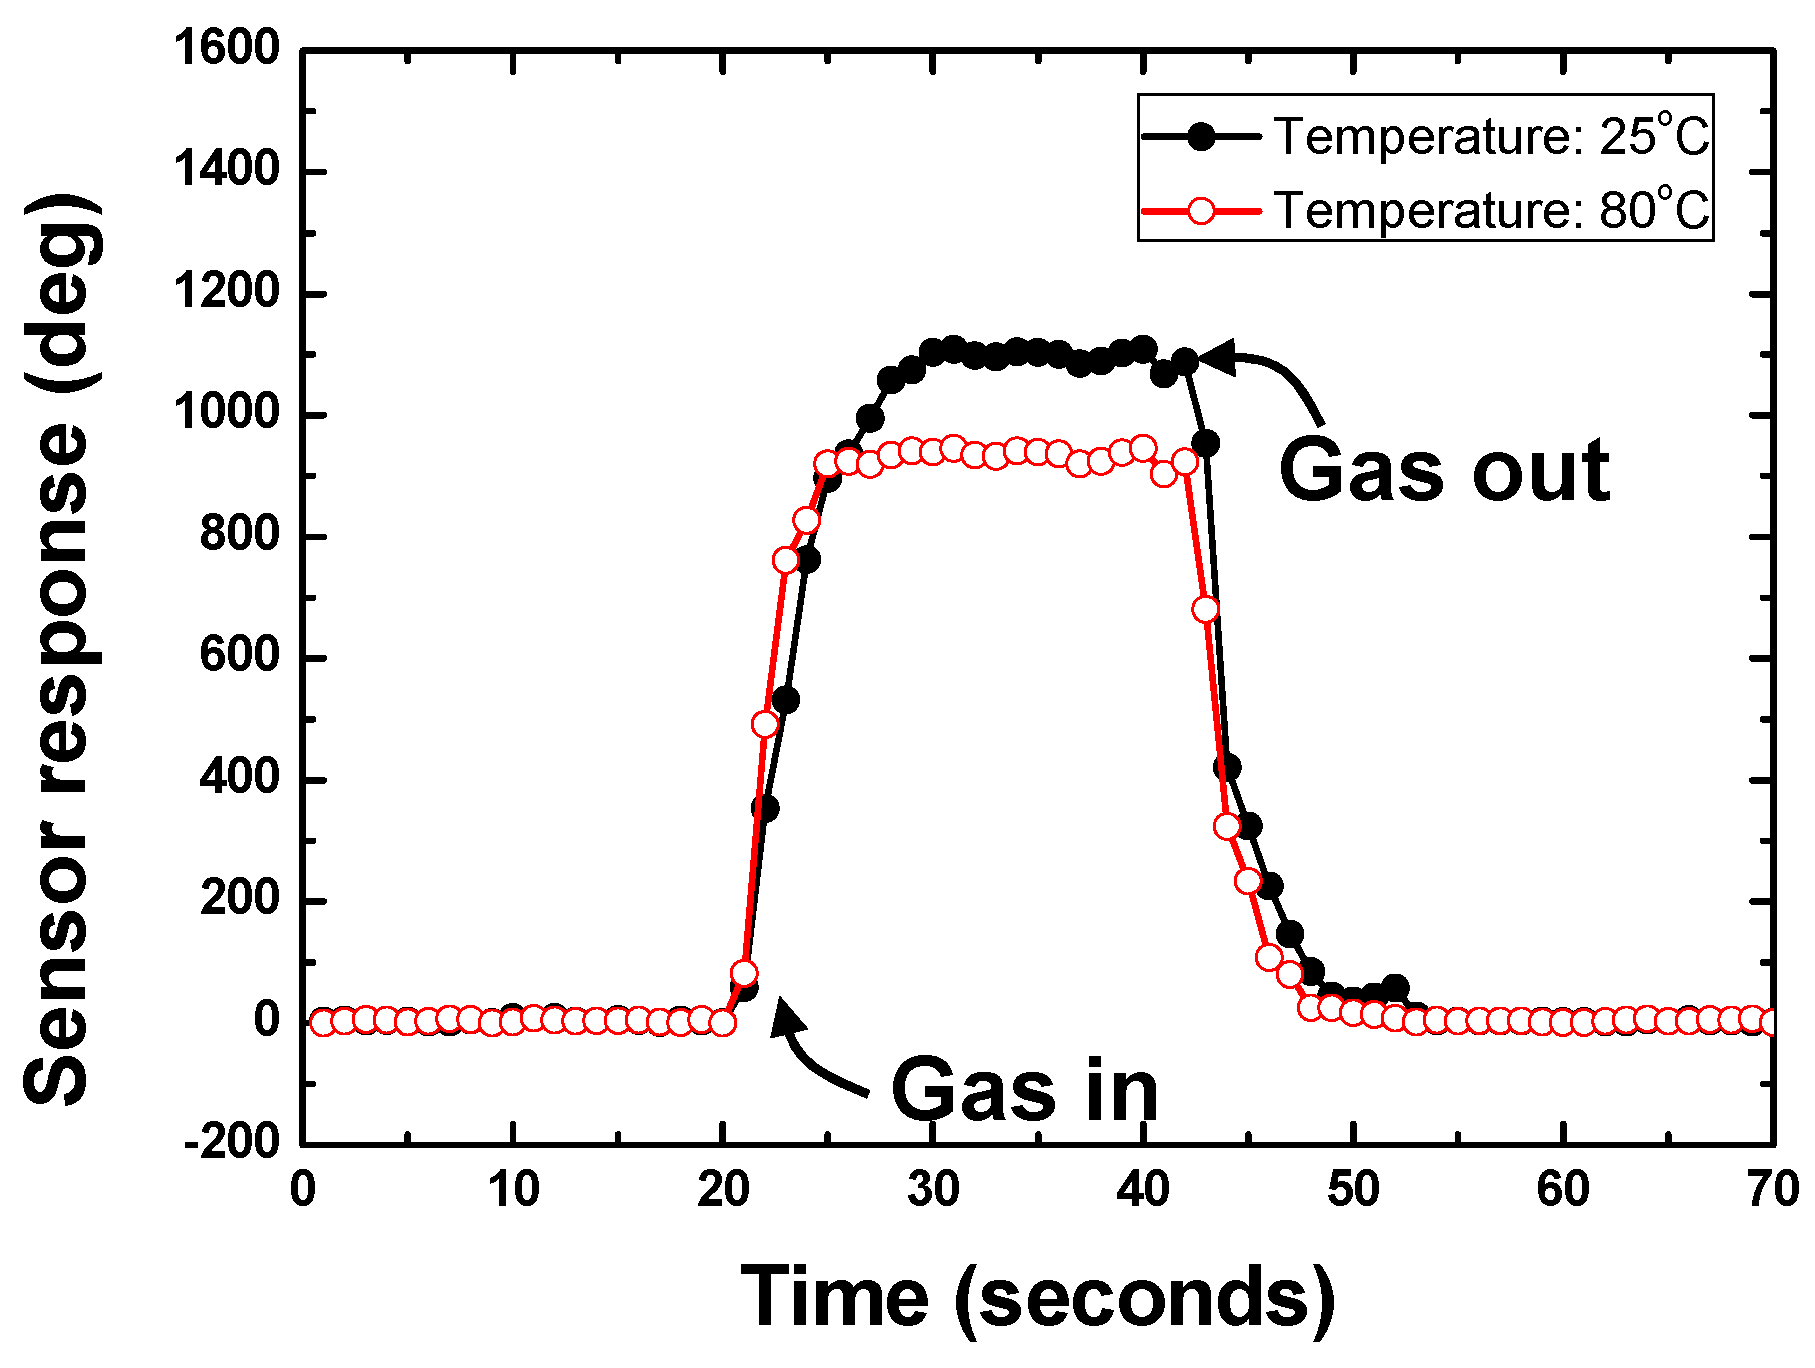
4.2. Temperature Effect on Sensor Response

It is well known that the environmental temperature influences significantly the sensor performance by causing shifts in the baselines and altering the adsorption interactions between the interface and the target gases. To study the temperature effect on the sensor response, the testing environment temperature was varied from room temperature to 80 °C by the hot plate. The measured phase responses towards 50 mg/m3 under different testing temperature are summarized in Figure 9.
Figure 9. Temperature effect analysis on sensor response.
Sensors 15 29793 g009
Even though the differential method was utilized, there are still obvious deviations in the sensor responses at different testing temperature. The differential method can effectively reduce the temperature effect from the thermal expansion of the piezoelectric substrate, but it is helpless for the temperature effect from the thermal expansion of the SXFA film and gas adsorption activities at elevated temperature. A promising approach to solve such issue would be to add a reference material to eliminate the temperature influence from the SXFA film itself using the differential structure. As the premise, the physical properties of the reference materials should be similar to the SXFA. This work will be the focus in our further investigation.

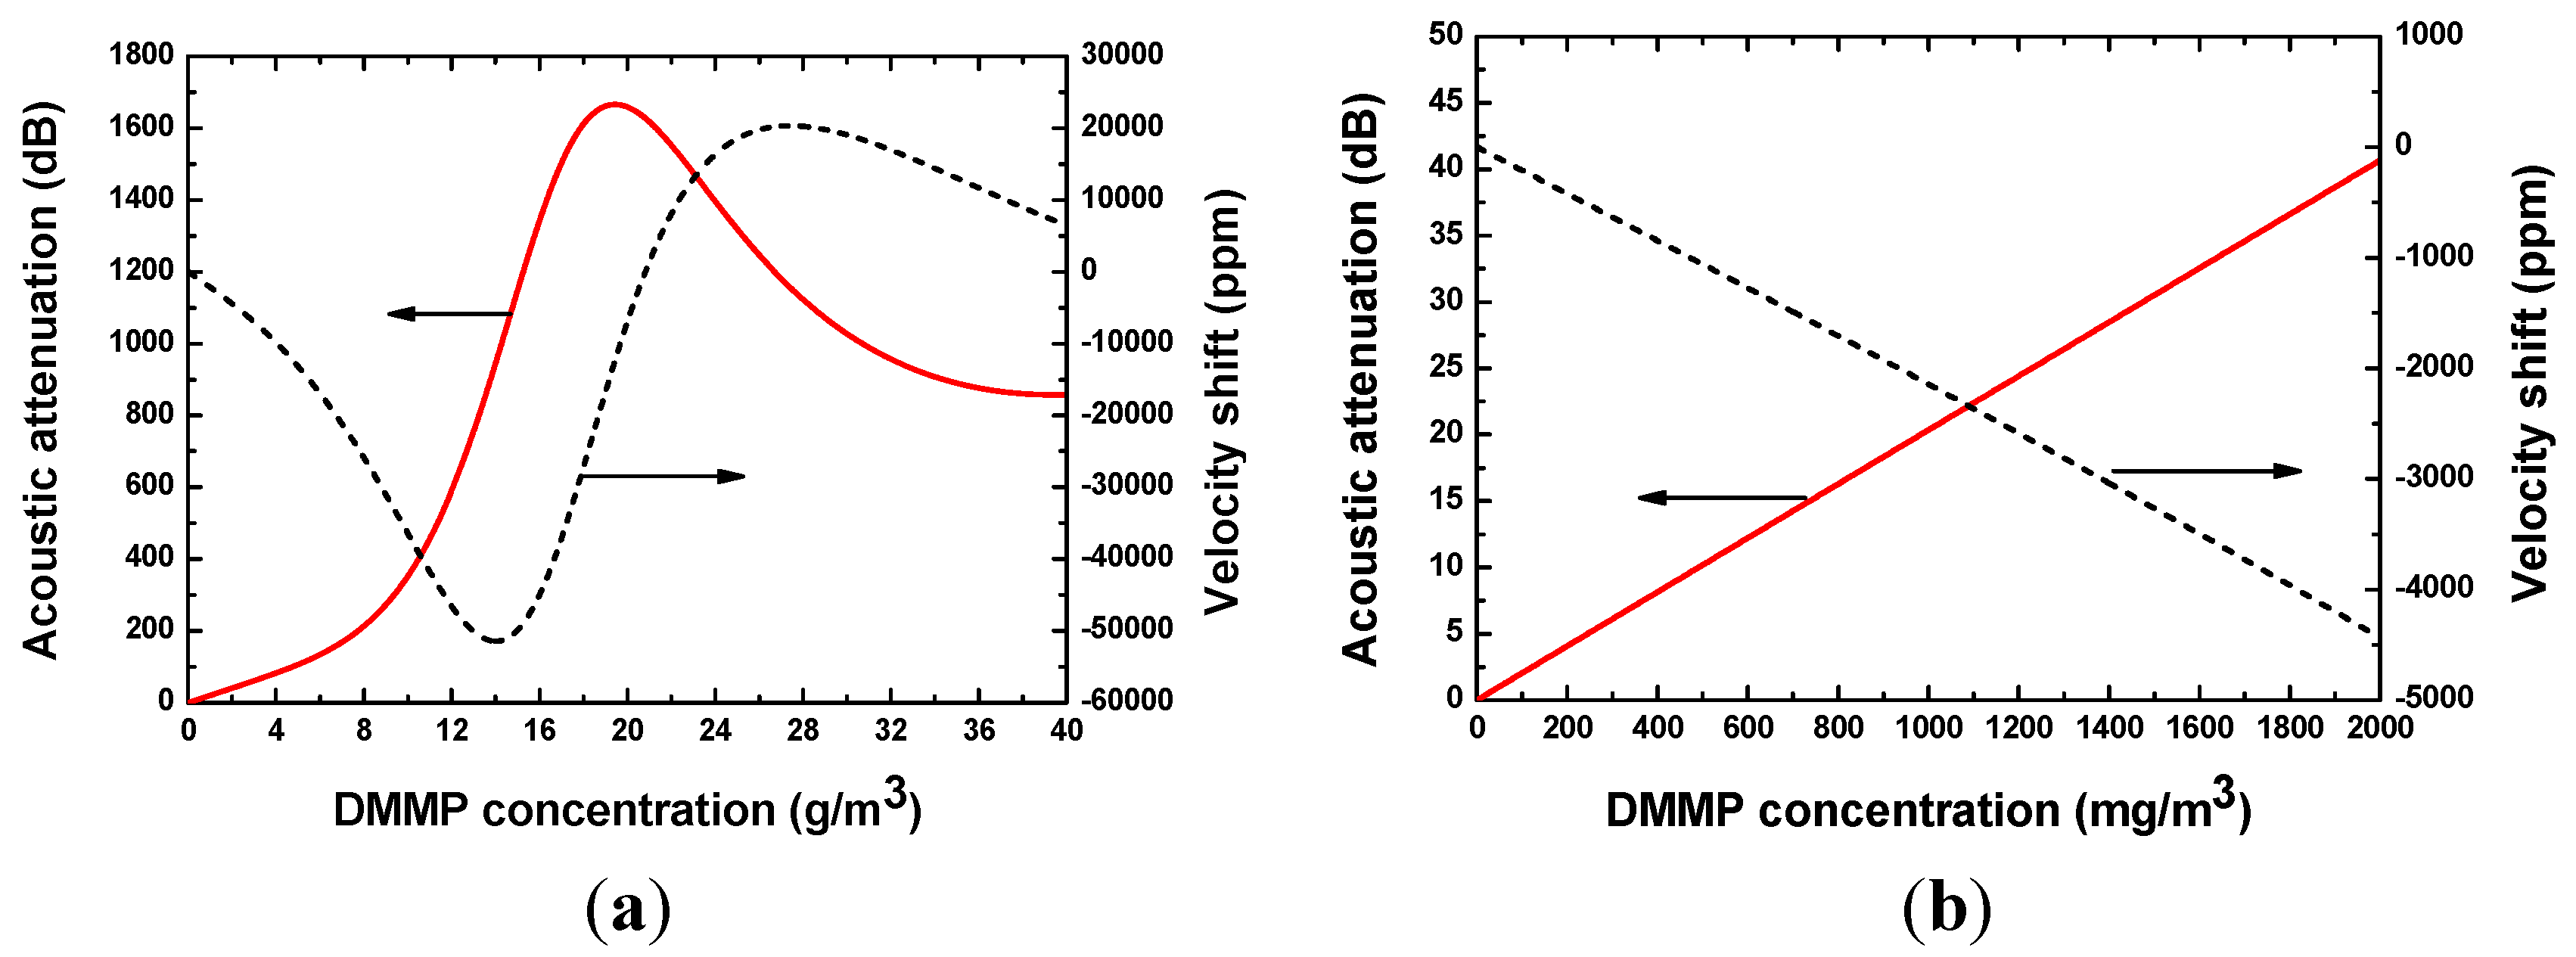
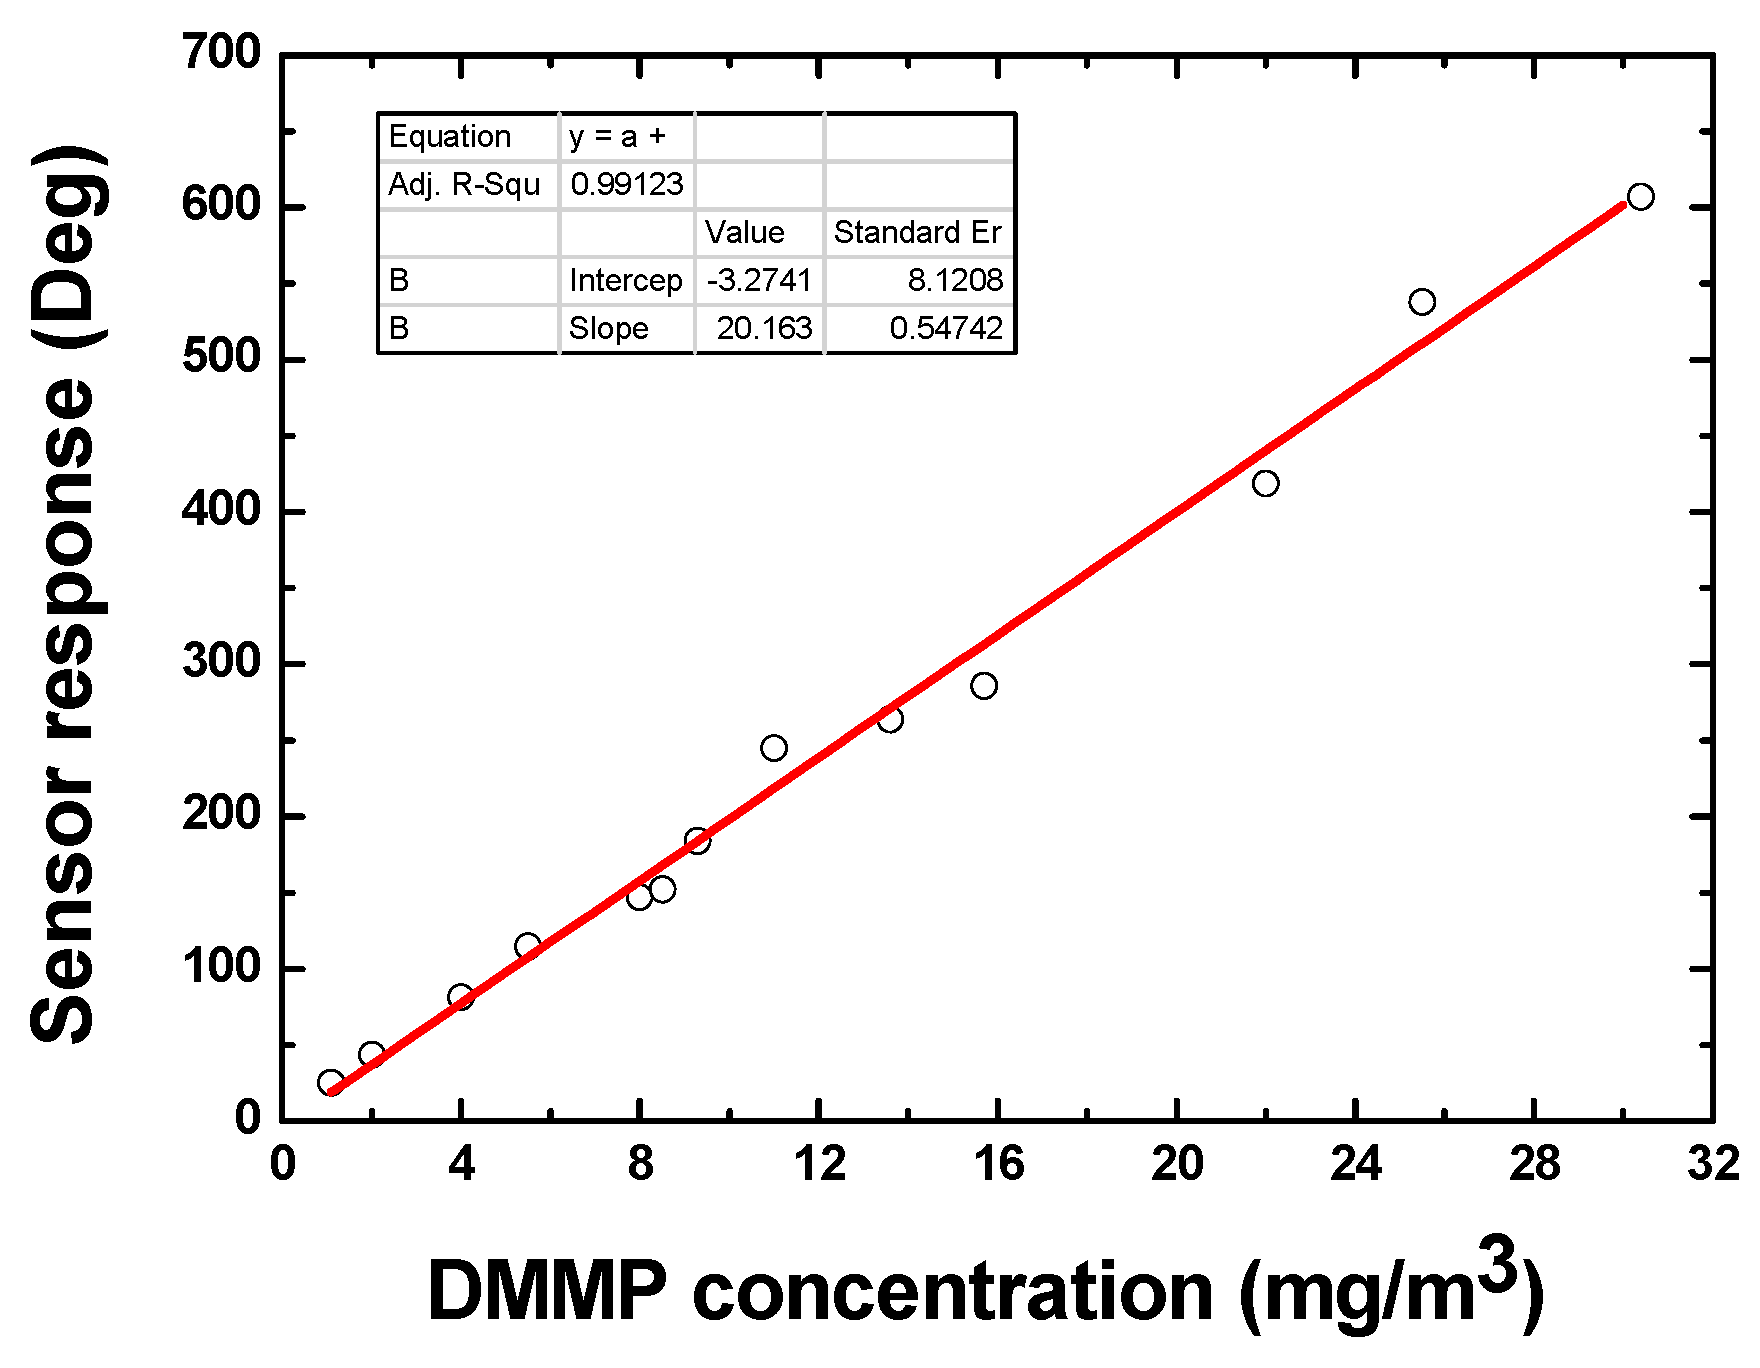
4.3. Sensitivity Evaluation

The developed SAW sensor was exposed to various concentrations of DMMP at 25 °C to evaluate its sensitivity. The DMMP concentration was increased from 1 mg/m3 to 30 mg/m3. Figure 10 describes the obtained phase response of the sensor depending on various DMMP concentrations. It is obvious that as the concentration increased, the sensor phase signal also increased with approximate linearity. The sensitivity in DMMP concentration range of 1~30 mg/m3 was evaluated as 20.1°/(mg/m3) with linearity of 0.99123. Considering the basic noise of ±2° and phase signal of ~20° response to 1 mg/m3 DMMP, the detection limit of the sensor is estimated at less than 0.5 mg/m3.
Figure 10. The sensitivity evaluation of the developed SAW sensor.
Sensors 15 29793 g010

5. Conclusions

A new wireless and passive SAW-based chemical sensor composed of a FSCW based reader unit, a SXFA-coated reflective delay lines, and two planar antennas connected to the reader unit and SAW device was proposed for OC sensing. The coupling of modes (COM) model and perturbation theory were used to predict the device performance and gas adsorption at the sensitive interface. The response of the developed SAW sensor towards DMMP was characterized in gas experiments. Excellent linearity and repeatability were achieved. The sensitivity and detection limit are evaluated as 20.1°/(mg/m3) and 0.5 mg/m3, respectively.

Acknowledgments

This work was partly supported by National Natural Science Foundation of China (Grant Nos. 11274340 and 11374254).

Author Contributions

All authors participated in the work presented here. Fang-Qian Xu and Wen Wang defined the research topic. Xu-Feng Xue and Hao-Liang Hu carried out most of the experiments. Yong Pan contributed the synthesis of the SXFA material.

Conflicts of Interest

The authors declare no conflict of interest.

References

  1. Ricco, A.J.; Crooks, R.M.; Osbourn, G.C. Surface acoustic wave chemical sensor arrays: New chemically sensitive interfaces combined with novel cluster analysis to detect volatile organic compounds and mixtures. Acc. Chem. Res. 1998, 31, 289–296. [Google Scholar] [CrossRef]
  2. Ballantine, D.S., Jr.; White, R.M.; Martin, S.J. Acoustic Wave Sensors: Theory, Design &Physico-Chemical Applications; Academic Press: San Diego, CA, USA, 1996. [Google Scholar]
  3. Pan, Y.; Yang, L.; Mu, N.; Shao, S.; Wang, W.; Xie, X.; He, S. Selective surface acoustic wave-based organophosphorus sensor employing a host-guest self-assembly monolayer of β-cyclodextrin derivative. Sensors 2015, 15, 17916–17925. [Google Scholar] [CrossRef] [PubMed]
  4. Afzala, A.; Iqbala, N. Advanced vapor recognition materials for selective and fast responsive surface acoustic wave sensors: A review. Anal. Chem. Acta 2013, 787, 36–49. [Google Scholar] [CrossRef] [PubMed]
  5. Wang, W.; Hu, H.; Chen, G.; Xie, X.; He, S. Optimization of a BSP3-coated surface acoustic wave chemical sensor. IEEE Sens. J. 2015, 15, 6730–6737. [Google Scholar] [CrossRef]
  6. Joo, B.S.; Huh, J.; Lee, D. Fabrication of polymer SAW sensor array to classify chemical warfare agents. Sens. Actuators B Chem. 2007, 121, 47–53. [Google Scholar] [CrossRef]
  7. Barie, N.; Bucking, M.; Rapp, M. A novel electronic nose based on miniaturized SAW sensor arrays coupled with SPME enhanced headspace-analysis and its use for rapid determination of volatile organic compounds in food quality monitoring. Sens. Actuators B Chem. 2006, 114, 482–488. [Google Scholar] [CrossRef]
  8. Binder, A.; Bruckner, G.; Schobernig, N.; Schmitt, D. Wireless surface acoustic wave pressure and temperature sensor with unique identification based on LiNbO3. IEEE Sens. J. 2013, 13, 1801–1805. [Google Scholar] [CrossRef]
  9. Reindl, L. Wireless passive SAW identification marks and sensors. In Proceedings of the 2nd International Symposium on Acoustic Wave Devices for Future Mobile Communication Systems, Chiba, Japan, 3–5 March 2004; pp. 1–15.
  10. Stoney, R.; Donohoe, B.; Geraghty, D.; O’Donnell, G.E. The development of surface acoustic wave sensors (SAWs) for process monitoring. Procedia CIRP 2012, 1, 569–574. [Google Scholar] [CrossRef]
  11. Li, B.; Yassinem, O.; Kosel, J. A surface acoustic wave passive and wireless sensor for magnetic fields, temperature, and humidity. IEEE Sens. J. 2015, 15, 453–462. [Google Scholar] [CrossRef]
  12. Springer, A.; Weigel, R.; Pohl, A.; Seifert, F. Wireless identification and sensing using surface acoustic wave devices. Mechatronics 1999, 9, 745–756. [Google Scholar] [CrossRef]
  13. Wang, W.; Lee, K.; Kim, T.; Yang, S.; Woo, I.; Park, I. A novel wireless, passive CO2 sensor incorporating a surface acoustic wave reflective delay line. Smart Mater. Struct. 2007, 16, 1382–1389. [Google Scholar] [CrossRef]
  14. Lim, C.-B.; Wang, W.; Yang, S.S.; Lee, K.K. Development of a wireless, battery-free SAW volatile organic compounds sensor integrated with temperature sensor. Sens. Lett. 2011, 9, 82–86. [Google Scholar] [CrossRef]
  15. Wang, W.; Lim, C.; Lee, K.; Yang, S. Wireless surface acoustic wave chemical sensor for simultaneous measurement of CO2 and humidity. J. Micro/Nanolith. MEMS MOEMS 2009, 8. [Google Scholar] [CrossRef]
  16. Lim, C.; Wang, W.; Yang, S.S.; Lee, K.K. Development of SAW-based multi-gas sensor for simultaneous detection of CO2 and NO2. Sens. Actuators B Chem. 2011, 154, 9–16. [Google Scholar] [CrossRef]
  17. Lieberzeit, P.A.; Christian, P.; Dickert, F.L.; Gerhard, F. SAW RFID-tags for mass-sensitive detection of humidity and vapors. Sensors 2009, 9, 9805–9815. [Google Scholar] [CrossRef] [PubMed]
  18. Huang, Y.S.; Chen, Y.Y.; Wu, T.T. A passive wireless hydrogen surface acoustic wave sensor based on Pt-coated ZnO nanorods. Nanotechnology 2010, 21. [Google Scholar] [CrossRef] [PubMed]
  19. Westafer, R.S.; Levitin, G.; Hess, D.W.; Michael, H.B.; William, D.H. Detection of ppb ozone using a dispersive surface acoustic wave reflective delay line with integrated reference signal. Sens. Actuators B Chem. 2014, 192, 406–413. [Google Scholar] [CrossRef]
  20. Wang, W.; He, S.T.; Liu, M.H.; Pan, Y. Advances in SXFA-coated SAW chemical sensor for organophosphorous compound detection. Sensors 2011, 11, 1526–1541. [Google Scholar] [CrossRef] [PubMed]
  21. Grate, J.W. Siloxanes with Strongly Hydrogen Bond Donating Functionalities. U.S. Patent No. 5,756,631, 26 May 1998. [Google Scholar]
  22. Hauser, R.; Carinthian, T.R.; Villach, A.; Fachberger, R.; Bruckner, G.; Smetana, W. A wireless SAW-based temperature sensor for harsh environment. In Proceedings of the 2004 IEEE Sensors, Vienna, Austria, 24–27 October 2004; pp. 860–863.
  23. Reindl, L.; Shrena, I.M. Wireless measurement of temperature using surface acoustic wave sensors. IEEE Trans. Ultrason. Ferroelectr. Freq. Control 2004, 51, 1457–1463. [Google Scholar] [CrossRef] [PubMed]
  24. Peter, R.; Harmann, C.S. Passive long range and high temperature ID systems based on SAW technology. In Proceedings of the Sensor Conference, Nuremberg, Germany, 13–15 May 2003; pp. 335–340.
  25. Wang, W.; Lee, K.K.; Yang, S.S. Optimal design on SAW sensor for wireless pressure measurement based on reflective delay line. Sens. Actuators A Phys. 2007, 139, 2–6. [Google Scholar] [CrossRef]
  26. Martin, S.J.; Frye, G.C.; Senturla, S.D. Dynamics and response of polymer-coated surface acoustic wave devices: Effect of viscoelastic properties and film resonance. Anal. Chem. 1994, 66, 2201–2219. [Google Scholar] [CrossRef]
  27. Grate, J.W. Hydrogen-bond acidic polymers for chemical vapor sensing. Chem. Rev. 2008, 108, 726–745. [Google Scholar] [CrossRef] [PubMed]

