A Split G-Quadruplex and Graphene Oxide-Based Low-Background Platform for Fluorescence Authentication of Pseudostellaria heterophylla


Abstract
: A label-free split G-quadruplex and graphene oxide (GO)-based fluorescence platform has been designed to distinguish Pseudostellaria heterophylla (PH) from its adulterants based on the differences in their nrDNA ITS sequences. Herein, GO has been first introduced to capture G-rich probes with 2:2 split mode and then decrease the background signal. As T-DNA exists, the probes leave the GO surface to form double-stranded structures followed by the formation of the overhanging G-rich sequence into a G-quadruplex structure, which combines quinaldine red specifically to produce a strong fluorescence signal. In addition, this strategy allows detection of T-DNA in a wide range of concentrations from 1.0 × 10⁻⁸ to 2.0 × 10⁻⁶ mol·L−1 with a detection limit of 7.8 × 10⁻⁹ mol·L−1. We hope that the split G-quadruplex/GO platform can be utilized to further develop gene identification sensors in Traditional Chinese Medicine or other analysis areas.1. Introduction
Recently, Traditional Chinese Medicine (TCM) is facing serious evaluation and regulation challenges [1]. In particular, adulterated medicinal herbs which may have weaker or completely different pharmacological actions [2] are still commonly misused in the market due to their similar morphological features or lower cost [3]. Pseudostellaria heterophylla (PH), possessing similar but milder efficacy than ginseng, has been commonly used to treat night sweats, asthenia after illnesses, lung and spleen diseases for children [4–6]. However, there exist many adulterants in the market, for example, Lophatherum gracile (LG), Liriope platyphylla (LP), Ophiopogon japonicus (OJ), Stemona sessilifolia (SS) and Stemona japonica (SJ) [7]. Based on well-characterized marker compounds, scientists have developed various authentication methods, e.g., HPLC-MS [8], HPCE [9], GC-MS [10] and NIR spectroscopy [6]. Furthermore, nuclear ribosomal DNA internal transcribed spacer (nrDNA ITS) possessing highly conserved and variable regions [11] has been frequently used as genetic marker for the authenticity of Chinese herbal medicines [12]. The common techniques for genetic authentication include RAPD [13], RFLP [14] and assembly-free genome sequencing [15]. However, the practicality of these methods is limited by their reliability, sensitivity and cost of execution. Therefore, there is an urgently need to develop a reliable, sensitive and low-cost authentication method.
G-quadruplexes, which are formed by the fold-over of G-rich sequences [16], can accommodate fluorescent ligands specifically through π-stacking, loop or groove recognition, and this affects the fluorescence signal [17]. For example, quinaldine red is reported to have a weak fluorescence signal itself and display strong enhancement upon binding G-quadruplexes [18,19]. Furthermore, much research has been done on splitting the unusual G-rich sequence into two equal parts (2:2 split mode) for the sake of extraordinary selectivity and a more flexible assay design. However, the 2:2 split parts could easily assemble into a G-quadruplex in the absence of target DNA and then produce a background signal [20].
In recent years, the novel nanomaterial graphene oxide (GO) has attracted more and more attention. In particular, GO with epoxides, carboxylic acids and hydroxyl groups can be obtained through acid exfoliation of graphene [21], and these active groups render GO water-soluble and suitable for biosensors/bioassays [22]. Moreover, it is reported that GO can capture single-stranded DNA strongly through π-stacking interactions [23], yet capture rigid double-stranded DNA weakly due to the nucleobases within the negatively charged phosphate backbone [24]. G-quadruplexes are also reported to have weak affinity for GO due to their high space charge density [25]. This interesting property of GO of differentiating between diverse DNA structures has been utilized for DNA biosensors [26].
In this study, we construct a fluorescence platform for distinguishing PH from its adulterants based on their different ITS sequences. Herein, G-quadruplex with 2:2 split mode is applied in the design of the probe and a GO nanosheet to adsorb the probe and decrease the background is introduced. In addition, quinaldine red is chosen as fluorescent indicator for revealing G-quadruplex formation.
2. Experimental Section
2.1. Materials
GO dispersion (1 g·L−1) was obtained from Xianfeng Nanotechnologies Co., Ltd. (Nanjing, China). Quinaldine red was purchased from Aladdin Chemistry Co., Ltd. (Shanghai, China). All oligomers were synthesized by Sangon Biotechnology Co., Ltd. (Shanghai, China). Tris-HCl buffer (pH 7.0) contains 25 mM Tris, working buffer (pH 8.0) contains 50 mM Tris and 100 mM KCl. The oligomers (5.0 × 10⁻⁵ mol·L−1) were prepared in Tris-HCl buffer and quinaldine red solution (5.0 × 10⁻⁴ mol·L−1) was prepared in the working buffer.
2.2. Assay Procedure
In the split G-quadruplex/GO assay, probe (0.5 μL, 5.0 × 10⁻⁵ mol·L−1) was first added to GO dispersion (2.5 μL, 1 g·L−1) for 60 min. Second, a certain volume of T-DNA (5.0 × 10⁻⁵ mol·L−1) and working buffer (25 μL) were added, and this uniform mixture was incubated for 60 min. Subsequently, working buffer along with quinaldine red (5 μL, 5.0 × 10⁻⁴ mol·L−1) was added to adjust the total volume to 250 μL. After 60 min, the fluorescent spectrum was scanned on a fluorescence spectrophotometer (Varian Cary Eclipse, Palo Alto, CA, USA). The instrument parameters were set as follows: λex = 562 nm (slit 10 nm), λem = 580–800 nm (slit 10 nm). In the circular dichroism (CD) experiments, the final concentrations of probes and T-DNA were 5.0 × 10⁻⁶ mol·L−1 and which of GO was 10 mg·L−1. CD spectra were measured on a circular dichroism spectrometer (Aviv Model 420, Lakewood, NJ, USA) at room temperature. The wavelengths were scanned from 220 to 320 nm, with a step of 2 nm and bandwidth of 1 nm.
3. Results and Discussion
3.1. Fluorescence Property of Quinaldine Red
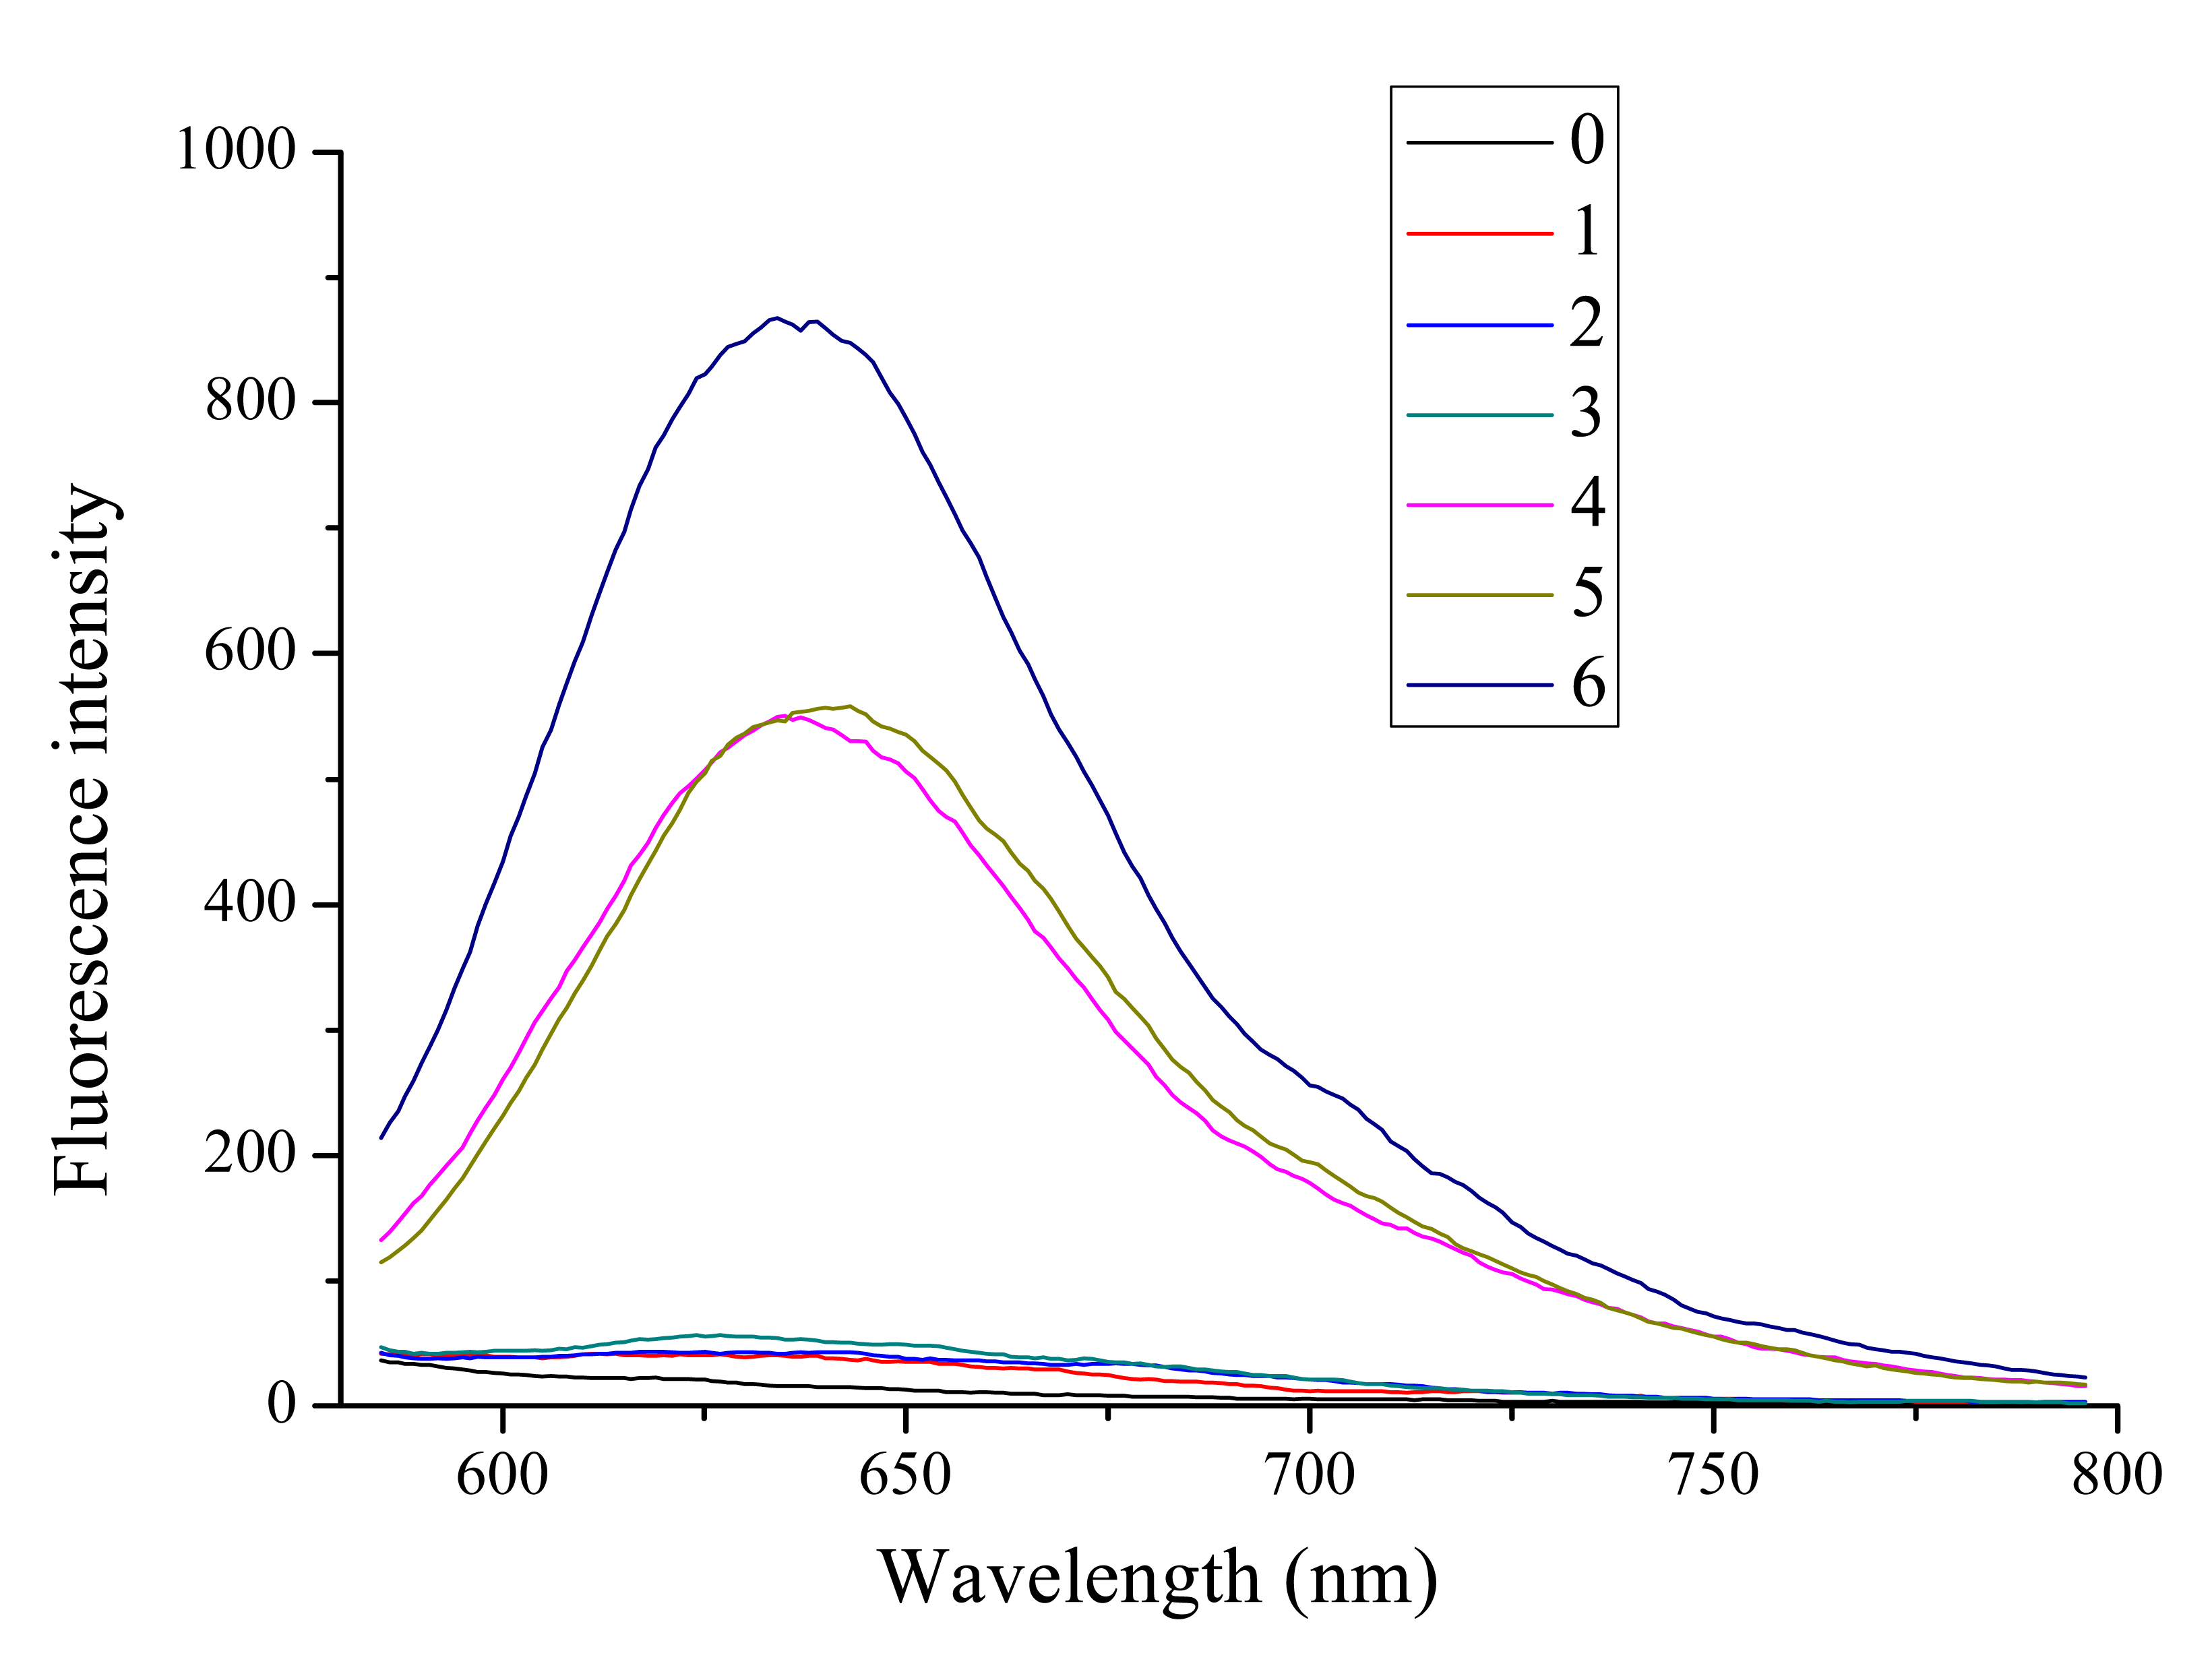
It has been reported that the fluorescence intensity of quinaldine red increases greatly in the presence of G-quadruplexes [18]. Furthermore, its fluorescence performance in the presence of different DNA conformations (in Table 1) has been investigated.
As indicated in Figure 1, the fluorescence of quinaldine red itself is quite low (curve 0) and then increases little in the presence of oligomers 1, 2 (dsDNA; curves 1, 2) and oligomer 3 (tetramer-type G-quadruplex, curve 3). Moreover, the fluorescence increases strongly in the presence of oligomer 4 (hairpin-type G-quadruplex, curve 4) and oligomer 5 (G-quadruplex, curve 5). Finally, it reaches a maximum in the presence of oligomer 6 (parallel G-quadruplex, curve 6). Therefore, oligomer 6 is utilized in the probe design.
3.2. Probe Design and Optimization
According to reports, there exists certain variation in the nrDNA ITS region between PH and its counterfeit species [7]. As shown in Table 2, a section of ITS sequence specific for PH is labeled as T-DNA and works as target, while sequences specific for the adulterants are labeled as C-DNA.
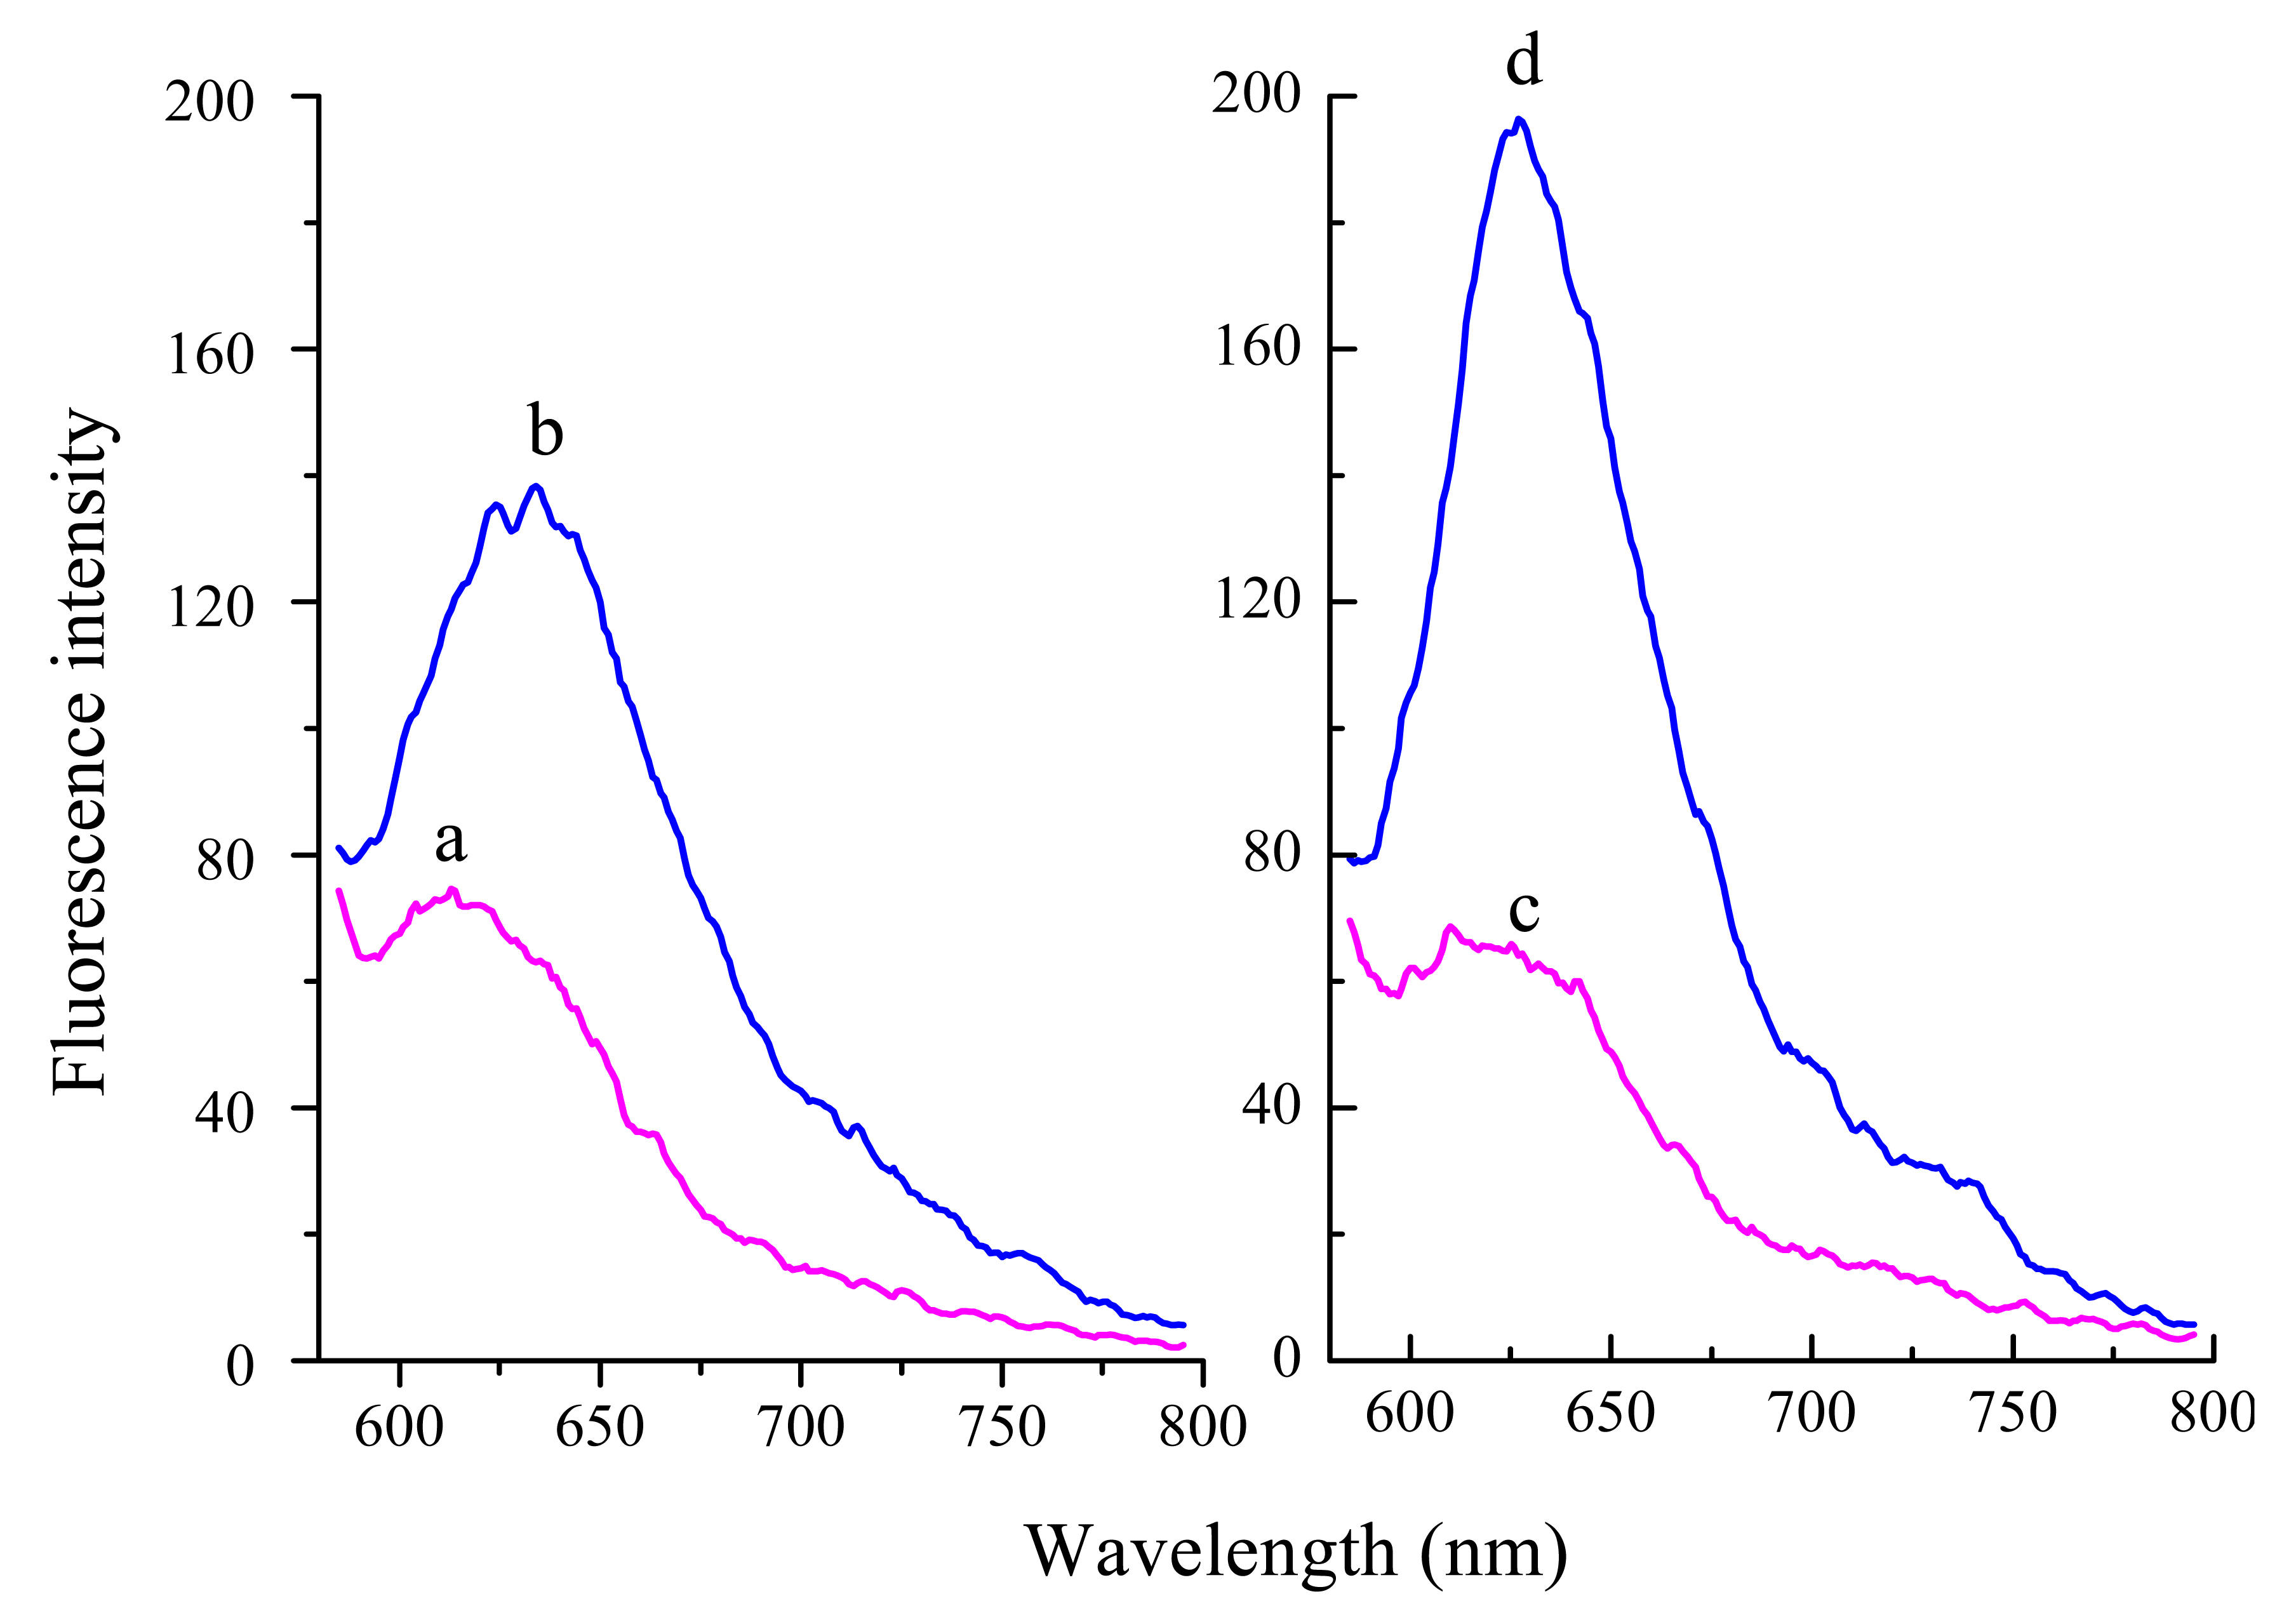
Furthermore, based on T-DNA and oligomer 6, two types of probe have been designed: probe 1 and probe 2 (probe 2-a, probe 2-b). Firstly, the G sequence of PS2.M at the 5′-terminus is moved to the 3′-terminus. Probe 1 possesses one section from the 3′-terminus complementary to T-DNA and the rest is PS2.M sequence. According to the equal 2:2 split mode, probes 2-a and -b both have one section complementary to different regions of T-DNA and the other section being two GGG repeats, respectively. Herein, the performance of probe 1 and probe 2 has been investigated and compared under the same conditions. In the absence of T-DNA, probe 1 system displays a little higher fluorescence signal (Figure 2, curve a) compared with probe 2 (curve c). Moreover, in the presence of T-DNA, probe 2 system (curve d) exhibits an obviously higher fluorescence signal than probe 1 system (curve b). Therefore, probe 2 with 2:2 split mode is chosen in the following experiments.
3.3. Principle of the Split G-Quadruplex/GO Platform
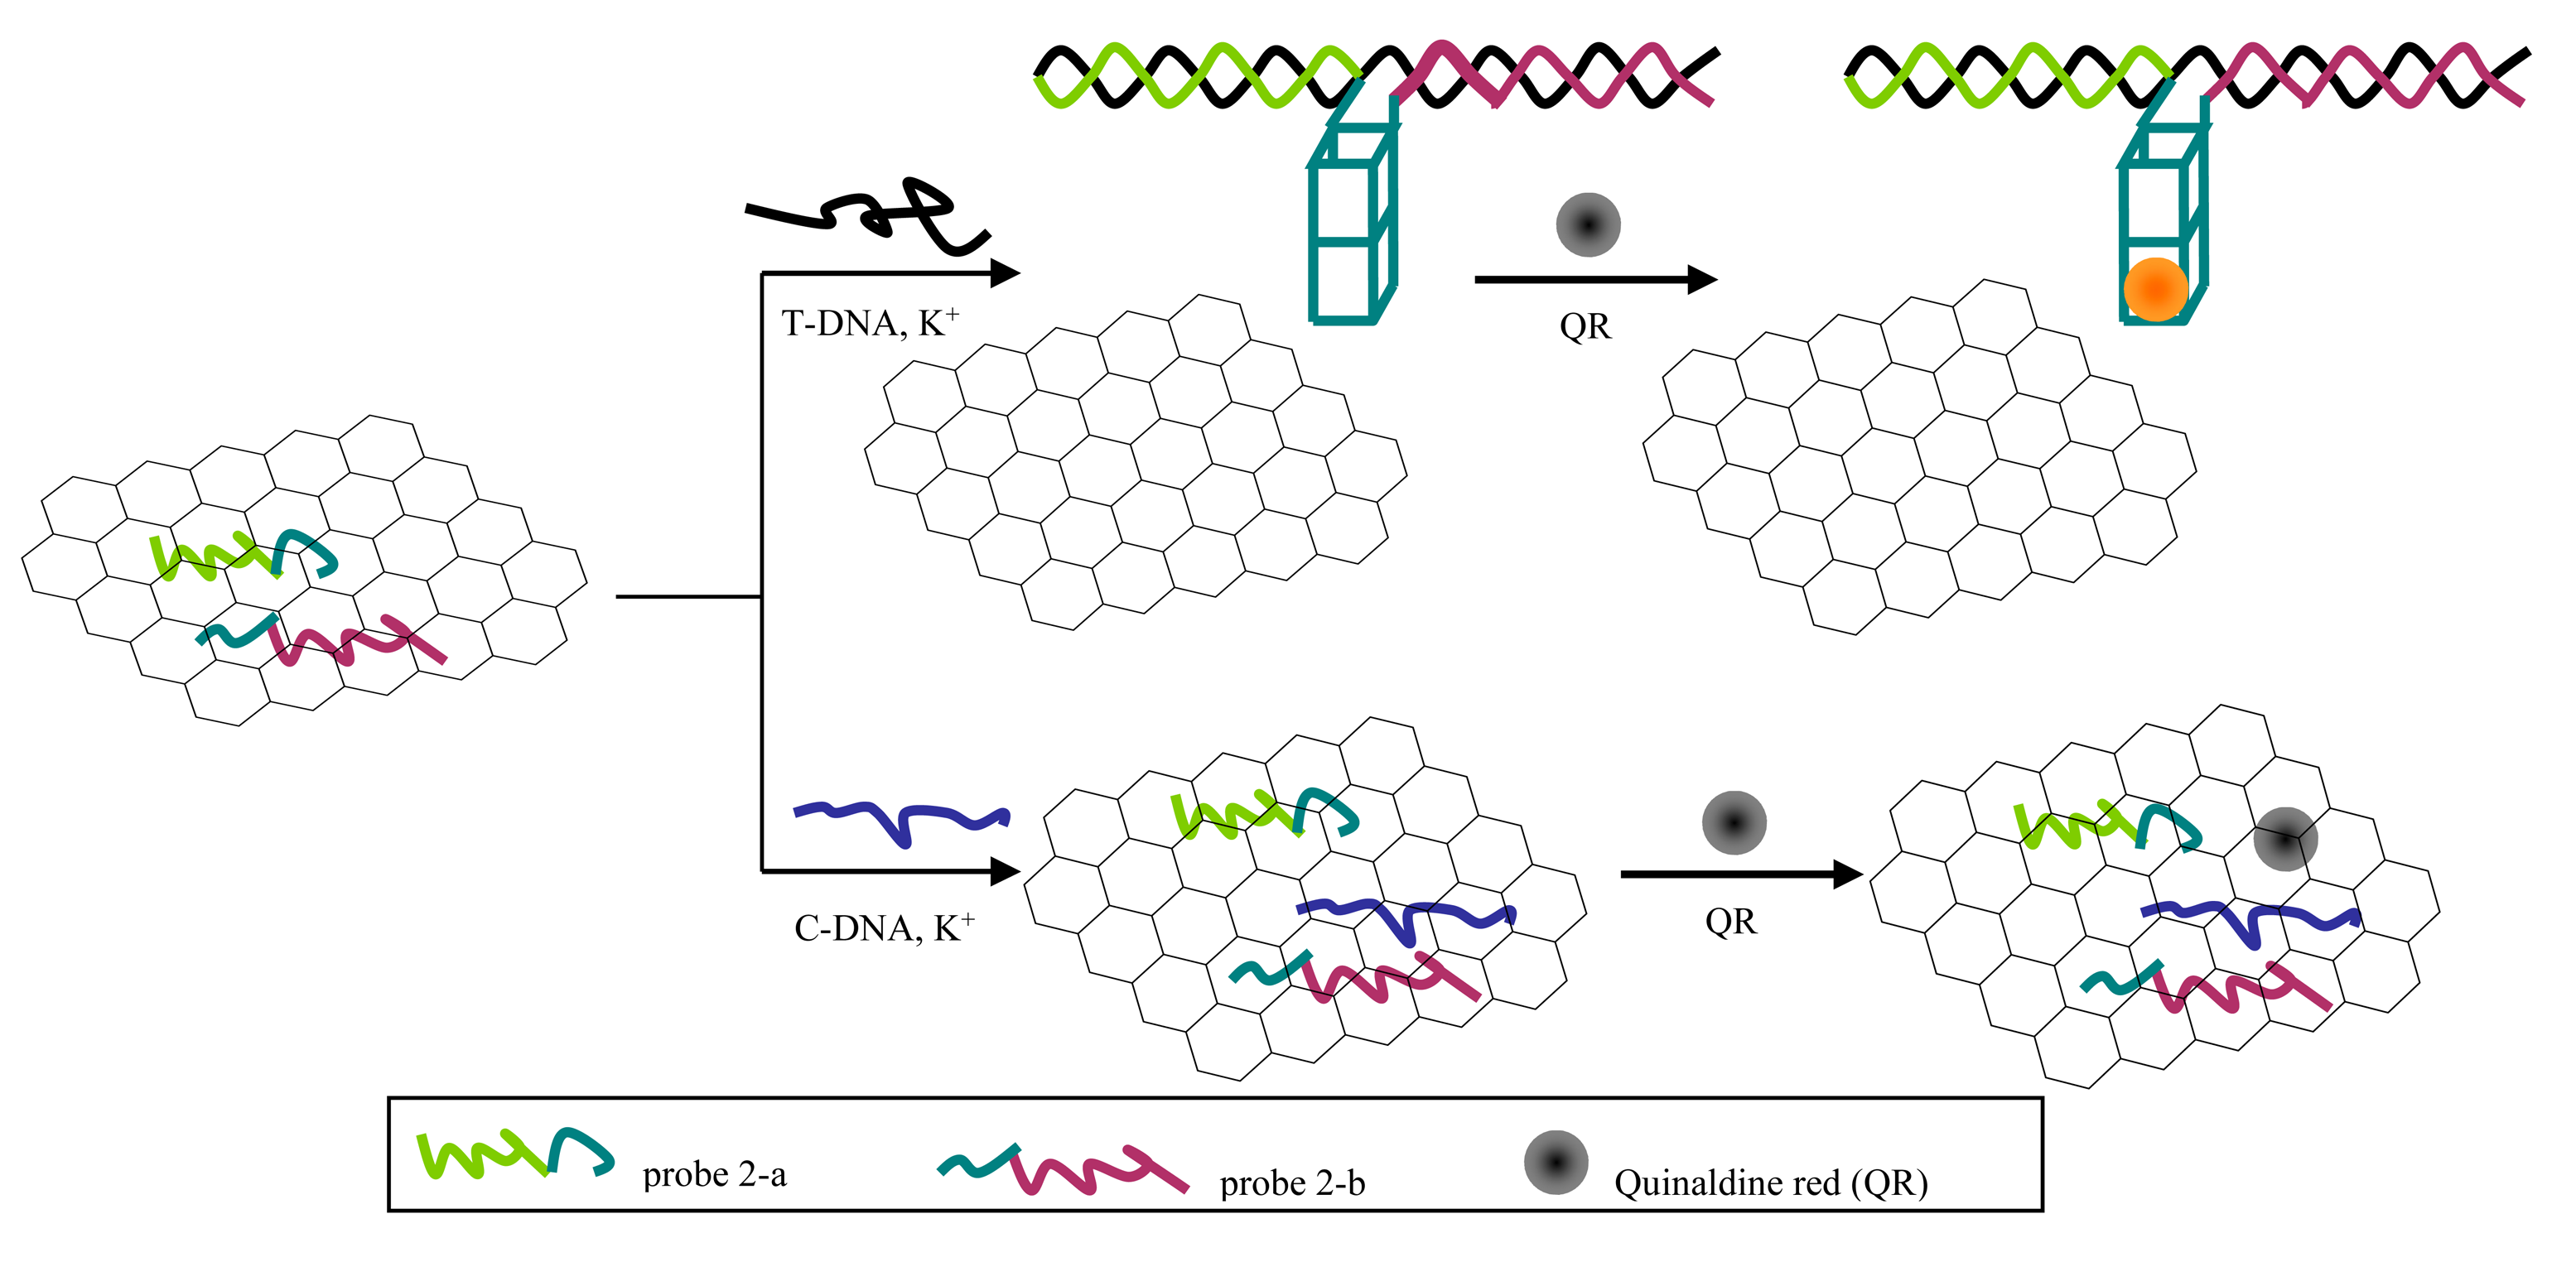
Scheme 1 shows principle of the split G-quadruplex/GO based fluorescence platform for discriminating PH from its counterfeit species.
In the absence of T-DNA, probes in single-stranded conformation can be adsorbed on the GO surface and even C-DNA added can barely release the probes. In the presence of T-DNA, the probes hybridize with T-DNA to form rigid double-stranded structures. However, this double-stranded DNA cannot be stably adsorbed on the GO surface due to its negatively charged phosphate backbone. Furthermore, in the presence of K+, the overhanging G-rich sequence mutually combines to shape a G-quadruplex structure which helps the compound to keep away from the GO platform. Eventually, quinaldine red combines with G-quadruplex specifically and then releases a strong fluorescence signal.
3.4. Fluorescence Recovery
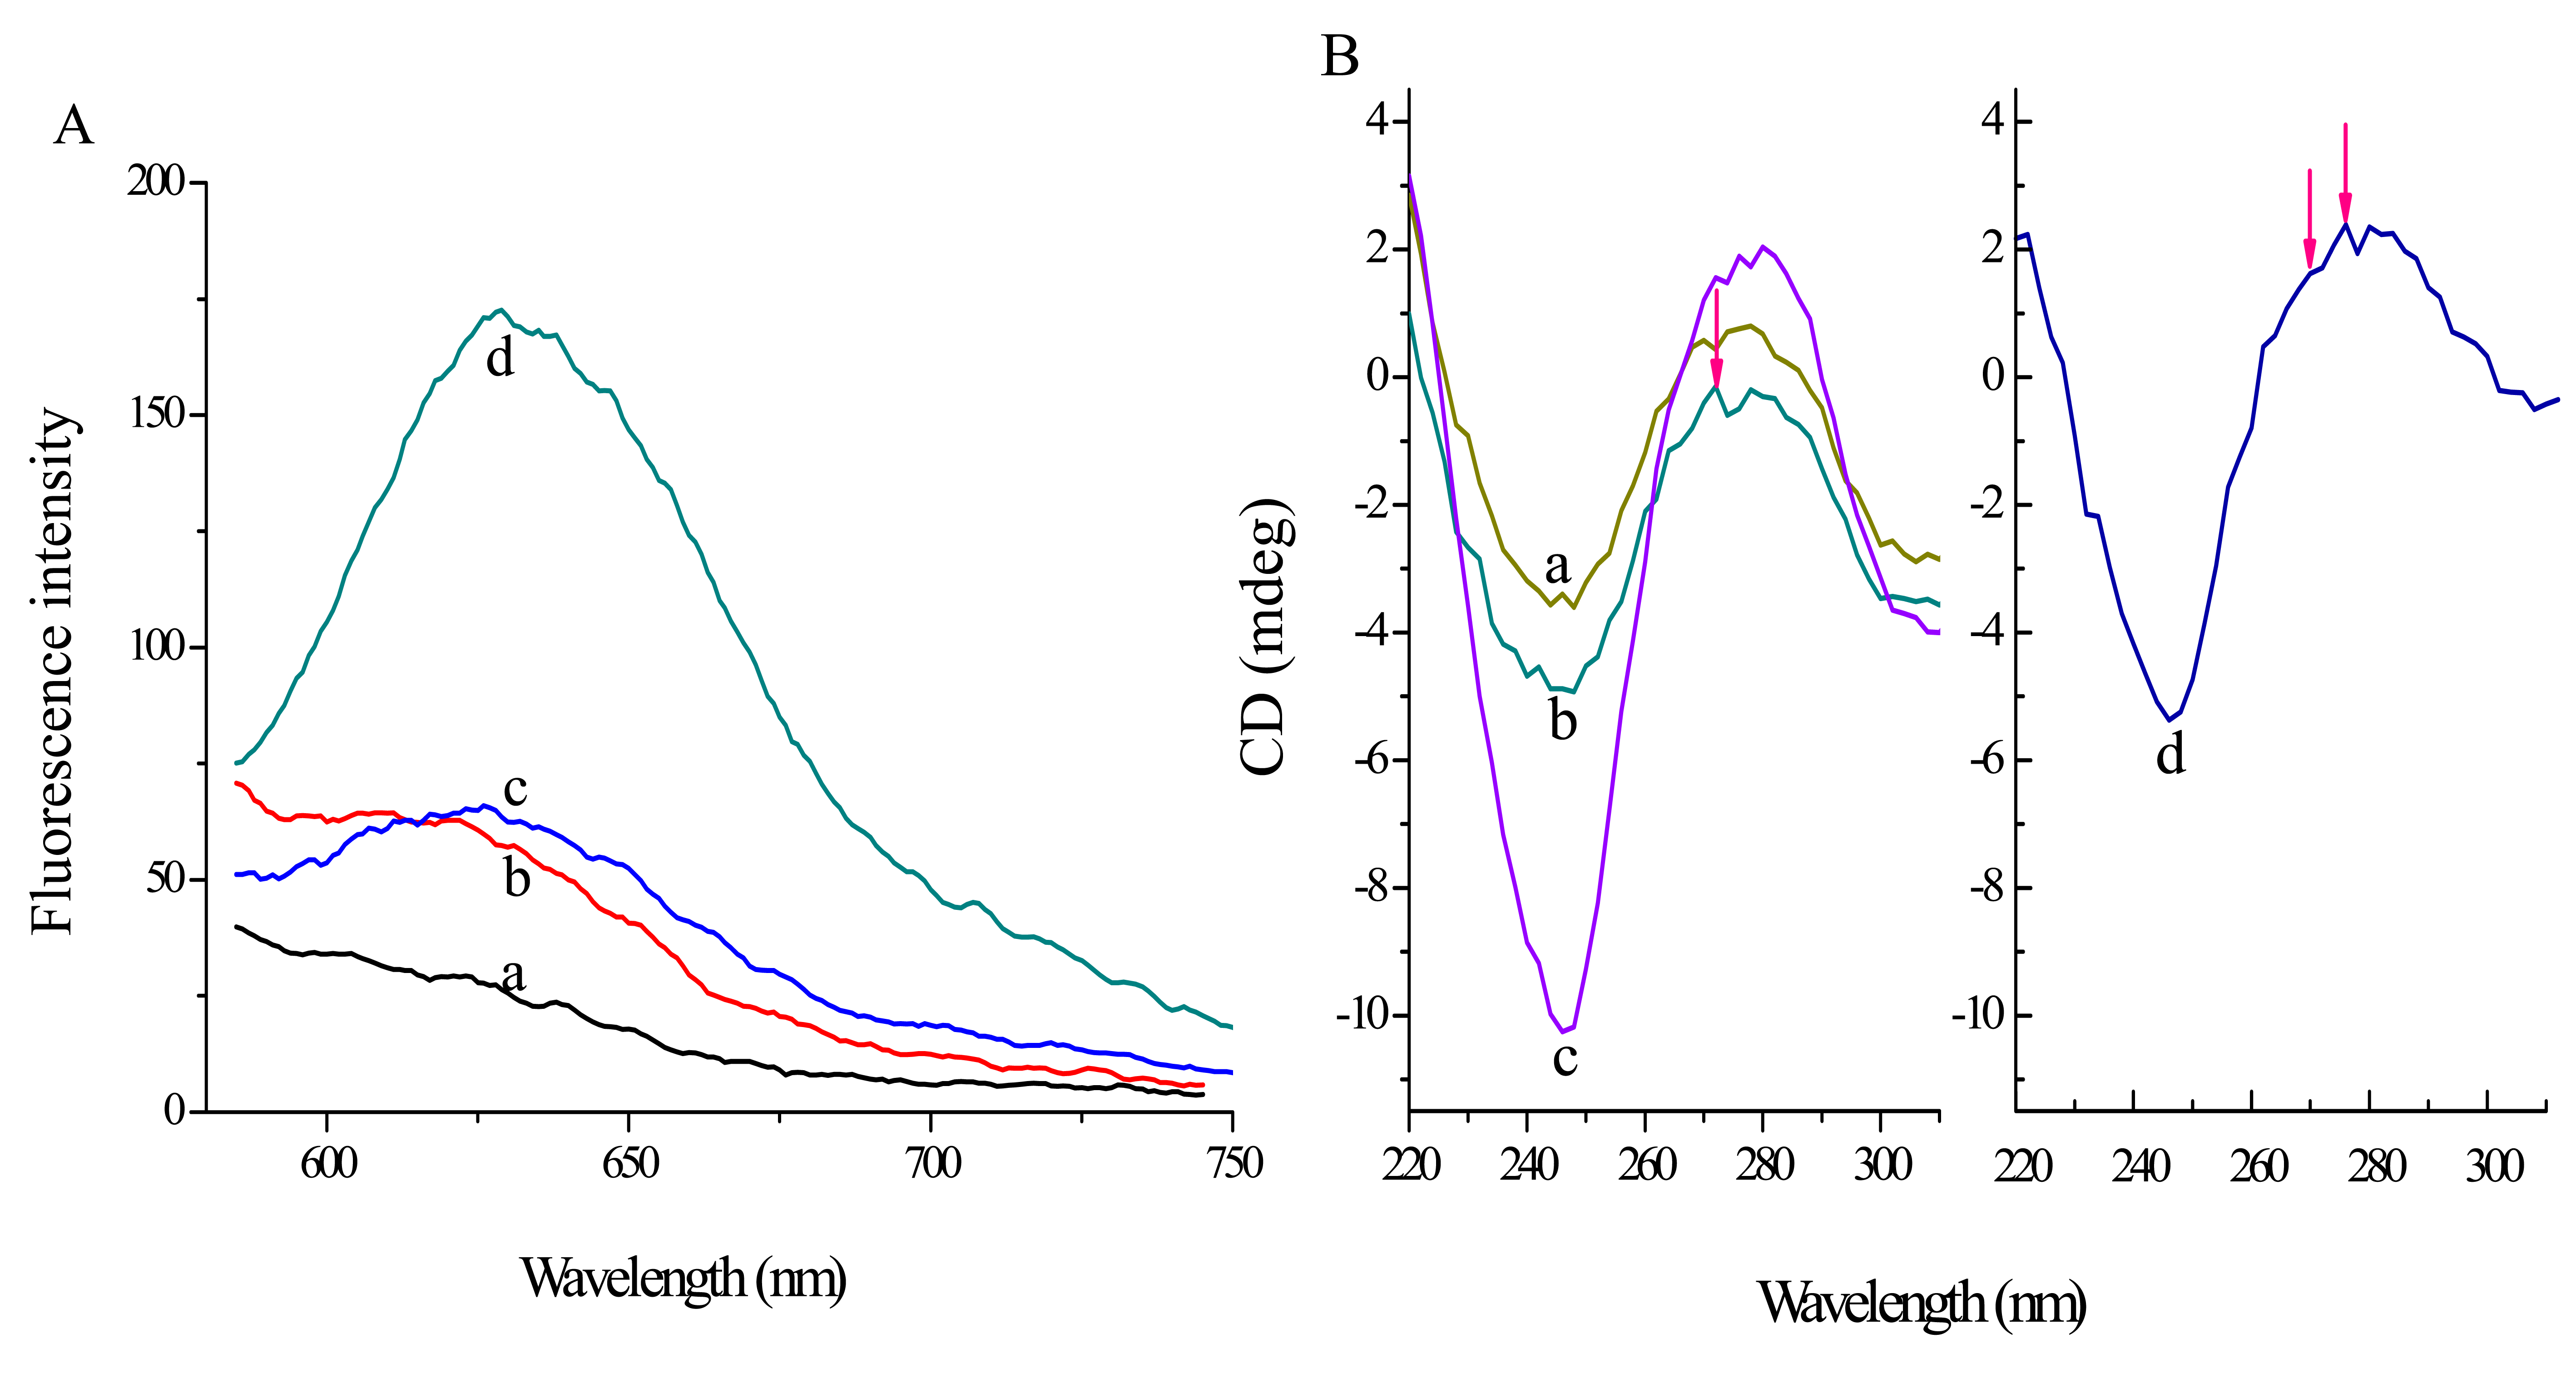
To further demonstrate the principle, fluorescence recovery of the split G-quadruplex/GO platform has been studied. As shown in Figure 3A, fluorescence signal of quinaldine red itself (curve a) is quite low and then increases a little as 10 mg·L−1 GO is added (curve b).
Moreover, the signal has nearly no change after incubation with probe 2 (curve c, F0), which indicates that the probes are completely adsorbed on the GO surface. Furthermore, as 3 × 10⁻⁷ mol·L−1 T-DNA is added, the fluorescence signal (F, curve d) increases dramatically with fluorescence recovery efficiency (F/F0) of 261.8%. Fluorescence recovery efficiency is calculated by F/F0, where F0 and F represent fluorescence intensity of the split G-quadruplex/GO system in the absence and presence of T-DNA, respectively. The result demonstrates that the probes can hybridize with T-DNA and the overhanging G-rich sequence shapes G-quadruplex structure combine with quinaldine red to release a strong fluorescence signal.
Meanwhile, CD and a subtractive method are also used to verify the principle. According to reports, the CD spectrum of a typical parallel G-quadruplex structure has a positive peak near 270 nm and a negative band around 240 nm, while a positive peak at 295 nm and a negative peak near 265 nm can be characterized in typical antiparallel G-quadruplex structures [27]. In addition, the CD spectrum of a B-form duplex DNA structure possesses a positive peak around 277 nm and a negative band close to 245 nm [28]. As shown in Figure 3B, the CD signal of curve b shifts negatively compared to that of curve a, which indicates the G-quadruplex structure can be affected by the GO platform. Furthermore, the influence of T-DNA can be determined by curve d by subtracting curve b from c. We can find that curve d has a positive peak around 277 nm, a shoulder peak at 270 nm and a negative band near 245 nm. The result suggests that the probes combine T-DNA to construct a B-form duplex and the overhanging G-rich repeats can shape a parallel G-quadruplex structure.
3.5. Optimization of Factors
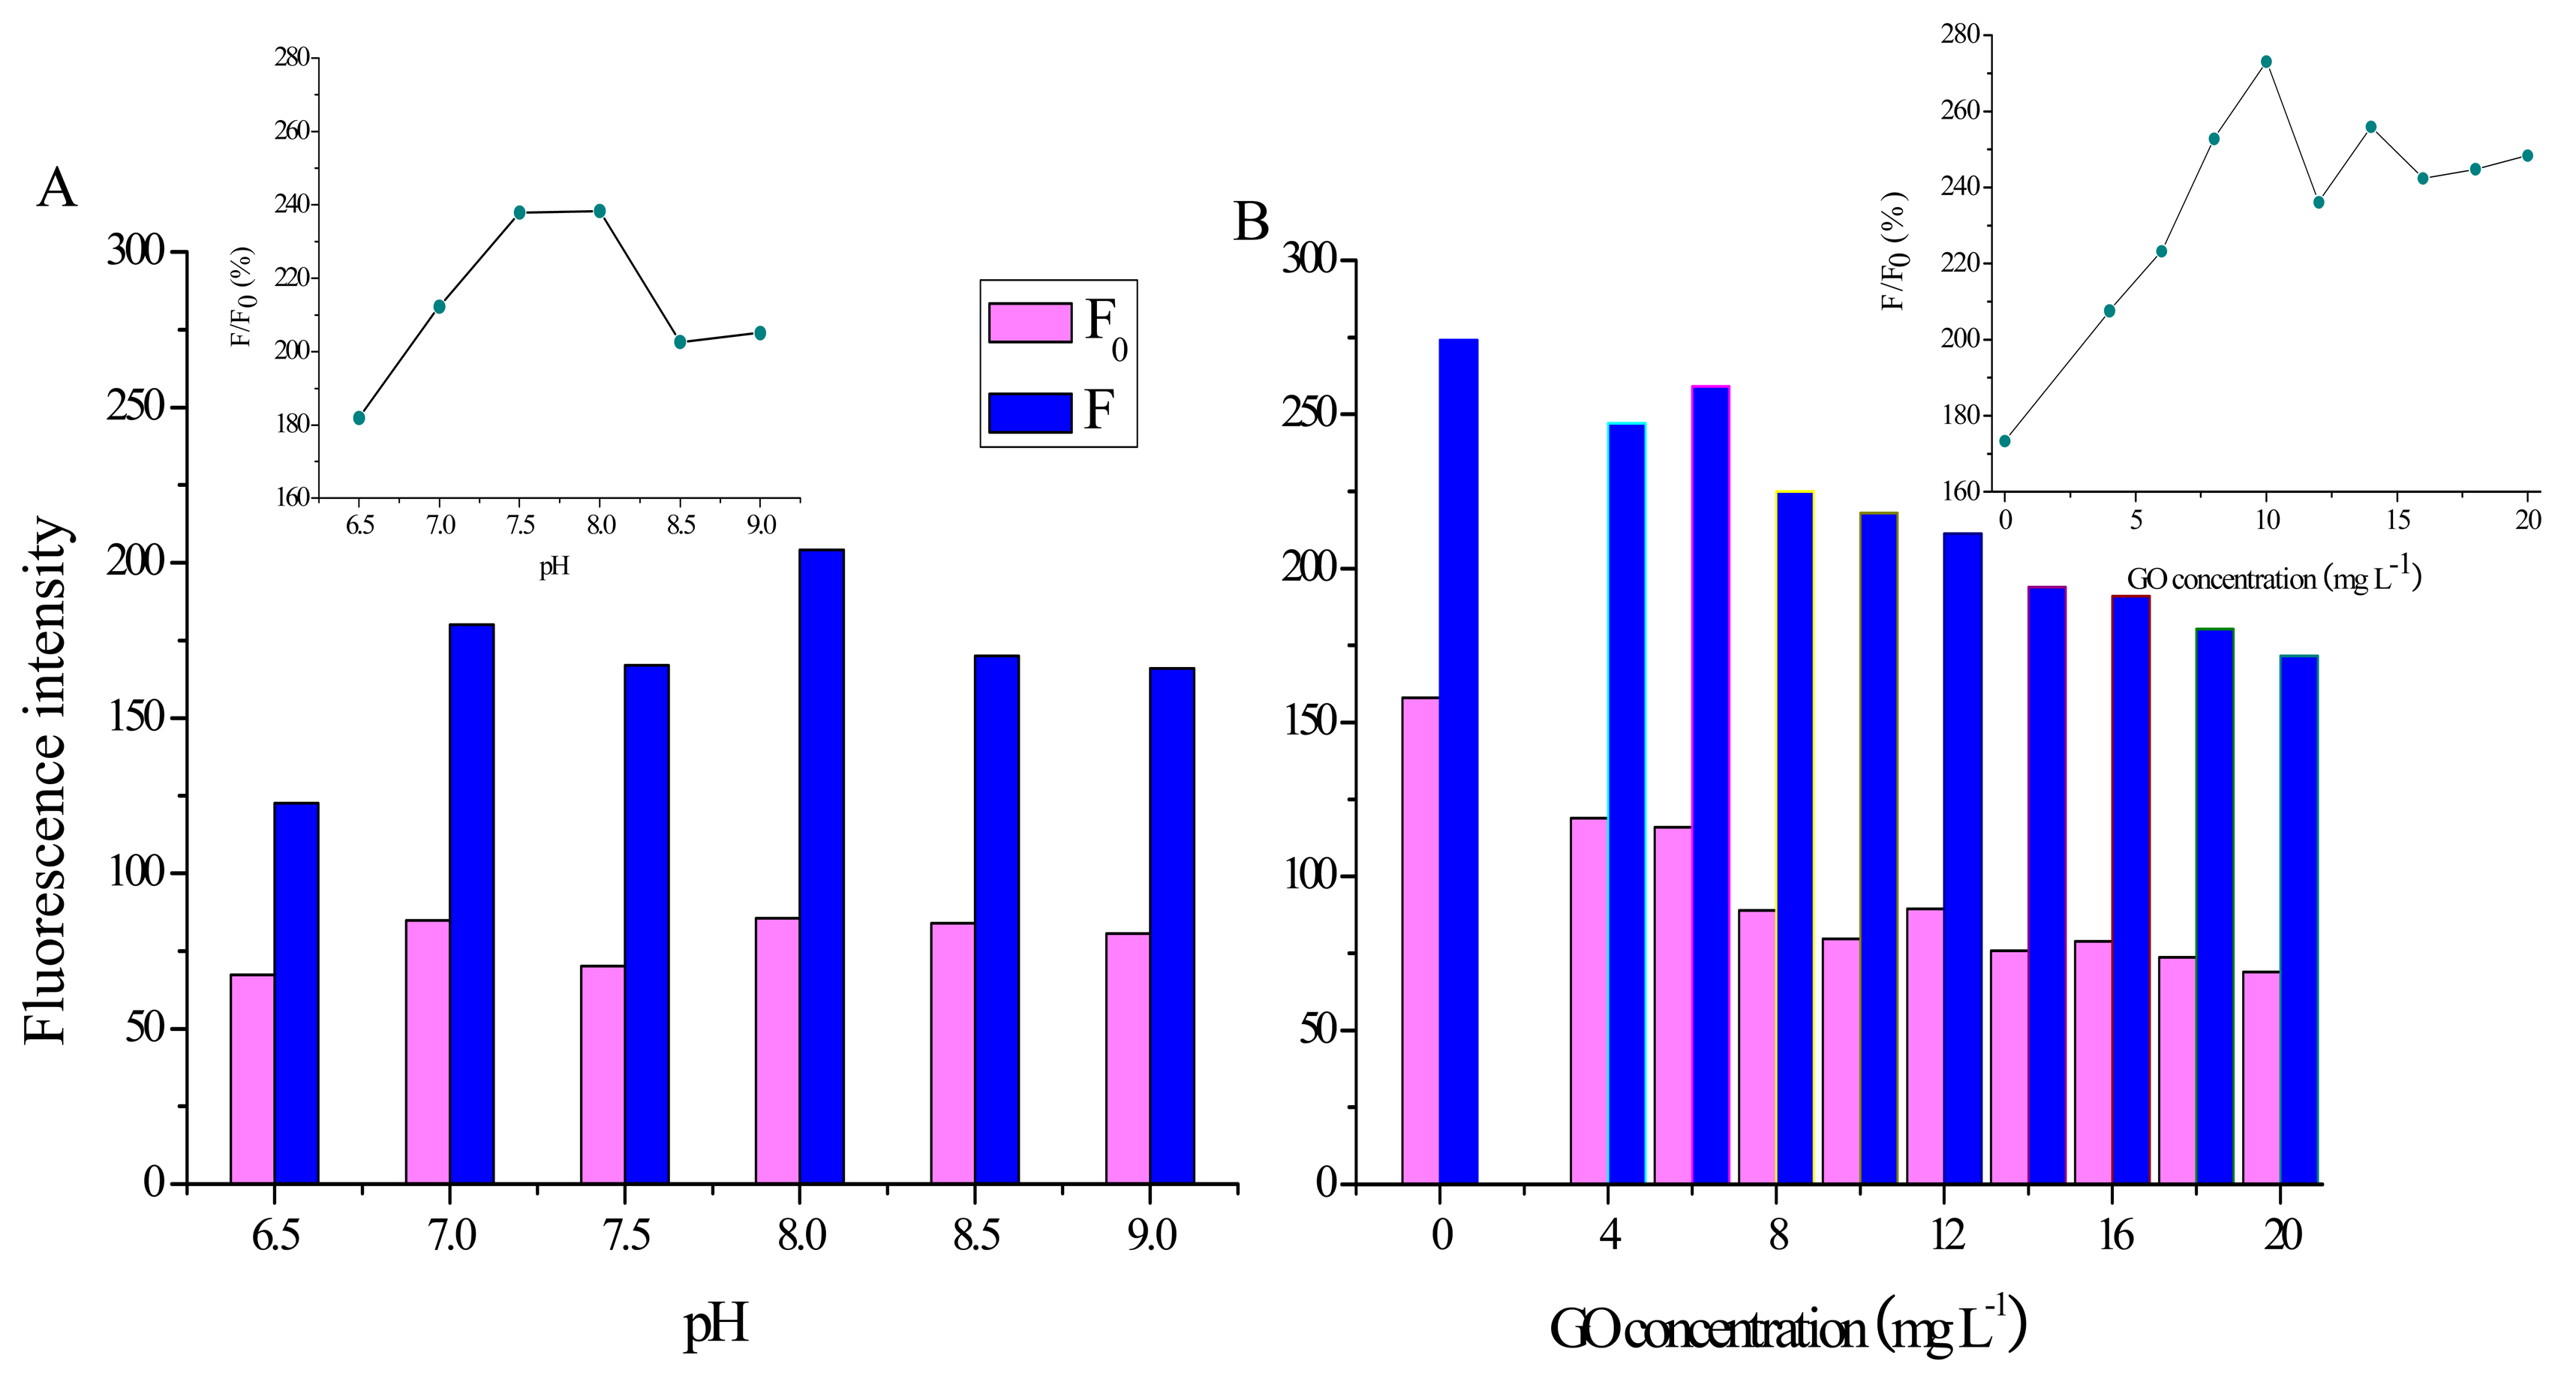
A series of working buffers with pH values from 6.5 to 9.0 have been prepared and their effect on the fluorescence recovery efficiency has been investigated. As shown in Figure 4A, while F0 has nearly no change with the increasing pH, the value of F increases greatly from 6.5 to 7.0 and then possesses a maximum at pH 8.0. Moreover, F/F0 increases with pH from 6.5 to 7.5, followed by a stationary phase from 7.5 to 8.0 and then a decrease after 8.0 (inset in Figure 4A). Therefore, pH 8.0 is used in the following experiments.
The influence of GO concentration (from 0 to 20 mg·L−1) on the recovery efficiency has also been studied. As shown in Figure 4B, while both F0 and F decline gradually with the increase of GO concentration, F/F0 increases rapidly with the GO concentration from 0 to 10 mg·L−1 and then shows little change after 12 mg·L−1 (inset in Figure 4B). From the results, we can conclude that 10 mg·L−1 GO nanosheets provide enough space and suitable force for adsorbing probes. Therefore, 10 mg·L−1 GO dispersion is used in the following experiments.
3.6. Analysis of T-DNA and Specificity Study
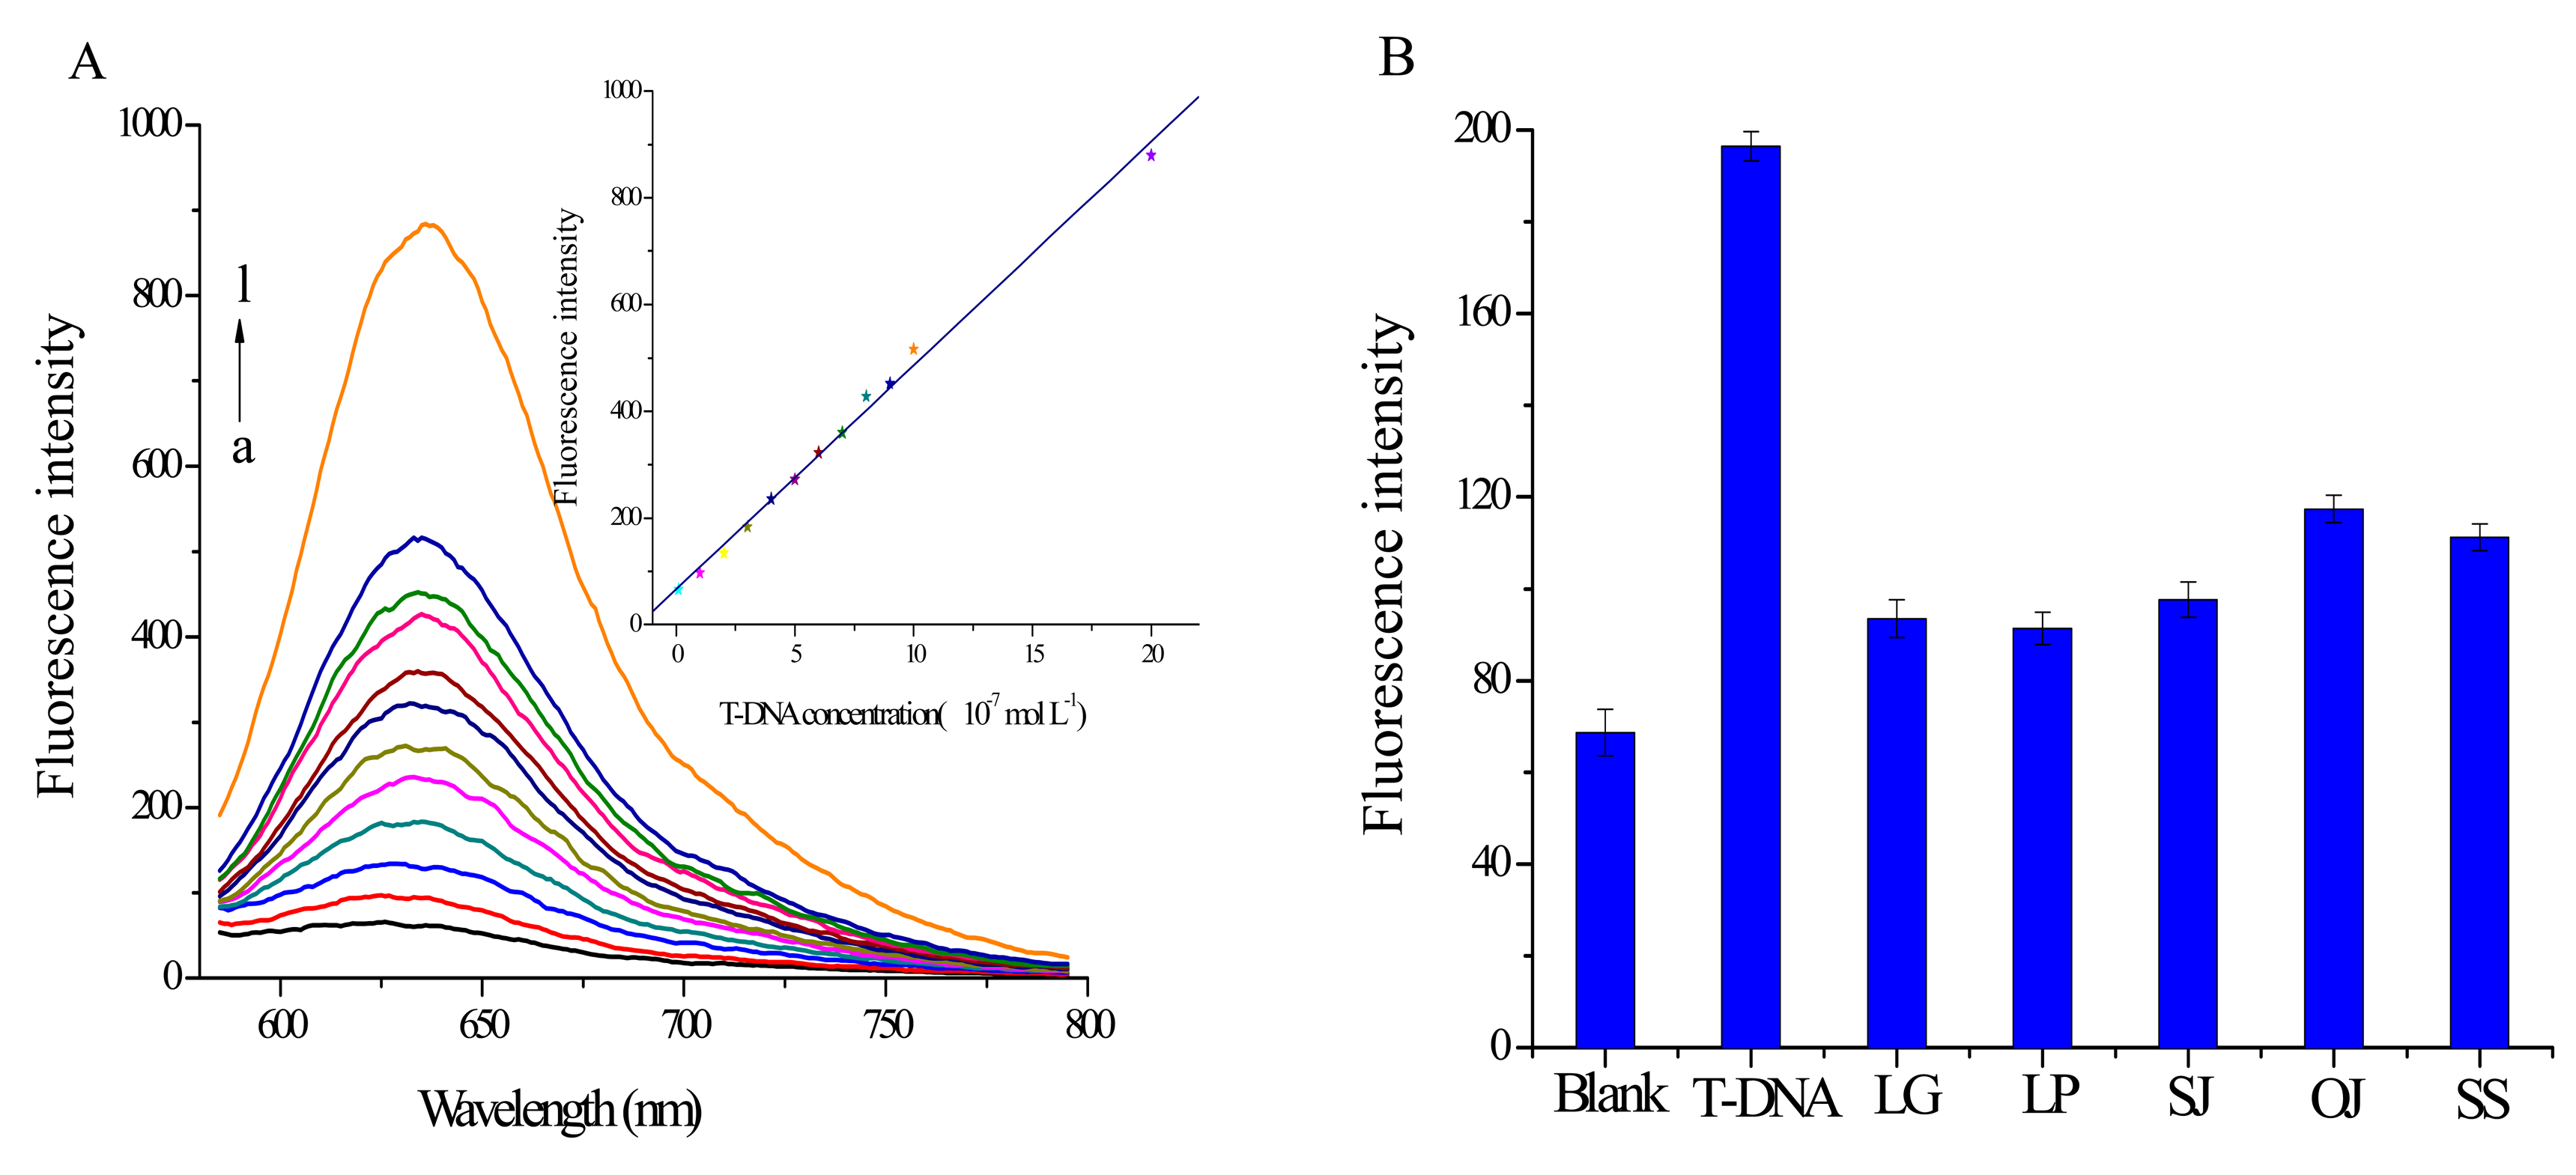
The relationship between the fluorescence signal and T-DNA concentration is investigated under the optimal experimental conditions. Figure 5A indicates that the fluorescence signal increases continuously with T-DNA concentration from 1.0 × 10⁻⁸ to 2.0 × 10⁻⁶ mol·L−1. Furthermore, the inset in Figure 5A is the calibration curve for T-DNA detection. It shows the fluorescence intensity is linearly dependent on the T-DNA concentration in the range from 1.0 × 10⁻⁸ to 2.0 × 10⁻⁶ mol·L−1 (coefficient R2 = 0.9974). The detection limit is estimated to be 7.8 × 10⁻⁹ mol·L−1 (3S0/S, S0 is the standard deviation for the blank solution, n = 7; S is the slope of the calibration curve). These results clearly demonstrate that the split G-quadruplex/GO platform can be a sensitive approach for identifying T-DNA.
In order to discuss the specificity of this split G-quadruplex/GO platform, control experiments with the main counterfeit species C-DNA with the same concentration of T-DNA have been done. As shown in Figure 5B, the fluorescence signal exhibits a much lower response to C-DNA than T-DNA, which demonstrates the binding force between C-DNA and probes is too weak to drive probes away from GO surface. Therefore we can conclude that the split G-quadruplex/GO based sensor can be utilized for authentication of PH from its main counterfeit species with little interference.
4. Conclusions
In the present study, we have developed a sensitive and selective platform for distinguishing and authenticating PH from its main counterfeit species using the nrDNA ITS sequence as DNA marker. In the platform, 2:2 split G-quadruplex probes are designed and GO nanomaterial is first introduced to reduce their background signal. Furthermore, in the presence of T-DNA, the probes hybridize with T-DNA for double-stranded structures and their overhanging GGG repeats assembles into a G-quadruplex structure. The complex moves away from the GO surface and combines with quinaldine red to release a strong fluorescence signal. Importantly, the probes are label-free and the whole experimental process is fast and simple. Moreover, the background of probes is significantly reduced. We hope this work may be combined with the PCR technique and serve as a foundation of further development of G-quadruplex/GO sensors for the authentication of Traditional Chinese Medicines or other areas.
Acknowledgments
We gratefully acknowledge the National Natural Science Foundation of China (No. 81303176), the Twelve Five “National Science and Technology Support Program” (2011BAI01B06). Independent Research Project of the Fujian Academy of Traditional Chinese Medicine (2012fjzyyk-2, 2013fjzyyk-2), Youth Foundation of Fujian Health Department (2013-2-71), Project of Fujian Education Department (type B, No. JB13092).
Author Contributions
Zhenzhu Zheng searched out and analyzed the bulk of the experimental data, and then wrote the introductory and most of the concluding sections. Juan Hu provided the idea of this article, generally supervised the whole research process and did the revision. And Zhaodong He did some research work for this article.
Conflicts of Interest
The authors declare no conflict of interest.
References
- Xu, J.C.; Liu, M.; Xia, Z.J. Will the Europe Union's Traditional Herbal Medicinal Products Directive (Directive 2004/24/EC) be against traditional Chinese medicine in EU market? Evid. Based Med. 2013, 6, 104–108. [Google Scholar]
- Zheng, Z.Z.; Han, J.; Pang, W.S.; Hu, J. G-quadruplex DNAzyme molecular beacon for amplified colorimetric biosensing of Pseudostellaria heterophylla. Sensors 2013, 13, 1064–1075. [Google Scholar]
- Zhao, Z.L.; Leng, C.H.; Wang, Z.T. Identification of Dryopteris crassirhizoma and the adulterant species based on cpDNA rbcL and translated amino acid sequences. Planta Med. 2007, 73, 1230–1233. [Google Scholar]
- Hu, J.; Pang, W.S.; Chen, J.L.; Bai, S.W.; Zheng, Z.Z.; Wu, X.H. Hypoglycemic effect of polysaccharides with different molecular weight of Pseudostellaria heterophylla. BMC Complement. Altern. Med. 2013, 13. [Google Scholar] [CrossRef]
- Pang, W.S.; Lin, S.D.; Dai, Q.W.; Zhang, H.C.; Hu, J. Antitussive activity of Pseudostellaria heterophylla (Miq.) Pax extracts and improvement in lung function via adjustment of multi-cytokine levels. Molecules 2011, 16, 3360–3370. [Google Scholar]
- Lin, H.; Zhao, J.W.; Chen, Q.S.; Zhou, F.; Sun, L. Discrimination of Radix Pseudostellariae according to geographical origins using NIR spectroscopy and support vector data description. Spectrochim. Acta A 2011, 79, 1381–1385. [Google Scholar]
- Zhu, Y.; Qin, M.J.; Hang, Y.Y.; Wang, L.Q. Authentication of Pseudostellaria heterophylla and its counterfeit species by analysis of rDNA ITS sequences. Chin. J. Nat. Med. 2007, 5, 211–215. [Google Scholar]
- Fan, L.L.; Yi, T.; Xu, F.; Zhang, Y.Z.; Zhang, J.Y.; Li, D.P.; Xie, Y.J.; Qin, S.D.; Chen, H.B. Characterization of flavonoids in the ethomedicine Fordiae Cauliflorae Radix and its adulterant Millettiae Pulchrae Radix by HPLC-DAD-ESI-IT-TOF-MSn. Molecules 2013, 18, 15134–15152. [Google Scholar]
- Li, Y.; Xue, F.; Wang, Y.; Xue, Y.; Sun, C.J. Simultaneous determination of seven adulterants in slimming functional foods by high performance capillary electrophoresis. Chin. J. Anal. Chem. 2011, 39, 1716–1720. [Google Scholar]
- Wang, M.; Avula, B.; Wang, Y.H.; Zhao, J.P.; Avonto, C.; Parcher, J.F.; Raman, V.; Zweigenbaum, J.A.; Wylie, P.L.; Khan, I.A. An integrated approach utilising chemometrics and GC/MS for classification of chamomile flowers, essential oils and commercial products. Food Chem. 2014, 152, 391–398. [Google Scholar]
- Wojciechowski, M.F.; Sanderson, M.J.; Baldwin, B.G.; Donoghue, M.J. Monophyly of aneuploid Astragalus (Fabaceae): Evidence from nuclear ribosomal DNA internal transcribed spacer sequences. Am. J. Bot. 1993, 80, 711–722. [Google Scholar]
- Feng, T.; Liu, S.; He, X.J. Molecular authentication of the traditional Chinese medicinal plant Angelica sinensis based on internal transcribed spacer of nrDNA. Electron. J. Biotechnol. 2010, 13, 9–10. [Google Scholar]
- Salim, K.; Jabeen, M.K.; Zainul, A.M. Development of RAPD markers for authentication of medicinal plant Cuscuta reflexa. EurAsian J. Biosci. 2010, 4, 1–7. [Google Scholar]
- Peng, X.; Li, W.; Wang, W.; Bai, G. Identification of Lonicera japonica by PCR-RFLP and allele-specific diagnostic PCR based on sequences of internal transcribed spacer regions. Planta Med. 2010, 76, 497–499. [Google Scholar]
- Coghlan, M.L.; Haile, J.; Houston, J.; Murray, D.C.; White, N.E.; Moolhuijzen, P.; Bellgard, M.I.; Bunce, M. Deep sequencing of plant and animal DNA contained within traditional Chinese medicines reveals legality issues and health safety concerns. PLoS Genet. 2012, 8. [Google Scholar] [CrossRef]
- Henderson, A.; Wu, Y.; Huang, Y.C.; Chavez1, E.A.; Platt, J.; Johnson, F.B.; Brosh, R.M., Jr.; Sen, D.; Lansdorp, P.M. Detection of G-quadruplex DNA in mammalian cells. Nucleic Acids Res. 2014, 42, 860–869. [Google Scholar]
- Murat, P.; Singh, Y.; Defrancq, E. Methods for investigating G-quadruplex DNA/ligand interactions. Chem. Soc. Rev. 2011, 40, 5293–5307. [Google Scholar]
- Wei, X.F.; Lin, W.L.; Ma, N.; Luo, F.; Lin, Z.Y.; Guo, L.H.; Qiu, B.; Chen, G.N. Sensitive fluorescence biosensor for folate receptor based on terminal protection of small-molecule-linked DNA. Chem. Commun. 2012, 48, 6184–6186. [Google Scholar]
- Cai, Q.H.; Wang, C.M.; Zhou, J.; Luo, F.; Lin, Z.Y.; Guo, L.H.; Qiu, B.; Chen, G.N. Terminal protection G-quadruplex-based turn-on fluorescence biosensor for H5N1 antibody. Anal. Methods 2012, 4, 3425–3428. [Google Scholar]
- Deng, M.G.; Zhang, D.; Zhou, Y.Y.; Zhou, X. Highly effective colorimetric and visual detection of nucleic acids using an asymmetrically split peroxidase DNAzyme. J. Am. Chem. Soc. 2008, 130, 13095–13102. [Google Scholar]
- Park, S.J.; Lee, K.S.; Bozoklu, G.; Cai, W.W.; Nguyen, S.T.; Ruoff, R.S. Graphene oxide papers modified by divalent ions-enhancing mechanical properties via chemical cross-linking. Nano 2008, 2, 572–578. [Google Scholar]
- Zhang, C.L.; Yuan, Y.X.; Zhang, S.M.; Wang, Y.H.; Liu, Z.H. Biosensing platform based on fluorescence resonance energy transfer from upconverting nanocrystals to graphene oxide. Angew. Chem. Int. Edit. 2011, 50, 6851–6854. [Google Scholar]
- Li, X.; Wang, G.K.; Ding, X.L.; Chen, Y.H.; Gou, Y.P.; Lu, Y. A “turn-on” fluorescent sensor for detection of Pb2+ based on graphene oxide and G-quadruplex DNA. Phys. Chem. Chem. Phys. 2013, 15, 12800–12804. [Google Scholar]
- Jang, H.J.; Kim, Y.K.; Kwon, H.M.; Yeo, W.S.; Kim, D.E.; Min, D.H. A graphene-based platform for the assay of duplex-DNA unwinding by helicase. Angew. Chem. 2010, 122, 5839–5843. [Google Scholar]
- Shi, Y.; Huang, W.T.; Luo, H.Q.; Li, N.B. A label-free DNA reduced graphene oxide-based fluorescent sensor for highly sensitive and selective detection of hemin. Chem. Commun. 2011, 47, 4676–4678. [Google Scholar]
- Sheng, L.; Ren, J.; Miao, Y.; Wang, J.; Wang, E. PVP-coated graphene oxide for selective determination of ochratoxin A via quenching fluorescence of free aptamer. Biosens. Bioelectron. 2011, 26, 3494–3499. [Google Scholar]
- Li, W.; Wu, P.; Ohmichi, T.; Sugimoto, N. Characterization and thermodynamic properties of quadruplex/duplex competition. FEBS Lett. 2002, 526, 77–81. [Google Scholar]
- Rajendran, A.; Nair, B.U. Unprecedented dual binding behaviour of acridine group of dye: A combined experimental and theoretical investigation for the development of anticancer chemotherapeutic agents. Biochim. Biophys. Acta 2006, 1760, 1794–1801. [Google Scholar]


| Oligomer | Sequence (from 5′ to 3′) | |
|---|---|---|
| 1 | GC | (GC)6 |
| 2 | LD | GCGCA2T2GCGC |
| 3 | LQ1 | TG4T |
| 4 | Hum12 | (T2AG3)2 |
| 5 | Apt | G2T2G2TGTG2T2G2 |
| 6 | PS2.M | GTG3TAG3CG3TTG2 |
| Oligomer | Sequence (from 5′ to 3′) | |
|---|---|---|
| T-DNA | PH | CGAAACCTGCCCAGC----AGAACGACCAGCGAACAT |
| C-DNA | LG | CGTGACCCTT--AAC----AAAACAGACCGCGCACG |
| LP | CAACACGTGTGCAGTTTAGAGCATACTCA ATA AACA | |
| OJ | CAATACGTGTG-AGTTTA-AGCATACTCA ATA AACA | |
| SS | CAATACATGTGCAGTTTA-AGCATACTCAGTGAACA | |
| SJ | CAGTACATGTGCAGTTTAGAGCATA-TCA ATA AACA | |
| probe | probe-1 | G3TTG3CG3ATG3TAAAACATGTTCGCTGGTCGTTCTGCTGGGCAGGTTTCG |
| probe 2-a | G3TTG3CCGTTCTGCTGGGCAGGTTTCG | |
| probe 2-b | AGTGTAAAACATGTTCGCTGTG3TAG3 | |
© 2014 by the authors; licensee MDPI, Basel, Switzerland. This article is an open access article distributed under the terms and conditions of the Creative Commons Attribution license ( http://creativecommons.org/licenses/by/4.0/).
Share and Cite
Zheng, Z.; Hu, J.; He, Z. A Split G-Quadruplex and Graphene Oxide-Based Low-Background Platform for Fluorescence Authentication of Pseudostellaria heterophylla. Sensors 2014, 14, 22971-22981. https://doi.org/10.3390/s141222971
Zheng Z, Hu J, He Z. A Split G-Quadruplex and Graphene Oxide-Based Low-Background Platform for Fluorescence Authentication of Pseudostellaria heterophylla. Sensors. 2014; 14(12):22971-22981. https://doi.org/10.3390/s141222971
Chicago/Turabian StyleZheng, Zhenzhu, Juan Hu, and Zhaodong He. 2014. "A Split G-Quadruplex and Graphene Oxide-Based Low-Background Platform for Fluorescence Authentication of Pseudostellaria heterophylla" Sensors 14, no. 12: 22971-22981. https://doi.org/10.3390/s141222971
APA StyleZheng, Z., Hu, J., & He, Z. (2014). A Split G-Quadruplex and Graphene Oxide-Based Low-Background Platform for Fluorescence Authentication of Pseudostellaria heterophylla. Sensors, 14(12), 22971-22981. https://doi.org/10.3390/s141222971