Measurement of Blood Pressure Using an Arterial Pulsimeter Equipped with a Hall Device

Abstract
: To measure precise blood pressure (BP) and pulse rate without using a cuff, we have developed an arterial pulsimeter consisting of a small, portable apparatus incorporating a Hall device. Regression analysis of the pulse wave measured during testing of the arterial pulsimeter was conducted using two equations of the BP algorithm. The estimated values of BP obtained by the cuffless arterial pulsimeter over 5 s were compared with values obtained using electronic or liquid mercury BP meters. The standard deviation between the estimated values and the measured values for systolic and diastolic BP were 8.3 and 4.9, respectively, which are close to the range of values of the BP International Standard. Detailed analysis of the pulse wave measured by the cuffless radial artery pulsimeter by detecting changes in the magnetic field can be used to develop a new diagnostic algorithm for BP, which can be applied to new medical apparatus such as the radial artery pulsimeter.1. Introduction
Sensing-technology for measuring blood pressure (BP) and pulse can be used to provide a remote programmable service (monitoring exercise, diet, and medication) through an online network. Such a system provides services for management of disease or promoting health. Moreover, it is an important means of maintaining training momentum and managing the health of athletes. However, the currently available sensors are inconvenient to use because of restrictions on the position of the sensors and the time over which they can obtain readings [1,2]. In particular, it is impossible to measure BP and pulse without an unpleasant oppressive feeling due to the use of pressurization, and accuracy is remarkably low. If the accuracy of vital information is ambiguous, it cannot be used as baseline data to understand medical activity, so accurate measurements are a required precondition for the U-health industry [3,4].
Traditional technology used to measure pressure and pulse led to the concept of a measuring instrument incorporated into a portable device such as a watch or ring [1]. However, it is difficult to accurately measure the pulse using a traditional method when the subject is moving, because it is difficult to hold the sensor precisely in place and movement causes static even though the traditional pulse-taking method can measure BP and pulse if the pulse wave sensor is positioned over the aorta radialis. There are optical, electrocardiogram and pressure sensors in use as traditional pulse wave measuring sensors but the difficulty of obtaining measurements causes problems in manufacture and results in the problem of an oversized device. To solve these problems, it is necessary to develop a wrist-mounted measuring instrument for checking BP and pulse that has its sensor positioned on the perimeter of the radius at the wrist and can thus analyze BP or pulse at the aorta radialis using a Hall element.
The resulting data can be used as a basis for remote-controlled treatment and health care monitoring by sending the data through a wireless network based on the future U-health care network. The principal elements of pulse measurements by a human using the traditional pulse method are force and period of pulsatory motion, expansion of pulse, speed of contraction, palpation depth, width, and length of pulse [5,6]. The arterial pulsimeter developed by our group has the important technological ability to analyze and monitor BP and pulse by holding the sensor on the perimeter of the radius and the ulna at the wrist, and can thus effectively measure the pulse wave of the aorta radialis [7,8].
Under the traditional stable state, portable instruments developed to monitor BP and pulse rate are uncomfortable to use, and impractical for everyday life due to the pain caused by pressure on the skin. Recently, an arterial pulsimeter was developed and was on the market in Japan, but this still had some problems such as intermittent measurement of vital signals, pain when wearing it and its large size. Therefore, it was difficult for patients to wear this instrument continuously. Our model is portable in real life situations and is able to measure blood pressure and pulse at the same time without pain, using a non-pressurization method based on next-generation technology of the U-health industry. It is also possible to adjust the length of the strap and the pressure of the sensor so that the part in contact with the skin will press the radial artery lightly to classify to floating and sunken pulse. Therefore, the purpose of our research was to develop a method of reproducibly measuring BP and pulse rate better than a traditional method and thus to fill the dominant market position in this field [9,10].
To obtain accurate BP and pulse data, we have developed a pulsimeter that is a portable, simple, and miniaturized medical instrument based on a stable product. In addition, its circuit composition is designed to minimize power consumption and it can be worn on the wrist to obtain BP and pulse data continuously. The miniaturized pulsimeter is accompanied by software able to analyze multiple vital signs so as to enhance the commercial appeal of the pulsimeter. Using this software, medical treatment and prescriptions can be given over the network, and the software, which monitors regular exercise and diet, will send basic physical information concerning the individual’s health condition in real time. Therefore, our research led us to develop the first product with a magnetic Hall device sensor; this product can measure minute changes in the magnetic field using pulsatory motion and a permanent magnet. We also developed an algorithm to estimate BP by analyzing the pulse wave generated from data derived from patient tests.
2. Methods
2.1. Structure of a Radial Artery Pulsimeter with Hall Device
To develop a radial arterial pulsimeter, we analyzed what experimental data was required to determine the shape of the spatial pulse from a reading of the type of wave generated by a ranged Hall device with a constant arrangement.
The main material of the Hall device is a magnetic converted element composed of indium antimonide (InSb), indium arsenide (InAs), germanium (Ge), and silicon (Si) [11]. Because the size of the Hall electromotive force induced by a magnetic field can be used to determine magnetic force, the advantage is that the magnetic field of a micro portion of a magnetic field can be measured. In addition, when the alteration of the magnetic field results from changes in position, measuring their position is possible.
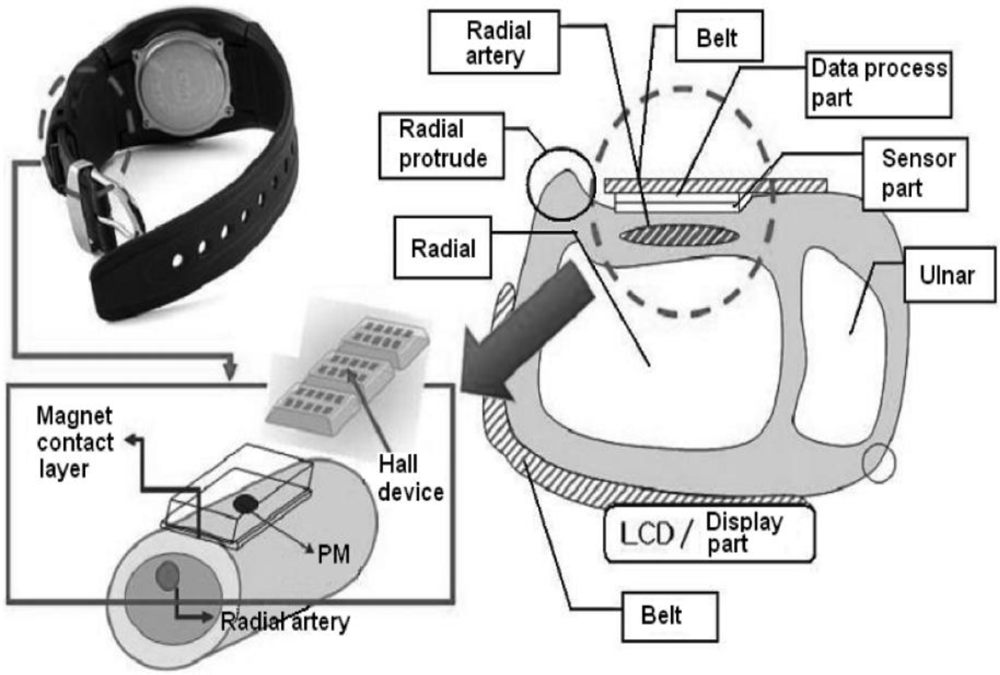
A schematic diagram showing the basic structure of the arterial pulsimeter is shown in Figure 1. The pulsimeter operates as follows: alteration of the voltage, caused by the Hall device, is interpreted as an electrical signal caused by a positional change of a permanent magnet situated on the radial artery. The electrical signal indicates the waveform of the pulse. Through the hardware of the circuit, the output signal is only the differentiated part of the signal resulting from the magnetic change. The signal process module shows the shape that represents a picture of the pulse according to the change of position of the magnetic field analyzed by the software.
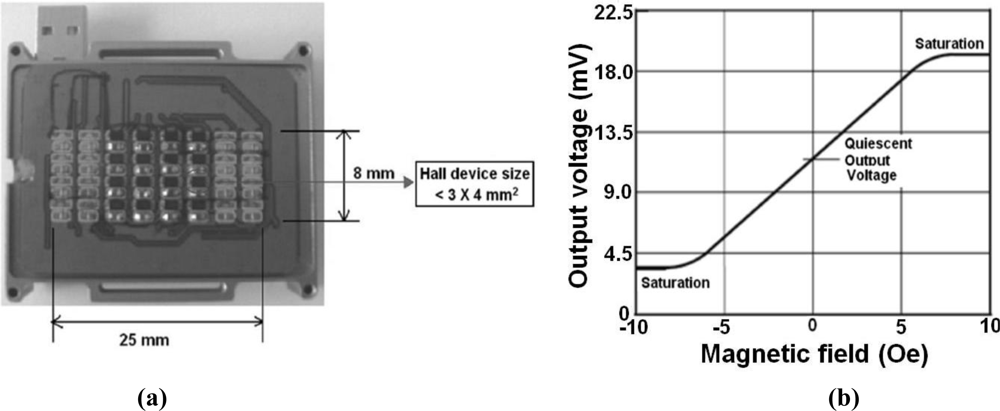
The size of the multiplex Hall device and its sensitivity to a magnetic field enables the pulsimeter to measure a pulse wave at a radial artery position based on its semiconductor, which is the real shape of a printed circuit board (PCB) with semiconductor multiplex Hall device and the property of a curve, which is 3 × 4 mm2 and 1.2 mV/Oe, as shown in Figure 2.
2.2. Experimental Procedure and Data Acquisition
The imaging circuit diagram of system by computer, read 36 Hall devices of three sets according to the fact that magnetic Hall device is a set. Generally, through hardware, the signal from the Hall device is delivered to the software by converting it into a waveform and then combining all the waveforms of peak value and converting them into a video signal that constitutes the monitoring structure. Each component of the hardware functions as follows. The electrical signal entering through three multiplexes in the Hall device array creates a minute parallel condition through the Wheatstone bridge circuit. This data is also saved to a memory device through an amplifier circuit and a bandwidth filter circuit. The data of 30 frames per second (FPS) is rapidly processed. Output signals of the processing hardware are delivered to the circuit part of the software, which is connected to RS232C, and the signal is converted to the MatLab program through the matrix so that an image is displayed on the monitor.
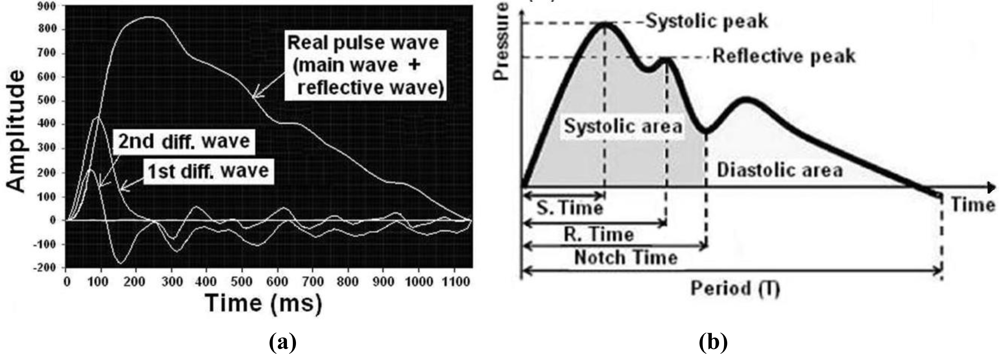
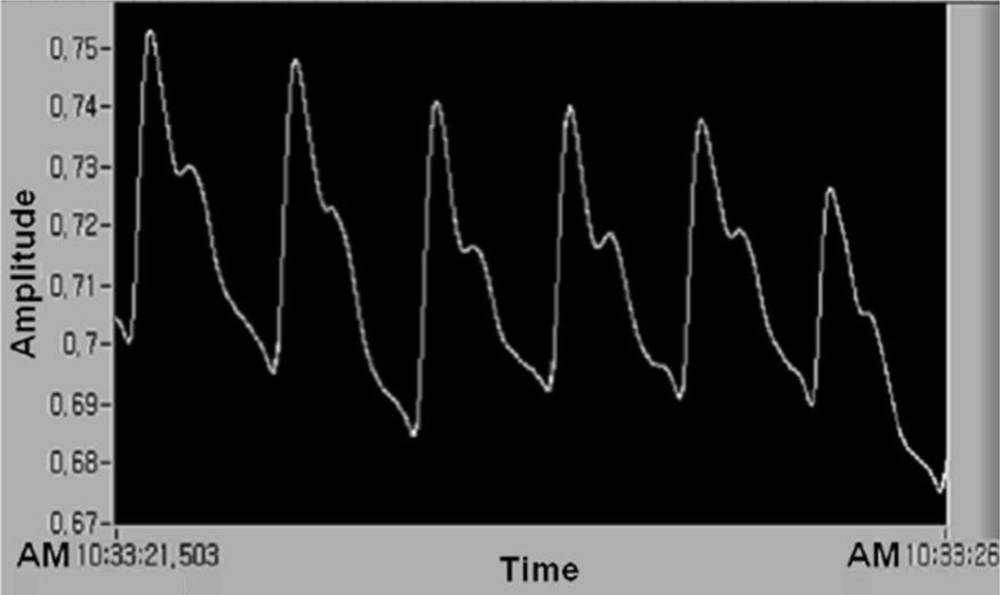
The pulse wave is amplified through measurement of the number of amplifications, and the pulse wave signal is received through automatic zero point setting, large output, noise filter, and attenuation. The waveform is received again with a lower power of computer simulation through the output of RS232C and 30 FPS by 12-bit resolution. To analyze the waveform of the pulsimeter used in the multiplex Hall device, we analyzed the saved data of waveform analysis at the number 32 channel, which is used in LabVIEW, linked real-time image, two dimensions of multiplex Hall device, sequential unlimited storage data, and Matlab. Figure 3 shows that typical pulse wave (number of pulses per minute = approximately 64) obtained by five dots moving through an average filter. The waveform shown in Figure 3 was obtained using a Hall device of sensing a minute magnetic field change by a permanent magnet. Thus, we measured the pulse wave in non-pressurization method and found diagnostic algorism of estimated BP based on the analyzed data.
3. Results
3.1. Testing of the Radial Artery Pulsimeter
The autonomic nervous system adjusts the BP in response to signals from the baroreceptors in the walls of the large systemic arteries and the chemoreceptors in the carotid and aortic body. The chemoreceptors respond smoothly and weakly to oxygen lack, carbon dioxide excess or hydrogen ion excess while the baroreceptors respond rapidly and strongly to direct BP changes which induced mainly by the postural change. The heart rate also increases to increase the supply of blood. Thus, pulse frequency also increases so it further increases the BP (the case that restrictive use of patient with arrhythmia and angina). Division of the pulse waveform brings the time difference of the reflected wave, which reflects to the lower body from the main pulse wave of the moving radial artery from the heart. Thus, the individual features of blood vessels and blood pressure can be evaluated.
Figure 4 is an example of application of the algorithm to estimate blood pressure and it shows the relationship of the main correlation factor about the regression analysis equation for the estimated algorithm of BP. We show that the necessary main correlation factors for deducing the regression analysis equation for the estimated algorithm of blood pressure are the time of the systolic period, reflective time, notch time, acceleration of the pulse wave, ratio of area (systolic period area/diastolic period area), and increasing pressure index (reflective wave peak/systolic wave peak).
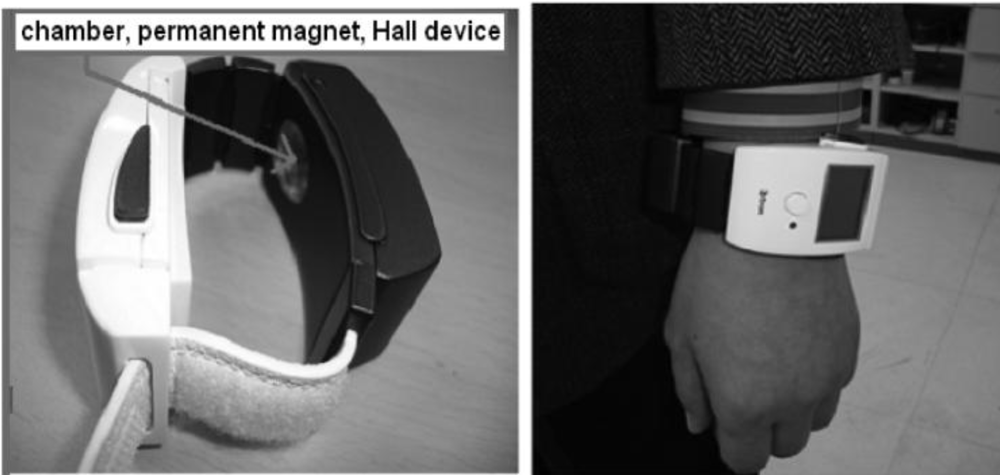
The first radial artery pulsimeter we have developed is shown in Figure 5 and uses a Hall device to obtain the data. A permanent magnet and a Hall device placed inside an air bladder are arranged to safely contact the biggest pulse spot on the radial artery. The pulsimeter weight has been reduced to about 80 g, including the battery. Our tests showed that the amount of electrical power provided by a lithium battery is less than 1.65 W (Output current 500 mA, 3.4 V) after wearing the pulsimeter.
This device is able to save the values of high/low BP measurements for 1 h, if the battery is 100% recharged. Increases in the heart rate calculated from the estimated BP algorithm are based on the fact that blood supply and pulse rate are causes of the increased heart rate. We were able to distinguish a normal, healthy person from a high BP patient with relation to the pulse waveform containing systolic and diastolic BP; this enabled us to distinguish the groups on the basis of the shape of the pulse wave.
4. Discussion
The main characteristic of the pulse wave used to calculate the estimated BP is extracted by applying the difference between the ratio of the arrival time of the progressive wave and that of the reflected wave and this must be performed each time, because the air inside the air bladder containing the permanent magnet can be changed by relative pressure. To obtain a more precise value of estimated BP, we divided data from the clinical trial into five modes separated by 10 units between 20 s and 60 s. Through analysis of these data, the regression of systolic and diastolic estimation of blood pressure, which considers correlation factors, is represented by Equations (1) and (2) below. Here, nine important parameters are defined as follows: (SBP), systolic blood pressure; (DBP), diastolic blood pressure; (ST), time of systole; (NT), time of notch point; (a), peak value of pulse wave acceleration; (b), minimum value of pulse wave acceleration; (RT), time of reflected wave; (PN), pulse rate; and (N1), index of Notch point. In these equations, the unit of blood pressure is mmHg:
We compared the measured value and the estimated value of blood pressure obtained from clinical trial data of 41 people. Table 1 shows the comparison between the measured value and the estimated value of BP from thirteen clinical patients. The standard deviation of the error in the estimated peak (systolic) BP and the minimum (diastolic) BP obtained from regressions (1) and (2) are calculated as 8.3 and 4.9. The error in peak blood pressure is a little higher than the International Standard margin of error for BP (±10), but the error in the minimum BP value is lower than the International Standard for BP [12]. If we are able to build up more data and thus develop an algorithm that is able to decrease the error of systolic BP readings, our pulsimeter will be suitable for commercial applications. Therefore, we could obtain valid values when we classified a pattern that applies the algorithm to earn accurate conclusion by age, and we are able to construct the regression by categorizing it from pulse waves with a similar pattern.
If patients always wear the wrist wearable pulsimeter, the frequency of diagnosis will rapidly increase and the rate of early detection of diseases will be higher. Furthermore, patients may benefit from new information about caring for their health and health problems at home. In addition, we will be able to graft BT onto IT to develop a new U-healthcare system that can save continuous vital sign data and analyze that data remotely through a wireless network, helping athletes to keep in shape and providing an efficient medical service to the chronically ill.
According to the U-health industry, the new medical paradigm, such a medical service will provide diagnosis, monitoring, and advice, not only in hospitals, but also in everyday life. Domestic companies are urged to develop this technology, because foreign global companies such as Intel, IBM and others are already entering this field and expanding in this area. The U-health industry will be very important in reducing medical expenses in our society as a next generation growth industry, because this industry is important for an aging society such as ours, which has rapidly increasing medical expenses. As the market for the U-health industry is expected to grow continuously, the main technologies, and the accuracy and convenience of sensing the medical information necessary to care for an individual’s health, must be standardized for developing products. In the bigger picture of the U-health industry, developing a sensing technology that monitors an individual’s health and measures BP and pulse of a patient is necessary to enlarge the range of medical services. This makes it possible that the chronically ill, the old and the infirm can measure and monitor their BP or pulse repeatedly, enabling management of an optimized service that prevents disease.
4. Conclusions
We have invented a miniaturized portable pulsimeter that can be used to obtain accurate BP and pulse measurements. In addition, the circuit composition was designed to minimize electricity consumption and was able to obtain continuous measurements of BP and pulsation data using a convenient wrist wearable non-pressurization method incorporating a pulse wave analysis algorithm. The pulse wave data obtained from a clinical test of thirteen subjects resulted in the regression analysis equation of the estimated algorithm with the pulse wave being the determinant of the correlation factor. We compared the values of estimated blood pressure from pulse wave data collected by the non-pressurization pulsimeter at the left wrist for 5 s with the measured values of BP obtained by an electron sphygmomanometer at the right upper arm and a mercury sphygmomanometer at the left upper arm; we found that the standard deviation of the minimum and maximum BP obtained by the non-pressurization pulsimeter was 8.3 and 4.9, respectively. Since the value of the standard deviation was close to the limit on the International BP Standard, this device could be commercialized as a non-pressurization BP and arterial pulsimeter. Therefore, through the analysis of non-pressurization pulse wave using a magnetic Hall device that perceived a minute magnetic field change of permanent magnet, we proposed the new estimated BP diagnostic algorism of Traditional Chinese Medicine.
Acknowledgments
This study was supported by a grant of the Oriental Medicine Advanced Technology R & D Project, Ministry for Health, Welfare & Family Affairs, Republic of Korea. (B100030).
References
- Tu, Q.; Zhou, J.; Fung, Y.C. Neutral Axis Location in Bending and Young’s Modulus of Different Layers of Arterial Wall. Am. J. Physiol. Heart Circ. Physiol 1993, 265, 52–60. [Google Scholar]
- Shaltis, P.A.; Reisner, A.T; Asada, H.H. Cuffless Blood Pressure Monitoring Using Hydrostatic Pressure Changes. IEEE Trans. Biomed. Eng 2008, 55, 1775–1777. [Google Scholar]
- McGrath, B.P. Ambulatory Blood Pressure Monitoring. Med. J. Aust 2002, 176, 588–592. [Google Scholar]
- Ka, E.; Ka, M.; Son, D.-R. Development of Micro-Size Search Coil Magnetometer for Magnetic Field Distribution Measurement. J. Magnet 2008, 13, 34–36. [Google Scholar]
- Choi, S.D.; Kim, M.S.; Ahn, M.C.; Choi, Y.G.; Kim, G.W.; Park, D.H.; Hwang, D.G.; Lee, S.S. Achievement of 3-D Pulse Waves of Pulse Diagnostic Apparatus by Using Multi-Hall Devices. J. Kor. Mag. Soc 2006, 16, 216–220. [Google Scholar]
- O’Rourke, M.F.P.; Kelly, R.P.; Avolio, A.P. The Arterial Pulse, 1st ed; Lea & Febiger: Philadelphia, PA, USA, 1992. [Google Scholar]
- Kim, S.W.; Choi, Y.G.; Lee, H.S.; Park, D.H.; Hwang, D.G.; Lee, S.S.; Kim, G.W.; Lee, S.G.; Lee, S.J. Improvement of Pulse Diagnostic Apparatus with Array Sensor of Magnetic Tunneling Junctions. J. Appl. Phys 2006, 99, R908–R910. [Google Scholar]
- Choi, S.D.; Kim, S.W.; Kim, G.W.; Ahn, M.C.; Kim, M.S.; Hwang, D.G.; Lee, S.S. Development of Spatial Pulse Diagnostic Apparatus with Magnetic Sensor Array. J. Magn. Magn. Maters 2007, 310, e983–e985. [Google Scholar]
- Lee, S.S.; Kim, G.W.; Ahn, M.C.; Park, Y.S.; Choi, J.G.; Choi, S.D.; Park, D.H.; Hwang, D.G.; Yoon, H.R. Embodiment of Spatially Arterial Pulse Diagnostic Apparatus using Array Multiple Hall Devices. J. Biomed. Eng. Res 2007, 28, 721–726. [Google Scholar]
- Lee, S.S.; Ahn, M.C.; Ahn, S.H. A New Measurement Method of a Radial Pulse Wave Using Multiple Hall Array Devices. J. Magnet 2009, 14, 132–136. [Google Scholar]
- Sze, S.M. Physics of Semiconductor Devices, 2nd ed; John Wiley & Sons: New York, NY, USA, 1981. [Google Scholar]
- Haider, A.W.; Larson, M.G.; Franklin, S.S.; Levy, D. Systolic Pressure, Diastolic Blood Pressure, and Pulse Pressure as Predictors of Risk for Congestive Heart Failure in the Framingham Heart Study. Ann. Inter. Medi 2006, 138, 10–17. [Google Scholar]


| BP Classification | Systolic Blood Pressure (SBP) | Diastolic Blood Pressure (DBP) | ||||
|---|---|---|---|---|---|---|
| Clinical Number | Estimated Value | Measured Value | Error | Estimated Value | Measured Value | Error |
| 1 | 133.0 | 145.0 | 12.0 | 64.0 | 63.0 | −1.0 |
| 2 | 131.6 | 140.0 | 8.4 | 65.0 | 63.0 | −2.0 |
| 3 | 135.1 | 142.0 | 6.9 | 64.3 | 71.0 | 6.7 |
| 4 | 135.4 | 140.0 | 4.6 | 63.8 | 67.0 | 3.2 |
| 5 | 132.9 | 142.0 | 9.1 | 63.6 | 68.0 | 4.4 |
| 6 | 132.8 | 135.0 | 2.2 | 63.5 | 71.0 | 7.5 |
| 7 | 135.0 | 137.0 | 2.0 | 62.6 | 63.0 | 0.4 |
| 8 | 133.6 | 135.0 | 1.4 | 65.1 | 67.0 | 1.9 |
| 9 | 133.3 | 136.0 | 2.7 | 62.1 | 64.0 | 1.9 |
| 10 | 132.9 | 133.0 | 0.1 | 60.5 | 58.0 | −2.5 |
| 11 | 128.3 | 130.0 | 1.7 | 63.0 | 61.0 | −2.0 |
| 12 | 133.1 | 135.0 | 1.9 | 62.3 | 54.0 | −8.3 |
| 13 | 129.6 | 105.0 | −24.6 | 59.7 | 50.0 | −9.7 |
| Standard Deviation | 8.3 | 4.9 | ||||
© 2011 by the authors; licensee MDPI, Basel, Switzerland. This article is an open access article distributed under the terms and conditions of the Creative Commons Attribution license (http://creativecommons.org/licenses/by/3.0/).
Share and Cite
Lee, S.-S.; Nam, D.-H.; Hong, Y.-S.; Lee, W.-B.; Son, I.-H.; Kim, K.-H.; Choi, J.-G. Measurement of Blood Pressure Using an Arterial Pulsimeter Equipped with a Hall Device. Sensors 2011, 11, 1784-1793. https://doi.org/10.3390/s110201784
Lee S-S, Nam D-H, Hong Y-S, Lee W-B, Son I-H, Kim K-H, Choi J-G. Measurement of Blood Pressure Using an Arterial Pulsimeter Equipped with a Hall Device. Sensors. 2011; 11(2):1784-1793. https://doi.org/10.3390/s110201784
Chicago/Turabian StyleLee, Sang-Suk, Dong-Hyun Nam, You-Sik Hong, Woo-Beom Lee, Il-Ho Son, Keun-Ho Kim, and Jong-Gu Choi. 2011. "Measurement of Blood Pressure Using an Arterial Pulsimeter Equipped with a Hall Device" Sensors 11, no. 2: 1784-1793. https://doi.org/10.3390/s110201784
APA StyleLee, S.-S., Nam, D.-H., Hong, Y.-S., Lee, W.-B., Son, I.-H., Kim, K.-H., & Choi, J.-G. (2011). Measurement of Blood Pressure Using an Arterial Pulsimeter Equipped with a Hall Device. Sensors, 11(2), 1784-1793. https://doi.org/10.3390/s110201784