
The Importance of Scaling for Detecting Community Patterns: Success and Failure in Assemblages of Introduced Species

Abstract
:1. Introduction
2. Experimental Section
Study Site and Analyses

| Species | Year of Introduction | Year of Extinction | NSPi | NSPe | |||
|---|---|---|---|---|---|---|---|
| Gallus gallus (3) | 1000 | 1935 | 0 | 31 | |||
| Columba livia (2) | 1850 | 1 | |||||
| Callipepla californica (3) | 1855 | 1941 | 2 | 28 | |||
| Alauda arvensis (2) | 1870 | 3 | |||||
| Numida meleagris (3) | 1874 | 1908 | 4 | 15 | |||
| Phasianus colchicus (3) | 1875 | 5 | |||||
| Passer domesticus (2) | 1879 | 8 | |||||
| Acridotheres tristis (3) | 1879 | 8 | |||||
| Streptopelia chinensis (3) | 1879 | 8 | |||||
| Lonchura punctulata (1) | 1883 | 10 | |||||
| Carpodacus mexicanus (2) | 1883 | 10 | |||||
| Pavo cristatus (3) | 1896 | 11 | |||||
| Amandava amandava (1) | 1900 | 13 | |||||
| Garrulax canorus (2) | 1900 | 13 | |||||
| Colinus virginianus (3) | 1906 | 1926 | 14 | 23 | |||
| Syrmaticus soemmerringii (3) | 1907 | 1920 | 15 | 14 | |||
| Coturnix chinensis (2) | 1921 | 1927 | 14 | 22 | |||
| Geopelia striata (2) | 1922 | 19 | |||||
| Grallina cyanoleuca (3) | 1922 | 1936 | 19 | 31 | |||
| Geopelia humeralis (3) | 1922 | 1938 | 19 | 27 | |||
| Geophaps lophotes (3) | 1922 | 1927 | 19 | 22 | |||
| Phaps chalcoptera (3) | 1922 | 1927 | 19 | 22 | |||
| Alectoris chukar (3) | 1923 | 1928 | 20 | 23 | |||
| Chalcophaps indica (3) | 1924 | 1928 | 22 | 23 | |||
| Rollulus rouloul (3) | 1924 | 1930 | 22 | 27 | |||
| Rhipidura leucophrys (2) | 1926 | 1937 | 23 | 29 | |||
| Parus varius (2) | 1928 | 1963 | 23 | 30 | |||
| Leiothrix lutea (2) | 1928 | 23 | |||||
| Geopelia cuneata (2) | 1928 | 1931 | 23 | 28 | |||
| Paroaria coronata (2) | 1928 | 23 | |||||
| Mimus polyglottos (2) | 1928 | 23 | |||||
| Streptopelia decaocto (3) | 1928 | 1944 | 23 | 24 | |||
| Zosterops japonica (1) | 1929 | 27 | |||||
| Cettia diphone (1) | 1929 | 27 | |||||
| Cyanoptila cyanomelana (2) | 1929 | 1958 | 27 | 24 | |||
| Cardinalis cardinalis (2) | 1929 | 27 | |||||
| Paroaria dominicana (2) | 1931 | 1932 | 29 | 31 | |||
| Sturnella neglecta (3) | 1931 | 1937 | 29 | 29 | |||
| Copsychus saularis (2) | 1932 | 1976 | 31 | 40 | |||
| Chrysolophus pictus (3) | 1932 | 1941 | 31 | 28 | |||
| Chrysolophus amherstiae (3) | 1932 | 1941 | 31 | 28 | |||
| Lophura nycthemera (3) | 1932 | 31 | 28 | ||||
| Passerina cyanea (1) | 1934 | 31 | 31 | ||||
| Lonchura malacca (1) | 1936 | 31 | |||||
| Copsychus malabaricus (2) | 1940 | 26 | |||||
| Passerina leclancherii (1) | 1941 | 28 | 24 | ||||
| Garrulax caerulatus (3) | 1947 | 24 | |||||
| Syrmaticus reevesii (3) | 1957 | 24 | 39 | ||||
| Francolinus pondicerianus (3) | 1959 | 25 | |||||
| Bubulcus ibis (3) | 1959 | 25 | |||||
| Gracula religiosa (3) | 1960 | 26 | |||||
| Tyto alba (3) | 1961 | 27 | |||||
| Vidua macroura (1) | 1962 | 30 | 38 | ||||
| Gallus sonneratii (3) | 1962 | 30 | 41 | ||||
| Meleagris gallopavo (3) | 1962 | 30 | 40 | ||||
| Serinus mozambicus (1) | 1964 | 31 | |||||
| Lonchura oryzivora (2) | 1964 | 31 | |||||
| Estrilda troglodytes (1) | 1965 | 39 | 38 | ||||
| Estrilda melpoda (1) | 1965 | 39 | |||||
| Lagonosticta senagala (1) | 1965 | 39 | 41 | ||||
| Estrilda caerulescens (1) | 1965 | 39 | |||||
| Uraeginthus angolensis (1) | 1965 | 39 | 42 | ||||
| Uraeginthus bengalus (1) | 1965 | 39 | 38 | ||||
| Sicalis flaveola (2) | 1965 | 39 | |||||
| Pycnonotus jocosus (2) | 1965 | 39 | |||||
| Pycnonotus cafer (2) | 1966 | 39 | |||||
| Francolinus erckelii (3) | 1967 | 40 | |||||
| Uraeginthus cycnocephala (1) | 1969 | 40 | 42 | ||||
| Myiopsitta monachus (3) | 1970 | 41 | 38 | ||||
| Nandayus nenday (3) | 1971 | 41 | 40 | ||||
| Tiaris olivacea (1) | 1974 | 41 | |||||
| Amazona viridigenalis (3) | 1975 | 42 | |||||
| Estrilda astrild (1) | 1981 | 38 | |||||
| Psittacula krameri (3) | 1982 | 36 | |||||
| Lonchura malabarica (1) | 1984 | 37 | |||||
3. Results and Discussion
| Number of Species Present (NSP) | |||
|---|---|---|---|
| Successful | Failed | p-value | |
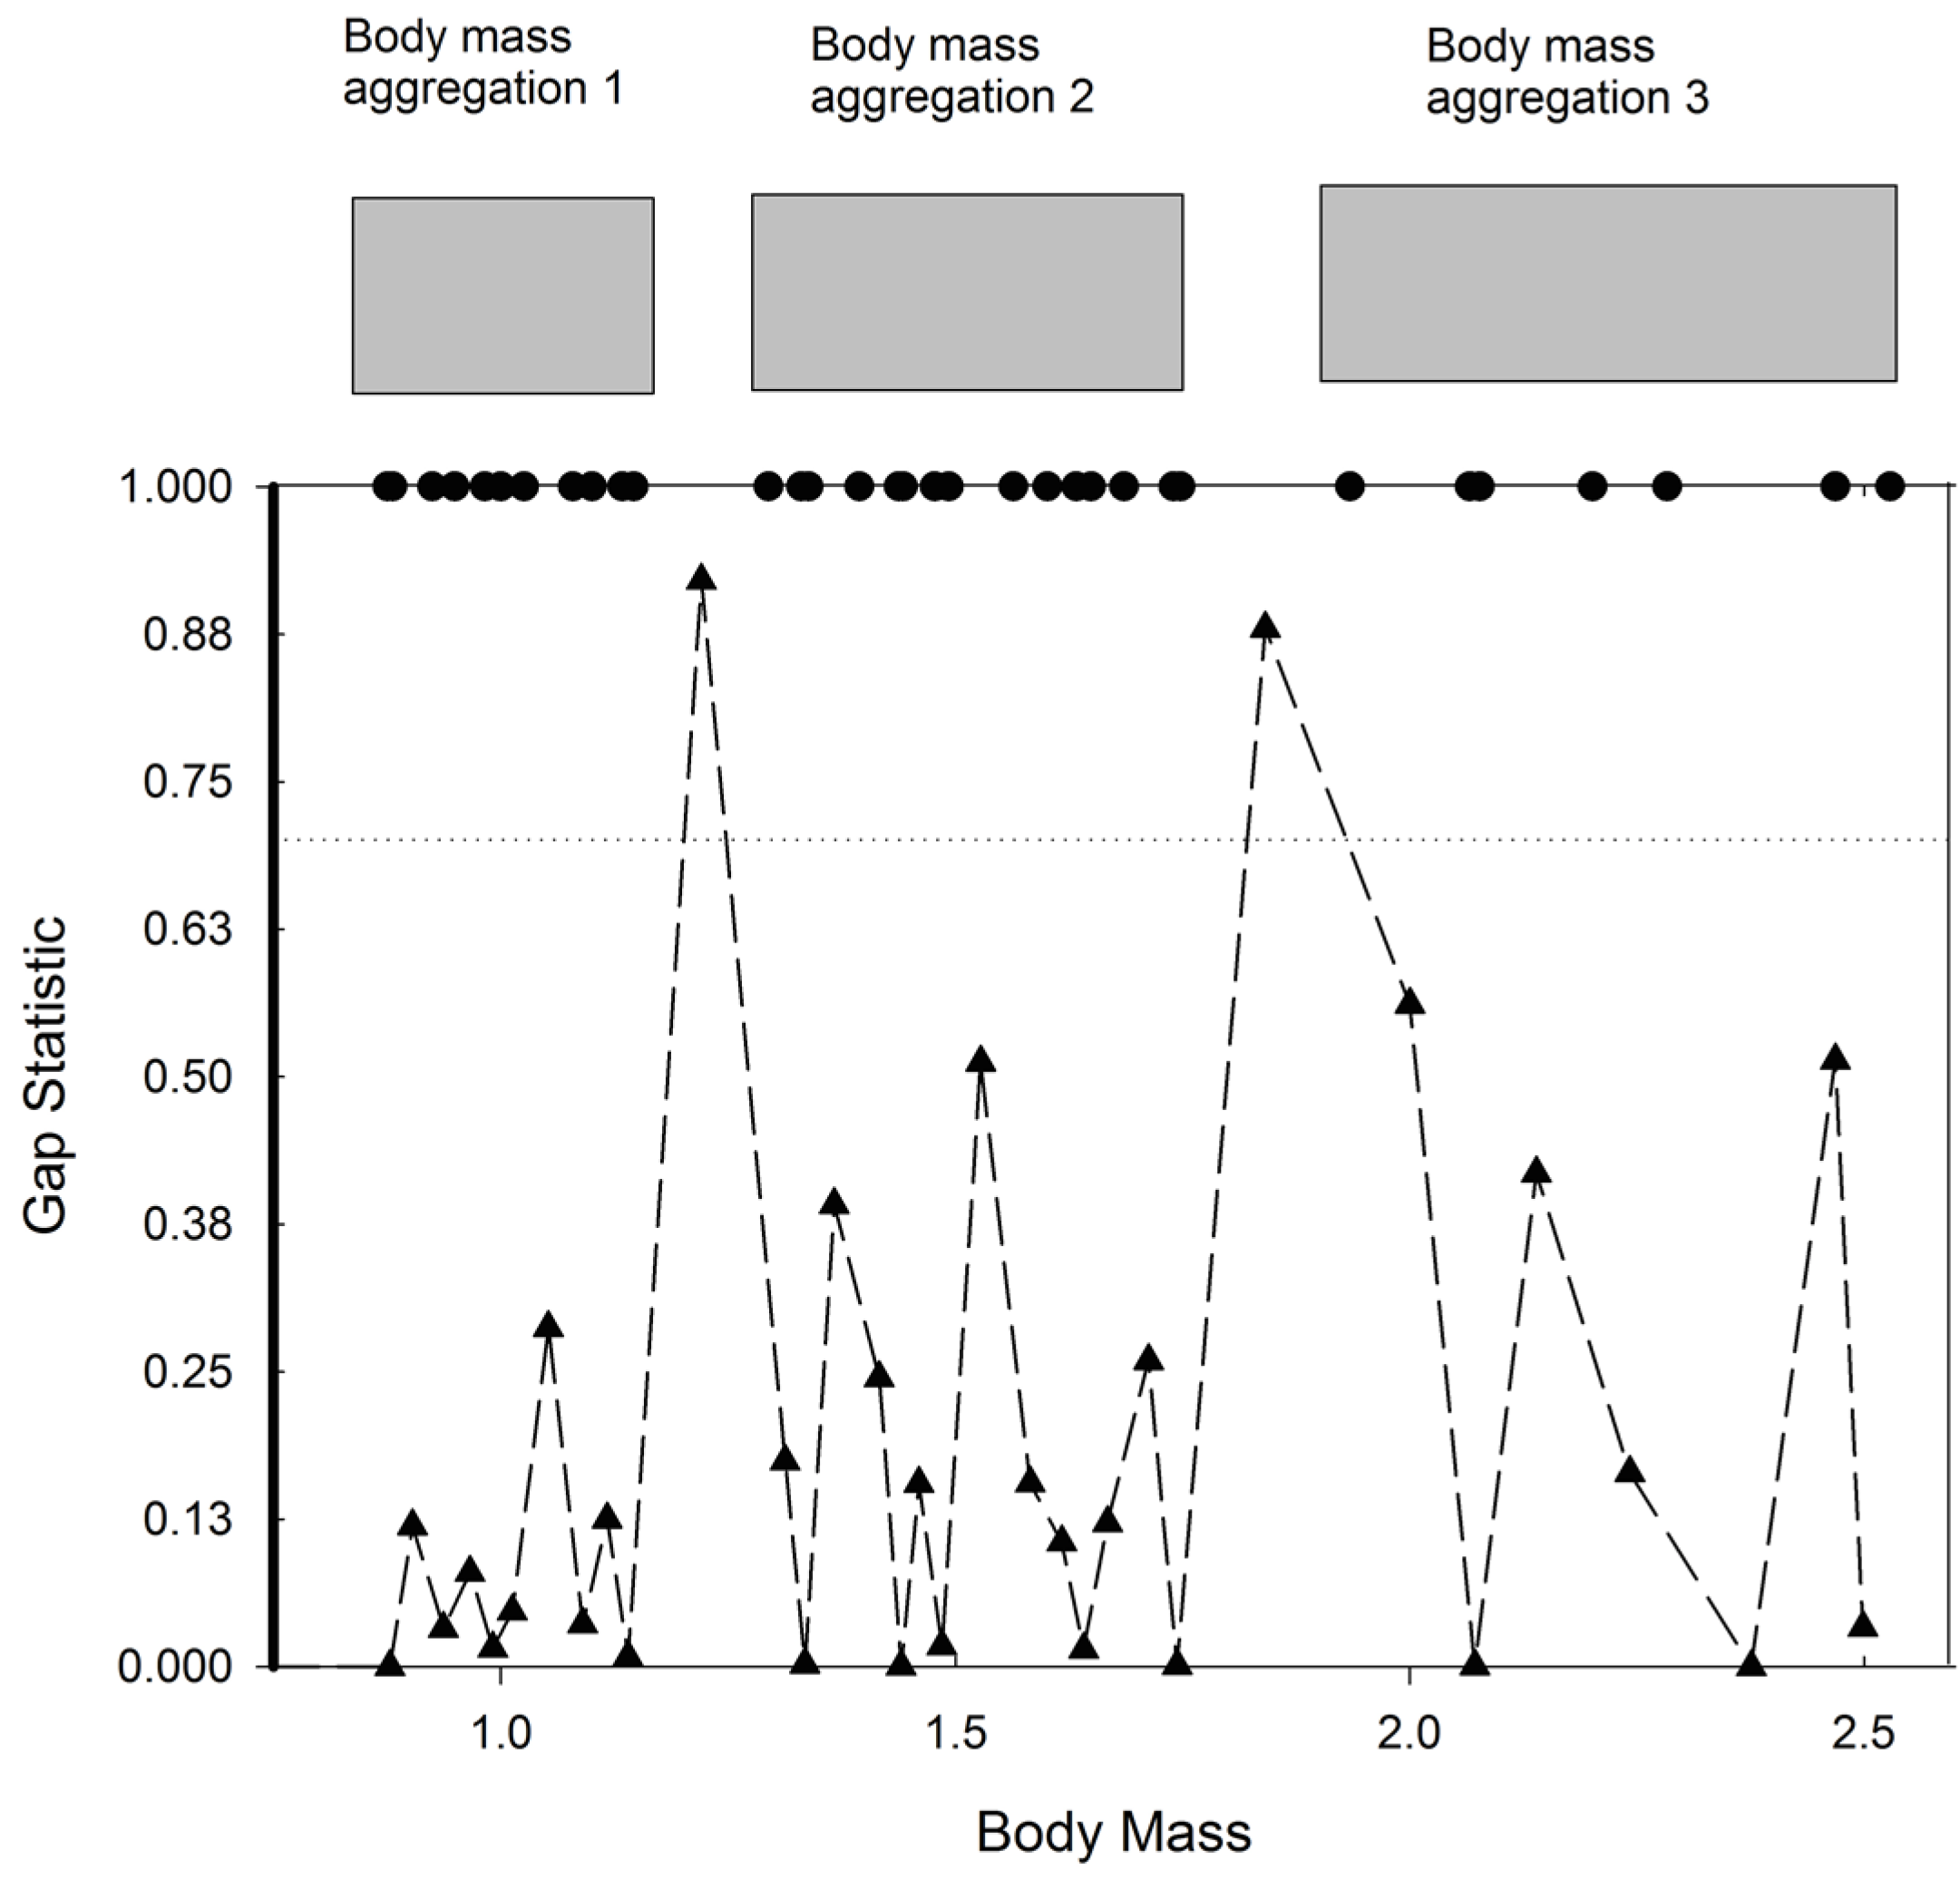
| Body mass aggregation 1 NSPi | 6.27(11) | 8.88(8)** | 0.090 |
| Body mass aggregation 1 NSPe | 6.27(11) | 10.5(8)** | 0.020 |
| Body mass aggregation 2 NSPi* | 11(15) | 11(7)** | 0.137 |
| Body mass aggregation 2 NSPe | 8.33(15) | 12.57(7)** | 0.026 |
| Body mass aggregation 3 NSPi* | 8(12) | 9.5(22)** | 0.144 |
| Body mass aggregation 3 NSPe | 8(12) | 9.77(22)** | 0.047 |
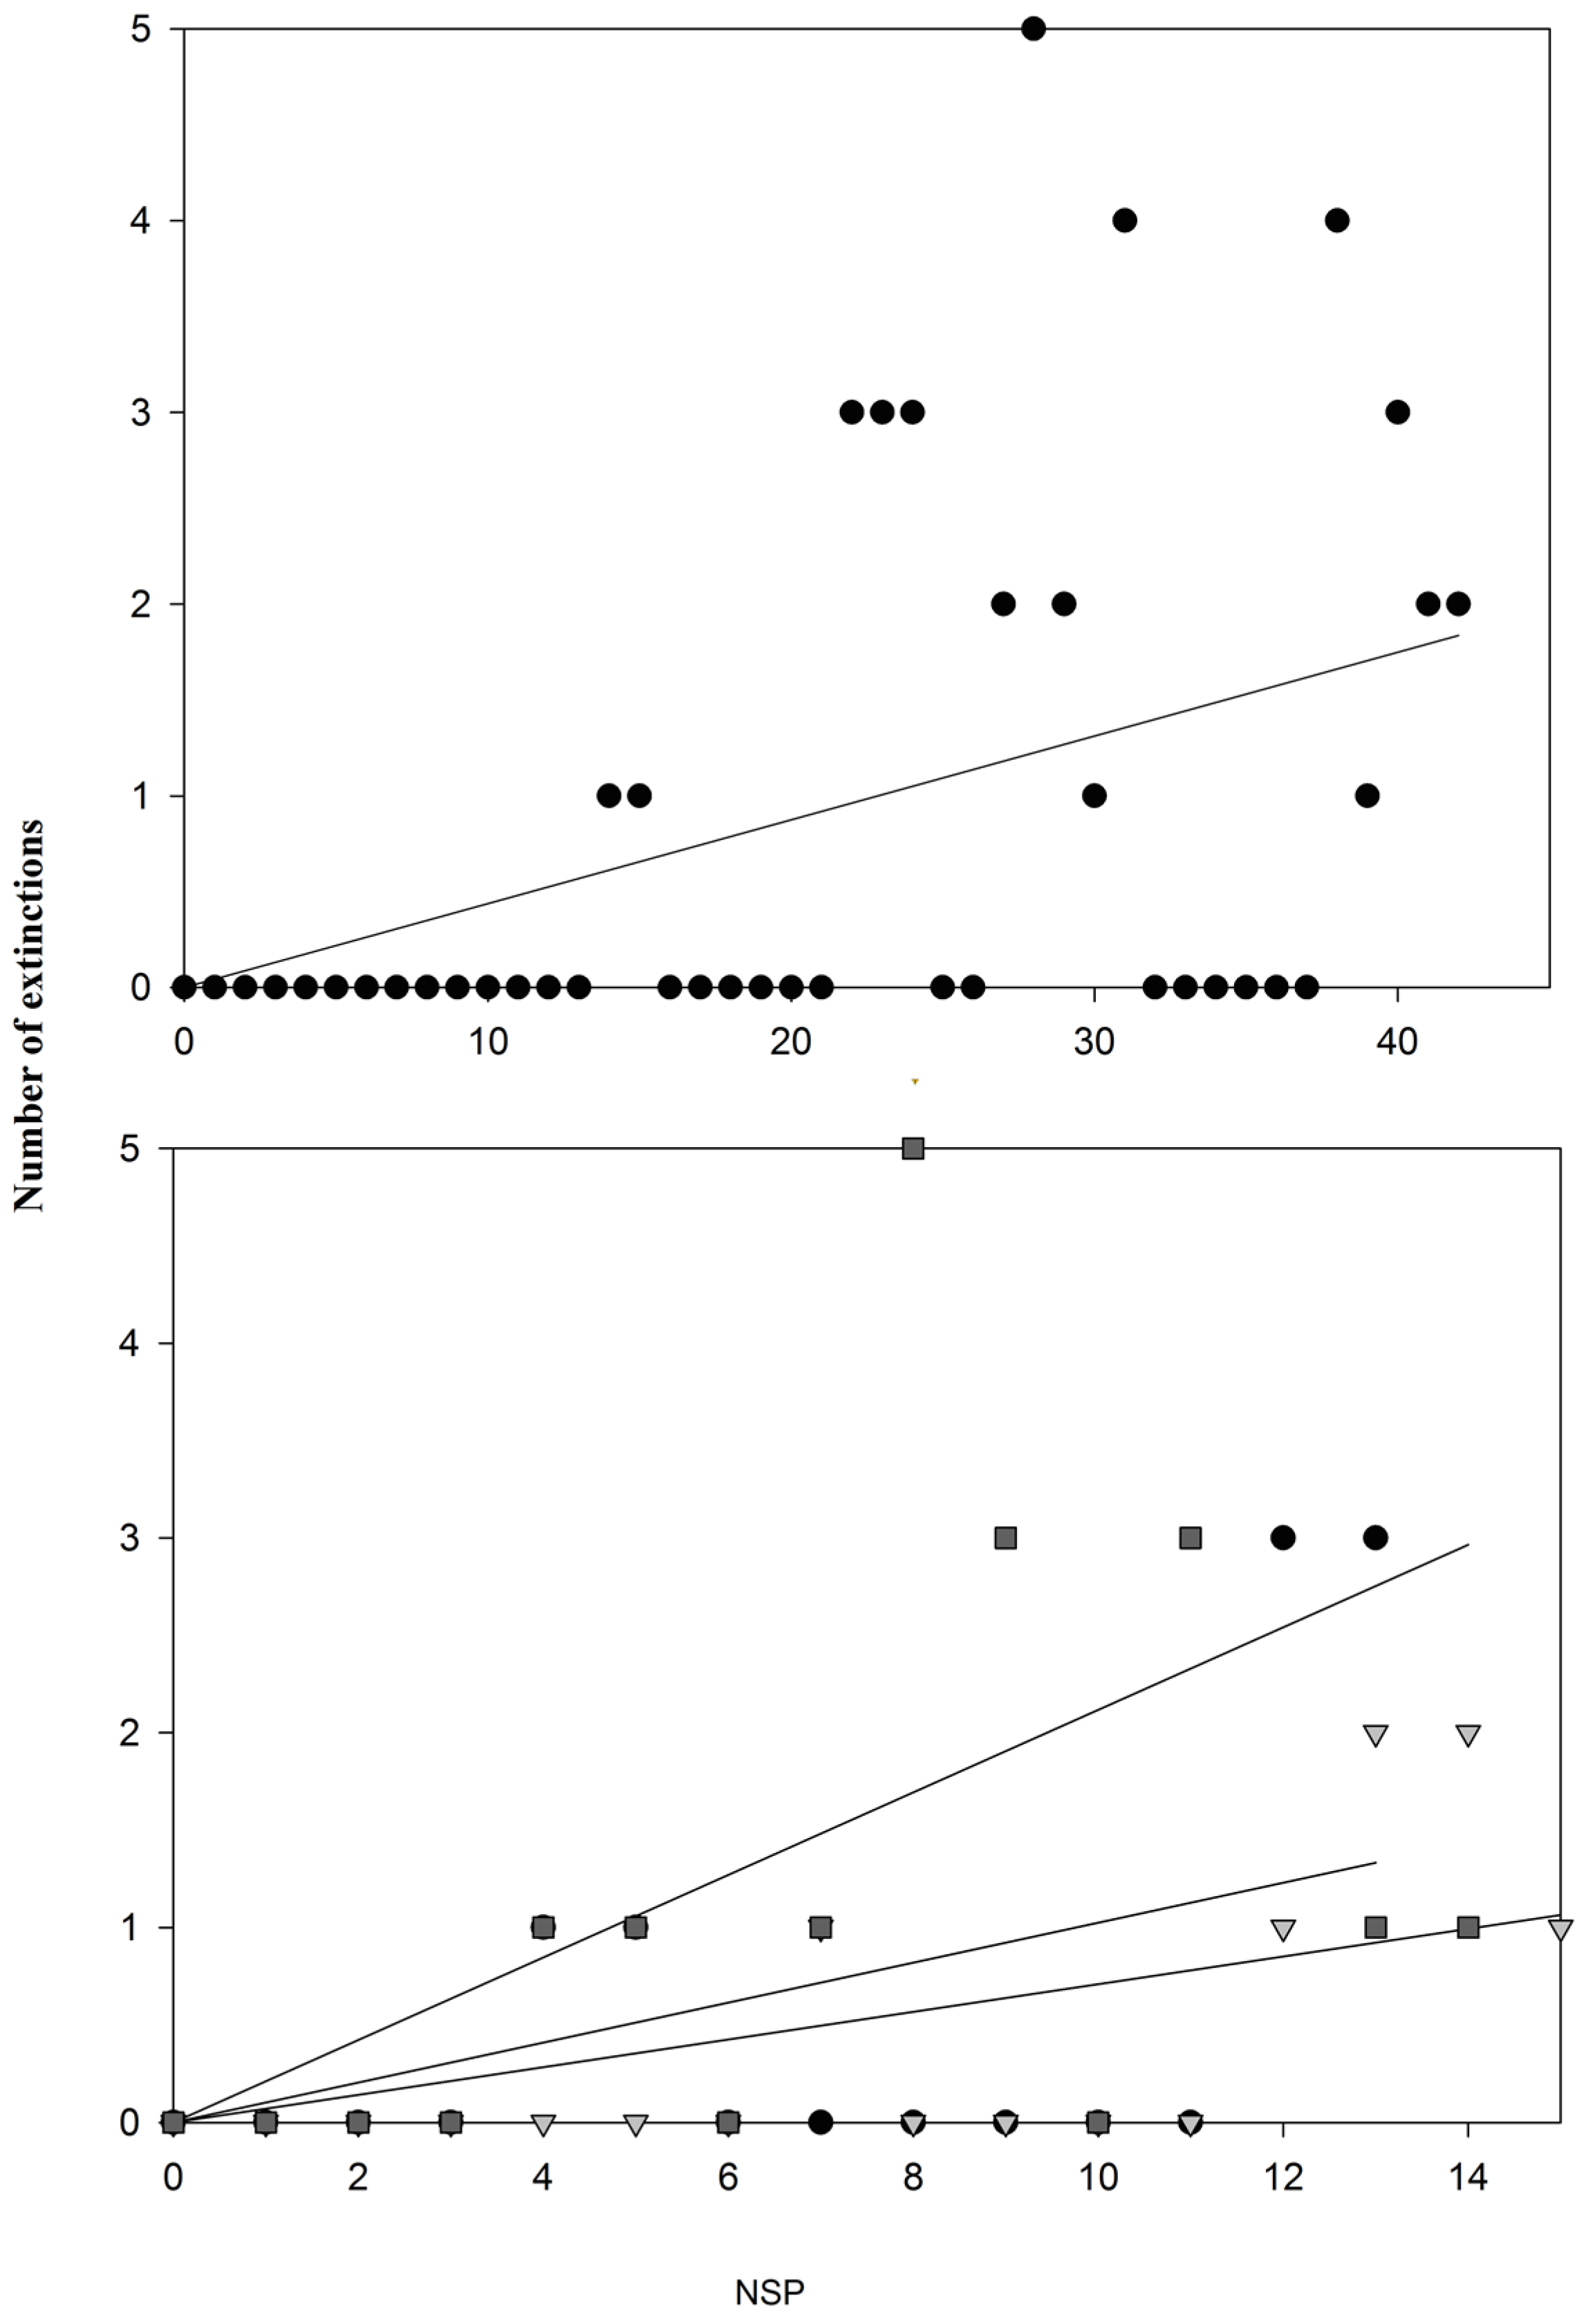
| Pooled data NSPi* | 8(38) | 11(37) | 0.051 |
| Pooled data NSPe* | 8(38) | 12(37) | 0.002 |
| Unscaled data NSPi | 24.58(38) | 25.43(37) | 0.374 |
| Unscaled data NSPe* | 26(38) | 29(37) | 0.026 |


4. Conclusions
Acknowledgments
Author Contributions
Conflicts of Interest
References
- Case, T.J. Invasion resistance arises in strongly interacting species-rich model competition communities. Proc. Natl. Acad. Sci. USA 1990, 87, 9610–9614. [Google Scholar] [CrossRef] [PubMed]
- Drake, J.A.; Huxel, G.R.; Hewit, C.L. Microcosms as models for generating and testing community theory. Ecology 1996, 77, 670–677. [Google Scholar] [CrossRef]
- Keitt, T.H.; Marquet, P.A. The introduced Hawaiian avifauna reconsidered: Evidence for self-organized criticality? J. Theor. Biol. 1996, 182, 161–167. [Google Scholar] [CrossRef]
- Moulton, M.P. The all-or-none pattern in introduced Hawaiian Passeriforms: The role of competition sustained. Am. Nat. 1993, 141, 105–119. [Google Scholar] [CrossRef]
- Allen, C.R.; Nemec, K.T.; Wardwell, D.A.; Hoffman, J.; Brust, M.; Decker, K.; Fogel, D.; Hogue, J.; Lotz, A.; Miller, T.; et al. Predictors of regional establishment success and spread of introduced non-indigenous vertebrates. Glob. Ecol. Biogeogr. 2013, 22, 889–899. [Google Scholar] [CrossRef]
- Kempel, A.; Chrobock, T.; Fischer, M.; Rohr, R.P.; van Kleunen, M. Determinants of plant establishment success in a multispecies introduction experiment with native and alien species. Proc. Natl. Acad. Sci. USA 2013, 110, 12727–12732. [Google Scholar] [CrossRef] [PubMed]
- Svenning, J.-C.; Gravel, D.; Holt, R.D.; Schurr, F.M.; Thuiller, W.; Münkemüller, T.; Schiffers, K.H.; Dullinger, S.; Edwards, T.C.; Hickler, T.; et al. The influence of interspecific interactions on species range expansion rates. Ecography 2014, 37, 1198–1209. [Google Scholar] [CrossRef] [PubMed]
- Brooke, R.K.; Lockwood, J.L.; Moulton, M.P. Patterns of success in passeriform bird introductions on Saint Helena. Oecologia 1995, 103, 337–342. [Google Scholar] [CrossRef]
- Moulton, M.P.; Sanderson, J.G.; Simberloff, D. Passeriform introductions to the Mascarenes (Indian Ocean): An assessment of the role of competition. Écologie 1996, 27, 143–152. [Google Scholar]
- Colautti, R.I.; MacIsaac, H.J. A neutral terminology to define “invasive” species. Divers. Distrib. 2004, 10, 135–141. [Google Scholar] [CrossRef]
- Tilman, D. Community invisibility, recruitment limitations, and grassland biodiversity. Ecology 1997, 81, 81–92. [Google Scholar] [CrossRef]
- Holling, C.S. Cross-scale morphology, geometry, and dynamics of ecosystems. Ecol. Monogr. 1992, 62, 447–502. [Google Scholar] [CrossRef]
- Angeler, D.G.; Göthe, E.; Johnson, R.K. Hierarchical Dynamics of Ecological Communities: Do Scales of Space and Time Match? PLoS ONE 2013, 8, e69174. [Google Scholar] [CrossRef] [PubMed]
- Allen, C.R.; Angeler, D.G.; Garmestani, A.S.; Gunderson, L.H.; Holling, C.S. Panarchy: Theory and applications. Ecosystems 2014, 17, 578–589. [Google Scholar] [CrossRef]
- Sundstrom, S.M.; Allen, C.R.; Barichievy, C. Species, Functional Groups, and Thresholds in Ecological Resilience. Conserv. Biol. 2012, 26, 305–314. [Google Scholar] [CrossRef] [PubMed]
- Kampichler, C.; Angeler, D.G.; Holmes, R.T.; Leito, A.; van der Jeugd, H.; Svensson, S.; Wesołowski, T. Natural long-term dynamics of bird communities: An analysis of base-line conditions from long-term data. Oecologia 2014, 175, 1301–1313. [Google Scholar] [CrossRef] [PubMed]
- Peterson, G.; Allen, C.R.; Holling, C.S. Ecological resilience, biodiversity, and scale. Ecosystems 1998, 1, 6–18. [Google Scholar] [CrossRef]
- Allen, T.F.H.; Hoekstra, T.W. Toward A Unified Ecology; Columbia University Press: New York, NY, USA, 1992. [Google Scholar]
- Wilson, D.S. The adequacy of body size as a niche difference. Am. Nat. 1975, 109, 769–784. [Google Scholar] [CrossRef]
- Eisenberg, J.F. The Mammalian Radiations: An Analysis of Trends in Evolution, Adaptation, and Behavior; University of Chicago Press: Chicago, IL, USA, 1981. [Google Scholar]
- Peters, R.H. The Ecological Implications of Body Size; Cambridge University Press: Cambridge, UK, 1983. [Google Scholar]
- Nash, K.L.; Allen, C.R.; Angeler, D.G.; Barichievy, C.; Eason, T.; Garmestani, A.S.; Graham, N.A.J.; Granholm, D.; Knutson, M.; Nelson, R.J.; et al. Discontinuities, cross-scale patterns and the organization of ecosystems. Ecology 2014, 95, 654–667. [Google Scholar] [CrossRef] [PubMed]
- Berger, A.J. Hawaiian Birdlife, 2nd ed.; University Press of Hawaii: Honolulu, HI, USA, 1981. [Google Scholar]
- Moulton, M.P.; Pimm, S.L. The introduced Hawaiian avifauana: Biogeographic evidence for competition. Am. Nat. 1983, 121, 669–690. [Google Scholar] [CrossRef]
- Moulton, M.P.; Pimm, S.L. The extent of competition in shaping an introduced avifauna. In Community Ecology; Diamond, J., Case, T.J., Eds.; Harper and Row: New York, NY, USA, 1986; pp. 80–97. [Google Scholar]
- Moulton, M.P.; Pimm, S.L. Species introductions to Hawaii. In Ecology of Biological Invasions of North America and Hawaii; Mooney, H.A., Drake, J.A., Eds.; Springer: New York, NY, USA, 1986; pp. 231–249. [Google Scholar]
- Simberloff, D.; Boecklen, W. Patterns of extinction in the introduced Hawaiian avifauna: A reexamination of the role of competition. Am. Nat. 1991, 138, 300–327. [Google Scholar] [CrossRef]
- Warner, R.E. The role of introduced diseases in the extinction of the endemic Hawaiian avifauna. Condor 1968, 70, 101–120. [Google Scholar] [CrossRef]
- Mountainspring, S.; Scott, J.M. Interspecific competition among Hawaiian forest birds. Ecol. Monogr. 1985, 55, 219–239. [Google Scholar] [CrossRef]
- Pratt, H.D.; Bruner, P.L.; Berret, D.G. The Birds of Hawaii and the Tropical Pacific; Princeton University Press: Princeton, NJ, USA, 1987. [Google Scholar]
- Veltman, C.J.; Nee, S.; Crawley, M.J. Correlates of introduction success in exotic New Zealand birds. Am. Nat. 1996, 147, 542–557. [Google Scholar] [CrossRef]
- Restrepo, C.; Renjifo, L.M.; Marples, P. Frugivorous birds in fragmented neotropical montane forests: Landscape pattern and body mass distribution. In Tropical Forest Remnants: Ecology, Management and Conservation of Fragmented Communities; Laurance, W.F., Bierregaard, R.O., Eds.; University of Chicago Press: Chicago, IL, USA, 1997; pp. 171–189. [Google Scholar]
- Dunning, J.B., Jr. CRC Handbook of Avian Body Masses; CRC Press: Ann Arbor, MI, USA, 1993. [Google Scholar]
- Silverman, B.W. Using kernel density estimates to investigate multimodality. J. R. Stat. Soc. 1981, 43, 97–99. [Google Scholar]
- Allen, C.R.; Forys, E.A.; Holling, C.S. Body mass patterns predict invasions and extinction in transforming landscapes. Ecosystems 1999, 2, 114–121. [Google Scholar] [CrossRef]
- Diamond, J.M. Assembly of species communities. In Ecology and Evolution of Communities; Cody, M.L., Diamond, J.M., Eds.; Harvard University Press: Cambridge, MA, USA, 1975; pp. 342–444. [Google Scholar]
- Moulton, M.P.; Pimm, S.L. Morphological assortment in introduced Hawaiian passerines. Evol. Ecol. 1987, 1, 113–124. [Google Scholar] [CrossRef]
- Moulton, M.P.; Lockwood, J.L. Morphological dispersion of introduced Hawaiian finches: Evidence for competition and a Narcissus effect. Evol. Ecol. 1992, 6, 45–55. [Google Scholar] [CrossRef]
- Lockwood, J.L.; Moulton, M.P.; Anderson, S.K. Morphological assortment and the assembly of communities of introduced passeriforms on oceanic islands: Tahiti versus Oahu. Am. Nat. 1993, 141, 398–408. [Google Scholar] [CrossRef]
- Lockwood, J.L.; Moulton, M.P. Ecomorphological pattern in Bermuda birds: The influence of competition and implications for nature preserves. Evol. Ecol. 1994, 8, 53–60. [Google Scholar] [CrossRef]
- Moulton, M.P.; Ferris, D.K. Summer diets of some introduced Hawaiian finches. Wilson Bull. 1991, 103, 286–292. [Google Scholar]
- Blackburn, T.M.; Cassey, P. Patterns of non-randomness in the exotic avifauna of Florida. Divers. Distrib. 2007, 13, 519–526. [Google Scholar] [CrossRef]
- Cardillo, M.; Mace, G.M.; Jones, K.E.; Bielby, J.; Bininda-Emonds, O.R.P.; Sechrest, W.; Orme, C.D.L.; Purvis, A. Multiple causes of high extinction risk in large mammal species. Science 2005, 209, 1239–1241. [Google Scholar] [CrossRef] [PubMed]
- Gaston, K.J.; Blackburn, T.M. Birds, body size and the threat of extinction. Philos. Trans. R. Soc. B 1995, 347, 205–212. [Google Scholar] [CrossRef]
- Loehle, C.; Eschenbach, W. Historical bird and terrestrial mammal extinction rates and causes. Divers. Distrib. 2012, 18, 84–91. [Google Scholar] [CrossRef]
- Angeler, D.G.; Allen, C.R.; Vila-Gispert, A.; Almeida, D. Fitness in animals correlates with proximity to discontinuities in body size distributions. Ecol. Complex. 2014, 20, 213–218. [Google Scholar] [CrossRef]
- Sundstrom, S.M.; Angeler, D.G.; Garmestani, A.S.; García, J.H.; Allen, C.R. Transdisciplinary application of cross-scale resilience. Sustainability 2014, 6, 6925–6948. [Google Scholar] [CrossRef]
© 2015 by the authors; licensee MDPI, Basel, Switzerland. This article is an open access article distributed under the terms and conditions of the Creative Commons Attribution license (http://creativecommons.org/licenses/by/4.0/).
Share and Cite
Allen, C.R.; Angeler, D.G.; Moulton, M.P.; Holling, C.S. The Importance of Scaling for Detecting Community Patterns: Success and Failure in Assemblages of Introduced Species. Diversity 2015, 7, 229-241. https://doi.org/10.3390/d7030229
Allen CR, Angeler DG, Moulton MP, Holling CS. The Importance of Scaling for Detecting Community Patterns: Success and Failure in Assemblages of Introduced Species. Diversity. 2015; 7(3):229-241. https://doi.org/10.3390/d7030229
Chicago/Turabian StyleAllen, Craig R., David G. Angeler, Michael P. Moulton, and Crawford S. Holling. 2015. "The Importance of Scaling for Detecting Community Patterns: Success and Failure in Assemblages of Introduced Species" Diversity 7, no. 3: 229-241. https://doi.org/10.3390/d7030229
APA StyleAllen, C. R., Angeler, D. G., Moulton, M. P., & Holling, C. S. (2015). The Importance of Scaling for Detecting Community Patterns: Success and Failure in Assemblages of Introduced Species. Diversity, 7(3), 229-241. https://doi.org/10.3390/d7030229