Genetic Diversity and Seed Quality of the “Badda” Common Bean from Sicily (Italy)


Abstract
:
1. Introduction
2. Experimental Section
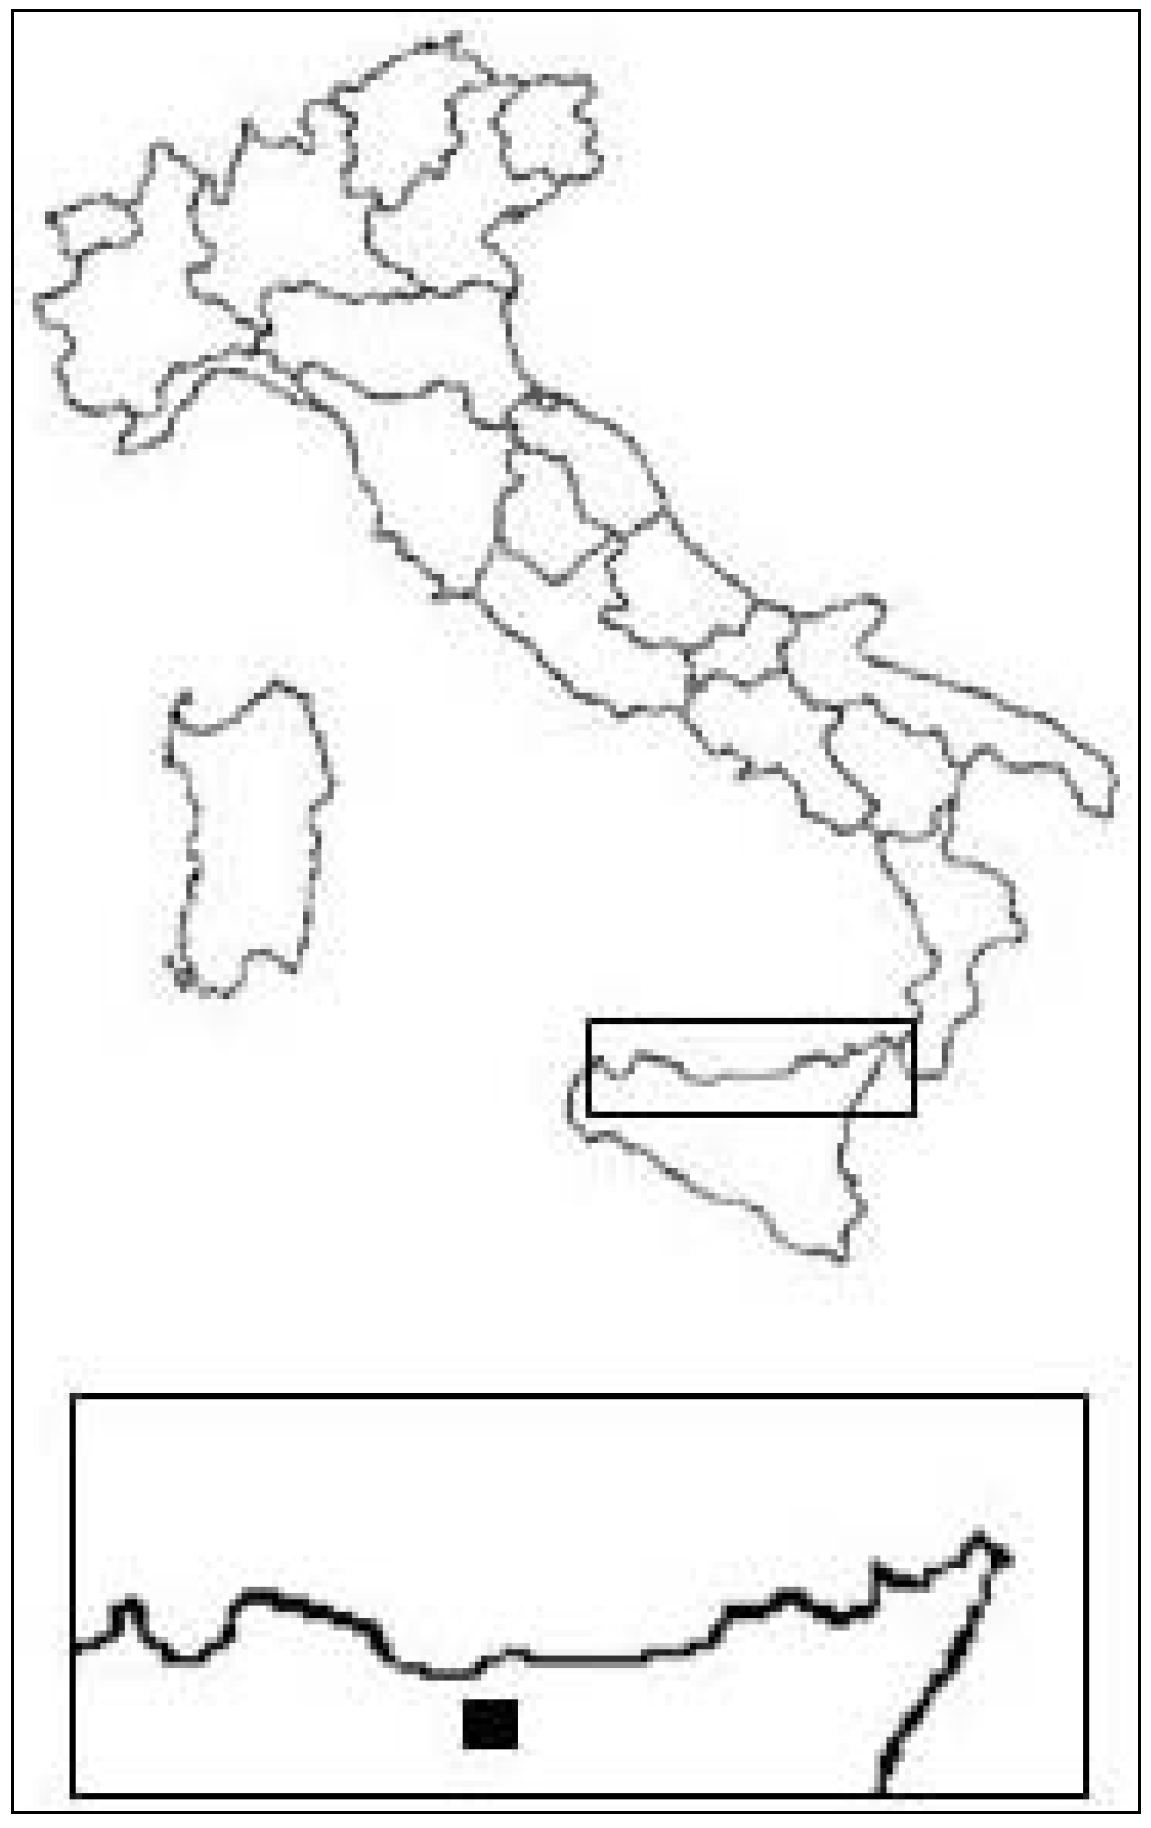
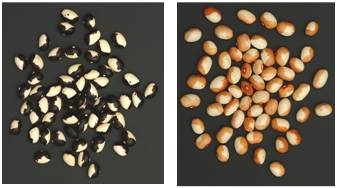
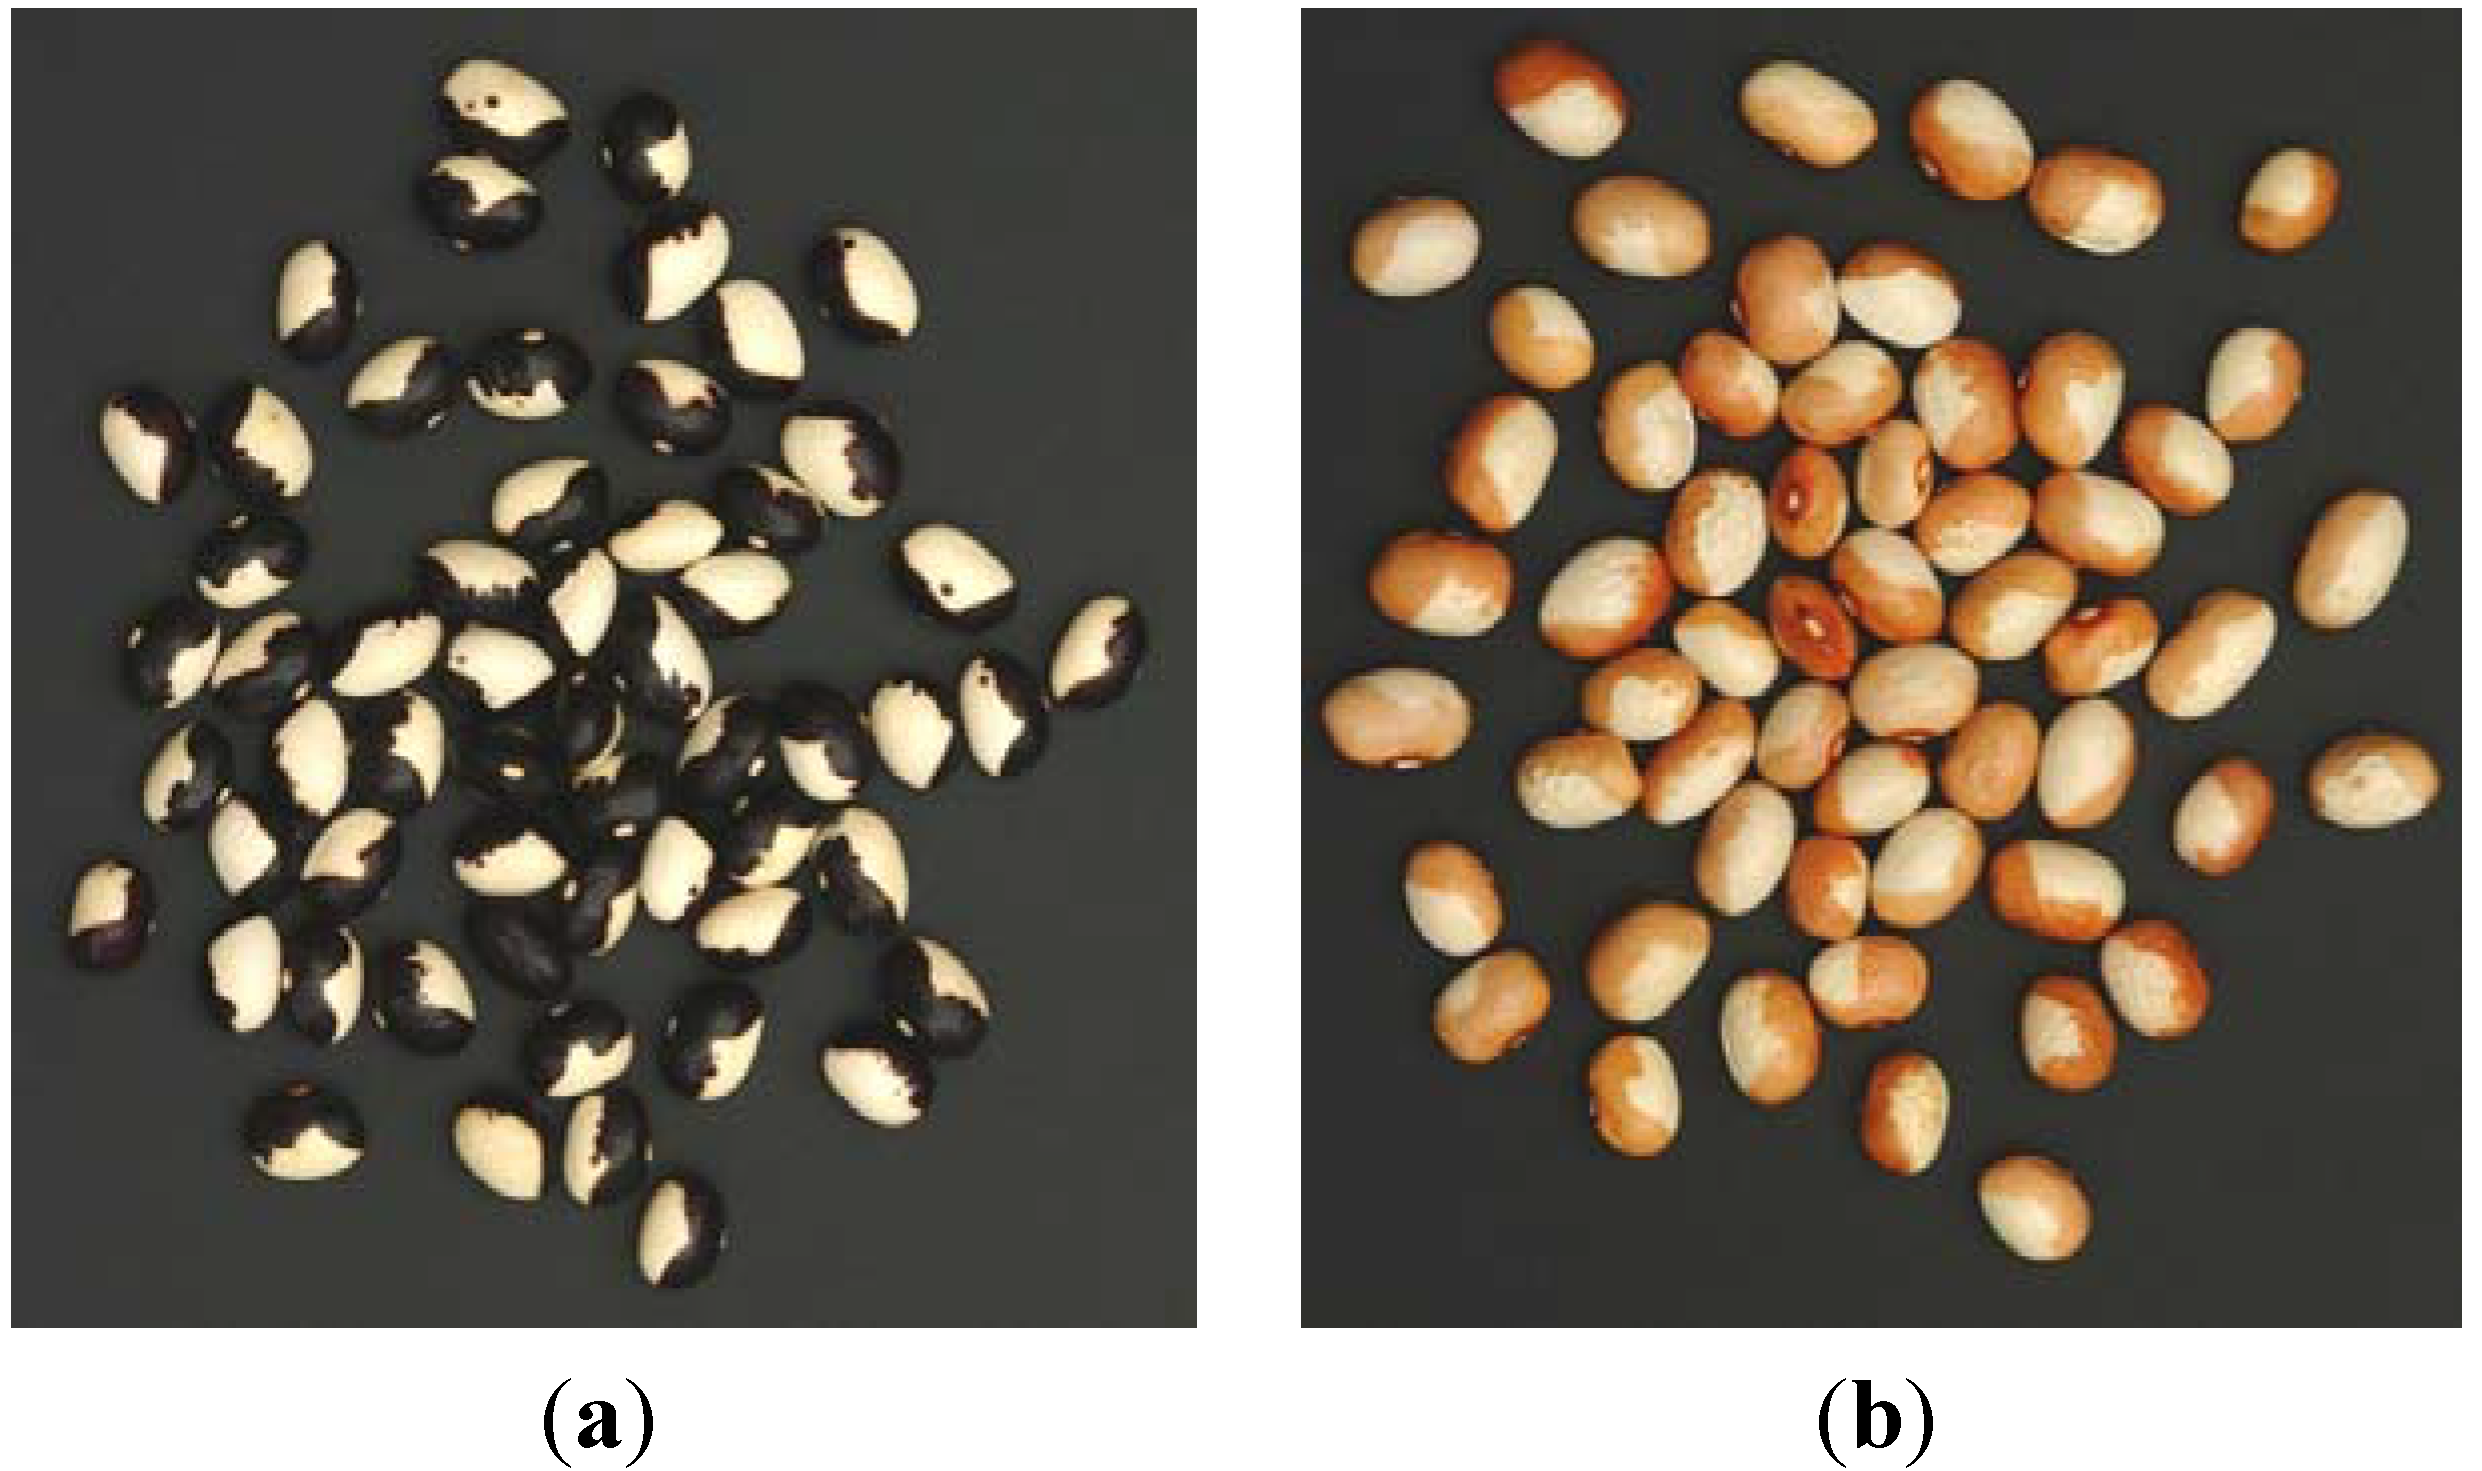
2.1. Plant Materials

2.2. Biochemical and Molecular Markers
2.3. Seed Quality

| EMBL access. No. | Locus | Core motif | Tm | Fragment size range | No. of alleles |
|---|---|---|---|---|---|
| AB070627 | PVSBE2 | (ATA)8 | 52 | 148–194 | 3 |
| AF402604 | HDZ1 | (GAA)4 (GT)1 (ATC)5 | 55 | 198 | 1 |
| AY007525 | PVPDX1 | (TC)6 (AG)8 | 50 | 158–162 | 2 |
| J04555 | PVPVPK | (CTT)3 (T)3 (CTT)6 | 58 | 154–163 | 2 |
| K03289 | PHVDLECB | (ATGC)4 | 56 | 142–144 | 2 |
| M68913 | PHVARC1A | (ATCT)3 | 51 | 198 | 1 |
| M75856 | PVPR3A | (CT)11 (TTC)6 | 57 | 157 | 1 |
| U18791 | PV18791 | (TA)22 | 55 | 239–295 | 13 |
| U34754 | PV34754 | (AT)8 | 58 | 247–251 | 2 |
| U70530 | PVU70530 | (CT)7 | 52 | 245 | 1 |
| X04001 | PVGSR1 | (AG)8 | 59 | 167 | 1 |
| X80051 | PVME1G | (AT)12 | 57 | 194–233 | 14 |
| X60000 | PVRBCOS | (AT)4 (T)2 (AT)6 | 55 | 135–139 | 2 |
| X61293 | PVGLND5 | (AT)18 | 50 | 154–273 | 12 |
| X63525 | PVLOXA | (AT)7 | 57 | 292–301 | 4 |
| X96999 | PVYPR10GN | (AT)9 | 57 | 170–178 | 4 |
2.4. Statistical Analyses
3. Results and Discussion
3.1. Seed Storage Protein Variation
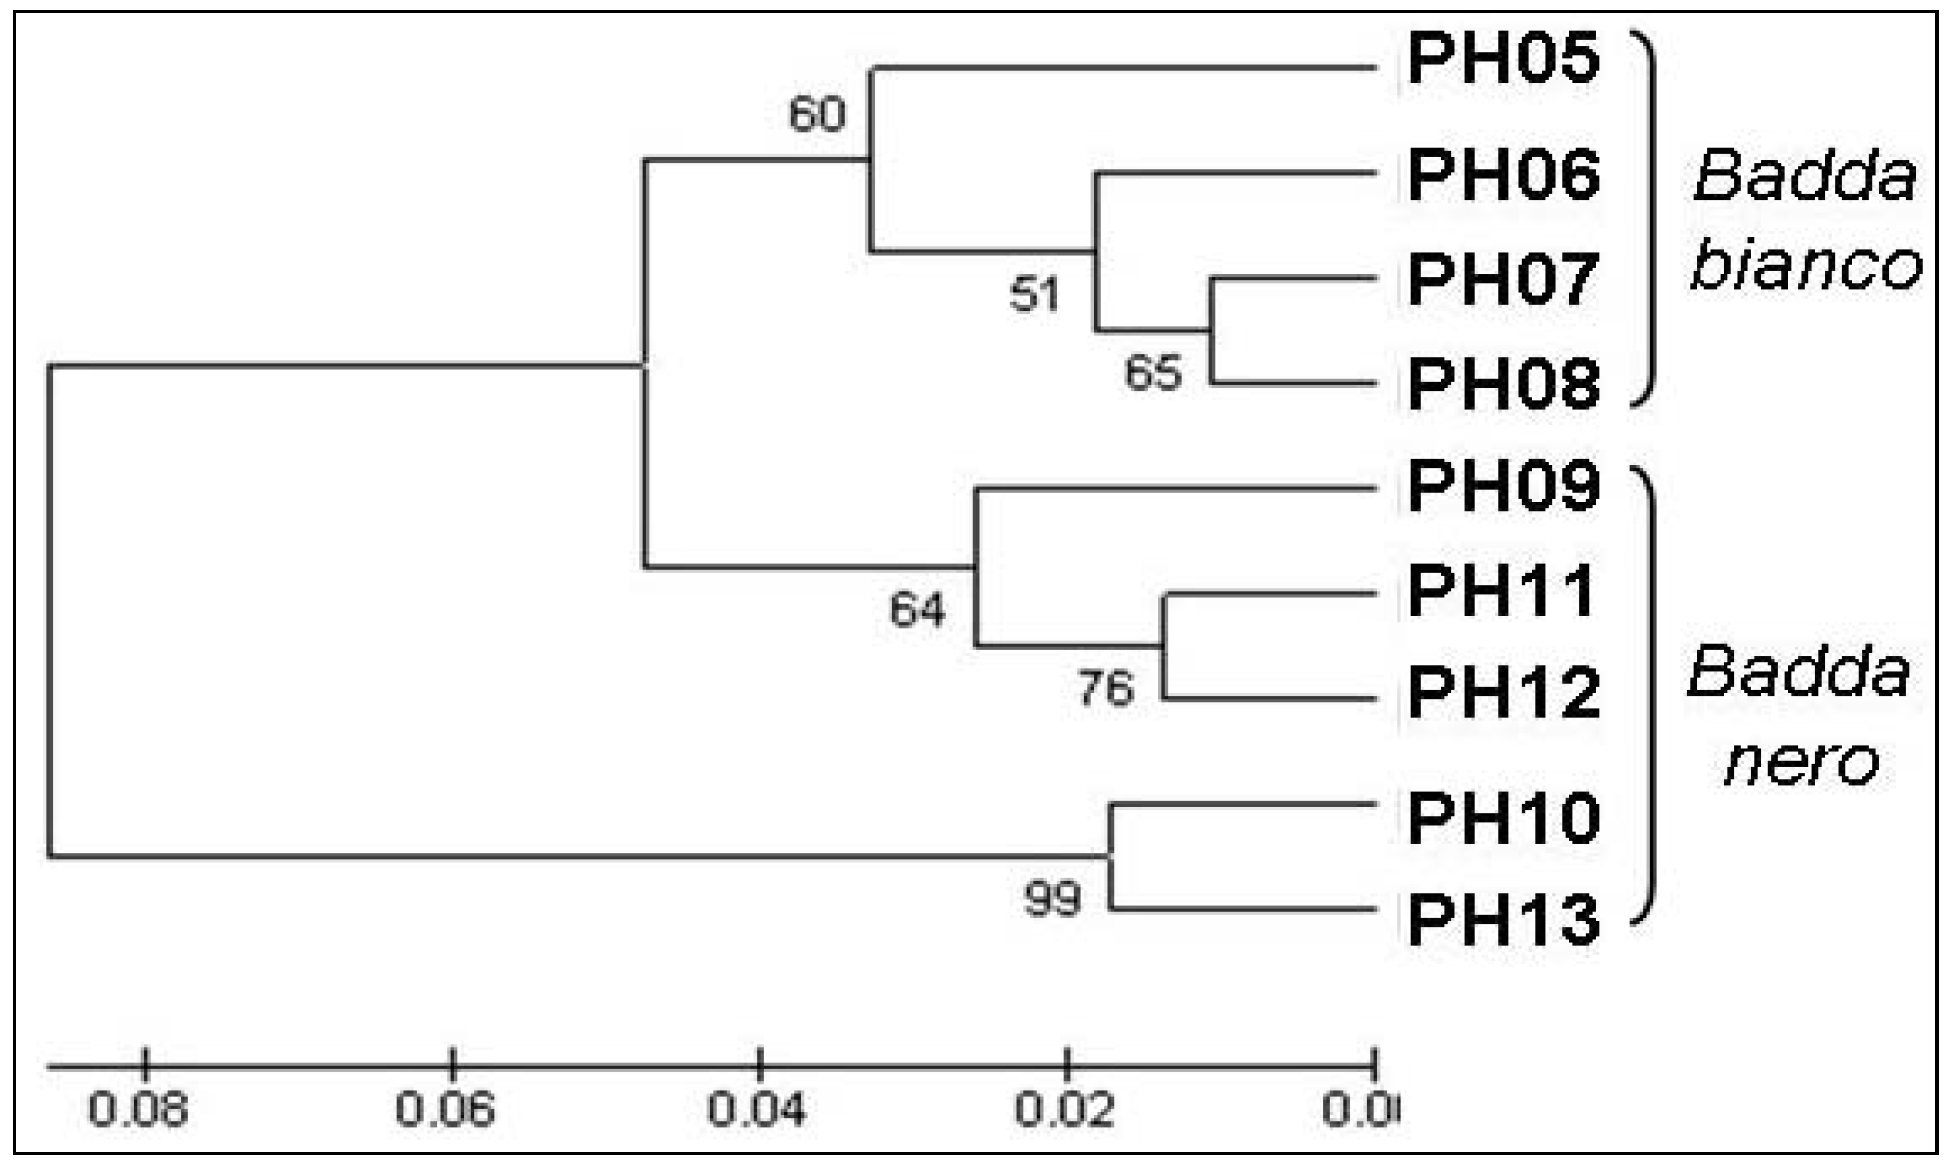
3.2. Genetic Variation Based on Molecular Markers
| Work Code | no a | ne b | P c | He d | Ho e |
|---|---|---|---|---|---|
| Badda bianco | |||||
| PH05 | 1.75 | 1.34 | 38 | 0.17 | 0.01 |
| PH06 | 1.81 | 1.54 | 44 | 0.21 | 0.01 |
| PH07 | 2.19 | 1.92 | 38 | 0.24 | 0.00 |
| PH08 | 2.38 | 2.10 | 38 | 0.27 | 0.00 |
| Mean | 2.03 * | 1.66 | 40 * | 0.22 * | 0.005 |
| Badda nero | |||||
| PH09 | 1.88 | 1.56 | 44 | 0.21 | 0.00 |
| PH10 | 1.31 | 1.14 | 19 | 0.07 | 0.01 |
| PH11 | 1.75 | 1.57 | 25 | 0.16 | 0.00 |
| PH12 | 1.56 | 1.30 | 19 | 0.12 | 0.00 |
| PH13 | 1.31 | 1.19 | 19 | 0.09 | 0.00 |
| Mean | 1.56 * | 1.33 | 25 * | 0.13 * | 0.002 |
| Total mean | 1.77 | 1.50 | 32 | 0.17 | 0.003 |
| Morphotype | Nei’s genetic diversity analysis | |||
|---|---|---|---|---|
| HT | HS | DST | GST | |
| Badda bianco | 0.25 | 0.22 | 0.03 | 0.12 |
| Badda nero | 0.21 | 0.13 | 0.08 | 0.38 |
| Accession | PH05 | PH06 | PH07 | PH08 | PH09 | PH10 | PH11 | PH12 | PH13 |
|---|---|---|---|---|---|---|---|---|---|
| PH05 | - | 0.943 | 0.924 | 0.919 | 0.894 | 0.771 | 0.871 | 0.866 | 0.777 |
| PH06 | 0.059 | - | 0.960 | 0.951 | 0.879 | 0.808 | 0.901 | 0.889 | 0.820 |
| PH07 | 0.079 | 0.041 | - | 0.969 | 0.921 | 0.842 | 0.935 | 0.939 | 0.856 |
| PH08 | 0.084 | 0.051 | 0.032 | - | 0.910 | 0.878 | 0.913 | 0.905 | 0.899 |
| PH09 | 0.112 | 0.123 | 0.082 | 0.095 | - | 0.819 | 0.946 | 0.939 | 0.830 |
| PH10 | 0.260 | 0.213 | 0.172 | 0.130 | 0.200 | - | 0.876 | 0.825 | 0.963 |
| PH11 | 0.138 | 0.102 | 0.067 | 0.091 | 0.055 | 0.133 | - | 0.968 | 0.886 |
| PH12 | 0.143 | 0.117 | 0.063 | 0.100 | 0.062 | 0.192 | 0.033 | - | 0.840 |
| PH13 | 0.252 | 0.198 | 0.156 | 0.106 | 0.186 | 0.037 | 0.121 | 0.174 | - |

3.3. Nutritional and Technological Seed Traits
| Work code | 100 seed weight (g) | Seed density (g mL−1) | Coat (g kg−1) | HI (%) | SI (% 24 h) | Moisture (g kg−1) | Protein (g kg−1) | Ash (g kg−1) | Cooking time (min) | |
|---|---|---|---|---|---|---|---|---|---|---|
| 5 h | 24 h | |||||||||
| Badda bianco | ||||||||||
| PH05 | 56.2 | 1.20 | 59.2 | 45.4 | 106.4 | 100 | 111.2 | 258.0 | 47.7 | 41 |
| PH06 | 44.2 | 1.07 | 57.6 | 2.5 | 80.1 | 92 | 108.7 | 243.8 | 41.0 | 42 |
| PH07 | 46.5 | 1.26 | 56.0 | 4.4 | 87.4 | 136 | 110.4 | 232.7 | 40.6 | 42 |
| PH08 | 52.2 | 1.13 | 52.8 | 15.2 | 89.7 | 92 | 101.7 | 245.7 | 46.1 | 45 |
| Mean | 49.8 | 1.16 | 56.4 | 16.9 | 91 | 105 | 108.0 | 245.0 | 43.8 | 42.5 |
| Std Dev | 5.45 | 0.08 | 2.73 | 19.82 | 11.11 | 21.01 | 4.33 | 10.36 | 3.59 | 1.73 |
| Badda nero | ||||||||||
| PH09 | 45.7 | 1.27 | 59.1 | 12.5 | 87.0 | 127 | 110.2 | 242.0 | 42.0 | 38 |
| PH10 | 59.1 | 1.09 | 57.0 | 59.7 | 85.5 | 94 | 106.5 | 243.1 | 38.8 | 44 |
| PH11 | 44.1 | 1.10 | 59.3 | 8.2 | 87.9 | 75 | 112.5 | 224.8 | 40.9 | 42 |
| PH12 | 41.7 | 1.11 | 60.5 | 5.6 | 90.4 | 100 | 111.3 | 222.7 | 43.0 | 48 |
| PH13 | 59.3 | 1.18 | 57.1 | 30.2 | 92.4 | 123 | 103.1 | 249.4 | 45.8 | 50 |
| Mean | 50.0 | 1.15 | 58.6 | 23.2 | 88.6 | 104 | 108.7 | 236.4 | 42.1 | 44.4 |
| Std Dev | 8.54 | 0.08 | 1.51 | 22.53 | 2.75 | 21.49 | 3.86 | 11.91 | 2.59 | 4.78 |
4. Conclusions
Acknowledgments
Conflicts of Interest
References
- Piergiovanni, A.R.; Lioi, L. Italian common bean landraces: History, genetic diversity and seed quality. Diversity 2010, 2, 837–862. [Google Scholar] [CrossRef]
- Escribano, M.R.; Santalla, M.; Casquero, P.A.; de Ron, A.R. Patterns of genetic diversity in landraces of common bean (Phaseolus vulgaris L.) from Galicia. Plant Breed. 1998, 117, 49–56. [Google Scholar] [CrossRef]
- Rodiño, A.P.; Santalla, M.; Montero, I.; Casquero, P.A.; de Ron, A.M. Diversity of common bean (Phaseolus vulgaris L.) germplasm from Portugal. Genet. Resour. Crop Evol. 2001, 48, 409–417. [Google Scholar] [CrossRef]
- Mavromatis, A.G.; Arvanitoyannis, I.S.; Korkovelos, A.E.; Giakountis, A.; Chatzitheodorou, V.A.; Goulas, C.K. Genetic diversity among common bean (Phaseolus vulgaris L.) Greek landraces and commercial cultivars: Nutritional components, RAPD and morphological markers. Span. J. Agric. Res. 2010, 8, 986–994. [Google Scholar]
- Ganopoulos, I.; Bosmali, I.; Madesis, P.; Tsaftari, A. Microsatellite genotyping with HRM (High Resolution Melting) analysis for identification of the PGI common bean variety Plake Megalosperma Prespon. Eur. Food Res. Technol. 2012, 234, 501–508. [Google Scholar] [CrossRef]
- Montesano, V.; Negro, D.; Sarli, G.; Logozzo, G.; Spagnoletti Zeuli, P.L. Landraces in inland of the Basilicata region, Italy: Monitoring and perspectives for on farm conservation. Genet. Resour. Crop Evol. 2012, 59, 701–716. [Google Scholar] [CrossRef]
- Negri, V.; Tosti, N. Phaseolus genetic diversity maintained on-farm in central Italy. Genet. Resour. Crop Evol. 2002, 49, 511–520. [Google Scholar] [CrossRef]
- Angioi, S.A.; Rau, D.; Rodriguez, M.; Logozzo, G.; Desiderio, F.; Papa, R.; Attene, G. Nuclear and chloroplast microsatellite diversity in Phaseolus vulgaris L. from Sardinia (Italy). Mol. Breed. 2009, 23, 413–429. [Google Scholar] [CrossRef]
- Mercati, F.; Leone, M.; Lupini, A.; Sorgonà, A.; Bacchi, M.; Abenavoli, M.R.; Sunseri, F. Genetic diversity and population structure of a common bean (Phaseolus vulgaris L.) collection from Calabria (Italy). Genet. Resour. Crop. Evol. 2013, 60, 839–852. [Google Scholar] [CrossRef]
- Paniconi, G.; Gianfilippi, F.; Mosconi, P.; Mazzuccato, A. Distinctiveness of bean landraces in Italy: The case study of the “Badda” bean. Diversity 2010, 2, 701–716. [Google Scholar] [CrossRef]
- Lioi, L.; Nuzzi, A.; Campion, B.; Piergiovanni, A.R. Assessment of genetic variation in common bean (Phaseolus vulgaris L.) from Nebrodi mountains (Sicily, Italy). Genet. Resour. Crop Evol. 2012, 59, 455–464. [Google Scholar] [CrossRef]
- Tredicesima revisione dell’elenco dei prodotti agroalimentari tradizionali. Available online: http://www.politicheagricole.it/flex/cm/pages/ServeBLOB.php/L/IT/IDPagina/3276 (accessed on 4 October 2013).
- Fondazione Slow Food. I presidi Slow Food in Italia. Available online: http://www.fondazioneslowfood.it/pagine/ita/presidi_italia/dettaglio_presidi.lasso?-id=3545 (accessed on 4 October 2013).
- Comune di Polizzi Generosa. Available online: http://www.comune.polizzi.pa.it/index.php?option=com_alberghi&Itemid=130&task=viewcategory&catid=68 (accessed on 4 October 2013).
- Gepts, P.; Bliss, F.A. Dissemination pathways of common bean (Phaseolus vulgaris, Fabaceae) deduced from phaseolin electrophoretic variability. II. Europe and Africa. Econ. Bot. 1988, 42, 86–104. [Google Scholar] [CrossRef]
- Maciel, F.L.; Echeverrigaray, S.; Gerald, L.T.S.; Grazziotin, G.F. Genetic relationships and diversity among Brazilian cultivars and landraces of common bean (Phaseolus vulgaris L.) revealed by AFLP markers. Genet. Resour. Crop Evol. 2003, 50, 887–893. [Google Scholar] [CrossRef]
- Blair, M.W.; Giraldo, M.C.; Buendia, H.F.; Tovar, E.; Duque, M.C.; Beebe, S.E. Microsatellite marker diversity in common bean (Phaseolus vulgaris L.). Theor. Appl. Genet. 2006, 113, 100–109. [Google Scholar] [CrossRef]
- Grisi, M.C.; Blair, M.W.; Gepts, P.; Brondani, C.; Pereira, P.A.; Brondani, R.P. Genetic mapping of a new set of microsatellite markers in a reference common bean (Phaseolus vulgaris) population BAT93 x Jalo EEP558. Genet. Mol. Res. 2007, 30, 691–706. [Google Scholar]
- Lioi, L.; Piergiovanni, A.R.; Pignone, D.; Puglisi, S.; Santantonio, M.; Sonnante, G. Genetic diversity of some surviving on-farm Italian common bean (Phaseolus vulgaris L) landraces. Plant Breed. 2005, 124, 576–581. [Google Scholar] [CrossRef]
- Bollini, R.; Chrispeels, M.J. Characterization and subcellular localization of vicilin and phytohemagglutinin, the two major reserve proteins of Phaseolus vulgaris L. Planta 1978, 142, 291–298. [Google Scholar] [CrossRef]
- Paz, M.M.; Veilleux, R.E. Genetic diversity based on randomly amplified polymorphic DNA (RAPD) and its relationship with the performance of diploid potato hybrids. J. Am. Soc. Hort. Sci. 1997, 122, 740–747. [Google Scholar]
- Association of Official Agricultural Chemists (AOAC). Official Methods of Analysis, 11th ed.; AOAC: Washington, DC, USA, 1970. [Google Scholar]
- Piergiovanni, A.R.; Cerbino, D.; della Gatta, C. Diversity in seed quality traits of common bean (Phaseolus vulgaris L.) populations from Basilicata (Southern Italy). Plant Breed. 2000, 119, 513–516. [Google Scholar] [CrossRef]
- Nei, M. Estimation of average heterozygosity and genetic distance from a small number of individuals. Genetics 1978, 89, 583–590. [Google Scholar]
- Yeh, F.C.; Yang, R.C.; Boyle, T. POPGENE, version 1.32; Microsoft Window-based freeware for population genetic analysis. Available online: http://www.ualberta.ca/~fyeh/popgene_download.html (accessed on 4 December 2013).
- Takezaki, N.; Nei, M.; Tamura, K. POPTREE2: Software for constructing population trees from allele frequency data and computing other population statistics with windows interface. Mol. Biol. Evol. 2010, 27, 747–752. [Google Scholar] [CrossRef]
- Lioi, L. Geographical variation of phaseolin pattern in an old world collection of Phaseolus vulgaris. Seed Sci. Technol. 1989, 17, 317–324. [Google Scholar]
- Ocampo, C.H.; Martin, J.P.; Sanchez-Yelamo, M.D.; Ortiz, J.M.; Toro, O. Tracing the origin of Spanish common bean cultivars using biochemical and molecular markers. Genet. Resour. Crop Evol. 2005, 52, 33–40. [Google Scholar] [CrossRef]
- Sicard, D.; Nanni, L.; Porfiri, O.; Bulfon, D.; Papa, R. Genetic diversity of Phaseolus vulgaris L. and P. coccineus L. landraces in central Italy. Plant Breed. 2005, 124, 464–472. [Google Scholar] [CrossRef]
- Bellucci, E.; Bitocchi, E.; Rau, D.; Rodriguez, M.; Biagetti, E.; Giardini, A.; Attene, G.; Nanni, L.; Papa, R. Genomics of Origin, Domestication and Evolution of Phaseolus vulgaris. In Genomics of Plant Genetic Resources; Tuberosa, R., Graner, A., Frison, E., Eds.; Springer: Dordrecht, The Netherlands, 2014; Volume 1, pp. 483–507. [Google Scholar]
- Angioi, S.A.; Rau, D.; Nanni, L.; Bellucci, E.; Papa, R.; Attene, G. The genetic make-up of the European landraces of the common bean. Plant Genet. Resour. 2011, 9, 197–201. [Google Scholar] [CrossRef]
- Logozzo, G.; Donnoli, R.; Macaluso, L.; Papa, R.; Knupffer, H.; Spagnoletti Zeuli, P.L. Analysis of the contribution of Mesoamerican and Andean gene pools to European common bean (Phaseolus vulgaris L.) germplasm and strategies to establish a core collection. Genet. Resour. Crop Evol. 2007, 54, 1763–1779. [Google Scholar] [CrossRef]
- Perazzini, R.; Leonardi, D.; Ruggeri, S.; Alesiani, D.; D’Arcangelo, G.; Canini, A. Characterization of Phaseolus vulgaris L. landraces cultivated in central Italy. Plant Foods Hum. Nutr. 2008, 63, 211–218. [Google Scholar] [CrossRef]
- Limongelli, G.; Laghetti, G.; Perrino, P.; Piergiovanni, A.R. Variation of seed storage proteins in landraces of common bean (Phaseolus vulgaris L.) from Basilicata, southern Italy. Euphytica 1996, 92, 393–399. [Google Scholar]
- Piergiovanni, A.R.; Maruca, G.; Lioi, L. Biochemical Characterization of Common Bean Germplasm Maintained On-Farm in Calabria Region. In Proceedings of the IX Convegno Nazionale sulla Biodiversità, Valenzano, Italy, 5–7 September 2012.
- Brown, J.W.S.; Osborn, T.C.; Bliss, F.A.; Hall, T.C. Bean lectins. Part 1: Relationships between agglutinating activity and electrophoretic variation in the lectin-containing G2/albumin seed proteins of French bean (Phaseolus vulgaris L.). Theor. Appl. Genet. 1982, 62, 263–271. [Google Scholar]
- Lioi, L. Electrophoretic variation and geographical distribution of the seed protein phytohemagglutinin in cultivated Phaseolus vulgaris L. J. Genet. Breed. 1991, 45, 97–102. [Google Scholar]
- Blair, M.W.; González, L.F.; Kimani, P.M.; Butare, L. Genetic diversity, inter-gene pool introgression and nutritional quality of common beans (Phaseolus vulgaris L.) from Central Africa. Theor. Appl. Genet. 2010, 121, 237–248. [Google Scholar] [CrossRef]
- Burle, M.L.; Fonseca, J.R.; Kami, J.A.; Gepts, P. Microsatellite diversity and genetic structure among common bean (Phaseolus vulgaris L.) landraces from Brazil, a secondary center of diversity. Theor. Appl. Genet. 2010, 12, 801–813. [Google Scholar]
© 2013 by the authors; licensee MDPI, Basel, Switzerland. This article is an open access article distributed under the terms and conditions of the Creative Commons Attribution license (http://creativecommons.org/licenses/by/3.0/).
Share and Cite
Lioi, L.; Piergiovanni, A.R. Genetic Diversity and Seed Quality of the “Badda” Common Bean from Sicily (Italy). Diversity 2013, 5, 843-855. https://doi.org/10.3390/d5040843
Lioi L, Piergiovanni AR. Genetic Diversity and Seed Quality of the “Badda” Common Bean from Sicily (Italy). Diversity. 2013; 5(4):843-855. https://doi.org/10.3390/d5040843
Chicago/Turabian StyleLioi, Lucia, and Angela Rosa Piergiovanni. 2013. "Genetic Diversity and Seed Quality of the “Badda” Common Bean from Sicily (Italy)" Diversity 5, no. 4: 843-855. https://doi.org/10.3390/d5040843
APA StyleLioi, L., & Piergiovanni, A. R. (2013). Genetic Diversity and Seed Quality of the “Badda” Common Bean from Sicily (Italy). Diversity, 5(4), 843-855. https://doi.org/10.3390/d5040843