Article

Community Structure Characteristics of Aquatic Organisms and Their Responses to Environmental Factors in the Yunxi Area


1
PowerChina Huadong Engineering Corporation Limited, Hangzhou 311122, China
2
Nanjing Hydraulic Research Institute, Nanjing 210029, China
*
Author to whom correspondence should be addressed.
Diversity 2026, 18(9), 568; https://doi.org/10.3390/d18090568
Submission received: 21 July 2026 / Revised: 8 September 2026 / Accepted: 9 September 2026 / Published: 15 September 2026

Abstract

Urban plain river networks often suffer from ecosystem impairment due to sluggish hydrodynamics and insufficient water replenishment. This study assessed the aquatic ecosystem of the Yunxi area in Hangzhou, a river network characterized by insufficient hydrodynamics. A systematic ecological survey of phytoplankton, zooplankton, and macrobenthic communities was conducted at 11 key sites, and their potential driving mechanisms were explored by integrating physicochemical water analysis with redundancy analysis (RDA). The results indicate generally weak hydrodynamic conditions and elevated nitrogen concentrations at several sampling sites. The aquatic biological communities were characterized by relatively high abundances of several pollution-tolerant taxa, mainly including Bacillariophyta, Rotifera, Oligochaeta, and Gastropoda. Furthermore, local dominance of Cyanophyta and Cryptophyta at specific sites indicate spatial variation in community composition. RDA further indicated that organic pollution and nutrient enrichment were closely associated with variations in aquatic community composition. According to the observed community patterns, the weak water exchange combined with nutrient and organic-matter enrichment may be associated with variations in the aquatic community composition. Therefore, targeted ecological water supplementation might be useful to enhance the regional hydrodynamic conditions, increase water exchange and reduce pollutant accumulation.

1. Introduction

Urban plain river networks play a crucial role in regulating regional microclimates, managing stormwater, and maintaining aquatic biodiversity [1,2]. However, rapid urbanization and intensive human interventions have severely fragmented these hydrological systems [3,4]. One of the major issues in these ecosystems is the decrease in urban river network water ecological resistance [5]. The modification of natural channels and the construction of artificial water regulating structures usually lead to slow water flow, resulting in weak hydrodynamics and a reduced ability for natural water supply [6].
The decline of hydrodynamic conditions seriously endangers the water environment and disturbs the living conditions [7]. The slow water flow restricts the physical dilution and self-purification capability of the water body, thus promoting the accumulation of water pollutants, such as high concentrations of oxidizable substances and other organic matters [8,9]. Therefore, these physical and chemical stress factors act as strong environmental filters, affecting the survival, reproduction and spatial distribution of aquatic organisms, from primary producers like phytoplankton to primary consumers and benthic animals [10,11]. It is significant to clarify the intricate relationship between poor water circulation and the community structure of aquatic organisms for accurately judging the health state of the ecosystem [12]. Various studies abroad also found that there was a decrease in aquatic species diversity and a change towards more tolerant species in urban streams due to the combined effects of hydrological, habitat and water-quality changes. In the present study, we examined phytoplankton, zooplankton and zoobenthos; however, fish communities were not investigated during the fieldwork [13,14,15].
The Yunxi area in Hangzhou is a typical example of an urban plain river network with a complex network of interconnected waterways and surrounding wetlands. Although this area possesses great ecological significance, it is now confronted with severe environmental barriers mainly because of the serious lack of hydrodynamics and inadequate external water replenishment capacity. These hydrological limitations may contribute to prolonged water retention periods, local habitat degradation and heightened sensitivity to environmental disturbances, such as nutrient enrichment, organic pollution, hypoxia, and altered flow conditions, which arouses great concern regarding the stability of the local aquatic ecosystem.
To address this critical knowledge gap, this study aims to comprehensively evaluate how limited hydrodynamics and poor water replenishment capacity impact the overall aquatic ecology of the Yunxi area. Specifically, this study examines the spatial distribution of phytoplankton, zooplankton and zoobenthos communities and their correlations with the detected environmental conditions. The results will serve as a scientific reference for the hydrodynamic reconstruction and ecological water-supply plans in urban alluvial river systems.

2. Materials and Methods

2.1. Study Area

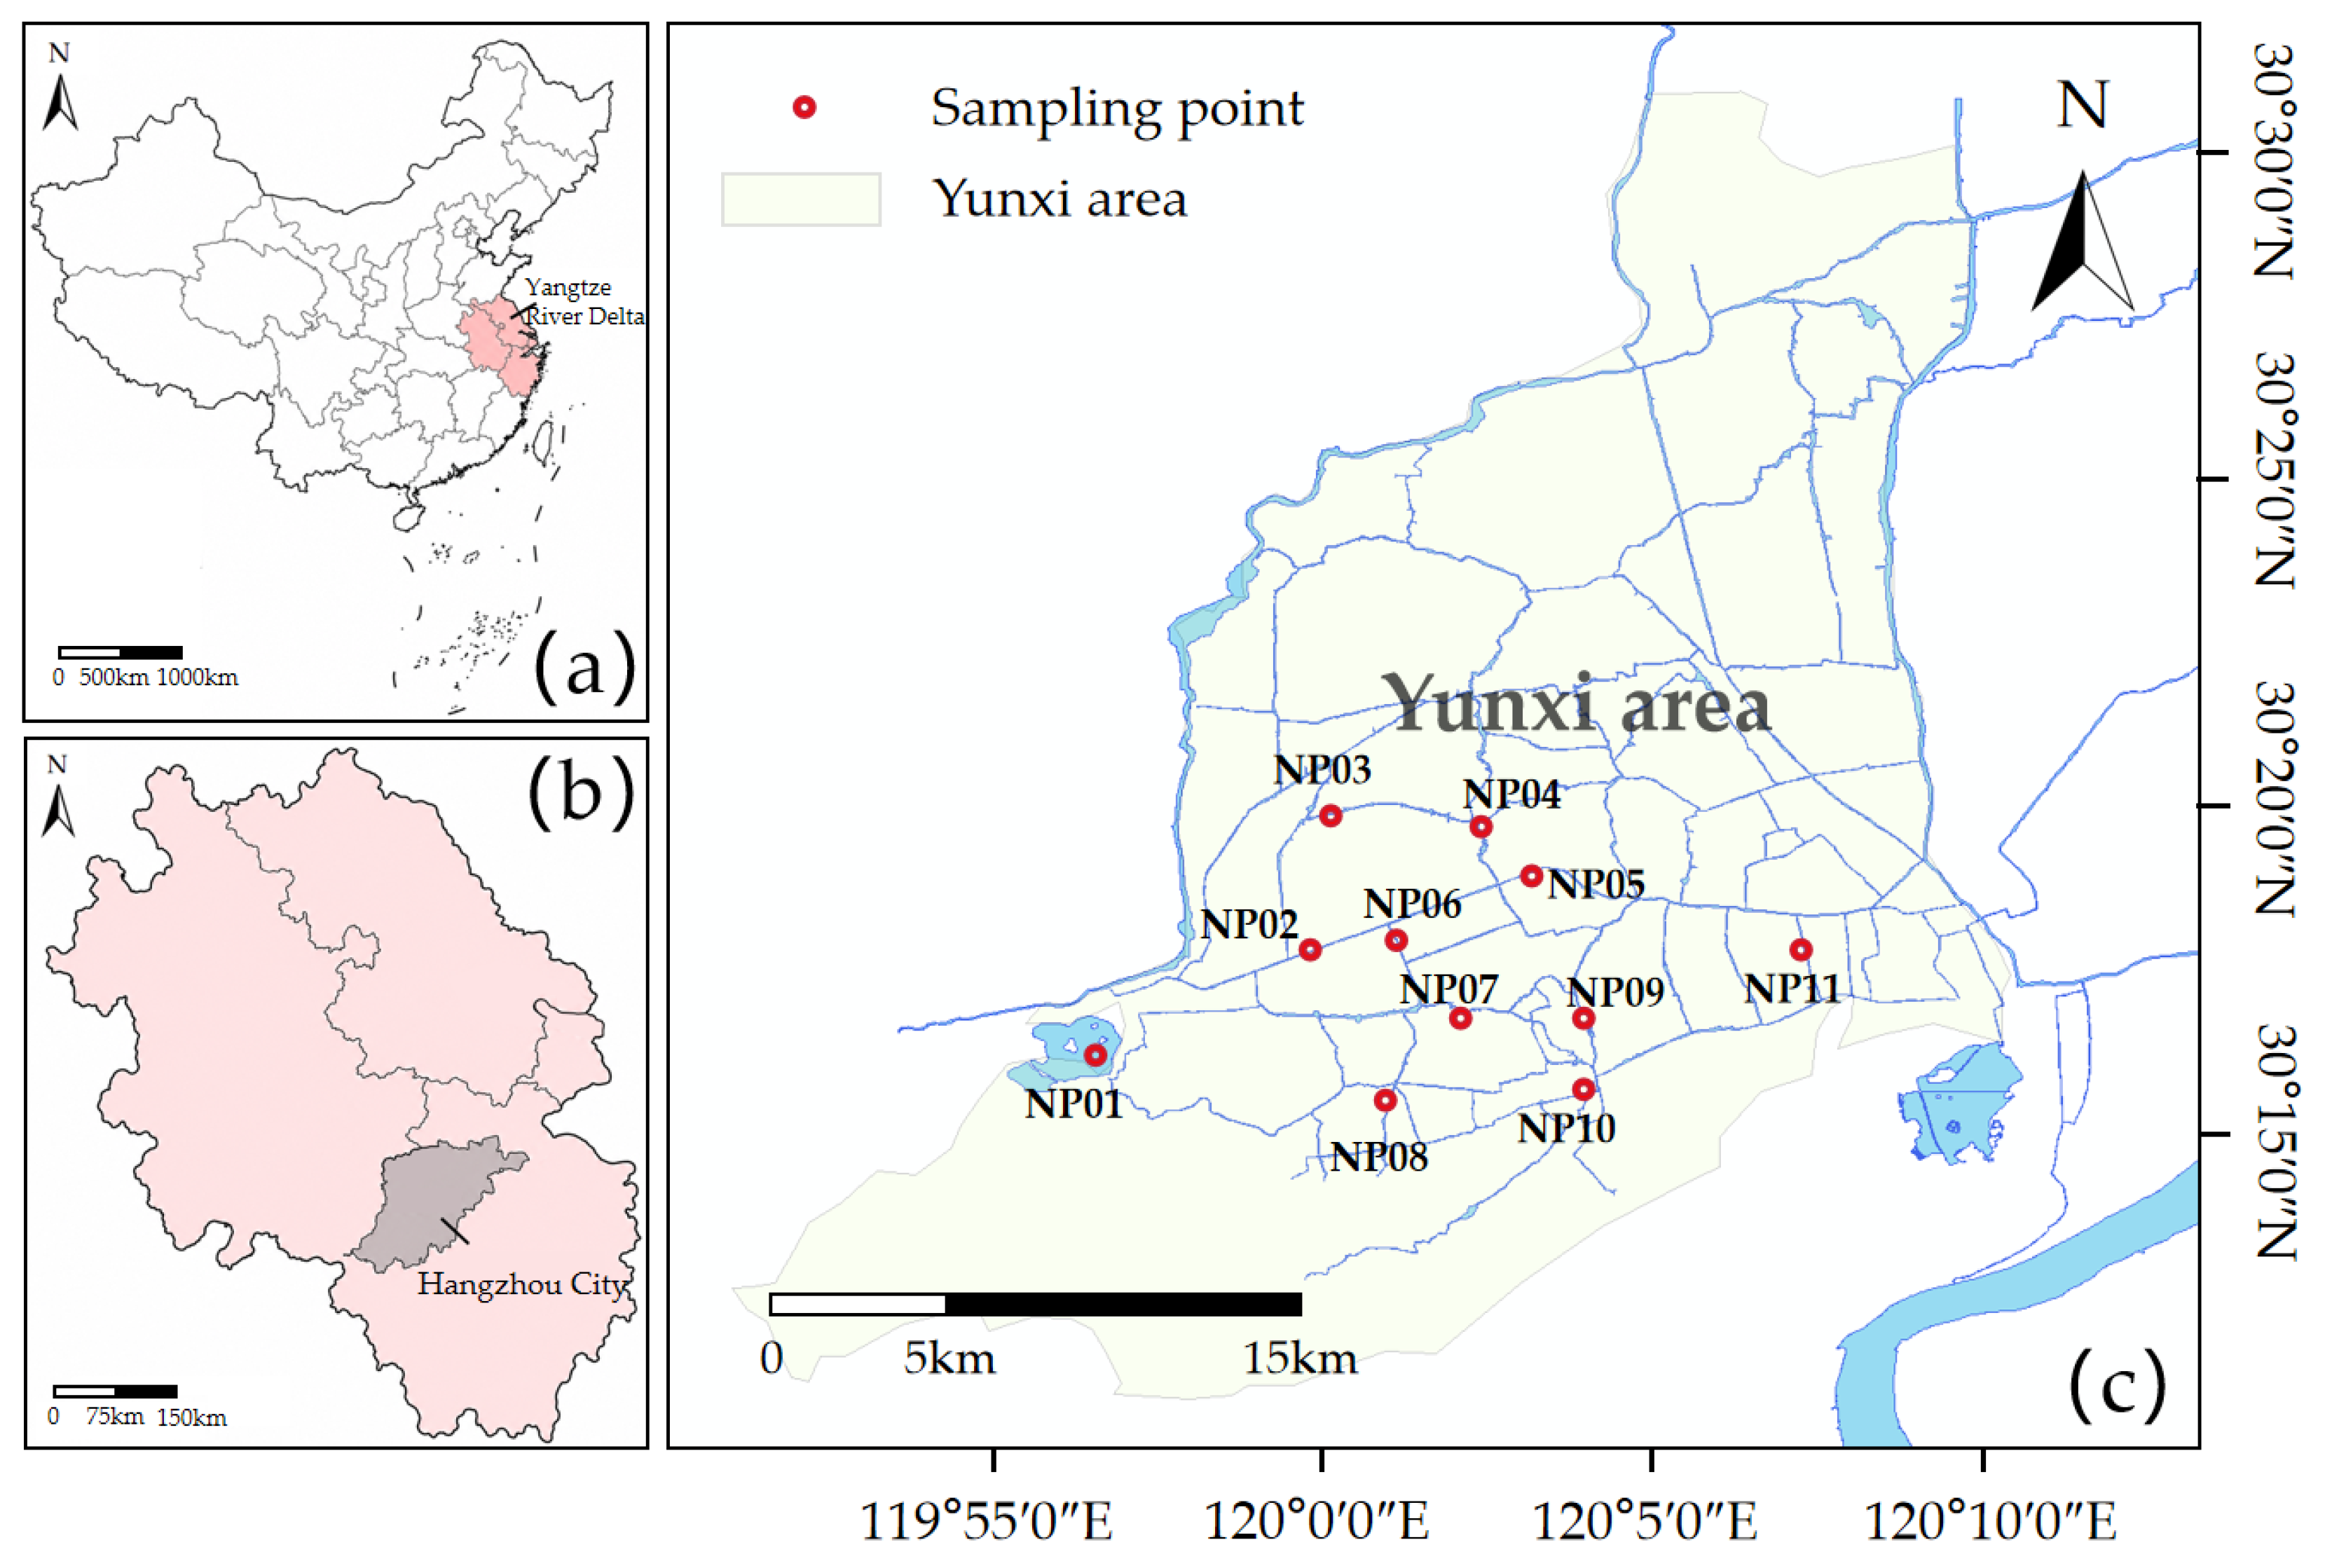
Hangzhou City is located on the southern wing of the Yangtze River Delta along the southeast coast, with its municipal area situated between latitudes 29°11′–30°34′ N and longitudes 118°20′–120°37′ E. The watershed where the study area is located is in the northeastern part of Zhejiang Province, which belongs to a typical subtropical monsoon climate zone characterized by a mild and humid climate with abundant rainfall. The multi-year average annual precipitation in this region is approximately 1206 mm. While the spatial variation in precipitation is relatively small, its intra-annual and inter-annual distributions are highly uneven.
This study focuses on the Yunxi area of the Hangjiahu Plain as the core investigation region. Its geographical boundaries extend to the East Tiaoxi River in the west, the Beijing-Hangzhou Grand Canal in the east, the Hangzhou city boundary in the north, and the mountainous water divide in the south, covering a total area of approximately 510 km2, as shown in Figure 1. This area is characterized by a plain river network geomorphology, with a dense internal water system and numerous water conservancy projects. Although the overall water diversion and drainage functions are relatively well-established, the actual volume of diverted and drained water is small.
Figure 1. Study area: (a) China region, (b) the Yangtze River Delta and the Hangzhou city, and (c) the Yunxi river network with sampling sites NP01–NP11 (Geographical locations are presented in Table 1).
Diversity 18 00568 g001
Table 1. Geographical coordinates at each sampling site in the study area.
SitesCoordinate
NP0130.2523116 N, 119.814122 E
NP0230.2904823 N, 119.988053 E
NP0330.3273356 N, 119.999875 E
NP0430.3237377 N, 120.032071 E
NP0530.3109270 N, 120.044144 E
NP0630.2938332 N, 120.012811 E
NP0730.2770777 N, 120.029196 E
NP0830.2544843 N, 120.010583 E
NP0930.2782879 N, 120.057763 E
NP1030.2553534 N, 120.059883 E
NP1130.2926542 N, 120.114716 E
Currently, ecological water replenishment in the Yunxi area primarily relies on the East Tiaoxi River on the western side of the watershed and the Qiantang River water diversion-to-city project on the southern side. The water flow generally exhibits a west-to-east and south-to-north pattern. However, due to the intricate and complex alignment of the river channels within the plain, which significantly deviates from the main water replenishment directions of the area, there are substantial spatial variations in the hydrodynamic conditions within the region. Meanwhile, owing to the flat terrain, complex channel alignment, and limited external replenishment, non-main channels have long water-exchange cycles and slow water replacement. In addition, the area is subject to potential agricultural and urban pollution inputs, including runoff and municipal wastewater-related pressures; however, source apportionment was not conducted in this study. The superposition of water stagnation and non-point source pollution further exacerbates the comprehensive pressure on the aquatic ecological environment in the Yunxi area.

2.2. Sample Collection

The sampling and analytical procedures were as follows:
Comprehensively considering the water system characteristics and habitat heterogeneity of the study area, 11 key ecological survey sites (NP01~NP11) were established in main rivers such as Nanhu Lake, Jiuquyanggang, Yuhangtang River, and Yanshan River, as well as the surrounding wetlands. Field sampling was conducted on 8–9 April 2024. Each site was sampled once during this survey, and all measurements and biological collections were conducted within the same designated site area.
Following relevant water environment monitoring specifications, an Acoustic Doppler Current Profiler was used to measure flow velocity (v), and portable dissolved oxygen meters and turbidimeters were used for the in-situ measurement of physicochemical indicators such as dissolved oxygen (DO) and turbidity (NTU). At the same time, water samples were collected and brought to the laboratory, where an ultraviolet–visible spectrophotometer was used for the quantitative analysis of core water quality indicators such as total phosphorus (TP), total nitrogen (TN), ammonia nitrogen (NH3-N), permanganate index (CODMn), and chlorophyll a (Chl-a).
The collection, fixation, and identification of aquatic biological specimens were strictly carried out in accordance with relevant specifications:
(1)
Phytoplankton
Qualitative phytoplankton samples were collected using a No. 25 plankton net (64 μm mesh), whereas quantitative samples were obtained by collecting 1 L of surface water using a water sampler. After processing, the samples were identified to the genus and species levels under an optical microscope (10 × 40 magnification), quantitatively counted, and converted into biomass based on the wet weight of the genus and species. Quantitative phytoplankton samples were fixed with 10–15 mL of Lugol’s solution, allowed to settle for 24–48 h, and concentrated to approximately 30 mL. Each sample was counted twice; when either count differed from the mean by more than 15%, a third count was performed.
(2)
Zooplankton
Water samples were collected using a 2000 mL water sampler. A 20 L water sample was filtered and concentrated to 50 mL using a No. 25 bolting cloth (64 μm mesh) and then fixed by adding 2.5 mL of formaldehyde reagent. Rotifers, cladocerans, and copepods were counted separately using a microscope, and their biomass was determined through the volume conversion method or by measuring body length and using regression equations. For rotifers, the concentrated sample was adjusted to 30 mL and two 1 mL counting chambers were counted; additional counts were made when the difference from the mean exceeded 15%. Cladocerans and copepods were concentrated to 10 mL and counted from the full quantitative sample.
(3)
Benthic animals
A Petersen grab sampler was used in deep water areas, while a combination of D-frame dip nets or quantitative frame methods was employed in shallow and wadeable areas. For D-frame sampling, the straight edge of the net was kept in contact with the bottom and moved approximately 0.5 m upstream against the current; three subsamples were collected, with a combined sampled area of at least 1 m2. The samples were washed through a 425 μm (40-mesh) sieve, fixed with 4% formaldehyde, and then transferred to a 75% ethanol solution for preservation. Taxonomic identification and counting were performed under a microscope. After sampling at each site, the sampling equipment was thoroughly rinsed and inspected to minimize cross-contamination between sites. All benthic samples were collected by the same trained field team following a standardized sampling protocol to minimize operator-related variability.

2.3. Data Analysis

Based on the collected ecological survey data, community ecology methods were utilized to investigate the current status of the aquatic ecosystem.
Dominance (Y) can represent the relative importance of different species in a community, and the calculation method for dominance is as follows:
Y = P i f i
P i = n i N
where Pi is the proportion of individuals of the i-th species to the total number of individuals; fi is the frequency of occurrence of the i-th species across all sampling sites; ni is the number of individuals of the i-th species; N is the total number of individuals in the aquatic community.
Biodiversity indices (Shannon–Wiener diversity index H, Simpson diversity index S, Pielou evenness index I, and Margalef species richness index M) are adopted, and the calculation methods for the indices are shown in Equations (3)–(6), respectively.
H = P i ln P i
S = 1 P i 2
I = P i ln P i / ln Q
M = Q 1 / ln N
where Pi is the proportion of individuals of the i-th species to the total number of individuals; Q is the total number of species; N is the total number of individuals in the aquatic community.
In this study, the Shannon–Wiener index was used for relative comparison of community diversity among sites. Pielou evenness is the ratio of the actual diversity index to the theoretical maximum diversity index. It is a relative value ranging from 0 to 1, and using it to evaluate the diversity of biological communities is more intuitive and clear. It can reflect the uniformity of the distribution of the number of individuals among various species. Pielou evenness was used to describe the relative distribution of individuals among taxa rather than as a direct measure of community stability.
Based on clarifying the biological community structure and the spatial distribution of environmental factors, mathematical and statistical analyses were conducted on the driving relationship between organisms and the environment. Redundancy Analysis (RDA) was utilized to visualize the ordination of biological samples and determine the explanatory power of key environmental constraints on community succession [16]. All multivariate statistical analyses were conducted using the ‘vegan’ package (v.2.7.2) in R software (v.4.2.2). Prior to redundancy analysis, a Detrended Correspondence Analysis (DCA) was performed on the biological data. The longest gradient length was found to be less than 3.0, indicating that the linear response model was appropriate, thereby justifying the selection of RDA over Canonical Correspondence Analysis (CCA) [17,18]. Before RDA, species data were Hellinger-transformed and environmental variables were Z-score standardized. Environmental variables with variance inflation factors (VIF) > 10 were iteratively removed to reduce multicollinearity. Because each site was represented by a single field sample and no parametric comparisons among site means were performed, normality and homogeneity-of-variance assumptions were not used as prerequisites for the ordination analysis. Pairwise associations between dominant taxa and environmental variables were additionally evaluated using Spearman rank correlations.

3. Results and Discussion

3.1. Environmental Factors Characteristics

As shown in Table 2, the physicochemical parameters across the 11 sampling sites in the Yunxi area exhibit significant spatial heterogeneity. The hydrodynamic conditions are generally sluggish, with flow velocities (v) predominantly ranging from 0 to 0.12 m/s, except for NP10 (0.4 m/s). Dissolved oxygen (DO) levels fluctuate widely between 2.79 mg/L (NP04) and 7.92 mg/L (NP10), highlighting distinct variations in local reaeration and biological oxygen consumption. The primary parameters exceeding standard limits in the Yunxi area are total nitrogen (TN) and ammonia nitrogen (NH3-N). TN concentrations range from a minimum of 1.13 mg/L (NP01) to a maximum of 6.02 mg/L (NP02), while NH3-N concentrations vary from 0.286 mg/L to 2.430 mg/L. Additionally, localized peaks in chlorophyll a (Chla) are observed at NP04 (10.5 μg/L) and NP01 (9.25 μg/L), indicating potential risks of phytoplankton proliferation in these specific micro-habitats.
The spatial distribution and speciation of nitrogen compounds provide critical insights into the localized environmental stressors within the urban river network. Site NP02 is particularly notable; it exhibits the highest TN concentration (6.02 mg/L) among all sites but maintains a relatively low NH3-N concentration (0.738 mg/L). This distinct ratio indicates that the nitrogen component at this location is predominantly in the form of nitrate nitrogen. A wastewater treatment facility is located near NP02; however, because no discharge measurements or source-tracing analyses were conducted, its contribution to the observed nitrogen pattern cannot be quantified in this study. Conversely, sites NP06, NP07, and NP08 suffer from severe ammonia nitrogen accumulation, with NH3-N levels reaching 2.430 mg/L, 1.630 mg/L, and 2.240 mg/L, respectively. Site NP08 is located in the Hemu Wetland, where the adjacent water quality is notably poor. The environmental degradation here is driven by complex non-point sources; the surrounding area contains construction waste and domestic garbage, while agricultural drainage from nearby farmland may also contribute nutrient inputs. The elevated NH3-N concentration at NP06 may reflect the combined influence of external pollution inputs and weak local hydrodynamics. This site receives polluted inflow from upstream areas, including the Hemu Wetland and Yaojiagang. However, its slow flow velocity and weak self-purification capacity prevent the efficient biological conversion of ammonia nitrogen to nitrate nitrogen through natural flowing water. Furthermore, the notably low DO concentration at NP06 acts as a limiting factor for nitrifying bacteria, thereby inhibiting the nitrification process and leading to the substantial accumulation of ammonia nitrogen in the water column.

3.2. Aquatic Organisms Characteristics

3.2.1. Phytoplankton

(1)
Community structure
In this quantitative phytoplankton survey, a total of 82 species belonging to 7 phyla were identified. Among them, there are 39 species of Bacillariophyta, accounting for 47.56% of the total species; 22 species of Chlorophyta, accounting for 26.83%; 7 species of Euglenophyta, accounting for 8.54%; 6 species of Cyanophyta, accounting for 7.32%; 3 species of Cryptophyta and 3 species of Dinophyta, each accounting for 3.66%; and 2 species of Chrysophyta, accounting for 2.44%. The measured algal cell density in this survey ranged from 19,352.86 to 1,700,484.07 cells/L, with an average of 190,891.95 cells/L. The algal cell density was mainly composed of Bacillariophyta, Cyanophyta, and Cryptophyta, with average proportions of 49.30%, 29.33%, and 9.76%, respectively. The proportion of each phytoplankton phylum is shown in Figure 2.
The phytoplankton community in the Yunxi area exhibits high taxonomic diversity, with Bacillariophyta occupying an absolute dominant position in terms of both species richness and density proportion. Diatoms have a wide range of adaptation to light and temperature, and their widespread distribution indicates that this plain river network generally still maintains basic benthic or water-mixing characteristics. However, the extreme spatial heterogeneity of the total community density (averaging 190,891.95 cells/L, reaching a maximum of 1,700,484.07 cells/L) indicates marked spatial differences in community density. For example, the total algal cell density at site NP01 showed an extreme peak and was almost entirely composed of diatoms, indicating a relatively sluggish water exchange rate in this water body.
Meanwhile, the localized outbreaks of Cyanophyta and Cryptophyta at specific sites have become important biological signals of habitat deterioration. At sites such as NP08, NP10, and NP11, cyanobacteria with buoyancy regulation mechanisms are the dominant taxa, as they easily establish a competitive advantage in areas with stagnant water flow and insufficient hydrodynamics [19,20]. In contrast, site NP03 exhibited an abnormal structure absolutely dominated by Cryptophyta, which possess strong phototaxis and rapid heterotrophic assimilation capabilities, reflecting severe organic matter enrichment and habitat stress in this localized water body [21].
This spatial succession from widespread diatom dominance to localized dominance by opportunistic taxa such as cyanobacteria and cryptophytes directly reflects the microhabitat deterioration within the complex urban river network caused by hydrodynamic deficiency and slow water replacement. These observations suggest that breaking up stagnant and slow-flowing zones and optimizing active water dispatching could be evaluated as potential management options to inhibit the abnormal proliferation of opportunistic algae and restore the ecological health of the system.
(2)
Species diversity
As the primary producers of living organisms in aquatic environments, changes in the composition and diversity of phytoplankton will directly affect the structure and function of river and lake ecosystems.
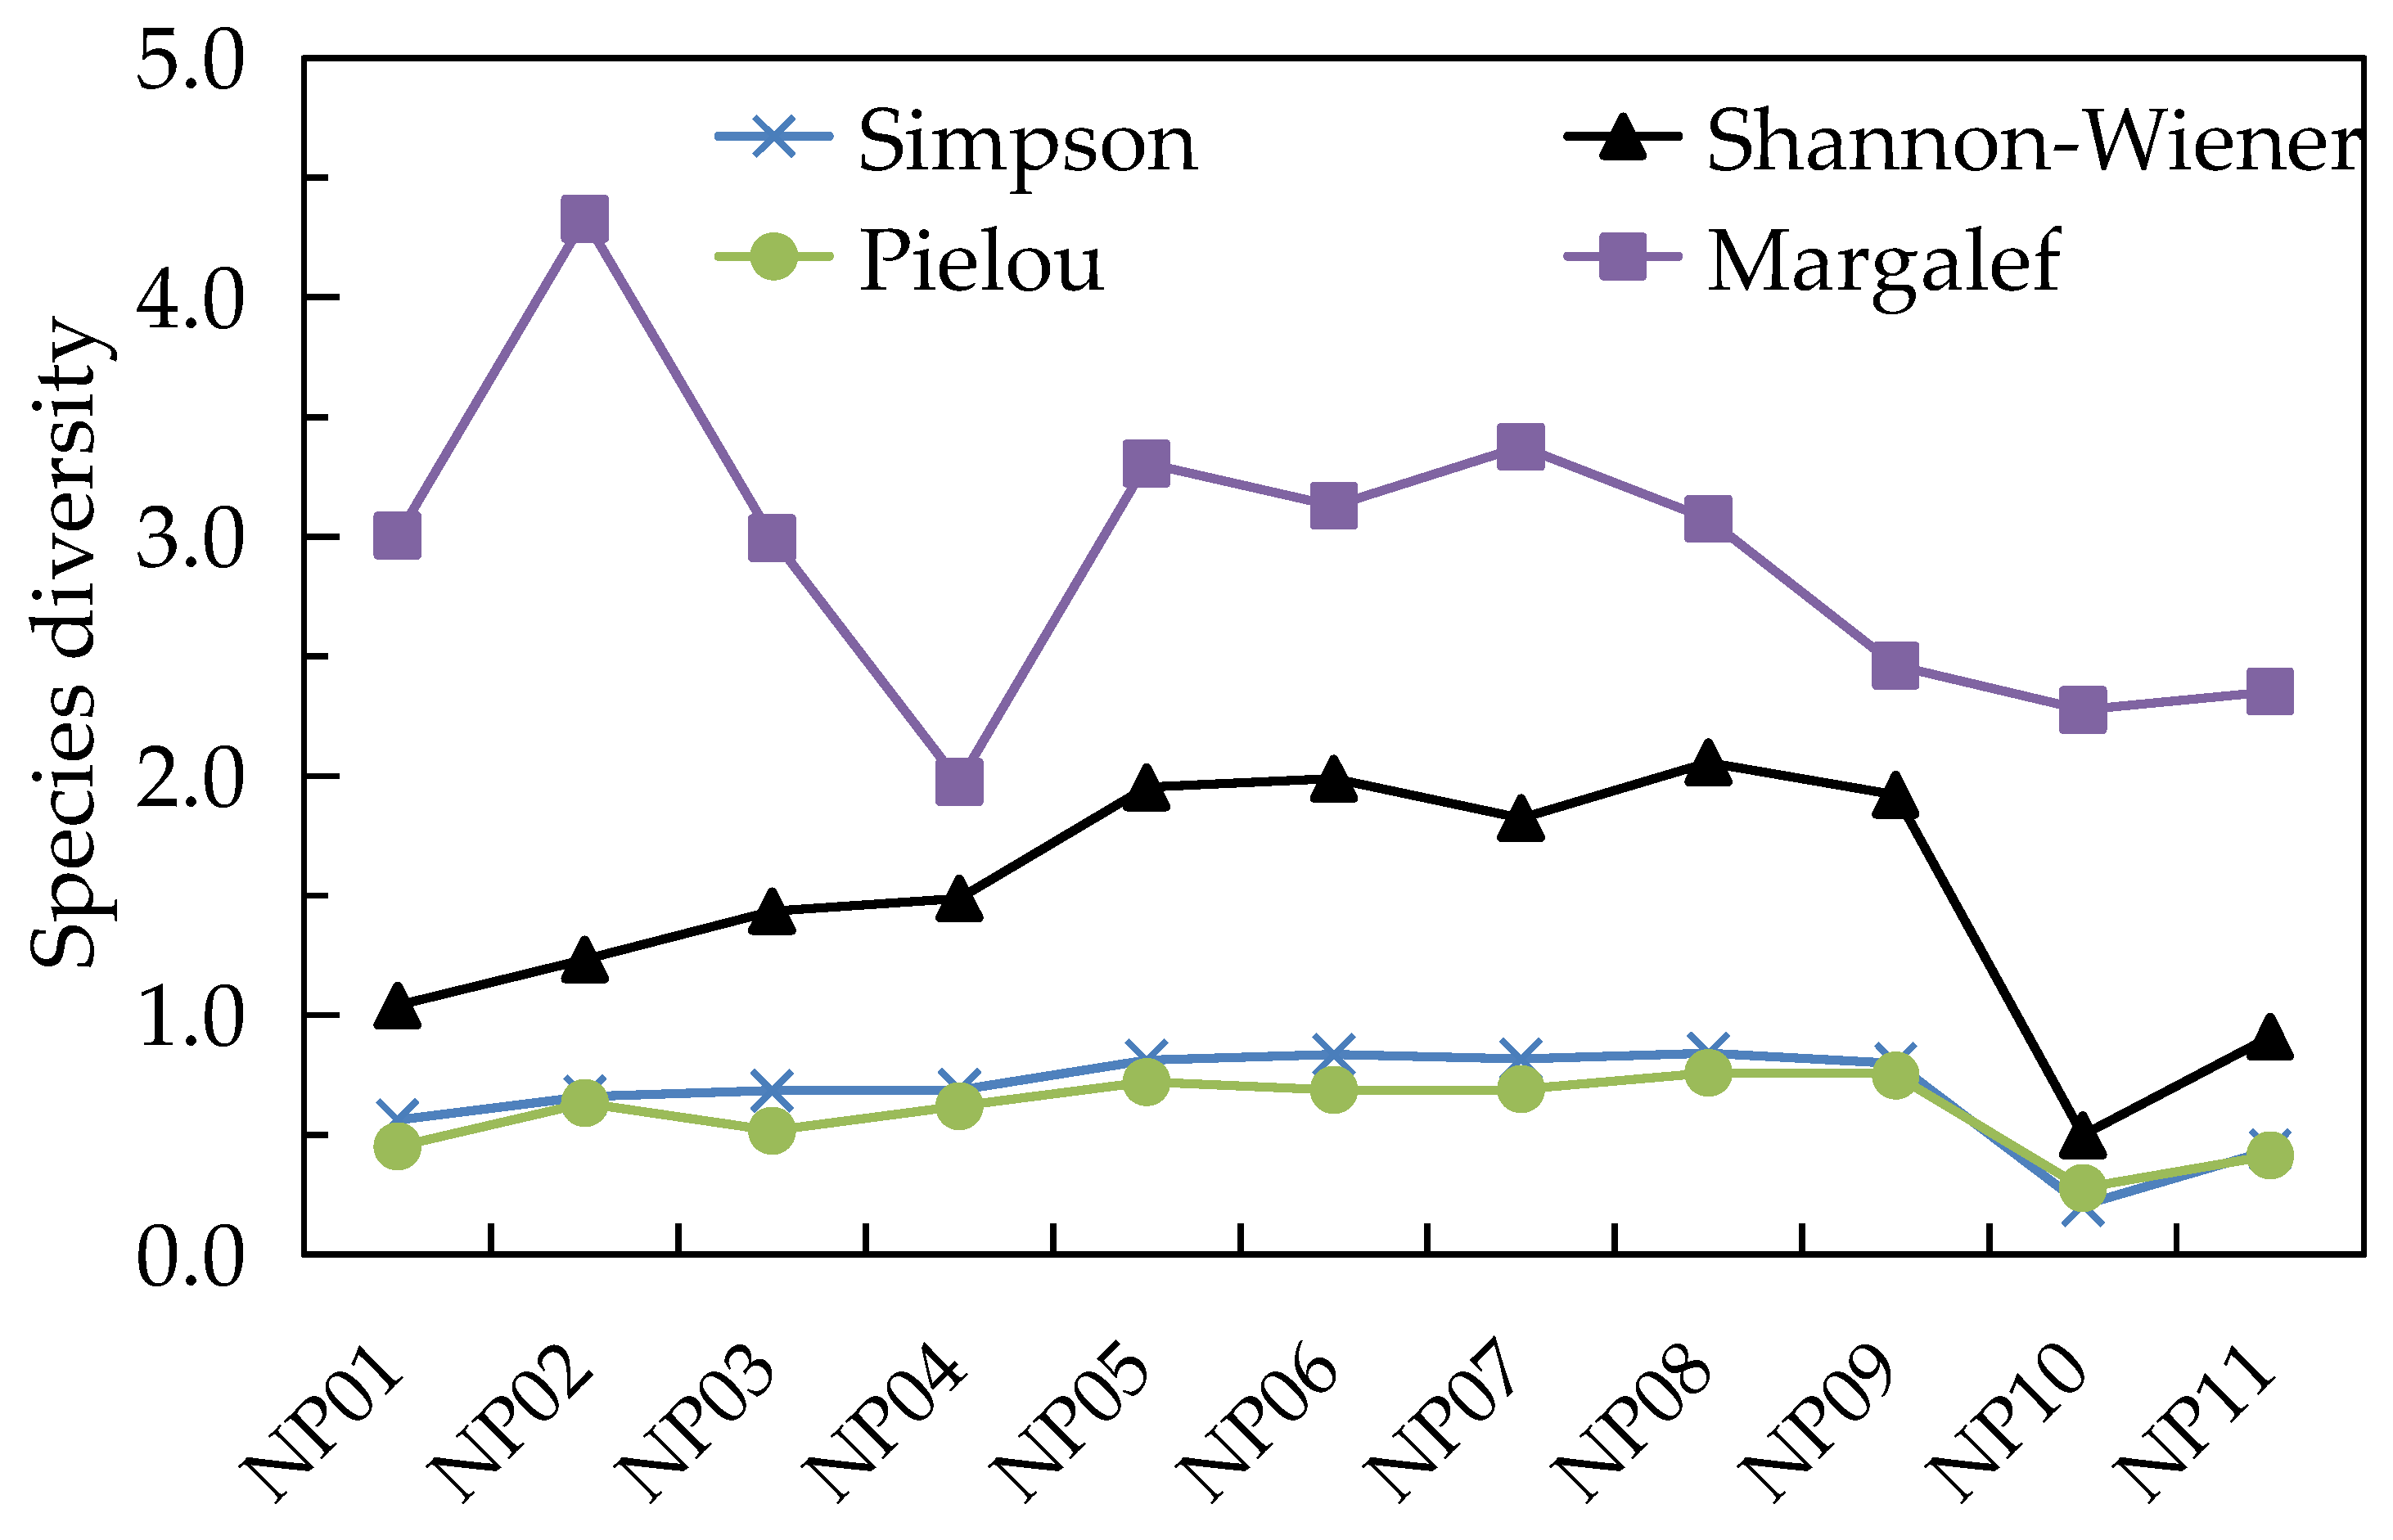
The calculation results of phytoplankton diversity indexes are shown in Figure 3. The survey results show that the average Shannon indices for NP01 and NP03 are less than 1, indicating relatively low phytoplankton diversity at these sites. The evenness values are all greater than 0.3 and describe the distribution of individuals among taxa.
The spatial variability of phytoplankton diversity indices describes spatial differences in community structure within the Yunxi urban river network. The relatively low values of the Shannon–Wiener and Pielou evenness indices at specific sites, notably NP01, NP03, and NP08, indicating that a single species may be proliferating in large numbers. At these sites, the observed composition may reflect environmental conditions favoring the rapid proliferation of specific pollution-tolerant or opportunistic taxa. This monopolization of available resources leads to a sharp decrease in community evenness and overall structural complexity. Furthermore, while the remaining sites exhibit characteristics of lightly to moderately polluted waters, the persistent spatial fluctuations across all evaluated indices—including Simpson and Margalef—underscore an underlying fragility in the aquatic ecosystem. The compromised stability of the biological community across the network suggests that sluggish hydrodynamics and organic accumulation continuously undermine ecological resilience. Consequently, disrupting these isolated, stagnant zones through targeted hydrodynamic improvements is essential to restore species evenness, mitigate the dominance of pollution-tolerant algae, and rebuild a robust, self-sustaining primary producer community.
(3)
Dominant species
In this survey, there were 3 dominant algal species across the sites, mainly belonging to Cyanophyta, Cryptophyta, and Bacillariophyta. The dominant species were Cyclotella meneghiniana with a dominance of 0.67, Cryptomonas sp. with a dominance of 0.02, and Planktolyngbya subtilis with a dominance of 0.08, as shown in Table 3. Among them, Bacillariophyta are widely distributed in fresh and brackish waters, are highly adaptable to temperature and light, and prefer to live in water bodies rich in organic matter and nitrogen. They are extremely common dominant species in traditional high-yield fertilized fish ponds in China, and Cyclotella meneghiniana within Bacillariophyta is a representative species of eutrophic water bodies. Similarly, Planktolyngbya subtilis, as a species of Cyanophyta, prefers high temperatures, strong light, high pH, and still water, as well as low nitrogen and high phosphorus conditions. Although Cryptophyta do not have many species, they are extremely adaptable to temperature and light and can form dominant species in both summer and winter. They prefer to live in water bodies rich in organic matter and nitrogen. The results of this survey show: phytoplankton species are mainly dominated by Bacillariophyta, Chlorophyta, Cyanophyta, and Euglenophyta, among which Bacillariophyta holds an absolute dominance. The phytoplankton density is relatively abundant, while the variation in the types of dominant species is not obvious.

3.2.2. Zooplankton

(1)
Community structure
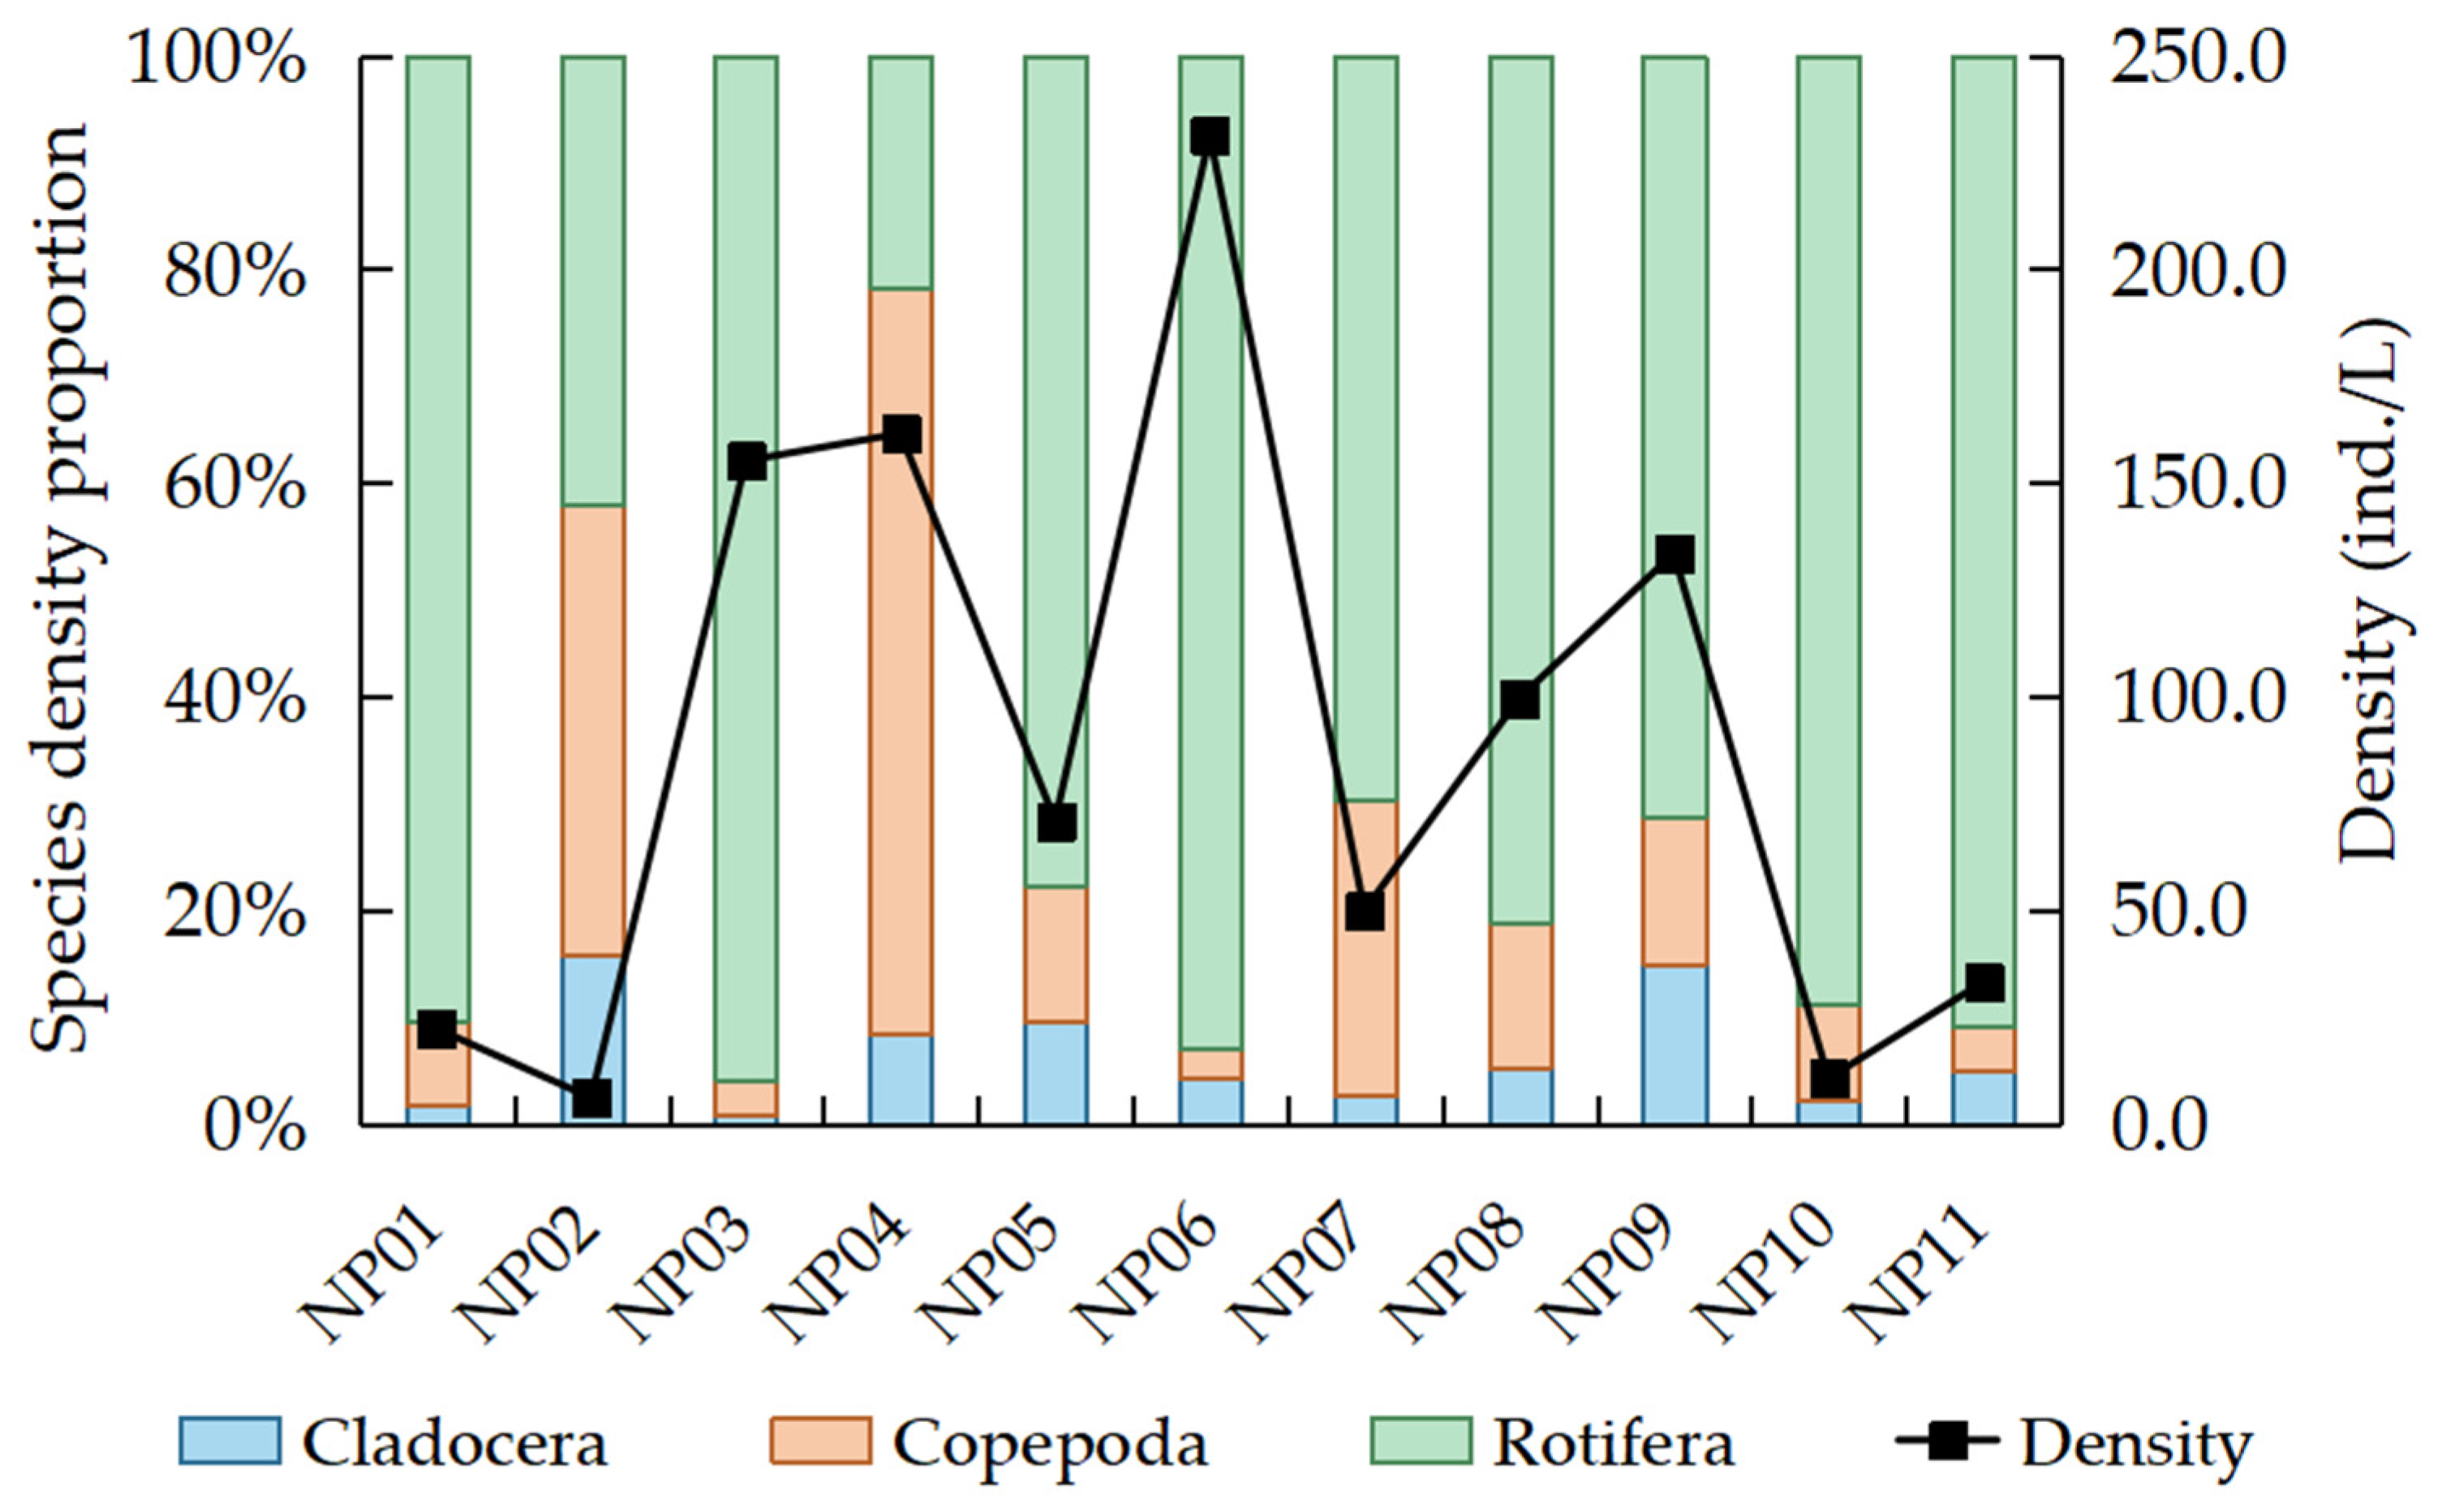
In this quantitative zooplankton survey, a total of 41 zooplankton taxa or developmental-stage records were identified Among them, there are 13 taxa of cladocerans, accounting for 31.71% of the total; 13 taxa of copepods, accounting for 31.71% of the total; and 15 taxa of rotifers, accounting for 36.59% of the total. The measured zooplankton density in this survey ranged from 5.93 to 231.20 ind./L, with an average value of 88.43 ind./L. The zooplankton density in descending order is rotifers, cladocerans, and copepods. Rotifers hold an absolute majority at the remaining sites except for NP03 and NP06, while copepods account for the main quantity at the two sites of NP02 and NP04. The zooplankton density and the proportion of taxonomic groups are shown in Figure 4.
The zooplankton community in the Yunxi area is an effective biological marker of the existing hydrological and physicochemical stress factors. The abundant occurrence of rotifers, which have the highest density in most sampling points, indicates the usual ecological characteristics of a nutrient-rich and slow-moving urban river system [22]. As opportunistic r-strategists with rapid reproduction cycles, rotifers have a special competitive advantage in utilizing suspended particles, bacteria and organic remains [23]. The very high density observed at site NP06, mainly due to the increase in rotifers, corresponds well with the previous findings of severe local organic and ammonia nitrogen pollution. The sluggish water flow and reduced self-purifying ability provide a favorable environment for these pollution-tolerant and small-sized species to grow exponentially [24].
In contrast, the uneven distribution of copepods at sites like NP02 and NP04 implies the existence of different micro-habitats. Copepods, being larger crustaceans with more complicated life cycles, usually need a longer development period and are more sensitive to severe environmental deterioration or hypoxia than rotifers [25,26]. In conclusion, the current condition of the aquatic ecosystem is impaired due to the reduction in the size of zooplankton, especially the decline of large cladocerans and the absolute domination of adaptable rotifers. Restoring hydrological connectivity could be considered as a potential option to remove the concentrated nutrients and to rebuild a balanced and diverse aquatic food web.
(2)
Species diversity
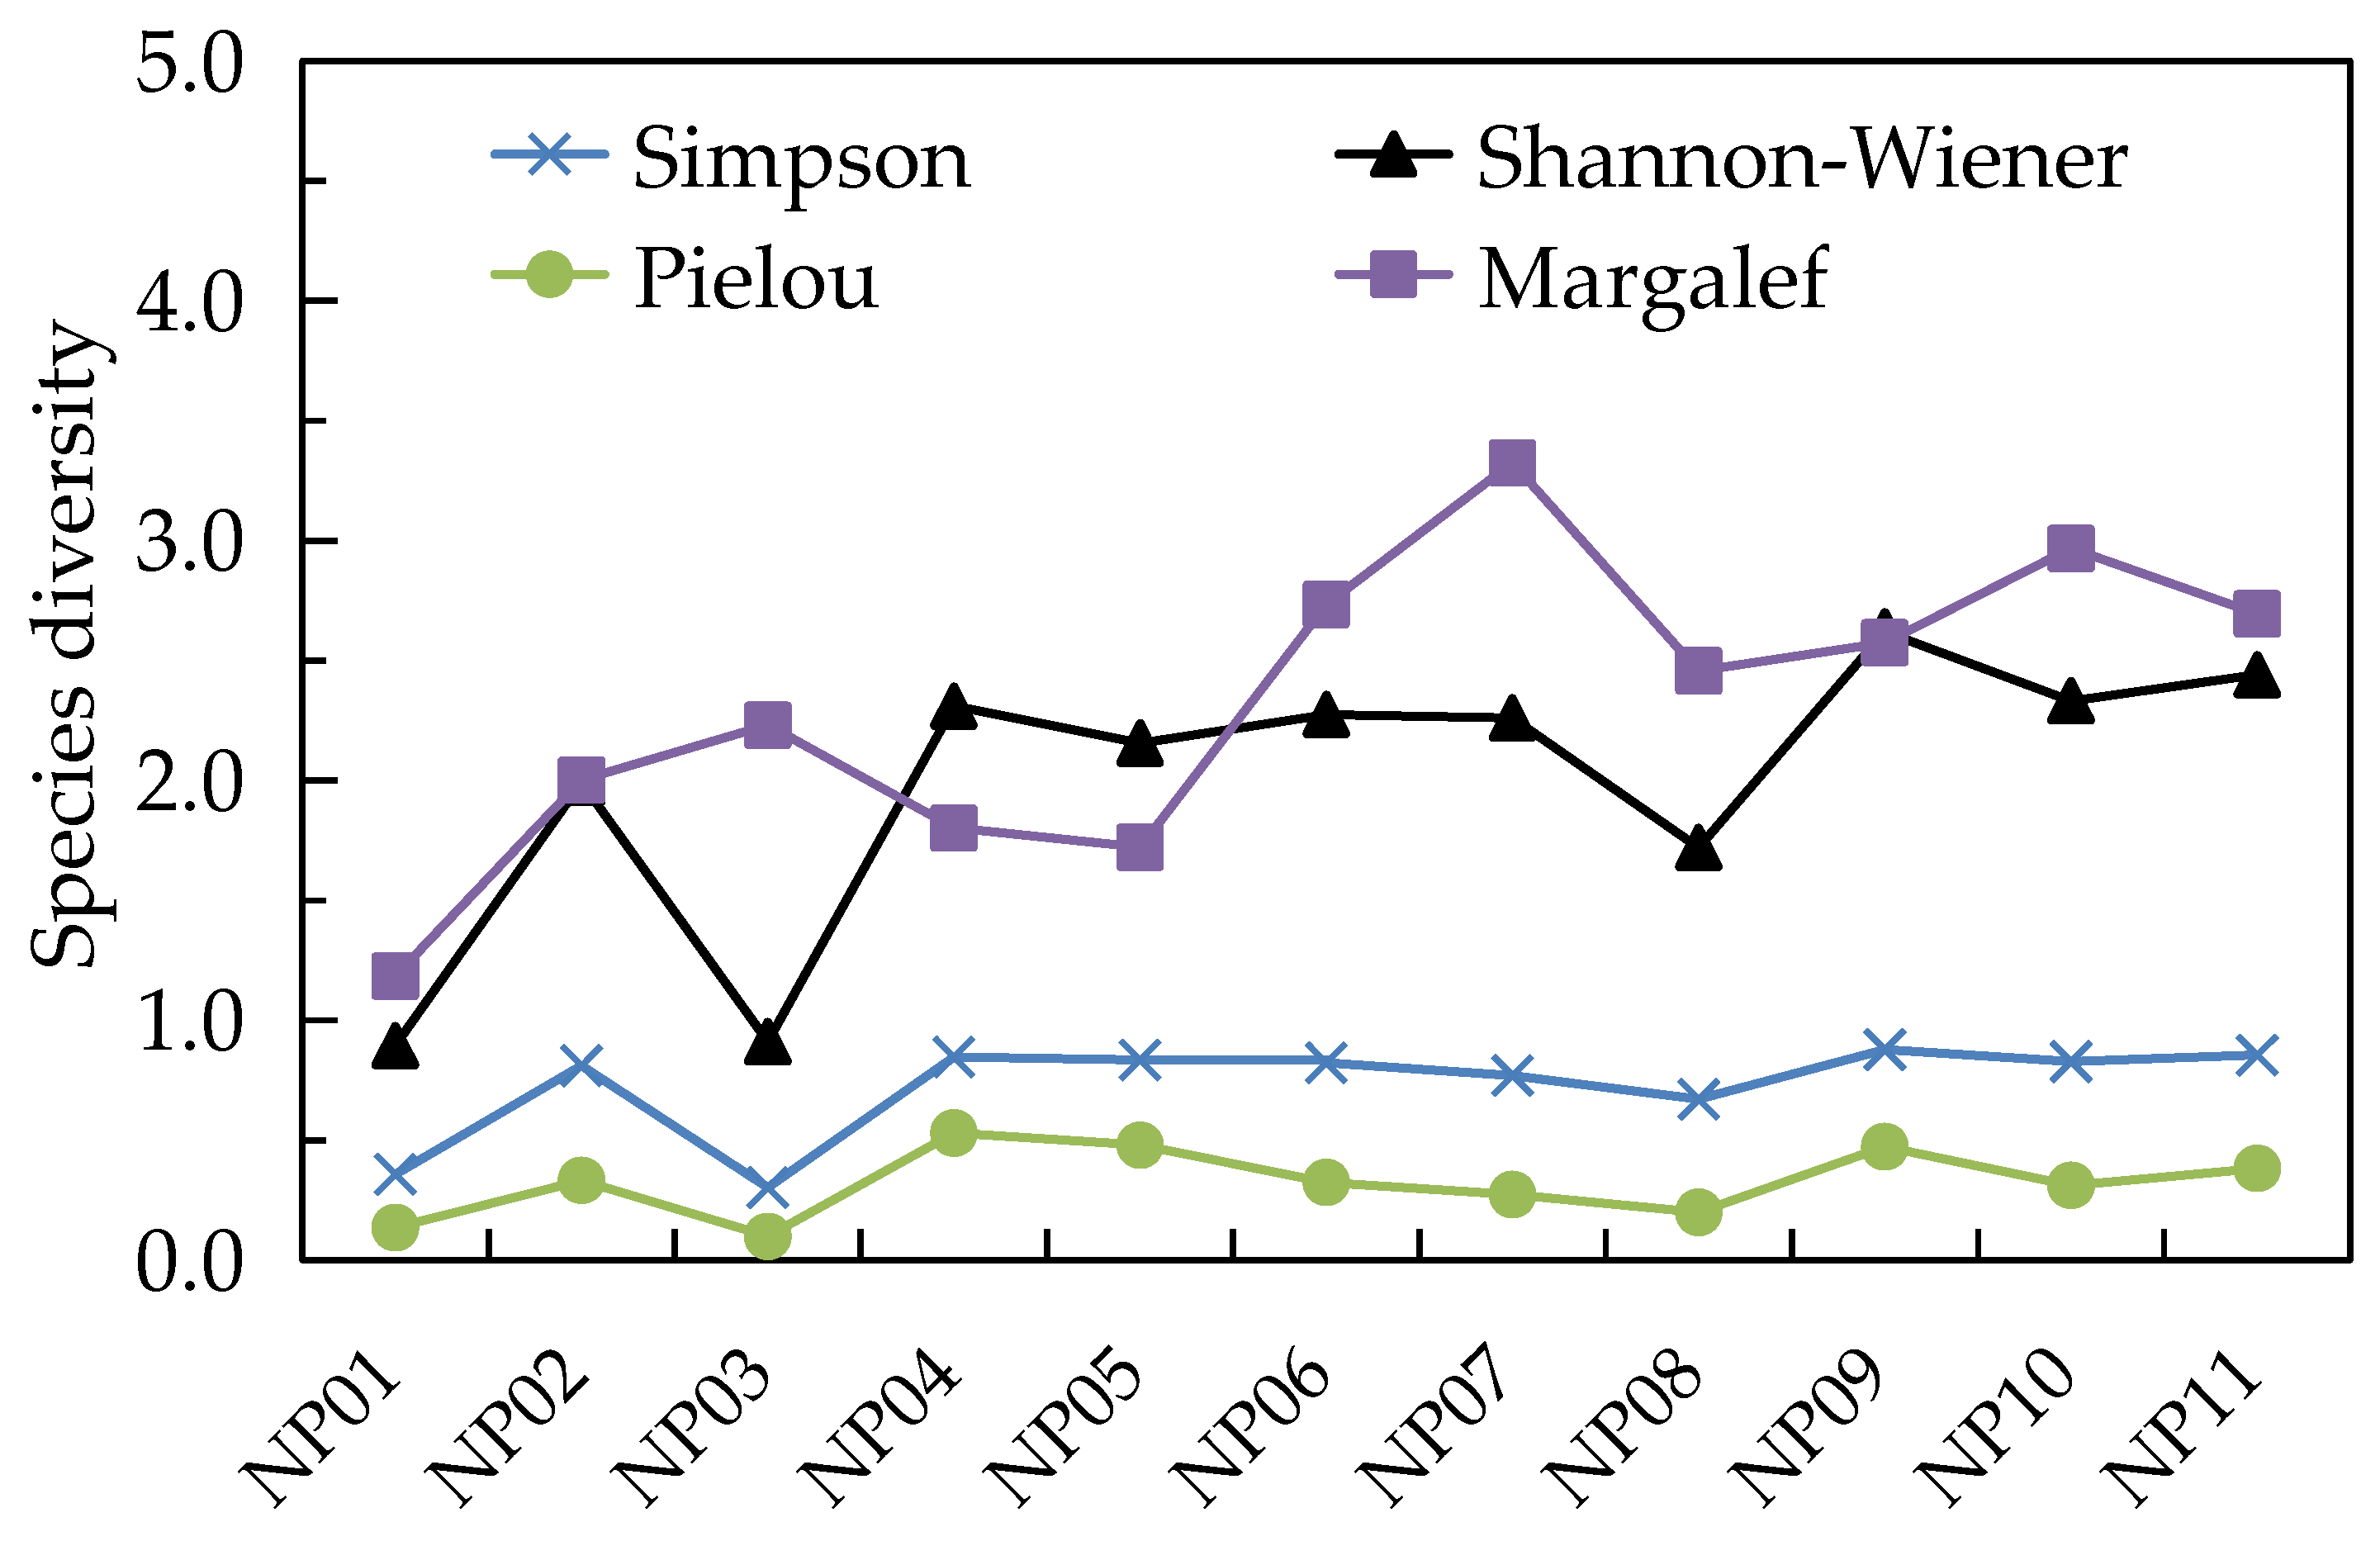
The zooplankton diversity indices can reflect the ecological environment and the spatial distribution of the Yunxi river system. The zooplankton diversity values are depicted in Figure 5. The Shannon–Wiener index varied among sites, indicating spatial differences in zooplankton diversity. Although there are some environmental changes, the Pielou evenness index is greater than 0.3 at most sampling points. The relatively high evenness at most sites indicates a comparatively even distribution of individuals among the recorded zooplankton taxa.
However, variation among these indices indicates spatial heterogeneity in zooplankton community structure. NP10 showed comparatively low Shannon–Wiener diversity and Pielou evenness, indicating locally reduced zooplankton diversity and evenness. Furthermore, the increase in Margalef richness index, reaching its peak at NP02 and then dropping rapidly in the network, reveals great spatial heterogeneity. These local structural abnormalities emphasize the need for enhancing the continuous hydrological connection to reduce local pollution and integrate the river system.
(3)
Dominant species
There were 8 dominant zooplankton taxa, as shown in Table 4, which were Polyarthra trigla with a dominance of 0.12, Keratella cochlearis (spineless form) with a dominance of 0.11, Bosmina longirostris with a dominance of 0.04, Mesocyclops leuckarti with a dominance of 0.07, Cyclopoida copepodites with a dominance of 0.07, Nauplii with a dominance of 0.02, Asplanchna sp. with a dominance of 0.04, and Keratella cochlearis (spined form) with a dominance of 0.06. The composition of dominant species serves as a clear bio-indicator of the current water quality. Genera such as Asplanchna, Keratella, and Polyarthra within the rotifers are widely recognized as pollution-tolerant species. Furthermore, the dominant cyclopoid copepods are highly adapted to living in moderately polluted water bodies. The relatively high abundance of several tolerant taxa is consistent with the nutrient-enriched and slow-flow conditions observed at several sites.

3.2.3. Zoobenthos

(1)
Community structure
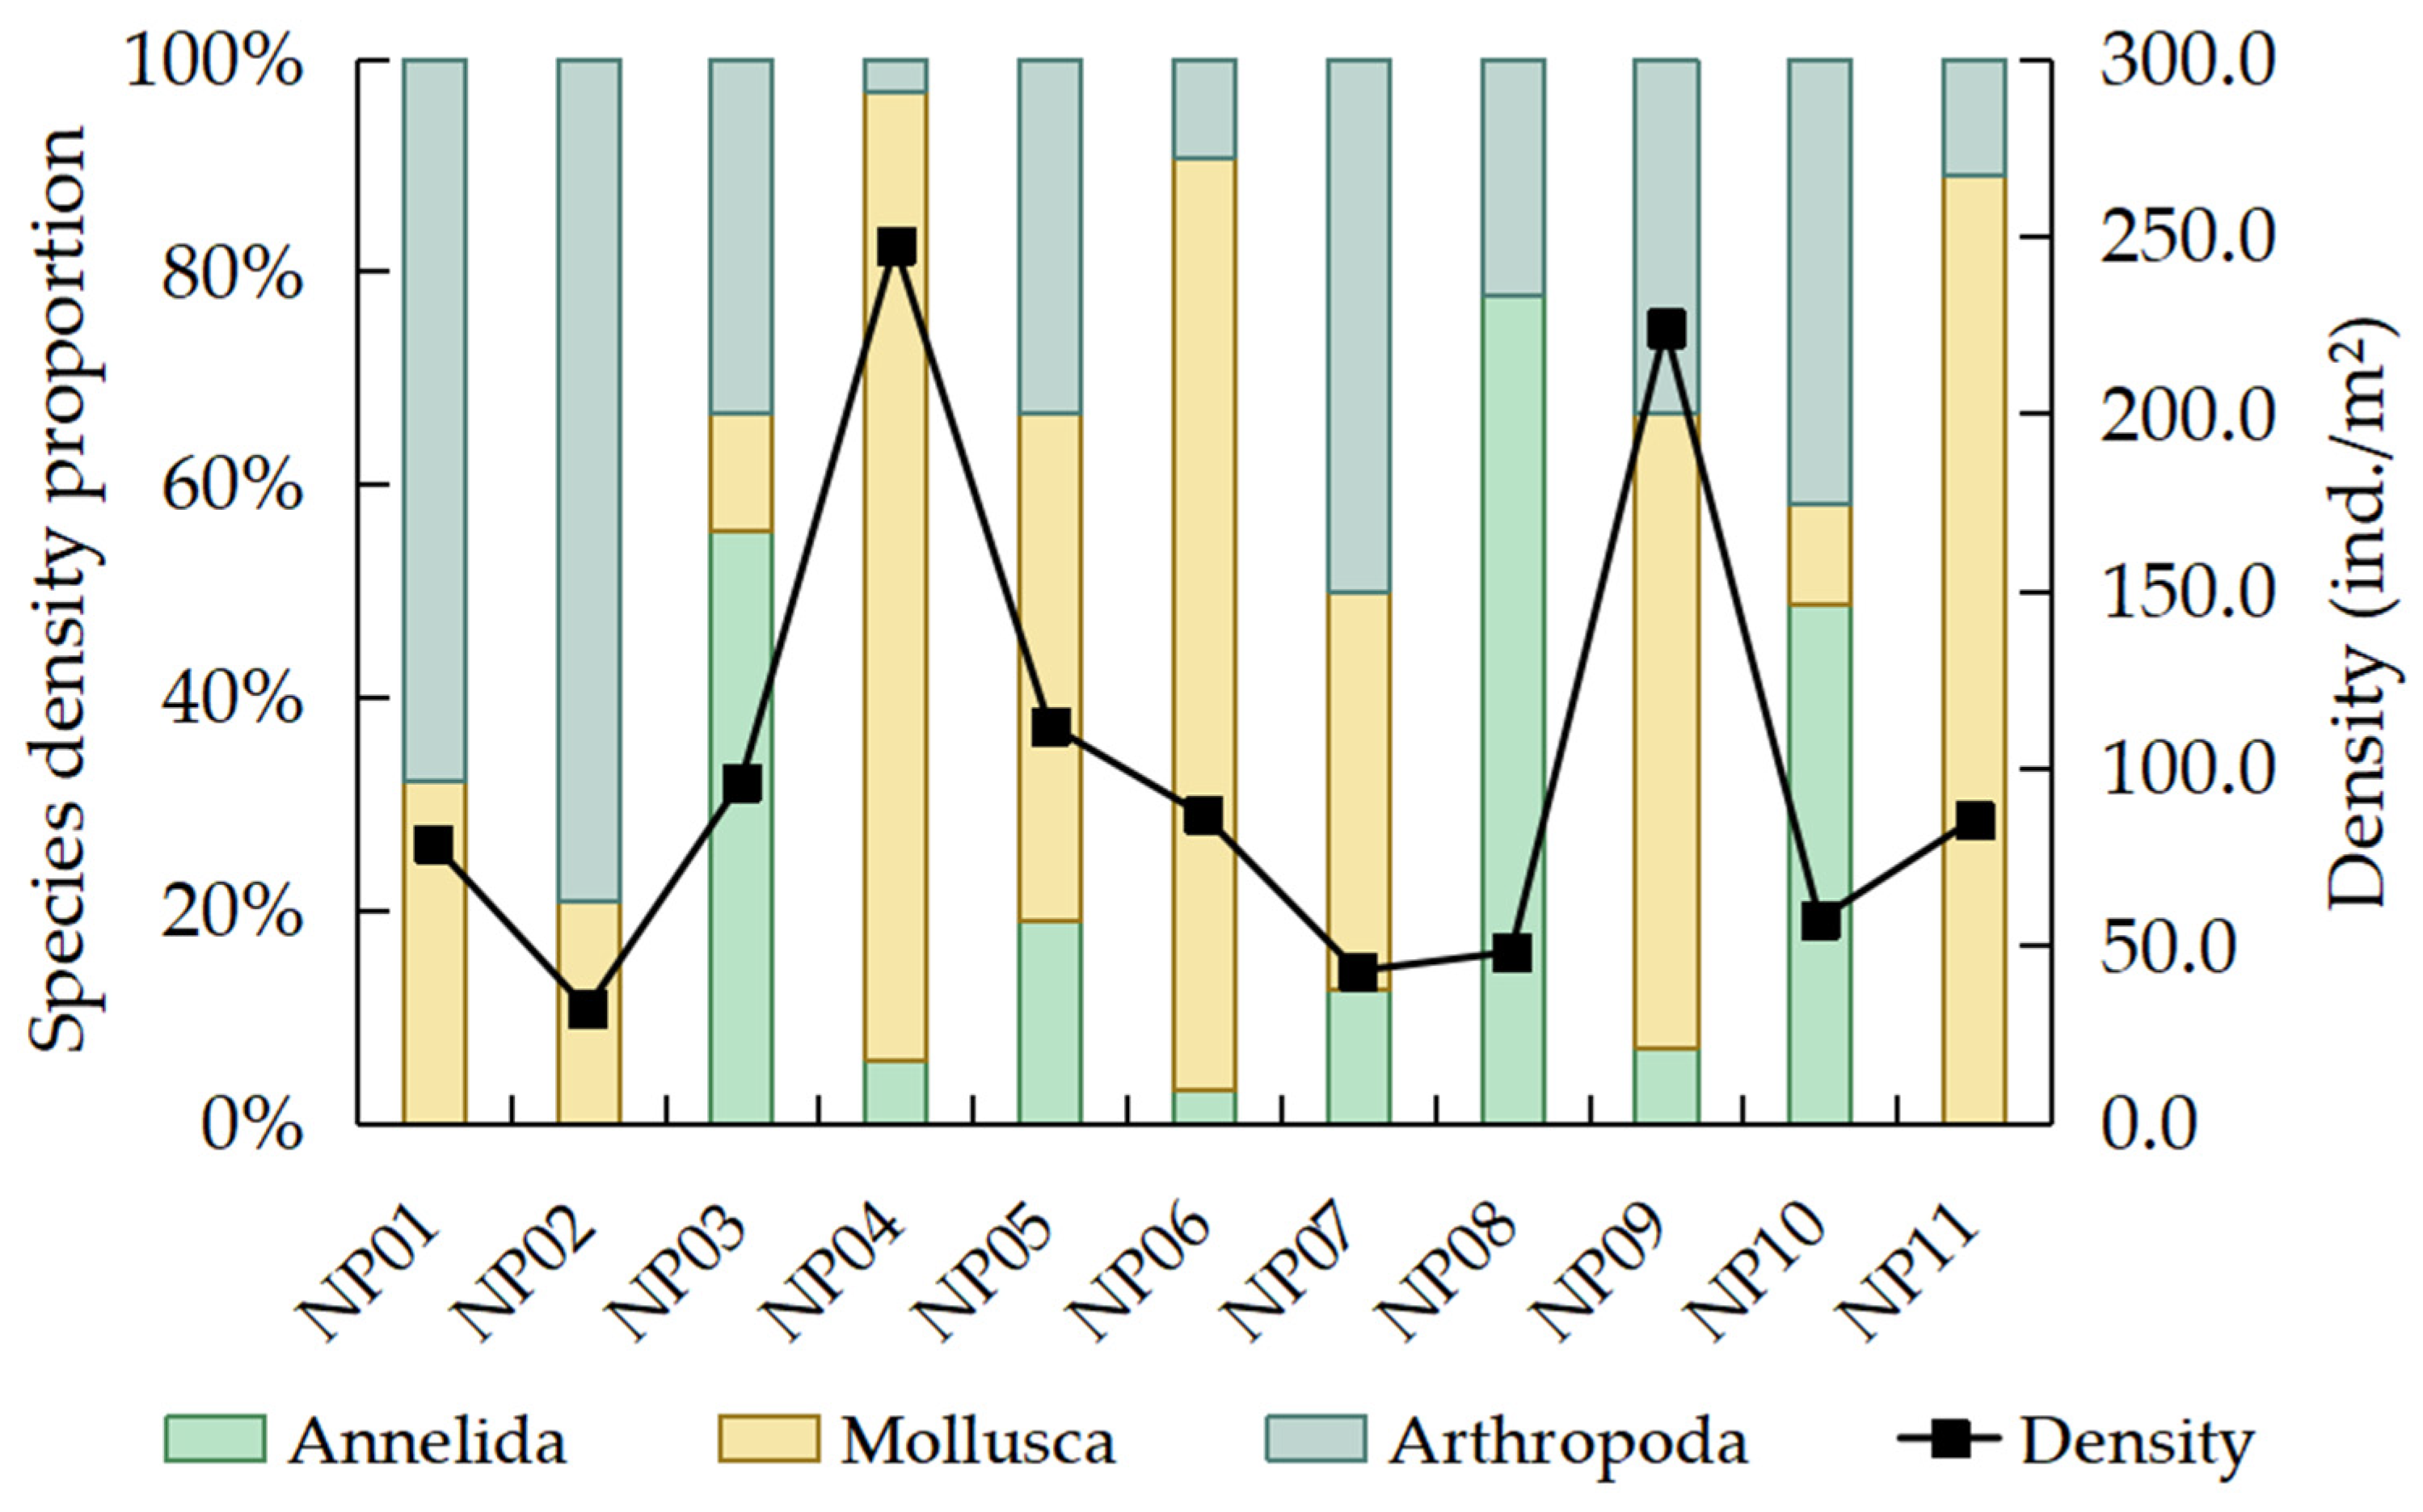
In this quantitative benthic animal survey, a total of 37 benthic animal species were identified. Among them, 6 species belong to Annelida (accounting for 16.22% of the total benthic species), 12 species to Mollusca (32.43%), and 19 species to Arthropoda (51.35%). The measured benthic animal density in this survey ranged from 42.67 to 247.38 ind./m2, with an average value of 100.91 ind./m2. Arthropoda hold an absolute majority at sites NP01 and NP02, while Mollusca account for the main quantity at the three sites of NP04, NP06, and NP11. The zoobenthos density and the proportion of taxonomic groups are shown in Figure 6.
The structural organization and spatial arrangement of the zoobenthos community act as reliable markers of the persistent physical chemical properties of the riverbed sediments. The marked changes in the dominant taxa, particularly the shifts among Arthropoda, Mollusca and Annelida in various locations, indicate spatial heterogeneity in the Yunxi river system. The overwhelming presence of Arthropoda at sites NP01 and NP02 indicates the existence of particular substrate conditions or aquatic plants which are suitable for their settlement and reproductive cycles. In contrast, the high proportion of Mollusca at NP04, NP06 and NP11 suggests local habitats with abundant organic debris for feeding, but possibly keeping the low dissolved oxygen levels in the bottom to meet their greater respiratory needs as compared to tolerant worms [27,28]. Additionally, total benthic density ranged from 42.67 to 247.38 ind./m2, indicating substantial spatial heterogeneity in the benthic assemblage. These distinct community patterns suggest that sediment improvement and restoration of bottom current connection could be evaluated for reconstructing a stable and continuous benthic environment.
(2)
Species diversity
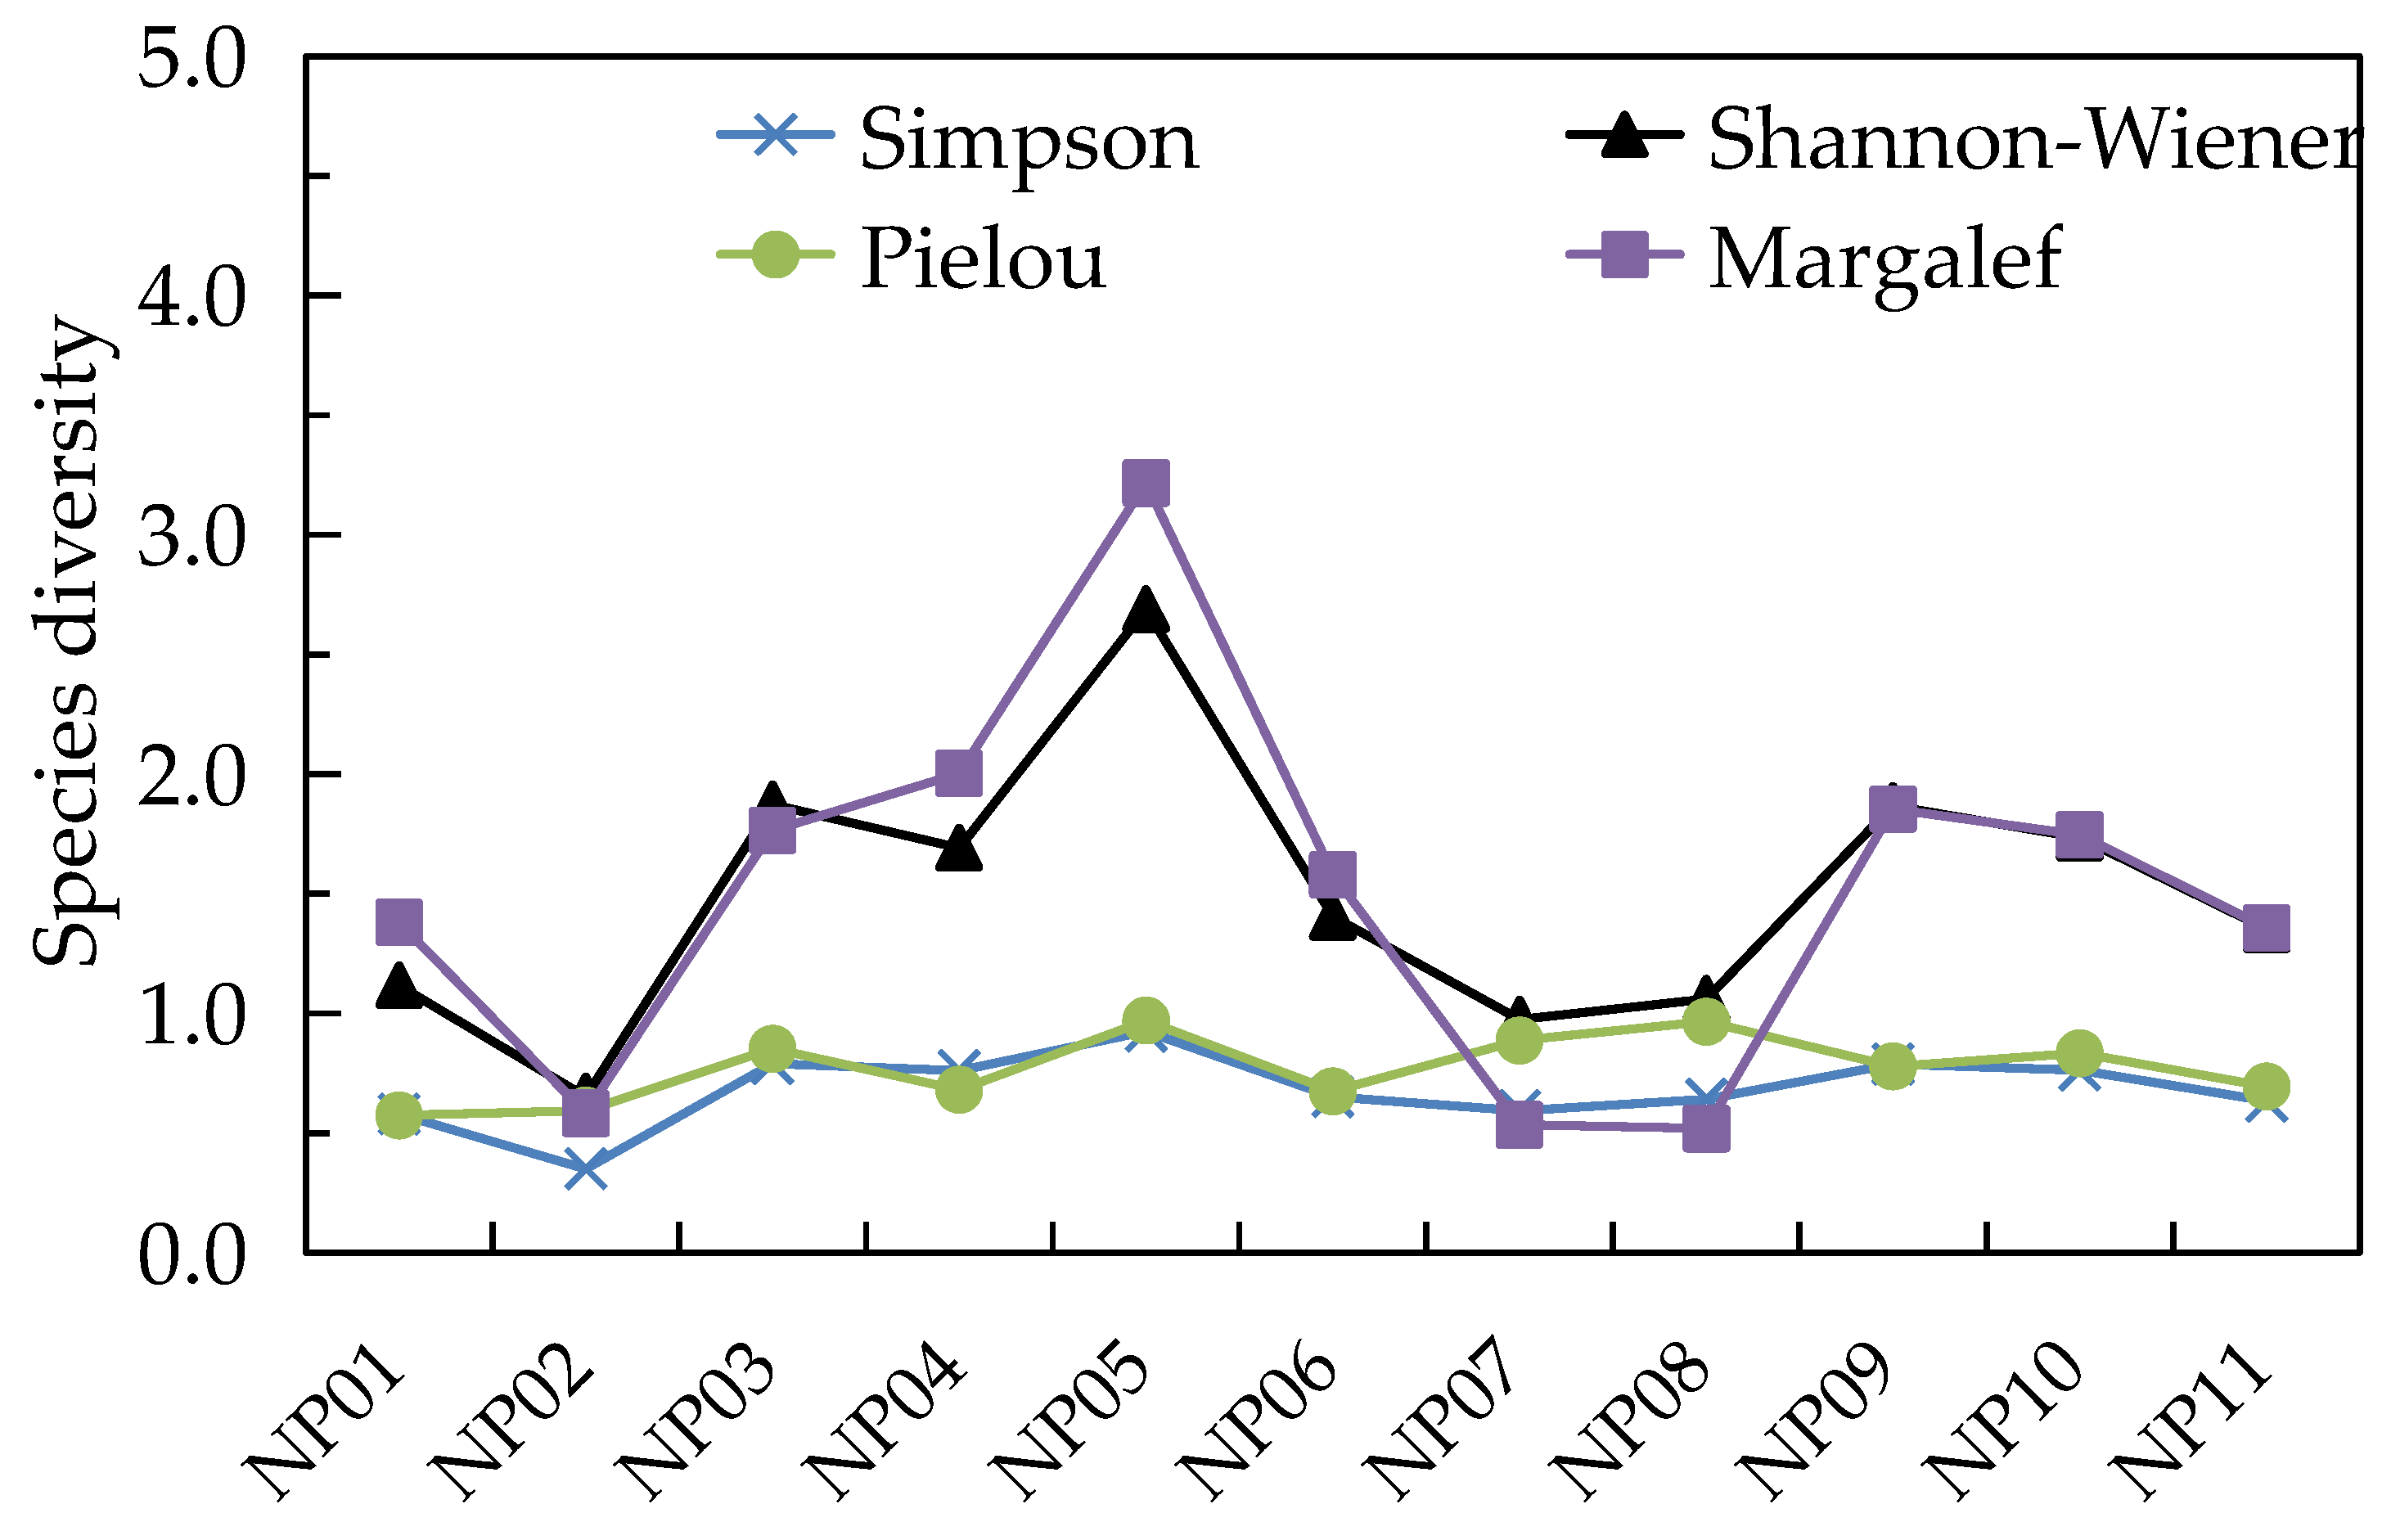
The calculation results of zoobenthos diversity are shown in Figure 7. In this survey, the mean Shannon index of benthic animals across the surveyed sites is 1.49 (ranging from 0.65 to 2.69). The variations in the Margalef index and Shannon–Wiener index are relatively significant, with the largest differences mainly concentrated at sites NP02 and NP05. Pielou evenness was comparatively high across sites, indicating a relatively even distribution of individuals among the recorded benthic taxa.
The diversity indices of the benthic assemblage showed marked spatial differences among the surveyed sites. The great difference between site NP05 and site NP02 is especially noticeable. NP05 showed comparatively high Shannon–Wiener diversity and Margalef richness, indicating higher local benthic diversity. In contrast, NP02 showed lower values of these indices, indicating lower local diversity and richness.
Despite these profound spatial fluctuations in richness and overall diversity, the Pielou evenness index remains consistently above 0.3 across all sites. This sustained evenness indicates a comparatively even distribution among the benthic taxa that were present. These differences in richness and evenness describe distinct aspects of benthic community structure and do not establish community stability or ecological degradation.
(3)
Dominant species
There were 6 dominant benthic animal species, as shown in Table 5, which were Limnodrilus hoffmeisteri with a dominance of 0.02, Limnodrilus claparedeianus with a dominance of 0.03, Bellamya aeruginosa with a dominance of 0.13, Parafossarulus eximius with a dominance of 0.05, Parafossarulus striatulus with a dominance of 0.03, and Alocinma longicornis with a dominance of 0.06. The species identified in this survey, with the exception of Bezzia sp., Pyrrhosoma sp., Brachuthemis sp., and Micronecta sp., are all pollution-tolerant species.
The specific composition of the dominant benthic community may provide information on the physicochemical conditions of the riverbed sediments. The community is structurally dominated by gastropods and oligochaetes, all of which are widely classified as pollution-tolerant taxa. In particular, the prominent presence of Limnodrilus species—classic indicators of organic enrichment and hypoxia—may be consistent with local environmental stress [29]. This prevalence of tolerant species over sensitive taxa may be associated with sluggish bottom-water hydrodynamics and the continuous accumulation of organic pollutants in the urban river network.

3.3. Relationship Between Dominant Species and Environmental Factors

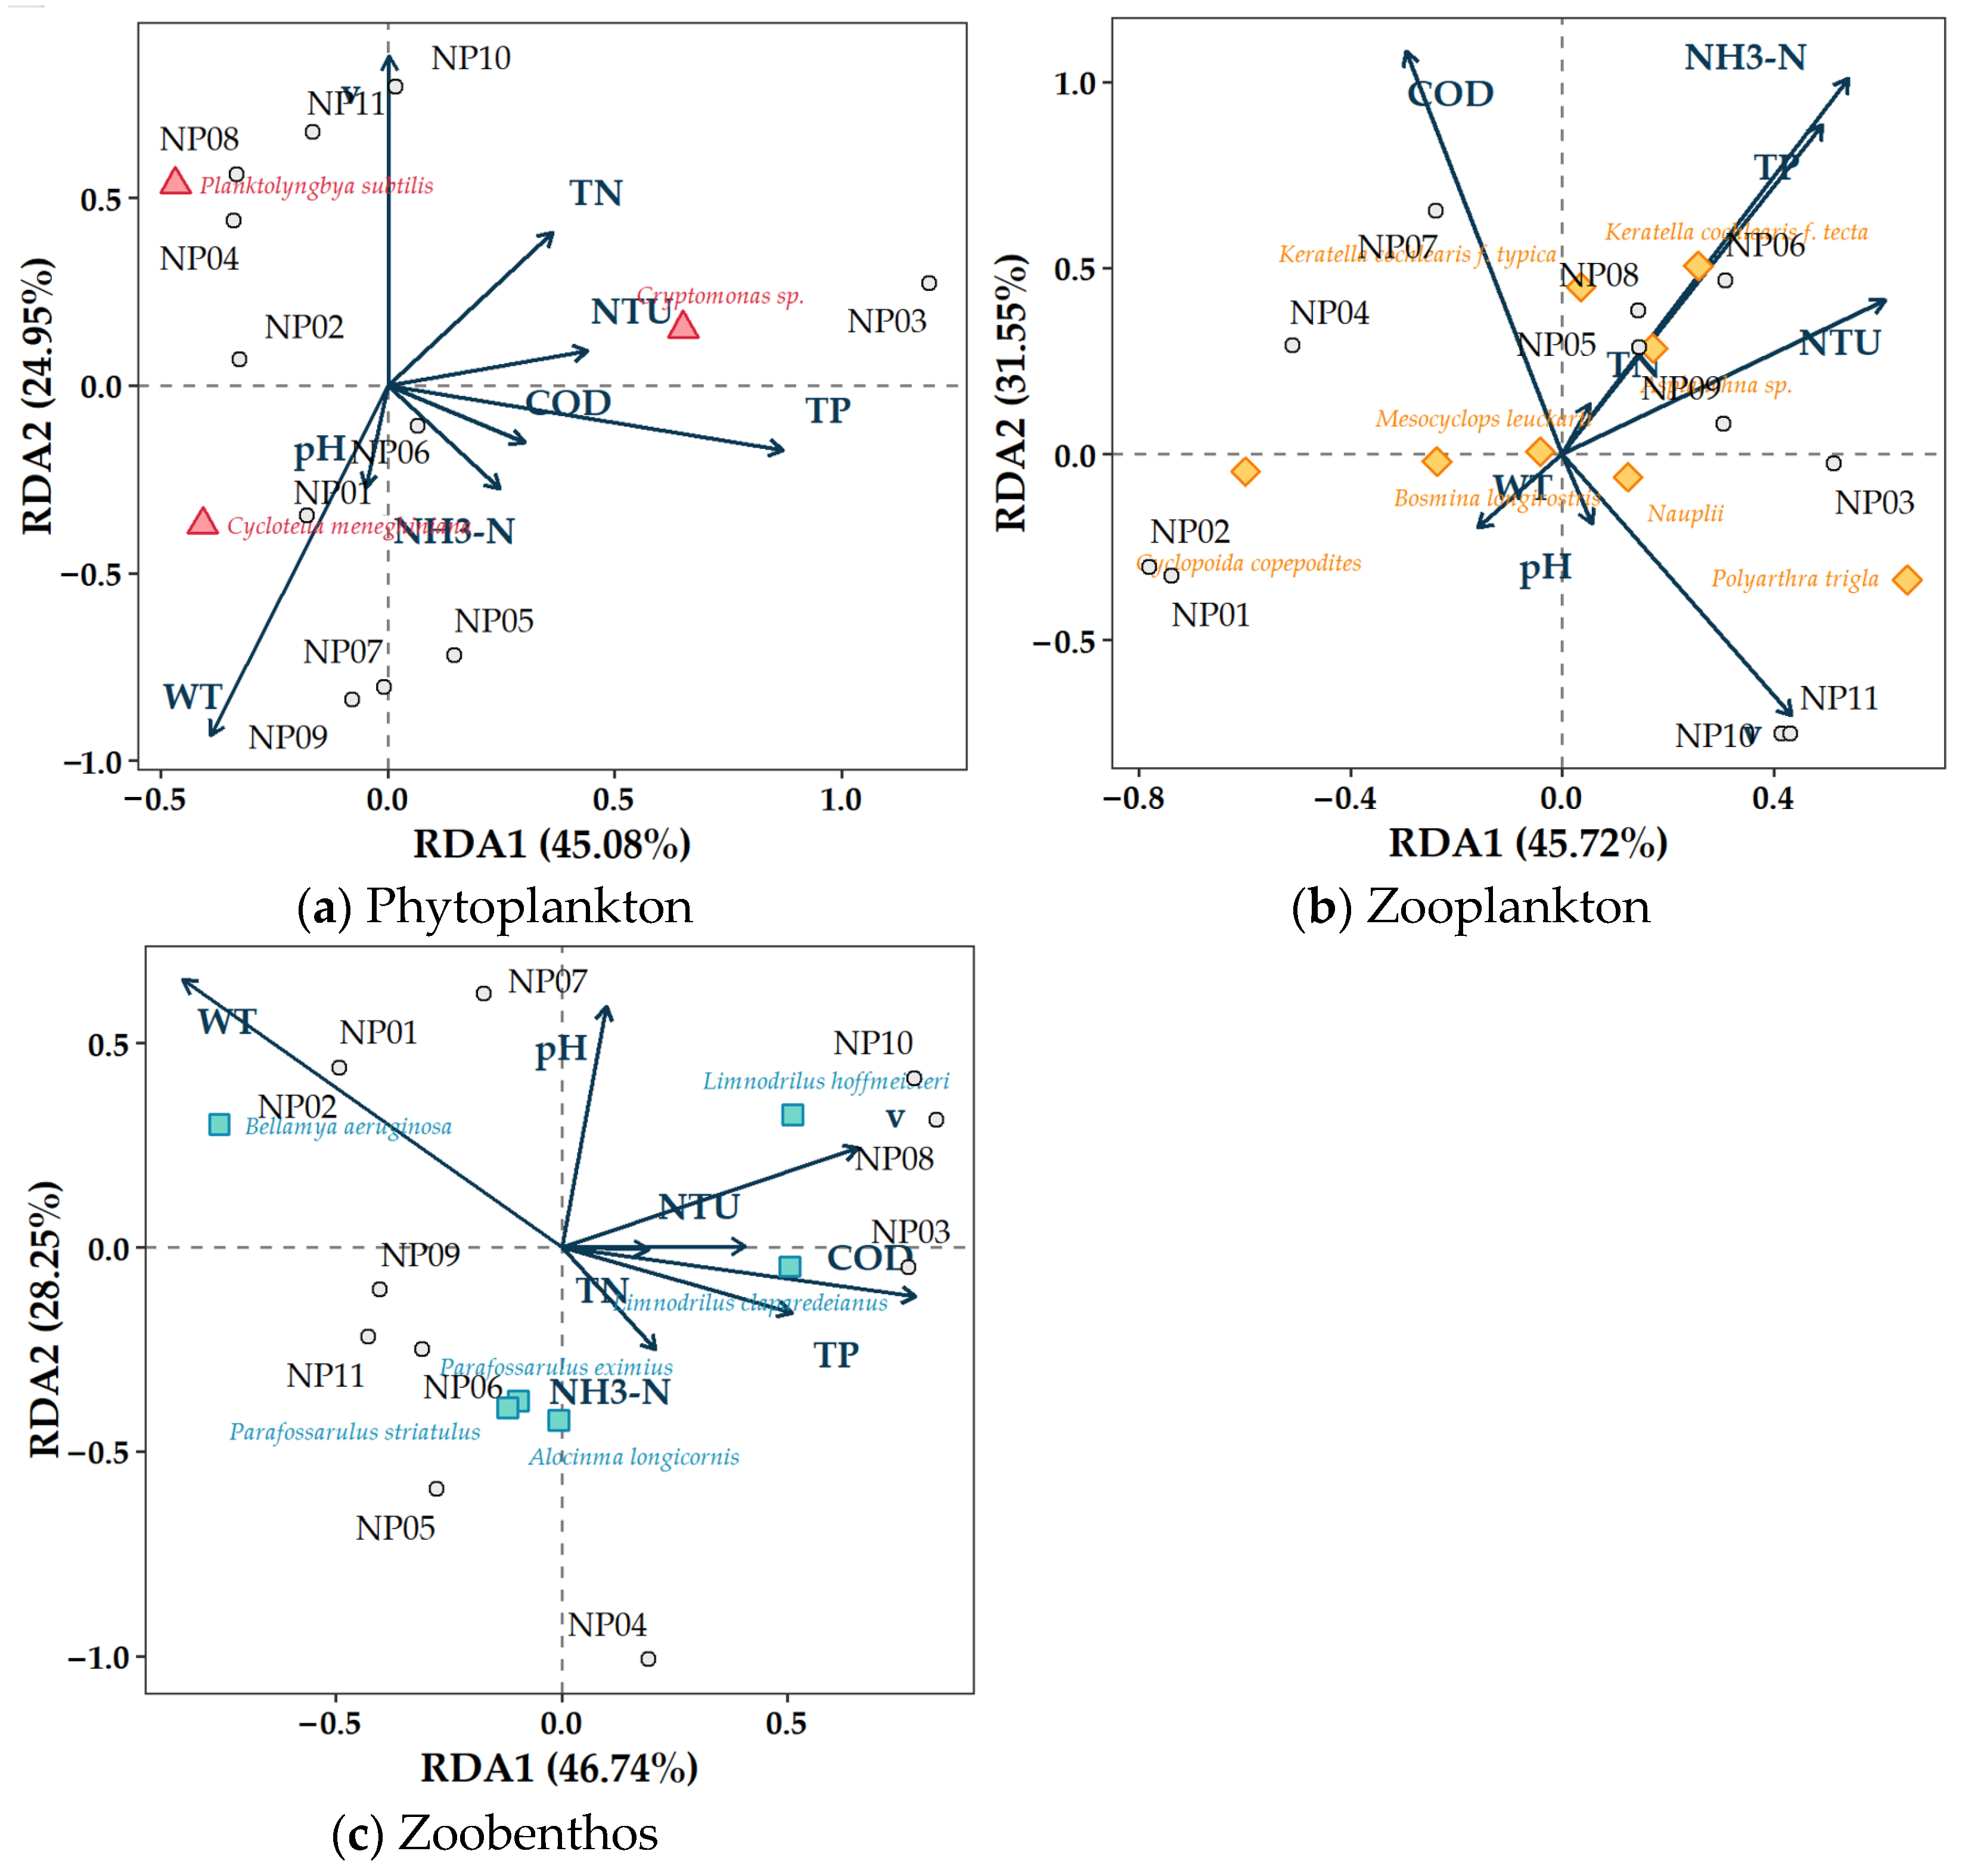
Prior to the multivariate ordination, a Detrended Correspondence Analysis (DCA) was conducted on the biological data. The longest gradient length was found to be less than 3.0, indicating that the species exhibited a linear response to the environmental gradients; therefore, Redundancy Analysis (RDA) was selected over Canonical Correspondence Analysis (CCA) to evaluate the relationships between dominant species and environmental factors. To prevent model overfitting and ensure the accuracy of the environmental driving factors, variables exhibiting high collinearity were removed prior to the final analysis. The resulting RDA triplots effectively capture the structural variance across the three aquatic taxonomic groups. Redundancy Analysis (RDA) was employed to quantitatively explore the response relationships between the relative abundances of dominant species in the three major taxonomic groups and key environmental factors, as shown in Figure 8. Environmental-variable correlation coefficients with RDA1 and RDA2 for each biological assemblage are presented in Table A1.
To further clarify the relationships between the biotic and abiotic variables, correlation analysis was performed. The significant correlations are summarized in Table 6. These results provide quantitative support for the relationships observed in the RDA ordination.
The RDA triplot for phytoplankton indicates that the first two axes explain 45.08% and 24.95% of the total variance, respectively. The dominant species Cryptomonas sp. was positioned in the same direction as TN, TP, CODMn, and NTU in the RDA ordination. Conversely, the relationship between Cyclotella meneghiniana and water temperature (WT) and pH is positive, while it is different from the primary nutrient gradients. The spatial distribution of Cryptomonas sp. shows its opportunistic growth and competitive advantage in nutrient-rich and turbid water. These ordination patterns indicate that nutrient and organic-matter gradients were associated with variation in phytoplankton community composition [30].
The zooplankton RDA accounts for 45.72% (Axis 1) and 31.55% (Axis 2) of the variation. The rotifers Keratella cochlearis f. tecta and Polyarthra trigla were positioned in the direction of the NH3-N, TP, TN, and NTU gradients in the ordination [31]. In contrast, the crustacean groups like Cyclopoid copepodites, Bosmina longirostris and Mesocyclops leuckarti are located on the opposite side of the nutrient gradient and exhibit a stronger affinity with WT and pH. The clustering of rotifers with high nitrogen, phosphorus and turbidity indicators suggests an association with nutrient-rich conditions. Their small size enables them to survive under these turbid conditions. The crustaceans, generally more sensitive to severe eutrophication, tend to avoid the most polluted areas, indicating a clear niche differentiation based on water quality.
For the zoobenthos community, the first and second axes account for 46.74% and 28.25% of the total variance, respectively. The oligochaetes Limnodrilus hoffmeisteri and Limnodrilus claparedeianus were positioned toward the CODMn, TP, NTU, and flow-velocity (v) gradients in the ordination. On the contrary, Bellamya aeruginosa and Parafossarulus eximius were positioned on the opposite side of these gradients and closer to the WT and pH vectors. Limnodrilus species act as good bio-indicators for the accumulation of organic matter in the benthos. Their close connection with COD and TP suggests an association with the measured environmental gradients [32].
In summary, the RDA results suggest that CODMn and nutrient gradients were associated with variation in the distribution of dominant taxa across the three biological groups. The increasing amounts of these pollutants are associated with the poor hydrodynamics and slow water flow in the Yunxi river network [33]. Thus, it is suggested to carry out targeted ecological water replenishment projects to improve the overall water environment and restore a balanced aquatic ecosystem. An increase in external water inflow could potentially enhance the regional hydrodynamics, accelerate water exchange and dilute the accumulated pollutants, thereby decreasing the dominance of pollution-tolerant species [34]. These multivariate associations should not be interpreted as identifying a single Liebig-limiting factor; direct nutrient limitation would require targeted experimental evidence.
Comparable patterns have been reported internationally: urbanization is connected with a decrease in macroinvertebrate diversity in European small rivers, persistent deterioration of tolerant communities in North American urban rivers, and reduction in food webs in tropical urban rivers [13,14,15]. In urban lakes, the structure of phytoplankton and nutrient conditions are also related to the composition of zooplankton communities [35].
This study was based on a single sampling campaign on 8–9 April 2024, with each site sampled once. Temporal and seasonal variability could therefore not be assessed, and repeated monitoring is needed to confirm the persistence of the observed spatial patterns. The absence of a relatively undisturbed reference site also limits definitive assessments of ecological degradation. Accordingly, the findings describe spatial differences and environmental associations, while causal mechanisms and the ecological benefits of the proposed management measures remain to be tested.

4. Conclusions

The Yunxi area shows slow hydrodynamics with flow velocities generally ranging from 0 to 0.12 m/s. Total nitrogen and ammonia nitrogen exceeded the relevant standards at several sites, while the present study did not quantify the relative contributions of individual pollution sources.
The aquatic communities showed marked spatial differences, with relatively high abundances of several pollution-tolerant and opportunistic taxa. The communities are mainly dominated by Bacillariophyta (phytoplankton), rotifers (zooplankton), and a mixture of gastropods and oligochaetes (zoobenthos). Localized community simplification and high density indicate spatial differences in community structure.
Redundancy Analysis (RDA) indicates that CODMn, TN, and TP were among the environmental variables associated with variation in aquatic community composition. These associations were consistent with the spatial distribution of several pollution-tolerant and opportunistic taxa.
The observed community patterns occurred under conditions of slow water exchange and local nutrient and organic-matter accumulation. Targeted ecological water replenishment could be evaluated as a potential management option. Increasing the external inflow of water may enhance the regional hydrodynamics, dilute the accumulated pollutants and break up the stagnant micro-habitats which are favourable for opportunistic algae and tolerant organisms.

Supplementary Materials

The following supporting information can be downloaded at: https://www.mdpi.com/article/10.3390/d18090568/s1, Table S1: Occurrence of phytoplankton, zooplankton, and zoobenthos taxa at the sampling sites, including scientific names with taxonomic authorities and years.

Author Contributions

Conceptualization, J.G., K.Y. and F.L.; methodology, J.G., K.Y. and W.G. (Wenrui Guo); validation, J.G., K.Y., F.L., R.D., B.M. and L.Z.; formal analysis, J.G., K.Y. and H.Z.; investigation, J.G., K.Y., W.G. (Wenrui Guo) and R.D.; resources, F.L., W.G. (Weijian Guo), B.M. and R.D.; data curation, J.G., K.Y. and H.Z.; writing—original draft preparation, J.G. and K.Y.; writing—review and editing, R.D., J.G., F.L., W.G. (Weijian Guo), L.Z. and H.Z.; visualization, R.D. and B.M.; supervision, R.D.; funding acquisition, R.D. All authors have read and agreed to the published version of the manuscript.

Funding

This research was funded by the National Key Research and Development Program of China (2022YFC3202604), the National Natural Science Foundation of China (Grant No.42271033), and Huadong Institute Major Science and Technology Program 201 (KY2024-ZD-04).

Institutional Review Board Statement

Not applicable.

Data Availability Statement

Raw data are available from the corresponding author upon request. All key results for interpreting the findings are included in the manuscript and Supplementary Materials.

Acknowledgments

The authors would like to extend their gratitude to Ji Wu for providing instructions and suggestions for this work.

Conflicts of Interest

Authors Jing Guo, Wenrui Guo, Bingyan Ma, Fang Liu, Hongxing Zhang, Weijian Guo, Leilei Zhang were employed by the company PowerChina Huadong Engineering Corporation Limited, Hangzhou, China. The remaining authors declare that the research was conducted in the absence of any commercial or financial relationships that could be construed as a potential conflict of interest.

Abbreviations

The following abbreviations are used in this manuscript:
RDARedundancy analysis
CCACanonical Correspondence Analysis
CODMnPermanganate Index
NH3-NAmmonia Nitrogen
TNTotal Nitrogen
TPTotal Phosphorus
WTWater Temperature
vVelocity
NTUTurbidity

Appendix A

Table A1. Environmental-variable correlation coefficients with RDA1 and RDA2 for each biological assemblage.
CommunityEnvironmental_VariableRDA1RDA2
PhytoplanktonWT−0.2654−0.4498
pH−0.0332−0.1307
NTU0.29900.0448
v0.00220.4225
TP0.5926−0.0828
TN0.24680.1965
NH3-N0.1674−0.1326
CODMn0.2048−0.0733
ZooplanktonWT−0.1047−0.1297
pH0.0362−0.1237
NTU0.39950.2713
v0.2834−0.4619
TP0.32170.5810
TN0.03380.0881
NH3-N0.35360.6635
CODMn−0.19320.7106
ZoobenthosWT−0.51960.4388
pH0.06120.3955
NTU0.25160.0017
v0.40610.1629
TP0.3153−0.1077
TN0.1188−0.0030
NH3-N0.1287−0.1682
CODMn0.4855−0.0812

References

  1. Mandjoupa, L.K.; Roman, K.K.; Azam, H.; Denis, M. Analyzing Urban Microclimate (UMC) Parameters and Comprehensive Review of UHI and Air Quality Interconnections. Environments 2025, 12, 104. [Google Scholar] [CrossRef] [Scilit]
  2. Ivanova, A.; Randhir, R.; Randhir, T.O. Nature-Based Solutions for Resilience: A Global Review of Ecosystem Services from Urban Forests and Cover Crops. Diversity 2026, 18, 47. [Google Scholar] [CrossRef] [Scilit]
  3. Xu, G.; Li, A.; Yang, Q.; Chi, J. Spatiotemporal change in the river network in rapidly urbanized plain regions of the Yangtze River Delta in China. River Res. Appl. 2022, 38, 965–974. [Google Scholar] [CrossRef] [Scilit]
  4. Díaz, G.; Arriagada, P.; Górski, K.; Link, O.; Karelovic, B.; Gonzalez, J.; Habit, E. Fragmentation of Chilean Andean rivers: Expected effects of hydropower development. Rev. Chil. Hist. Nat. 2019, 92, 1. [Google Scholar] [CrossRef] [Scilit]
  5. Hu, H.; Wang, J.; Zhou, G.; Tong, S.; Wang, W.; Hu, T. Understanding the Water Quality Changes of the Typical Plain River Network Area Using Comprehensive Assessment Methods. Sustainability 2024, 16, 8766. [Google Scholar] [CrossRef] [Scilit]
  6. Tang, Z.; Chu, J.; Zhou, Z.; Zhang, Y.; Zhou, T.; Yuan, K.; Ma, M.; Wang, Y. Study on Ecological Water Replenishment Calculation and Intelligent Pump Station Scheduling for Non-Perennial Rivers. Sustainability 2025, 17, 2032. [Google Scholar] [CrossRef] [Scilit]
  7. Brewer, S.K.; McManamay, R.A.; Miller, A.D.; Mollenhauer, R.; Worthington, T.A.; Arsuffi, T. Advancing Environmental Flow Science: Developing Frameworks for Altered Landscapes and Integrating Efforts Across Disciplines. Environ. Manag. 2016, 58, 175–192. [Google Scholar] [CrossRef] [Scilit] [PubMed]
  8. Farhadian, M.; Haddad, O.B.; Seifollahi-Aghmiuni, S.; Loaiciga, H.A. Assimilative capacity and flow dilution for water quality protection in rivers. J. Hazard. Toxic Radioact. Waste 2014, 19, 04014027. [Google Scholar] [CrossRef] [Scilit]
  9. Di Fluri, P.; Di Talia, V.; Antonioni, G.; Domeneghetti, A. A short-cut methodology for the spatial assessment of the biochemical river quality. Environ. Monit. Assess. 2024, 196, 388. [Google Scholar] [CrossRef] [Scilit] [PubMed]
  10. Reid, A.J.; Carlson, A.K.; Creed, I.F.; Eliason, E.J.; Gell, P.A.; Johnson, P.T.J.; Kidd, K.A.; MacCormack, T.J.; Olden, J.D.; Ormerod, S.J.; et al. Emerging threats and persistent conservation challenges for freshwater biodiversity. Biol. Rev. 2019, 94, 849–873. [Google Scholar] [CrossRef] [Scilit] [PubMed]
  11. Stovall, J.K.; Robbins, C.J.; Osburn, F.S.; Andersen, I.M.; Adams, C.; Chambers, J.; Porter, M.; Scott, J.T. Spatial Distribution of Rare and Common Phytoplankton Taxa is Controlled by Geospatial and Physicochemical Variables. Ecosphere 2025, 16, e70438. [Google Scholar] [CrossRef] [Scilit]
  12. Yu, K.; Li, D.; Fan, Z.; Ding, R. Evolution of the Lake Taihu Aquatic Ecosystem over a 14-Year Period of External Load Reduction. Diversity 2026, 18, 193. [Google Scholar] [CrossRef] [Scilit]
  13. Bohus, A.; Gál, B.; Barta, B.; Szivák, I.; Karádi-Kovács, K.; Boda, P.; Padisák, J.; Schmera, D. Effects of urbanization-induced local alterations on the diversity and assemblage structure of macroinvertebrates in low-order streams. Hydrobiologia 2023, 850, 881–899. [Google Scholar] [CrossRef] [Scilit]
  14. Westman, R.C.; Martin, K.L. Urbanization results in highly dynamic, degraded benthic macroinvertebrate communities in North Carolina streams. Hydrobiologia 2025, 852, 4475–4491. [Google Scholar] [CrossRef] [Scilit]
  15. Yule, C.M.; Gan, J.Y.; Jinggut, T.; Lee, K.V. Urbanization affects food webs and leaf-litter decomposition in a tropical stream in Malaysia. Freshw. Sci. 2015, 34, 702–715. [Google Scholar] [CrossRef] [Scilit]
  16. Schindler, D.W.; Carpenter, S.R.; Chapra, S.C.; Hecky, R.E.; Orihel, D.M. Reducing Phosphorus to Curb Lake Eutrophication Is a Success. Environ. Sci. Technol. 2016, 50, 8923–8929. [Google Scholar] [CrossRef] [Scilit] [PubMed]
  17. Lepš, J.; Šmilauer, P. Multivariate Analysis of Ecological Data Using CANOCO 5; Cambridge University Press: Cambridge, UK, 2003. [Google Scholar]
  18. ter Braak, C.J.F.; Juggins, S. Weighted averaging partial least squares regression (WA-PLS): An improved method for reconstructing environmental variables from species assemblages. Hydrobiologia 1993, 269, 485–502. [Google Scholar] [CrossRef] [Scilit]
  19. Niamaimandi, N.; Valinassab, T.; Daryanabard, R. Biodiversity of Demersal Species from Trawl Surveys in the Iranian Waters of the Persian Gulf. Turk. J. Fish. Aquat. Sci. 2018, 18, 1345–1353. [Google Scholar]
  20. Tong, S.; Yang, L.; Wang, L.; Yang, R.; Chen, S. Water environment quality of Dongyu River and estuary area of Nansi lake (Shandong Province, China) based on the characteristics of diatom community. J. Freshw. Ecol. 2023, 38, 2274349. [Google Scholar] [CrossRef] [Scilit]
  21. Ab Hamid, S.; Rawi, C. Application of Aquatic Insects (Ephemeroptera, Plecoptera and Trichoptera) in Water Quality Assessment of Malaysian Headwater. Trop. Life Sci. Res. 2017, 28, 143–162. [Google Scholar] [CrossRef] [Scilit] [PubMed]
  22. Wang, B.; Yin, X. Homogenization of Functional Diversity of Rotifer Communities in Relation to Eutrophication in an Urban River of North China. Biology 2023, 12, 1488. [Google Scholar] [CrossRef] [Scilit] [PubMed]
  23. Hein, S.; Jacob, J. Recovery of small rodent populations after population collapse. Wildl. Res. 2015, 42, 108–118. [Google Scholar] [CrossRef] [Scilit]
  24. Bonecker, C. Species Composition of Rotifers in Different Habitats of an Artificial Lake, Mato Grosso Do Sul State, Brazil. Acta Sci. 2000, 22, 343–346. [Google Scholar]
  25. Paraskevopoulou, S.; Dennis, A.B.; Weithoff, G.; Tiedemann, R. Temperature-dependent life history and transcriptomic responses in heat-tolerant versus heat-sensitive Brachionus rotifers. Sci. Rep. 2020, 10, 13281. [Google Scholar] [CrossRef] [Scilit] [PubMed]
  26. Campbell, R.G.; Wagner, M.M.; Teegarden, G.J.; Boudreau, C.A.; Durbin, E.G. Growth and development rates of the copepod Calanus finmarchicus reared in the laboratory. Mar. Ecol. Prog. Ser. 2001, 221, 161–183. [Google Scholar] [CrossRef] [Scilit]
  27. Makhutova, O.N.; Protasov, A.A.; Gladyshev, M.I.; Sylaieva, A.A.; Sushchik, N.N.; Morozovskaya, I.A.; Kalachova, G.S. Feeding spectra of bivalve mollusks Unio and Dreissena from Kanevskoe Reservoir, Ukraine: Are they food competitors or not? Zool. Stud. 2013, 52, 56. [Google Scholar] [CrossRef] [Scilit]
  28. Morant, D.; Perennou, C.; Camacho, A. Assessment of the Pressure Level over Lentic Waterbodies through the Estimation of Land Uses in the Catchment and Hydro-Morphological Alterations: The LUPLES Method. Appl. Sci. 2021, 11, 1633. [Google Scholar] [CrossRef] [Scilit]
  29. Liu, Y.; Fend, S.V.; Martinsson, S.; Erséus, C. Extensive cryptic diversity in the cosmopolitan sludge worm Limnodrilus hoffmeisteri (Clitellata, Naididae). Org. Divers. Evol. 2017, 17, 477–495. [Google Scholar] [CrossRef] [Scilit]
  30. Zhang, Y.; Yu, H.; Liu, J.; Guo, Y. Analysis of water quality and the response of phytoplankton in the low-temperature environment of Majiagou Urban River, China. Heliyon 2024, 10, e25955. [Google Scholar] [CrossRef] [Scilit] [PubMed]
  31. Xu, B.; Huang, X.; Xu, K.; Wang, X. Spatial and Seasonal Dynamics of Plankton Community and Its Relationship with Environmental Factors in an Urban River: A Case Study of Wuxi City, China. Water 2025, 17, 51. [Google Scholar] [CrossRef] [Scilit]
  32. Zhang, Y.; Yu, H.; Liu, M.; Liu, J.; Dong, W.; Xu, T.; Wang, Y.; Guo, Y. Analysis of Water Quality and Habitat Suitability for Benthic Macro-Invertebrates in the Majiagou Urban River, China. Water 2023, 15, 2269. [Google Scholar] [CrossRef] [Scilit]
  33. Chen, S.; Guo, C.; Wang, X.; Wu, Y.; Wang, Y.; Wang, Y.; Guo, H. Channelization and flow depletion shift benthic macroinvertebrate and fish communities in urban rivers. PLoS ONE 2025, 20, e0328843. [Google Scholar] [CrossRef] [Scilit] [PubMed]
  34. Shi, X.; Wang, L.; Chen, A.; Yu, W.; Liu, Y.; Huang, X.; Long, X.; Du, Y.; Qu, D. Enhancing water quality and ecosystems of reclaimed water-replenished river: A case study of Dongsha River, Beijing, China. Sci. Total Environ. 2024, 926, 172024. [Google Scholar] [CrossRef] [Scilit] [PubMed]
  35. Florescu, L.I.; Moldoveanu, M.M.; Catană, R.D.; Păceșilă, I.; Dumitrache, A.; Gavrilidis, A.A.; Iojă, C.I. Assessing the Effects of Phytoplankton Structure on Zooplankton Communities in Different Types of Urban Lakes. Diversity 2022, 14, 231. [Google Scholar] [CrossRef] [Scilit]
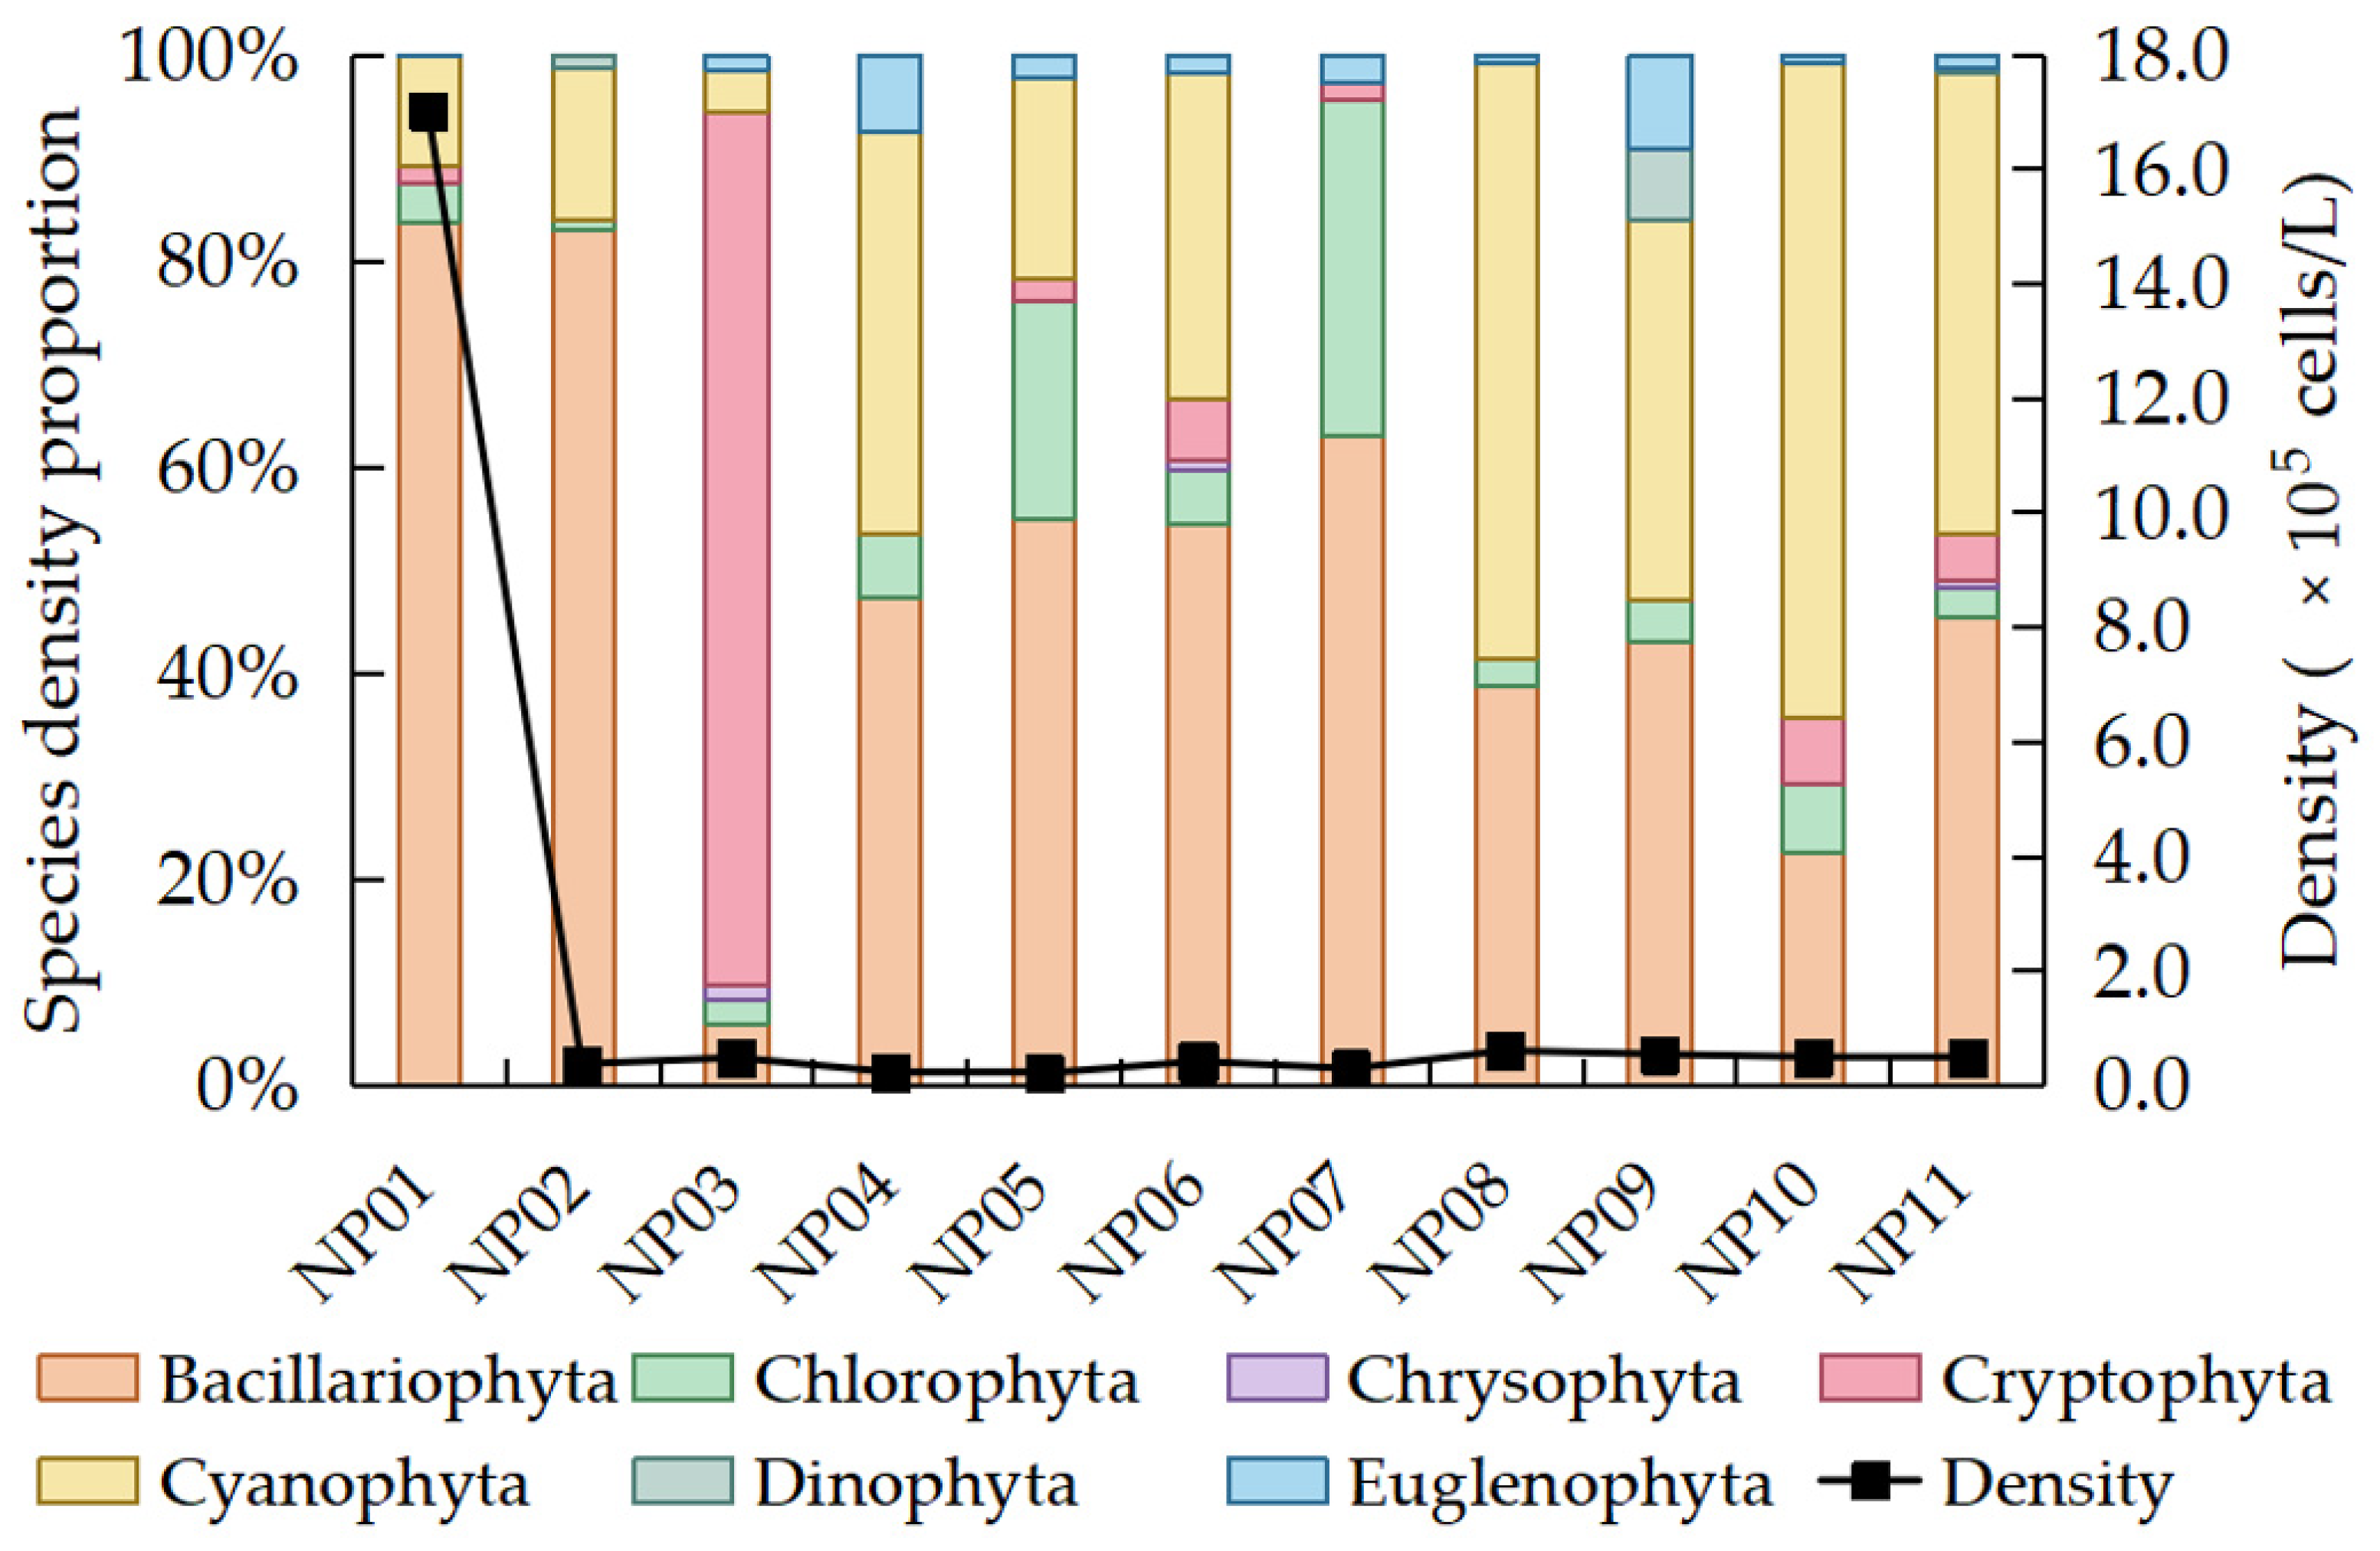
Figure 2. Spatial distribution of relative abundance and total density of phytoplankton communities at each sampling site in the Yunxi area.
Diversity 18 00568 g002
Figure 3. Diversity indices of phytoplankton at different sites in the Yunxi area.
Diversity 18 00568 g003
Figure 4. Spatial distribution of relative abundance and total density of zooplankton communities at each sampling site in the Yunxi area.
Diversity 18 00568 g004
Figure 5. Diversity indices of zooplankton at different sites in the Yunxi area.
Diversity 18 00568 g005
Figure 6. Spatial distribution of relative abundance and total density of zoobenthos communities at each sampling site in the Yunxi area.
Diversity 18 00568 g006
Figure 7. Diversity indices of zoobenthos at different sites in the Yunxi area.
Diversity 18 00568 g007
Figure 8. Redundancy analysis (RDA) of dominant aquatic species and environmental factors.
Diversity 18 00568 g008
Table 2. Environmental factors at each sampling site in the study area.
SitesWT
(°C)
DO
(mg/L)
pHNTU
(NTU)
Chla
(μg/L)
v
(m/s)
TP
(mg/L)
TN
(mg/L)
NH3-N
(mg/L)
CODMn
(mg/L)
NP0118.157.618.382.69.2500.041.130.2862.7
NP0219.626.477.321.52.310.090.096.020.7382.7
NP0316.853.547.663.78.910.030.184.651.3303.3
NP0417.042.797.660.310.50.040.072.310.7443.4
NP0517.753.477.864.44.10.120.144.052.1502.6
NP0617.52.887.824.65.020.080.143.912.4302.8
NP0721.314.568.261.24.070.030.122.261.6303.2
NP0816.863.637.785.33.970.040.144.012.2403.3
NP0920.666.487.721.24.600.051.710.5472.8
NP1018.767.928.311.61.260.40.042.250.4172.5
NP1119.645.737.852.21.890.050.072.901.0702.1
Table 3. Dominant phytoplankton species and their dominance.
PhylumSpeciesDominance
BacillariophytaCyclotella meneghiniana0.67
CyanophytaPlanktolyngbya subtilis0.08
CryptophytaCryptomonas sp.0.02
Table 4. Dominant zooplankton taxon and their dominance.
Taxonomic GroupTaxonDominance
RotiferaPolyarthra trigla0.12
RotiferaKeratella cochlearis f. tecta0.11
CopepodaMesocyclops leuckarti0.07
CopepodaCyclopoida copepodites0.07
RotiferaKeratella cochlearis f. typica0.06
CladoceraBosmina longirostris0.04
RotiferaAsplanchna sp.0.04
CopepodaNauplii0.02
Table 5. Dominant zoobenthos species and their dominance.
PhylumSpeciesDominance
MolluscaBellamya aeruginosa0.13
MolluscaAlocinma longicornis0.06
MolluscaParafossarulus eximius0.05
AnnelidaLimnodrilus claparedeianus0.03
MolluscaParafossarulus striatulus0.03
AnnelidaLimnodrilus hoffmeisteri0.02
Table 6. Significant correlations between the biotic and abiotic variables.
CommunityTaxonEnvironmental VariableCorrelation Coefficient
ZooplanktonKeratella cochlearis f. tectaTP0.8511 **
ZooplanktonKeratella cochlearis f. tectaNH3-N0.8347 ***
Note: Significance levels are denoted by asterisks, with p-values as the determining criteria: ** indicates p < 0.01 (highly significant) and *** indicates p < 0.001 (extremely significant).
Disclaimer/Publisher’s Note: The statements, opinions and data contained in all publications are solely those of the individual author(s) and contributor(s) and not of MDPI and/or the editor(s). MDPI and/or the editor(s) disclaim responsibility for any injury to people or property resulting from any ideas, methods, instructions or products referred to in the content.