Article

Decoding the Evolutionary Transitions and Distribution of Basal and Keystone Lineages of Polycladida (Rhabditophora)


Department of Biodiversity and Evolutionary Biology, National Museum of Natural Science, MNCN (CSIC), 28006 Madrid, Spain
*
Author to whom correspondence should be addressed.
Diversity 2026, 18(9), 566; https://doi.org/10.3390/d18090566
Submission received: 31 July 2026 / Revised: 4 September 2026 / Accepted: 4 September 2026 / Published: 15 September 2026

Abstract

The evolutionary history of ancient marine lineages is often obscured by geological change, long-term isolation, and morphological conservatism. Here, we investigate whether population genetic patterns can reveal deep-time evolutionary processes by integrating haplotype structure and differentiation, molecular dating, and ancestral-range reconstruction in two early-diverging genera of Polycladida, Boninia and Pericelis. Time-calibrated phylogenies and ancestral-range reconstructions place the origins of both genera in tropical marine regions during the Miocene, with the most recent common ancestor of Boninia dated to 8.3 Ma and that of Pericelis to 14–17 Ma. Despite this shared origin, they followed contrasting evolutionary trajectories. Boninia diversified primarily through vicariant fragmentation, followed by founder-event dispersal and regional radiations, whereas Pericelis preserves evidence of a formerly widespread tropical distribution through reciprocal relict species linking the Atlantic and Indo-Pacific, followed by independent regional diversification. Both genera exhibit pronounced geographic genetic structure, indicating long-term evolutionary persistence rather than recent cosmopolitan dispersal. These results demonstrate the value of integrating regional genetic diversity, molecular dating, and ancestral-range reconstruction to resolve the historical biogeography of early-diverging marine lineages.

1. Introduction

Recent advances in molecular phylogenetics have significantly reshaped our understanding of the order Polycladida Lang, 1884, particularly in terms of its evolutionary history, systematic relationships, and biogeographic patterns. Several taxa have emerged as central to these developments, particularly the basal genera Boninia Bock, 1923 and Pericelis Laidlaw, 1902 [1,2].
Boninia is the most species-rich genus within Boniniidae [3], comprising eight formally described species distributed throughout all oceans except the Arctic and Antarctic [3,4,5,6,7,8,9,10,11]. The genus Boninia represents one of the most basal lineages within Polycladida and occupies a pivotal evolutionary position relative to the two traditionally recognised suborders, Cotylea Lang, 1884 and Acotylea Lang, 1884 [2,12,13]. Although historically assigned to Cotylea, phylogenetic reconstructions recover Boninia as the sister group of the main cotylean branch [1,14], that diverged approximately 350 million years ago [2].
Biogeographically, diversification within Boninia appears strongly shaped by historical marine barriers, including the Eastern Pacific Barrier and the emergence of the Isthmus of Panama, which likely promoted allopatric divergence and long-term vicariance [3,15,16]. The combination of morphological conservatism, deep genetic fragmentation, and early phylogenetic divergence positions Boninia as a relict lineage retaining ancestral traits and provides critical insight into the early evolutionary history of Polycladida [2,3].
Pericelis Laidlaw, 1902, as the single genus of the family Pericelidae (superfamily Periceloidea), has traditionally been placed within Cotylea. However, recent molecular analyses suggest that it occupies a more basal position, forming the sister group to Acotylea [2]. This placement implies a shared ancestry followed by divergent evolutionary trajectories between Pericelis and remaining acotylean lineages. The genus holds particular evolutionary interest because it displays a mosaic of morphological traits: Cotylea-like features such as a ventral sucker, cement glands, and uterine vesicles, combined with Acotylea characters including a centrally ruffled pharynx, anteriorly directed uteri, and marginal eyes. This unique mixture of diagnostic elements positions Pericelis as a pivotal genus for understanding morphological transitions and early evolutionary patterns within Polycladida.
The taxonomic distinctiveness of Pericelis is matched by its wide geographic distribution. Of the 13 species currently described, increased by several recent additions [11,17], seven are distributed along the Pacific coasts (P. flavomarginata, P. hymanae, P. lactea, P. maculosa, P. nazahui, P. nivea, and P. sigmeri). Four species, P. alba, P. cata, P. ernesti, and P. orbicularis, inhabit both sides of the Atlantic Ocean, with multiple records from the Gulf of Mexico and the Caribbean Sea. Only a single species, P. beyerleyana, is recorded from the Indian Ocean (including the Red Sea), yet it exhibits the broadest distribution within the genus, spanning the Red Sea [18], India [19], Indonesia [20], and extending to Australia [14]. The origin of P. tectivorum remains uncertain because it was discovered in a coral aquarium [21]. Molecular analyses [17] place it within the P. beyerleyana clade.
This study aims to establish a coherent and biologically grounded framework for understanding early diversification, dispersal, and biogeographical evolution in Polycladida through the integration of microevolutionary and macroevolutionary approaches. In this sense, the research focuses on two basal genera, Boninia and Pericelis, which collectively possess the necessary characteristics to investigate these evolutionary processes.

2. Materials and Methods

2.1. DNA Extraction, Amplification and Sequencing

Tissues for molecular studies were fixed in absolute ethanol. DNA was extracted using the DNeasy Blood and Tissue Kit (Qiagen, Hilden, Germany) according to the manufacturer’s instructions. All PCRs were performed using Taq DNA polymerase of Mastermix (Invitrogen, Carlsbad, CA, USA) following the manufacturer’s protocol in a total volume of 25 μL. PCR products were purified using ExoSAP-IT™ PCR Product Cleanup Reagent (Thermo Fisher Scientific, Waltham, MA, USA) following the manufacturer’s instructions and sequenced by Secugen S.L. (Madrid, Spain).
Approximately 1100 bp of the 28S rRNA gene were amplified using the forward primer 5′-AGCCCAGCACCGAATCCT-3′ and the reverse primer 5′-GCAAACCAAGTAGGGTGTCGC-3′ [2]. The PCR consisted in an initial denaturation step at 95 °C (3 min), followed by 5 cycles of denaturation at 96 °C (30 s), annealing at 55 °C (30 s) and extension at 72 °C (1 min), and another 40 cycles of denaturation at 95 °C (30 s), annealing at 59 °C (30 s) and extension at 72 °C (1 min), with a final extension of 10 min at 72 °C.
Finally, the sequences obtained from forward and reverse primers were assembled using the program Geneious R6 (ver. 6.1.5) [22].

2.2. Sequence Alignment and Phylogenetic Analyses

A comparative analysis was carried out with both newly obtained sequences and those obtained from the NCBI GenBank database (Table 1). A total of 58 sequences were aligned with MAFFT ver. 7 [23] using Geneious R6 (ver. 6.1.5). 57 of them are newly obtained sequences.
The alignment was generated using the program MAFFT ver. 7 [23]. Ambiguously aligned and variable regions were recognised and excluded using the program Gblocks ver. 0.91b [24] with relaxed parameters (smaller final blocks, gap positions within the final blocks, and less strict flanking positions allowed). A matrix with an extension of 744 bp was obtained.
Maximum Likelihood (ML) analysis was implemented through IQ-TREE [25]. The best-fit nucleotide substitution model was selected using ModelFinder implemented in IQ-TREE, according to the Bayesian Information Criterion (BIC), resulting in TIM2+I+G4. The consensus tree of 1000 bootstrap pseudoreplicates was selected and edited with iTOL ver. 3.1.1 [26].

2.3. Genetic Diversity Indices

Haplotype numbers (Hap) and diversity, segregating sites, and nucleotide diversity were obtained in DNAsp 5.10.1 [27]. Haplotype networks were estimated with TCS [28] implemented in PopART (https://popart.maths.otago.ac.nz/; accessed on 3 September 2026).

2.4. Phylogenetic Inference and Time Calibration

We estimated a time-calibrated species tree under a Bayesian multispecies coalescent framework using the *BEAST implementation [29] of BEAST v1.8.4 [30]. Sequence evolution was modelled with the TRN (TN93) substitution model with a proportion of invariant sites (TRN+I), as implemented in BEAST/BEAUTi and selected for the alignment. The proportion of invariant sites was estimated during MCMC. Base frequencies and the transition/transversion parameters were estimated from the data.
Because direct fossil assignments to the focal taxa are uncertain, we calibrated the molecular clock using an external, ribosomal-gene rate derived from Scarpa et al. [31]. These authors report 28S gene pairwise divergence of 0.49–0.52% per million years (percentage divergence per Myr) for Proseriata. We converted this to a per-lineage substitution rate by dividing the divergence rate by two (r = divergence/2), yielding a mean per-lineage rate of approximately 0.002525 substitutions site−1 Myr−1 for 28S (0.00505/2). This 28S-derived value was implemented as an informed prior on the molecular clock parameter. Specifically, a lognormal prior (mean in real space = 0.002525, log-SD = 0.5) was placed on the clock.rate parameter so that the analysis was centred on the Scarpa et al. [31] estimate while still allowing appreciable uncertainty. The analysis reported here used a strict molecular clock. We also performed sensitivity checks with a relaxed (uncorrelated lognormal) clock in exploratory runs to assess rate heterogeneity and assessed clock-model fit by marginal-likelihood comparison where appropriate.
The species-tree prior was a birth–death model applied to the species tree. Per-species geographic region-size variation was modelled using a mixed gamma prior (gamma shape parameters 2 and 4 with a shared scale parameter), i.e., the species population-size prior and the split-population parameterization implemented in StarBEAST/*BEAST. Operators and tuning parameters followed the default/automated schedules produced by BEAUTi, with additional up–down operators linking clock rate and tree scale to facilitate efficient sampling.
MCMC analyses were run for sufficiently long chains to achieve effective sample sizes (ESS) > 200 for key parameters (clock.rate, posterior, likelihood, tree height, population parameters), as assessed in Tracer v1.7.1 [32]. Logs and trees were sampled at regular intervals, and an appropriate burn-in (10%) was discarded prior to summarization. Maximum clade credibility (MCC) species trees were generated with TreeAnnotator, node ages and 95% highest posterior density (HPD) intervals were reported on the MCC tree, and trees were visualized with FigTree. To place divergence estimates in a geological framework, we plotted the MCC tree using the R packages strap and phytools.
Ancestral areas were inferred using the R package BioGeoBEARS v.0.2 [33], which provides a unified likelihood framework for testing alternative biogeographic models under a phylogenetic context. Prior to analysis, each lineage was assigned to its corresponding present-day distributional areas, ensuring that the algorithm could evaluate historical range dynamics in relation to contemporary biogeographic patterns. BioGeoBEARS then estimates ancestral ranges across the phylogeny and compares competing evolutionary scenarios involving dispersal, vicariance, and founder-event speciation.
In this study, six biogeographic models implemented in BioGeoBEARS were evaluated. Specifically, we tested the Dispersal–Extinction–Cladogenesis model (DEC) [34], the Dispersal–Vicariance model (DIVA) [35], and the BayArea model [36]. The likelihood-based versions of the latter two models, as implemented in BioGeoBEARS, correspond to DIVALIKE and BayAreaLIKE, respectively. All models include two free parameters estimated along phylogenetic branches: d, representing dispersal or range expansion, and e, representing extinction or range contraction. To examine potential improvements in model fit, we additionally incorporated the founder-event parameter j, which accounts for cladogenetic jump dispersal. Inclusion of j generated three further models—DEC + J, DIVALIKE + J, and BayAreaLIKE + J. Model selection was performed using the AICc, and ancestral ranges were inferred for each node under the best-supported model. The resulting reconstructions were subsequently plotted onto the MCC tree.

3. Results

3.1. Boninia

3.1.1. Phylogeographic Structure and Haplotype Diversity

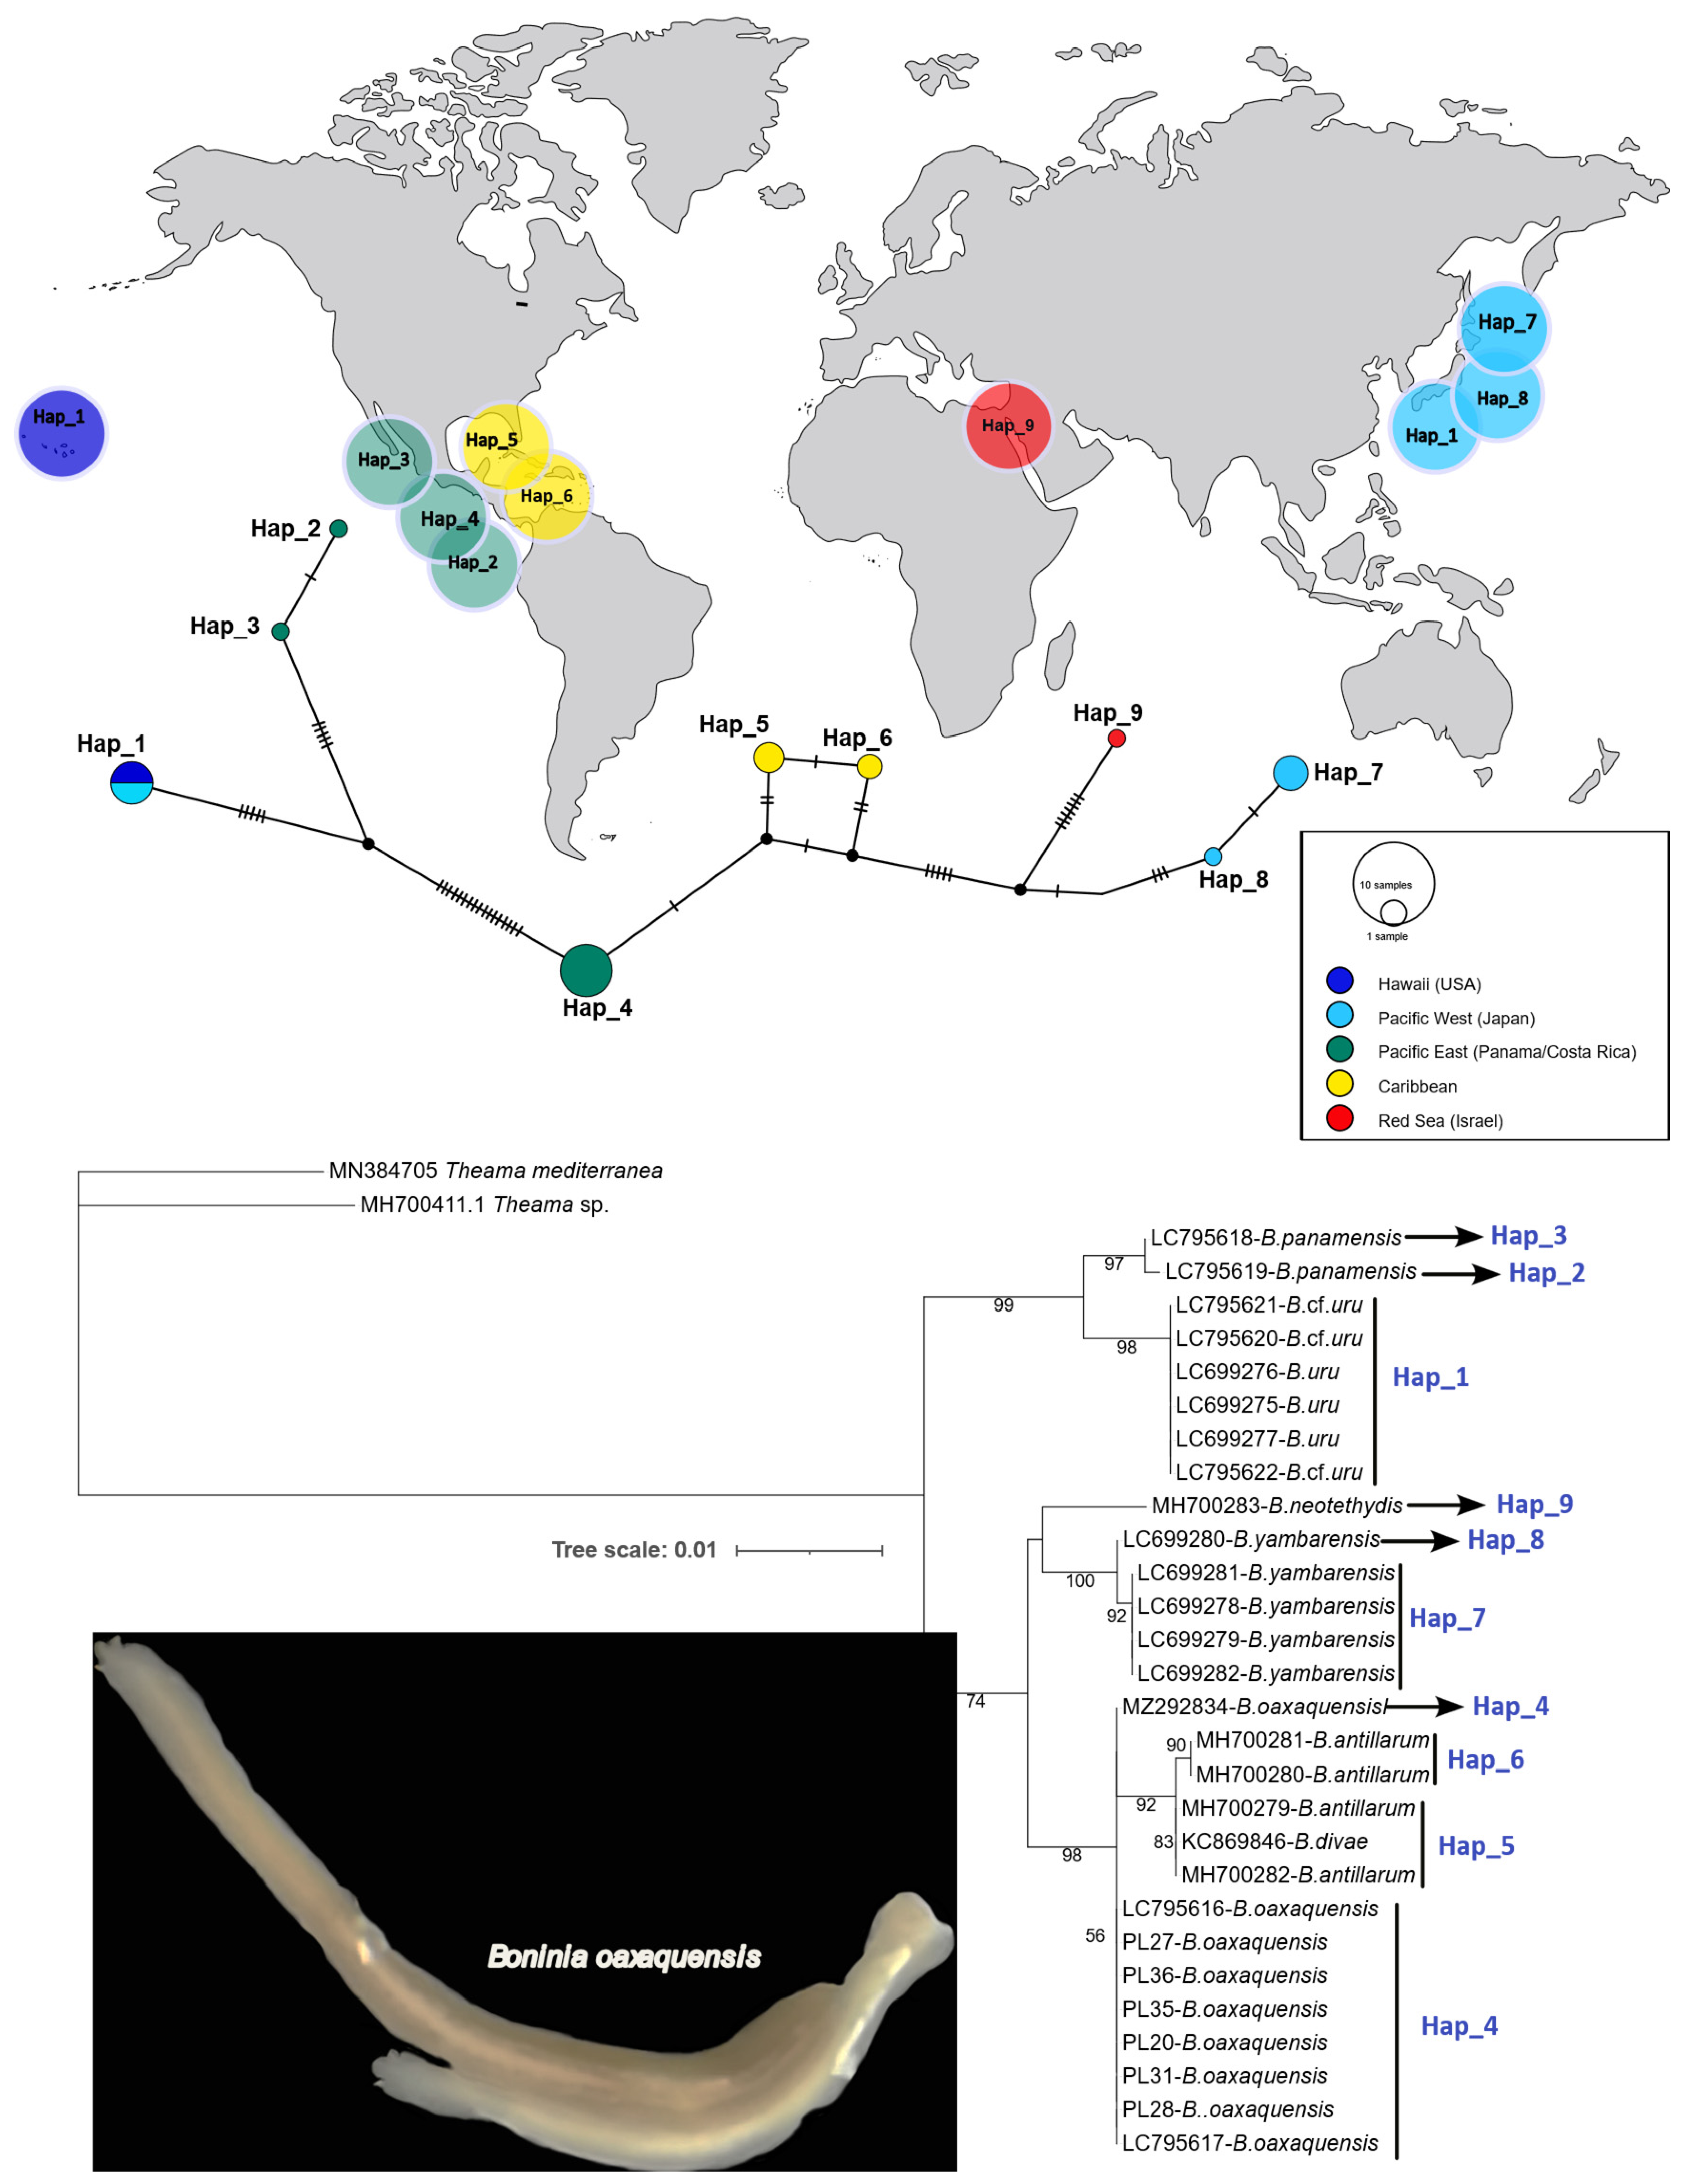
Figure 1 shows the 9 haplotypes recovered from the analysis of the genus Boninia. Most species are represented by one or two closely related haplotypes, including B. antillarum (Hap_5–Hap_6), B. panamensis (Hap_2–Hap_3), and B. yambarensis (Hap_7–Hap_8). Boninia uru from Japan, on the other hand, is represented by a single, widely distributed haplotype (Hap_1), which is also shared with specimens from Hawaii. Boninia oaxaquensis is likewise represented by a single haplotype (Hap_4), present in all sampled individuals from Costa Rica and Panama. Similarly, B. neotethydis is represented by a single haplotype from the Red Sea, although the species has also been reported from the Mediterranean coast of Israel.
The haplotype network revealed a geographic structure that is consistent with the topology recovered by the Maximum Likelihood phylogeny, except for B. oaxaquensis. The Caribbean haplotypes (B. antillarum and B. divae) form a single clade together with the eastern Pacific species B. oaxaquensis. This Caribbean–eastern Pacific clade is sister to the clade formed by the Japanese species B. yambarensis and the only known Boninia species from the Red Sea, B. neotethydis.
The second major clade comprises the Japanese species B. uru and the Hawaiian species B. cf. uru (possibly the same species). In this clade, B. panamensis, native to the eastern Pacific, appears as the sister group of B. uru and B. cf. uru.
Geographic Region 1: USA-Hawaii
The analysis of 28S sequences (Table 2) from the Hawaiian population of Boninia uru (n = 3) showed no genetic variation. All individuals shared a single haplotype (Hap_1), also present in Japan. Diversity indices (S = 0; h = 1; Hd = 0; K = 0; π = 0) confirm the lack of genetic variation and the sharing of Hap_1 with Japan indicate no detectable differentiation between these distant geographic regions.
Geographic Region 2: Japan
The Japanese population showed moderate to high genetic diversity (Hd ≈ 0.68; π ≈ 0.016), despite only three haplotypes being detected (h = 3) (Table 2). The high sequence divergence results from the coexistence of Boninia uru (Hap_1) and B. yambarensis (Hap_7, Hap_8), each with exclusive haplotypes. No shared haplotypes or signs of recombination were found, indicating reproductive isolation. Genetic diversity in Japan reflects sympatric but distinct species rather than intra-species variation. The strong divergence between Hap_1 (B. uru) and Hap_7/8 (B. yambarensis) drives the high values of S, supporting clear species-level separation.
Geographic Region 3: Eastern Pacific (Panama–Costa Rica)
This region (Table 2) exhibited low haplotype diversity (Hd = 0.45455), with Boninia oaxaquensis dominating the sample (9 individuals; Hap_4). B. panamensis was represented by two individuals with two closely related haplotypes (Hap_2, Hap_3). Despite the low haplotype richness, nucleotide diversity was moderate to high (π ≈ 0.0153), due to considerable divergence (S = 55) between the two species.
The genetic pattern indicates a predominance of B. oaxaquensis with limited intra-species variation, contrasted by distinct divergence from B. panamensis, increasing overall nucleotide diversity.
Geographic Region 4: Caribbean
The Caribbean population (Table 2) showed two haplotypes (Hap_5, Hap_6) with intermediate haplotype diversity (Hd = 0.6), but extremely low nucleotide diversity (π = 0.00068). The average pairwise differences were minimal (K = 0.6), and only a single segregating site was detected (S = 1), indicating high genetic homogeneity. Boninia antillarum in the Caribbean exhibits very low genetic diversity despite its broad distribution. The presence of two closely related haplotypes suggests a recent origin or historical bottleneck. Their limited divergence (one mutation) and a small number of differences from B. oaxaquensis (three mutations) contrast with the much higher divergence observed among other species in the genus.

3.1.2. Ancestral Area Reconstruction and Historical Biogeography

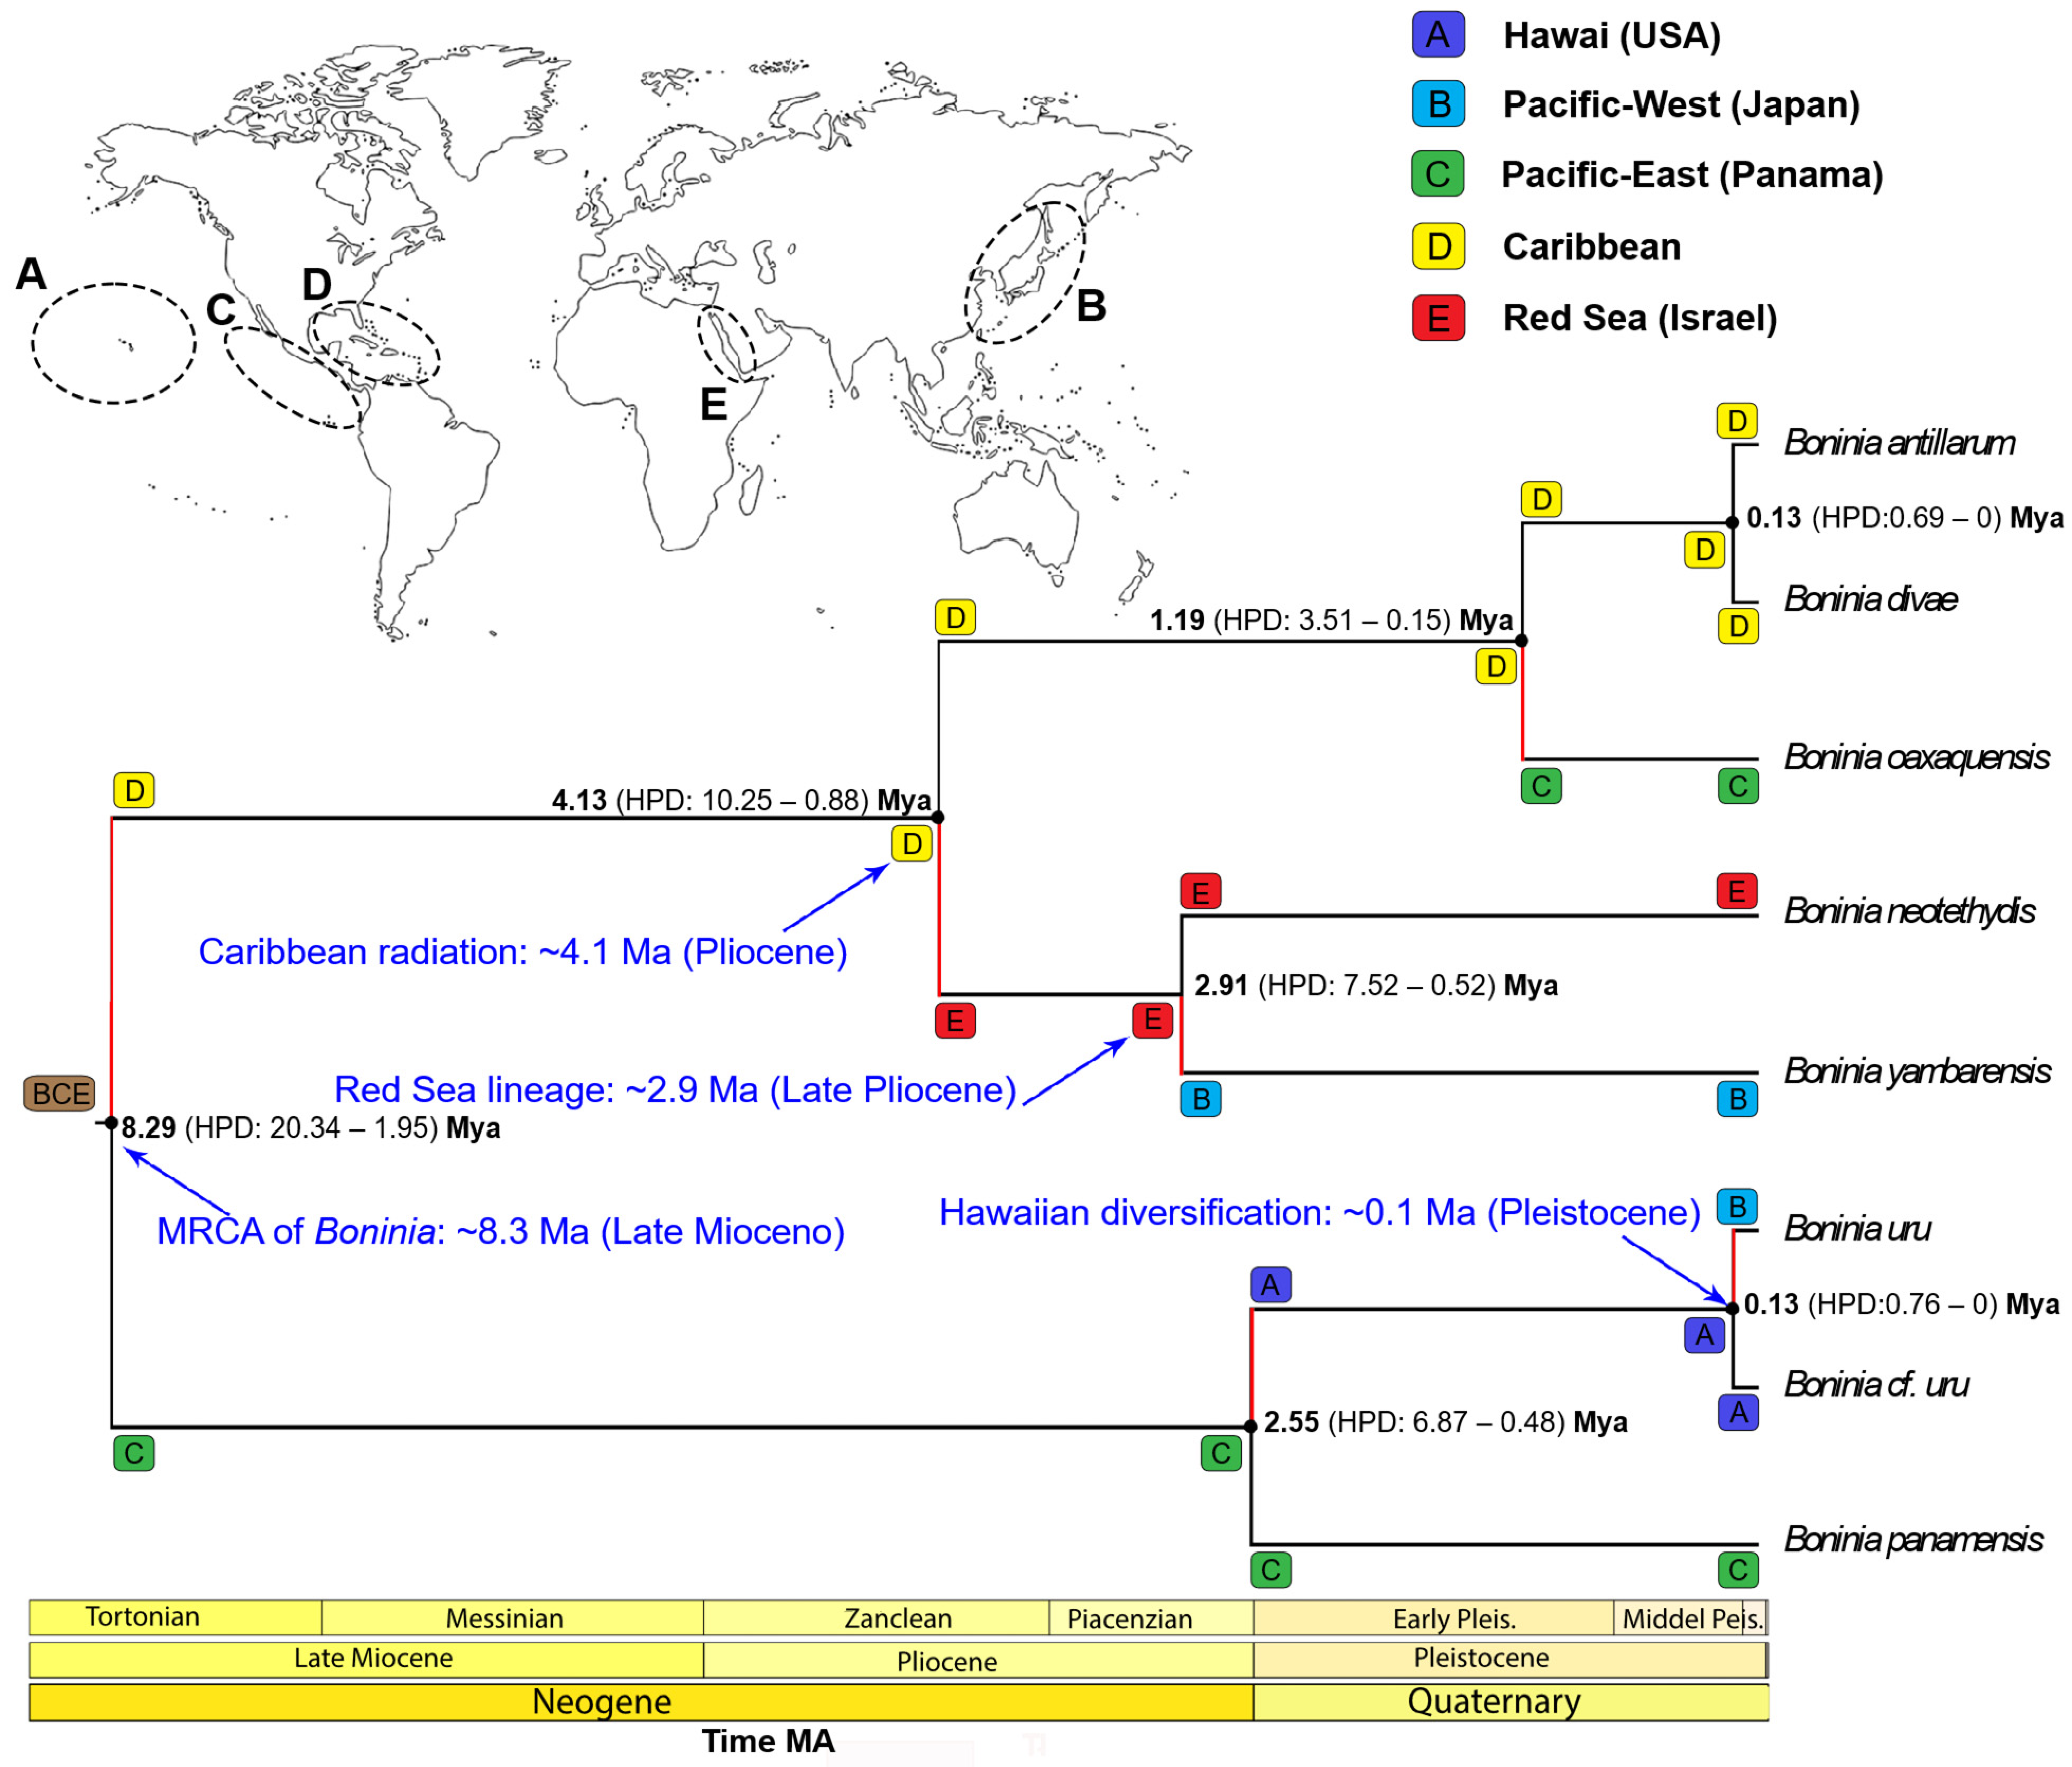
According to the BioGeoBEARS analyses (Table 3), the DIVA+J model provided the best fit to the data. Ancestral range reconstruction places the most recent common ancestor of Boninia at approximately 8.3 Ma (Late Miocene), occupying a broad ancestral range encompassing areas Pacific-West (B), Pacific-East (C), and Red Sea (E) (Figure 2). From this ancestor, two principal lineages were recovered in the Caribbean (D) and Pacific-East (C), respectively. Phylogenetic analyses recovered two major groups that were consistently supported by both Maximum Likelihood (Figure 1) and BEAST analyses, although the internal relationships involving B. neotethydis and B. yambarensis remained unresolved.
The second major lineage (Figure 2), reconstructed in the Eastern Pacific (C) at approximately 2.5 Ma, comprises B. panamensis, B. uru, and B. cf. uru. Ancestral range reconstruction inferred a transition from Pacific-East (C) to Hawaii (A) at the node separating B. panamensis from the group containing B. uru and B. cf. uru. The first major clade originated approximately 4.1 Ma and was reconstructed primarily in the Caribbean (D). This lineage includes B. antillarum, B. divae, and B. oaxaquensis, and exhibits a transition from Caribbean (D) to East-Pacific (C) associated with the origin of B. oaxaquensis.
Boninia neotethydis forms an independent lineage associated with the Red Sea (E). The divergence between B. neotethydis and B. yambarensis was estimated at approximately 2.9 Ma. Ancestral range reconstruction further identified a transition from Caribbean (D) to Red Sea (E) along the branch leading to the common ancestor of B. neotethydis and B. yambarensis, followed by a transition from Red Sea € to Pacific-West (B) associated with the origin of B. yambarensis.
Overall, ancestral range reconstruction inferred at least four biogeographic transitions among geographic regions: two anagenetic range shifts (D → E and E → B) and two transitions associated with cladogenetic events (D → C and C → A). Together, these events account for the present distribution of species within the genus.

3.2. Pericelis

3.2.1. Phylogeographic Structure and Haplotype Diversity

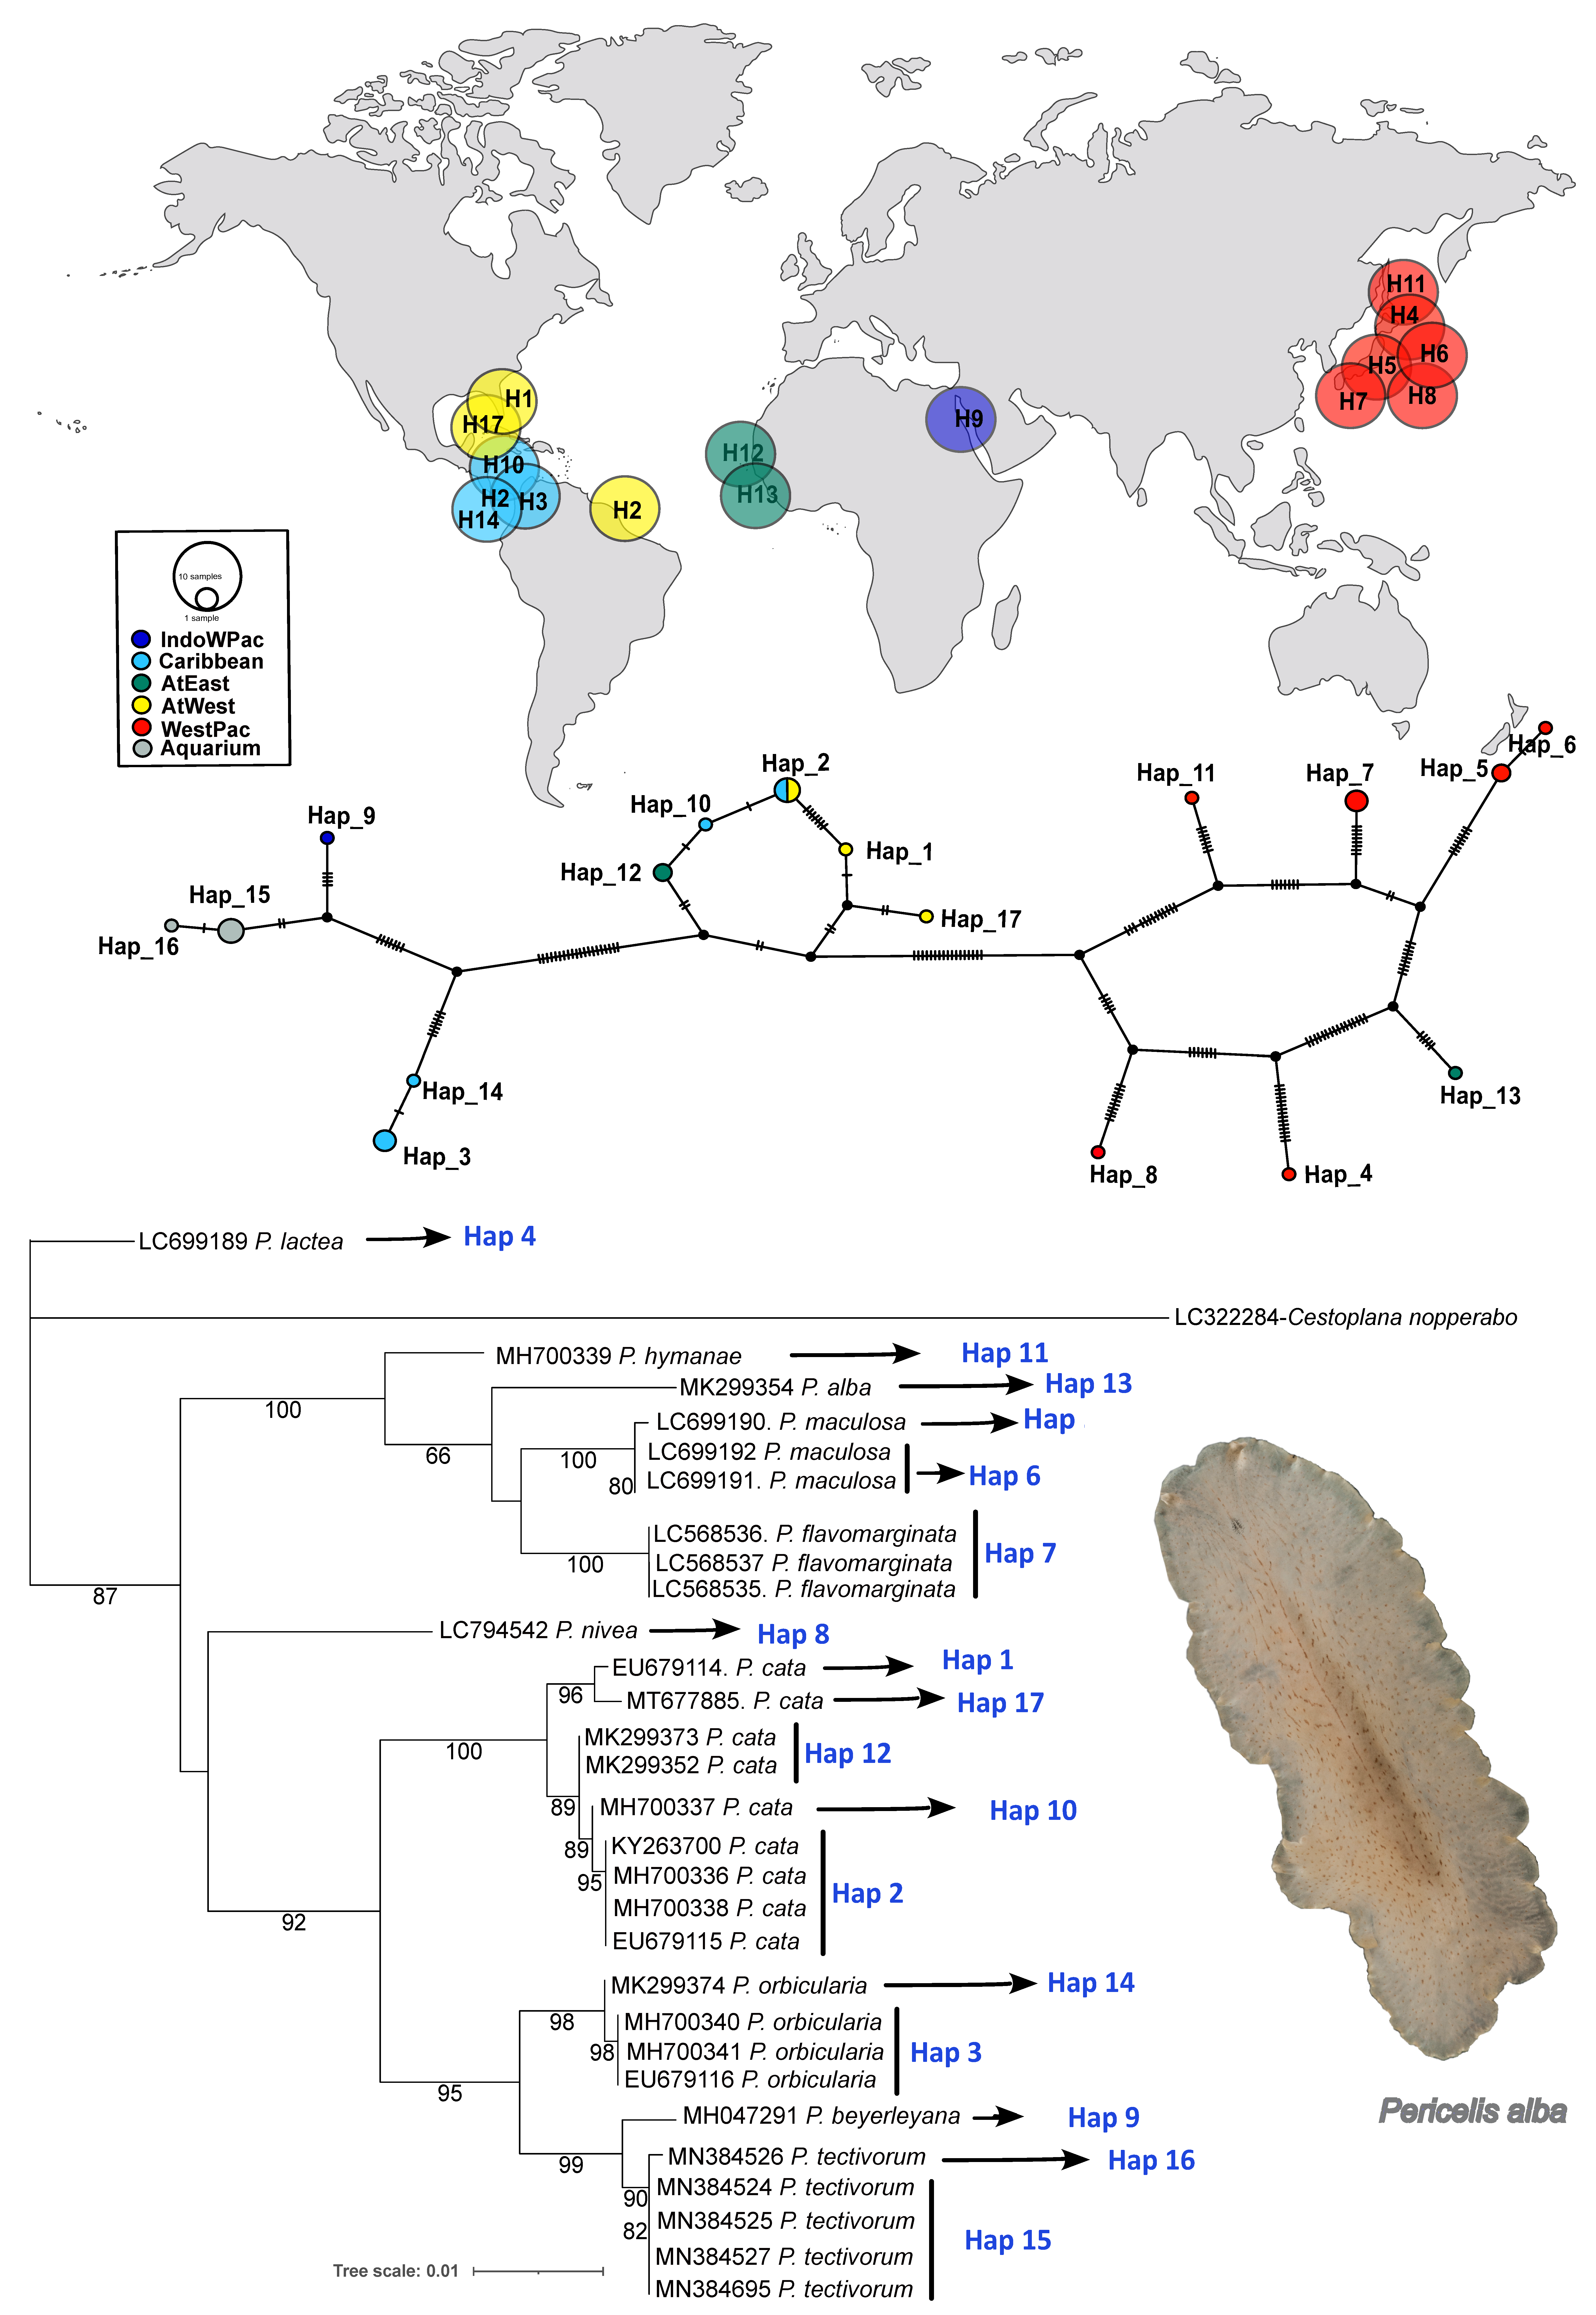
The haplotype network identified 17 haplotypes within Pericelis (Figure 3; Table 4). Most species were represented by one or two haplotypes, whereas P. cata showed the greatest intraspecific diversity (five haplotypes) across the Caribbean, Gulf of Mexico, Florida, and Brazil. Atlantic and Indo-Pacific lineages formed two well-separated groups, with the Pacific cluster separated from the Atlantic.
The Maximum Likelihood phylogeny recovered the same geographic pattern observed in the haplotype network. An Atlantic clade comprised P. orbicularia, P. cata, and P. beyerleyana, whereas a second clade included the western Pacific species. Within the Atlantic clade, P. cata displayed marked geographic structure, while within the Pacific clade, P. lactea and P. nivea occupied basal positions (Figure 3).
The genetic diversity of Pericelis (Table 4) varied markedly among the population of the artificial aquarium and the four geographic regions analysed. The Aquarium population, represented exclusively by P tectivorum (n = 5), showed the lowest genetic variation; this low diversity is consistent with the fact that all specimens originated from aquarium material and may therefore represent a spatially restricted or genetically homogeneous sample.
The Caribbean region comprised seven sequences belonging to P. orbicularia (4) and P. cata (3). Despite the relatively small sample size, this region displayed substantially greater genetic variation, indicating considerable sequence divergence among the Caribbean haplotypes.
The Atlantic-West region, represented by four sequences of P. cata, showed intermediate genetic diversity. Thus, although haplotype diversity was high, the relatively low nucleotide diversity indicates that the haplotypes are comparatively closely related.
The Atlantic-East region contained three sequences, two corresponding to P. cata and one to P. alba. Despite its small sample size, this region exhibited the highest levels of nucleotide divergence among the regions. This pattern indicates that the two Atlantic-East haplotypes are deeply divergent from one another, suggesting the presence of genetically distinct evolutionary lineages.
Finally, the West-Pacific region comprises nine sequences from five species (P. flavomarginata, P. maculosa, P. lactea, P. nivea, and P. hymanae). The values shown in Table 4 indicate substantial genetic differentiation within the West-Pacific assemblage, consistent with the coexistence of several divergent lineages and species in this region.
The genetic diversity was highest in the West-Pacific and Atlantic-East regions. The Caribbean also showed relatively high nucleotide diversity, whereas the Atlantic-West exhibited high haplotype diversity but comparatively low nucleotide diversity. The high nucleotide divergence observed in the Atlantic-East region, despite its very small sample size, suggests the persistence of deeply divergent lineages rather than simply the accumulation of numerous closely related haplotypes. In contrast, the high diversity of the West-Pacific region appears to reflect the coexistence of multiple divergent haplotypes associated with several species. These patterns support a strong geographic and evolutionary structuring of genetic diversity in Pericelis.

3.2.2. Ancestral Area Reconstruction and Historical Biogeography

Although BAYAREALIKE + J produced the lowest AICc value (Table 5), its difference relative to DEC + J (ΔAICc = 2.13) indicates that both models fall within a range commonly interpreted as statistically comparable. In such cases, biological plausibility becomes an important criterion for selecting the preferred model. The DEC + J framework explicitly incorporates dispersal, extinction, and founder-event speciation—processes that align more closely with the ecological constraints, limited dispersal ability, and spatially fragmented habitats characteristic of Pericelis. In contrast, BAYAREALIKE + J assumes widespread sympatric ranges and lacks mechanisms for vicariance or range subdivision, making it less consistent with the evolutionary dynamics expected for marine flatworms. For these reasons, despite its slightly higher AICc, DEC + J was considered the most appropriate and biologically realistic model for reconstructing the biogeographic history of Pericelis. The estimated parameters were d = 0.0055, e = 0, and j = 0.0949, with a log-likelihood of LnL = −15.56, indicating that founder-event speciation contributed substantially to the inferred biogeographic history, whereas extinction was not supported under the best-fitting model.
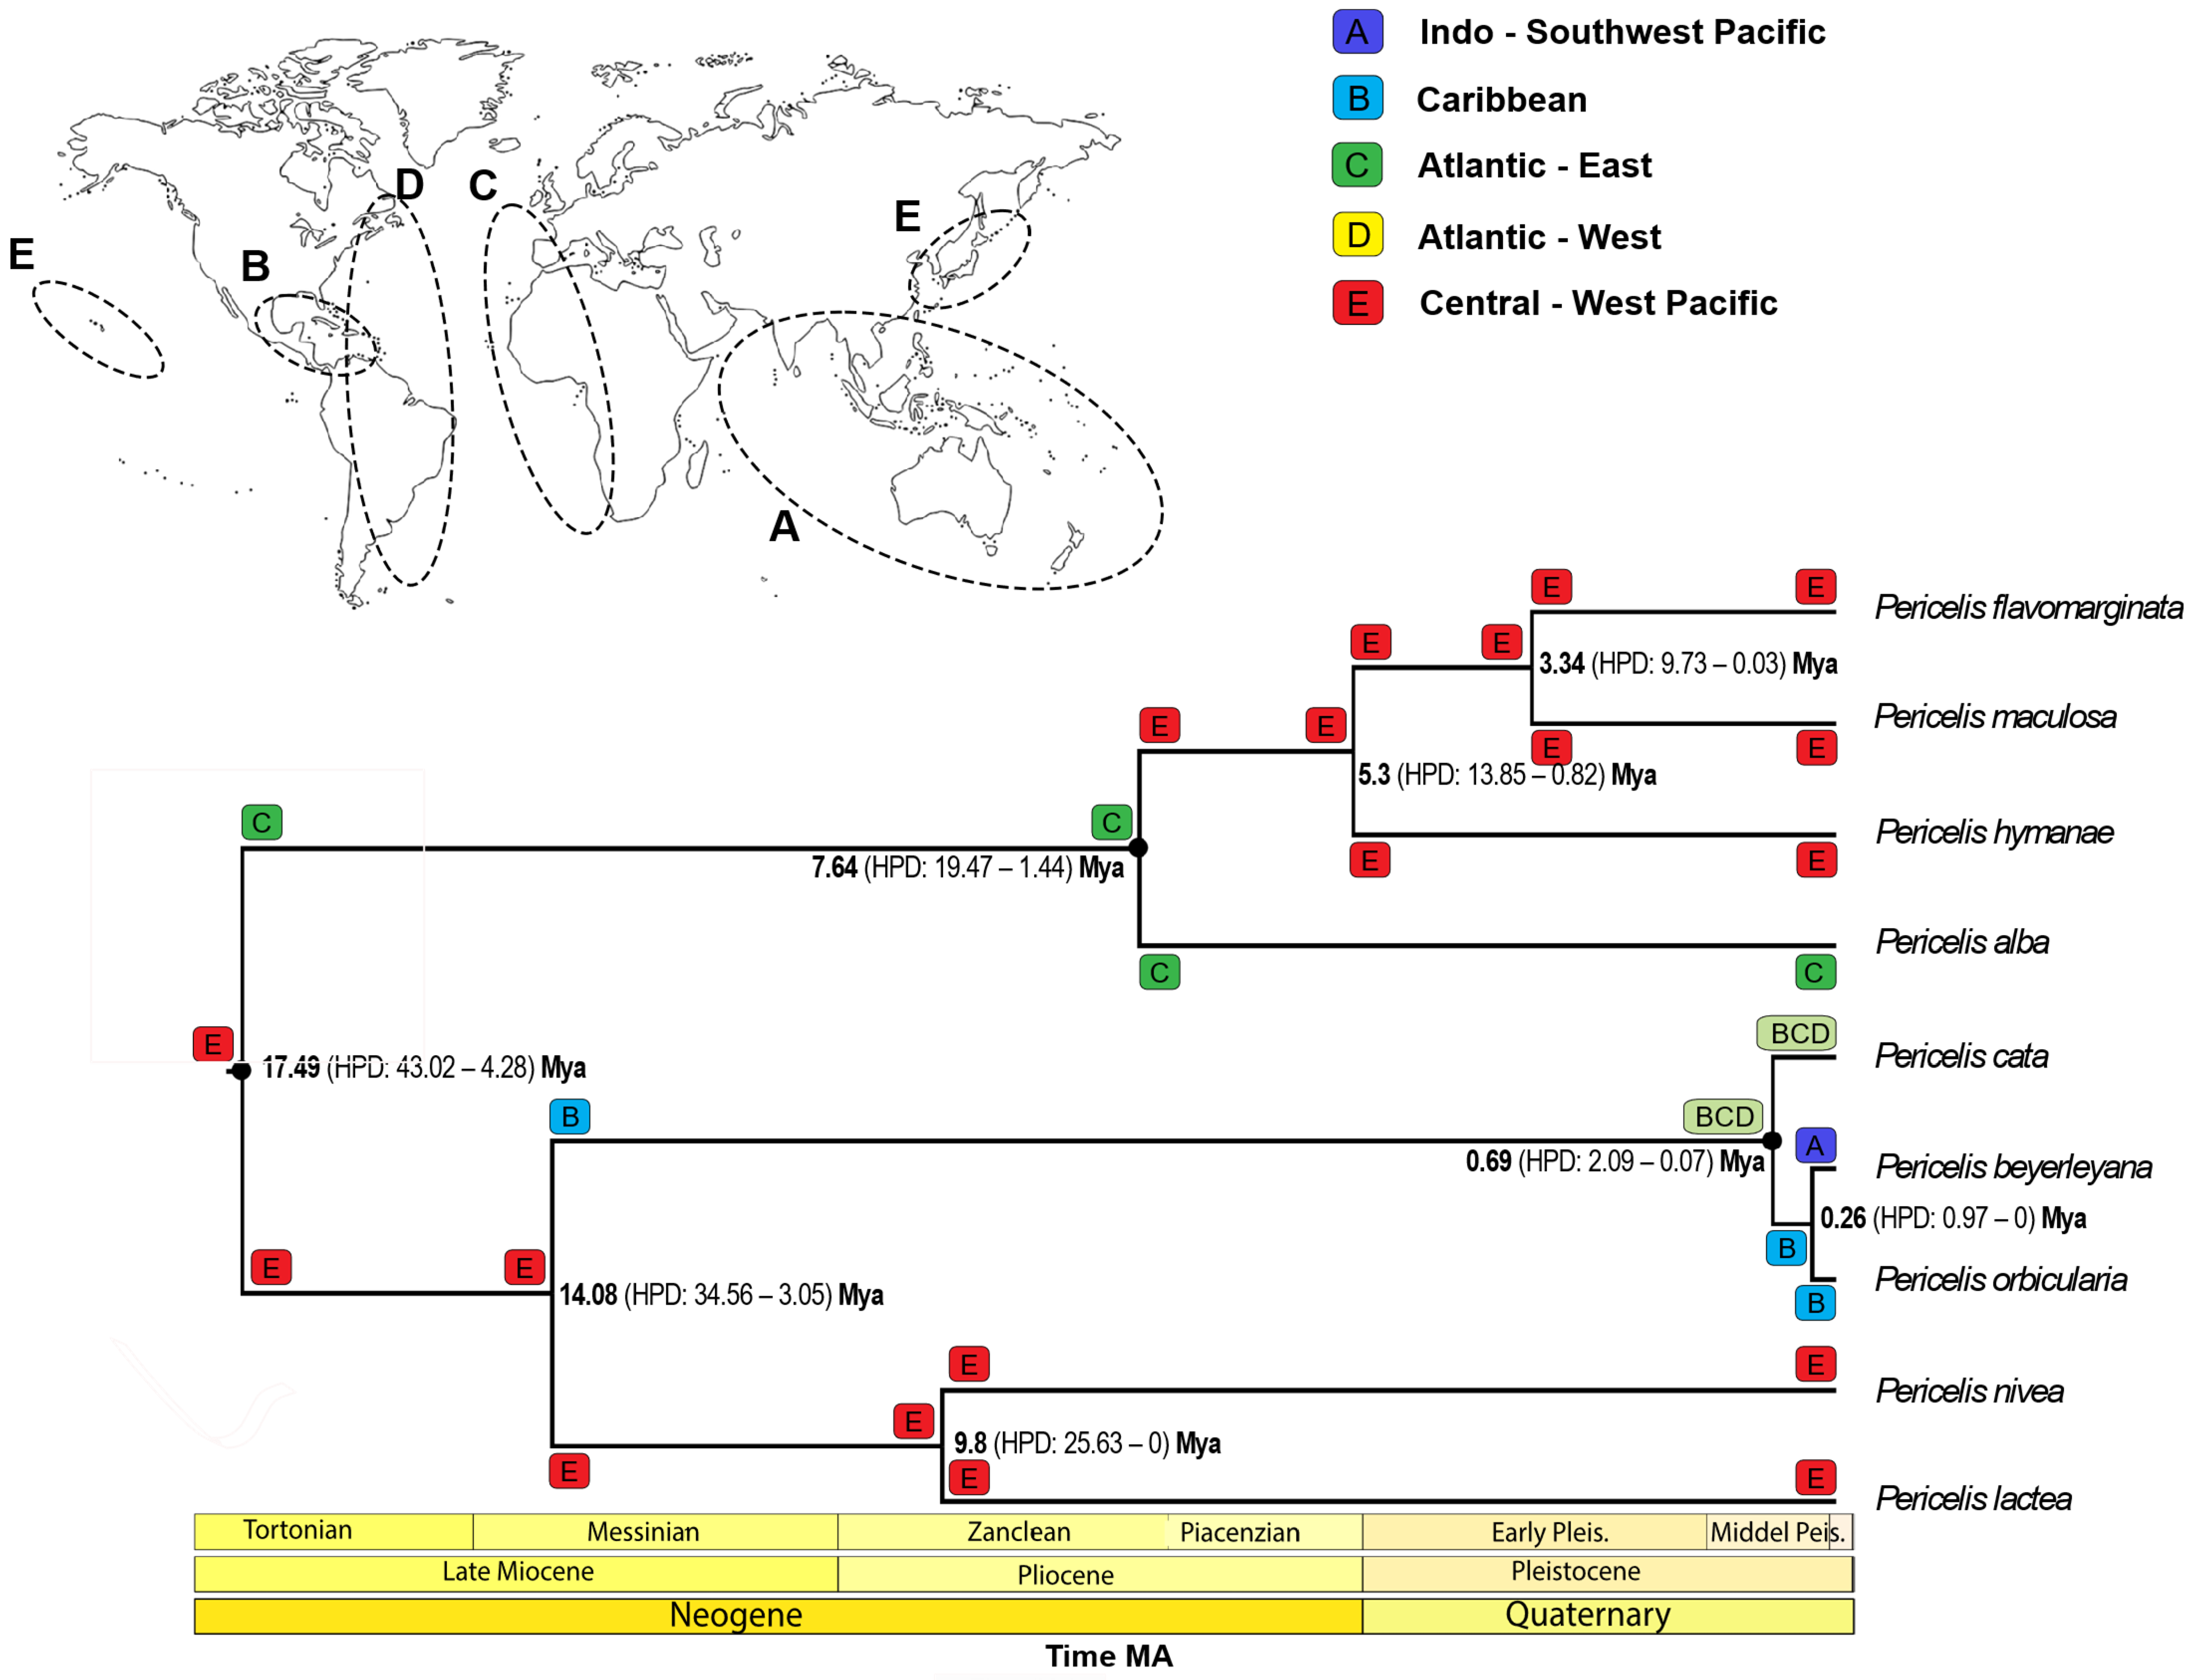
The ancestral-range reconstruction (Figure 4) indicates that the deepest nodes of Pericelis are associated with a broad Central–West Pacific distribution during the Middle–Late Miocene. The earliest reconstructed ancestors occupy the Central–West Pacific (area E), from which the genus subsequently expanded and diversified. An early divergence separated two principal evolutionary lineages 17 Ma: one that remained centred in the western Pacific and another that subsequently gave rise to the Atlantic–Caribbean clade. The Central–West Pacific lineage retained the oldest extant species (P. lactea and P. nivea), whereas later diversification produced P. hymanae, P. flavomarginata, and P. maculosa. In contrast, the Atlantic lineage diversified more recently, leading to P. beyerleyana, P. orbicularia, and P. cata. Notably, P. alba was reconstructed within the Pacific lineage despite its present occurrence in the eastern Atlantic, whereas P. beyerleyana occupies the Atlantic lineage despite its current Indo-Pacific distribution, highlighting the persistence of ancient biogeographic connections between both regions.

4. Discussion

The combined population genetic and biogeographic analyses indicate that Boninia is an ancient, geographically structured lineage whose evolutionary history has been shaped by long-term isolation, vicariance, and episodic long-distance dispersal. The combination of high haplotype diversity and moderate nucleotide diversity at the conservative 28S marker is consistent with the gradual accumulation of divergence over extended evolutionary timescales, a pattern commonly observed in ancient and geographically fragmented marine lineages [37,38,39].
These patterns agree with the ancestral-range reconstruction, which places the origin of Boninia in the Indo-Pacific during the Late Miocene. Although the precise extent of the ancestral range remains uncertain, an Indo-Pacific origin is consistent with the paleoceanographic conditions prevailing at that time, when extensive tropical habitats and high connectivity between the Indian and Pacific oceans promoted the diversification and dispersal of shallow-water marine organisms [40]. The reconstruction of a widespread ancestral distribution followed by geographically restricted descendant lineages suggests that vicariance played a central role in the early diversification of the genus. This scenario also provides a plausible explanation for the apparently anomalous relationships among Japanese, Caribbean, and eastern Pacific species, which may represent remnants of a formerly widespread ancestral lineage subsequently fragmented by extinction and geographic isolation.
The phylogenetic and biogeographic reconstructions identify two principal diversification trajectories. One lineage diversified in the eastern Pacific and subsequently colonized Hawaii, giving rise to the B. uruB. cf. uru clade. Under the DIVA+J model, this pattern is consistent with founder-event speciation, in which dispersal to a newly colonized region was followed by geographic isolation and divergence. The estimated timing of this event (~2.5 Ma) broadly coincides with major sea-level fluctuations during the Late Pliocene and Early Pleistocene, which may have modified connectivity among Pacific Island systems [40]. The second trajectory corresponds to an independent Caribbean radiation that produced B. antillarum, B. divae, and B. oaxaquensis. The placement of B. oaxaquensis within this predominantly Caribbean lineage is compatible with either founder-event dispersal into the eastern Pacific or the persistence of a broader ancestral distribution prior to the emergence of the Isthmus of Panama and the establishment of the Eastern Pacific Barrier.
The position of B. neotethydis provides additional insight into the historical dynamics of the genus. Although its phylogenetic placement remains weakly supported, ancestral-range reconstruction suggests a relatively recent colonization of the Red Sea by a Caribbean–Pacific lineage, followed by regional isolation. Consequently, the occurrence of B. neotethydis is more consistent with secondary colonization than with a Red Sea origin for the genus. An alternative explanation is that its present distribution has been influenced by anthropogenic transport, comparable scenarios have been documented in other marine invertebrates (for example: The planarian Girardia sinensis, which belongs to a group considered exclusive to the Americas, was described from China and is very likely originally from Cuba or the USA [41]). If a similar process has affected B. neotethydis, its current distribution should be interpreted cautiously in historical biogeographic reconstructions.
The strong genetic fragmentation among Caribbean, eastern Pacific, central Pacific, and western Pacific populations is probably reinforced by the biological characteristics of Boninia. Species of this genus are generally small, elongated, with delicate planktonic larvae [42], interstitial, and they lack specialized attachment structures. These traits are expected to limit dispersal capacity and promote long-term population isolation [43]. Consistent with this expectation, each geographic region is characterized by distinct species assemblages, little or no haplotype sharing, and deep phylogenetic divergence among lineages.
Overall, the genetic, ecological, and biogeographic evidence supports Boninia as an early-diverging lineage within Polycladida whose present distribution reflects the combined effects of ancestral-range fragmentation, restricted dispersal, and occasional long-distance colonization. These processes were likely driven by major paleoceanographic events, including the reorganization of tropical oceanic circulation during the Late Miocene, the progressive closure of the Isthmus of Panama, and repeated sea-level fluctuations throughout the Plio-Pleistocene [44,45,46,47].
The integration of phylogenetic inference, molecular dating, areal genetic analyses, and ancestral-range reconstruction provides a coherent framework for understanding the evolutionary history of Pericelis. The ancestral-range reconstruction associates the deepest nodes of the genus with the Central–West Pacific (area E) during the Middle–Late Miocene, identifying this region as the principal centre of early diversification and the source from which Pericelis subsequently expanded. Although the precise extent of the ancestral distribution cannot be reconstructed with complete certainty, the oldest nodes consistently indicate a Central–West Pacific origin, in agreement with Miocene paleoceanographic conditions that promoted connectivity and dispersal among tropical marine regions.
An early divergence at approximately 17 Ma separated two principal evolutionary lineages. One remained centred in the western Pacific, whereas the other subsequently gave rise to the Atlantic–Caribbean clade. The Pacific lineage retains the oldest extant representatives of the genus, P. lactea and P. nivea, followed by the later diversification of P. hymanae, P. flavomarginata, and P. maculosa. In contrast, the Atlantic lineage diversified more recently, giving rise to P. beyerleyana, P. orbicularia, and P. cata. The pronounced phylogeographic structure and substantial genetic differentiation among regional lineages are consistent with long-term geographic isolation following these early divergences, although the ancestral-range reconstruction also indicates subsequent dispersal among regions.
Importantly, the present-day distribution of several species does not correspond directly to the geographic affinities of their phylogenetic lineages. Pericelis alba, currently restricted to the eastern Atlantic, is reconstructed within the Pacific lineage, whereas P. beyerleyana, despite its present Indo-Pacific distribution, belongs to the Atlantic lineage. These reciprocal distribution patterns indicate that the evolutionary history of Pericelis cannot be explained solely by present-day ranges or by a single process. They may preserve signatures of historical connections between the Atlantic and Indo-Pacific regions, although independent long-distance dispersal cannot be excluded. Similarly, the reconstruction of the P. beyerleyanaP. cataP. orbicularia clade supports dispersal followed by regional diversification in the Caribbean, demonstrating that long-distance colonization also contributed to the evolution of the genus.
Taken together, the results support a dynamic evolutionary history involving several recurrent processes. Pericelis originated and began diversifying in the Central–West Pacific during the Miocene, followed by an early separation of major regional lineages, long-term persistence and diversification within ancestral regions, and subsequent episodes of dispersal, vicariance, and regional isolation. Thus, rather than representing a simple history of either progressive fragmentation of a formerly widespread ancestor or repeated colonization events, the present-day diversity of Pericelis reflects the combined effects of geographic isolation and dispersal operating at different times throughout its evolutionary history. This interpretation is consistent with the ancestral-range reconstruction and provides a more balanced explanation for the mismatch between present-day species distributions and their phylogenetic relationships.

5. Conclusions

The integration of population genetics, phylogenetic inference, molecular dating, and ancestral-range reconstruction provides a coherent evolutionary framework for understanding the origin and diversification of the basal polyclad genera Boninia and Pericelis. Despite marked differences in their taxonomy, ecology, and current distributions, both genera share several fundamental evolutionary patterns: they originated in the tropical Indo-Pacific during the Miocene, exhibit pronounced phylogeographic structure and limited historical gene flow, and retain deeply divergent regional lineages indicative of long-term evolutionary persistence. Collectively, these results show that their contemporary distributions are the outcome of Miocene diversification, prolonged geographic isolation, and occasional long-distance dispersal, while their genetic patterns still preserve signatures of ancient geological and oceanographic processes operating over millions of years.
Despite this common evolutionary framework, Boninia and Pericelis followed different biogeographic trajectories. The diversification of Boninia was driven primarily by vicariant fragmentation of an ancestral range, followed by occasional founder-event dispersal that generated isolated regional radiations. In contrast, Pericelis retains evidence of a formerly widespread tropical ancestor, whose ancient distribution persists through reciprocal relict lineages, such as P. alba and P. beyerleyana, linking the Atlantic and Indo-Pacific regions and subsequently undergoing independent regional diversification. These complementary histories demonstrate that closely related marine taxa can respond differently to the same geological and oceanographic changes while developing similarly strong regional genetic differentiation.

Author Contributions

Conceptualization, C.N., A.M., D.C. and J.P.M.; methodology, D.C. and J.P.M.; software, J.P.M.; formal analysis, D.C. and J.P.M.; investigation, C.N., A.M. and D.C.; writing—original draft preparation, C.N.; writing—review and editing, C.N., D.C. and A.M. All authors have read and agreed to the published version of the manuscript.

Funding

This research received no external funding. We acknowledge the financial support provided to J.P.M. through fellowship contract PTA2023-023686-I.

Institutional Review Board Statement

The polyclad flatworms (Polycladida, Platyhelminthes) examined in this study are free-living marine invertebrates that are not protected species and are not covered by regulations requiring ethical approval for their use in research; therefore, no specific ethical approval was required for this study. Most nucleotide sequences analysed were obtained from the publicly available GenBank database. The additional specimens from Costa Rica were collected during a field-sampling trip associated with the University Master’s Degree in Biodiversity in Tropical Areas and Conservation (UIMP-CSIC), under the relevant permits and authorizations granted by the Government of Costa Rica. The authors gratefully acknowledge the Ministry of Environment and Energy of Costa Rica (MINAE) for the permits and approvals required for sampling within Las Baulas National Marine Park, as well as the National Commission for the Management of Biodiversity (CONAGEBIO) for the authorization to conduct genetic characterization of the collected material. The authors also sincerely thank Rotney Piedra Chacón, administrator of Las Baulas National Marine Park, and the Park staff for their support and assistance during fieldwork.

Data Availability Statement

The data presented in this study are available in the same manuscript.

Acknowledgments

The successful completion of this study would not have been possible without the valuable assistance of the Histology and Molecular Laboratories of the National Museum of Natural Sciences (Madrid, Spain). We are particularly grateful to Lourdes Alcaraz and Iván Acevedo for their invaluable support and advice during the molecular processing of the samples, and to Gemma González for her invaluable assistance with the histological processing.

Conflicts of Interest

The authors declare no conflicts of interest.

References

  1. Goodheart, J.A.; Collins, A.G.; Cummings, M.P.; Egger, B.; Rawlinson, K.A. A phylogenomic approach to resolving interrelationships of polyclad flatworms, with implications for life history evolution. R. Soc. Open Sci. 2023, 10, 220939. [Google Scholar] [CrossRef] [Scilit]
  2. Cuadrado, D.; Machordom, A.; Noreña, C. A deep-time perspective on Polycladida (Platyhelminthes) through integrated phylogenetic and molecular clock analyses. Org. Divers. Evol. 2026, 26, 47–65. [Google Scholar] [CrossRef] [Scilit]
  3. Tsuyuki, A.; Norenburg, J.; Leasi, F.; Curini-Galletti, M. Molecular phylogeny of Boninia (Platyhelminthes: Polycladida), with description of a new species from the Pacific coasts of Panama. Invertebr. Syst. 2024, 38, IS24009. [Google Scholar] [CrossRef] [Scilit]
  4. Bock, S. Boninia, a new polyclad genus from the Pacific. Nova Acta Regiae Soc. Sci. Upsal. 1923, 4, 1–32. [Google Scholar]
  5. Hyman, L.H. Some polyclad flatworms from the West Indies and Florida. Proc. U. S. Natl. Mus. 1955, 104, 115–150. [Google Scholar] [CrossRef] [Scilit]
  6. Du Bois-Reymond Marcus, E.; Marcus, E. Polycladida from Curaçao and faunistically related regions. Stud. Fauna Curaçao Other Caribb. Isl. 1968, 26, 1–133. [Google Scholar]
  7. Curini-Galletti, M.; Campus, P. Boninia neotethydis sp. nov. (Platyhelminthes: Polycladida: Cotylea)—The first lessepsian flatworm. J. Mar. Biol. Assoc. U. K. 2007, 87, 435–442. [Google Scholar] [CrossRef] [Scilit]
  8. Laumer, C.E.; Giribet, G. Inclusive taxon sampling suggests a single, stepwise origin of ectolecithality in Platyhelminthes. Biol. J. Linn. Soc. 2014, 111, 570–588. [Google Scholar] [CrossRef] [Scilit]
  9. Ramos-Sánchez, M.; Bahia, J.; Bastida-Zavala, J.R. Five new species of cotylean flatworms (Platyhelminthes: Polycladida: Cotylea) from Oaxaca, southern Mexican Pacific. Zootaxa 2020, 4819, 49–83. [Google Scholar] [CrossRef] [Scilit]
  10. Soutullo, P.; Cuadrado, D.; Noreña, C. First study of the Polycladida (Rhabditophora, Platyhelminthes) from the Pacific coast of Costa Rica. Zootaxa 2021, 4964, 363–381. [Google Scholar] [CrossRef] [Scilit]
  11. Tsuyuki, A.; Oya, Y.; Kajihara, H. Reversible shifts between interstitial and epibenthic habitats in evolutionary history: Molecular phylogeny of the marine flatworm family Boniniidae (Platyhelminthes: Polycladida: Cotylea) with descriptions of two new species. PLoS ONE 2022, 17, e0276847. [Google Scholar] [CrossRef] [Scilit]
  12. Faubel, A. The Polycladida, Turbellaria; Proposal and establishment of a new system. Part II. The Cotylea. Mitt. Hamb. Zool. Mus. Inst. 1984, 81, 189–259. [Google Scholar]
  13. Faubel, A. The Polycladida, Turbellaria; Proposal and establishment of a new system. Part I. The Acotylea. Mitt. Hamb. Zool. Mus. Inst. 1983, 80, 17–121. [Google Scholar]
  14. Litvaitis, M.K.; Bolaños, D.M.; Quiroga, S.Y. The phylogeny of Polycladida (Platyhelminthes) inferred from ribosomal DNA sequences. Zool. J. Linn. Soc. 2019, 186, 1067–1084. [Google Scholar]
  15. Briggs, J.C. The east pacific barrier and the distribution of marine shore fishes. Evolution 1961, 15, 545–554. [Google Scholar] [CrossRef] [Scilit]
  16. Romero-Torres, M.; Treml, E.A.; Acosta, A.; Paz-García, D.A. The Eastern Tropical Pacific coral population connectivity and the role of the Eastern Pacific Barrier. Sci. Rep. 2018, 8, 9354. [Google Scholar] [CrossRef] [Scilit]
  17. Oya, Y.; Moritaki, T.; Tsuyuki, A. Description of a new species of Pericelis (Polycladida, Diposthidae) from sunken wood in the bathyal zone in Japan. J. Mar. Biol. Assoc. U. K. 2024, 104, e12. [Google Scholar] [CrossRef] [Scilit]
  18. Velasquez, X.; Bolaños, D.M.; Benayahu, Y. New records of cotylean flatworms (Platyhelminthes, Polycladida, Rhabditophora) from coastal habitats of Israel. Zootaxa 2018, 4438, 237–260. [Google Scholar] [CrossRef] [Scilit]
  19. Laidlaw, F.F. The marine Turbellaria, with an account of the anatomy of some of the species. In The Fauna and Geography of the Maldive and Laccadive Archipelagoes; Gardiner, J.S., Ed.; Cambridge University Press: Cambridge, UK, 1902; Volume 1, pp. 282–312. [Google Scholar]
  20. Tajika, K.-I.; Raj, U.; Horiuchi, S.; Koshida, Y. Polyclad turbellarians collected on the Osaka University expedition to Viti Levu, Fiji, in 1985, with remarks on distribution and phylogeny of the genus Discoplana. Hydrobiologia 1991, 227, 333–340. [Google Scholar] [CrossRef] [Scilit]
  21. Dittmann, I.L.; Dibiasi, W.; Noreña, C.; Egger, B. Description of the snail-eating flatworm in marine aquaria, Pericelis tectivorum sp. nov. (Polycladida, Platyhelminthes). Zootaxa 2019, 4565, 383–397. [Google Scholar] [CrossRef] [Scilit]
  22. Kearse, M.; Moir, R.; Wilson, A.; Stones-Havas, S.; Cheung, M.; Sturrock, S.; Buxton, S.; Cooper, A.; Markowitz, S.; Duran, C.; et al. Geneious Basic: An integrated and extendable desktop software platform for the organization and analysis of sequence data. Bioinformatics 2012, 28, 1647–1649. [Google Scholar] [CrossRef] [Scilit]
  23. Katoh, K.; Standley, D.M. MAFFT Multiple Sequence Alignment Software Version 7: Improvements in Performance and Usability. Mol. Biol. Evol. 2013, 30, 772–780. [Google Scholar] [CrossRef] [Scilit]
  24. Castresana, J. Selection of conserved blocks from multiple alignments for their use in phylogenetic analysis. Mol. Biol. Evol. 2000, 17, 540–552. [Google Scholar] [CrossRef] [Scilit]
  25. Trifinopoulos, J.; Nguyen, L.T.; von Haeseler, A.; Minh, B.Q. W-IQ-TREE: A fast online phylogenetic tool for maximum likelihood analysis. Nucleic Acids Res. 2016, 44, W232–W235. [Google Scholar] [CrossRef] [Scilit]
  26. Letunic, I.; Bork, P. Interactive tree of life (iTOL) v3: An online tool for the display and annotation of phylogenetic and other trees. Nucleic Acids Res. 2016, 44, W242–W245. [Google Scholar] [CrossRef] [Scilit]
  27. Librado, P.; Rozas, J. DnaSP v5: A software for comprehensive analysis of DNA polymorphism data. Bioinformatics 2009, 25, 1451–1452. [Google Scholar] [CrossRef] [Scilit]
  28. Clement, M.; Snell, Q.; Walke, P.; Posada, D.; Crandall, K. TCS: Estimating gene genealogies. In Proceedings of the 16th International Parallel and Distributed Processing Symposium, Lauderdale, FL, USA, 15–19 April 2002; Volume 2, p. 184. [Google Scholar]
  29. Heled, J.; Drummond, A.J. Bayesian Inference of Species Trees from Multilocus Data. Mol. Biol. Evol. 2010, 27, 570–580. [Google Scholar] [CrossRef] [Scilit]
  30. Bouckaert, R.; Vaughan, T.G.; Barido-Sottani, J.; Duchêne, S.; Fourment, M.; Gavryushkina, A.; Heled, J.; Jones, G.; Kühnert, D.; De Maio, N.; et al. BEAST 2.5: An advanced software platform for Bayesian evolutionary analysis. PLoS Comput. Biol. 2019, 15, e1006650. [Google Scholar] [CrossRef] [Scilit]
  31. Scarpa, F.; Cossu, P.; Sanna, D.; Lai, T.; Norenburg, J.L.; Curini-Galletti, M.; Marco Casu, M. An 18S and 28S-based clock calibration for marine Proseriata (Platyhelminthes). J. Exp. Mar. Biol. Ecol. 2015, 463, 22–31. [Google Scholar] [CrossRef] [Scilit]
  32. Rambaut, A.; Drummond, A.J. Tracer v1. 4: MCMC Trace Analyses Tool. 2007. Available online: http://tree.bio.ed.ac.uk/software/tracer (accessed on 3 September 2026).
  33. Matzke, N.J. BioGeoBEARS: BioGeography with Bayesian (and Likelihood) Evolutionary Analysis in R Scripts, Version 0.2.1; University of California: Berkeley, CA, USA, 2013. [Google Scholar]
  34. Ree, R.H.; Moore, B.R.; Webb, C.O.; Donoghue, M.J. A Likelihood Framework for Inferring the Evolution of Geographic Range on Phylogenetic Trees. Evolution 2005, 59, 2299–2311. [Google Scholar] [CrossRef] [Scilit]
  35. Ronquist, F. Dispersal-Vicariance Analysis: A New Approach to the Quantification of Historical Biogeography. Syst. Biol. 1997, 46, 195–203. [Google Scholar] [CrossRef]
  36. Landis, M.J.; Matzke, N.J.; Moore, B.R.; Huelsenbeck, J.P. Bayesian Analysis of Biogeography when the Number of Areas is Large. Syst. Biol. 2013, 62, 789–804. [Google Scholar] [CrossRef] [Scilit]
  37. Avise, J.C. Phylogeography: The History and Formation of Species; Harvard University Press: Cambridge, MA, USA, 2000; 464p. [Google Scholar]
  38. Hellberg, M.E.; Burton, R.S.; Neigel, J.E.; Palumbi, S.R. Genetic assessment of connectivity among marine populations. Bull. Mar. Sci. 2002, 70, 273–290. [Google Scholar]
  39. Lessios, H.A. The Great American Schism: Divergence of marine organisms after the rise of the Central American Isthmus. Annu. Rev. Ecol. Evol. Syst. 2008, 39, 63–91. [Google Scholar] [CrossRef] [Scilit]
  40. Ludt, W.B.; Rocha, L.A. Shifting seas: The impacts of Pleistocene sea-level fluctuations on the evolution of tropical marine taxa. J. Biogeogr. 2015, 42, 399–415. [Google Scholar] [CrossRef] [Scilit]
  41. Catalá, A.; Benítez-Álvarez, L.; Diez, Y.L.; Blasco, G.; Riutort, M. Treasure Island: DNA data reveals unknown diversity in Cuban freshwater planarians (Platyhelminthes: Tricladida). Zoologia 2024, 41, e23101. [Google Scholar] [CrossRef] [Scilit]
  42. Dittmann, I.L.; Bertemes, P.; Gotsis, C.; Grosbusch, A.L.; Redl, S.; Hess, M.W.; Salvenmoser, W.; Egger, B. The ultrastructure of the apical organ of Curini-Galletti’s larva, a new polyclad larval type. Cell Bio. Int. 2024, 48, 682–694. [Google Scholar] [CrossRef] [Scilit]
  43. Rawlinson, K. The diversity, development and evolution of polyclad flatworm larvae. EvoDevo 2014, 5, 9. [Google Scholar] [CrossRef] [Scilit]
  44. Gallagher, S.J.; Auer, G.; Brierley, C.M.; Craig, S.; Fulthorpe, C.S.; Robert Hall, R. Cenozoic History of the Indonesian Gateway. Annu. Rev. Earth Planet. Sci. 2024, 52, 581–604. [Google Scholar] [CrossRef] [Scilit]
  45. Haug, G.; Tiedemann, R. Effect of the formation of the Isthmus of Panama on Atlantic Ocean thermohaline circulation. Nature 1998, 393, 673–676. [Google Scholar] [CrossRef] [Scilit]
  46. Lyle, M.; Barron, J.; Bralower, T.J.; Huber, M.; Lyle, A.O.; Ravelo, A.C.; Rea, D.K.; Wilson, P.A. Pacific Ocean and Cenozoic evolution of climate. Rev. Geophys. 2008, 46, RG2002. [Google Scholar] [CrossRef] [Scilit]
  47. Miller, K.G.; Mountain, G.S.; Wright, J.D.; Browning, J.V. A 180-million-year record of sea level and ice volume variations from continental margin and deep-sea isotopic records. Oceanography 2011, 24, 40–53. [Google Scholar] [CrossRef] [Scilit]
Figure 1. Geographic distribution, haplotype network, and phylogenetic relationships of Boninia inferred from 28S sequences. Circle size is proportional to the number of individuals, colours indicate sampling regions, and hatch marks represent mutational steps between haplotypes. The Maximum Likelihood tree shows the correspondence between haplotypes and species-level lineages (bootstrap values > 50%). The photograph depicts Boninia oaxaquensis from the Eastern Pacific (Costa Rica).
Diversity 18 00566 g001
Figure 2. Biogeographic history of Boninia inferred under a strict molecular clock using the 28S rRNA dataset. Divergence times were estimated using an external 28S substitution rate from Scarpa and co-workers [31] derived from other Platyhelminthes. Node ages are shown at each node, with 95% highest posterior density (HPD) intervals given in parentheses. Black dots mark well-supported species clades (Bayesian posterior probability, BPP > 0.95). Branches coloured red indicate inferred jump-dispersal (founder-event) occurrences.
Diversity 18 00566 g002
Figure 3. TCS haplotype network (upper panel) and Maximum Likelihood phylogeny (lower panel) of the 17 Pericelis haplotypes inferred from partial 28S rDNA sequences. Circle sizes represent haplotype frequency, colours indicate sampling regions, and black dots correspond to inferred intermediate haplotypes. Bootstrap values (>50%) are shown on the ML tree. Haplotype designations are identical in both analyses. Please note that Pericelis tectivorum (Hap 15 and 16) are artificial aquarium populations; therefore, their locations on the map are not possible to determine.
Diversity 18 00566 g003
Figure 4. Time-calibrated phylogeny and ancestral-range reconstruction of Pericelis inferred with BioGeoBEARS under the best-fitting DEC+J model (LnL = −15.56; d = 0.0055, e = 0, j = 0.0949). Letters correspond to the predefined geographic areas shown in the inset map. Node ages are shown at each node, with 95% highest posterior density (HPD) intervals given in parentheses. Black dots mark well-supported species clades (Bayesian posterior probability, BPP > 0.95). Branches coloured red indicate inferred jump-dispersal (founder-event) occurrences.
Diversity 18 00566 g004
Table 1. Taxa of Boninia and Pericelis included in this study, indicating GenBank accession numbers, species names, sampling localities, haplotype designation, and geographic areas. (Question marks (¿?): location and Geographic Areas unknown).
BONINIA
Acc NumSpeciesLocalitiesHaplotypeGeographic Areas
LC795622Boninia cf. uru Hawai USAHap 1Pacific
LC795621B. cf. uru Hawai USAHap 1Pacific
LC795620B. cf. uru Hawai USAHap 1Pacific
LC699277B. uruJapan-OkinawaHap 1West Pacific
LC699276B. uruJapan-OkinawaHap 1West Pacific
LC699275B. uruJapan-OkinawaHap 1West Pacific
LC795619B. panamensisPacific PanamaHap 2East-Pacific
LC795618B. panamensisPacific PanamaHap 3East-Pacific
LC795617B. oaxaquensisPacific Panama Hap 4East-Pacific
LC795616B. oaxaquensisPacific Panama Hap 4East-Pacific
LC699282B. yambarensisJapan-OkinawaHap 7West Pacific
LC699281B. yambarensisJapan-OkinawaHap 7West Pacific
LC699279B. yambarensisJapan-OkinawaHap 7West Pacific
LC699278B. yambarensisJapan-OkinawaHap 7West Pacific
LC699280B. yambarensisJapan-OkinawaHap 8West Pacific
MH700282B. antillarumVirgin IslandHap 5Caribbean
MH700279 B. antillarumColombiaHap 5Caribbean
MH700280 B. antillarumCurasaoHap 6Caribbean
MH700281B. antillarumJamaicaHap 6Caribbean
KC869846B. divae/B. antillarumCaribbeanHap 5Caribbean
MH700283 B. neotethydisIsraelHap 9Red Sea
MZ292834 B. oaxaquensisCosta RicaHap 4East-Pacific
PZ952909PL27-B. oaxaquensisCosta RicaHap 4East-Pacific
PZ952912PL36-B. oaxaquensisCosta RicaHap 4East-Pacific
PZ952908PL35-B. oaxaquensisCosta RicaHap 4East-Pacific
PZ952907PL20-B. oaxaquensisCosta RicaHap 4East-Pacific
PZ952911PL31-B. oaxaquensisCosta RicaHap 4East-Pacific
PZ952910PL28-B. oaxaquensisCosta RicaHap 4East-Pacific
PERICELIS
Acc NumSpeciesLocalitiesHaplotypeGeographic Areas
MH047291P. beyerleyanaIsrael Red SeaHap 9Indo-West Pacific
EU679116P. orbiculariaVirgin Is. Hap 3Caribbean
MH700340P. orbiculariaVirgin Is. Hap 3Caribbean
MH700341P. orbiculariaVirgin Is. Hap 3Caribbean
MK299374P. orbiculariaMaritnica Hap 14Caribbean
MK299354P. albaCabo VerdeHap 13Atlantic-East
MK299352P. cataCabo VerdeHap 12Atlantic-East
MK299373P. cataCabo VerdeHap 12Atlantic-East
MT677885P. cataGulf of MexicoHap 17Atlantic-West
EU679114P. cataFloridaHap 1Atlantic-West
EU679115P. cataFloridaHap 2Atlantic-West
KY263700P. cataBrazilHap 2Atlantic-West
MH700336P. cataJamaica Hap 2Caribbean
MH700338P. cataVirgin Is. Hap 2Caribbean
MH700337P. cataPanamaHap 10Caribbean
LC568535P. flavomarginataJapanHap 7West Pacific
LC568536P. flavomarginataJapanHap 7West Pacific
LC568537P. flavomarginataJapanHap 7West Pacific
LC699190P. maculosaJapanHap 5West Pacific
LC699192P. maculosaJapanHap 6West Pacific
LC699191P. maculosaJapanHap 6West Pacific
MH700339P. hymanaeAustraliaHap 11West Pacific
LC699189P. lacteaJapanHap 4West Pacific
LC794542P. niveaJapanHap 8West Pacific
MN384695P. tectivorumAquariumHap 15¿?
MK181524P. tectivorumAquariumHap 15¿?
MK181525P. tectivorumAquariumHap 15¿?
MK181527P. tectivorumAquariumHap 15¿?
MK181526P. tectivorumAquariumHap 16¿?
Table 2. Summary of genetic diversity indices for Boninia from Hawaii (USA), Japan, the Eastern Pacific and the Caribbean.
Geographic Region 1:
Hawaii/USA
Geographic Region 2:
Japan
Geographic Region 3:
Eastern Pacific (Panama and Costa Rica)
Geographic Region 4:
Caribbean
Number of sequences, N:3
Boninia cf. uru
Number of sequences, N: 8
Boninia uru (3 sequences) Boninia yambarensis (5 sequences)
Number of sequences N:11
Boninia oaxaquensis
(9 sequences)
Boninia panamensis
(2 sequences)
Number of sequences N: 5
Boninia antillarum
Segregating sites, S: 0Segregating sites, S: 27Segregating sites, S: 55Segregating sites, S: 1
Haplotypes nr., h:1
Hap_1: Boninia uru
Haplotypes nr., h:3
Hap_1: Boninia uru,
Hap_7, Hap_8:
Boninia yambarensis
Haplotypes nr., h:3
Hap_2, Hap 3:
B. panamensis
from Panama
Hap_4: B. oaxaquensis from Costa Rica
Haplotypes nr., h:2
Hap_5: Boninia antillarum from Virgin Island, Colombia, Caribbean Sea.
Hap_6: Boninia antillarum from Curazao, Jamaica
Haplotype diversity (Hd/Hs) 0Haplotype diversity
(Hd / Hs) 0.67
Haplotype diversity (Hd/Hs) 0.45Haplotype diversity
(Hd/Hs) 0.6
Nucleotide diversity (π) 0.00000Nucleotide diversity (π) 0.01633Nucleotide diversity (π) 0.01529Nucleotide diversity (π)0.00068
Table 3. Comparison of the biogeographic models estimated in BioGeoBEARS for Boninia species. Model selection was performed using AICc, and the best-fit model was subsequently used to infer the most likely ancestral ranges across the MCC tree.
Model−lnLAICcdejΔAICc
DIVALIKE + j−10.1932.371.0 × 10−121.0 × 10−123.8 × 10−10.0 × 100
DEC + J−10.5533.101.0 × 10−121.0 × 10−124.5 × 10−17.2 × 10−1
DIVALIKE−13.6933.797.0 × 10−24.0 × 10−90.0 × 1001.4 × 100
BAYAREALIKE + j−11.2434.481.0 × 10−121.0 × 10−123.9 × 10−12.1 × 100
DEC−18.2542.899.7 × 10−28.0 × 10−20.0 × 1001.1 × 101
BAYAREALIKE−24.5855.561.4 × 10−13.4 × 10−10.0 × 1002.3 × 101
Table 4. Summary of genetic diversity indices for Pericelis from an Aquarium and the regions of the Caribbean, Atlantic-West, Atlantic-East, and West Pacific.
AquariumGeographic Region 1 CaribbeanGeographic Region 2
Atlantic-West
Geographic Region 3 Atlantic-EastGeographic Region 4
West-Pacific
Number
of sequences: 5
P. tectivorum
Number
of sequences: 7
P. orbicularia
(4 sequences)
P. cata
(3 sequences).
Number
of sequences: 4
P. cata
Number
of sequences: 3
P. cata
(2 sequences)
P. alba
(1 sequence)
Number
of sequences: 9
P. flavomarginata
(3 sequences),
P. maculosa
(3 sequences),
P. lactea
(1 sequence),
P. nivea (1 sequence)
P. hymanae
(1 sequence)
Number
of segregating sites
S: 1
Number
of segregating sites
S: 31
Number
of segregating sites
S: 10
Number
of segregating sites
S: 44
Number
of segregating sites
S: 71
Number
of haplotypes, h: 2,
Hap_15: 4 sequences.
Hap_16: 1 sequence
Number
of haplotypes, h: 4.
Hap_2: P. cata
Jamaica, Virgin Is. Hap_3: P. orbicularia Virgin Island;
Hap_10: P. cata
Panama-Caribbean Hap_14:
P. orbicularia
Martinique
Number
of haplotypes, h: 3,
Hap_1:
Pericelis cata
Gulf of Mexico,
Hap_2:
P. cata
Florida, Brazil,
Hap_17:
Pericelis cata
Florida
Number
of haplotypes, h: 2.
Hap_12: Pericelis cata
Hap_13: Pericelis alba
Number
of haplotypes, h: 6.
Hap_4: P. láctea;
Hap_5: P. maculosa
Hap_6: P. maculosa Hap_7:
P. flavomarginata;
Hap_8: P. nívea.
Hap_11: P. hymanae
Haplotype diversity,
Hd: 0.40000
Haplotype diversity,
Hd: 0.80952
Haplotype diversity,
Hd: 0.83
Haplotype diversity,
Hd: 0.66
Haplotype diversity,
Hd: 0.88
Nucleotide diversity,
π: 0.00044
Nucleotide diversity,
π: 0.01919
Nucleotide diversity,
π: 0.0067
Nucleotide diversity,
π: 0.031
Nucleotide diversity,
π: 0.029
Table 5. Comparison of the biogeographic models estimated in BioGeoBEARS for Pericelis species. Model selection was performed using AICc, and the best-fit model was subsequently used to infer the most likely ancestral ranges across the MCC tree.
Model−lnLAICcdejΔAICc
BAYAREALIKE + J −14.5039.790.00000.00000.21480.0000
DEC + J−15.5641.920.00550.00000.09492.1282
DIVALIKE + J−16.4843.750.00690.00000.15433.9582
DIVALIKE−19.3944.780.01800.00000.00004.9853
DEC−20.3346.650.01280.00000.00006.8591
BAYAREALIKE−29.4864.960.02380.09660.000025.1646
Disclaimer/Publisher’s Note: The statements, opinions and data contained in all publications are solely those of the individual author(s) and contributor(s) and not of MDPI and/or the editor(s). MDPI and/or the editor(s) disclaim responsibility for any injury to people or property resulting from any ideas, methods, instructions or products referred to in the content.