Article

eDNA Metabarcoding Reveals Spatial Patterns of Marine Communities Along the Beagle Channel (Tierra del Fuego, Argentina)


by
Marianela Veyñ
1,2,†,
Julieta Sánchez
1,†,
Sebastian Poljak
1,3,
Facundo Manuel Llompart
4,5,
Soledad Lorena Diodato
1,3,
Karen Daiana Montaño
3,
Lu Denisse Chiberry
1,
Melina Pellegrino
1,
Luciana Riccialdelli
1,
Sergio Matías Delpiani
1,3,
Natalia Dellabianca
1 and
Cristina Fernanda Nardi
3,6,*
1
Centro Austral de Investigaciones Científicas (CADIC), Consejo Nacional de Investigaciones Científicas y Técnicas (CONICET), Ushuaia 9410, Argentina
2
Departamento de Biodiversidad y Biología Experimental, Facultad de Ciencias Exactas y Naturales, Universidad de Buenos Aires, Ciudad Autónoma de Buenos Aires C1428EGA, Argentina
3
Instituto de Ciencias Polares, Ambiente y Recursos Naturales, Universidad Nacional de Tierra del Fuego (ICPA-UNTDF), Ushuaia 9410, Argentina
4
Instituto de Limnología “Dr. Raúl A. Ringuelet”—ILPLA (Consejo Nacional de Investigaciones Científicas y Técnicas—Universidad Nacional de La Plata), La Plata B1900, Argentina
5
Facultad de Ciencias Naturales y Museo, Universidad Nacional de La Plata, La Plata B1900, Argentina
6
Consejo Nacional de Investigaciones Científicas y Técnicas (CONICET), Ciudad Autónoma de Buenos Aires C1425FQB, Argentina
*
Author to whom correspondence should be addressed.
These authors contributed equally to this work.
Diversity 2026, 18(8), 468; https://doi.org/10.3390/d18080468
Submission received: 3 July 2026 / Revised: 28 July 2026 / Accepted: 30 July 2026 / Published: 3 August 2026

Abstract

The Beagle Channel, located south of Tierra del Fuego (~54° S), is South America’s southernmost intracoastal ecosystem. Here, we applied environmental DNA metabarcoding using a partial sequence of the 12sRNA mitochondrial gene to evaluate the seasonal and spatial dynamics of marine vertebrate communities along the longitudinal gradient of the Beagle Channel. Water samples were collected across seasons and sites spanning the central and eastern sectors of the channel. Vertebrate DNA was amplified and analyzed against a custom reference database enriched with locally generated sequences. A total of 43 vertebrate taxa were detected, including 25 fish, 13 mammals, and 5 seabirds. Vertebrate assemblages were spatially structured along the longitudinal gradient of the Beagle Channel, with the central sector characterized by higher relative abundances of Fuegian sprat (Sprattus fuegensis), Southern elephant seal (Mirounga leonina), South American fur seal (Arctocephalus australis), and domestic species, whereas the eastern sector showed higher relative abundances of fish species including silversides (Odontesthes spp.), Magellanic rockcod (Paranotothenia magellanica), and striped rockcod (Trematomus hansoni), as well as mammals including southern sea lion (Otaria flavescens), North American beaver (Castor canadensis), and native grass mice (Abrothrix spp.). This spatial differentiation was associated with contrasting environmental conditions. No significant seasonal effect was detected. This study provides the first environmental DNA-based baseline of marine vertebrates on the Beagle Channel and validates this approach for ecosystem-scale biodiversity monitoring in subantarctic coastal environments.

1. Introduction

Community biomonitoring has become increasingly essential amid global change, as biodiversity declines faster than it can be documented [1]. Biomonitoring plays a key role in ecosystem conservation, sustainable resource use, and detection of shifts in species composition driven by external pressures [2]. Because climate-driven changes are expected to be particularly fast in high-latitude polar and subpolar marine ecosystems [3], robust and sensitive monitoring approaches are needed to establish biodiversity baselines and track trajectories of community change.
The Beagle Channel (BC), located at the southern tip of Tierra del Fuego within the Patagonian fjord system (~54° S), exemplifies the vulnerability of subpolar marine environments to rapid climate change. This semi-estuarine system extends for ~240–300 km, connecting the Pacific and Atlantic oceans through a marked west-to-east salinity gradient driven by the interaction between Subantarctic waters and seasonal freshwater inputs from glaciers and rivers [4,5]. Previous studies have shown that the BC is longitudinally compartmentalized, although different terminologies have been used to describe this structure. In the Argentine section of the BC, Iachetti et al. [6] distinguished inner and outer hydrographic sectors based mainly on bathymetry, circulation patterns, freshwater influence, salinity, nutrients, and phytoplankton biomass, with the Gable Island–Mackinlay Strait area acting as a transition zone. At a broader scale, Schloss et al. [7] described western (mainly corresponding to the Chilean sector of the channel), central, and eastern regions based on physical, chemical and biological features, including depth, salinity, water residence time, nutrient availability, and dissolved organic matter. Together, these frameworks support the view that environmental heterogeneity along the BC may contribute to the spatial structuring of biological communities (e.g., [8]). However, whether marine vertebrate assemblages reflect this longitudinal environmental organization remains unexplored.
The BC supports a rich marine fauna, including fish, marine mammals, and seabirds, serving as a subpolar corridor linking Pacific, Atlantic, and Antarctic biotas. An early study documented 56 fish species, dominated by notothenioids [9], while later studies focused on kelp-forest-associated taxa [10,11,12]. More recently, Nardi et al. (2024) [13] updated and expanded the species list using environmental DNA (eDNA) metabarcoding, highlighting the potential of this biomonitoring technique. Their study increased the number of fish species reported for the Beagle Channel to 67, comprising ray-finned fish (Actinopterygii), cartilaginous fish (Chondrichthyes), hagfish (Myxini), and lampreys (Petromyzontida).
The BC and surrounding Fuegian waters also host more than thirty marine mammal species, dolphins (Delphinidae), beaked whales (Ziphiidae), porpoises (Phocoenidae), seals (Phocidae), sea lions, and fur seals (Otariidae) [14,15,16]. Together with seabirds, these upper-trophic-level vertebrates represent important components of the marine ecosystem.
In addition, several studies have identified marine vertebrates as reliable indicators of marine ecosystem health. Fish are widely used as bioindicators of chemical contamination, including heavy metals and other pollutants, in marine environments [17,18]. Seabirds are also valuable indicators of environmental change, providing information on plastic pollution, climate change impacts, and prey availability through changes in breeding success, diet, and population dynamics [19,20]. Furthermore, as long-lived, highly mobile top predators, marine mammals integrate ecological processes occurring across broad spatial scales. They can therefore act as sentinels of ecosystem condition, environmental change, and potential risks to human health ([16] and references therein). Waters around Tierra del Fuego also serve as important foraging and breeding grounds as well as migratory routes for numerous resident and transient species [14,15,21,22,23].
However, traditional sampling methods for characterizing vertebrate diversity face severe limitations. Visual surveys based on line-transect methods may provide limited spatial and temporal coverage [24], particularly in remote sub-Antarctic regions where short daylight periods during winter and logistical constraints restrict sampling effort. In addition, these surveys depend upon favorable weather conditions [25] and suffer from detectability biases for elusive species such as the beaked whales [26]. These challenges hinder comprehensive and integrated surveys of marine vertebrate communities across seasons and space.
Environmental DNA (eDNA) is the genetic material that organisms leave behind in natural habitats (e.g., bodily fluids, skin/scales, feces), enabling non-invasive species detection from water samples [27]. One of the most widely used approaches is eDNA metabarcoding, which allows the simultaneous identification of multiple species from a single environmental sample. This method uses primers targeting conserved genetic regions, followed by PCR amplification, high-throughput sequencing, and taxonomic assignment through comparison with reference DNA databases. This highly sensitive technique often detects species overlooked by traditional methods, including fish in complex habitats [13], marine mammals in open waters [28], and broader marine vertebrate assemblages, including seabirds and pinnipeds [29,30].
While prior studies have characterized individual taxonomic groups (e.g., fish via eDNA or capture; mammals via sightings), heterogeneous sampling methods preclude a unified baseline for BC marine vertebrate communities. No comprehensive, simultaneous compilation of assessment exists for the overall community structure along the BC, nor for seasonal effects or environmental correlations. To address this, we conducted a longitudinal faunistic gradient study across seasons using hierarchical eDNA sampling to disentangle spatiotemporal variation. Here, we applied vertebrate eDNA metabarcoding to: (1) establish a baseline of vertebrate species composition for long-term biomonitoring; (2) determine whether vertebrate assemblages exhibit spatial structuring along the BC and whether this pattern varies seasonally; and (3) evaluate the environmental drivers underlying assemblage structure.

2. Materials and Methods

2.1. Study Area

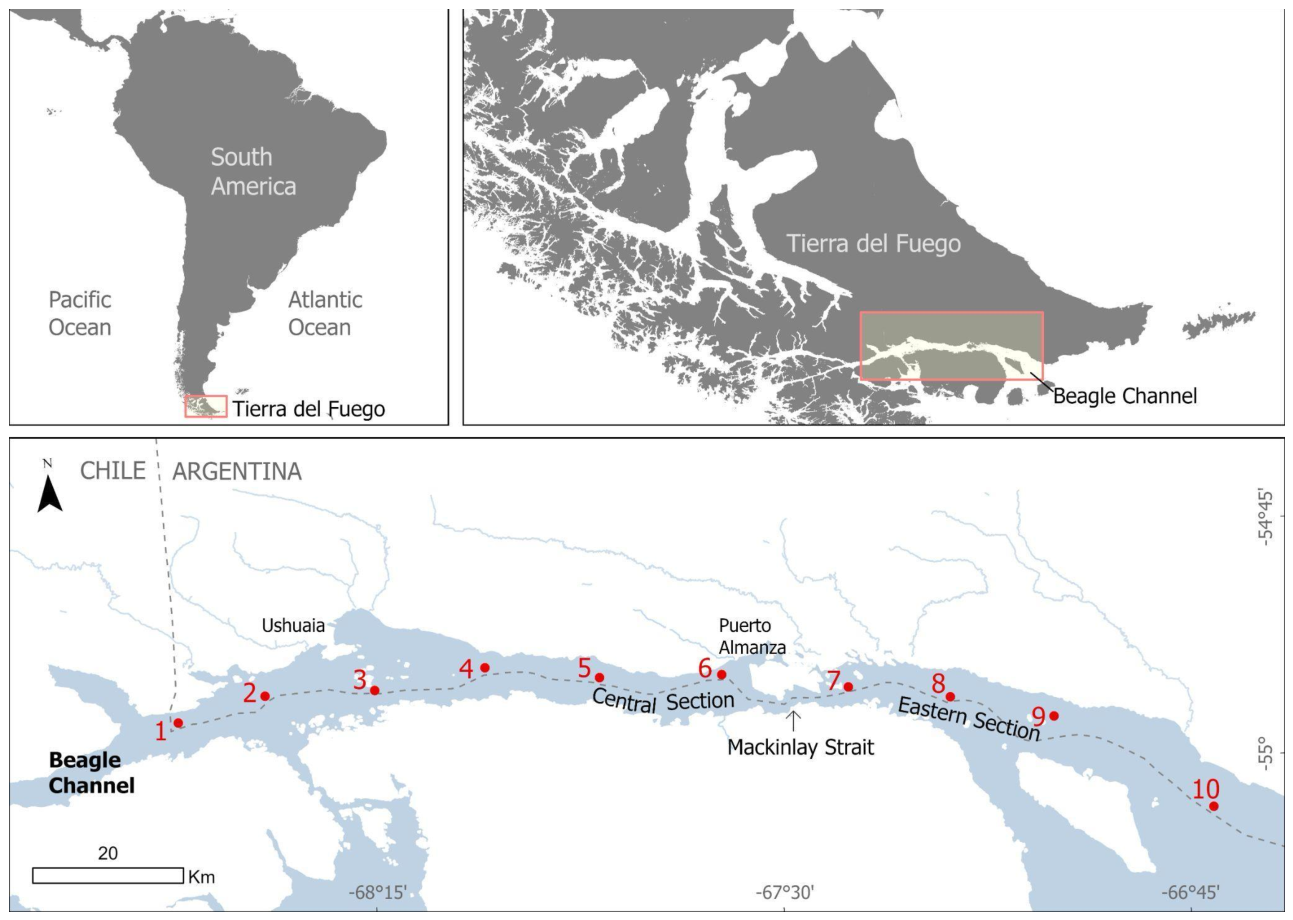
The BC is a semi-enclosed subantarctic coastal system located at the southern tip of South America (54–55° S) and is part of the Magellanic fjord and channel system. Extending approximately 240–300 km between the Pacific and Atlantic Oceans, the channel is characterized by a dominant west-to-east circulation driven by sea-level differences between the two ocean basins [31,32]. The water column is influenced by subantarctic waters entering from the west and southwest and progressively modified by freshwater inputs from rivers, runoff, precipitation, and glacial meltwater, generating marked longitudinal environmental gradients in salinity, stratification, nutrient availability, and productivity [6,7,33]. Sampling sites were located within the central sector (CS) and the eastern sector (ES) of the BC following the hydrographic regionalization proposed by Schloss et al. [7] (Figure 1). These regions encompass a well-defined environmental gradient associated with bathymetry, circulation patterns, and freshwater influence, making them suitable for evaluating spatial variation in vertebrate assemblages. The CS is the most densely populated area and the most affected region by human activities, as it includes the city of Ushuaia and the town of Puerto Almanza, both of which support tourism and other coastal activities.

2.2. Water Sampling and eDNA Extraction

During austral spring (November 2023) and autumn (April 2024), we collected four 3-L surface water replicates per site at 10 strategically selected locations spanning the inner and outer zones of the BC (Figure 1) to test environmental sectorization and biotic gradients (see Section 2.7 below). In-situ measurements of temperature, salinity, dissolved oxygen and conductivity were recorded using a Rinko ASTD-102 multisensor. Water samples for eDNA were immediately filtered in the laboratory with disposable cellulose nitrate-sterile Biosart® filters of a 0.45 μm pore (Sartorius Lab Instruments GmbH, Goettingen, Germany) connected to a diaphragm vacuum pump (Silfab, CABA, Argentina). Then, eDNA was extracted using the DNeasy® PowerWater® Kit (QIAGEN, Hilden, Germany) following the manufacturer’s instructions.
A total of 2 Milli-Q water blanks (1 L per season) were processed alongside field samples through filtration and DNA extraction to confirm that contamination did not occur during sample processing.

2.3. Water Analysis

Subsurface water samples of 10 L each were collected in bottles (previously rinsed with 2% HCl and Milli-Q water) simultaneously with the eDNA samples at each sampling site for water quality analysis. Samples were kept refrigerated (4 °C) and were processed in the laboratory immediately after sampling and in duplicate. For laboratory quality assurance and quality control (QA/QC), equipment and devices were regularly calibrated with commercial standard solutions. Blanks with Milli-Q water were carried out, where applicable. pH was registered with a HANNA HI-9813-5 portable sensor (range: 1.0–14.0; resolution: 0.1; Hanna Instruments, Inc., Woonsocket, RI, USA), while turbidity was measured with a Lutron turbidimeter TN3024 (range: 0.01–300 NTU; resolution: 0.01 NTU; Lutron Electronic Enterprise Co., Ltd., Taipei, Taiwan). The concentration of dissolved inorganic nutrients (ammonium (NH4+), nitrate (NO3), phosphate (PO43−) and silicate (SiO3)), total nitrogen (TN), total phosphorus (TP), suspended particulate matter (SPM), total organic carbon (TOC), and phytoplanktonic chlorophyll a (Chl-a) were assessed. For dissolved inorganic nutrients and Chl-a, aliquots of 2 L were filtered onto Whatman GF/F filters (0.7 µm pore size) and were kept frozen (−20 °C) until analysis. Samples for NH4+ were analyzed within the day with the phenol–hypochlorite method [34]; NO3 were determined with the diazotization method with a previous cadmium reduction [35]; PO43− were analyzed by the ascorbic acid method [36], and SiO3 by the molybdosilicate method [37,38]. For all dissolved nutrients, Hach procedures accepted or approved by USEPA were carried out with a Hach DR/2700 spectrophotometer along with Hach reagents (Hach Company, Loveland, CO, USA). For total nutrients (TN and TP), water samples were digested according to Valderrama [39] and measured as NO3 and PO43− respectively, following the same methodology indicated for dissolved nutrients. For SPM determinations, aliquots of 0.5–1 L were filtered through nitrocellulose membranes (0.45 µm pore size) and analyzed by the gravimetric method [37]. For TOC determination, samples were filtered with hydrophilic PVDF membranes (0.22 µm pore size) and then analyzed with a Shimadzu TOC-N analyzer (Shimadzu Corporation, Kyoto, Japan). For Chl-a analysis, the retained pigments in the GF/F filters were extracted in 90% acetone, analyzed using a PerkinElmer Lambda 25 UV–visible spectrophotometer (PerkinElmer Inc., Norwalk, CT, USA), and corrected for phaeopigment content following the method of Lorenzen [40].
Values for selected parameters were compared against environmental quality criteria for the protection of aquatic life established in national and international regulations (Provincial Law 1126/2016 and Decree 450/21; CONAMA Chile; Canadian Council of Ministers of the Environment [CCME]).

2.4. eDNA Amplification and Sequencing

The presence of PCR inhibitors was tested in all eDNA samples following Nardi et al. [41]. Then, eDNA samples were amplified using the primer set MarVer01 targeting marine vertebrates [42]. This ~100–150 bp assay amplifies a variable region of the mitochondrial 12S rRNA gene (12S), designed to broadly capture fish, marine mammals, seabirds, and other vertebrates while minimizing non-target amplification from invertebrates or microbes. PCR reactions were conducted in a 15 μL reaction volume, containing 1U Q5 High-Fidelity DNA Polymerase (New England BioLabs, Ipswich, MA, USA), 1 × PCR buffer, 200 μM dNTPs, 200 μM forward and reverse primers, and 2 μL of DNA template. Each eDNA sample was amplified in three technical PCR replicates, along with a no-template PCR control. Thermal cycling conditions started with an initial step of 3 min at 98 °C, followed by 45 cycles of 10 s at 98 °C, 30 s at 60 °C and 25 s at 72 °C; and finished with a 10 min hold at 72 °C. The amplicon size was checked by gel electrophoresis; the triplicates were recovered from the gel, pooled, and purified using an extraction kit (PuriPrep-GP; INBIO Highway, Tandil, Argentina). The Milli-Q water negative controls also underwent PCR amplification. Even though no bands were observed on agarose gels in the expected size ranges, the gel was sliced and processed in the same manner as the field samples for library preparation and sequencing. Then, purified amplicons were indexed using dual unique index sequences according to the workflow proposed by the Illumina 16S metagenomic sequencing library preparation protocol [43]. This was accomplished during a second PCR step containing 2.5 μL of each Index Primer, 5 μL of the eDNA sample amplified during the first round of PCR, 1× Q5® Reaction Buffer Pack (New England Biolabs, Ipswich, MA, USA), 0.2 mM dNTPs mix, 2.5 μL Q5® High G Enhancer (New England Biolabs, Ipswich, MA, USA) and 0.15 μL Q5® High-Fidelity DNA Polymerase (New England Biolab, Ipswich, MA, USA) in a total volume of 25 μL. The cycling conditions used included a first step at 95 °C for 3 min, eight cycles of a denaturation step at 95 °C for 30 s, an annealing step at 55 °C for 30 s, an extension step at 72 °C for 30 s, and a final extension at 72 °C for 5 min. Libraries were purified as previously mentioned, quantified, pooled and sent to ANLIS Malbrán, Argentina (https://www.argentina.gob.ar/salud/anlis, accessed on 25 June 2026) for sequencing on an Illumina MiSeq platform, 300-bp, paired-end run.

2.5. Reference Databases Update

The reference database used in this study included two previously developed databases by Nardi et al. [13] for fish and Pellegrino et al. [44] for mammals, both enriched with the addition of local reference sequences. Importantly, the reference sequences included in these databases encompassed the region targeted by the MarVer assay, allowing their direct use for taxonomic assignment in the present study. These databases were expanded with de novo sequences generated from local specimens. For this purpose, fin and skin tissue samples from fish and mammal species, respectively (1–3 specimens per species), were acquired from the tissue collection at the Centro Austral de Investigaciones Científicas (CADIC, Ushuaia, Argentina). DNA was extracted through the salting-out purification method [45]. To maximize the future utility of the reference database across different 12S-based metabarcoding assays, an approximately 700-bp fragment of the mitochondrial 12S rRNA gene, encompassing the MarVer amplicon region, was amplified and sequenced. For this, a combination of previously reported universal primers was used: MiFish-Fw [46] and Teleo-Rv [47] for fish, and MarVer01-Fw [42] and Mamm01-Rv [48] for mammals. PCR reactions were carried out in a 35-μL volume that contained 1 U GoTaq DNA Polymerase (Promega, Madison, WI, USA), 1× PCR buffer, 200 μM dNTPs, 150 nM of each primer, and 0.035 ng of template DNA. The thermal cycling program used was 3 min at 94 °C, 35 cycles of 20 s at 94 °C, 15 s at 55 °C, and 22 s at 72 °C, ending with a 5 min hold at 72 °C. PCR products were Sanger sequenced by Macrogen (Seoul, South Korea). Sequence alignment and primer trimming were achieved using MEGA software version 4.0 [49]. Only one representative sequence per species was retained unless sequences differed between individuals. When tissue of reported species present in the BC was not available, 12S sequence information was included from the National Centre for Biotechnology Information database (NCBI) (https://www.ncbi.nlm.nih.gov/, accessed on 26 June 2026). The reference database is a tab-separated text file with taxonomy levels separated by an underscore (family_genus_species).

2.6. Bioinformatics Analysis

The quality check of raw demultiplexed reads was conducted with FASTQC [50]. Forward and reverse reads were trimmed, merged, and classified under the default settings of the Barque pipeline v1.8.5 (www.github.com/enormandeau/barque, accessed on 26 June 2026; [51]). The local reference database was employed to assign the most probable species to sequences, applying a 98% similarity threshold for species-level identification. Sequences that could not be confidently assigned at the species level were subsequently queried against the NCBI nucleotide database using the online BLASTn web interface. Based on the first BLAST hit, sequences showing >95% identity were assigned to the corresponding genus, and sequences with <90% identity were retained as unidentified (UnID). A low-stringency bioinformatics criterion for species detection was adopted [52], considering a species present if its DNA was detected in at least one replicate sample per site. Sequences attributed to Homo sapiens and non-vertebrate species were not included in the analysis.

2.7. Sampling Design and Statistical Analyses

To characterize longitudinal variation in vertebrate eDNA assemblages along the BC, surface water samples were collected at ten sampling sites distributed along the Argentine sector of the channel. Stations 1–6 were located west of the Mackinlay Strait and assigned to the CS, whereas stations 7–10 were located east of the strait and assigned to the ES according to Schloss et al. [7] (Figure 1). Sampling was conducted during autumn and spring, with three to four biological replicates collected at each station during each season. To evaluate spatial and temporal patterns in vertebrate community composition, a permutational multivariate analysis of variance (PERMANOVA, [53,54]) was performed using a three-factor design. Sector was considered a fixed factor with two levels (CS and ES) crossed with Season as a fixed factor with two levels (autumn and spring), and Sites as a random factor nested within Sector. Statistical significance was assessed using 9999 permutations under a reduced model, with a significance level set at α = 0.05. Raw read counts were fourth-root transformed to reduce the influence of highly abundant taxa and then standardized by the total abundance of each sample to allow comparison among samples with different sequencing depths. A Bray–Curtis dissimilarity matrix [55] was then calculated from the transformed and standardized data. Non-metric multidimensional scaling (nMDS, [56,57]) was used to visualize patterns in vertebrate assemblage composition among Sectors, Stations, and Seasons. For graphical representation, centroids were calculated by Sector–Station–Season combinations and plotted in the ordination space. Similarity percentage analysis (SIMPER, [58]) was used as an exploratory tool to identify the taxa contributing most to the observed differences among groups. To assess the relationship between vertebrate assemblage structure and environmental variables, distance-based redundancy analysis (dbRDA, [59,60]) was performed using the Bray–Curtis dissimilarity matrix. Environmental predictors were selected using the Akaike Information Criterion (AIC, [61]), and multicollinearity among them was evaluated using variance inflation factors (VIFs). The five variables shown in the dbRDA plot—chlorophyll-a, ammonium, silicate, salinity and turbidity—had VIF values below 3, indicating no evidence of problematic multicollinearity among the variables used for biplot interpretation. Accordingly, these variables were retained for visualization and interpreted as environmental gradients associated with variation in vertebrate eDNA assemblage structure. The final dbRDA model was represented as a biplot showing sampling stations and selected explanatory variables. All statistical analyses were conducted using PRIMER v7 with the PERMANOVA+ add-on [62].

3. Results

3.1. Local Reference Database Update

The reference databases reported by Nardi et al. [13] and Pellegrino et al. [44] for species from Tierra del Fuego were updated with de novo 12S sequences of 15 species: 9 fish and 6 marine mammal species. In some cases, some 12S sequences were already available at NCBI; however, 12S amplicons of local individuals were included to account for possible local variation (Supplementary Table S1).

3.2. Metabarcoding Results

All seawater samples yielded metabarcoding data. A total of 5,385,967 raw reads were obtained, of which 3,081,363 reads (57.2%) were retained after downstream analysis. These reads encompassed a broad range of vertebrates: 2,687,515 (87.2%) assigned to mammals, 338,114 (11.0%) to fish, 23,743 (0.8%) to birds, and the remainder to other taxa (bacteria, algae, and invertebrates). Homo sapiens, bacteria, algae, and invertebrate sequences were excluded from the dataset because they are irrelevant to this study.
A total of 43 sequence groups were identified, comprising 13 mammal species (7 marine and 6 terrestrial), 25 fish, and 5 birds. Of these, 36 sequence groups were assigned to the species level using the local reference database. Three additional groups were assigned to the genus level (hakes Merluccius sp. and two cormorants Leucocarbo sequence groups), while three could not be resolved to a single species because they matched multiple closely related taxa (native grass mice Abrothrix spp., silversides Odontesthes spp., and notothenioid Patagonotothen spp.). Detailed read counts for each sequence group, sampling site, replicate and season are provided in Supplementary Table S2. Only one sequence group remained unresolved after taxonomic assignment. A subsequent BLASTn search against the NCBI nucleotide database returned cunner (Tautogolabrus adspersus) as the closest match, but with only 82.1% sequence identity. Because this value fell below the threshold established for taxonomic assignment, the sequence was retained as an unidentified fish taxon (UnID).

3.3. Spatio-Temporal Patterns in Vertebrate Assemblages

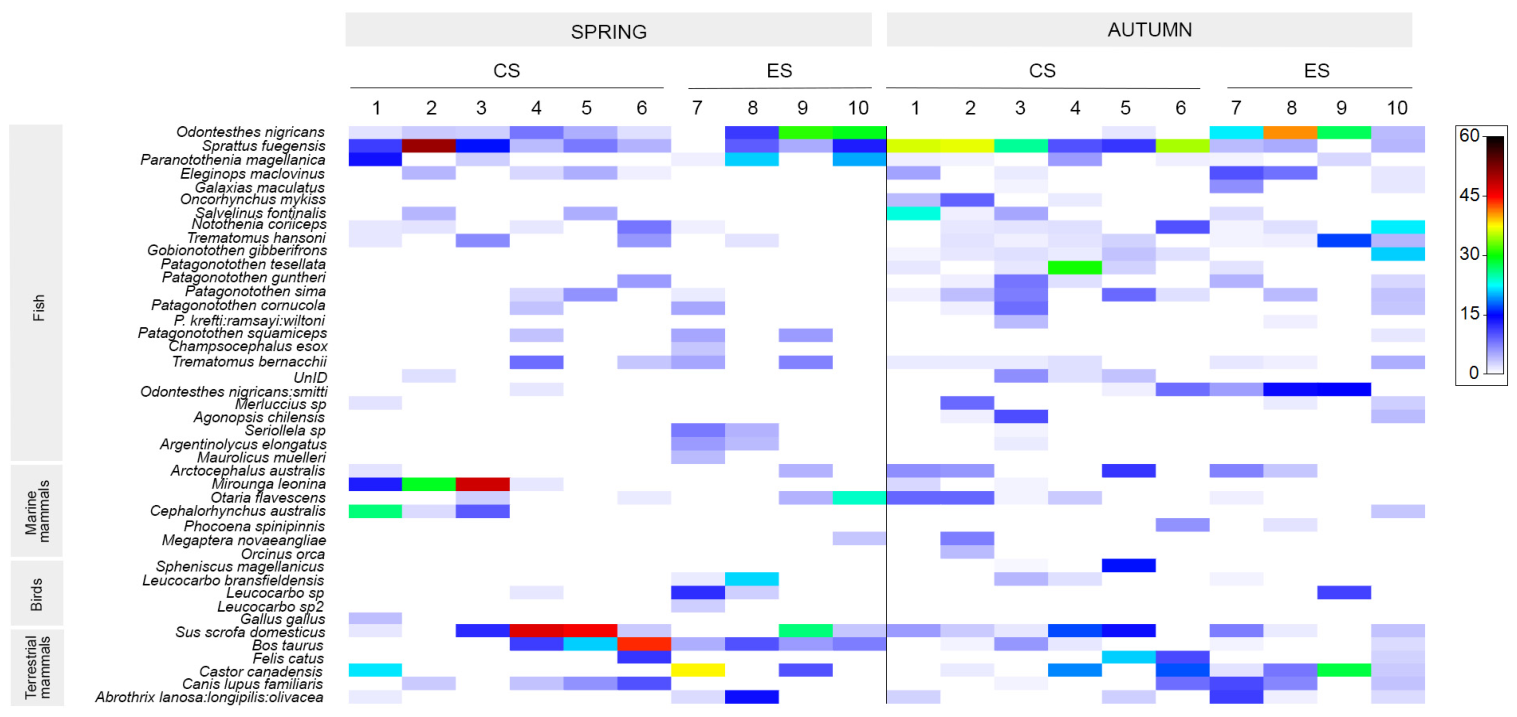
The shade plot (Figure 2) illustrates species occurrence across seasons and sectors of the BC, with taxa organized by vertebrate groups.
Fish constituted the most diverse vertebrate group detected, encompassing taxa occupying a broad range of ecological niches, including pelagic, demersal, coastal, freshwater, diadromous, and Antarctic environments. A total of 24 species or taxonomic sequence groups belonging to 16 genera and 13 families were identified. Notothenioids represented the dominant component of the assemblage, accounting for more than half of the detected fish taxa. Within this group, Nototheniidae (cod and icefish) was the most species-rich family, comprising nine taxa distributed among five genera (Gobionotothen, Notothenia, Paranotothenia, Patagonotothen and Trematomus), whereas pike icefish (Champsocephalus esox) was the sole representative of the family Channichthyidae. The remaining families, Agonidae, Atherinopsidae, Clupeidae, Eleginopidae, Galaxiidae, Merlucciidae, Salmonidae, Sternoptychidae, and Zoarcidae, were each represented by one or two taxa.
Fuegian sprat (Sprattus fuegensis) and the silverside (Odontesthes nigricans) were the most frequently detected species. The former was the only taxon consistently detected throughout the study area, being recorded at all sampling sites in at least one replicate except at station seven in spring and station nine in autumn (Supplementary Table S2). In contrast, the latter was recorded in both seasons but showed a marked spatial bias toward the ES, particularly during autumn. Although less abundant, Magellanic rockcod (Paranotothenia magellanica) and Patagonian blennie (Eleginops maclovinus) were also frequently detected. Freshwater and diadromous taxa, including common galaxias (Galaxias maculatus), introduced rainbow trout (Oncorhynchus mykiss), and introduced brook trout (Salvelinus fontinalis), were recorded at a limited number of stations. Antarctic notothenioids such as black rockcod (Notothenia coriiceps), striped rockcod (Trematomus hansoni), and humped rockcod (Gobionotothen gibberifrons) were also detected, although they occurred sporadically throughout the study area without a clear spatial pattern. Likewise, Patagonotothen spp. were recorded in both sectors without a clear spatial trend, although P. sima, black southern cod (P. tessellata) and yellowfin notothen (P. guntheri) were more frequently detected during autumn.
Mammals represented the second most diverse vertebrate group, comprising 13 species or taxonomic sequence groups assigned to 13 genera and 11 families. Marine mammals accounted for more than half of the recorded mammalian taxa and included representatives of both pinnipeds (Pinnipedia) and cetaceans (Cetacea), whereas the remaining taxa corresponded to native and introduced terrestrial mammals.
Marine mammal detections exhibited clear seasonal variation, with pinnipeds showing broader and more frequent detections than cetaceans. South American fur seal (Arctocephalus australis) was detected in both seasons, with a broader spatial distribution in autumn. Southern elephant seal (Mirounga leonina) was recorded during both sampling periods, but was more frequently detected in spring, whereas southern sea lion (Otaria flavescens) was detected mainly in autumn. In contrast, cetacean detections were comparatively sparse and localized. The black-chinned dolphin (Cephalorhynchus australis) was recorded predominantly in spring, while Burmeister’s porpoises (Phocoena spinipinnis), humpback whales (Megaptera novaeangliae) and killer whales (Orcinus orca) were detected almost exclusively in autumn and restricted to the CS (Supplementary Table S2).
Birds represented the least diverse vertebrate group, comprising five taxonomic sequence groups assigned to three genera and three families. The assemblage was dominated by seabirds, with only a single terrestrial bird taxon (domestic chicken Gallus gallus) detected. Among seabirds, detections were comparatively limited: Magellanic penguins (Spheniscus magellanicus) were detected exclusively during autumn and only in the CS, whereas cormorants (Leucocarbo spp.) were recorded in both seasons and across both sectors of the BC.
Among terrestrial mammals, both the invasive North American beaver (Castor canadensis) and native grass mice (Abrothrix spp.) showed a similar spatio-temporal pattern, being detected mainly during autumn and predominantly in the ES. Lastly, domestic species such as pigs (Sus scrofa domesticus), cows (Bos taurus), cats (Felis catus), and Gallus gallus were detected more frequently during spring.
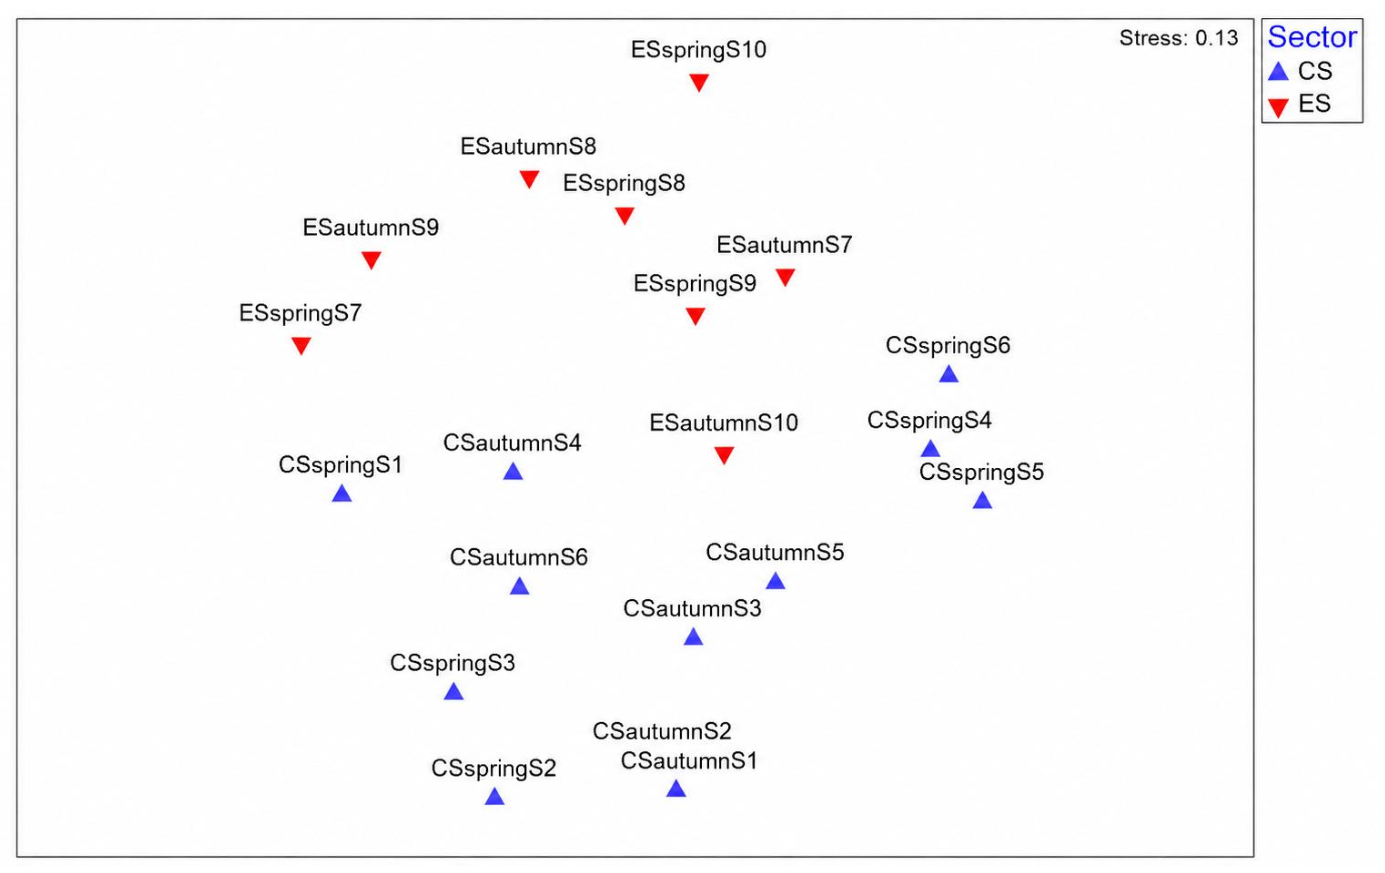
Although several taxa exhibited distinct spatio-temporal occurrence patterns, these species-specific trends did not necessarily translate into changes in the overall structure of vertebrate assemblages. Multivariate analyses revealed that community composition was structured primarily by sector rather than by season.
Figure 3 shows the nMDS ordination, revealing a clear spatial structure among the vertebrate eDNA assemblages. Samples from the ES were mainly distributed in the upper region of the ordination space, whereas samples from the CS were arranged predominantly in the lower region of the plot. In contrast, no consistent overall separation between autumn and spring was evident within either sector.
This pattern was supported by PERMANOVA, which detected significant differences in community composition between sectors (pseudo-F = 3.36, p = 0.007). Significant variability was also observed among stations nested within sectors (pseudo-F = 2.79, p = 0.0001), indicating spatial heterogeneity at a smaller scale. The overall effect of season was not significant (pseudo-F = 1.87, p = 0.08), and the sector × season interaction was also not significant (pseudo-F = 1.46, p = 0.19). However, the season × station (sector) interaction was significant (pseudo-F = 2.73, p = 0.0001), suggesting that temporal changes in vertebrate assemblage composition were not consistent across the study area, but varied among stations within sectors (Table 1). Residual variation among replicates accounted for most of the variability, followed by differences among stations within sectors and the season × station (sector) interaction.
SIMPER analysis showed that the dissimilarity between sectors was explained by a limited set of taxa with contrasting relative abundances between the CS and ES (Table 2). Several marine and terrestrial vertebrates contributed strongly to the observed sectoral separation. Among fish, S. fuegensis exhibited higher average abundances in the CS, whereas Odontesthes spp. (O. nigricans and O. nigricans/smitti), Paranotothenia magellanica and Trematomus hansoni were more abundant in the ES.
Marine mammals also contributed substantially to the differentiation between sectors. Mirounga leonina and Arctocephalus australis were associated with the CS, while Otaria flavescens showed higher relative abundance in the ES. In addition, several terrestrial and freshwater-associated mammals contributed to the separation, including Castor canadensis and native rodents of the genus Abrothrix, both of which were more strongly represented in the ES. Finally, domestic species showed higher average abundances in the CS.

3.4. Water Analysis and the Relationship with Vertebrate Assemblages

All the water quality parameters measured fell within the acceptable ranges established for the protection of marine waters. Although no marked differences were observed between sectors within each sampling period, some consistent trends emerged. The CS was characterized by higher concentrations of dissolved carbon, silicate, and nitrogen nutrients, all of which support phytoplankton growth, as reflected by higher chlorophyll-a (Chl-a) concentrations. In contrast, the ES was characterized by higher concentrations of phosphorus and suspended particulate matter (SPM).
Seasonal differences were more pronounced than spatial differences for most environmental variables (Supplementary Table S3). The highest mean values of dissolved oxygen (9.76 ± 0.08 mg L−1), NH4+ (0.027 ± 0.007 mg L−1), and total nitrogen (TN; 0.93 ± 0.03 mg L−1) were recorded during spring, whereas all remaining variables reached their highest mean values in autumn. Accordingly, temperature was positively correlated with conductivity (r = 0.90), pH (r = 0.76), and total phosphorus (TP; r = 0.85), and negatively correlated with dissolved oxygen (r = −0.95), NH4+ (r = −0.83), and TN (r = −0.71). Turbidity was negatively correlated with NH4+ (r = −0.73) and positively correlated with Chl-a (r = 0.70).
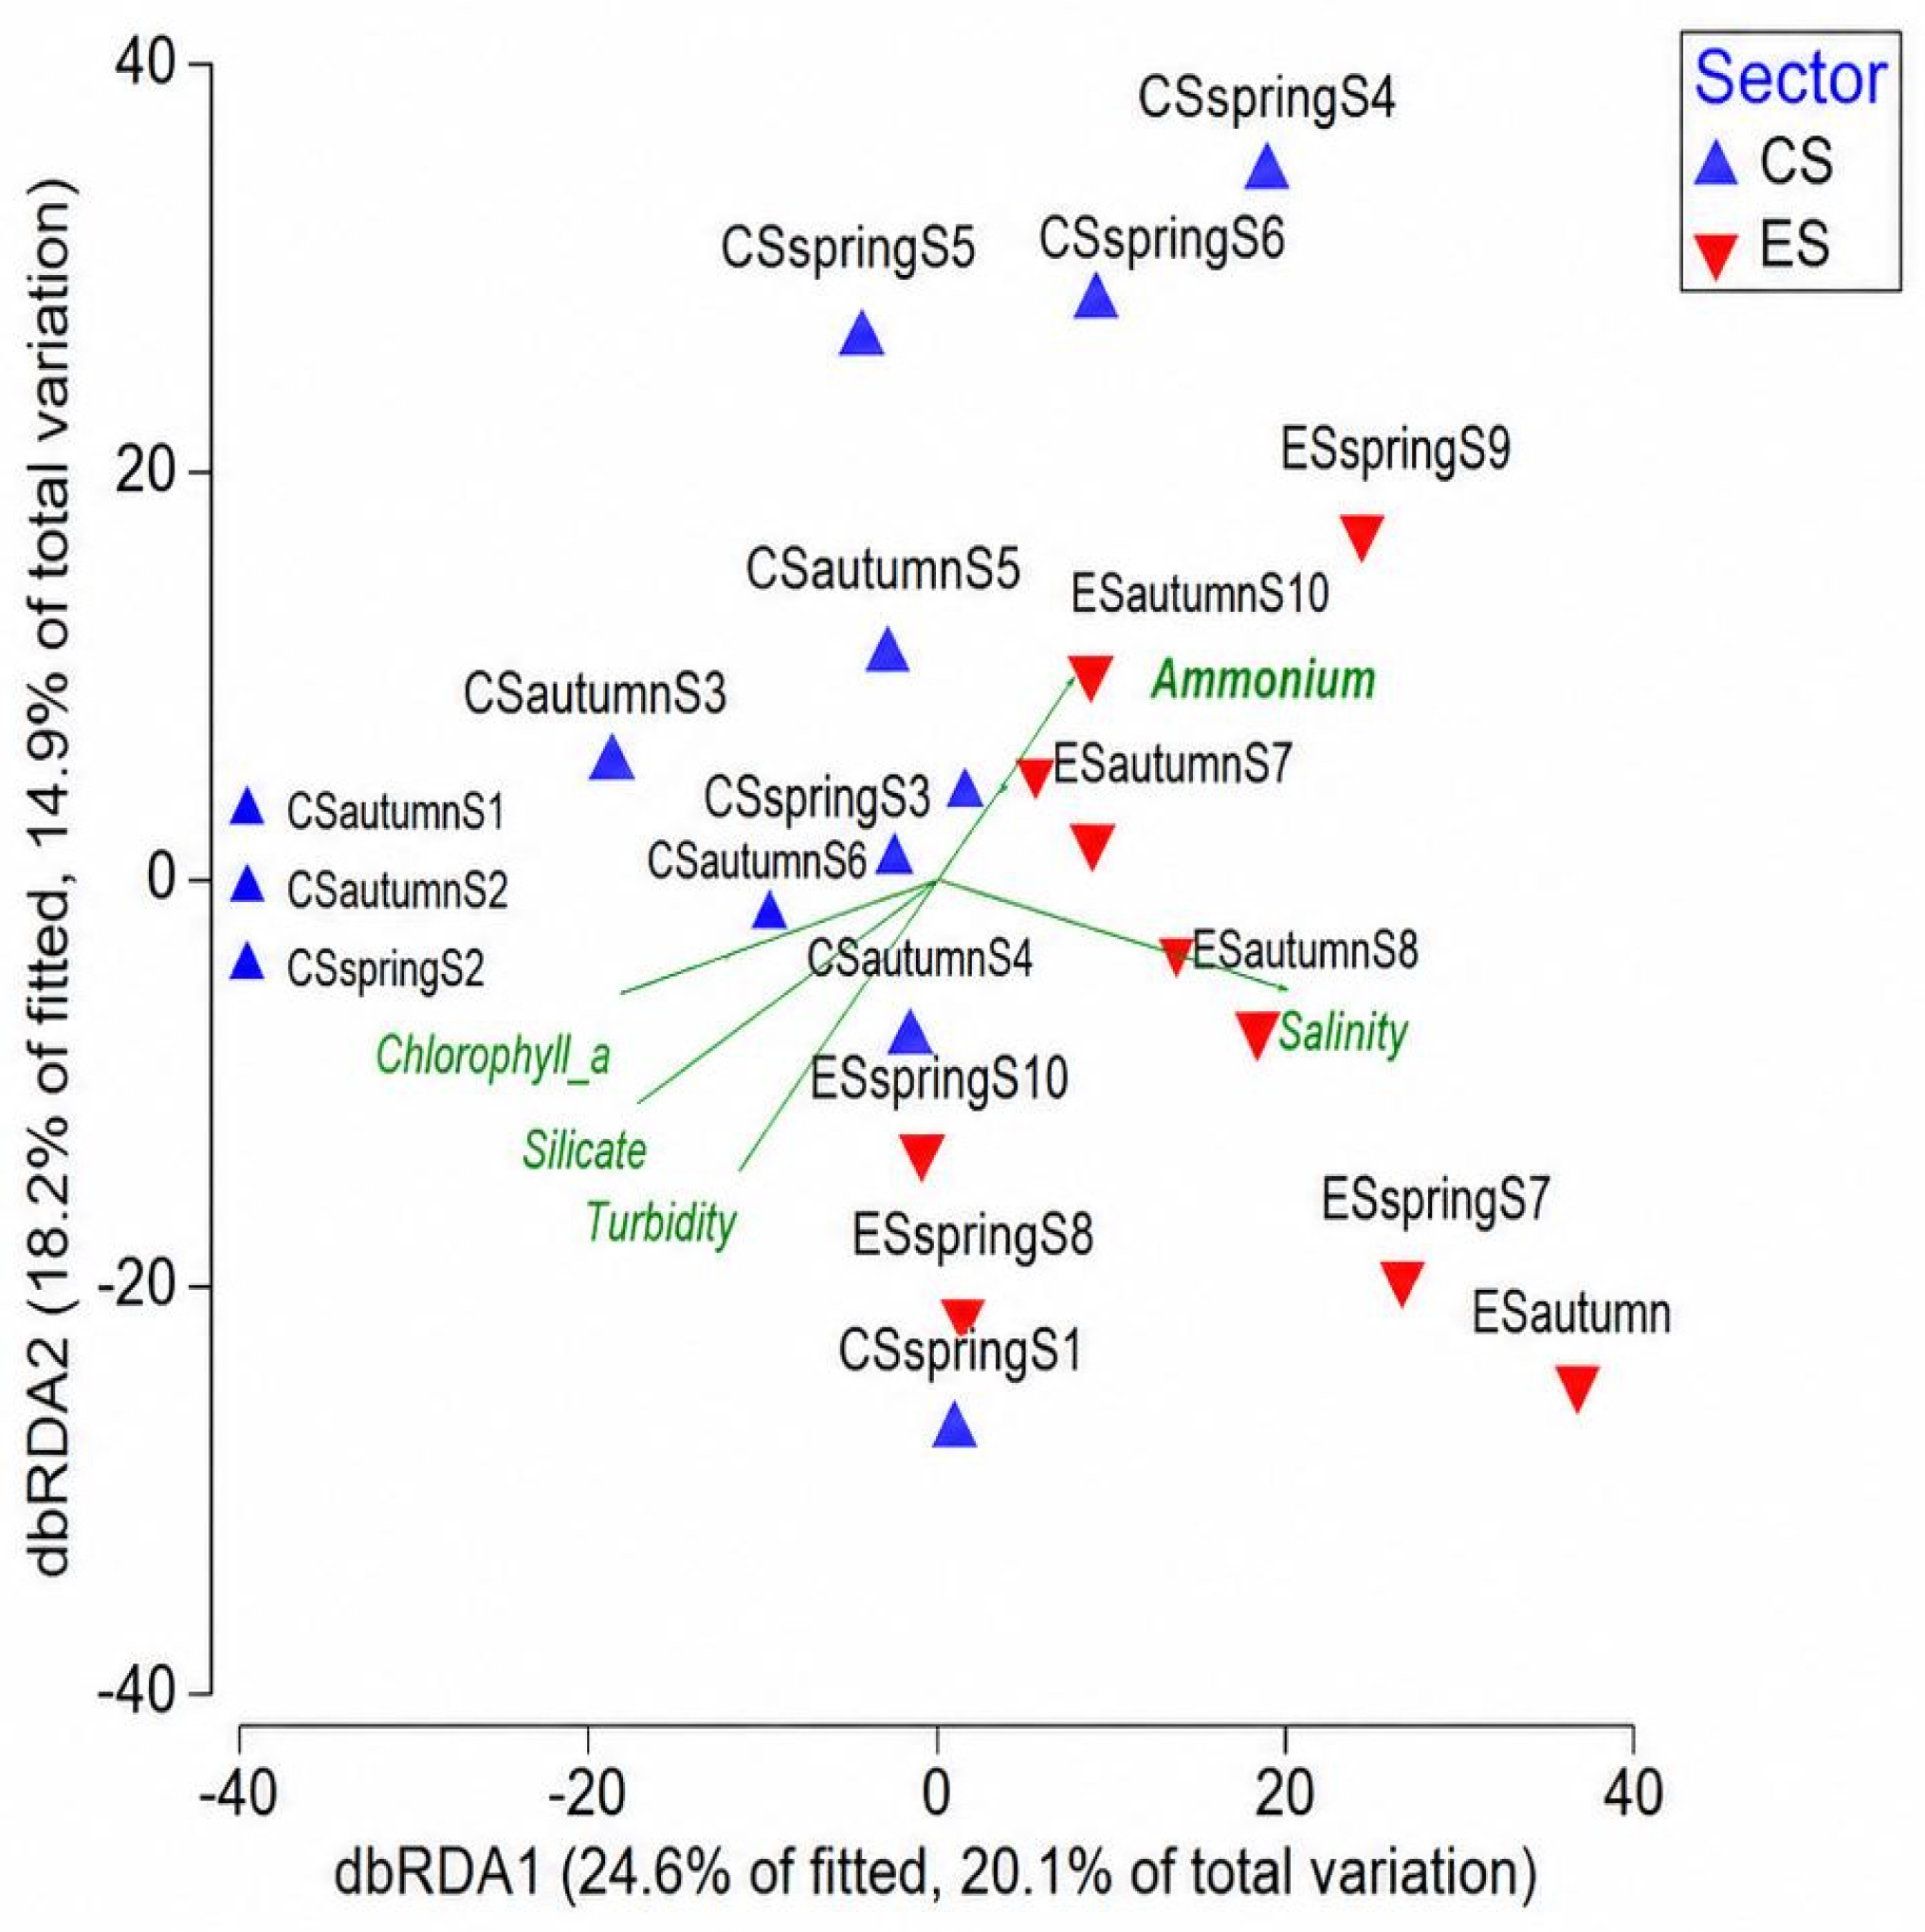
The DistLM/dbRDA analysis showed that variation in vertebrate eDNA assemblage composition was associated with environmental variables and was also consistent with the sectoral structure observed in the nMDS ordination (Figure 4). Marginal DistLM tests identified chlorophyll-a, ammonium, silicate, salinity and turbidity as significant predictors, each individually explaining between 9.1% and 10.6% of the total variation. To improve readability, only these significant variables were displayed as vectors in the dbRDA biplot. The first two dbRDA axes explained 24.6% and 18.2% of the fitted variation, equivalent to 20.1% and 14.9% of the total variation, respectively. Overall, the dbRDA ordination suggested that the spatial separation between sectors was associated with contrasting environmental gradients: CS assemblages were mainly related to chlorophyll-a, silicate and turbidity, whereas ES assemblages tended to be associated with salinity and ammonium.

4. Discussion

This study represents the first eDNA-based ecosystem-scale assessment of marine vertebrate communities along the longitudinal gradient of the BC. By simultaneously detecting multiple vertebrate groups, including marine mammals, fish and birds, we provide the first eDNA-based biodiversity baseline and reveal clear spatial structuring of vertebrate assemblages across the channel.

4.1. Species Composition and Spatial Structuring of Vertebrate Assemblages

A total of 43 vertebrate taxa were identified. Fish constituted the most species-rich group detected, and our results are consistent with previous descriptions of species-rich coastal fish assemblages in the channel [9,10,11,13]. Beyond fish, the detection of marine mammals and seabirds extends the taxonomic scope of previous surveys and emphasizes the aptitude of eDNA metabarcoding for ecosystem-level biodiversity assessment in subantarctic marine environments.
The clearest pattern revealed by vertebrate eDNA metabarcoding was the significant spatial differentiation between the CS and ES of the BC. This finding is also consistent with the environmental sectorization previously proposed for the Channel. Based on hydrographic and biological variables, Iachetti et al. [6] identified two major sectors separated by the Mackinlay Strait, whereas Schloss et al. [7] subsequently described a central and eastern sector encompassing the same general regions. The significant differences in vertebrate assemblages detected in the present study provide biological support for this previously described subdivision, suggesting that the vertebrate community composition reflected the longitudinal environmental sectorization.
The spatial structuring detected here is also consistent with previous eDNA-based observations from the BC. Nardi et al. [13] reported significant differences in fish community composition among three coastal sites within a relatively restricted portion of the BC. Using a broader longitudinal design and a vertebrate-wide molecular barcoding marker, we show that this spatial heterogeneity is not limited to local site-level variation but also it is expressed at the regional scale as a clear differentiation between the central and eastern sectors. Together, both studies support the view that eDNA assemblages in the BC are spatially structured across nested scales, from local coastal habitats to broader hydrographic sectors.

4.2. Fish

Fish exhibited species-specific spatial patterns that were largely consistent with their known ecology and previous observations in the BC. S. fuegensis was the only species consistently detected throughout the channel and across both sampling seasons, although its occurrence was higher in the CS. This pattern is particularly noteworthy because all samples were collected from surface waters, whereas previous studies have reported marked seasonal shifts in the vertical distribution of this species. During summer, S. fuegensis schools are typically pelagic, while in winter they form larger aggregations associated with deeper waters [63]. Despite these changes in vertical habitat use, S. fuegensis remained widely detectable across the study area and throughout both seasons tested, suggesting that eDNA integrates signals across multiple habitats.
The predominance of O. nigricans in the ES is consistent with previous evidence indicating that this species is the only Odontesthes frequently found in the BC [64,65]. Although an unresolved Odontesthes sequence group was also detected (O. nigricans/smitti), this observation should not be interpreted as direct evidence of O. smitti occurrence in the BC, given that previous studies have associated O. smitti mainly with the Atlantic Patagonian coast [66]. Instead, this signal likely reflects limited marker resolution among closely related silversides. The marked spatial signal of O. nigricans is also noteworthy because recent genetic and genomic studies showed that populations of the BC are differentiated from Atlantic populations and may exhibit fine-scale structure within the channel [67].
The detection of the native diadromous species G. maculatus with introduced salmonids (O. mykiss and S. fontinalis) in the CS highlights the connectivity between freshwater, coastal, and marine ecosystems in Tierra del Fuego. Interestingly, the recently established invasive salmonid coho salmon (Oncorhynchus kisutch) was not detected, despite its increasing occurrence in the BC and in tributary rivers over recent years [13,68,69].
Notothenioids are the main component of the native subantarctic fish fauna and were well represented in the eDNA dataset and showed patterns consistent with previous surveys using non-traditional fish-collection-based methods. The higher occurrence of P. magellanica in the ES may reflect the stronger oceanic influence characterizing this area. Earlier studies have shown that this species is associated with exposed and semi-exposed coastal habitats, suggesting a preference for environments subjected to greater water exchange and hydrodynamic energy [70]. In addition, P. magellanica has been associated with higher-salinity environments, a pattern that is consistent with the results of this study.

4.3. Terrestrial Vertebrates

The detection of terrestrial vertebrates further illustrates the integrative nature of aquatic eDNA. Domestic species were more frequently detected in the CS of the channel, whereas Castor canadensis and Abrothrix spp. predominated in the ES. The higher contribution of domestic taxa to the CS may be related to the greater urban influence associated with Ushuaia, the largest city along the BC, and the town of Puerto Almanza. However, no formal correlation was performed between domestic DNA and spatially explicit urban-impact proxies such as distance to sewage outfalls, population density or river discharge. Thus, this pattern should be interpreted cautiously as a plausible signal of land–sea connectivity and human-associated inputs, rather than as evidence of a direct causal relationship. Future studies should test this hypothesis using a sampling design specifically developed to relate domestic DNA detections to urban and watershed-related predictors.
In contrast, the predominance of Castor canadensis and Abrothrix spp. in the ES likely reflects differences in watershed characteristics. Watersheds draining into this sector of the BC support some of the highest densities of beaver dams in southeastern Tierra del Fuego [71], providing a plausible explanation for the more frequent detection of C. canadensis. Similarly, the forested landscapes surrounding these watersheds provide suitable habitat for native Abrothrix rodents, which may explain their predominance in the ES.
Overall, these findings demonstrate the ability of aquatic eDNA to integrate biological signals from adjacent terrestrial ecosystems [30,72].

4.4. Marine Mammals

The marine mammal patterns of occurrence observed in this study likely reflect both species ecology and the inherent characteristics of eDNA detection. Pinnipeds are generally associated with predictable haul-out sites and breeding colonies close to the coastline, such as those of Península Mitre (south-eastern corner of Tierra del Fuego) or inside the channel, such as Bridges (CS) and Becasses Islands (ES) [73,74], potentially providing a more continuous source of eDNA to surrounding waters. In contrast, cetaceans are highly mobile, generally occur at comparatively low densities, and some species spend only limited periods in the area, factors that may reduce eDNA concentration and persistence in seawater. Previous eDNA studies have shown that cetaceans are not always detected even when animals are observed in proximity [28,75,76]. Likewise, Álvarez-González et al. [77] found that agreement between visual surveys and eDNA was evident only at broad spatial scales and disappeared at finer spatial resolution. Additionally, large volumes of water [78] and targeted sampling strategies [79,80] are recommended for cetaceans’ detection. Together, these studies indicate that eDNA detection of large, highly mobile cetaceans is inherently stochastic at local scales.
The sporadic presence of Mirounga leonina in the area has long been recognized. In this study, the species was detected predominantly during spring at the westernmost sampling stations (1–3), encompassing the western half of the CS (Figure 1). It was also detected during autumn in the same area, although with much lower detection intensity. Because adult M. leonina breed on land during spring and remain fasting until pups are weaned, while breeding harems do not occur along the BC, we infer that most detections likely correspond to wandering subadult and juvenile individuals that reached the area from the west and east through the BC, or from the south via the Murray Channel. On the other hand, an unusual birth was reported shortly before the spring sampling near Station 2, and the mother–pup pair remained ashore throughout the lactation period until November [81], which may also have shaped the observed detections.
A similar pattern was observed for Cephalorhynchus australis, whose eDNA detections were concentrated in the western part of the CS (stations 1–3). Although this resident species occurs throughout the BC, sightings in Argentine waters are generally more frequent in the western portion of the channel [82,83]. The species has also been regularly recorded in nearby Yendegaia Bay (Yendegaia National Park, Chile). Therefore, the detected eDNA may reflect both local occurrence and transport of eDNA from neighbouring Chilean waters.
Seasonal differences in the occurrence of some species were generally consistent with known patterns of habitat use in the region. The detection of Megaptera novaeangliae during autumn agrees with the seasonal influx of this species into the BC [84], as they exploit feeding opportunities during this period. Likewise, the detection of the Orcinus orca is consistent with observations of the species entering the channel to forage on marine mammals, such as pinnipeds and baleen whales [85,86]. Conversely, the limited detection of the resident Phocoena spinipinnis was unexpected given its regular occurrence within the channel [87]. Similarly, the dusky dolphin (Aethalodelphis obscurus) and the sei whale (Balaenoptera borealis), species known to use the area [88], were not detected. Despite these species-specific seasonal patterns, no consistent seasonal shift in overall vertebrate assemblage composition was detected.
Consistent with this observation, vertebrate assemblages differed significantly between sectors, whereas no overall seasonal effect was detected. This result suggests that the main structure of the vertebrate community was more strongly associated with the longitudinal sectorization of the channel than with the seasonal contrast captured here. However, the significant season × site (sector) interaction further indicates that temporal changes in species occurrence took place at local scales, emphasizing the need for repeated sampling when using eDNA to distinguish persistent spatial patterns from short-term biological or hydrodynamic variability.
These results highlight that eDNA surveys provide a temporal snapshot of species occurrence rather than a complete representation of the marine mammal community inhabiting the BC. The detected assemblage reflects the combined effects of recent animal presence, movement patterns, DNA shedding, degradation, and hydrodynamic transport at the time of sampling. Consequently, episodic biological events may influence local eDNA signals, whereas repeated surveys across seasons and years will be necessary to distinguish persistent ecological patterns from short-term environmental or biological variability.

4.5. Environmental Drivers of Vertebrate Assemblages

Beyond taxonomic composition, the environmental analyses provide further support for the spatial organization of vertebrate assemblages along the BC. The environmental gradients identified by the dbRDA visualization were broadly consistent with the hydrographic structure previously described for the channel. These patterns closely match the environmental characterization proposed by Schloss et al. [7], who described contrasting hydrographic conditions between the central and eastern sectors of the BC.
The association of ES samples with high salinity agrees with the stronger oceanic influence reported for the eastern channel [7,33]. Conversely, the association of CS samples with high chlorophyll-a and silicate agrees with previous evidence of higher phytoplankton biomass and nutrient-related variability in the inner-central channel [6].
The contribution of turbidity is also compatible with the relevance of shallow-water resuspension processes described for the central–eastern BC. In contrast, the spatial interpretation of ammonium should be interpreted more cautiously, as it may reflect local nutrient inputs rather than a previously established longitudinal gradient.
Nevertheless, a substantial proportion of the variation in vertebrate eDNA assemblage composition remained unexplained, suggesting that additional environmental and ecological factors may also influence the observed patterns. Marine hydrodynamic processes, such as tidal cycles, currents, and water column mixing, may affect eDNA transport, whereas habitat characteristics, including bathymetry, coastal structure, and proximity to river outlets, together with biological factors such as species behaviour, seasonal movements, and prey availability, among others, may further influence vertebrate assemblage composition. Further studies integrating these variables could provide a more comprehensive understanding of the drivers of vertebrate eDNA assemblages in the BC.

4.6. Performance of the Metabarcoding Approach

Environmental DNA metabarcoding success depends strongly on both primer selection and reference database completeness. To date, Nardi et al. [13] remains the only published eDNA metabarcoding study conducted in the BC, providing the most appropriate benchmark against which to evaluate the performance of the vertebrate-wide assay employed in the present study.
Despite being designed as a vertebrate-wide marker rather than a fish-specific assay, MarVer recovered most of the characteristic fish taxa previously detected in the BC. These results indicate that MarVer successfully captures the core fish assemblage of the BC while simultaneously expanding taxonomic coverage beyond fish to include marine mammals and seabirds.
Nevertheless, differences between studies were also evident and likely reflect both marker-specific biases and differences in sampling design. While MiFish recovered several taxa not detected in the present study (brown trout Salmo trutta, coho salmon Oncorhynchus kisutch, Magellan plunderfish Harpagifer bispinis, Patagonotothen trigramma, Austrolycus laticinctus, Chinook salmon Oncorhynchus tshawytscha, tadpole codling Salilota australis, pink cusk-eel Genypterus blacodes, Patagonotothen wiltoni, choicy ruff Seriolella porosa, Odontesthes smitti), MarVer identified additional fish taxa, resulting in overlapping but distinct representations of the local ichthyofauna. This complementarity is consistent with the results of previous studies showing that no single molecular marker can fully capture community diversity and that multi-marker approaches maximize taxonomic recovery while providing a more comprehensive characterization of biological communities (e.g., [89]).
Conversely, several species known to occur in the BC, including O. kisutch, A. obscurus and B. borealis, were not detected. Although these absences may partly reflect stochastic sampling effects or low eDNA availability, they also illustrate the inherent limitations of relying on a single metabarcoding marker.
Despite these limitations, MarVer simultaneously characterized fish, marine mammals and seabirds from a single water sample, providing an important practical advantage for ecosystem-level biomonitoring. Its performance in the present study demonstrates that a single vertebrate-wide assay can effectively characterize the main components of the marine vertebrate community, even though a multi-marker approach would likely provide a more complete characterization of biodiversity.
In addition to primer choice, taxonomic assignment is strongly influenced by the completeness and geographic representativeness of reference databases. Custom databases are often essential, as public repositories such as GenBank and BOLD remain taxonomically and geographically biased, particularly for Southern Hemisphere taxa [2,90]. The importance of complete and well-curated reference databases for precise taxonomic assignment in eDNA metabarcoding is widely recognized [91]. Beyond taxonomic completeness, recent studies have emphasized the value of incorporating geographically relevant reference sequences, as intraspecific genetic variation may exhibit regional structure that is not fully represented in public repositories [92]. For this reason, we supplemented existing public records with sequences generated from locally collected specimens, thereby increasing the geographic representativeness of the reference database used for taxonomic assignment.
Despite the continuous expansion of our regional reference database, several sequences could not be confidently assigned to the species level, remaining either unidentified or resolved only to the genus level. The persistence of these unresolved sequences indicates that reference database development remains an ongoing process and highlights the need for continued efforts to generate and curate local reference sequences. This is particularly relevant in subantarctic ecosystems, where regional biodiversity and genetic diversity remain incompletely represented in public repositories, limiting the taxonomic resolution that can be achieved through eDNA metabarcoding.
The results obtained for seabirds illustrate both the strengths and current limitations of the vertebrate-wide assay. In this sense, our assay successfully recovered both penguins and coastal cormorants, demonstrating that vertebrate-wide metabarcoding can detect taxonomically distinct avian groups in marine environments. The comparatively low bird species richness recovered in this study is consistent with previous eDNA studies reporting lower detection efficiency for birds than for fish and mammals in water samples [93]. In addition, birds have historically received comparatively less attention in eDNA-based monitoring, resulting in more limited primer development and reference database coverage than for other vertebrate groups [94,95]. This limitation is also reflected in our local reference database, which currently relies exclusively on GenBank sequences and does not yet include many of the seabird species occurring in the BC.
Future work should therefore prioritize expanding the local reference database and evaluating bird-specific primer sets to improve taxonomic resolution and detection sensitivity (e.g., [94]).

5. Conclusions

This study demonstrates that marine vertebrate assemblages in the Beagle Channel are spatially structured, with distinct communities associated with the central and eastern sectors. By simultaneously recovering fish, marine mammals and seabirds, vertebrate eDNA metabarcoding successfully captured ecologically meaningful patterns of community organization across this subantarctic ecosystem.
From a biomonitoring perspective, these findings have several important implications. First, future monitoring programs should incorporate spatially stratified sampling to capture the environmental heterogeneity of the channel and thereby avoid biased biodiversity baselines. Second, the validated MarVer assay, together with the baseline established here, provides a repeatable framework for detecting long-term community changes associated with climate change, biological invasions and increasing human activities. Finally, the ecological information recovered by vertebrate eDNA is inherently scale-dependent, allowing the same dataset to address questions ranging from broad biogeographic patterns to local habitat associations and community structure.
Together, these findings demonstrate vertebrate-wide eDNA metabarcoding as a powerful tool for ecosystem-scale biodiversity assessment and long-term ecological monitoring in subantarctic coastal ecosystems.

Supplementary Materials

The following supporting information can be downloaded at: https://www.mdpi.com/article/10.3390/d18080468/s1, Supplementary Table S1: List of species reported in Tierra del Fuego added to the local mitochondrial 12S rRNA reference database. Supplementary Table S2: Numbers of reads assigned to each vertebrate taxon across sampling stations, and replicates in the Beagle Channel. Supplementary Table S3: Mean values of environmental variables from central and eastern sectors of the Beagle Channel in spring and autumn.

Author Contributions

Conceptualization, M.V., J.S., S.P. and C.F.N.; Data Curation, M.V. and F.M.L.; Methodology, M.V., C.F.N., K.D.M., J.S., S.P., S.L.D., M.P., L.D.C., S.M.D., N.D. and L.R.; Validation, M.V., J.S. and C.F.N.; Formal Analysis, M.V. and F.M.L.; Investigation M.V., C.F.N., K.D.M., J.S., S.P., S.L.D., M.P., L.D.C., S.M.D., N.D. and L.R.; Data Curation, M.V., C.F.N. and F.M.L.; Writing—Original Draft Preparation M.V., C.F.N. and K.D.M.; Writing—Review & Editing M.V., C.F.N., F.M.L., J.S., S.P., S.L.D., K.D.M., M.P., N.D. and L.R.; Visualization M.V., C.F.N., F.M.L., J.S., S.P., S.L.D., K.D.M., M.P., N.D. and L.R.; Supervision, C.F.N., J.S. and S.P.; Project Administration, C.F.N. and J.S.; Funding Acquisition, C.F.N. and S.P. All authors have read and agreed to the published version of the manuscript.

Funding

This work was funded by the Ministerio de Ciencia y Tecnología (MINCyT-Argentina) PICT-2021-CAT-II-00067 and Fundación Williams.

Institutional Review Board Statement

This research was carried out in accordance with the rules and regulations of Secretaría de Ambiente, Ministerio de Producción y Ambiente, Provincia de Tierra del Fuego, Argentina, under permit number 570-2022. Permit date: 15 July 2022.

Data Availability Statement

The data will be available upon request.

Acknowledgments

We are very grateful to the Shenu crew and especially to Martín Castro, who coordinated the work on board and helped us with the sampling. We also thank Álvaro Vazquez and Amalia Bursztyn Fuentes for their help in nutrient determinations.

Conflicts of Interest

The authors declare that they have no known competing financial interests or personal relationships that could have appeared to influence the work reported in this paper.

References

  1. Kindsvater, H.; Dulvy, N.K.; Horswill, C.; Juan-Jorda, M.J.; Mangel, M.; Mathiopoulos, J. Overcoming the data crisis in biodiversity conservation. Trends Ecol. Evol. 2018, 33, 676–688. [Google Scholar] [CrossRef] [PubMed]
  2. Schenekar, T.; Schletterer, M.; Lecaudey, L.; Weiss, S. Reference databases, primer choice, and assay sensitivity for environmental metabarcoding: Lessons learnt from a re-evaluation of an eDNA fish assessment in the Volga headwaters. River Res. Appl. 2020, 36, 1004–1013. [Google Scholar] [CrossRef]
  3. IPCC. Cambio Climático. Informe de Síntesis; Contribuciones de los Grupos de Trabajo I, II y III al Quinto Informe de Evaluación del Panel Intergubernamental sobre el Cambio Climático; Pachauri, R.K., Meyer, L.A., Eds.; IPCC: Geneva, Switzerland, 2014; p. 151. [Google Scholar]
  4. Antezana, T.; Hamamé, M.; Eissler, Y.; Jara, S. Hydrography in Chilean fjords: Strait of Magellan to Beagle Channel (legs 1 and 2). In Cruise Report of the Joint Chilean-German-Italian Magellan ‘Victor Hensen’Campaign in 1994; Alfred Wegener Institute for Polar and Marine Research: Bremerhaven, Germany, 1996; pp. 16–18. [Google Scholar]
  5. Isla, F.; Bujalesky, G.; Coronato, A. Procesos estuarinos en el canal Beagle, Tierra del Fuego. Rev. Asoc. Geol. Argent. 1999, 54, 307–318. [Google Scholar]
  6. Iachetti, C.M.; Lovrich, G.; Alder, V.A. Temporal variability of the physical and chemical environment, chlorophyll and diatom biomass in the euphotic zone of the Beagle Channel (Argentina): Evidence of nutrient limitation. Prog. Oceanogr. 2021, 195, 102576. [Google Scholar] [CrossRef]
  7. Schloss, I.; Pizarro, G.; Cadaillon, A.; Giesecke, R.; Almandoz, G.; Latorre, M.; Malits, A.; Flores-Melo, X.; Saravia, L.; Martín, J.; et al. Alexandrium catenella dynamics and paralytic shellfish toxins distribution along the Beagle Channel (southern Patagonia). J. Mar. Syst. 2023, 239, 103856. [Google Scholar] [CrossRef]
  8. Presta, M.L.; Riccialdelli, L.; Bruno, D.O.; Castro, L.R.; Fioramonti, N.E.; Florentín, O.V.; Berghoff, C.F.; Capitanio, F.L.; Lovrich, G.A. Mesozooplankton community structure and trophic relationships in an austral high-latitude ecosystem (Beagle Channel): The role of bottom-up and top-down forces during springtime. J. Mar. Syst. 2023, 240, 103881. [Google Scholar] [CrossRef]
  9. Lloris, D.; Rucabado, J. Ictiofauna del Canal Beagle (Tierra del Fuego), Aspectos Ecológicos y Análisis Biogeográfico; Instituto Español de Oceanografía: Madrid, Spain, 1991; Volume 8, pp. 1–182. [Google Scholar]
  10. Vanella, F.A.; Fernández, D.A.; Romero, M.C.; Calvo, J. Changes in the fish fauna associated with a sub-Antarctic Macrocystis pyrifera kelp forest in response to canopy removal. Polar Biol. 2007, 30, 449–457. [Google Scholar] [CrossRef]
  11. Cruz-Jiménez, A.M. Ensambles de Peces en los Bosques de Kelp de Macrocystis Pyrifera en el Canal Beagle, Tierra del Fuego: Estructura Comunitaria y Variación Espacio-Temporal. Ph.D. Thesis, Universidad Nacional de La Plata (UNLP), La Plata, Argentina, 2019; pp. 1–193. [Google Scholar]
  12. Bravo, G.; Kaminsky, J.; Bagur, M.; Alonso, C.P.; Rodríguez, M.; Fraysse, C.; Lovrich, G.; Bigatti, G. Roving Diver Survey as a Rapid and Cost-Effective Methodology to Register Species Richness in Sub-Antarctic Kelp Forests. Diversity 2023, 15, 354. [Google Scholar] [CrossRef]
  13. Nardi, C.F.; Llompart, F.; Chalde, T.; Bruno, D.O. Ceballos SG Evaluation of fish biodiversity in the Beagle Channel (Tierra del Fuego, Argentina) using environmental DNA (eDNA) metabarcoding. Est. Coast. Shelf Sci. 2024, 303, 108819. [Google Scholar] [CrossRef]
  14. Goodall, R.N.P.; Dellabianca, N.; Boy, C.C.; Benegas, L.G.; Pimper, L.E.; Riccialdelli, L. Review of small cetaceans stranded or incidentally capture on the coast of Tierra del Fuego, Argentina, over 33 years. In Proceedings of the Reunión del Comité Científico de la Comisión Ballenera Internacional (IWC), Santiago, Chile, 31 May–10 June 2008; p. 15. Available online: https://iwc.int/sc60docs (accessed on 25 June 2026).
  15. Riccialdelli, L.; Newsome, S.D.; Fogel, M.L.; Fernández, D.A. Trophic interactions and food web structure of a subantarctic marine food web in the Beagle Channel: Bahía Lapataia, Argentina. Polar Biol. 2017, 40, 807–821. [Google Scholar] [CrossRef]
  16. Dellabianca, N.A.; Torres, M.A.; Ordoñez, C.; Fioramonti, N.; Raya Rey, A. Marine protected areas in the southern south-west Atlantic: Insights from marine top predator communities. Aquat. Conserv. Mar. Freshw. Ecosyst. 2023, 33, 472–487. [Google Scholar] [CrossRef]
  17. Rudneva, I.I.; Skuratovskaya, E.N.; Dorokhova, I.I.; Grab, Y.A.; Zalevskaya, I.N.; Omel’chenko, S.O. Bioindication of the environmental state of marine areas with the use of fish biomarkers. Water Resour. 2011, 38, 107–112. [Google Scholar] [CrossRef]
  18. Hamada, N.; Ali, R.; El-Tabakh, M.; Bream, A. Environmental monitoring: Tobara fish as bioindicators of heavy metal pollution in a coastal ecosystem. Reg. Stud. Mar. Sci. 2024, 69, 103335. [Google Scholar] [CrossRef]
  19. Khan, M.; Khalid, S.; Khalid, M.A. Birds as bioindicators of environmental health. In Biodiversity in India: Implementation and Barriers of Regulatory Acts; M/S Academic Publishers & Distributors: Lucknow, India, 2025; pp. 1–17. [Google Scholar]
  20. Piatt, J.F.; Sydeman, W.J.; Wiese, F. Introduction: A modern role for seabirds as indicators. Mar. Ecol. Prog. Ser. 2007, 352, 199–204. [Google Scholar] [CrossRef]
  21. Falabella, V.; Campagna, C.; Croxall, J. Atlas of the Patagonian Sea. Species and Spaces; Wildlife Conservation Society and BirdLife International: Buenos Aires, Argentina, 2009. [Google Scholar]
  22. Riccialdelli, L.; Newsome, S.D.; Fogel, M.L.; Goodall, R.N.P. Isotopic assessment of prey and habitat preferences of a cetacean community in the southwestern South Atlantic Ocean. Mar. Ecol. Prog. Ser. 2010, 418, 235–248. [Google Scholar] [CrossRef]
  23. Falabella, V. Área Marina Protegida Namuncurá–Banco Burdwood. Contribuciones para la Línea de Base y el Plan de Manejo; Jefatura de Gabinete de Ministros: Buenos Aires, Argentina, 2017. [Google Scholar]
  24. Kaschner, K.; Quick, N.J.; Jewell, R.; Williams, R.; Harris, C.M. Global coverage of cetacean line-transect surveys: Status quo, data gaps and future challenges. PLoS ONE 2012, 7, e44075. [Google Scholar] [CrossRef] [PubMed]
  25. Dawson, S.; Wade, P.; Slooten, E.; Barlow, J. Design and field methods for sighting surveys of cetaceans in coastal and riverine habitats. Mammal. Rev. 2008, 38, 19–49. [Google Scholar] [CrossRef]
  26. Rose, E. The Elusive Life of Beaked Whales: Understanding Deep-Diving Foraging Behavior Using Acoustics and Optics. UC San Diego, Center for Marine Biodiversity and Conservation. 2025. Available online: https://escholarship.org/uc/item/36f2m3zm (accessed on 1 July 2026).
  27. Ficetola, G.F.; Miaud, C.; Pompanon, F.; Taberlet, P. Species detection using environmental DNA from water samples. Biol. Lett. 2008, 4, 423–425. [Google Scholar] [CrossRef] [PubMed]
  28. Baker, C.S.; Steel, D.; Nieukirk, S.; Klinck, H. Environmental DNA (eDNA) from the wake of the whales: Droplet digital PCR for detection and species identification. Front. Mar. Sci. 2018, 5, 133. [Google Scholar] [CrossRef]
  29. Andruszkiewicz, E.A.; Starks, H.A.; Chavez, F.P.; Sassoubre, L.M.; Block, B.A.; Boehm, A.B. Biomonitoring of marine vertebrates in Monterey Bay using eDNA metabarcoding. PLoS ONE 2017, 12, e0176343. [Google Scholar] [CrossRef] [PubMed]
  30. Closek, C.J.; Santora, J.A.; Starks, H.A.; Schroeder, I.D.; Andruszkiewicz, E.A.; Sakuma, K.M.; Bograd, S.J.; Hazen, E.L.; Field, J.C.; Boehm, A.B. Marine vertebrate biodiversity and distribution within the Central California Current using environmental DNA (eDNA) metabarcoding and ecosystem surveys. Front. Mar. Sci. 2019, 6, 732. [Google Scholar] [CrossRef]
  31. Porter, S.; Stuiver, M.; Heusser, C. Holocene sea-level changes along the Strait of Magellan and Beagle Channel, southernmost South America. Quat. Res. 1984, 22, 59–67. [Google Scholar] [CrossRef]
  32. Martín, J.; Alonso, G.; Dragani, W.; Meyerjurgens, J.; Giesecke, R.; Cucco, A.; Fenco, H. General circulation and tidal wave propagation along the Beagle Channel. J. Mar. Syst. 2023, 240, 103889. [Google Scholar] [CrossRef]
  33. Giesecke, R.; Martín, J.; Piñones, A.; Höfer, J.; Garcés-Vargas, J.; Flores-Melo, X.; Alarcón, E.; Durrieu de Madron, X.; Bourrin, F.; González, H.E. General hydrography of the Beagle Channel, a subantarctic interoceanic passage at the southern tip of South America. Front. Mar. Sci. 2021, 8, 621822. [Google Scholar] [CrossRef]
  34. Solórzano, L. Determination of ammonia in natural waters by the phenolhypochlorite method. Limnol. Oceanogr. 1969, 14, 799–801. [Google Scholar] [CrossRef]
  35. Wood, E.D.; Armstrong, F.A.J.; Richards, F.A. Determination of nitrate in sea water by cadmium-copper reduction to nitrite. J. Mar. Biol. Assoc. UK 1967, 47, 23–31. [Google Scholar] [CrossRef]
  36. Murphy, J.; Riley, J.P. A Modified Single Solution Method for the Determination of Phosphate in Natural Water. Anal. Chim. Acta 1962, 27, 31–36. [Google Scholar] [CrossRef]
  37. Strickland, J.D.H.; Parsons, T.R. A Practical Handbook of Seawater Analysis; Fisheries Research Board of Canada: Ottawa, ON, Canada, 1972. [Google Scholar]
  38. APHA. Standard Methods for the Examination of Water and Wastewater; American Public Health Association: Washington, DC, USA, 2017. [Google Scholar]
  39. Valderrama, J.C. The simultaneous analysis of total nitrogen and total phosphorus in natural waters. Mar. Chem. 1981, 10, 109–122. [Google Scholar] [CrossRef]
  40. Lorenzen, C.J. Determination of chlorophyll and phaeopigments: Spectrophotometric equations. Limnol. Oceanogr. 1967, 12, 343–346. [Google Scholar] [CrossRef]
  41. Nardi, C.F.; Fernández, D.A.; Vanella, F.A.; Chalde, T. The expansion of exotic Chinook salmon (Oncorhynchus tshawytscha) in the extreme south of Patagonia: An environmental DNA approach. Biol. Invasions 2019, 21, 1415–1425. [Google Scholar] [CrossRef]
  42. Valsecchi, E.; Bylemans, J.; Goodman, S.; Lombardi, R.; Carr, I.; Castellano, L.; Galimberti, A.; Galli, P. Novel universal primers for metabarcoding environmental DNA surveys of marine mammals and other marine vertebrates. Environ. DNA 2020, 2, 460–476. [Google Scholar] [CrossRef]
  43. Illumina 16S Metagenomic Sequencing Library Preparation. Amplicon, PCR, Clean-up, PCR & Index PCR. 2013. Available online: https://support.illumina.com/documents/documentation/chemistry_documentation/16s/16s-metagenomic-library-prep-guide-15044223-b.pdf (accessed on 15 June 2026).
  44. Pellegrino, M.; Sánchez, J.; Chiberry, L.D.; Victorio, M.F.; Poljak, S. Mammal diversity in remote and harsh habitats: Validating the power of environmental DNA metabarcoding at the southernmost tip of South America. Polar Biol. 2026, 49, 70. [Google Scholar] [CrossRef]
  45. Miller, S.; Dykes, D.; Polesky, H. A simple salting out procedure for extracting DNA from human nucleated cells. Nucleic Acids Res. 1988, 16, 1215. [Google Scholar] [CrossRef] [PubMed]
  46. Miya, M.; Sato, Y.; Fukunaga, T.; Sado, T.; Poulsen, J.; Sato, K.; Minamoto, T.; Yamamoto, S.; Yamanaka, H.; Araki, H.; et al. MiFish, a set of universal PCR primers for metabarcoding environmental DNA from fishes: Detection of more than 230 subtropical marine species. R Soc. Open Sci. 2015, 2, 150088. [Google Scholar] [CrossRef] [PubMed]
  47. Valentini, A.; Taberlet, P.; Miaud, C.; Civade, R.; Herder, J.; Thomsen, P.F.; Bellemain, E.; Besnard, A.; Coissac, E.; Boyer, F.; et al. Next-generation monitoring of aquatic biodiversity using environmental DNA metabarcoding. Mol. Ecol. 2016, 25, 929–942. [Google Scholar] [CrossRef] [PubMed]
  48. Taberlet, P.; Bonin, A.; Zinger, L.; Coissac, E. Environmental DNA: For Biodiversity Research and Monitoring; Oxford University Press: Oxford, UK, 2018. [Google Scholar]
  49. Tamura, K.; Dudley, J.; Nei, M.; Kumar, S. MEGA4: Molecular evolutionary genetics analysis (MEGA) software version 4.0. Mol. Biol. Evol. 2007, 24, 1596–1599. [Google Scholar] [CrossRef] [PubMed]
  50. Andrews, S. FastQC: A Quality Control Tool for High Throughput Sequence Data. 2010. Available online: https://www.bioinformatics.babraham.ac.uk/projects/fastqc (accessed on 26 June 2026).
  51. Mathon, L.; Valentini, A.; Guerin, P.E.; Normandeau, E.; Noel, C.; Lionnet, C.; Boulanger, E.; Thuiller, W.; Bernatchez, L.; Mouillot, D.; et al. Benchmarking bioinformatic tools for fast and accurate eDNA metabarcoding species identification. Mol. Ecol. Resour. 2021, 21, 2565–2579. [Google Scholar] [CrossRef] [PubMed]
  52. Evans, N.T.; Li, Y.; Renshaw, M.A.; Olds, B.P.; Deiner, K.; Turner, C.R.; Jerde, C.L.; Lodge, D.M.; Lamberti, G.A.; Pfrender, M.E. Fish community assessment with eDNA metabarcoding: Effects of sampling design and bioinformatic filtering. Can. J. Fish. Aquat. Sci. 2017, 74, 1362–1374. [Google Scholar] [CrossRef]
  53. Anderson, M. A new method for non-parametric multivariate analysis of variance. Austral. Ecol. 2001, 26, 32–46. [Google Scholar] [CrossRef]
  54. Anderson, M.; Gorley, R.; Clarke, K. PERMANOVA+ for PRIMER: Guide to Software and Statistical Methods; PRIMER-E, Plymouth Marine Laboratory: Plymouth, UK; 199p.
  55. Bray, J.R.; Curtis, J.T. An ordination of the upland forest communities of southern Wisconsin. Ecol. Monogr. 1957, 27, 325–349. [Google Scholar] [CrossRef] [PubMed]
  56. Kruskal, J.B. Multidimensional scaling by optimizing goodness of fit to a nonmetric hypothesis. Psychometrika 1964, 29, 1–27. [Google Scholar] [CrossRef]
  57. Kruskal, J.B. Nonmetric multidimensional scaling: A numerical method. Psychometrika 1964, 29, 115–129. [Google Scholar] [CrossRef]
  58. Clarke, K. Non-parametric multivariate analyses of changes in community structure. Aust. J. Ecol. 1993, 18, 117–143. [Google Scholar] [CrossRef]
  59. Legendre, P.; Anderson, M.J. Distance-based redundancy analysis: Testing multispecies responses in multifactorial ecological experiments. Ecol. Monogr. 1999, 69, 1–24. [Google Scholar] [CrossRef]
  60. McArdle, B.H.; Anderson, M.J. Fitting multivariate models to community data: A comment on distance-based redundancy analysis. Ecology 2001, 82, 290–297. [Google Scholar] [CrossRef]
  61. Akaike, H. A new look at the statistical model identification. IEEE Trans. Autom. Control 1974, 19, 716–723. [Google Scholar] [CrossRef]
  62. Clarke, K.R.; Gorley, R.N. Getting Started with PRIMER v7; Plymouth Marine Laboratory: Plymouth, UK, 2015; 20p. [Google Scholar]
  63. Diez, M.J.; Cabreira, A.G.; Madirolas, A.O.; De Nascimento, J.M.; Scioscia, G.; Schiavini, A.; Lovrich, G.A. Winter is cool: Spatio-temporal patterns of the squat lobster Munida gregaria and the Fuegian sprat Sprattus fuegensis in a sub-Antarctic estuarine environment. Polar Biol. 2018, 41, 2591–2605. [Google Scholar] [CrossRef]
  64. Lattuca, M.E.; Perez, A.F.; Giarratano, E.; Malanga, G.F. Baseline levels of biomarkers of oxidative damage in Odontesthes nigricans (Pisces, Atherinopsidae) from two coastal areas of the Beagle Channel, Argentina. Rev. Chil. Hist. Nat. 2013, 86, 453–464. [Google Scholar] [CrossRef]
  65. Lattuca, M.E.; Lozano, I.E.; Brown, D.R.; Renzi, M.; Luizon, C.A. Natural growth, otolith shape and diet analyses of Odontesthes nigricans Richardson (Atherinopsidae) from southern Patagonia. Est. Coast. Shelf Sci. 2015, 166, 105–114. [Google Scholar] [CrossRef]
  66. Cocito, L.L.; Ceballos, S.G.; Fernández, D.A. Sharp phylogeographical differentiation near the southern range edge of the silverside Odontesthes nigricans: Distinct peripheral populations and incipient speciation? Est. Coast. Shelf Sci. 2019, 226, 106276. [Google Scholar] [CrossRef]
  67. Alvarez Oyarzo, Y.P.; Rojas, A.E.; Ceballos, S.G. Genomic SNP data reveal allopatric divergence during Pleistocene glaciations and fine-scale population structure in a southern South American silverside (Odontesthes nigricans). Mar. Biol. 2026, 173, 121. [Google Scholar] [CrossRef]
  68. Chalde, T.; Nardi, C.F.; Fernández, D.A. Early warning: Detection of exotic coho salmon (Oncorhynchus Kisutch) by environmental DNA and evidence of establishment at the extreme south of Patagonia. Can. J. Fish. Aquat. Sci. 2019, 76, 2343–2349. [Google Scholar] [CrossRef]
  69. Veyñ, M.; Chalde, T.; Nardi, C. Optimisation of an environmental DNA-based approach for assessing freshwater fish biodiversity in southernmost South America. Aquat. Conserv. Mar. Freshw. Ecosyst. 2025, 35, e70112. [Google Scholar] [CrossRef]
  70. Hüne, M.; Friedlander, A.M.; Ballesteros, E.; Caselle, J.E.; Sala, E. Assemblage structure and spatial diversity patterns of kelp forest-associated fishes in Southern Patagonia. PLoS ONE 2021, 16, e0257662. [Google Scholar] [CrossRef] [PubMed]
  71. Huertas Herrera, A.; Lencinas, M.V.; Toro Manríquez, M.; Miller, J.A.; Martínez Pastur, G. Mapping the status of the North American beaver invasion in the Tierra del Fuego archipelago. PLoS ONE 2020, 15, e0232057. [Google Scholar] [CrossRef] [PubMed]
  72. Kelly, R.P.; Port, J.A.; Yamahara, K.M.; Crowder, L.B. Using environmental DNA to census marine fishes in a large mesocosm. PLoS ONE 2014, 9, e86175. [Google Scholar] [CrossRef] [PubMed]
  73. Milano, V.N.; Grandi, M.F.; Schiavini, A.C.M.; Crespo, E.A. Recovery of South American fur seals from Fuegian Archipelago (Argentina). Mar. Mamm. Sci. 2020, 36, 1022–1032. [Google Scholar] [CrossRef]
  74. Milano, V.N.; Grandi, M.F.; Schiavini, A.C.M.; Crespo, E.A. Sea lions (Otaria flavescens) from the end of the world: Insights of a recovery. Polar Biol. 2020, 43, 695–706. [Google Scholar] [CrossRef]
  75. Pinfield, R.; Dillane, E.; Runge, A.K.W.; Evans, A.; Mirimin, L.; Niemann, J.; Reed, T.E.; Reid, D.G.; Rogan, E.; Samarra, F.I.P.; et al. False-negative detections from environmental DNA collected in the presence of large numbers of killer whales (Orcinus orca). Environ. DNA 2019, 1, 316–328. [Google Scholar] [CrossRef]
  76. Deng, S.; Zhang, X.; Liu, M.; Lin, B.A.; Zhou, Y.; Liu, M.; Lin, W.; Lin, M.; Dong, L.; Kang, H.; et al. Distribution pattern of cetaceans in the northern South China Sea based on visual surveys and environmental DNA metabarcoding. Conserv. Biol. 2025, 39, e70060. [Google Scholar] [CrossRef] [PubMed]
  77. Álvarez-González, M.; Saavedra, C.; Rotllant, J.; Pierce, G.J.; Gutiérrez-Muñoz, P.; Vázquez Bonales, J.A.; Suarez-Bregua, P. Environmental DNA (eDNA) metabarcoding as a complementary monitoring tool in cetacean visual surveys: From broad to fine-scale spatial analysis in open waters. Mar. Environ. Res. 2026, 217, 107985. [Google Scholar] [CrossRef] [PubMed]
  78. Robinson, C.V.; Migneault, A.; Dracott, K.; Glover, R.D. Seas the DNA? Limited detection of cetaceans by low-volume environmental DNA transect surveys. Environ. DNA 2023, 5, 1641–1651. [Google Scholar] [CrossRef]
  79. Parsons, K.M.; May, S.A.; Gold, Z.; Dahlheim, M.; Gabriele, C.; Straley, J.M.; Reed, T.E.; Reid, D.G.; Rogan, E.; Samarra, F.I.P.; et al. Using eDNA to supplement population genetic analyses for cryptic marine species: Identifying population boundaries for Alaska harbour porpoises. Mol. Ecol. 2025, 34, e17563. [Google Scholar] [CrossRef] [PubMed]
  80. Alter, S.E.; King, C.D.; Chou, E.; Chin, S.C.; Rekdahl, M.; Rosenbaum, H.C. Using environmental DNA to detect whales and dolphins in the New York Bight. Front. Conserv. Sci. 2022, 3, 820377. [Google Scholar] [CrossRef]
  81. Paso Viola, M.N.; San Martín, A.; Dellabianca, A.; Jusim, P.; Vidal, V.; Torres, M.; Dellabianca, N.; Tartaglia Gamarra, M.B.; Riccialdelli, L. Presencia del Elefante Marino del sur Mirounga leonina en Tierra del Fuego; JNCM: Puerto Madryn, Argentina, 2025. [Google Scholar]
  82. Dellabianca, N.A.; Torres, M.A.; Raya Rey, A. Occurrence of dusky dolphin Lagenorhynchus obscurus in Tierra del Fuego archipelago over five decades. Polar Biol. 2018, 41, 1895–1900. [Google Scholar] [CrossRef]
  83. Ordoñez, C.; Diez, M.J.; Torres, M.A.; Dellabianca, N.A. Uso de hábitat del delfín austral (Lagenorhynchus australis) en el Canal Beagle, Tierra del Fuego, Argentina. Mastozool. Neotrop. 2020, 27, 247–252. [Google Scholar] [CrossRef]
  84. Dellabianca, A.; Torres, M.A.; Riccialdelli, L.; Leiva Muñoz, G.; Asplanato, N.; Dellabianca, N.A. Fidelidad al Sitio y Tiempos de Permanencia de Ballenas Jorobadas Megaptera Novaeangliae en el Canal Beagle, Tierra del Fuego; JNCM: Puerto Madryn, Argentina, 2025; Libro de resúmenes; p. 197. [Google Scholar]
  85. Goodall, R.N.P.; Boy, C.C.; Schiavini, A.C.M. Historical and modern records of cetaceans self-stranding to escape from killer whales (Working Paper SC59/SM17). Report to the Scientific Committee. In Proceedings of the 59th Annual Meeting of the International Whaling Commission (IWC), Anchorage, AK, USA, 28–31 May 2007; 11p. [Google Scholar]
  86. Schüttler, E.; Gañan, M.; Barroso, O.; Contador, T.; Illanes, D.; Muñoz-Araya, G.; Palma, M.J.; Pérez-Álvarez, M.J.; Sepúlveda, M.; Rendoll-Cárcamo, J. Observations of attacks on sei and fin whales by killer whales in Magellanic sub-Antarctic waters, Chile. Aquat. Mamm. 2024, 50, 332–341. [Google Scholar] [CrossRef]
  87. Asplanato, N.; Wells, R.S.; Riccialdelli, L.; Torres, M.A.; Dellabianca, N.A. Photo-identification: An effective tool to study Burmeister’s porpoises. Polar Biol. 2026, 49, 40. [Google Scholar] [CrossRef]
  88. Torres, M.A.; Tartaglia Gamarra, M.B.; Ordoñez, C.; Riccialdelli, L.; Dellabianca, A.; Dellabianca, N.A. Ocurrencia de la Ballena sei (Balaenoptera borealis) en Aguas del Canal Beagle, Tierra del Fuego; JNCM: Puerto Madryn, Argentina, 2025; Libro de resúmenes; p. 217. [Google Scholar]
  89. Stat, M.; Huggett, M.J.; Bernasconi, R.; DiBattista, J.D.; Berry, T.E.; Newman, S.J.; Harvey, E.S.; Bunce, M. Ecosystem biomonitoring with eDNA: Metabarcoding across the tree of life in a tropical marine environment. Sci. Rep. 2017, 7, 12240. [Google Scholar] [CrossRef] [PubMed]
  90. Linck, E.; Cadena, C.D. A latitudinal gradient of reference genomes. Mol. Ecol. 2024, 34, e17551. [Google Scholar] [CrossRef] [PubMed]
  91. Gold, Z.; Curd, E.E.; Goodwin, K.D.; Choi, E.S.; Frable, B.W.; Thompson, A.R.; Walker, H.J.; Burton, R.S.; Kacev, D.; Martz, L.D.; et al. Improving metabarcoding taxonomic assignment: A case study of fishes in a large marine ecosystem. Mol. Ecol. Resour. 2021, 21, 2546–2564. [Google Scholar] [CrossRef] [PubMed]
  92. Blackman, R.C.; Walser, J.C.; Rüber, L.; Brantschen, J.; Villalba, S.; Brodersen, J.; Seehausen, O.; Altermatt, F. General principles for assignments of communities from eDNA: Open versus closed taxonomic databases. Environ. DNA 2023, 5, 326–342. [Google Scholar] [CrossRef]
  93. Saenz-Agudelo, P.; Delrieu-Trottin, E.; DiBattista, J.D.; Martínez-Rincon, D.; Morales-González, S.; Pontigo, F.; Ramírez, P.; Silva, A.; Soto, M.; Correa, C. Monitoring vertebrate biodiversity of a protected coastal wetland using eDNA metabarcoding. Environ. DNA 2021, 4, 77–92. [Google Scholar] [CrossRef]
  94. Thalinger, B.; Empey, R.; Cowperthwaite, M.; Coveny, K.; Steinke, D. BirT: A novel primer pair for avian environmental DNA metabarcoding. Environ. DNA 2026, 8, e70255. [Google Scholar] [CrossRef]
  95. Takahashi, M.; Saccò, M.; Kestel, J.H.; Nester, G.; Campbell, M.A.; Van der Heyde, M.; Heydenrych, M.J.; Juszkiewicz, D.J.; Nevill, P.; Dawkins, K.L.; et al. Aquatic environmental DNA: A review of the macro-organismal biomonitoring revolution. Sci. Total Environ. 2023, 873, 162322. [Google Scholar] [CrossRef] [PubMed]
Figure 1. Location of the Beagle Channel in Tierra del Fuego. Red dots represent sampling sites: 1− 6 correspond to the central section, whereas sites 7−10 correspond to the eastern section of the channel. Solid lines represent freshwater inputs, and the dashed line indicates the Argentina–Chile border. The arrow shows the location of the Mackinlay Strait.
Diversity 18 00468 g001
Figure 2. Shade plot showing species occurrence (y-axis) across the sampling stations (x-axis) with the four field replicates pooled for each station (1 to 10). The intensity of the colours denotes the relative abundance ranging from 0 (white) to 60 (black). CS: central sector, ES: eastern sector.
Diversity 18 00468 g002
Figure 3. Non-metric multidimensional scaling (nMDS) ordination plot based on Bray–Curtis dissimilarities of vertebrate eDNA assemblages from the Beagle Channel. Triangles represent centroids calculated for each Sector–Station–Season combination, where each centroid summarizes the average position of the biological replicates within that group. Blue upward triangles represent the Central Sector (CS), and red downward triangles represent the Eastern Sector (ES). Centroids were used only for graphical clarity; statistical analyses were conducted using the individual biological replicates.
Diversity 18 00468 g003
Figure 4. Distance−based redundancy analysis (dbRDA) ordination showing the relationship between vertebrate eDNA assemblage composition and environmental variables in the Beagle Channel. The analysis was based on a Bray–Curtis resemblance matrix calculated from fourth-root-transformed and sample-standardized read abundances. Blue upward triangles represent samples from the central sector (CS), and red downward triangles represent samples from the eastern sector (ES). Environmental vectors show only variables that were significant in the marginal DistLM tests: chlorophyll-a, ammonium, silicate, salinity and turbidity.
Diversity 18 00468 g004
Table 1. PERMANOVA results testing spatial and temporal variation in vertebrate eDNA assemblage composition in the Beagle Channel. The model included Sector and Season as fixed crossed factors, and station as a random factor nested within sector. df = degrees of freedom; MS = mean square; pseudo-F = pseudo-F statistic; P (perm) = permutational p-value; unique perms = number of unique permutations; %CV = percentage contribution of each source of variation.
Source of VariationdfMSPseudo-Fp-permU.perms%CV
Sector122,0883.360.0077125920.6
Season112,0741.870.0862993812.4
Site (sector)86647.32.790.0001979723.4
Sector × season19416.31.460.1956994012.7
Season × site (sector)865192.730.0001979932.6
Residual582380.7 48.7
Total77
Table 2. SIMPER analysis identifying the main taxa contributing to the dissimilarity in vertebrate eDNA assemblage composition between the central and eastern sectors (CS and ES, respectively) of the Beagle Channel. Taxa are ranked by their percentage contribution to the average Bray–Curtis dissimilarity. Av.Abund. = average transformed and standardized abundance; Av.Diss. = average dissimilarity contribution; Diss/SD = consistency of the taxon contribution; Contrib. (%) = percentage contribution; Cum. (%) = cumulative contribution. Groups: Central Sector & Eastern Sector. Average dissimilarity = 88.79.
Group CSGroup ES
SpeciesCommon NamesAv.AbundAv.AbundAv.DissDiss/SDContrib%Cum.%
Odontesthes nigricansSilverside1.9420.9410.300.9711.6011.60
Sprattus fuegensisFuegian sprat20.625.299.671.0110.8922.48
Sus scrofa domesticusPig12.505.477.570.688.5231.01
Castor canadensisNorth American beaver4.8710.726.610.667.4538.46
Bos taurusCow6.994.074.670.605.2643.71
Mirounga leoninaSouthern elephant seal7.830.003.920.424.4148.12
Paranotothenia magellanicaMagellanic rockcod2.105.863.380.723.8151.93
Otaria flavescensSouthern sea lion2.113.892.670.573.0154.94
Canis lupus familiarisDomestic dog2.672.682.380.542.6857.62
Odontesthes spp.Silversides0.904.132.380.502.6860.30
Notothenia coriicepsBlack rockcod2.312.652.190.452.4762.76
Abrothrix spp.Native grass mice0.543.972.160.352.4365.19
Trematomus hansoniStriped rockcod1.782.511.970.402.2267.41
Arctocephalus australisSouth American fur seal2.181.981.930.422.1869.59
Felis catusDomestic cat3.590.261.900.332.1471.73
Disclaimer/Publisher’s Note: The statements, opinions and data contained in all publications are solely those of the individual author(s) and contributor(s) and not of MDPI and/or the editor(s). MDPI and/or the editor(s) disclaim responsibility for any injury to people or property resulting from any ideas, methods, instructions or products referred to in the content.