Article

Potential Distribution of Wild Chinese Giant Salamander (Andrias davidianus) in Zhejiang Province from Environmental DNA

1
Provincial Key Laboratory of Wildlife Biotechnology and Conservation and Utilization, Zhejiang Normal University, Jinhua 321004, China
2
Wuyi City Natural Resources and Planning Bureau, Jinhua 321004, China
3
Xingzhi College, Zhejiang Normal University, Jinhua 321004, China
*
Author to whom correspondence should be addressed.
Diversity 2026, 18(8), 461; https://doi.org/10.3390/d18080461
Submission received: 18 June 2026 / Revised: 16 July 2026 / Accepted: 27 July 2026 / Published: 30 July 2026
(This article belongs to the Section Biodiversity Conservation)

Abstract

The Chinese giant salamander (CGS, Andrias davidianus) is an endangered aquatic amphibian in China. Using environmental DNA (eDNA), this study aimed to monitor the spatial distribution of this species in Zhejiang Province, providing a scientific basis for species assessment, evaluation of reintroduction effectiveness, and non-invasive monitoring. Based on historical records of species presence, 18 representative water localities were selected for sampling. Among these localities, eDNA signals of the CGS were detected at nine. After excluding sampling sites affected by historical CGS releases and surrounding breeding farms, Jinzi Peak and Huyuan were inferred as candidate potentially natural stream habitats within the province. Additionally, eDNA monitoring was conducted at two release sites, Gutian Mountain and Banshanyuan, for two consecutive years. Results revealed lower detection rates in both areas in the second year of monitoring, potentially attributed to low survival rates, dispersal and disappearance, or sampling variability. A principal component analysis (PCA) of water quality factors (including parameters such as NH3-N, TN, TP, COD) revealed distinct geographic clustering of CGS-positive and CGS-negative sampling sites that corresponded to their separation in topographic space, suggesting that the measured physicochemical conditions may be associated with the CGS eDNA detection probability. This study demonstrates that eDNA is a feasible and efficient method for surveying CGS in Zhejiang Province. Further, it provides an efficient non-invasive monitoring approach for endangered amphibians, with broad application prospects.

1. Introduction

The Chinese giant salamander (CGS), Andrias davidianus (Amphibia, Caudata, Cryptobranchidae), is endemic to China [1,2] and was once predominantly distributed within the Yangtze and Yellow Rivers and the Pearl River basins, spanning 17 provinces and municipalities including Guizhou, Hunan, Hubei, and Henan [3]. As a flagship species of freshwater ecosystems, the protection of endangered CGS helps maintain aquatic ecological stability and regional biodiversity [4]. Despite the implementation of a series of national laws and regulations, the illegal capturing, trafficking, and consumption of the species remain prevalent, resulting in a considerable contraction of its habitat range. At present, many geographically separate populations of wild CGS have become extinct in China [5], with rapid declines in abundance, making the CGS a globally endangered amphibian [6]. It was recently listed as Critically Endangered [7] and was also listed as a Grade II state-protected animal in China in 2021 [8].
As a key protected amphibian, the CGS has been subject to large-scale attempts at artificial population recovery through breeding and release over the years in several regions within China [9,10]. However, due to the lack of unified quality control and individual identification systems for early releases, the survival rate, dispersal paths, and interactions with wild populations of released individuals are difficult to track; therefore, the assessment has long relied on field observations and expert experience [11,12]. Zhejiang Province is a historically important region for the CGS and has lacked survey efforts and systematic scientific data; therefore, observational data have relied on sporadic sightings or private reports, which restricts further research on the linkage between its wild distribution pattern and regional species diversity protection. Traditional survey methods, such as on-site searching, manual capture, and visual observation, particularly in release areas and rivers where wild populations may occur, are faced with limitations including strong operational interference, low efficiency, and high dependence on the species’ behavioural habits [13]. The CGS is a nocturnal species with extremely low densities, making it difficult to survey using conventional methods to obtain effective information [14]. As a result, there is an urgent need to explore a sensitive, non-invasive, and adaptable approach to monitor and assess released individuals and potential wild populations.
Environmental DNA (eDNA) is genetic material released into the environment through organismal shedding, excretion, or cell lysis. Collected from samples such as water, soil, or air, eDNA can be used to detect species presence [15,16]. This method obtains residual DNA while avoiding habitat disturbance caused by traditional capture and trapping approaches and is particularly suitable for monitoring sensitive ecosystems and endangered species [17]. When combined with PCR detection, eDNA surveys can be highly sensitive, efficient, convenient, and provide wide coverage, resulting in a mainstream tool for rare species surveys. The reliability and practicability of this method are supported by many field applications; for instance, Voyles et al. [18] employed eDNA to detect endangered harlequin frogs (Atelopus varius, Atelopus zeteki, and Atelopus chiriquiensis) and amphibian chytrid fungus (Batrachochytrium dendrobatidis, Bd) in Panamanian streams, verifying that some harlequin frog populations still survive in their historical habitats. Further, Kurtz et al. [19] developed an eDNA-PCR assay targeting the mitochondrial control region for the hellbender salamander (Cryptobranchus alleganiensis), which exhibited excellent specificity and enhanced the detection sensitivity of field eDNA by one order of magnitude, offering a reliable approach for the non-invasive monitoring of this endangered species. Species-specific eDNA primers have been designed for the CGS and field sampling and laboratory validation have demonstrated that they can effectively amplify the target DNA and identify different mitochondrial haplotypes and lineage mixtures, providing a highly sensitive and cost-effective method to monitor this rare species [20]. Therefore, this is a suitable approach for monitoring the CGS in other regions such as Zhejiang Province [21].
In this study, eDNA analysis was utilized to assess the spatial distribution range of wild CGS in Zhejiang Province and to explore the effects of water quality and environmental factors on the distribution. By monitoring the release sites over two consecutive years, the survival and dispersal status of the CGS population after artificial release were assessed to provide precise and efficient technical support for the management and protection of this species.

2. Materials and Methods

2.1. Study Sites

This study was conducted from June 2023 to November 2024 in Zhejiang Province, China, focusing on field surveys in areas with more historical records. A total of 40 localities were initially surveyed for habitat suitability, and water samples were collected from 18 representative localities (coordinates in Table S1). Within each locality, sampling sites were established along rivers at 300 m intervals, with three replicate 4.5 L samples collected per site. A total of 192 samples were collected from 64 sites (Figure 1).

2.2. Water Sample Treatment and eDNA Sample Collection

Water samples were collected at a uniform depth of 10–15 cm below the water surface. Prior to sampling, the 4.5 L plastic buckets were sterilized by rinsing with 75% ethanol, followed by three rinses with ultrapure water (≥18.0 MΩ·cm) and site water; a new pair of rubber gloves was worn at each sampling site. Unfiltered stream water samples were collected from all 18 sampling sites for subsequent water quality parameter determination.
A vacuum filtration system, glass sand cores, and forceps were rinsed with ultrapure water, and then sterilized under high temperature and pressure (autoclaved at 121 °C, 15 psi, 20 min). On-site filtration of the water samples was performed using vacuum filtration. During filtration, a sterilized mixed cellulose ester (MCE) filter membrane (47 mm diameter, 0.45 µm pore size) was placed onto the filter holder. After filtration, the filter membrane was folded using the sterile forceps and stored in a 1.5 mL microcentrifuge Eppendorf tube containing 95% ethanol for subsequent environmental DNA extraction. To monitor the risk of cross-contamination, 4.5 L of purified water was filtered immediately after sample processing at each site, and the corresponding filter membrane was collected for DNA extraction as a negative control [21,22].

2.3. Extraction of Genomic DNA and PCR Amplification

The TIANamp Genomic DNA Kit (Sangon Biotech Co., Ltd., Shanghai, China) was used to process the samples following the manufacturer’s protocol. All environmental water samples and negative control blanks were lysed directly following pre-filtration eDNA enrichment. The lysate was loaded onto a centrifugal adsorption column for protein removal and washing, after which DNA was eluted with 100 μL of 65 °C elution buffer. Extracts were confirmed to contain DNA fragments via 1% agarose gel electrophoresis, and the concentration and OD260/OD280 ratio were measured using a nucleic acid protein analyzer (Houyan Biological Instruments, Shanghai, China). Given the inherently low yield and degraded nature of environmental DNA, samples with an OD260/OD280 ratio of 1.0–2.0 and a concentration ≥ 0.1 ng/μL were selected, aliquoted, and stored at −20 °C.
Our PCR mix had a total volume of 25 µL, including 12.5 µL Master Mix (Nanjing Novazene Biotechnology Co., Ltd., Nanjing, China), 8.5 µL double-distilled water (ddH2O), 1 µL of forward and reverse primers, and 2 µL of template DNA. The reaction conditions were as follows: pre-denaturation at 94 °C for 4 min; 35 cycles of denaturation at 95 °C for 40 s, a two-step annealing/extension procedure comprising 60 °C for 60 s (to enhance primer specificity) and 51.2 °C for 60 s (to ensure efficient amplification), followed by extension at 72 °C for 30 s; and a final extension at 72 °C for 8 min. Species-specific primers were designed based on the conserved mitochondrial region of the target species. Primer specificity was rigorously evaluated via sequence alignment, web-based NCBI BLAST verification, and the inclusion of negative and positive controls. The resulting cytochrome b (cytb) primers were 5′-TCTTCAGCATTTTCATCMGTGG-3′ and 5′-GGAAGGACATAACCACAAAAAAGC-3′. They were originally designed by Wang et al. [20]. Each eDNA sample underwent three PCR replicates, with negative and positive controls included in each run. We defined successful detection as ≥2 positive PCR replicates out of three to avoid false-positive signals. The amplification products were detected using 1.2% agarose gel electrophoresis, using Marker B (100–600 bp, Sangon Biotech Co., Ltd., Shanghai, China) as the molecular weight standard. Electrophoresis samples exhibiting a band of approximately 224 bp were considered positive CGS eDNA detection. To ensure accurate results excluding false positives and false negatives, all PCR amplification results were verified by Sanger sequencing and were subsequently compared with those in the NCBI database [23].

2.4. Principal Component Analysis of Water Samples

A multi-parameter water quality analyzer (Hach HQ40d, Hach Company, Loveland, CO, USA) was used to measure physicochemical parameters in the water samples including ammonia nitrogen (NH3-N), total nitrogen (TN), total phosphorus (TP), chemical oxygen demand (COD), fluoride ion (F), nitrate (NO3), and pH. All parameter measurements were strictly conducted in in accordance with instrument’s standard operating procedures and following “Methods for Monitoring and Analysis of Water and Wastewater” [24]. Each sample was tested three times, and the average was used for analysis, with detailed records kept.
To supplement and improve the monitoring data, historical F, NO3, and pH data from the same geographic locations in this study were retrieved from the National Surface Water Quality Automatic Monitoring Network of the Ministry of Ecology and Environment and the data platform of the China National Environmental Monitoring Station. Based on the sampling time and location, data within a straight-line distance of no more than 5 km from the sampling point and within 7 days before and after sampling were selected and integrated [25]. All physicochemical parameter data were standardized (Z-scores) to eliminate dimensional differences for a subsequent principal component analysis (PCA). PCA was performed in SPSS 26.0 (IBM, Armonk, NY, USA) to investigate the influence of the above-selected environmental variables on the distribution of CGS eDNA. Principal components with eigenvalues > 1 were extracted, and the factor loading matrix was subjected to Varimax rotation.

3. Results

3.1. DNA Survey Results

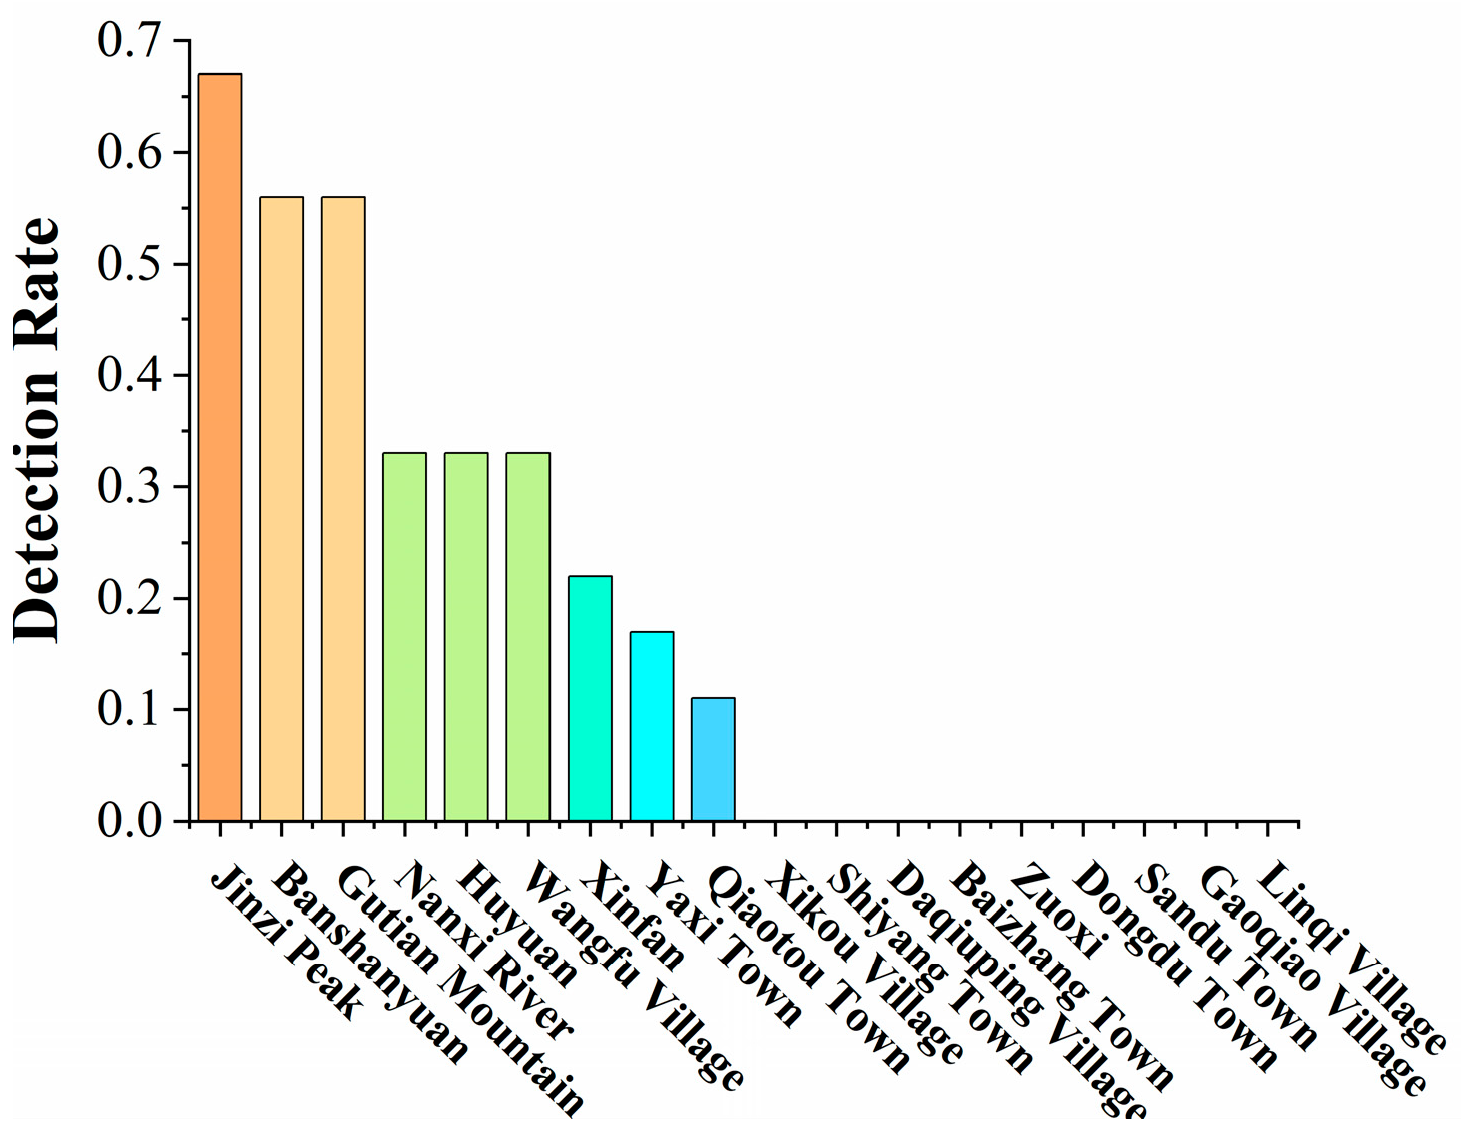
CGS eDNA was detected at nine of the 18 sampling localities (Figure 2), suggesting molecular traces of the species within these regions. These localities where CGS eDNA was detected included Jinzi Peak (detection rate: 67%, defined as the ratio of PCR-positive water samples to total water samples collected at the site), Banshanyuan (56%), Gutian Mountain (56%), Nanxi River (33%), Huyuan (33%), Wangfu Village (33%), Xinfan (22%), Yaxi Town (17%) and Qiaotou Town (11%). Combining historical records and geographic information, we found that Gutian Mountain and Banshanyuan lie close to early giant salamander release sites. Furthermore, Xinfan and Yaxi Town are relatively close to the CGS farms and considering that water is discharged daily from the farms into the surrounding rivers, the eDNA detected at these sites likely originates from farm discharge water. The detection rates at the Jinzi Peak and Huyuan sites were relatively high. The absence of documented restocking or farm escapes at these Qingyuan sites raises the possibility of wild CGS presence.

3.2. Electrophoresis Results of eDNA-Positive Sites

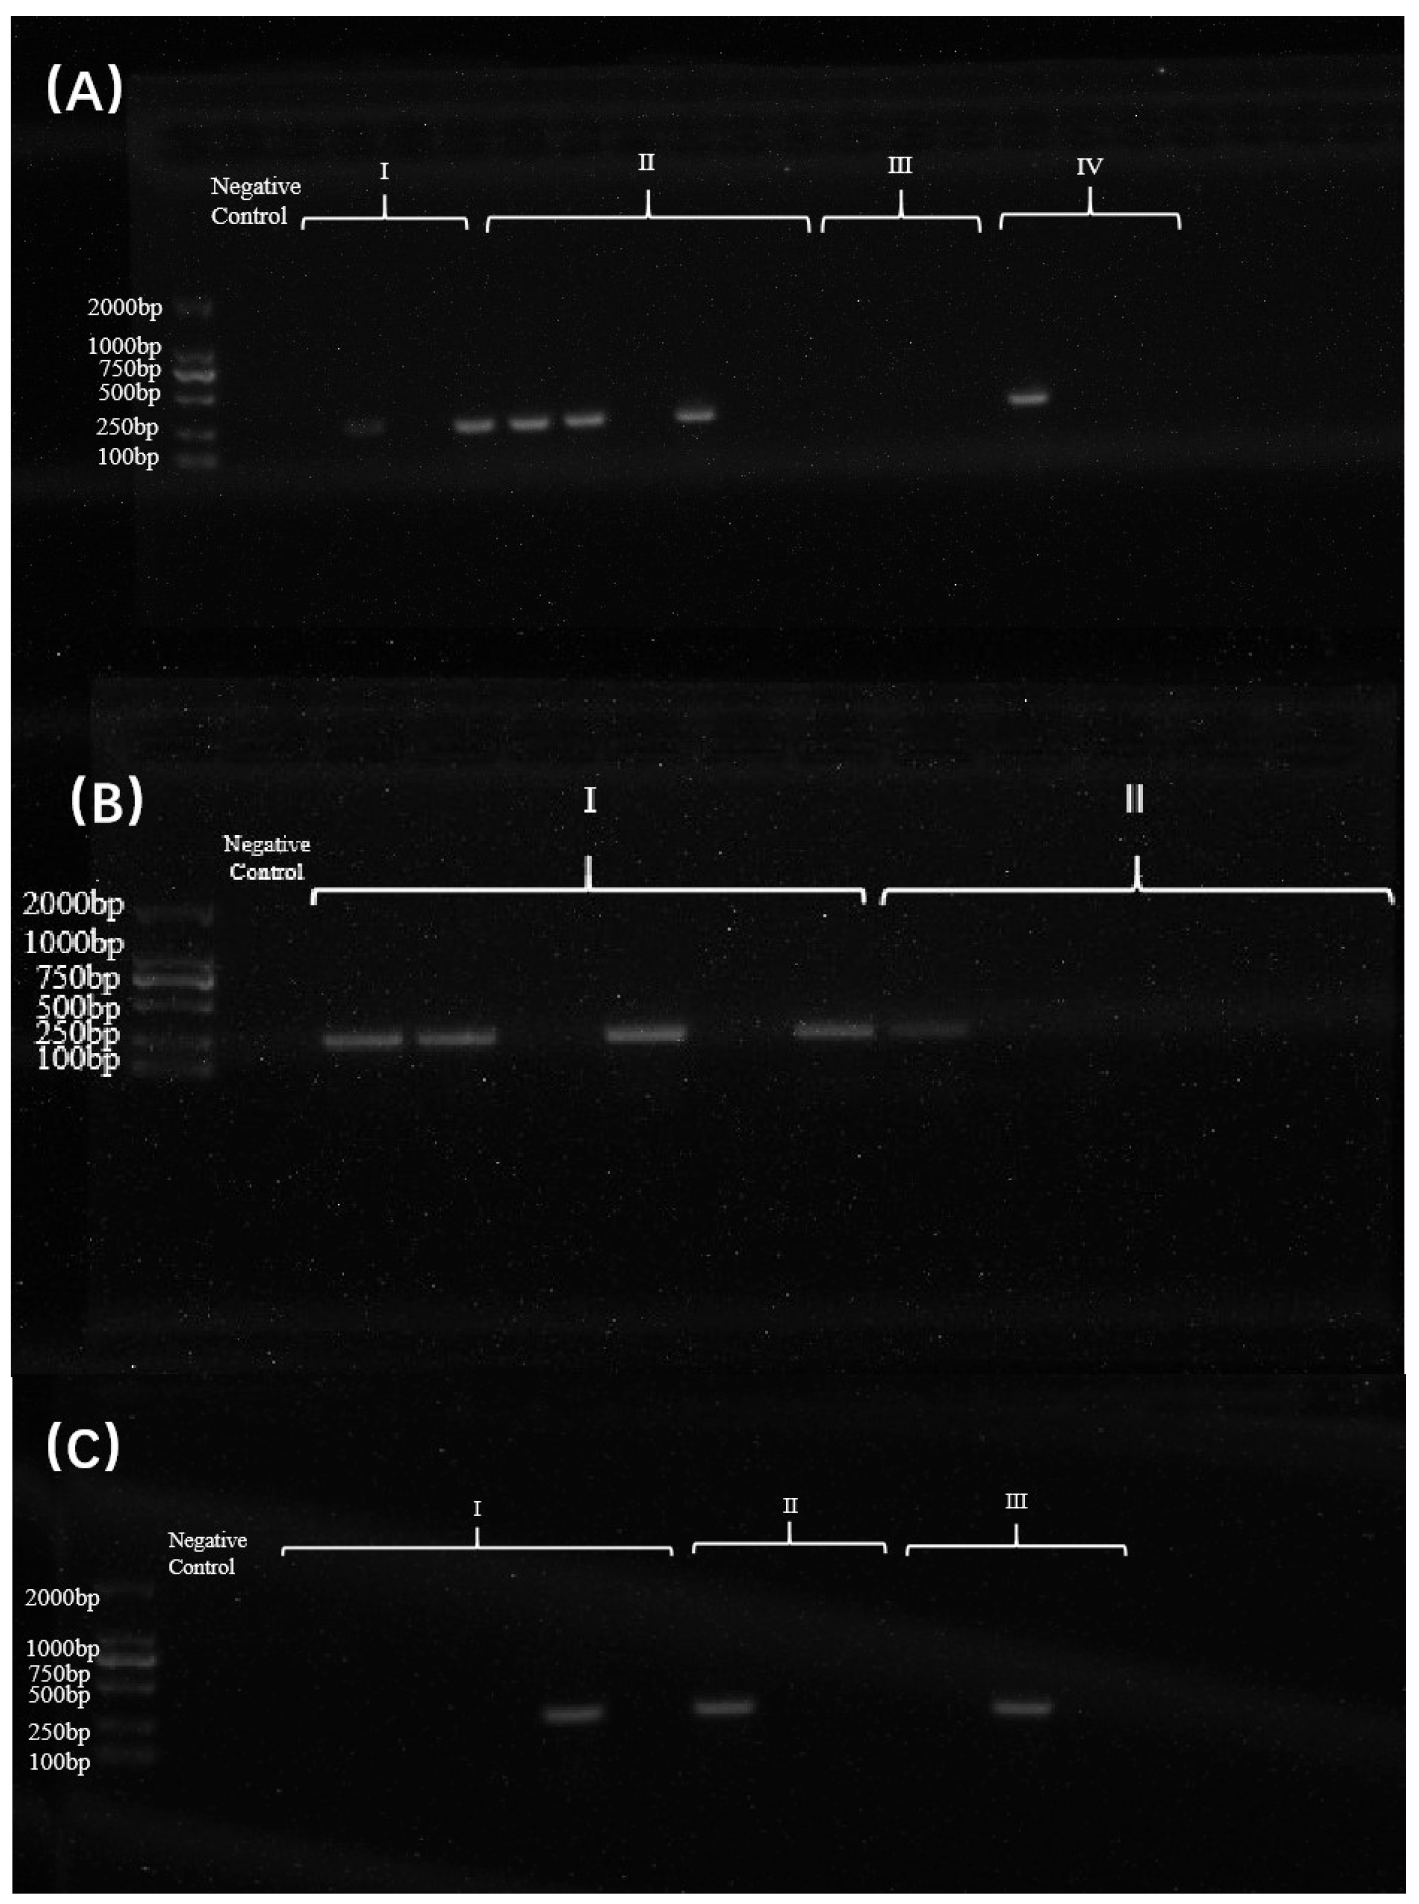
Electrophoresis results showed that all eDNA-positive samples exhibited clear amplification bands at approximately 224 bp, whereas no bands were present in the control group. The fragments detected at eDNA-positive sites ranged from 200 to 224 bp, consistent with the predicted fragment size (Figure 3, Figure S1 shows the original PCR electrophoresis gel images). Sequencing analysis of the positive samples identified that the eDNA belonged to the CGS. The CGS cytb primers used in this study demonstrated good species specificity within the target area. During the DNA detection process, no cross-amplification with other common amphibian species was observed, indicating that the eDNA method used had high detection specificity, supporting its application for CGS presence monitoring.

3.3. Trends in Detection Rates at Release Sites

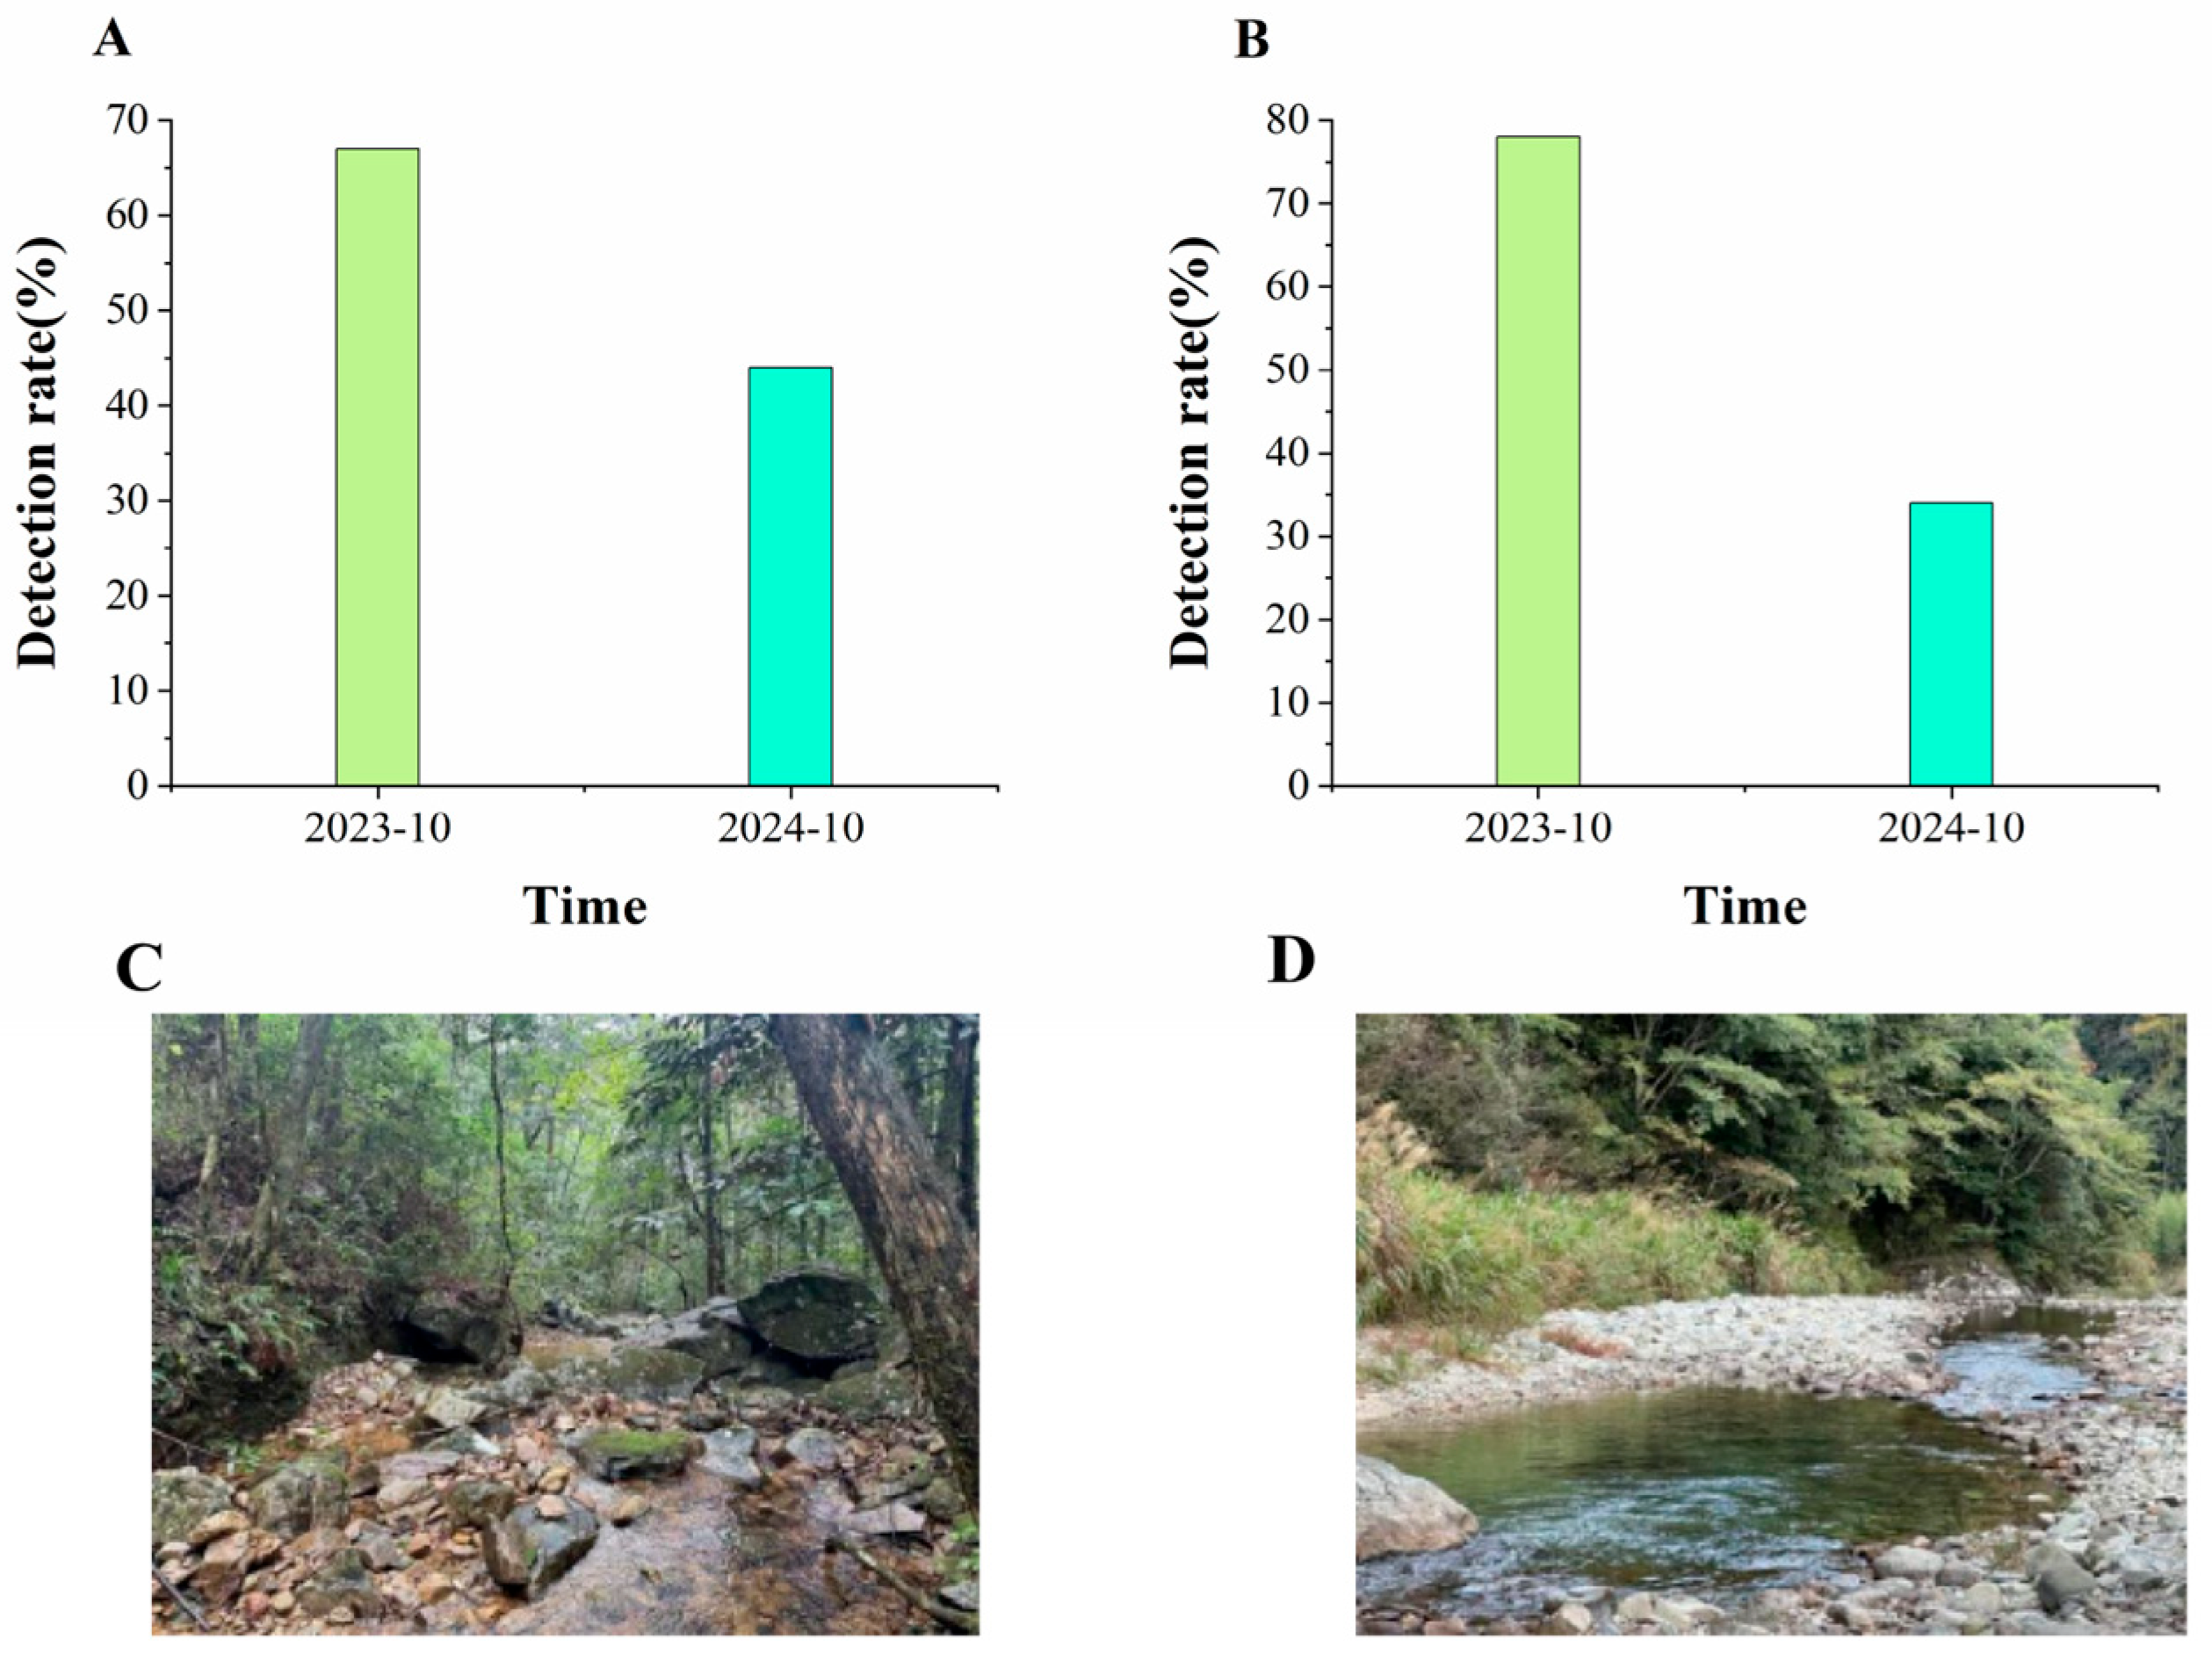
To assess the survival and potential dispersal effects of artificially released CGS, this study conducted two rounds of eDNA sampling at the Gutian Mountain and Banshanyuan release sites in October 2023 and October 2024 (Figure 4). The results showed that the eDNA detection rate at Gutian Mountain decreased from 67% in 2023 to 44% in 2024 (Figure 4A), while eDNA detection rate at Banshanyuan decreased from 78% in 2023 to 34% in 2024 (Figure 4B).

3.4. PCA of Water Quality-Related Factors at Sampling Sites

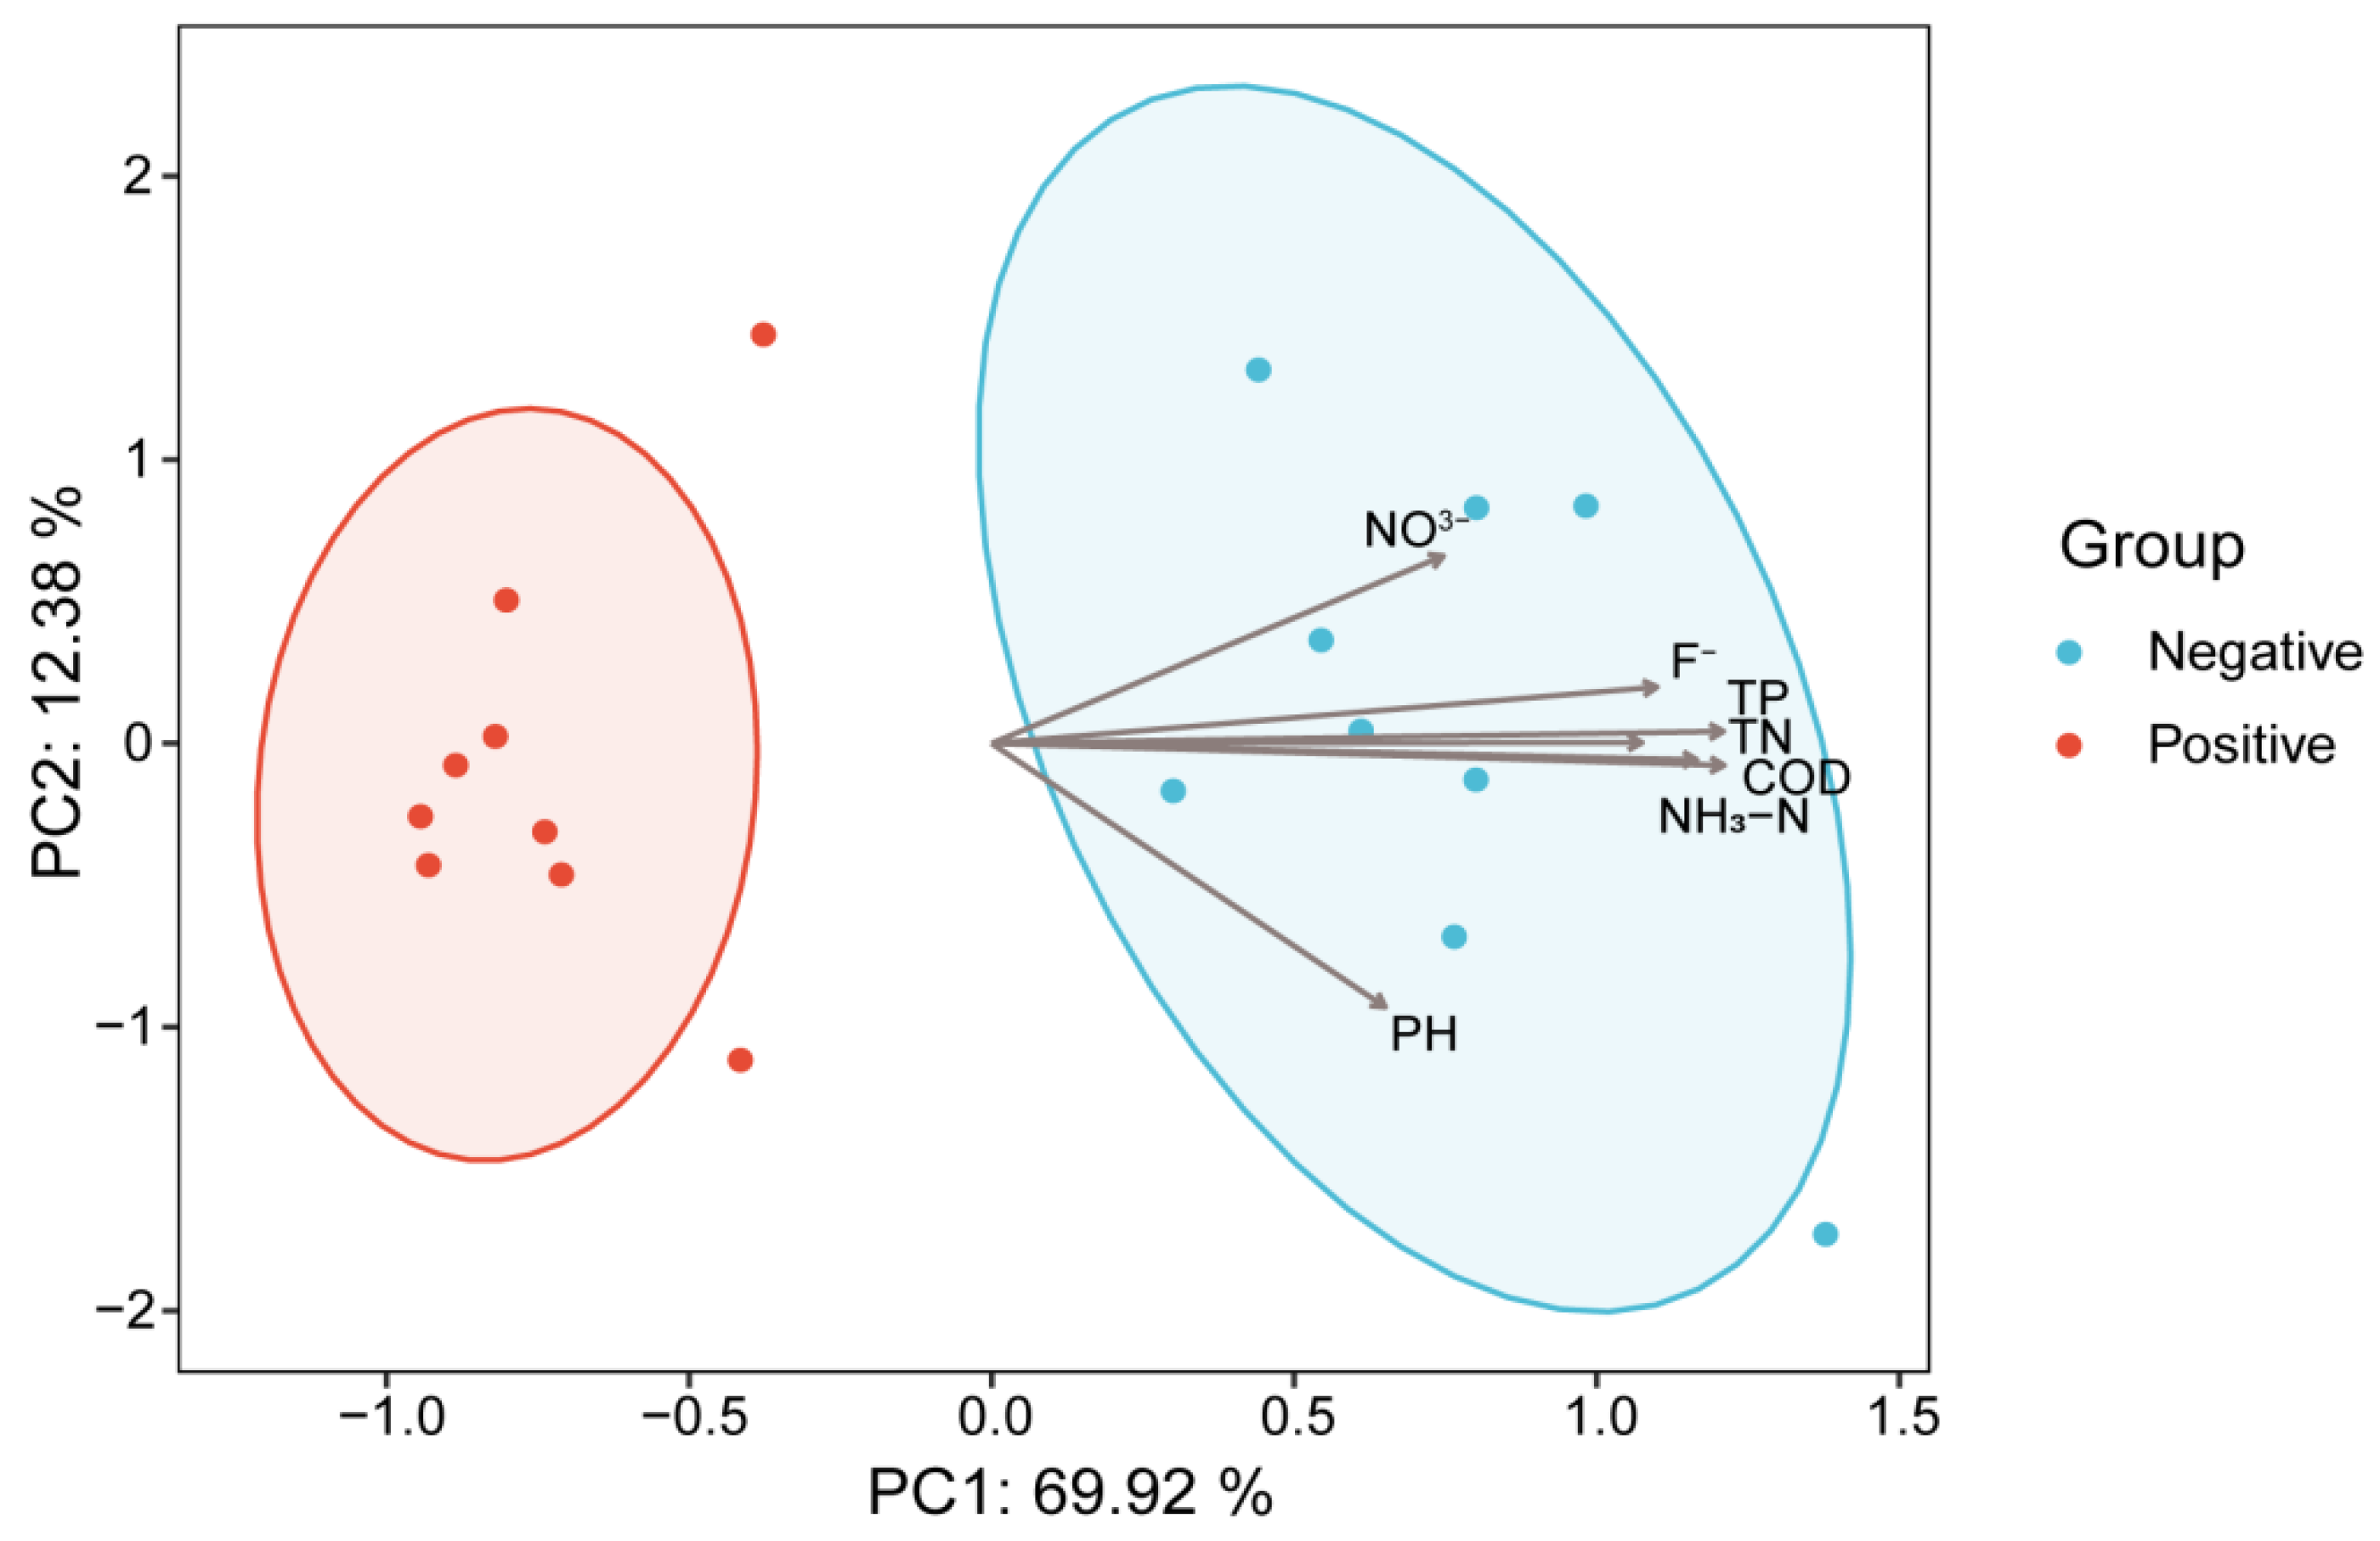
PCA revealed distinct differentiation in water physicochemical conditions between sites with positive and negative CGS eDNA detections. The Kaiser–Meyer–Olkin (KMO) measure of sampling adequacy was 0.828, and Bartlett’s test of sphericity was significant (χ2 = 113.541, df = 21, p < 0.05), indicating that the data were suitable for factor analysis (Table 1). Through PCA dimensionality reduction, the seven parameters were simplified into two principal components. PC1 explained 69.9% of the variance, primarily loaded with NH3-N, TN, TP, COD, and F- while PC2 explained 12.4% of the variance, primarily loaded with NO3- and pH (Table S2).
Multivariate analysis of variance (MANOVA) revealed a significant difference between the CGS eDNA-positive and -negative groups (p = 2.2 × 10⁻⁵). The two groups were projected onto the PCA results plot (Figure 5) with 95% confidence ellipses for visual reference. The two groups exhibited distinct separation where the positive group was concentrated within the low-value region of PC1 (corresponding to low concentrations of factors such as NH3-N), while the negative group was more widely distributed across the high-value region of PC1 and different intervals of PC2. Combining the PC loading directions with the spatial distribution of the groups suggests that water physicochemical parameters are associated with CGS distribution.

4. Discussion

4.1. eDNA Detection Results and Limitations

Given the elusiveness, pronounced nocturnal behavior, seasonal activity patterns, and scarcity of wild populations of the CGS [14], and considering the species status in Zhejiang Province and the associated characteristics of its release programs, this study employed eDNA using specific cytb primers for species detection at 18 sampling localities in Zhejiang Province. Specific CGS DNA signals were detected at nine of these localities, providing molecular evidence for species presence and distribution. Among these, the Jinzi Peak and Banshanyuan localities in Qingyuan County showed the highest detection rates. The exclusion of human-associated factors based on historical data raises the possibility that wild CGS may exist in these areas. However, without amplicon sequencing or mitochondrial haplotype analysis, this distinction remains speculative. Additionally, eDNA was detected at two adjacent early CGS release sites, Gutian Mountain and Banshanyuan. This result may be attributed to potential gene flow from the aquaculture farms into natural water systems.
Standard methods for amphibian surveys vary widely, and multiple studies suggest that group-specific surveys should be designed based on their biological characteristics, such as habitat, activity cycles, and reproductive behavior [26]. Previous surveys of released CGS populations have primarily used mark-recapture, questionnaires, radio tracking, and underwater cameras [27]. However, these traditional methods have significant limitations. For example, mark-recapture is invasive and can cause stress, questionnaires are subject to subjective bias, and underwater cameras are highly susceptible to environmental interference, all of which may have difficulty satisfying the requirements for distribution monitoring [28,29]. The non-invasive and broad coverage of eDNA analysis used in this study compensates for the limitations of these traditional methods, particularly in habitats such as caves and deep pools. Further, positive detections at sites near aquaculture farms demonstrate that eDNA analysis can also be useful in assessing the ecological benefits of stocking and release.
Although an increasing number of studies have emphasized the advantages of eDNA sampling compared to traditional methods [30,31], particularly in large water bodies and for rare species, this approach also has its limitations. For example, both non-biological and biological factors can influence eDNA persistence and concentration [29], eDNA concentrations and detection probabilities are highly variable over time, reflecting changes in activity patterns and life stages of target organisms [32,33]. Based on previous studies, water temperature has been shown to have a dual effect on eDNA degradation and accumulation, with higher water temperatures increasing eDNA decay rates [34], while enhanced metabolism and physiological activity may lead to higher eDNA shedding rates [35]. The low detection rates of eDNA in this study may be related to the combined environmental effects, such as water flow velocity, physicochemical parameters, and temperature [36], and the water sampling process may carry a risk of false positives, resulting in a certain degree of randomness [13,37].

4.2. Monitoring of Released Populations and Recommendations for Future Monitoring Program

CGS restocking has become an important conservation measure for the species in China. Monitoring CGS individuals after release is crucial for evaluating restocking effectiveness as it provides core information on population survival rates and habitat suitability, offering a scientific basis for optimizing conservation strategies and improving release success rates. It is also necessary to avoid blind release and achieve sustainable conservation [11]. The CGS restocking programs are large-scale, involving a high number of individuals and covering a wide geographical range. However, due to the lack of effective tracking and monitoring after release, evaluations of restocking effectiveness are limited [38]. This study carried out October sampling across two years as part of an eDNA monitoring program covering the Gutian Mountain and Banshanyuan reintroduction sites, revealing obvious interannual variation in CGS detection rates. The decline in detection rates at both sites from 2023 to 2024 may be related to changes in post-reintroduction survival of CGS, though environmental influences on eDNA persistence and detection probability cannot be ruled out. Even though more than 1000 individuals were released at Gutian Mountain, deficiencies in water quality, food webs, and microhabitats may still inhibit their adaptability, leading to a decline in population numbers [39]. However, due to fluctuations in environmental temperature and humidity, hydrological conditions, and the short monitoring period, it is difficult to determine whether the fluctuations in eDNA detection rates were random coincidences or truly reflective of CGS population dynamics.
eDNA was used to monitor CGS at the Gutian Mountain and Banshanyuan release sites, which demonstrated a decline in positive eDNA detection rates, a trend that may suggest reduced detection probability. However, the study still had limitations. A key limitation is the lack of qPCR-based limit of detection data, as only qualitative PCR was performed for eDNA screening. We found that eDNA detection and conventional monitoring methods yielded different results at different sites. When using traditional methods, capture rates are higher when monitoring large-scale releases, indicating that a single method is insufficient to assess the distribution and survival rates of released CGS comprehensively and accurately [40]. Therefore, a multi-technology system is required for future CGS release monitoring. It is recommended to fully adopt electronic chip technology to address individual tracking challenges and avoid misjudgments of population density. Visual observations, mark-recapture, and eDNA should be integrated to leverage the strengths of different methods. Through long-term, multi-cycle monitoring, a precise understanding of the distribution and survival rates, and the trend shifts therein, of released CGS populations can be achieved, providing scientific support for the conservation and management of the CGS [3,41].

4.3. Impact of Physicochemical Parameters on CGS eDNA Detectability

PCA loadings and spatial grouping patterns suggest that water physicochemical parameters are linked to the distribution of CGS eDNA. The CGS exhibits a habitat preference for mountain streams in river basins such as the Yangtze and Pearl Rivers, requiring steep and densely vegetated valleys, with caves and rock crevices between rocky riverbanks forming hiding areas [42]. Based on previous research, suitable habitat conditions for Chinese giant salamanders include low turbidity, neutral to slightly acidic pH (6–7), adequate dissolved oxygen levels, and low pollutant concentrations [3,4,43], particularly in dynamic water bodies with slow to moderate currents [43]. The CGS is highly sensitive to changes in NH3-N, TN, and TP concentrations. Such areas are typically less disturbed by human activities and have strong self-purification capabilities [12]. In this study, eDNA detection at the Jinzi Peak sampling site (eDNA = 67%, NH3-N = 0.24 mg/L, TP = 0.052 mg/L) in Qingyuan County was significantly higher than that at the Xikou Village (eDNA = 0%, NH3-N = 1.58 mg/L, TP = 0.113 mg/L) in Taishun County, indicating that high nutrient levels may be negatively correlated with CGS eDNA detectability. The optimal pH range for the CGS is 6.5–7.5, conducive to maintaining skin respiration and osmotic pressure regulation [43]. When pH is lower than 6.0 or higher than 8.0, enzyme activity and immune function are suppressed, leading to reduced feeding or migration [44]. All sampling sites with positive CGS eDNA detections in this study exhibited water pH values falling within this range. Excessively high COD can inhibit metabolism through oxygen consumption or the release of toxic substances, while excessive F can lead to a decrease in spawning rates [45]. The eDNA detection rate in Nanxi River, Yongjia County (eDNA = 33%, COD = 7.5 mg/L, F = 0.188 mg/L) was significantly higher than that in Shiyang Town, Taishun County (eDNA = 0, COD = 14.6 mg/L, F = 0.269 mg/L), suggesting a correlative relationship between COD, F levels and the detectability of CGS eDNA. This study showed that there were significant differences in water physicochemical parameters between eDNA-positive and -negative sites (p < 0.05). PCA results indicated that the eDNA-positive group was concentrated in the low-value region of PC1 (low load of NH3-N, TN, TP and COD), while the eDNA-negative group was distributed in the high-value region of PC1 and varying intervals of PC2, further pointing to a correlative association between water physicochemical conditions and CGS eDNA detectability.
In the present study, we found that water physicochemical parameters may affect CGS distribution based on eDNA detection rates. Previous studies have demonstrated that such parameters can influence eDNA degradation rates. Although TN, TP, and pH showed no significant effects on eDNA decay rates in this study, the potential impacts of these factors on eDNA degradation cannot be ruled out [46]. One methodological limitation arises from mixed-source water quality data: F, NO3, and pH values were retrieved from external monitoring stations rather than synchronous field sampling, introducing potential spatiotemporal heterogeneity despite strict screening within 5 km and ±7 days. PCA variance decomposition indicates that inter-group separation is driven by field-measured nutrients on PC1, so this bias is unlikely to substantially alter core grouping trends. Additionally, the MANOVA result (Pillai’s Trace = 0.828) should be interpreted cautiously, as the ratio of 18 sampling sites to 7 water quality variables is modest, supporting but not definitively proving group separation. Therefore, further research will be conducted to verify whether the observed differences in eDNA detection are a result of variations in the measured water quality parameters, and to employ fully synchronized field measurements for all parameters.

5. Conclusions

In this study, the non-invasive and broad coverage of eDNA compensated for the limitations of traditional methods in monitoring habitats such as caves and deep pools. Positive eDNA detections at sites surrounding CGS farms further demonstrate that eDNA is a useful tool in assessing the ecological benefits of stocking and release programs. Furthermore, there is evidence that water physicochemical parameters significantly impact CGS eDNA detection rates and distribution. These findings provide robust support for advancing targeted conservation efforts and developing science-based conservation strategies for the species. As an early application of eDNA analysis in CGS population monitoring, future efforts should refine sampling protocols and integrate multiple monitoring approaches to enhance data reliability. Combining eDNA analysis with traditional sampling methods can provide scientific references for monitoring population dynamics and informing decision-making processes for habitat conservation, offering innovative technical tools for endangered species protection.

Supplementary Materials

The following supporting information can be downloaded at: https://www.mdpi.com/article/10.3390/d18080461/s1, Figure S1: Original PCR Electrophoresis Gel Images; Table S1: Geographic coordinates, number of water samples collected, and eDNA positive detection rates at each sampling site; Table S2: Results of principal component analysis (PCA).

Author Contributions

Conceptualization, L.Z.; methodology, X.X.; software, X.X. and Z.Z.; formal analysis, T.D. and Z.Z.; investigation, T.D., W.X., Y.Z. and X.X.; data curation, G.W., X.X. and Z.Z.; writing—original draft preparation, X.X.; writing—review and editing, G.W. and R.Z.; supervision, R.Z.; project administration, R.Z.; funding acquisition, R.Z. All authors have read and agreed to the published version of the manuscript.

Funding

This research was funded by the Key R&D Program Projects in Zhejiang Province (2021C02044), the National Natural Science Foundation of China (Grant No. 32370454), and Wuyi County Wild Animal Resources Baseline Survey Project (JHTK-ZB2024111).

Data Availability Statement

The data presented in this study are available in the Supplementary Materials of this article.

Conflicts of Interest

The authors declare no conflicts of interest.

References

  1. Xu, J.C.; Peng, L.F.; Chen, Y.R.; Yang, D.C.; Wu, Q.N.; Weng, S.Y.; Zhang, Y.; Huang, S. Four Complete Mitochondrial Genomes of Living Wild-Type Chinese Giant Salamander Andrias davidianus (Amphibia: Cryptobranchidae). Mitochondrial DNA Part B Resour. 2018, 3, 1200–1202. [Google Scholar] [CrossRef] [Scilit] [PubMed]
  2. Geng, X.; Li, W.; Shang, H.; Gou, Q.; Zhang, F.; Zang, X.; Zeng, B.; Li, J.; Wang, Y.; Ma, J.; et al. A Reference Gene Set Construction Using RNA-seq of Multiple Tissues of Chinese Giant Salamander Andrias davidianus. GigaScience 2017, 6, 1–7. [Google Scholar] [CrossRef] [Scilit] [PubMed]
  3. Jiang, W.; Tian, H.; Zhang, L. Husbandry, Captive Breeding, and Field Survey of Chinese Giant Salamander (Andrias davidianus). Methods Mol. Biol. 2023, 2562, 75–92. [Google Scholar] [CrossRef] [Scilit] [PubMed]
  4. Zhu, W.; Zhao, T.; Zhao, C.L.; Li, C.; Xie, F.; Liu, J.Y.; Jiang, J.P. How will warming affect the growth and body size of the largest extant amphibian? More than the temperature–size rule. Sci. Total Environ. 2023, 859, 160105. [Google Scholar] [CrossRef] [Scilit] [PubMed]
  5. Nishikawa, K.; Matsui, M.; Yoshikawa, N.; Tominaga, A.; Eto, K.; Fukuyama, I.; Fukutani, K.; Matsubara, K.; Hattori, Y.; Iwato, S.; et al. Discovery of Ex Situ Individuals of Andrias sligoi, an Extremely Endangered Species and One of the Largest Amphibians Worldwide. Sci. Rep. 2024, 14, 2575. [Google Scholar] [CrossRef] [Scilit] [PubMed]
  6. Xu, J.C.; Yang, D.C.; Chen, Y.R.; Wu, Q.N.; Huang, S. Complete Mitochondrial Genome of a Living Wild-Type Chinese Giant Salamander Andrias davidianus (Amphibia: Cryptobranchidae) in Huangshan. Mitochondrial DNA Part B Resour. 2016, 1, 542–543. [Google Scholar] [CrossRef] [Scilit] [PubMed]
  7. IUCN Red List of Threatened Species, Version 2024-1; IUCN: Gland, Switzerland, 2024. Available online: https://www.iucnredlist.org (accessed on 15 March 2025).
  8. National Forestry and Grassland Administration; Ministry of Agriculture and Rural Affairs. Available online: http://yyj.moa.gov.cn/gzdt/202102/t20210205_6361296.htm (accessed on 15 March 2025).
  9. Shu, G.C.; Liu, P.; Zhao, T. Disordered Translocation is Hastening Local Extinction of the Chinese Giant Salamander. Asian Herpetol. Res. 2021, 12, 271–279. [Google Scholar] [CrossRef]
  10. Duarte, A.; Pearl, C.A.; Adams, M.J.; Peterson, J.T. A New Parameterization for Integrated Population Models to Document Amphibian Reintroductions. Ecol. Appl. 2017, 27, 1761–1775. [Google Scholar] [CrossRef] [Scilit] [PubMed]
  11. Lu, C.; Chai, J.; Murphy, R.W.; Che, J. The Chinese Giant Salamanders: Farmed yet Endangered. Science 2020, 367, 989. [Google Scholar] [CrossRef] [Scilit] [PubMed]
  12. Luo, Q.H.; Tong, F.; Song, Y.J.; Wang, H.; Du, M.L.; Ji, H.B. Observation of the Breeding Behavior of the Chinese Giant Salamander (Andrias davidianus) Using a Digital Monitoring System. Animals 2018, 8, 161. [Google Scholar] [CrossRef] [Scilit] [PubMed]
  13. Svenningsen, A.K.N.; Pertoldi, C.; Bruhn, D. eDNA Metabarcoding Benchmarked towards Conventional Survey Methods in Amphibian Monitoring. Animals 2022, 12, 763. [Google Scholar] [CrossRef] [Scilit] [PubMed]
  14. Ling, L.; Liang, L.; Wang, H.; Lin, X.; Li, C. Real-Time Monitoring on the Chinese Giant Salamander Using RPA-LFD. Int. J. Mol. Sci. 2024, 25, 4946. [Google Scholar] [CrossRef] [Scilit] [PubMed]
  15. Sun, X.; Guo, N.; Gao, J.; Xiao, N. Using eDNA to Survey Amphibians: Methods, Applications, and Challenges. Biotechnol. Bioeng. 2024, 121, 456–471. [Google Scholar] [CrossRef] [Scilit] [PubMed]
  16. Hajibabaei, M. Demystifying eDNA Validation. Trends Ecol. Evol. 2022, 37, 826–828. [Google Scholar] [CrossRef] [Scilit] [PubMed]
  17. Thomsen, P.F.; Jensen, M.R.; Sigsgaard, E.E. A Vision for Global eDNA-Based Monitoring in a Changing World. Cell 2024, 187, 4444–4448. [Google Scholar] [CrossRef] [Scilit] [PubMed]
  18. Voyles, J.; Richards-Zawacki, C.L.; Byrne, A.Q.; Estrada, A.; Ibáñez, R.; Rodriguez, K.M.; Goldberg, C.S. Using Environmental DNA Sampling for Simultaneous Detection of Hosts and Their Pathogens: A Case Study with the Critically Endangered Frog Genus Atelopus. Anim. Conserv. 2025, 28, 663–674. [Google Scholar] [CrossRef] [Scilit]
  19. Kurtz, P.; Santo Domingo, J.; Pyron, R.A.; Wendell, D. Nested PCR Amplification of the Mitochondrial Hypervariable Region for Non-Invasive eDNA Detection of Cryptobranchus alleganiensis. PLoS ONE 2025, 20, e0328633. [Google Scholar] [CrossRef] [Scilit] [PubMed]
  20. Wang, J.; Liu, P.; Chang, J.; Li, C.; Xie, F.; Jiang, J. Development of an eDNA Metabarcoding Tool for Surveying the World’s Largest Amphibian. Curr. Zool. 2022, 68, 608–614. [Google Scholar] [CrossRef] [Scilit] [PubMed]
  21. Yamanaka, H.; Motozawa, H.; Tsuji, S.; Miyazawa, R.C.; Takahara, T.; Minamoto, T. On-Site Filtration of Water Samples for Environmental DNA Analysis to Avoid DNA Degradation During Transportation. Ecol. Res. 2016, 31, 963–967. [Google Scholar] [CrossRef] [Scilit]
  22. Huang, S.; Yoshitake, K.; Watabe, S.; Asakawa, S. Environmental DNA Study on Aquatic Ecosystem Monitoring and Management: Recent Advances and Prospects. J. Environ. Manag. 2022, 323, 116310. [Google Scholar] [CrossRef] [Scilit] [PubMed]
  23. Wesselmann, M.; Geraldi, N.R.; Marbà, N.; Hendriks, I.E.; Díaz-Rúa, R.; Duarte, C.M. eDNA Reveals the Associated Metazoan Diversity of Mediterranean Seagrass Sediments. Diversity 2022, 14, 549. [Google Scholar] [CrossRef] [Scilit]
  24. The State Environmental Protection Administration. Water and Wastewater Monitoring and Analysis Methods, 4th ed.; China Environmental Science Press: Beijing, China, 2002. [Google Scholar]
  25. Deng, X.; Qi, M.; Ren, R.; Chen, J. Towards the Comprehensive Water Quality Control in Lake Taihu: Correlating Chlorophyll a and Water Quality Parameters with Generalized Additive Model. Water Res. 2019, 165, 115043. [Google Scholar] [CrossRef] [Scilit] [PubMed]
  26. Wikston, M.; Breton, B.-A.; Vilaça, S.T.; Bennett, A.M.; Kyle, C.J.; Beresford, D.V.; Lesbarrères, D.; Wilson, C.C.; Green, D.M.; Fortin, M.-J.; et al. Comparative Efficacy of eDNA and Conventional Methods for Monitoring Wetland Anuran Communities. Front. Ecol. Evol. 2023, 11, 1179158. [Google Scholar] [CrossRef] [Scilit]
  27. Marcec, R.; Kouba, A.; Zhang, L.; Zhang, H.; Wang, Q.; Zhao, H.; Jiang, W.; Willard, S. Surgical Implantation of Coelomic Radiotransmitters and Postoperative Survival of Chinese Giant Salamanders (Andrias davidianus) Following Reintroduction. J. Zoo Wildl. Med. 2016, 47, 187–195. [Google Scholar] [CrossRef] [Scilit] [PubMed]
  28. Ruppert, K.M.; Davis, D.R.; Rahman, M.S.; Kline, R.J. Development and Assessment of an Environmental DNA (eDNA) Assay for a Cryptic Siren (Amphibia: Sirenidae). Environ. Adv. 2022, 7, 100163. [Google Scholar] [CrossRef] [Scilit]
  29. Zhang, S.; Lu, Q.; Wang, Y.; Wang, X.; Zhao, J.; Yao, M. Assessment of Fish Communities Using Environmental DNA: Effect of Spatial Sampling Design in Lentic Systems of Different Sizes. Mol. Ecol. Resour. 2020, 20, 242–255. [Google Scholar] [CrossRef] [Scilit] [PubMed]
  30. Czeglédi, I.; Sály, P.; Specziár, A.; Preiszner, B.; Szalóky, Z.; Maroda, Á.; Pont, D.; Meulenbroek, P.; Valentini, A.; Erős, T. Congruency between Two Traditional and eDNA-Based Sampling Methods in Characterising Taxonomic and Trait-Based Structure of Fish Communities and Community-Environment Relationships in Lentic Environment. Ecol. Indic. 2021, 129, 107952. [Google Scholar] [CrossRef] [Scilit]
  31. Fediajevaite, J.; Priestley, V.; Arnold, R.; Savolainen, V. Meta-Analysis Shows That Environmental DNA Outperforms Traditional Surveys, but Warrants Better Reporting Standards. Ecol. Evol. 2021, 11, 4803–4815. [Google Scholar] [CrossRef] [Scilit] [PubMed]
  32. Spear, S.F.; Groves, J.D.; Williams, L.A.; Waits, L.P. Using Environmental DNA Methods to Improve Detectability in a Hellbender (Cryptobranchus alleganiensis) Monitoring Program. Biol. Conserv. 2015, 183, 38–45. [Google Scholar] [CrossRef] [Scilit]
  33. Takahashi, M.K.; Meyer, M.J.; McPhee, C.; Gaston, J.R.; Venesky, M.D.; Case, B.F. Seasonal and Diel Signature of Eastern Hellbender Environmental DNA. J. Wildl. Manag. 2018, 82, 217–225. [Google Scholar] [CrossRef] [Scilit]
  34. Ekram, M.A.; Wuchter, C.; Bijaksana, S.; Grice, K.; Russell, J.; Stevenson, J.; Vogel, H.; Coolen, M.J.L. A Quaternary Sedimentary Ancient DNA (sedaDNA) Record of Fungal-Terrestrial Ecosystem Dynamics in a Tropical Biodiversity Hotspot (Lake Towuti, Sulawesi, Indonesia). Microorganisms 2025, 13, 1005. [Google Scholar] [CrossRef] [Scilit] [PubMed]
  35. Li, J.; Zhang, X.; Fan, W.Y.; Yao, M.C.; Sheng, G.P. Dissolved Organic Matter Dominating the Photodegradation of Free DNA Bases in Aquatic Environments. Water Res. 2020, 179, 115885. [Google Scholar] [CrossRef] [Scilit] [PubMed]
  36. Liu, M.Q.; Zhang, Z.; Wang, S.; Feng, K.; Gu, S.S.; Li, C.G.; Deng, Y. eDNA Technology for Monitoring Terrestrial Biodiversity: Technical Highlights, Challenges and Progress. Yingyong Shengtai Xuebao 2025, 36, 927–942. (In English) [Google Scholar] [CrossRef] [Scilit] [PubMed]
  37. Fonseca, V.G.; Davison, P.I.; Creach, V.; Stone, D.; Bass, D.; Tidbury, H.J. The Application of eDNA for Monitoring Aquatic Non-Indigenous Species: Practical and Policy Considerations. Diversity 2023, 15, 631. [Google Scholar] [CrossRef] [Scilit]
  38. Hammond, T.T.; Curtis, M.J.; Jacobs, L.E.; Tobler, M.W.; Swaisgood, R.R.; Shier, D.M. Behavior and Detection Method Influence Detection Probability of a Translocated, Endangered Amphibian. Anim. Conserv. 2021, 24, 401–411. [Google Scholar] [CrossRef] [Scilit]
  39. Zhao, C.; Feng, J.; Sun, Z.; Zhu, W.; Chang, J.; Fan, W.; Jiang, J.; Yue, B.; Zhao, T. Intraspecific Variation in Microhabitat Selection in Reintroduced Chinese Giant Salamanders. Curr. Zool. 2023, 69, 121–127. [Google Scholar] [CrossRef] [Scilit] [PubMed]
  40. Liu, P.; Zhao, C.L.; Xiong, S.; Wang, J.; Zhao, T.; Li, C.; Xie, F. Population Monitoring and Effect Evaluation of the Stock Enhancement of Chinese Giant Salamander in the Gutian Mountain National Nature Reserve. Chin. J. Appl. Ecol. 2021, 27, 823–830. (In Chinese) [Google Scholar]
  41. Altobelli, J.T.; Dickinson, K.J.M.; Godfrey, S.S.; Bishop, P.J. Methods in Amphibian Biotelemetry: Two Decades in Review. Ecol. Evol. 2022, 12, e8925. [Google Scholar] [CrossRef] [Scilit]
  42. Chen, S.; Cunningham, A.A.; Wei, G.; Yang, J.; Liang, Z.Q.; Wang, J.; Wu, M.Y.; Yan, F.; Xiao, H.B.; Harrison, X.A.; et al. Determining Threatened Species Distributions in the Face of Limited Data: Spatial Conservation Prioritization for the Chinese Giant Salamander (Andrias davidianus). Ecol. Evol. 2018, 8, 2098–2108. [Google Scholar] [CrossRef] [Scilit] [PubMed]
  43. Tapley, B.; Turvey, S.T.; Chen, S.; Wei, G.; Xie, F.; Yang, J.; Liang, Z.; Tian, H.; Wu, M.; Okada, S. Range-Wide Decline of Chinese Giant Salamanders Andrias spp. from Suitable Habitat. Oryx 2021, 55, 373–381. [Google Scholar] [CrossRef] [Scilit]
  44. Luo, S.; Wang, P.; Zhang, Y.; Wang, Z.; Tian, H.; Luo, Q. Ethogram of the Chinese Giant Salamander during the Breeding Period Based on the PAE Coding System. Animals 2023, 13, 3632. [Google Scholar] [CrossRef] [Scilit] [PubMed]
  45. Calderon, M.R.; Almeida, C.A.; González, P.; Jofré, M.B. Influence of Water Quality and Habitat Conditions on Amphibian Community Metrics in Rivers Affected by Urban Activity. Urban Ecosyst. 2019, 22, 743–755. [Google Scholar] [CrossRef] [Scilit]
  46. McKnight, E.G.; Shafer, A.B.; Frost, P.C. Quantifying the Effect of Water Quality on eDNA Degradation Using Microcosm and Bioassay Experiments. Environ. DNA 2024, 6, e530. [Google Scholar] [CrossRef] [Scilit]
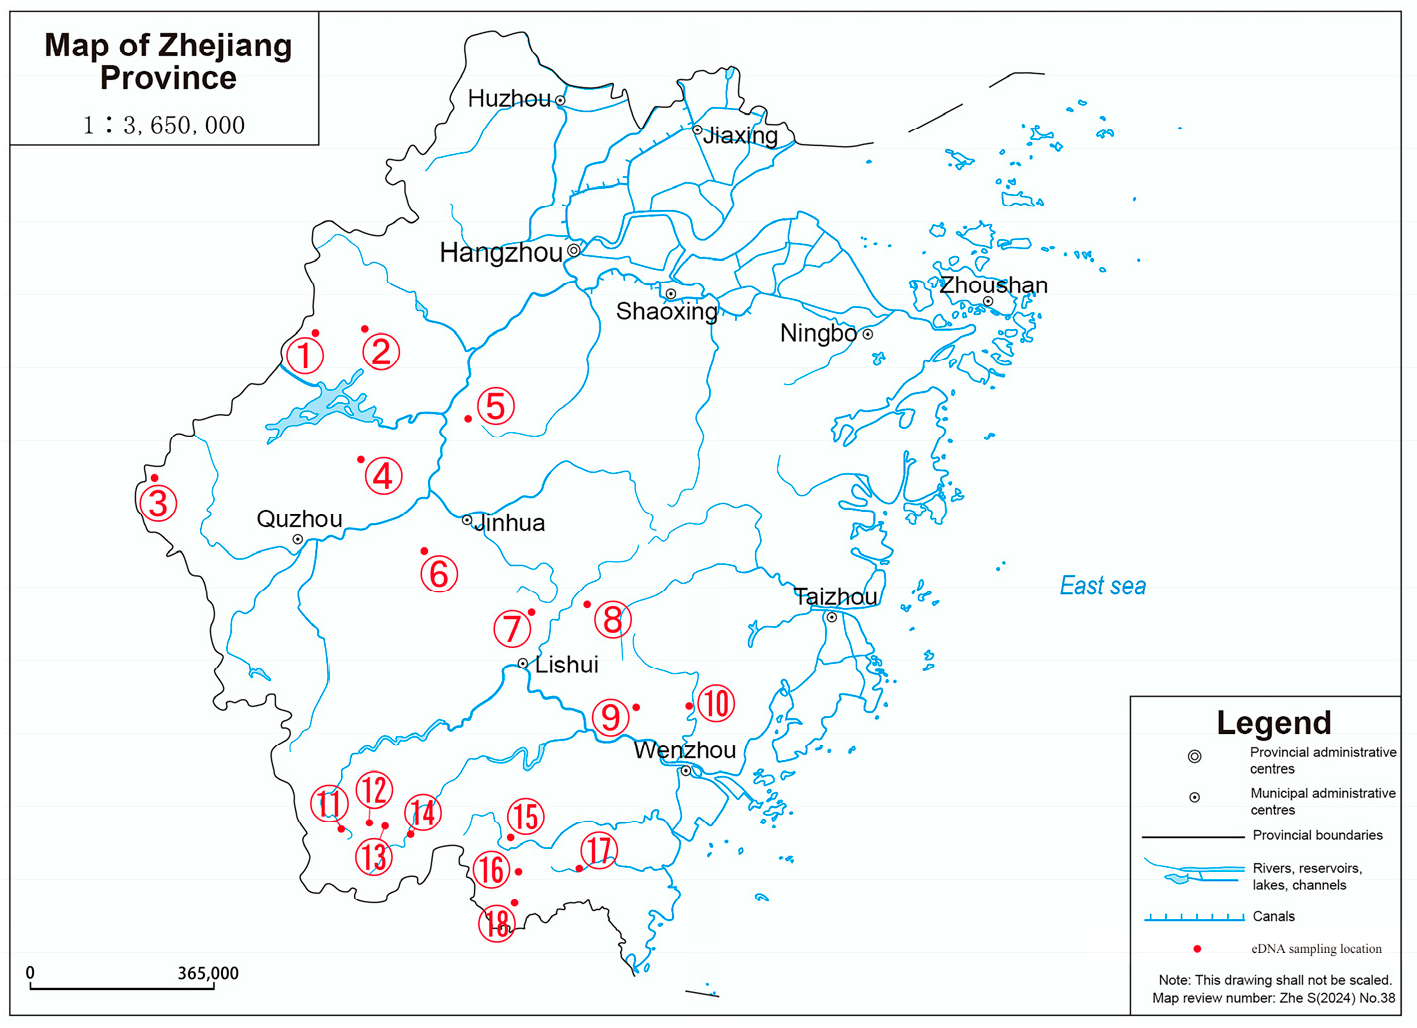
Figure 1. eDNA sampling localities in Zhejiang Province, China. Note: Sampling watersheds corresponding to numbers on the map are as follows: 1. Wangfu Village, Chun’an County; 2. Linqi Village, Chun’an County; 3. Gutian Mountain, Kaihua County; 4. Gaoqiao Village, Jiande City; 5. Sandu Town, Jiande City; 6. Xinfan, Wucheng District; 7. Yaxi Town, Liandu District; 8. Dongdu Town, Jinyun County; 9. Qiaotou Town, Yongjia County; 10. Nanxi River, Yongjia County; 11. Jinzi Peak, Qingyuan County; 12. Huyuan, Qingyuan County; 13. Banshanyuan, Qingyuan County; 14. Zuoxi, Qingyuan County; 15. Baizhang Town, Taishun County; 16. Daqiuping Village, Taishun County; 17. Xikou Village, Taishun County; 18. Shiyang Town, Taishun County.
Diversity 18 00461 g001
Figure 2. Prevalence of positive samples in each region based on eDNA technology.
Diversity 18 00461 g002
Figure 3. eDNA monitoring results. Note: (A) Qingyuan eDNA monitoring results: I represents the Jinzi Peak sampling point; II represents the Banshanyuan sampling point; III represents the Zuoxi sampling point; IV represents the Huyuan sampling point. (B) eDNA monitoring results for Gutianshan and Xinfan: I represents the Gutianshan sampling point; II represents the Xinfan sampling point. (C) eDNA monitoring results for Liandu, Chun’an, and Yongjia: I represents the Liandu sampling point; II represents the Chun’an sampling point; III represents the Yongjia sampling point.
Diversity 18 00461 g003
Figure 4. eDNA detection rates and release monitoring sites. Note: (A) Gutian Mountain eDNA detection rate; (B) Banshanyuan eDNA detection rate; (C) Gutian Mountain; (D) Banshanyuan.
Diversity 18 00461 g004
Figure 5. Principal Component Analysis (PCA) results of the water physicochemical parameters at the CGS eDNA sampling sites (n = 18). Note: Red dots represent eDNA-positive water samples, and blue dots represent eDNA-negative water samples. PCA ordination with 95% confidence ellipses for visual reference. Positive sites cluster in the low PC1 region (low NH3-N, TN, TP, COD, F), while negative sites are widely distributed across high PC1 values and all PC2 ranges.
Diversity 18 00461 g005
Table 1. Water Quality-Related Factors at Different Sampling Sites.
LocationNH3-N
(mg/L)
TN
(mg/L)
COD
(mg/L)
TP
(mg/L)
F
(mg/L)
NO3
(mg/L)
pH
Jinzi Peak0.241.446.40.0520.2798.367
Gutian Mountain0.111.427.40.0410.1296.867.1
Banshanyuan0.131.686.70.0440.2056.067
Huyuan0.261.658.50.0320.1686.147
Wangfu Village0.211.477.70.0390.1797.147
Nanxi River0.330.897.50.0510.1887.157.2
Xinfan0.361.577.60.0560.2046.777.3
Yaxi Town0.221.256.80.0380.1756.337.1
Qiaotou Town0.460.786.80.0470.1767.527.2
Zuoxi0.832.0817.80.0780.2827.867.2
Dongdu Town1.082.3318.40.0850.3216.357.2
Gaoqiao Village0.962.0914.60.0770.2538.587.2
Sandu Town1.232.3615.80.0950.2578.547.1
Linqi Village0.781.6510.20.0870.2458.427.3
Shiyang Town1.252.0514.60.0890.2698.557.3
Daqiuping Village1.432.3915.80.1050.2788.477.1
Baizhang Town0.861.7513.70.0970.2898.247
Xikou Village1.582.5417.90.1130.3027.327.5
Disclaimer/Publisher’s Note: The statements, opinions and data contained in all publications are solely those of the individual author(s) and contributor(s) and not of MDPI and/or the editor(s). MDPI and/or the editor(s) disclaim responsibility for any injury to people or property resulting from any ideas, methods, instructions or products referred to in the content.