Article

Characteristics of Zooplankton Distribution and Correlation with Stress Factors in Lake Dianchi Estuaries

1
College of Agronomy and Life Sciences, Kunming University, Kunming 650214, China
2
Kunming Academy of Eco-Environmental Sciences, Kunming 650032, China
3
School of Ecology and Environmental Sciences, Yunnan University, Kunming 650500, China
4
Yunnan Key Laboratory for Plateau Mountain Ecology and Restoration of Degraded Environments, Yunnan University, Kunming 650500, China
*
Authors to whom correspondence should be addressed.
Diversity 2026, 18(8), 448; https://doi.org/10.3390/d18080448
Submission received: 25 March 2026 / Revised: 10 July 2026 / Accepted: 24 July 2026 / Published: 27 July 2026
(This article belongs to the Section Freshwater Biodiversity)

Abstract

This study investigated zooplankton distribution in Lake Dianchi, focusing on river mouths and their ecological conditions, using environmental DNA (eDNA) technology. It analyzed zooplankton diversity during the dry and wet seasons, employing alpha diversity indices to assess community differences. A total of 24 species from 22 genera and 17 families across two phyla were identified, among Arthropoda (54%) and Rotifera (46%). Cyclopidae made up 29% of Arthropoda. β-diversity analysis showed a 37% difference between seasons and significant differences between estuaries: 61.4% in the dry season and 42.1% in the wet season. Redundancy analysis identified total nitrogen (TN) as the main factor correlated with zooplankton diversity, with the highest TN levels in suburban estuaries. The findings provide insights for ecological restoration efforts in Lake Dianchi estuaries.

1. Introduction

Lake estuaries, where inflowing rivers meet standing waters, function as critical transitional zones characterized by intensive material exchange and dynamic hydrological conditions [1,2,3,4,5]. In eutrophic lakes, estuaries often serve as the primary location for external nutrient loading, receiving substantial inputs of nitrogen, phosphorus, and other pollutants from upstream watersheds [6,7]. Lake Dianchi is a large eutrophic plateau lake in Yunnan Province, southwestern China. Approximately 35 rivers of varying sizes converge into Lake Dianchi, and while these rivers supply a large amount of water to the lake, they also carry significant pollutants into the lake body [8,9,10]. Consequently, water quality in Lake Dianchi’s estuarine zones has deteriorated markedly since the 1980s, leading to frequent cyanobacteria blooms and driving the lake to Grade V under China’s surface water quality standards (GB 3838-2002). Although restoration efforts between 2018 and 2020 improved the lake’s average eutrophic status to Grade IV, enduring obstacles such as water scarcity and substantial non-point source pollution remain severe [11]. Understanding how biological communities respond to these differential stress regimes is essential for prioritizing estuarine restoration strategies.
Zooplankton occupy a central position in lake food webs, mediating energy transfer from primary producers to higher trophic levels and serving as sensitive indicators of eutrophication [12,13]. Their community composition, biomass, and secondary productivity respond rapidly to changes in nutrient concentrations, hydrological conditions, and predation pressure [14]. In eutrophic lake estuaries, zooplankton distributions are frequently structured by environmental gradients, yet the relative importance of specific stressors, such as nitrogen, phosphorus, or organic matter, varies considerably across systems [15]. Previous studies on Dianchi estuarine plankton have relied predominantly on traditional morphological identification, an approach that, while well-established, is time-consuming and constrained by limited taxonomic resolution, particularly for small-bodied and cryptic species [16]. Environmental DNA (eDNA) metabarcoding has emerged as a powerful alternative for biodiversity assessment, enabling high-throughput, non-invasive detection of aquatic communities [17,18,19]. However, the efficacy of eDNA metabarcoding for capturing seasonal and spatial heterogeneity of zooplankton across contrasting estuary types in eutrophic lakes remains insufficiently tested. Furthermore, whether zooplankton communities in urban, suburban, and agricultural estuaries of Dianchi exhibit divergent responses to environmental stressors has not been systematically examined. Given that total nitrogen (TN) concentrations in Dianchi are among the highest reported for Chinese plateau lakes, and that nitrogen loading has been identified as a key driver of ecological degradation in its inflowing rivers [20], we hypothesized that (1) zooplankton community composition would differ significantly between dry and rainy seasons, and (2) TN would be the primary environmental stressor shaping zooplankton distribution across the three estuary types.
To test these hypotheses, we utilized eDNA metabarcoding targeting the mitochondrial COI gene to analyze zooplankton communities across Lake Dianchi. Sampling was conducted during the dry (March) and rainy (July) seasons of 2022, spanning nine representative estuaries (categorized as urban, suburban, and agricultural) and one lake-center site. Redundancy analysis (RDA) was subsequently performed to evaluate the associations between zooplankton community structure and ten physicochemical water quality parameters. By integrating eDNA-based biomonitoring with multivariate statistical approaches, this study aimed to provide a robust methodological framework and empirical evidence to inform stressor-specific management and ecological restoration in eutrophic lake estuaries.
Environmental DNA metabarcoding was selected for this study due to its non-invasive, high-sensitivity, and logistically scalable properties. Nevertheless, this approach carries inherent limitations. We acknowledge the potential for false positives and negatives, DNA transport, and semi-quantitative bias; accordingly, results are interpreted as relative detection probabilities rather than absolute abundances. In terms of taxonomic resolution, species-level identification is achievable for well-referenced taxa, but many operational taxonomic units (OTUs) from under-sequenced groups could only be classified to genus or family level. Given these constraints, it is recommended to integrate eDNA technology with conventional surveys and complementary investigation approaches in future research on zooplankton diversity in the Dianchi Basin.

2. Materials and Methods

2.1. Determination of Sampling Sites

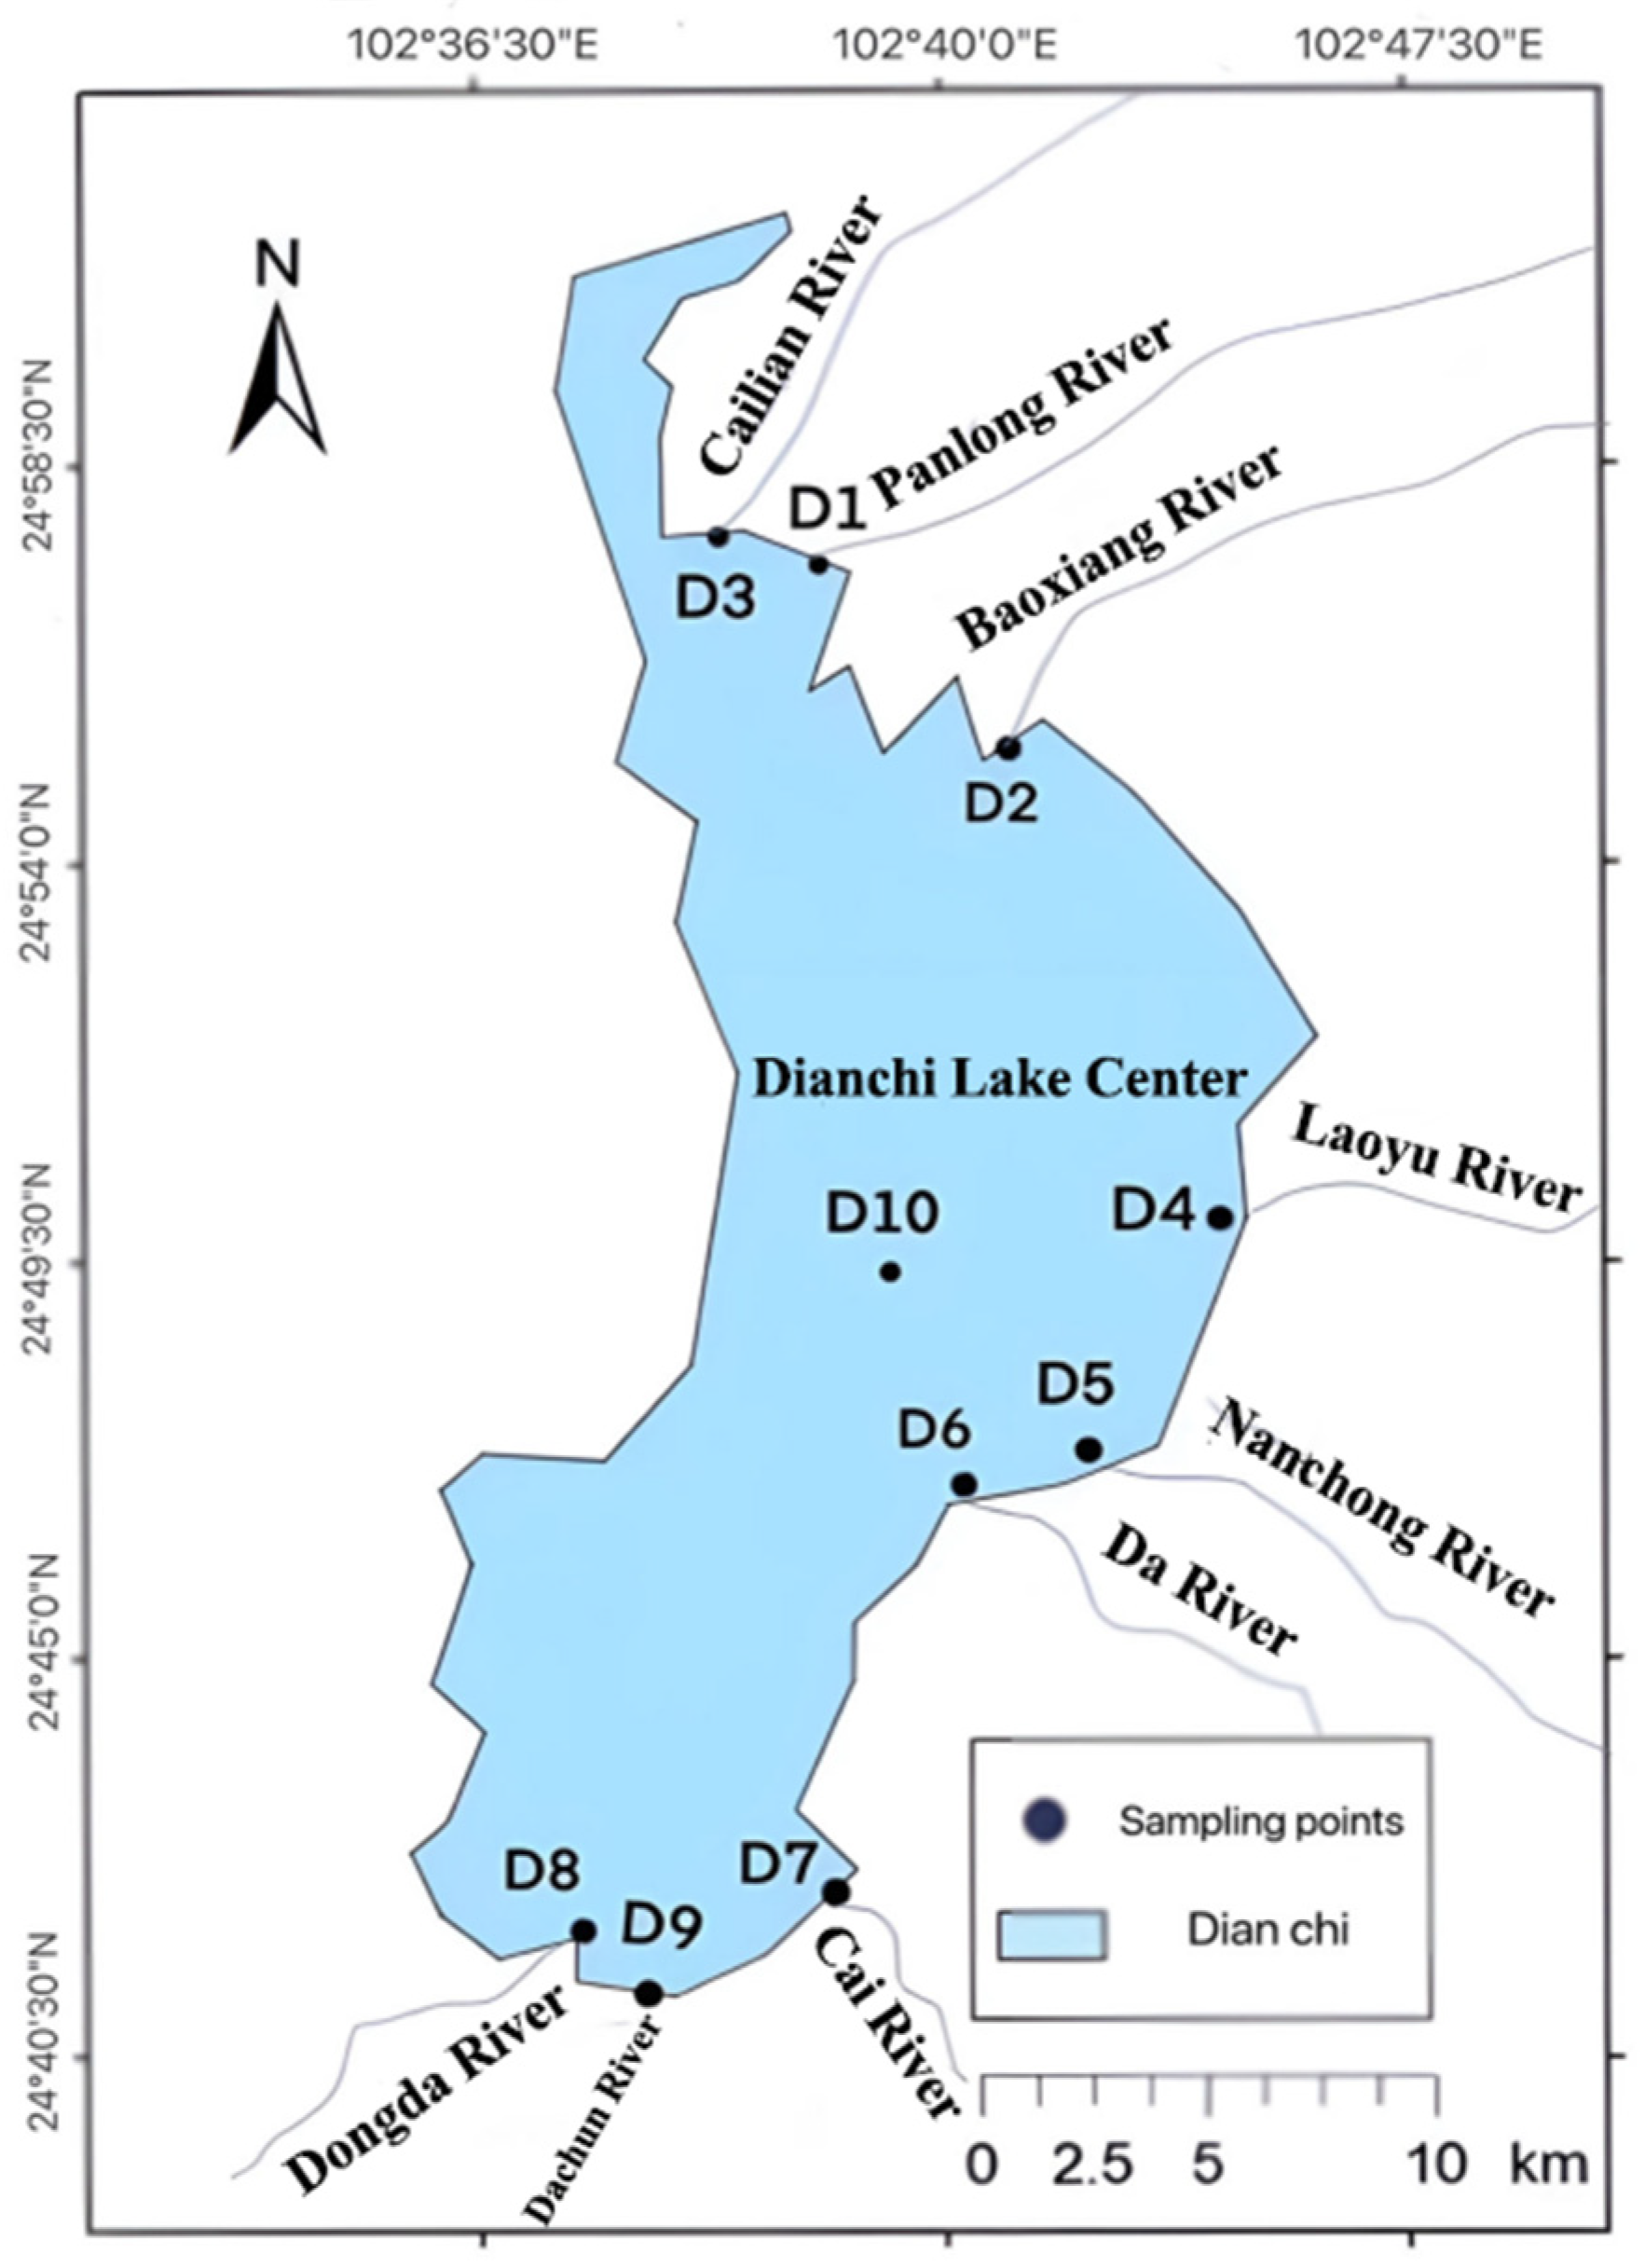
In this experiment, the selection of sampling sites was based on an analysis of the flow areas and pollution conditions of the rivers flowing into Lake Dianchi. Therefore, it was decided to focus on nine estuaries in the Lake Dianchi watershed, Panlong River (D1), Baoxiang River (D2), Cailian River (D3), Laoyu River (D4), Nanchong River (D5), Dahe River (D6), Chaihe River (D7), Dongda River (D8), and Dachun River (D9), as well as the central region of Lake Dianchi (D10) as shown in Table 1, for the analysis of planktonic diversity, as depicted in Figure 1. Previous studies have highlighted the significant impact of differences between the wet season and dry season on the aquatic species within the watershed. According to available data and local field surveys, the wet season in the Dianchi Lake basin lasts from May to October each year, and the dry season from November to April of the following year. Therefore, sampling was conducted on 28 March 2022 (dry season) and 5 July 2022 (wet season) at each of the ten designated sites. At each site, 10 L water samples were collected for eDNA analysis and water quality assessment, aiming to evaluate the spatiotemporal diversity of planktonic organisms at the estuaries of Lake Dianchi.

2.2. Collection and Storage Methods

At each sampling site, 10 L water samples were collected using a water sampler and temporarily stored in sterilized wide-mouth bottles. During our investigation, 5 L water samples were designated for environmental DNA analysis, while the remaining 5 L water samples were used for water quality assessment. Subsequently, the obtained water eDNA samples were filtered through a multi-channel water environmental DNA filtration device (Nanjing Yijinuo Environmental Technology Co., Ltd., Nanjing, China), equipped with a 0.45 μm mixed cellulose filter membrane (Jinteng Company, Tianjin, China), using vacuum filtration. Approximately 5 L water samples were filtered at each sampling site. Finally, the filtered membranes were promptly placed in a −80 °C freezer for preservation [21]. Following the Chinese national standard HJ 91.2—2022 (Technical Specifications for Surface Water Environmental Quality Monitoring), the other 5 L water samples were preserved and transported on-site, then promptly delivered to the laboratory for water quality parameter testing once field sampling was finished.

2.3. Extraction of Zooplankton DNA

The extraction of zooplankton environmental DNA was carried out using the DNeasy Blood and Tissue Kit (Qiagen, Hilden, Germany) following these steps: Initially, the filtered membranes, which had undergone vacuum filtration, were placed in 5 mL cryotubes. Subsequently, 0.2 g of Glass Beads X and 450 mL of Buffer ATL were added to the cryotubes, mixed thoroughly, and then subjected to centrifugation at 1300 rpm for 45 s. The tubes were then placed in a 56 °C water bath for 30 min, with this process repeated twice. Next, 30 μL of Proteinase K was added to the cryotubes, mixed thoroughly, centrifuged at 1300 rpm for 10 s, and then placed in a 56 °C water bath for 2–3 h until the filter membranes were completely dissolved. After vortexing for 15 s, the solution was centrifuged at 4000 rpm for 1 min. The supernatant was transferred to new 2 mL centrifuge tubes, centrifuged at 13,000 rpm for 1 min, and the supernatant was transferred to fresh 2 mL centrifuge tubes. Subsequently, 400 μL of Buffer AL was added to the tubes, thoroughly mixed, and incubated at 56 °C for 10 min. Following this, 400 μL of absolute ethanol was added, centrifuged at 13,000 rpm for 1 min, the supernatant was collected, added to the adsorption column, centrifuged at 13,000 rpm for 1 min, and the filtrate was discarded. Next, 700 μL of Buffer AW1 was added to the adsorption column, centrifuged at 13,000 g for 1 min, and the filtrate was discarded. Thereafter, 700 μL of Buffer AW2 was added to the column and centrifuged at 17,000 g for 1 min. The adsorption column was then transferred to a new 1.5 mL centrifuge tube, and 100 μL of Buffer AE elution solution was added. After incubating at room temperature for 2 min, centrifugation was performed at 12,000 rpm for 2 min. Finally, the obtained total DNA from the water was preserved in a −80 °C freezer [21,22].

2.4. Screening of Zooplankton Universal Primers

In the screening of universal primers for zooplankton detection, four pairs of universal primers were selected, with their nucleotide sequences provided in Table 2. The detection of zooplankton in environmental DNA was conducted using the 2 × Taq PCR Mastermix (Vazyme, Nanjing, China) kit. The PCR amplification system, as outlined in Table 3 (with a total volume of 30 μL), involved adding 15 μL of 2 × Taq PCR Mastermix, 1 μL each of the forward and reverse primers, 2 μL of DNA template, and 11 μL of ddH2O to sterile PCR tubes. The PCR amplification conditions were set as follows: an initial denaturation at 95 °C for 3 min, followed by 32 cycles of denaturation at 95 °C for 15 s, annealing at 52–60 °C for 15 s, extension at 72 °C for 2 s, and a final extension at 72 °C for 5 min.

2.5. High-Throughput Sequencing and Library Preparation

PCR products were examined by means of 2% (w/v) agarose gel electrophoresis, and gel images were captured using a Gel Doc EZ system (735BR00194) to verify the band sizes and specificity. The PCR products were then pooled in equimolar amounts using an automated DNA liquid-handling workstation, and the pooled products were purified with the VAHTS DNA Clean Beads kit (N411-02). The purified PCR products were used for subsequent sequencing. Library construction was carried out with the VAHTS® Universal DNA Library Prep Kit for Ion Torrent V2 (ND702). Sequencing templates were prepared and enriched using the Ion OneTouch™ 2 and Ion OneTouch™ ES systems, and sequencing was performed on a Proton Semiconductor Sequencer with the Ion PI™ Chip Kit V3 [27].

2.6. Analysis of Environmental DNA Metabarcoding Sequencing Data

(1) Utilizing the software MOTHUR (v1.8.12), the following operations were conducted: conversion of FASTQ-formatted files to FASTA format, alongside the generation of corresponding quality files. Through the comprehensive computational platform QIIME (quantitative insights into microbial ecology v1.8.0), sample sequences were partitioned based on distinct barcodes, while sequences with sequencing error rates exceeding 1%, lengths less than 100 base pairs, and occurrences less than twice were eliminated. Subsequently, using USEARCH7, sequences were clustered into operational taxonomic units (OTUs) at 97% similarity and aligned with the NCBI GenBank nt database to remove chimeras. Sequences were then classified within each OTU to determine the number of sequences per sample [28].
(2) Leveraging Python language (3.7) and the PR2 database (https://github.com/pr2database/pr2database, (accessed on 20 March 2023)), OTUs underwent species annotation processes [29], encompassing primer removal, quality filtration, concatenation, and removal of chimeras. The remaining sequences were clustered using QIIME2 software (2022.2) at ≥97% similarity, generating clustered results termed as OTUs [30].
(3) The Brocc annotation algorithm was employed for taxonomic classification of the obtained OTU sequences. Annotation outcomes underwent manual curation to exclude non-zooplankton information. OTUs aligning with zooplankton class with an identity value ≥ 97% and E-value ≤ 10−5 were selected, and OTUs identified as the same species were merged. For OTUs unalignable at the species level, classification and abundance statistics were conducted at higher taxonomic levels such as order and family to obtain the corresponding OTU abundance table [31].
(4) Annotation of the zooplankton OTU abundance table was performed, visualizing the composition distribution at seven taxonomic levels including kingdom, phylum, class, order, family, genus, and species [32,33]. Through methods like relative abundance comparisons, Poca analysis, Shannon index, and Simpson index, the richness and diversity of zooplankton across different seasons and river types were comprehensively evaluated.

2.7. Data Quality Control

The application of environmental DNA (eDNA) technology in biodiversity monitoring and ecosystem research has increasingly gained prominence. However, ensuring the accuracy and reliability of the data obtained is paramount, thus making Data Quality Control (QC) essential [34]. Initially, sterile sampling tools and containers are utilized during sampling to minimize sample contamination. Cross-contamination during sampling is avoided, for instance, by employing disposable gloves and tools. Furthermore, during DNA extraction and amplification, it is crucial to: (1) utilize high-quality DNA extraction reagents to ensure the purity and integrity of DNA, (2) adhere to stringent PCR amplification conditions and optimized primer designs to reduce amplification biases and non-specific amplifications, and (3) conduct positive and negative control experiments to detect potential contamination and reagent failures. In data processing, sequence alignment and species identification are conducted. The original sequence data undergo quality filtering to eliminate low-quality sequences and potential errors [30]. Setting reasonable species identification thresholds, such as similarity percentages, is important to ensure the accuracy of species identification. Through meticulous quality control at each of these steps, conclusive data can ultimately be derived.

2.8. Monitoring of Aquatic Environmental Factors

In this experiment, a total of 10 environmental characteristics in Lake Dianchi were measured (Table 4). The portable water quality parameter meter (HACHSL1000), Hach COD analyzer (DR2800), and conductivity meter were utilized to determine the pH value, dissolved oxygen (DO), chemical oxygen demand (COD), and total dissolved solids content in the water samples, respectively. Ion chromatography (Thermo Fisher ICS5000+, Waltham, MA, USA) was employed to measure the nitrite nitrogen (NO2-N) and nitrate nitrogen (NO3-N) in the water samples, while high-performance liquid chromatography (HPLC) was utilized to determine the chlorophyll a content in the water. The national standard spectrophotometric method was used to measure the concentrations of ammonia nitrogen (NH3-N), total phosphorus (TP), total nitrogen (TN), and total ammonia nitrogen (TAN). Water quality indicators were analyzed according to the methods outlined in the fourth edition of water and wastewater treatment practices [35].

2.9. Methodology for Redundancy Analysis of Aquatic Environmental Factors and Zooplankton Diversity

Alpha diversity indices were calculated based on the rarefied OTU abundance table to eliminate biases caused by uneven sequencing depth across samples. Four complementary indices were computed: (1) the Shannon index ( H 2 = i = 1 S ( n i n ) log 2 ( n i n ) ), which accounts for both richness and evenness and increases as both diversity and evenness increase (In the formula: H 2 —Shannon diversity index; n —total number of individuals of all species; S —number of species; n i —number of individuals of the i-th species) [36]; (2) the Simpson index ( D = 1 i = 1 s ( n i n ) 2 ), representing the probability that two randomly selected individuals belong to the same species (In the formula: D —Simpson diversity index; n —total number of individuals of macrozoobenthos; S —number of macrozoobenthos species; n i —number of individuals of the i-th macrozoobenthos species) [37]; (3) Pielou’s evenness index ( J = H e ln S ), measuring how evenly individuals are distributed among taxa (In the formula: S = number of species within the community; H e = Shannon diversity index. The range of the index satisfies 0 < J < 1. A larger value of J indicates a more even distribution of individuals; conversely, a smaller value of J represents a lower evenness of individual distribution) [38]; and (4) the Margalef richness index ( D = S 1 ln N ), in the formula: N = total number of individuals; S = total number of species [39].
Beta diversity was assessed using Bray–Curtis dissimilarity ( B C j k = 1 2 C j k S j + S k ), where C j k is the sum of shared abundances and S j and S k are total abundances in samples j and k calculated on Hellinger-transformed OTU abundances ( y i j = y i j i y i j ). Visualization of community structure was performed using non-metric multidimensional scaling (NMDS) with a maximum of 100 random starts using different initial configurations; the final solution (k = 2, stress = 0.189) was selected based on stress < 0.20 and was confirmed through Procrustes analysis of 500 permuted configurations (Procrustes correlation = 0.978) to ensure solution stability [40]. Permutational multivariate analysis of variance (PERMANOVA, adonis2 function in vegan, 9999 unrestricted permutations) was used to test for significant differences in community composition across estuary types, seasons, and their interaction, with Type III sums of squares [41]. Pairwise post-hoc comparisons were performed using the R package pairwiseAdonis v0.4.1 with 9999 permutations per comparison [42]. All p-values from pairwise comparisons were corrected for multiple testing using the Benjamini–Hochberg false discovery rate (FDR) procedure. Dispersion homogeneity was verified using the betadisper function in vegan prior to PERMANOVA.
All statistical analyses were performed in R v4.3.1. Prior to multivariate analysis, collinearity among the 10 environmental variables was assessed using the variance inflation factor (VIF) calculated with the vifstep function in the R package usdm v2.1-7 [43]. Variables with VIF > 10 were considered highly collinear and were sequentially removed (starting with the highest VIF) until all remaining variables satisfied VIF < 5. The final set of uncorrelated environmental predictors used in the RDA is reported in the results.
Redundancy analysis (RDA) was performed to quantify the relationships between zooplankton community composition (Hellinger-transformed OTU abundance matrix) and the selected environmental variables. Hellinger transformation was applied to the species matrix prior to RDA to reduce the influence of rare taxa and to linearize species–environment relationships [44]. The RDA model was fitted using the rda function in vegan. The significance of the overall RDA model and of each constrained axis (RDA1, RDA2, …) was evaluated using permutation tests (9999 unrestricted permutations, α = 0.05). The proportion of total variance explained by the model is reported as adjusted R2 (R2adj) to correct for the number of predictors. Forward selection of environmental variables was performed using the ordistep function in vegan, with a significance threshold of α = 0.05 and 999 permutations per step, to identify the minimal set of environmental predictors that best explained community variation.
Mantel tests (9999 permutations, Pearson correlation) were used to test the correlation between zooplankton community dissimilarity (Bray–Curtis) and Euclidean distance matrices of individual environmental variables. Correction for multiple testing across Mantel comparisons (10 variables) was applied using the Benjamini–Hochberg FDR procedure. Effect sizes for PERMANOVA are reported as R2 values. All permutation-based p-values were computed with a minimum of 9999 permutations to ensure stable estimation of significance at α = 0.05.
In order to analyze the interrelationships between zooplankton diversity and the environment, the relative abundance of sequences obtained through high-throughput sequencing of zooplankton at each sampling site was combined with the values of 10 water quality physicochemical indicators detected, including Chl-a, COD, BOD5, total nitrogen (TN), total phosphorus (TP), pH, dissolved oxygen (DO), COD, conductivity, total dissolved solids (TDS), and total ammonia nitrogen (TAN), for redundancy analysis (tb-RDA). Redundancy analysis (RDA) is a multivariate statistical analysis method that simplifies high-dimensional data into a lower-dimensional space using dimensionality reduction techniques, making complex datasets more understandable and visualizable. This is typically achieved by plotting the scores of response variables on constrained axes, aiming to explore the associations between multiple response variables (such as species abundance) and multiple explanatory variables (such as environmental parameters). In this study, RDA was utilized to analyze the correlation between zooplankton composition and environmental factors. RDA combines the characteristics of principal component analysis (PCA) and canonical correlation analysis (CCA). Through RDA, key environmental factors that significantly influence biodiversity and species distribution can be identified. The results of RDA analysis hold important practical implications for fields such as ecological conservation, resource management, and environmental monitoring. Furthermore, it guides the decision-making processes for ecological restoration and environmental improvement.

3. Results

3.1. Selection Results of Universal Primers for Zooplankton

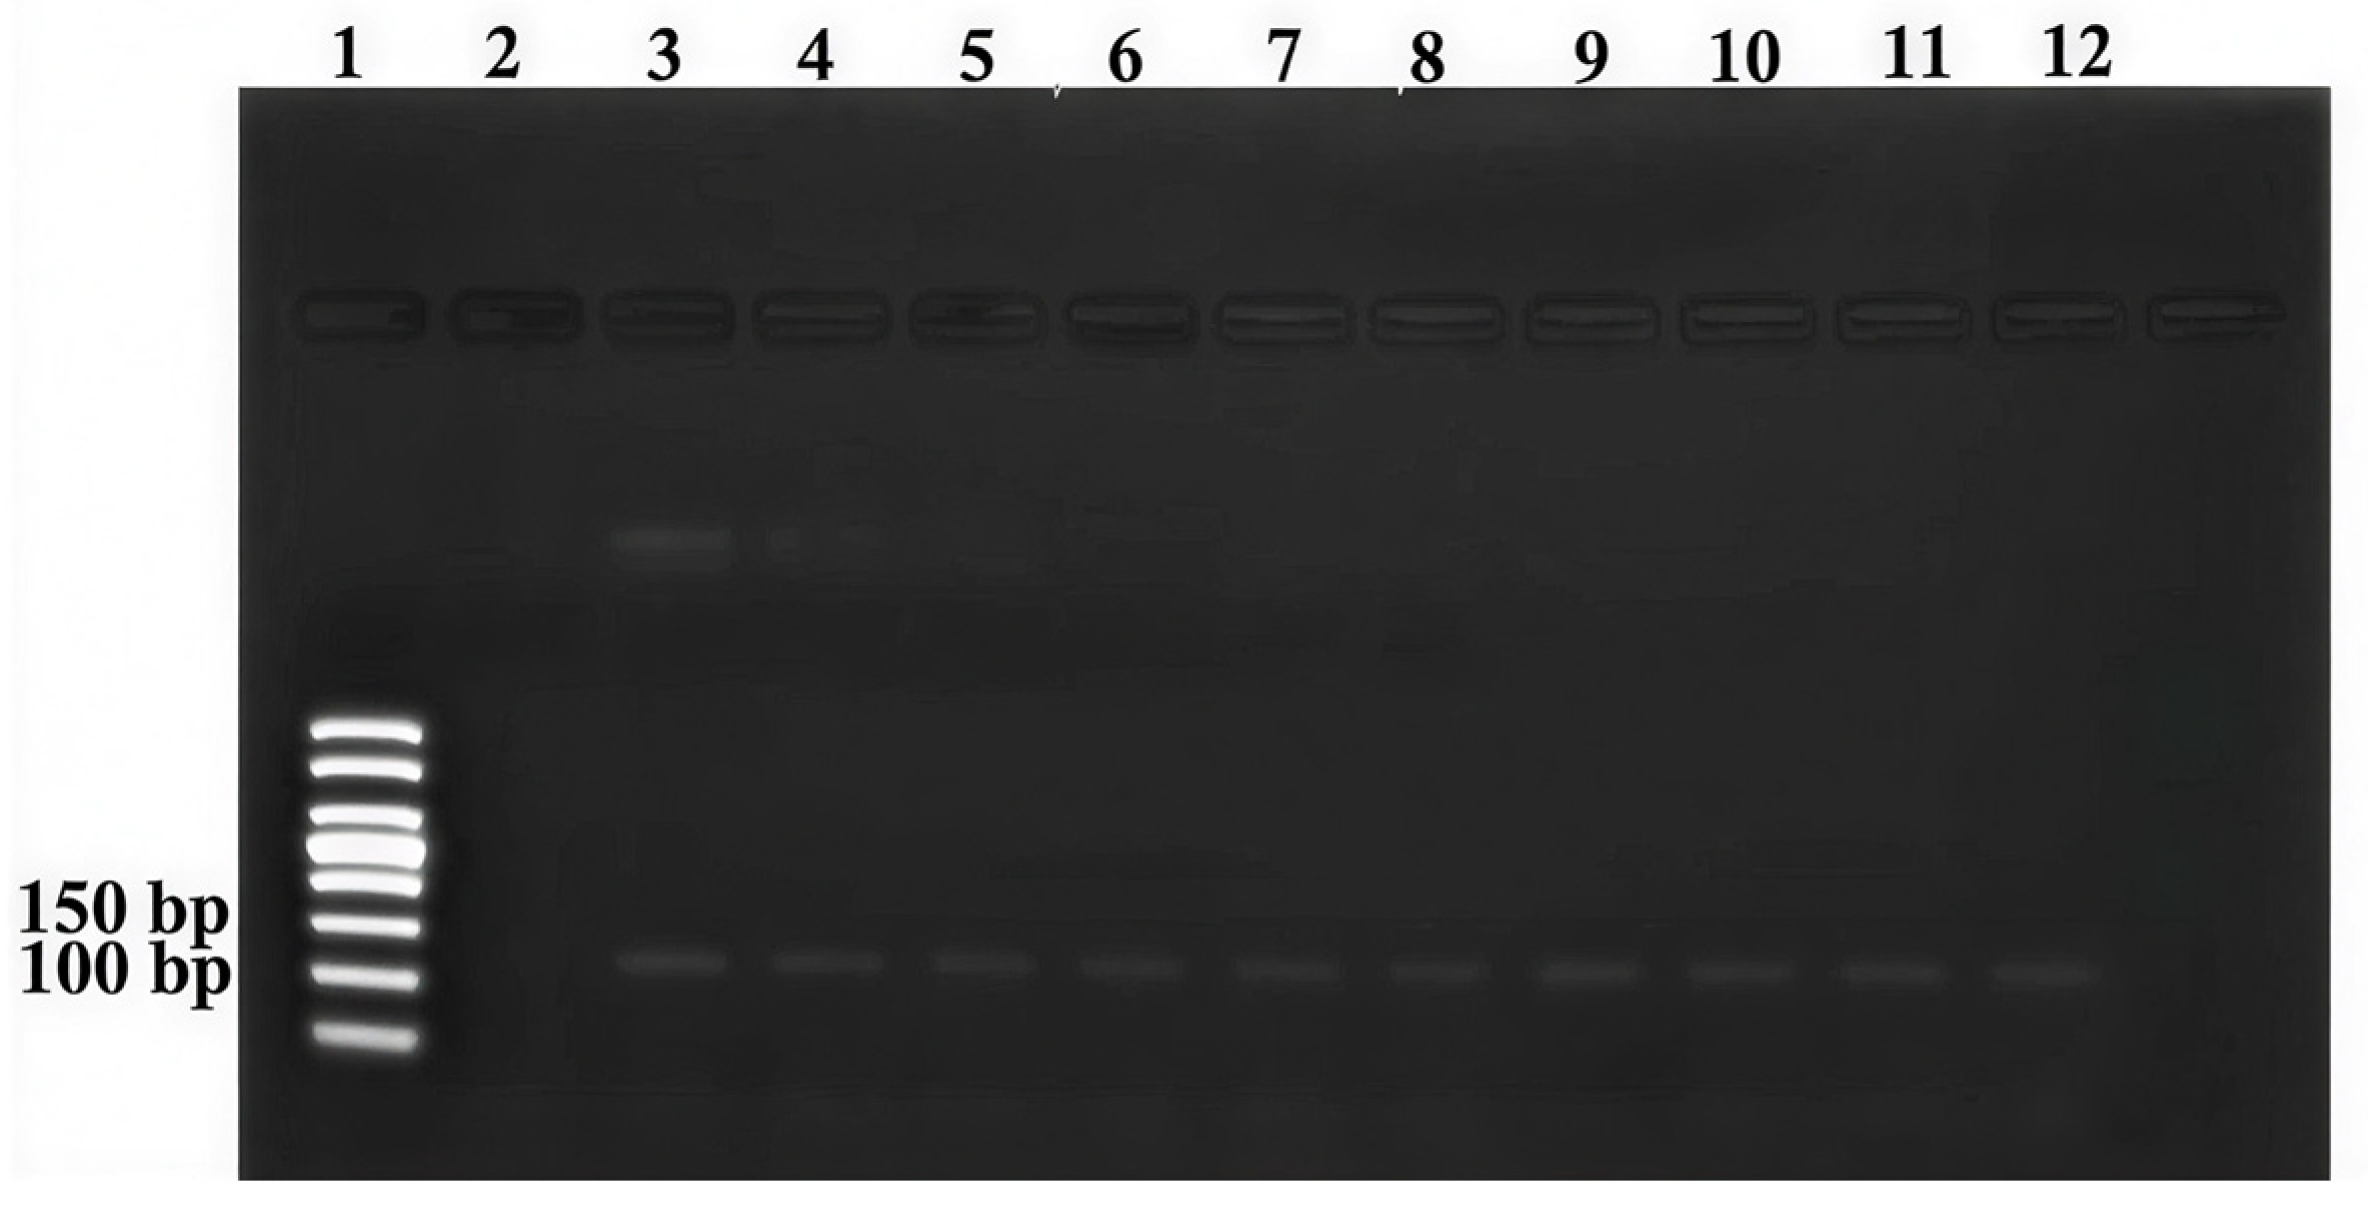
Based on the conclusions derived from high-throughput sequencing, significant differences in PCR product concentrations amplified by different primers were observed. In order to identify the optimal primers and conditions suitable for zooplankton in the plateau lakes of Lake Dianchi, this study conducted a screening process on four primers known for their efficacy with zooplankton universal primers. By utilizing these universal primers, PCR amplification was carried out, resulting in the successful selection of COI-LCO1490-F and HCO2198-R primers, with clear target bands observed at an annealing temperature of 58 °C and 30 cycles, as depicted in Figure 2.

3.2. Analysis of Zooplankton Community Species in Dry and Rainy Seasons in the Dianchi Basin

The environmental DNA metabarcoding analysis results reveal a total of 24 species of zooplankton belonging to 2 phyla, 17 families, and 22 genera during both the dry and wet seasons, specifically classified as Arthropoda (13 species) and Rotifera (11 species). Notably, the Cyclopidae family of the phylum Arthropoda constitutes the highest proportion at 29%.
In Table 5, Aglaodiaptomus clavipoides was not detected during the dry season in March, whereas it was detected at more sites during the wet season in July. In contrast, Acanthocyclops viridis and Eucyclops serrulatus were not detected during the wet season in July but were detected at more sites during the dry season. During the dry season in March, Limnoithona tetraspina and Filinia longiseta were detected at fewer sites, whereas they were detected at more sites during the wet season in July. During the wet season in July, Macrocyclops albidus, Eucyclops macruroides, Paracalanus sp., and Acroperus harpae were detected at fewer sites, whereas they were detected at more sites during the dry season in March.

3.3. Analysis of Zooplankton Species Abundance in Dry and Rainy Seasons in Lake Dianchi

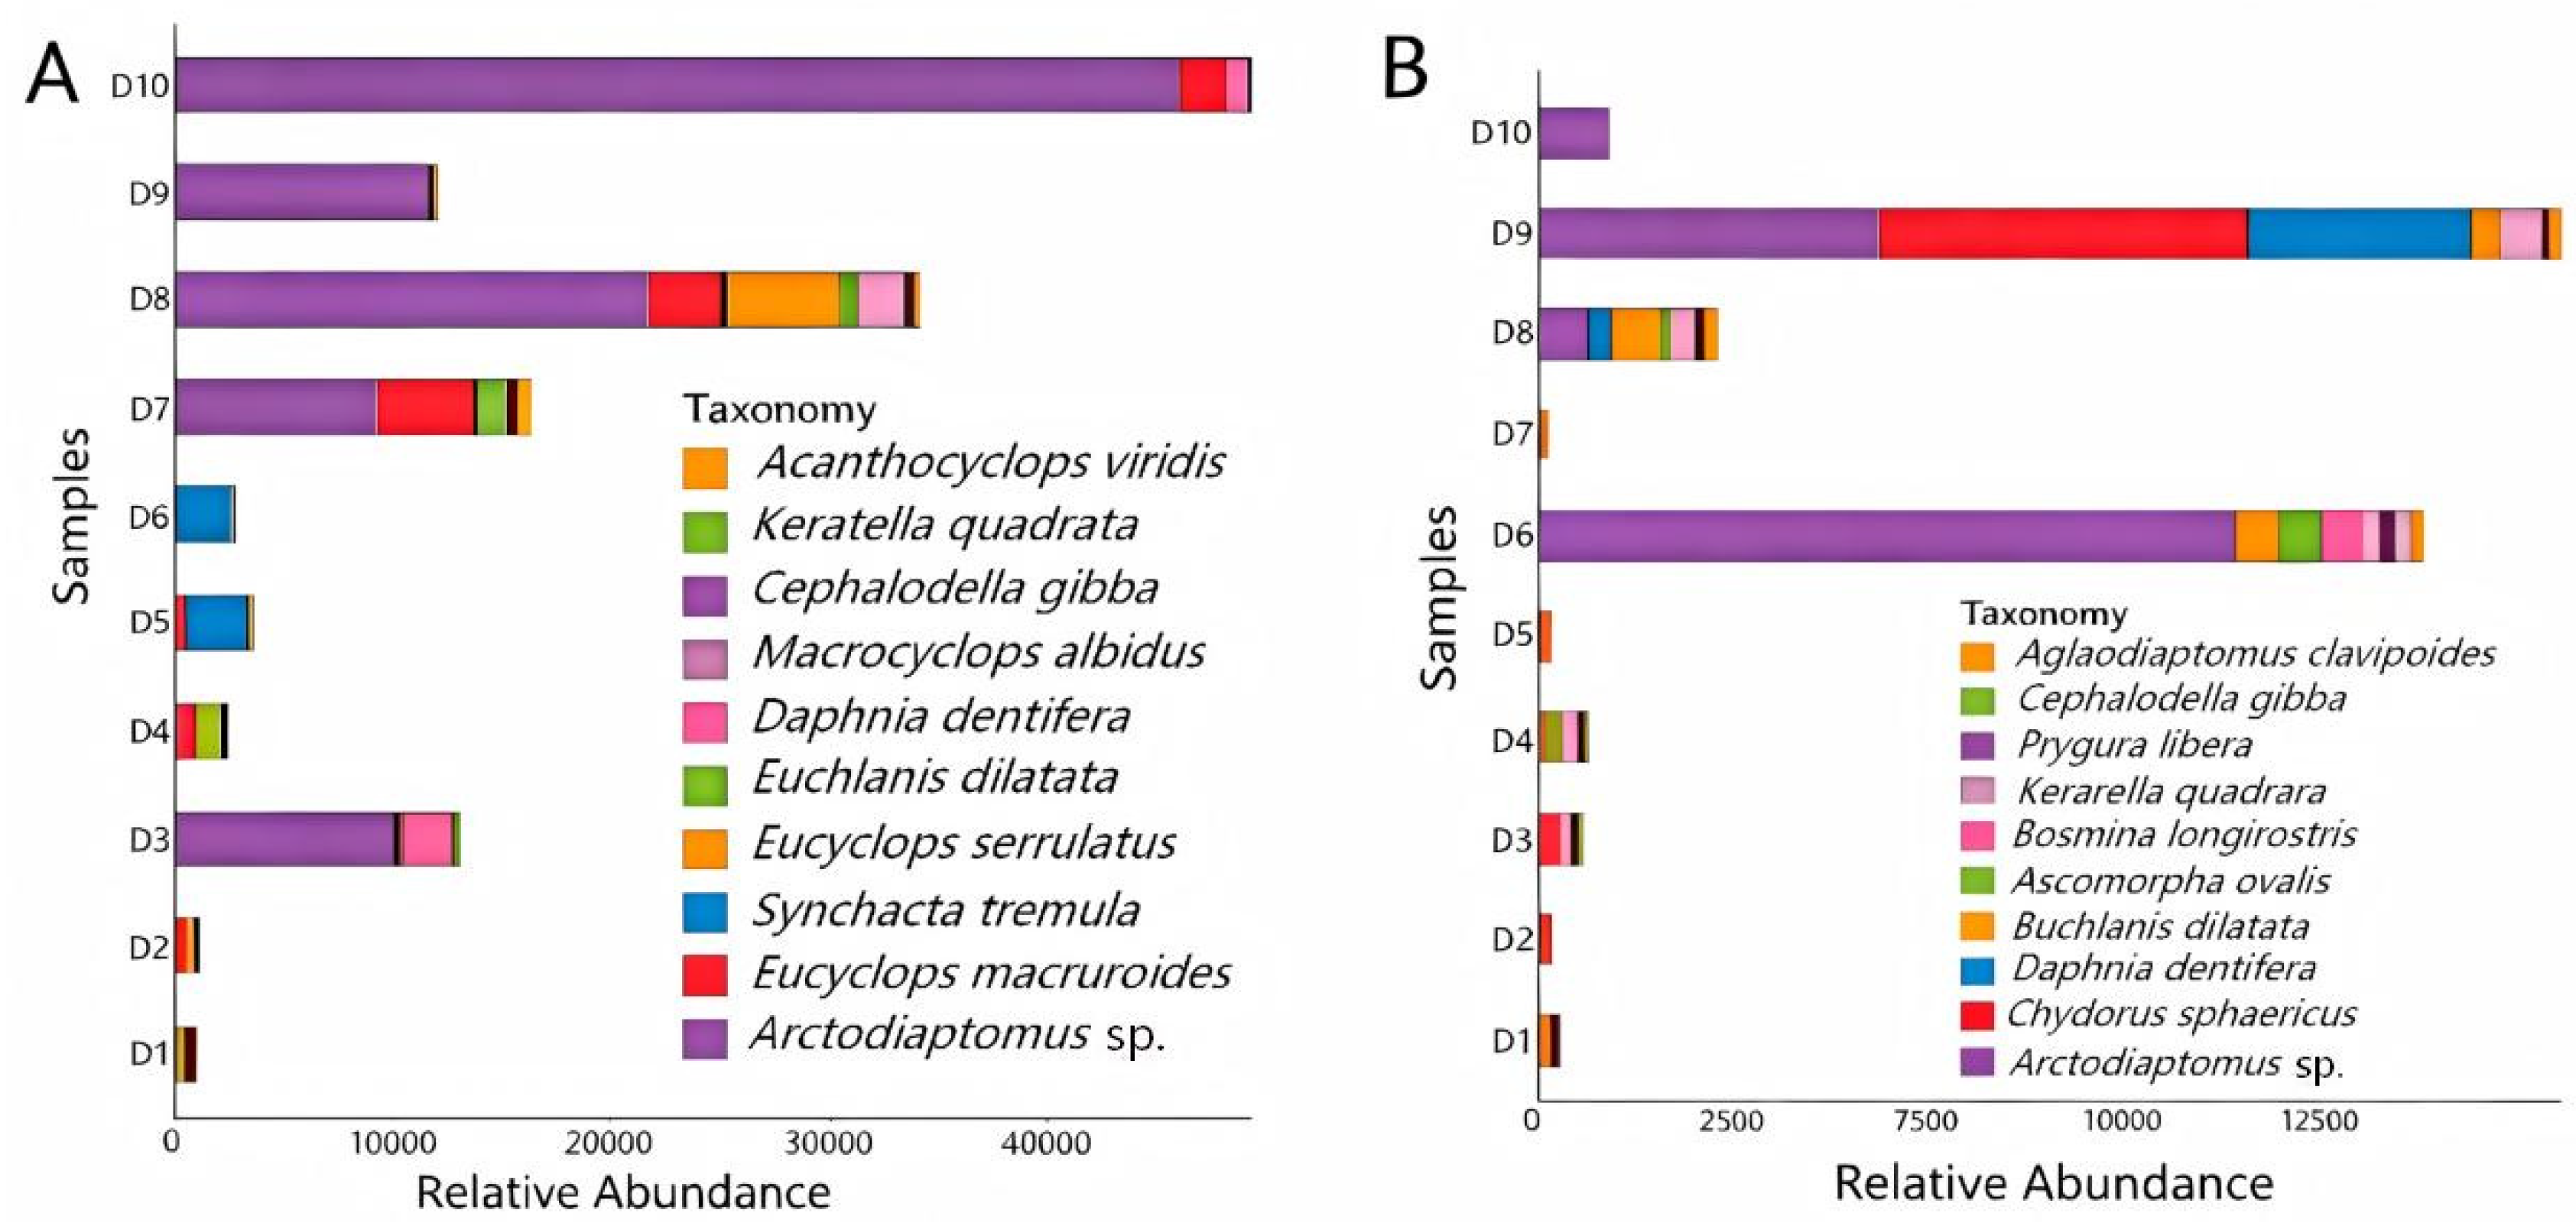
Utilizing eDNA technology and high-throughput sequencing, a bar graph was generated using Origin 2018 for descriptive statistics to analyze zooplankton abundance. The results depicted in Figure 3 reveal that during the dry season in Lake Dianchi, the abundance of Arctodiaptomus sp. is notably high. Specifically, at the central part of Lake Dianchi (station D10), Arctodiaptomus sp. was prevalent, whereas it was not detected at the Baixiang River inlet (station D2). Examination of the bar graph indicates that the species with the highest zooplankton abundance during both periods exhibit no significant differences. In the wet season, Arctodiaptomus sp. emerges as the prominently abundant species at varying sites within Lake Dianchi. Notably, in the Dahe River (station D6), Arctodiaptomus sp. was prevalent, while in the Dachun River (station D9), a comparatively high abundance of the circular discoid pond shrimp Chydorus sphaericus was observed.

3.4. Analysis of Zooplankton Alpha Diversity at Different Inlets of Lake Dianchi

Analysis of the alpha diversity of zooplankton at various sampling stations during the dry season in March (Table 6) shows that the Shannon index ranged from 0.31 to 1.76 across stations, with the lowest value at station D10 and the highest at station D1; the Simpson index ranged from 0.09 to 0.50, with the lowest value at station D9 and the highest at station D2; the Pielou index ranged from 0.13 to 0.76, with the lowest value at station D9 and the highest at station D1; and the Margalef index ranged from 0.56 to 1.34, with the lowest value at station D10 and the highest at station D8.
Analysis of the alpha diversity of zooplankton at various sampling stations in July during the wet season shows (Table 7) that the Shannon index ranged from 0 to 2.27 across stations, with the lowest value at station D5 and the highest at stations D2 and D8; The Simpson index ranged from 0.09 to 1.00, with the lowest value at station D10 and the highest at station D5; the Pielou index ranged from 0.14 to 0.86, with the lowest value at station D10 and the highest at station D2; and the Margalef index ranged from 1.58 to 2.30, with the lowest value at station D9 and the highest at station D2.

3.5. Analysis of Spatial Heterogeneity of Zooplankton in Different Estuaries of Lake Dianchi

During the dry season, the β-diversity analysis of zooplankton from various estuaries explains 61.4% of the variance, as depicted in Figure 4. Notably, the diversity of zooplankton in the heart of Lake Dianchi shows no overlap with agricultural, urban, or suburban estuaries on the coordinate axes. In contrast, during the wet season, the analysis accounts for 42.1% of the differences. During the dry season in March, the dominant species in the urban inflow estuaries were Arctodiaptomus sp. and Cephalodella gibba, while Arctodiaptomus sp. and Synchaeta tremula dominated both the suburban and agricultural inflow estuaries. In the central zone of Lake Dianchi, the dominant species were Arctodiaptomus sp. and Keratella quadrata. During the wet season in July, the dominant species in the urban inflow estuaries shifted to Bosmina longirostris and Euchlanis dilatata. In the suburban inflow estuaries and the central zone of Lake Dianchi, Arctodiaptomus sp. and Euchlanis dilatata were dominant, whereas the agricultural inflow estuaries were dominated by Chydorus sphaericus and Keratella quadrata.

3.6. Analysis of Zooplankton Diversity Disparities Between Dry and Rainy Periods in Lake Dianchi

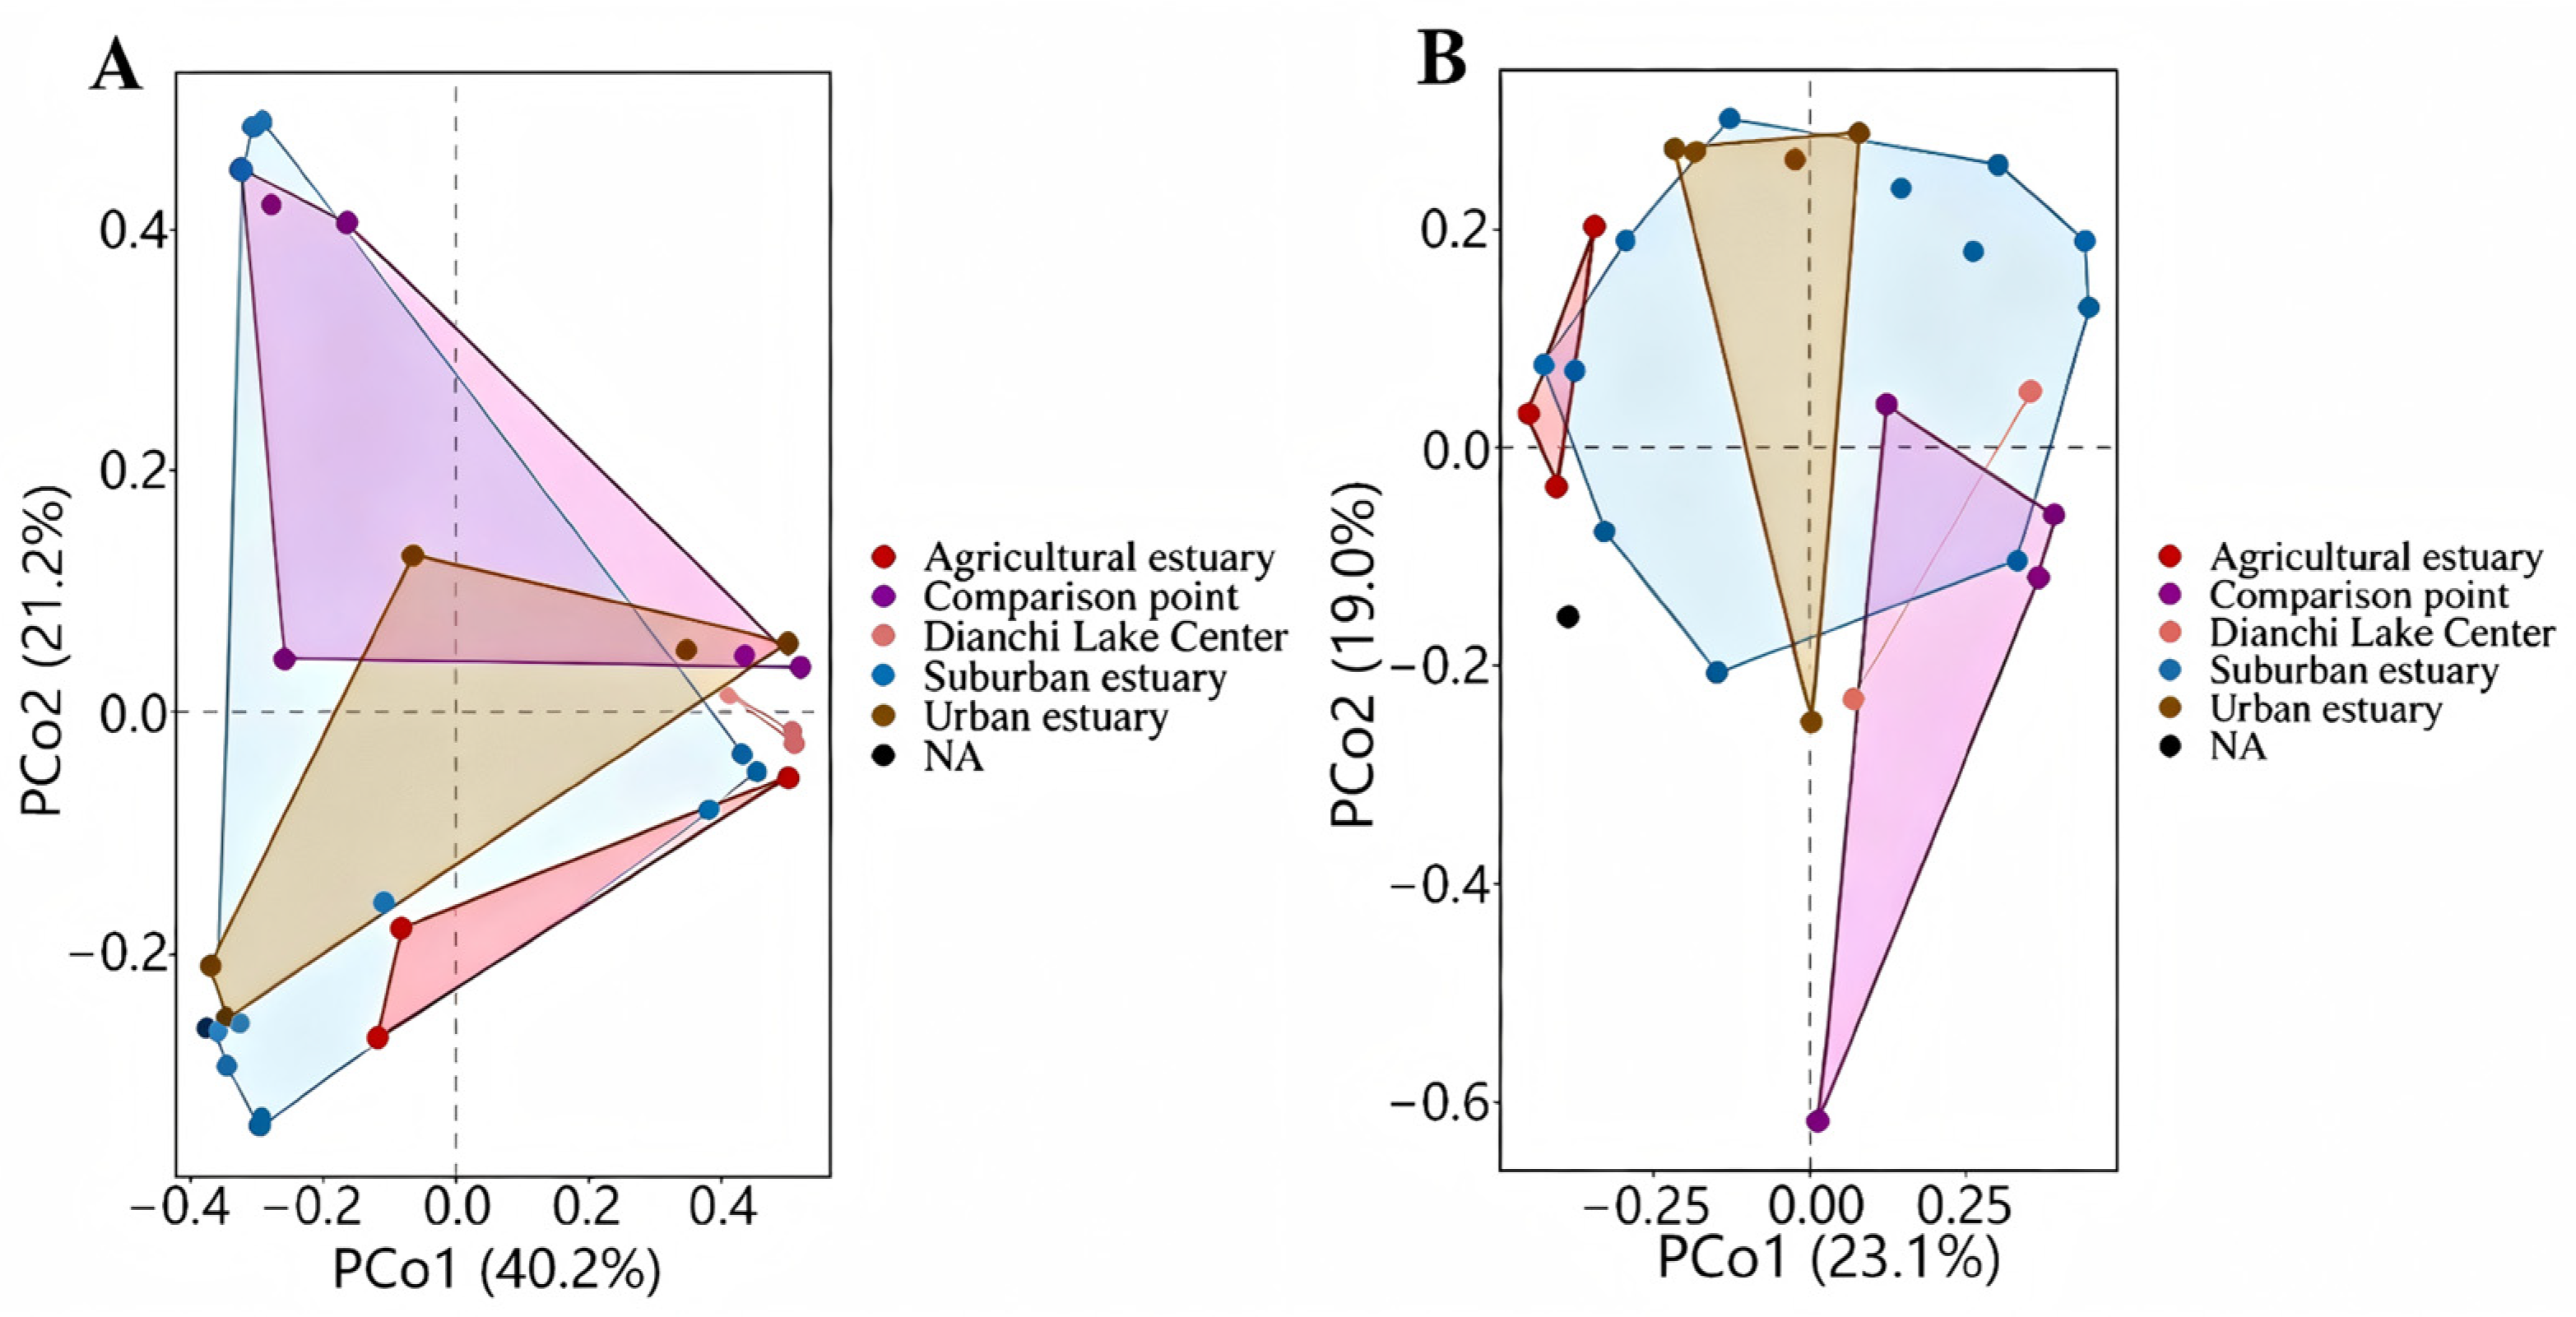
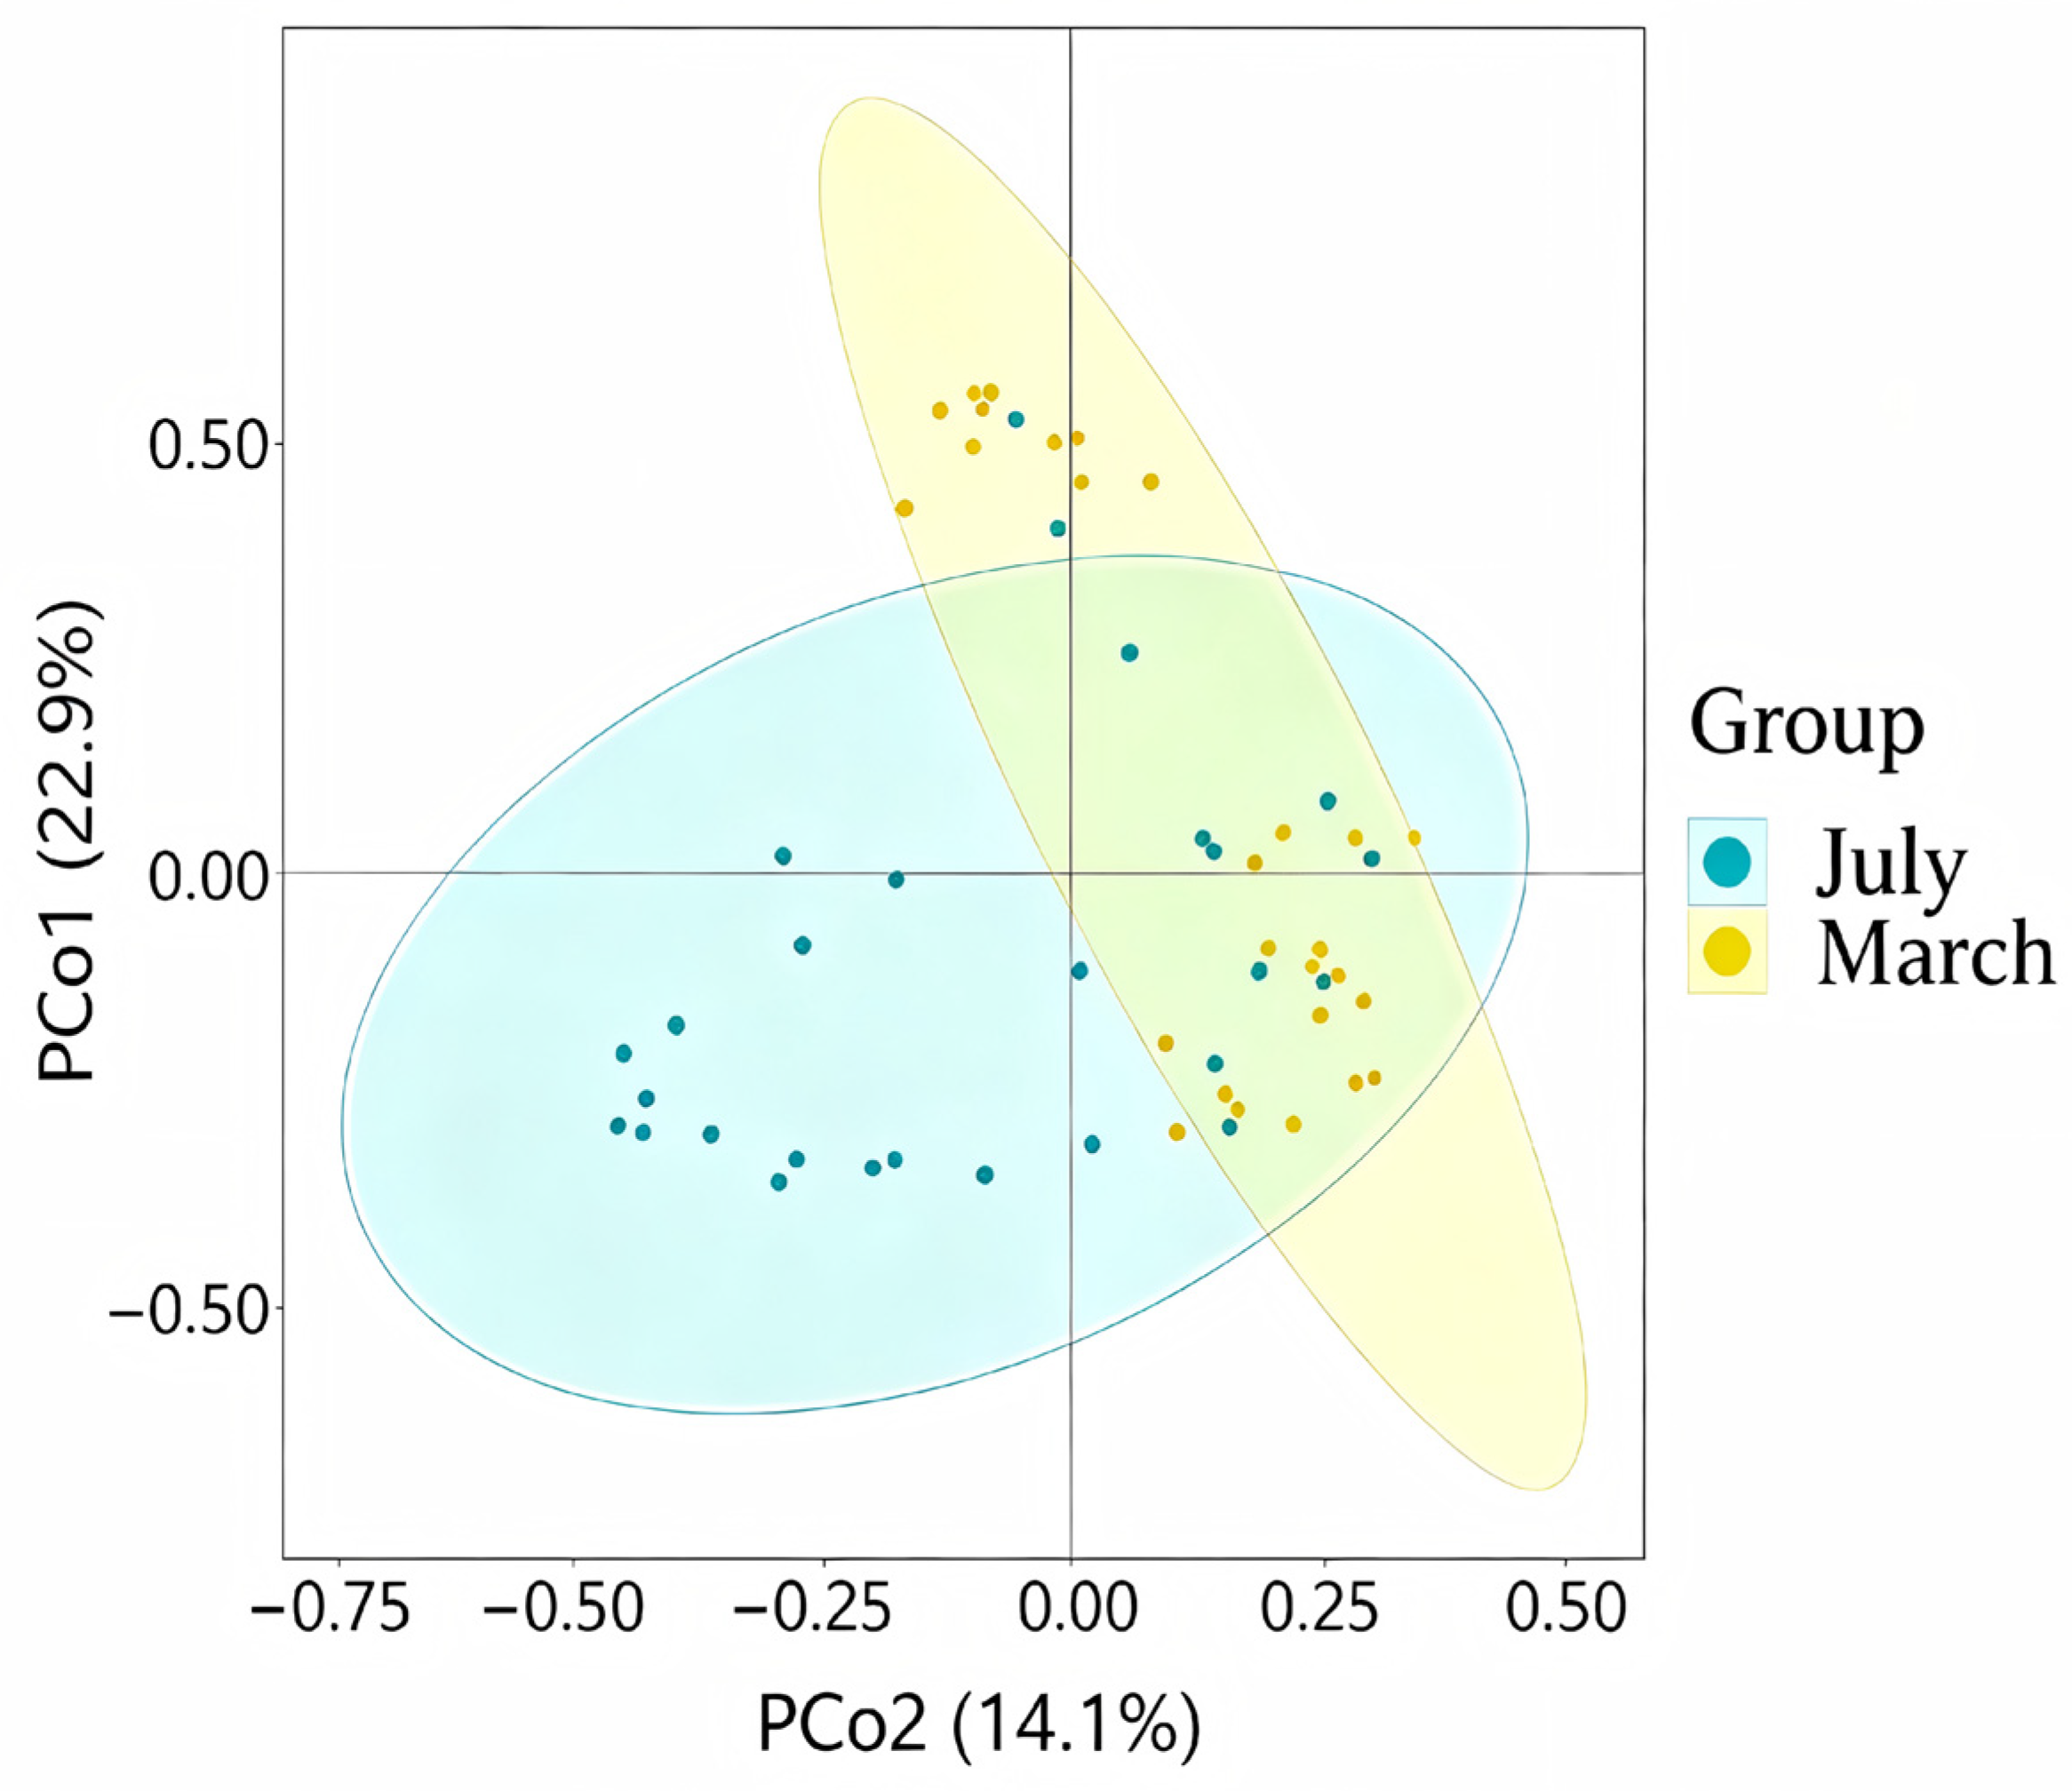
The β-diversity analysis (principal coordinates analysis, PCoA, based on Jaccard distance) of zooplankton operational taxonomic units (OTUs) between the dry and wet periods reveals that PCo1 and PCo2 collectively explain 37% of the total variance (Figure 5). As shown in Figure 5, the wet-season samples (July) exhibit greater dispersion in ordination space compared to dry-season samples (March), indicating higher among-site compositional variability during the rainy period. However, the group centroids of the two seasons show considerable overlap in ordination space, and the 95% confidence ellipses around each seasonal centroid partially overlap, indicating that seasonal compositional differences, while detectable, are not strongly pronounced across the full set of sampling sites. This pattern suggests that the seasonal hydrological regime exerts a measurable but moderate influence on zooplankton community composition, and that site-specific factors (e.g., estuary type, local nutrient loading) may interact with season to shape community structure.

3.7. Analysis of Water Quality Monitoring Data in Different Inlets of Lake Dianchi

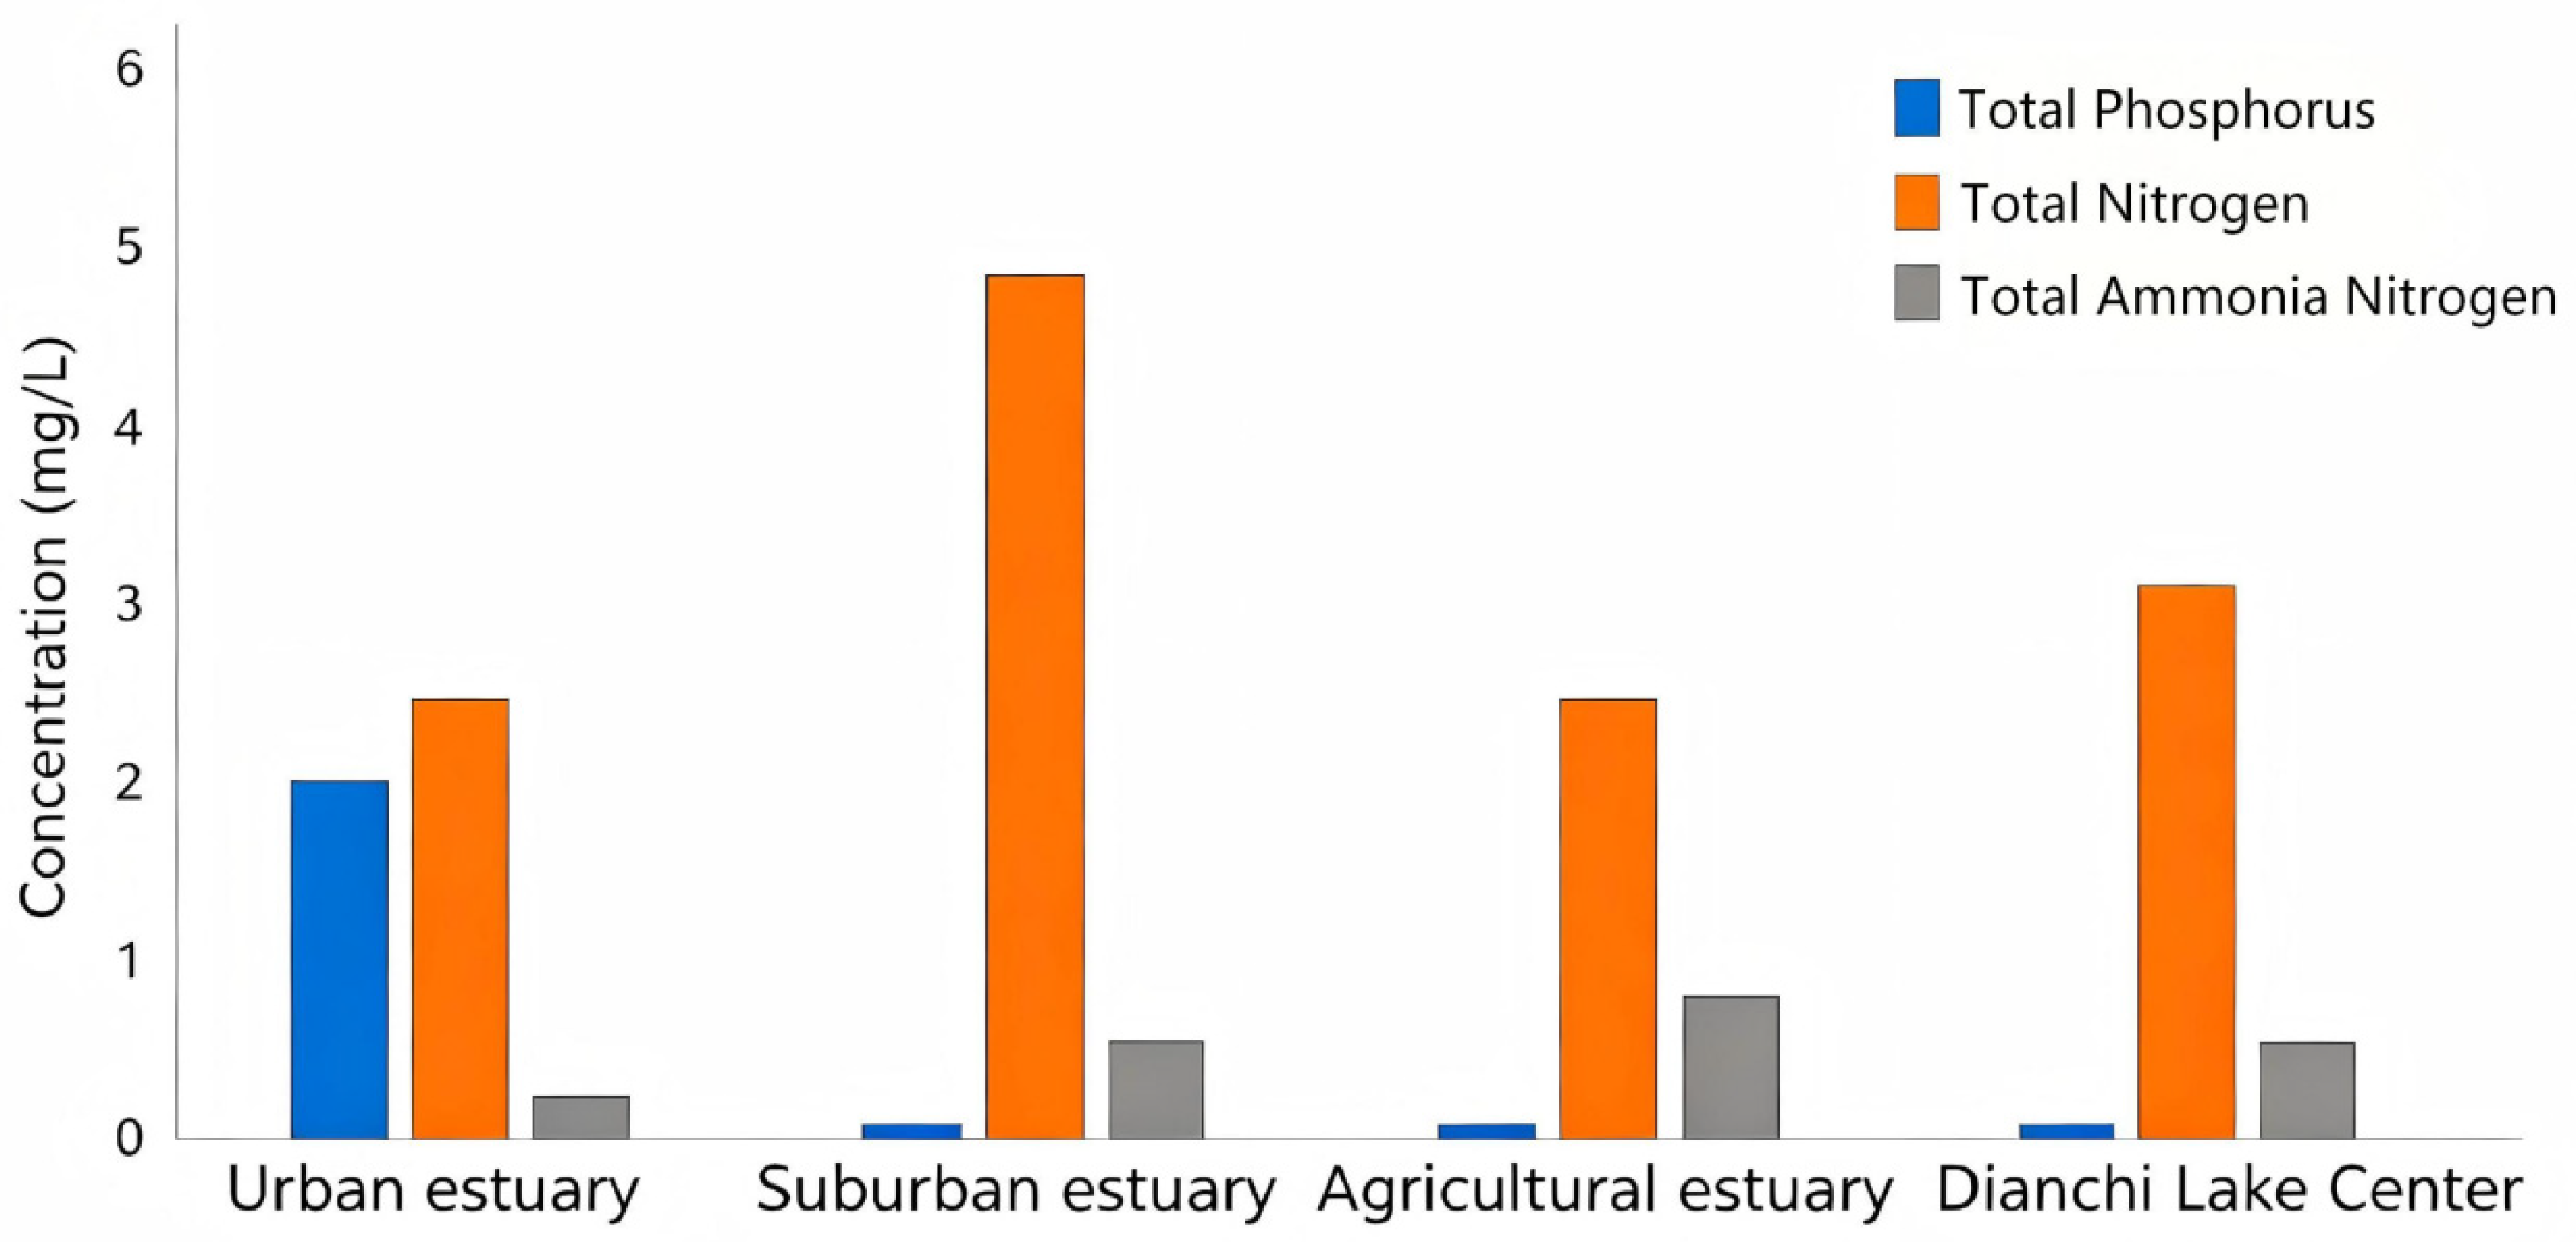
During the dry and rainy periods, the key influencing factors in the water bodies of Lake Dianchi included a mean TN concentration of 3.53 mg/L, a mean TP concentration of 0.28 mg/L, and a mean TAN concentration of 0.45 mg/L. TN concentrations were generally elevated across all inlet estuaries, indicating that TN constitutes a major environmental stressor in Lake Dianchi (Figure 6).
Among the three inlet estuary types, the urban type exhibited higher mean TN concentrations than the suburban and agricultural types in both the dry season (urban: 5.13 ± 0.35 mg/L; suburban: 3.83 ± 3.06 mg/L; agricultural: 2.84 ± 1.16 mg/L) and the rainy season (urban: 5.36 ± 4.07 mg/L; suburban: 2.75 ± 0.42 mg/L; agricultural: 3.20 ± 2.22 mg/L). However, one-way analysis of variance (ANOVA) revealed no statistically significant differences in TN concentrations among the three estuary types in either the dry season (F = 0.70, p = 0.8192) or the rainy season (F = 0.58, p = 0.8683; p > 0.05). Tukey’s HSD post hoc test similarly detected no significant pairwise differences between any two groups. In addition, the TN concentration at sampling site D10 was 2.66 mg/L in the dry season and 3.10 mg/L in the rainy season.

3.8. Analysis of the Influence of Physicochemical Water Quality Indicators on Zooplankton in Lake Dianchi

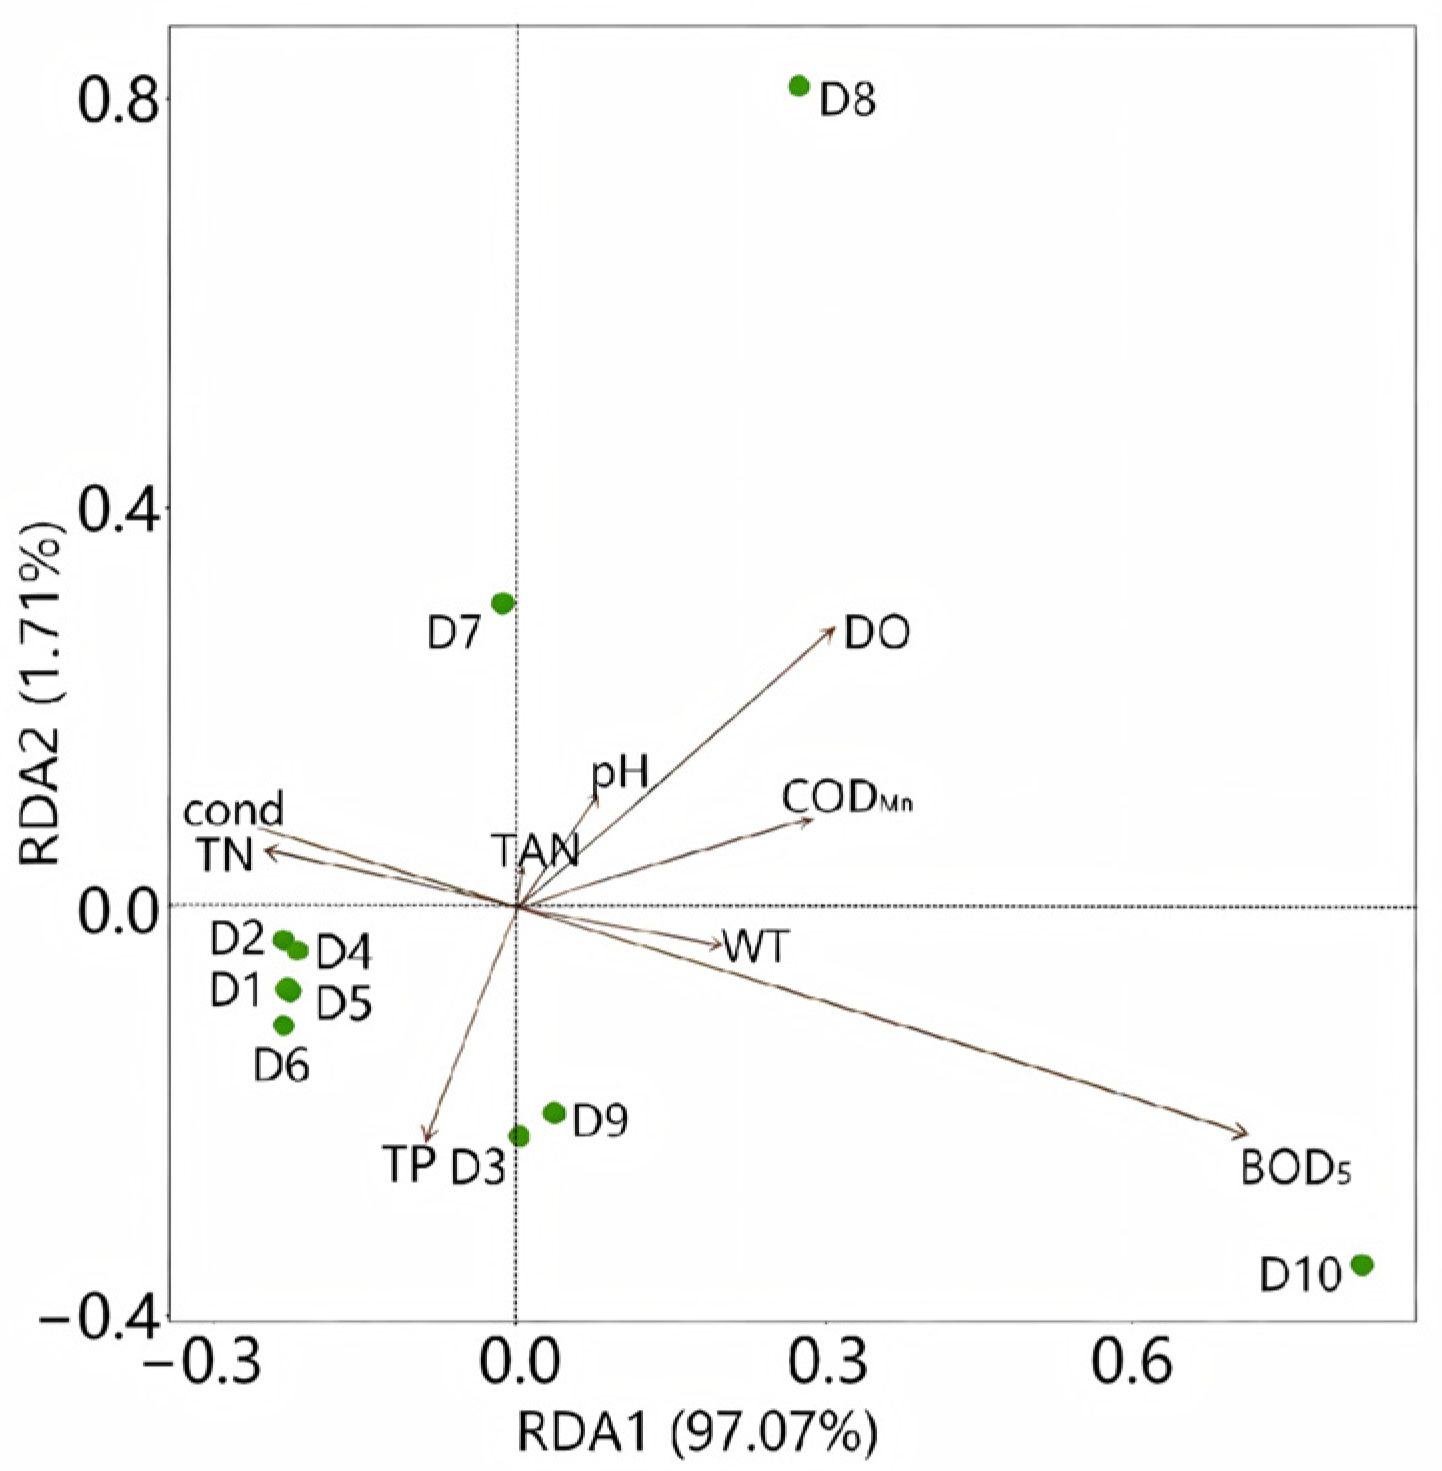
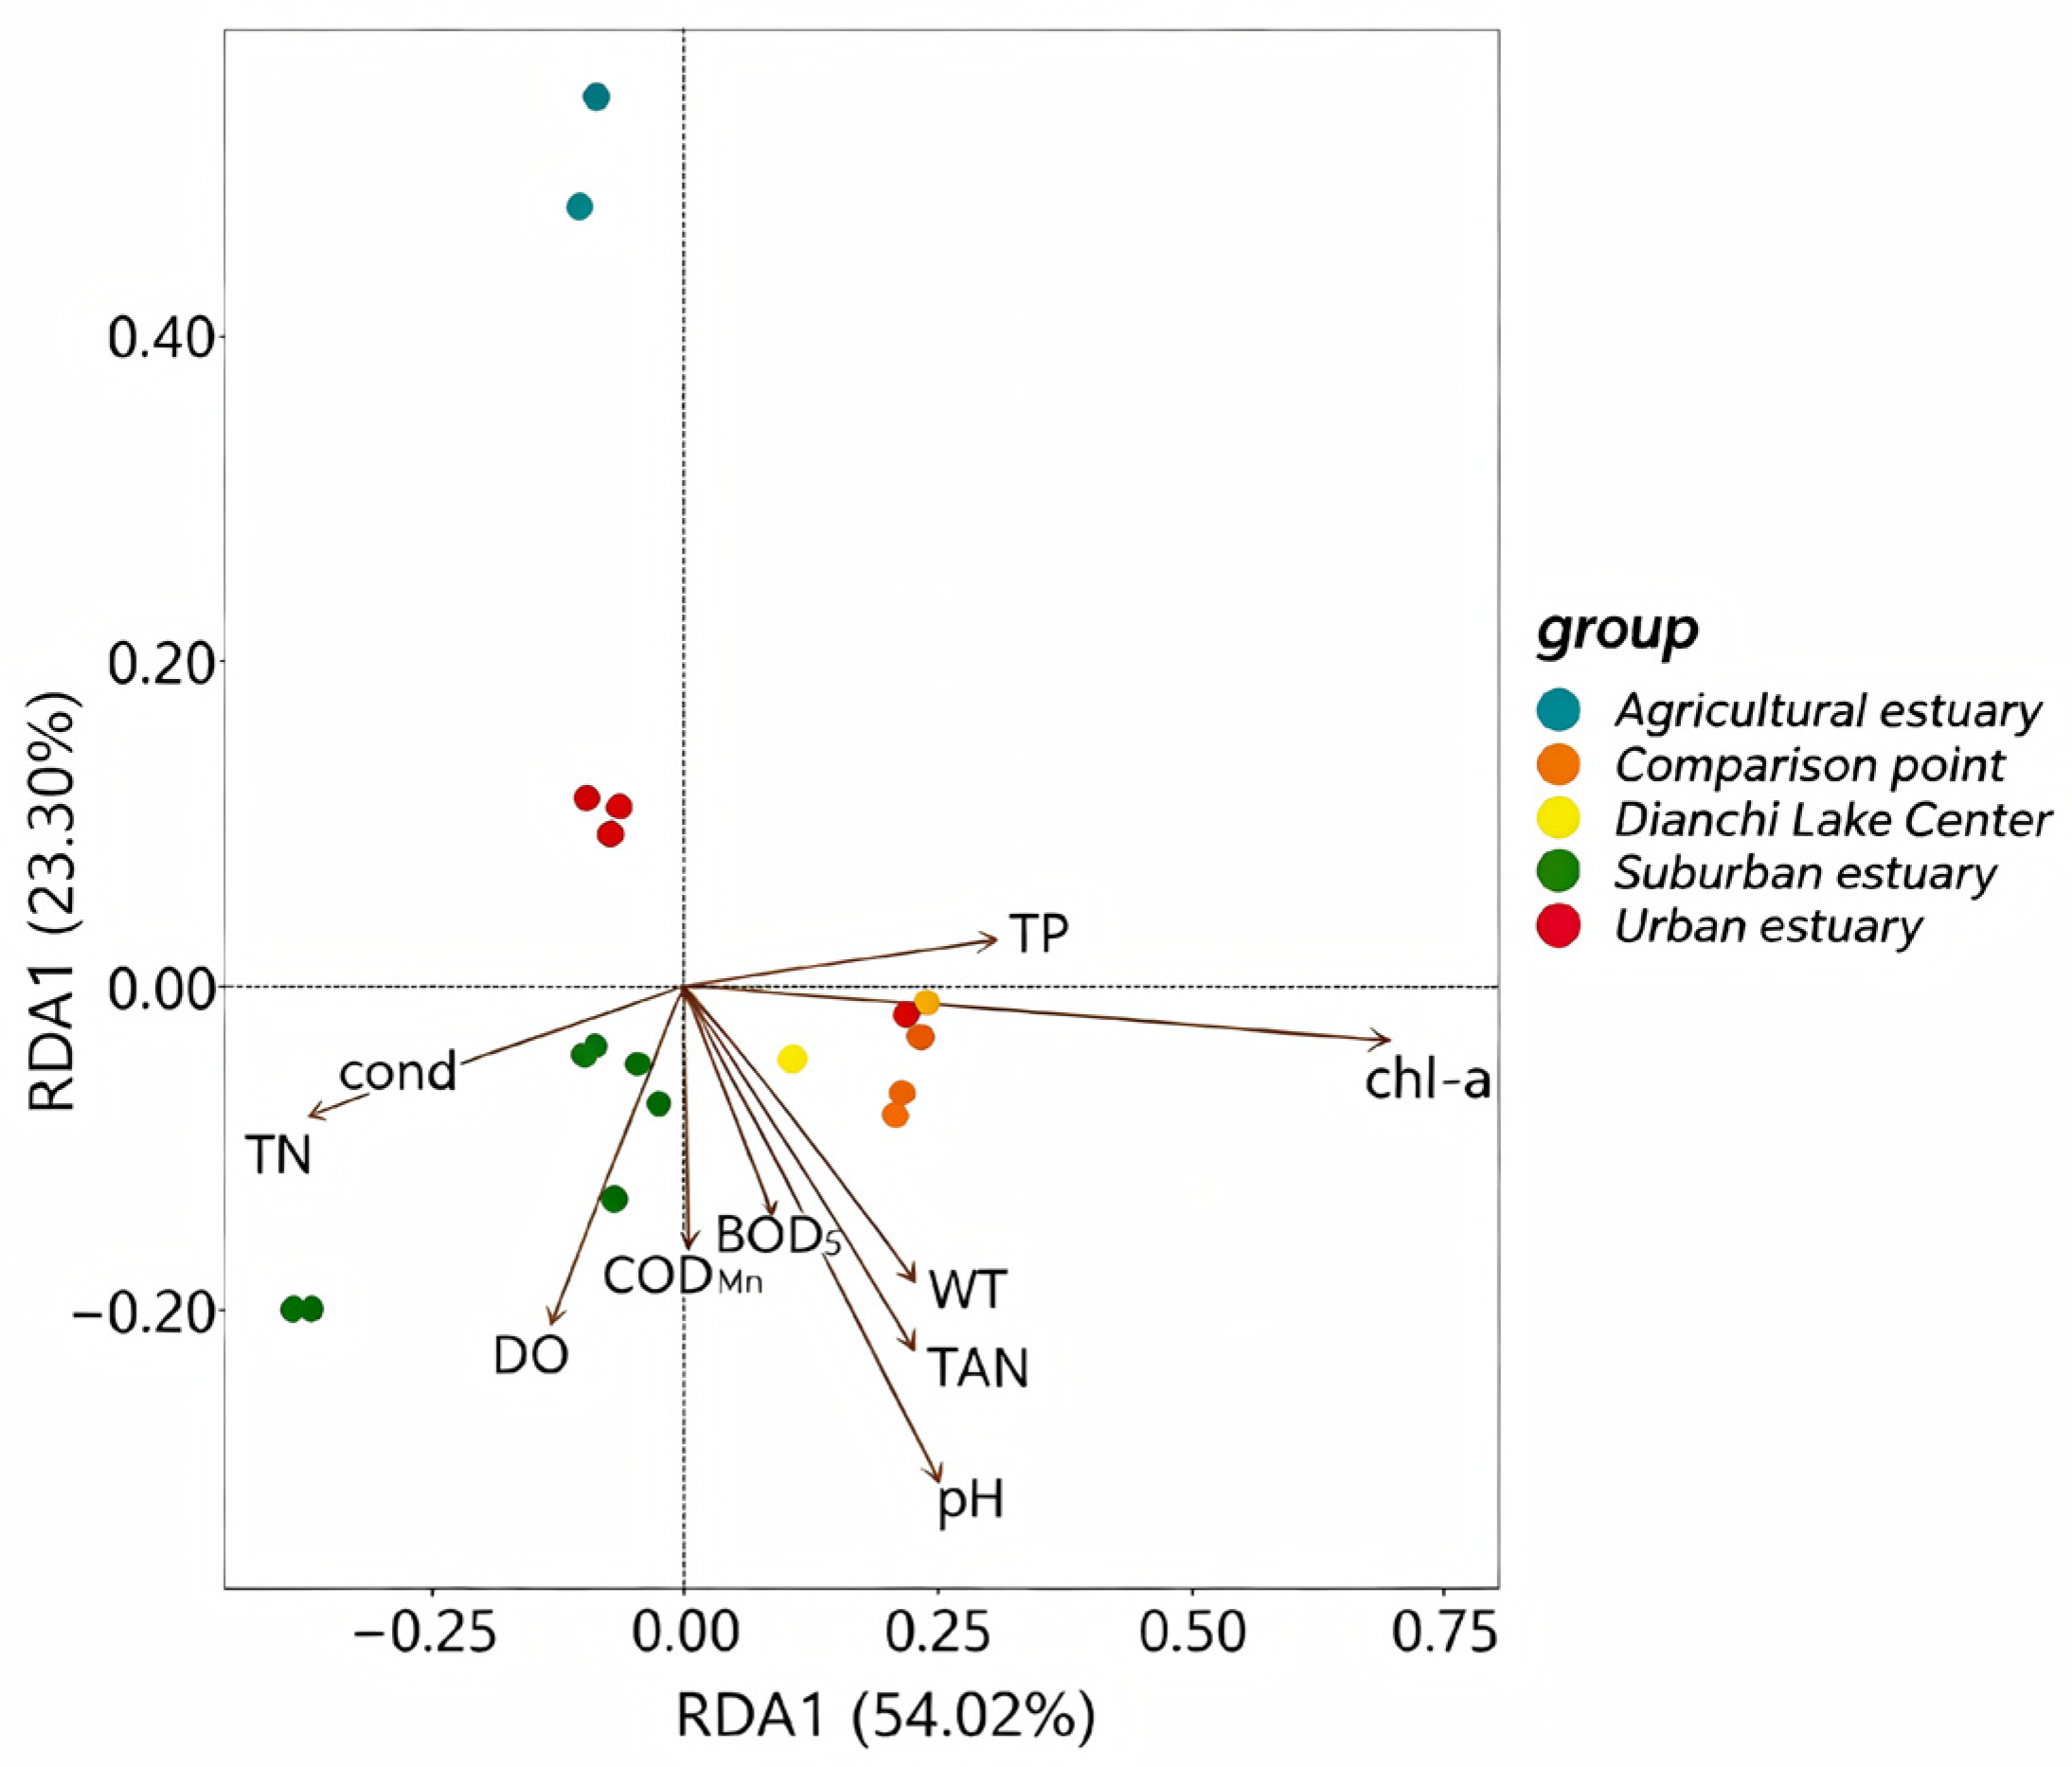
Through redundancy analysis (RDA), Figure 7 and Figure 8, we can see that water quality parameters influence biodiversity at different sampling sites. The correlation between the locations of the sampling sites and the water quality parameter indicator vectors reveals the potential impact of these environmental factors on biodiversity at the sampling sites. The dominant species at the suburban lake estuary was Arctodiaptomus sp., belonging to the family Diaptomidae. Since TN is one of the key nutrients in aquatic ecosystems, it is crucial for the growth of phytoplankton. Environments with high TN levels typically indicate nutrient-rich waters, which can promote phytoplankton proliferation, providing a plentiful food source for Arctodiaptomus sp. Abundant nutrients improve the growth and reproduction conditions for Arctodiaptomus sp. Environments with high TN levels offer them a more suitable habitat, thereby promoting population growth. Arctodiaptomus sp. was identified as the dominant species in urban, suburban, and central Lake Dianchi habitats, indicating that Arctodiaptomus sp. exhibits greater tolerance to TN compared to other species.

4. Discussion

4.1. Zooplankton Community Structure in the Context of Lake Dianchi and Similar Eutrophic Systems

The zooplankton communities detected in Lake Dianchi estuaries via eDNA metabarcoding comprised 24 species (2 phyla, 17 families, 22 genera), with the phylum Arthropoda (13 species, predominantly Cyclopidae at 29%) and Rotifera (11 species, primarily Brachionidae) being the dominant groups. This taxonomic composition is consistent with previous morphological surveys of Lake Dianchi conducted between 2009 and 2022, which consistently identified Rotifera, Cladocera, and Copepoda as the dominant zooplankton groups [45,46,47]. In particular, the detection of the genera Chydorus, Bosmina, Keratella, Euchlanis, Synchaeta, and Cephalodella and multiple Cyclopidae representatives aligns well with the historical records from morphological surveys of the lake. The broad congruence between our eDNA-based detections and previously published morphological records provides confidence in the methodological approach, while also highlighting the complementarity of the two methods.
Compared with other eutrophic plateau lakes in southwestern China, such as Lake Erhai and Lake Fuxian, the zooplankton richness detected in Dianchi (24 taxa) falls within the lower range of reported values. For instance, Lake Erhai typically harbors 30–40 zooplankton taxa during comparable seasons [48], suggesting that the severe eutrophication and prolonged cyanobacteria blooms in Dianchi may have depressed zooplankton diversity [47]. The dominance of cyclopoid copepods (Acanthocyclops, Eucyclops, Mesocyclops) and small-bodied rotifers (Keratella, Brachionus) in our samples is a well-documented pattern in hypertrophic lakes worldwide, where tolerant r-selected species replace larger, more sensitive cladocerans under high nutrient and low-oxygen conditions [13]. This suggests that the zooplankton community of Dianchi has undergone a eutrophication-driven functional simplification, a pattern also observed in the agriculturally dominated state of Iowa (USA) [49].
Seasonally, our study found higher alpha diversity (mean Shannon: 1.59 vs. 1.08; mean Margalef: 1.96 vs. 1.07) and greater among-site compositional variability during the rainy season (July) compared to the dry season (March). This pattern is consistent with the seasonal dynamics reported in other eutrophic systems, where increased riverine runoff during the wet season delivers allochthonous organic matter and nutrients that stimulate secondary production and introduce new taxa from upstream habitats [50]. However, the PERMANOVA results revealed that the seasonal effect, while statistically significant, explained a relatively modest proportion of community variance compared to site-specific factors (estuary type), indicating that localized pollution regimes may override the broad seasonal hydrological signal. This finding aligns with the study by Xu [51], who reported that spatial heterogeneity in nutrient loading was a stronger predictor of plankton community structure in Dianchi than seasonal variation alone.

4.2. Methodological Considerations and Limitations of eDNA Metabarcoding

While eDNA metabarcoding enabled high-throughput detection of zooplankton across multiple phyla, several limitations warrant consideration.
First, the taxonomic richness detected (24 taxa) is lower than the 41 species documented in Lake Dianchi through morphological surveys [46]. This discrepancy may reflect: (1) PCR amplification bias of the COI-F/MICOIint-R primer pair toward certain metazoan lineages [52]; (2) incomplete reference databases, particularly for locally adapted or rare taxa, resulting in conservative taxonomic assignments; and (3) differential DNA shedding rates, whereby actively swimming copepods contribute disproportionately to eDNA signals relative to quiescent taxa such as rotifer resting stages [53].
Second, eDNA signals in lotic-lentic transition zones are influenced by hydrological transport, resuspension of sedimentary DNA, and differential degradation, complicating source attribution [54]. False negatives may arise from dilution or PCR inhibition by humic substances [55]. Although field, filtration, extraction, and PCR-negative controls were included, residual false positives from carryover or persistent extracellular DNA cannot be excluded.
Third, under our SINTAX confidence thresholds (genus ≥ 0.6, species ≥ 0.8), four OTUs were resolved only to the genus level (e.g., Arctodiaptomus sp., Mesocyclops sp.), limiting species-level ecological inference. This is a recognized constraint of COI-based metabarcoding in under-curated groups [56]. Alternative markers such as 18S V9 offer broader coverage at the cost of reduced species resolution [57].
To strengthen confidence in these results, we recommend targeted validation of key indicator taxa (e.g., Bosmina longirostris, Daphnia dentifera) through traditional net-tow sampling with morphological identification, or cross-referencing against published presence–absence records for Lake Dianchi [58]. The broad concordance observed here supports the overall reliability of the eDNA-based inventory.

4.3. Total Nitrogen as a Primary Stressor and Implications for Management

Redundancy analysis identified total nitrogen (TN) as the primary variable correlated with zooplankton community variation across seasons and estuary types, consistent with previous studies in Dianchi [59]. TN concentrations (mean 2.46 mg/L) far exceeded the OECD hypertrophy threshold (0.65 mg/L), with suburban estuaries (D2, D4, D6, D8) exhibiting the highest levels, reflecting combined urban and agricultural non-point source inputs.
Biologically, elevated TN corresponded with the dominance of the cyclopoid copepod Arctodiaptomus sp., whose abundance vectors aligned positively with the TN gradient in RDA biplots (Figure 7 and Figure 8), suggesting tolerance or indirect benefit from nitrogen-stimulated primary production. This association warrants caution, as RDA captures correlation rather than causation, and TN may co-vary with TP, conductivity, or cyanotoxins in eutrophic waters [60]. Forward-selection analysis identified TN, TP, and conductivity as the minimal predictor set, indicating that single-nutrient management may be insufficient.
Reducing TN in inflowing suburban rivers to below approximately 1.5 mg/L—the RDA-estimated breakpoint for the Arctodiaptomus sp. gradient (Figure 7)—could facilitate a shift toward a more functionally diverse assemblage including larger cladocerans and sensitive rotifers. However, several uncertainties constrain this estimate: diffuse non-point source pollution and long hydraulic residence time limit the cost-effectiveness of watershed-scale TN reduction [61], and phosphorus co-management is likely necessary to prevent compensatory cyanobacterial blooms. These findings support a dual-nutrient strategy with emphasis on TN load reduction in suburban catchments, monitored through zooplankton community metrics as early-warning indicators of ecological recovery.

5. Conclusions

The study identified optimal universal primers for zooplankton, with COI-LCO1490-F and HCO2198-R providing the best PCR results at 58 °C after 30 cycles. Beta diversity analysis showed a 37% difference in zooplankton diversity between the two periods, identifying 24 species from 17 families and 22 genera, among Arthropoda (54%) and Rotifera (46%). Within Arthropoda, Cyclopidae is the most prominent family. During the dry season in March, the dominant species in the urban inflow estuaries were Arctodiaptomus sp. and Cephalodella gibba, while Arctodiaptomus sp. and Synchaeta tremula dominated both the suburban and agricultural inflow estuaries. In the central zone of Lake Dianchi, the dominant species were Arctodiaptomus sp. and Keratella quadrata. During the rainy season in July, the dominant species in the urban inflow estuaries shifted to Bosmina longirostris and Euchlanis dilatata. In the suburban inflow estuaries and the central zone of Lake Dianchi, Arctodiaptomus sp. and Euchlanis dilatata were dominant, whereas the agricultural inflow estuaries were dominated by Chydorus sphaericus and Keratella quadrata. Redundancy analysis revealed that TN is the main stress indicator correlated with zooplankton diversity, with the highest concentration found in suburban-type estuaries, where Arctodiaptomus sp. demonstrates greater tolerance to TN. This research provides a basis for ecological restoration efforts in various inlet estuaries of Lake Dianchi by linking zooplankton diversity to water quality.
This study provides a spatially and temporally explicit assessment of zooplankton communities in Lake Dianchi estuaries using eDNA metabarcoding, demonstrating the utility of this approach for rapid, multi-taxon biodiversity monitoring in complex eutrophic systems. Our results confirm that TN is a dominant environmental driver in this system and that suburban estuaries represent priority management zones. However, several important questions remain. Future research should (1) integrate eDNA with quantitative PCR (qPCR) or droplet digital PCR (ddPCR) for absolute quantification of key indicator species; (2) extend temporal sampling to capture interannual variability and regime shifts; (3) pair eDNA with traditional net sampling for method validation; and (4) trace upstream pollution sources in the suburban river catchments identified herein as TN hotspots, using stable isotope or microbial source-tracking approaches. Addressing these knowledge gaps will strengthen the evidence base for ecosystem-based management and ecological restoration of eutrophic lake estuaries in the Dianchi Basin and beyond.

Author Contributions

S.W.: Formal analysis, Methodology, Writing—original draft; K.Z.: Investigation, Data curation, Formal analysis; Q.H.: Software, Visualization; J.Z.: Writing—review and editing; X.W.: Resources; L.S.: Investigation; Z.Z.: Data curation; T.X.: Project administration; X.Z.: Conceptualization; Validation; S.X.: Conceptualization, Funding acquisition, Visualization. All authors have read and agreed to the published version of the manuscript.

Funding

This work was supported by the Yunnan Provincial Department of Education Yunnan Plateau Lakes–North America Great Lakes International Joint Science and Technology Innovation Team and Yunnan Provincial Key Laboratory of River and Lake Ecological Health Assessment and Restoration in Universities.

Institutional Review Board Statement

Not applicable.

Data Availability Statement

All of the sample raw reads obtained in this study have been deposited at the National Center for Biotechnology Information (accession number: PRJNA1174696).

Acknowledgments

Our research team is committed to ecological health assessment and restoration of rivers and lakes and has formed a good cooperative relationship with many institutions (such as Nanjing University and Kunming Municipal Environmental Monitoring Center).

Conflicts of Interest

The authors declare that there are no conflicts of interest regarding the publication of this paper.

References

  1. Fisher, J.C.; Newton, R.J.; Dila, D.K.; McLellan, S.L. Urban microbial ecology of a freshwater estuary of Lake Michigan. Elementa 2015, 3, 000064. [Google Scholar] [CrossRef] [PubMed]
  2. Du, C.; Li, Y.; Wang, Q.; Liu, G.; Zheng, Z.; Mu, M.; Li, Y. Tempo-spatial dynamics of water quality and its response to river flow in estuary of Taihu Lake based on GOCI imagery. Environ. Sci. Pollut. Res. 2017, 24, 28079–28101. [Google Scholar] [CrossRef]
  3. Phlips, E.; Badylak, S.; Nelson, N.; Havens, K. Hurricanes, El Niño and Harmful Algal Blooms in Two Sub-Tropical Florida Estuaries: Direct and Indirect Impacts. Sci. Rep. 2020, 10, 1910. [Google Scholar] [CrossRef] [PubMed]
  4. Xia, W.; Rao, Q.; Deng, X.; Chen, J.; Xie, P. Rainfall is a Significant Environmental Factor of Microplastic Pollution in Inland Waters. Sci. Total Environ. 2020, 732, 139065. [Google Scholar] [CrossRef] [PubMed]
  5. Hu, B.T.; Liu, Y.H.; Chen, Y.X.; Yao, Y.P.; Liu, H.Y.; Wang, Z.S. Water quality and pollution source apportionment responses to rainfall in steppe lake estuaries: A case study of Hulun Lake in northern China. Ecol. Indic. 2024, 168, 112791. [Google Scholar] [CrossRef]
  6. Stephens, B.M.; Minor, E.C. DOM characteristics along the continuum from river to receiving basin: A comparison of freshwater and saline transects. Aquat. Sci. 2010, 72, 403–417. [Google Scholar] [CrossRef]
  7. Howell, E.T.; Chomicki, K.M.; Kaltenecker, G. Tributary discharge, lake circulation and lake biology as drivers of water quality in the Canadian Nearshore of Lake Ontario. J. Gt. Lakes Res. 2012, 38, 47–61. [Google Scholar] [CrossRef]
  8. Wu, X.; Zhu, Q.F.; Zhang, Y.; Wang, Y.C.; Dong, L. Causes of water quality fluctuation in Dianchi Lake in 2023 and corresponding measures. China Water Wastewater 2025, 41, 34–42. [Google Scholar]
  9. Lou, B.F.; Duan, Y.A.; Huang, J.; Yuan, S.B.; Yang, C.; Yu, M.X. Comprehensive diagnosis on eutrophication in Dianchi Lake. Yangtze River 2025, 56, 60–69. [Google Scholar]
  10. Wu, Y.; Zhang, H.F. Remote Sensing Estimation and Analysis of Evolutionary Characteristics of Water Volume Changes in Dianchi Lake. Water Resour. Power 2026, 9, 41–45. [Google Scholar]
  11. Hua, Y.X.; Pan, J.Z.; Du, J.S.; Li, Y.; Yang, Q.; Xu, S.; Huang, Y.H. Effects of the long-term ecological restoration in the eutrophic plateau shallow lake—A case study of Dabokou, Lake Dianchi. J. Lake Sci. 2023, 35, 1549–1561. [Google Scholar] [CrossRef]
  12. Havens, K.E. Lake eutrophication and plankton food webs. In Eutrophication: Causes, Consequences and Control; Springer: Dordrecht, The Netherlands, 2014; pp. 73–80. [Google Scholar]
  13. Karpowicz, M.; Kuczyńska-Kippen, N.; Sługocki, Ł.; Czerniawski, R.; Bogacka-Kapusta, E.; Ejsmont-Karabin, J. Zooplankton as indicators of lake trophic status: Novel universal metrics from 224 temperate lakes. Ecol. Indic. 2025, 179, 114236. [Google Scholar] [CrossRef]
  14. Bakhtiyar, Y.; Arafat, M.; Andrabi, S.; Tak, H. Zooplankton: The Significant Ecosystem Service Provider in Aquatic Environment. Bioremediat. Biotechnol. 2020, 3, 227–244. [Google Scholar] [CrossRef]
  15. Rosas, R.S.; Azevedo-Cutrim, A.C.G.; Cutrim, M.V.J.; da Cruz, Q.S.; Souza, D.S.C.; dos Santos Sá, A.K.D.; Oliveira, A.V.G.; Santos, T.P. Spatial heterogeneity of zooplankton community in an eutrophicated tropical estuary. Aquat. Sci. 2024, 86, 102. [Google Scholar] [CrossRef]
  16. Pawlowski, J.; Kelly-Quinn, M.; Altermatt, F.; Apothéloz-Perret-Gentil, L.; Beja, P.; Boggero, A.; Borja, A.; Bouchez, A.; Cordier, T.; Domaizon, I.; et al. The future of biotic indices in the ecogenomic era: Integrating (e)DNA metabarcoding in biological assessment of aquatic ecosystems. Sci. Total Environ. 2018, 637–638, 1295–1310. [Google Scholar] [CrossRef] [PubMed]
  17. Jo, T.; Yamanaka, H. Meta-analyses of environmental DNA downstream transport and deposition in relation to hydrogeography in riverine environments. Freshw. Biol. 2022, 67, 1333–1343. [Google Scholar] [CrossRef]
  18. Sahu, A.; Kumar, N.; Singh, C.; Singh, M. Environmental DNA (eDNA): Powerful Technique for Biodiversity Conservation. J. Nat. Conserv. 2023, 71, 126325. [Google Scholar] [CrossRef]
  19. Seymour, M.; Smith, A. Arctic char occurrence and abundance using environmental DNA. Freshw. Biol. 2023, 68, 781–789. [Google Scholar] [CrossRef]
  20. Li, L.; Wang, H.F.; Wang, S.R.; Zhang, R.; Jiao, L.X.; Ding, S.; Yu, Y.J. Spatial and Temporal Changes in Nitrogen Loading of Rivers into Dianchi Lake and Contributions of Different Components. Res. Environ. Sci. 2016, 29, 829–836. [Google Scholar]
  21. Minamoto, T.; Myia, M.; Sado, T.; Seino, S.; Uchii, K. An illustrated manual for environmental DNA research: Water sampling guidelines and experimental protocols. Environ. DNA 2020, 3, 8–13. [Google Scholar] [CrossRef]
  22. Currier, C.A. Detection of Four At-Risk Freshwater Pearly Mussel Species (Bivalvia: Unionoida: Unionidae) from Environmental DNA (eDNA). Master’s Thesis, Trent University, Peterborough, ON, Canada, 2017. [Google Scholar]
  23. Hajibabaei, M.; Porter, T.M.; Wright, M.; Rudar, J. COI metabarcoding primer choice affects richness and recovery of indicator taxa in freshwater systems. PLoS ONE 2019, 14, e0220953. [Google Scholar] [CrossRef] [PubMed]
  24. Folmer, O.; Black, M.; Hoeh, W.; Lutz, R.; Vrijenhoek, R. DNA primers for amplification of mitochondrial cytochrome c oxidase subunit I from diverse metazoan invertebrates. Mol. Mar. Biol. Biotechnol. 1994, 3, 294–299. [Google Scholar] [PubMed]
  25. Li, M.; Wei, T.T.; Shi, B.Y.; Hao, X.Y.; Xu, H.G.; Sun, H.Y. Biodiversity monitoring of freshwater benthic macroinvertebrates using environmental DNA. Biodivers. Sci. 2019, 27, 480–490. [Google Scholar] [CrossRef]
  26. Zhang, X.; Lv, J.T.; Yang, L.L.; Sun, Z.K.; Wang, Y.B.; Ding, P.; Wu, L.P.; Ding, C.; Mao, L.X.; Li, X. Molecular and phylogenetic characterization of Cryptosporidium by nested PCR based on SSU rRNA gene. J. Environ. Health 2019, 36, 511–514+565. [Google Scholar]
  27. Sigsgaard, E.E.; Torquato, F.; Froslev, T.G.; Moore, A.B.M.; Sørensen, J.M.; Range, P.; Ben-Hamadou, R.; Bach, S.S.; Møller, P.R.; Thomsen, P.F. Using vertebrate environmental DNA from seawater in biomonitoring of marine habitats. Conserv. Biol. 2020, 34, 697–710. [Google Scholar] [PubMed]
  28. Shu, L.; Lin, J.Y.; Xu, Y.; Cao, T.; Feng, J.M.; Peng, Z.G. Investigating The Fish Diversity in Erhai Lake Based On Environmental DNA Metabarcoding. Acta Hydrobiol. Sin. 2020, 44, 1080–1086. [Google Scholar]
  29. Morard, R.; Darling, K.F.; Mahé, F.; Audic, S.; Ujiié, Y.; Weiner, A.K.M.; André, A.; Seears, H.A.; Wade, C.M.; Quillévéré, F.; et al. PFR2: A curated database of planktonic foraminifera 18S ribosomal DNA as a resource for studies of plankton ecology, biogeography and evolution. Mol. Ecol. Resour. 2015, 15, 1472–1485. [Google Scholar] [CrossRef] [PubMed]
  30. Zhang, W.W.; Xie, Y.W.; Yang, J.H.; Yang, Y.N.; Li, D.; Zhang, Y.; Yu, H.X.; Zhang, X.W. Applications and Prospects of Metabarcoding in Environmental Monitoring of Phytoplankton Community. J. Ecotoxicol. 2017, 12, 15–24. [Google Scholar]
  31. Nilsson, R.H.; Ryberg, M.; Kristiansson, E.; Abarenkov, K.; Larsson, K.H.; Kõljalg, U. Taxonomic reliability of DNA sequences in public sequence databases: A fungal perspective. PLoS ONE 2006, 1, e59. [Google Scholar] [CrossRef]
  32. Leray, M.; Yang, J.Y.; Meyer, C.P.; Mills, S.C.; Agudelo, N.; Ranwez, V.; Boehm, J.T.; Machida, R.J. A new versatile primer set targeting a short fragment of the mitochondrial COI region for metabarcoding metazoan diversity: Application for characterizing coral reef fish gut contents. Front. Zool. 2013, 10, 34. [Google Scholar] [CrossRef] [PubMed]
  33. Shan, X.J.; Li, M.; Wang, W.J. Research Progress on the Application of Environmental DNA (eDNA) Technology in Aquatic Ecosystems. Fish. Sci. Prog. 2018, 39, 23–29. [Google Scholar]
  34. Zinger, L.; Bonin, A.; Alsos, I.G.; Bálint, M.; Bik, H.; Boyer, F.; Chariton, A.A.; Creer, S.; Coissac, E.; Deagle, B.E.; et al. DNA metabarcoding—Need for robust experimental designs to draw sound ecological conclusions. Mol. Ecol. 2019, 28, 1857–1862. [Google Scholar] [CrossRef] [PubMed]
  35. State Environmental Protection Administration. Water and Wastewater Monitoring and Analysis Methods; China Environmental Science Press: Beijing, China, 2002. [Google Scholar]
  36. Shannon, C.E. A mathematical theory of communication. Bell Syst. Tech. J. 1948, 27, 379–423. [Google Scholar] [CrossRef]
  37. Simpson, E.H. Measurement of diversity. Nature 1949, 163, 688. [Google Scholar] [CrossRef]
  38. Pielou, E.C. Species-diversity and pattern-diversity in the study of ecological succession. J. Theor. Biol. 1966, 10, 370–383. [Google Scholar] [CrossRef] [PubMed]
  39. Margalef, R. Information theory in ecology. Gen. Syst. 1958, 3, 36–71. [Google Scholar]
  40. Xia, Y.L.; Jun, S. Statistical testing of beta diversity. In Bioinformatic and Statistical Analysis of Microbiome Data: From Raw Sequences to Advanced Modeling with QIIME 2 and R; Springer International Publishing: Cham, Switzerland, 2023; pp. 397–433. [Google Scholar]
  41. Anderson, M.J. Permutational multivariate analysis of variance (PERMANOVA). In Wiley Statsref: Statistics Reference Online; Wiley: Hoboken, NJ, USA, 2014; pp. 1–15. [Google Scholar]
  42. Martinez Arbizu, P. pairwiseAdonis: Pairwise Multilevel Comparison Using Adonis, R package version 0.4; GitHub: San Francisco, CA, USA, 2020. [Google Scholar]
  43. Naimi, B.; Hamm, N.A.S.; Groen, T.A.; Skidmore, A.K.; Toxopeus, A.G. Where is positional uncertainty a problem for species distribution modelling? Ecography 2014, 37, 191–203. [Google Scholar]
  44. Legendre, P.; Gallagher, E.D. Ecologically meaningful transformations for ordination of species data. Oecologia 2001, 29, 271–280. [Google Scholar] [CrossRef]
  45. Sun, C.Q. Study on the Community Structure and Population Dynamics of Zooplankton in Dianchi Lake; Yunnan University: Kunming, China, 2010. [Google Scholar]
  46. Yang, J.J.; Chen, D.; Huang, L.C.; Li, Y.; Dong, J.Y.; Huang, C.; Wang, C.B.; Liu, Y.D.; Du, J.S.; Pan, M. Analysis of zooplankton community stability and its driving factors in different regions of Dianchi Lake. J. Lake Sci. 2023, 35, 1752–1766. [Google Scholar] [CrossRef]
  47. Dong, X.E.; Shen, L.Q.; Xiong, D.N.; Li, Q.; Zhang, J.; Zhao, Z.J. Seasonal succession of zooplankton community and influencing factors in Dianchi Lake. Yangtze River 2025, 56, 72–79. [Google Scholar]
  48. Gao, D.C.; Lü, X.J.; Yang, S.K.; Zhang, K.D.; Li, H.; Huang, M.Y.; Wei, Z.H. Study on the Seasonal Variation and Current Statusof Zooplankton in Erhai Lake. Environ. Sci. Guide 2021, 40, 1–6. [Google Scholar] [CrossRef]
  49. Moody, E.K.; Wilkinson, G.M. Functional shifts in lake zooplankton communities with hypereutrophication. Freshw. Biol. 2019, 64, 608–616. [Google Scholar] [CrossRef]
  50. Sommer, U.; Adrian, R.; De Senerpont Domis, L.; Elser, J.J.; Gaedke, U.; Ibelings, B.; Jeppesen, E.; Lürling, M.; Molinero, J.C.; Mooij, W.M.; et al. Beyond the Plankton Ecology Group (PEG) model: Mechanisms driving plankton succession. Annu. Rev. Ecol. Evol. Syst. 2012, 43, 429–448. [Google Scholar] [CrossRef]
  51. Xu, K.; Guo, X.T.; Chu, X.X.; Liu, M.X.; Yang, D.P.; Chen, Y.; Duan, G.Q.; Peng, J.F.; Li, Y.H. Eutrophication and seasonal changes drive differences in niche structure and stability of planktoniccommunities in plateau lakes. Acta Sci. Circumstantiae 2025, 46, 151–165. [Google Scholar]
  52. Elbrecht, V.; Leese, F. Validation and Development of COI Metabarcoding Primers for Freshwater Macroinvertebrate Bioassessment. Front. Environ. Sci. 2017, 5, 11. [Google Scholar] [CrossRef]
  53. Allan, E.A.; Zhang, W.G.; Lavery, A.C.; Govindarajan, A.F. Environmental DNA shedding and decay rates from diverse animal forms and thermal regimes. Environ. DNA 2021, 3, 492–514. [Google Scholar]
  54. Harrison, J.B.; Sunday, J.; Rogers, S. Predicting the fate of edna in the environment and implications for studying biodiversity. Proc. R. Soc. B 2019, 286, 20191409. [Google Scholar] [CrossRef] [PubMed]
  55. Matheson, C.D.; Gurney, C.; Esau, N.; Lehto, R. Assessing pcr inhibition from humic substances. Open Enzym. Inhib. J. 2010, 3, 38–45. [Google Scholar] [CrossRef]
  56. Deagle, B.E.; Jarman, S.N.; Coissac, E.; Pompanon, F.; Taberlet, P. DNA metabarcoding and the cytochrome c oxidase subunit I marker: Not a perfect match. Biol. Lett. 2014, 10, 20140562. [Google Scholar] [CrossRef] [PubMed]
  57. Tang, C.Q.; Leasi, F.; Obertegger, U.; Kieneke, A.; Barraclough, T.G.; Fontaneto, D. The widely used small subunit 18S rDNA molecule greatly underestimates true diversity in biodiversity surveys of the meiofauna. Proc. Natl. Acad. Sci. USA 2012, 109, 16208–16212. [Google Scholar] [CrossRef] [PubMed]
  58. Jiang, J.J.; Hu, W.; Ye, C.; Song, D.; Wang, Z.Y.; Li, C.H.; Li, J.; Tang, C. Succession and driving factors of Lake Dianchi aquatic ecosystem in the past 60 years. J. Environ. Eng. Technol. 2023, 13, 541–551. [Google Scholar]
  59. Huang, J.; Wang, Y.C.; Deng, X.Q.; Shi, Z.; Yang, C.Y. Characteristics of spatial and temporal variation of water quality andnutritional status in Dianchi Lake. Yangtze River 2022, 53, 61–67. [Google Scholar]
  60. ter Braak, C.J.F.; Verdonschot, P.F.M. Canonical correspondence analysis and related multivariate methods in aquatic ecology. Aquat. Sci. 1995, 57, 255–289. [Google Scholar] [CrossRef]
  61. Carpenter, S.R. Eutrophication of aquatic ecosystems: Bistability and soil phosphorus. Proc. Natl. Acad. Sci. USA 2005, 102, 10002–10005. [Google Scholar] [CrossRef] [PubMed]
Figure 1. Schematic diagram of sampling sites in the estuary of Lake Dianchi.
Diversity 18 00448 g001
Figure 2. Plot of PCR amplification results of zooplankton primers COI-LCO1490 -F and HCO2198-R. Note 1: Takara 50bp DNA Marker; 2: Primer negative control; 3–11: PCR products of COI-LCO1490-F and HCO2198-R primers at 10.
Diversity 18 00448 g002
Figure 3. Zooplankton abundance analysis in different estuaries. The abundance of zooplankton in different estuaries during the dry season (A) and the rainy season (B).
Diversity 18 00448 g003
Figure 4. Analysis of β-diversity of zooplankton communities in different estuaries of Lake Dianchi during the dry season (A) and the rainy season (B).
Diversity 18 00448 g004
Figure 5. Differences in zooplankton communities between dry and rainy periods in Lake Dianchi.
Diversity 18 00448 g005
Figure 6. Analysis of differences in concentrations of major stressors in different lake inlets.
Diversity 18 00448 g006
Figure 7. Redundancy analysis between zooplankton diversity and water quality during the dry season in Lake Dianchi.
Diversity 18 00448 g007
Figure 8. Redundancy analysis between zooplankton diversity and water quality during the rainy season in Lake Dianchi.
Diversity 18 00448 g008
Table 1. Types of sampled estuaries.
Types of EstuariesNames of EstuariesSampling SitesCoordinates
Urban-type EstuaryPanlong RiverD1102.6965′ E, 24.9596′ N
Urban-type EstuaryCailian RiverD3102.6649′ E, 24.9628′ N
Suburban-type EstuaryBaoxiang RiverD2102.7229′ E, 24.9247′ N
Suburban-type EstuaryLaoyu RiverD4102.7639′ E, 24.8263′ N
Suburban-type EstuaryDahe RiverD6102.7138′ E, 24.7734′ N
Suburban-type EstuaryDongda RiverD8102.6489′ E, 24.6700′ N
Agricultural-type EstuaryNanchong RiverD5102.7407′ E, 24.7795′ N
Agricultural-type EstuaryChaihe RiverD7102.6886′ E, 24.6916′ N
Agricultural-type EstuaryDachun RiverD9102.6358′ E, 24.6847′ N
Lake DianchiHeart of Lake DianchiD10102.6912′ E, 24.8020′ N
Table 2. Sequence list of zooplankton universal primer bases.
Primer NamePrimer SequenceReferences
COI-FGGWACWGGWTGAACWGTWTAYCCYCC[23]
MICOIint-RTAIACYTCIGGRTGICCRAARAAYCA
Folmer-FGGTCAACAAATCATAAAGAYATYGG[24]
Folmer-RTAAACTTCAGGGTGACCAAARAAYCA
COI-LCO1490-FGGTCAACAAATCATAAAGATATTGG[25]
HCO2198-RTAAACTTCAGGGTGACCAAAAAATCA
SUU-F04GCTTGTCTCAAAGATTAAGCC[26]
SUU-R22GCCTGCTGCCTTCCTTGGA
Table 3. PCR amplification system.
Reagent NameVolume/μL
Taq mix15
F1
R1
DNA template2
dd H2O11
Total30
Table 4. Water physicochemical indicators, analytical methods, standards and instruments.
Water Physicochemical IndicatorAnalytical Method & Standard CodeName of Analytical Instrument
Chemical Oxygen Demand (COD)Dichromate method (HJ 828-2017)HCA-101 Standard COD Digester (YETUO, Shanghai, China)
5-day Biochemical Oxygen Demand (BOD5)Dilution and seeding method (HJ 505-2009)LRH-250F Biochemical Incubator (YIHENG, Shanghai, China), burette
Total Phosphorus (TP)Ammonium molybdate spectrophotometric method (GB 11893-89)Model 722S Visible Spectrophotometer (LENGGUANG, Shanghai, China)
Total Nitrogen (TN)Alkaline potassium persulfate digestion-UV spectrophotometric method (HJ 636-2012)Model 752N UV-Vis Spectrophotometer (LEICI, Shanghai, China)
Ammonia Nitrogen (NH3-N)Nessler’s reagent spectrophotometric method (HJ 535-2009)Model 722S Visible Spectrophotometer (LENGGUANG, Shanghai, China)
Nitrate Nitrogen
(NO2-N)
Phenol disulfonic acid spectrophotometric method (GB 7480-87)Model 722S Visible Spectrophotometer (LENGGUANG, Shanghai, China)
pHElectrode method (GB 6920-1986)pH Meter (LICHEN, Hangzhou China)
Chlorophyll-a (Chl-a)DPD method (GB/T 5750-2006)Model 722S Visible Spectrophotometer (LENGGUANG, Shanghai, China)
ConductivityOhm’s law method (GB/T 11007-2008)Conductivity Meter (LICHEN, Hangzhou China)
Water TemperatureThermometer measurement method (GB/T 13195-1991)Calibrated Thermometer (HISENSE HAINUO, Qingdao, China)
Table 5. Zooplankton species list.
No.PhylumFamilyGenusSpeciesSites Recorded in MarchSites Recorded in July
1ArthropodaCyclopinidaeLimnoithonaLimnoithona tetraspinaD1D1,D2,D3,D4,D5,D6,D7,D8,D9,D10
2ArthropodaDiaptomidaeArctodiaptomusAglaodiaptomus clavipoides/D1,D2,D3,D4,D6,D7,D8,D9,D10
3ArthropodaDiaptomidaeArctodiaptomusArctodiaptomus sp.D1,D2,D3,D4,D5,D6,D7,D8,D9,D10D1,D2,D3,D4,D6,D7,D8,D9,D10
4ArthropodaCyclopidaeAcanthocyclopsAcanthocyclops viridisD1,D2,D4,D6,D7,D8,D9/
5ArthropodaCyclopidaeMacrocyclopsMacrocyclops albidusD1,D2,D5,D6,D7,D8,D9,D10D8
6ArthropodaCyclopidaeEucyclopsEucyclops macruroidesD1,D2,D3,D4,D5,D6,D7,D8,D9,D10D2,D8
7ArthropodaCyclopidaeEucyclopsEucyclops serrulatusD1,D2,D3,D4,D5,D6,D7,D8,D9,D10/
8ArthropodaCyclopidaeMesocyclopsMesocyclops sp.D2,D3,D4,D5,D7,D8,D9,D10D2,D3,D4,D6,D8,D9,D10
9ArthropodaParacalanidaeParacalanusParacalanus sp.D1,D2,D3,D4,D5,D6,D7,D8,D9,D10D2,D3
10ArthropodaChydoridaeAcroperusAcroperus harpaeD1,D2,D6,D7,D8D7
11ArthropodaChydoridaeChydorusChydorus sphaericusD1,D2,D7,D9D1,D2,D3,D4,D6,D7,D8,D9,D10
12ArthropodaDaphniidaeDaphniaDaphnia dentiferaD1,D2,D3,D4,D5,D6,D7,D8,D9,D10D1,D2,D3,D4,D6,D7,D8,D9,D10
13ArthropodaBosminidaeBosminaBosmina longirostrisD3,D9,D10D1,D2,D3,D4,D6,D7,D8,D9,D10
14RotiferaBrachionidaeBrachionusBrachionus rubensD2,D3,D4,D6,D7,D8,D9D1,D2,D3,D4,D6,D7,D8,D9,D10
15RotiferaBrachionidaeKeratellaKeratella quadrataD1,D2,D3,D4,D5,D6,D7,D8,D9,D10D1,D2,D3,D4,D6,D7,D8,D9
16RotiferaBrachionidaeMytilinaMytilina ventralisD1,D2,D3,D4,D5,D6,D8,D9,D10D3,D4,D6,D8,D9
17RotiferaFlosculariaceaePtyguraPtygura liberaD1,D2,D3,D4,D6,D7,D8,D9D1,D2,D3,D4,D6,D7,D8,D9,D10
18RotiferaGastropodidaeAscomorphaAscomorpha ovalisD1,D2,D3,D4,D5,D6,D7,D8,D9D1,D3,D4,D6,D7,D8,D9,D10
19RotiferaLecanidaeLecaneLecane bullaD1,D4,D6,D7,D8,D10D1,D2,D3,D6,D8
20RotiferaTestudinellidaeFiliniaFilinia longisetaD1,D8D1,D2,D3,D4,D6,D7,D8,D9,D10
21RotiferaEuchlanidaeEuchlanisEuchlanis dilatataD1,D2,D3,D4,D5,D6,D7,D8,D9,D10D1,D2,D3,D4,D6,D7,D8,D9,D10
22RotiferaSynchaetidaePolyarthraPolyarthra remataD1,D2,D3,D4,D5,D6,D7,D8,D9,D10D1,D2,D3,D4,D6,D7,D8,D9
23RotiferaSynchaetidaeSynchaetaSynchaeta tremulaD1,D2,D3,D4,D5,D6,D7,D8,D9,D10D3,D4,D6,D7,D8,D9
24RotiferaNotommatidaeCephalodellaCephalodella gibbaD1,D2,D3,D4,D5,D6,D7,D8,D9,D10D1,D2,D3,D4,D6,D7,D8,D9,D10
Table 6. Alpha diversity index of zooplankton at various monitoring sites in March during the dry season.
StationShannon IndexSimpson IndexPielou IndexMargalef Index
D11.760.430.761.27
D21.470.500.750.85
D30.880.140.351.16
D41.590.360.691.15
D51.080.220.490.97
D60.790.190.380.88
D71.310.200.511.23
D81.270.150.471.34
D90.340.090.131.27
D100.310.160.160.56
mean1.080.240.471.07
Table 7. Alpha diversity index of zooplankton at various monitoring sites in July during the rainy season.
StationShannon IndexSimpson IndexPielou IndexMargalef Index
D12.110.580.851.87
D22.270.560.862.30
D32.330.520.842.28
D42.130.410.772.23
D50.001.00//
D61.050.100.381.60
D71.930.570.841.77
D82.270.350.772.29
D91.470.220.531.58
D100.370.090.141.75
mean1.590.440.661.96
Disclaimer/Publisher’s Note: The statements, opinions and data contained in all publications are solely those of the individual author(s) and contributor(s) and not of MDPI and/or the editor(s). MDPI and/or the editor(s) disclaim responsibility for any injury to people or property resulting from any ideas, methods, instructions or products referred to in the content.