Article

A Temperature-Structured Cetacean Community and the Loss of Its Cold-Water Species from a Rapidly Warming Marginal Sea (The East Sea/Sea of Japan)


1
Cetacean Research Institute, National Institute of Fisheries Science, Ulsan 44780, Republic of Korea
2
Department of Environmental Engineering, College of Engineering, Keimyung University, Daegu 42601, Republic of Korea
*
Author to whom correspondence should be addressed.
Diversity 2026, 18(7), 422; https://doi.org/10.3390/d18070422
Submission received: 10 June 2026 / Revised: 8 July 2026 / Accepted: 9 July 2026 / Published: 14 July 2026
(This article belongs to the Section Marine Diversity)

Abstract

The East Sea (Sea of Japan) is one of the world’s most rapidly warming marginal seas, a sensitive setting in which to examine how cetacean communities are structured by, and respond to, ocean temperature. Using visual sighting records from line-transect surveys off the Korean east coast (2015–2024) and analyses designed to be robust to heterogeneous survey effort rather than to estimate abundance, we matched 177 sightings of six species to satellite sea-surface temperature (SST) and tested whether the species form distinct thermal guilds. Cold-water species (Dall’s porpoise and Pacific white-sided dolphin) occurred in water averaging 11.6 °C and warm-water species (common, Risso’s, and bottlenose dolphins and false killer whale) in water averaging 17.8 °C—a 6.2 °C separation that was highly significant, very large (Cohen’s d = 1.84), and independent of location, defining a temperature-structured community. Over the same period, spring regional mean SST rose about 2 °C (0.22 °C yr−1). Strikingly, the cold-water guild was absent during the spring surveys in 2022 and 2024: it was absent in the two warmest-spring years despite the highest survey effort and full spatial coverage, its encounter rate fell with spring SST (ρ = −0.78), and—unlike the warm-water guild, which persisted unchanged—its loss was guild-specific. National bycatch statistics and local knowledge independently corroborate this decline. A sharply temperature-structured community, rapid warming, and the guild-specific loss of cold-water species together indicate that climate-driven reorganization of this assemblage is already underway, underscoring the need for sustained, all-season monitoring.

1. Introduction

Ocean warming is reorganizing marine communities worldwide. As temperatures rise, species track their thermal niches, producing poleward range shifts, local changes in abundance, and turnover in community composition that have now been documented across many taxa and ocean regions [1,2,3,4]. As highly mobile endotherms near the top of marine food webs, cetaceans are expected to respond to such changes both directly, through their own thermal tolerances and habitat preferences, and indirectly, through shifts in the distribution and availability of their prey [5,6]. Documented and projected climate-driven distributional changes in cetaceans include poleward shifts and predicted range contractions for cold-water species, with non-tropical, shelf-associated species identified as particularly vulnerable [6,7].
Detecting such changes in cetaceans is difficult. Conventional abundance estimation from line-transect surveys requires substantial, well-standardized survey effort, and the resulting time series are often too short, too sparse, or too variable in coverage to resolve distributional trends [6,8]. As a result, studies of cetacean climate responses have increasingly drawn on alternative or complementary information—including stranding records and the relative composition of multi-source sighting data—to infer change where formal abundance estimation is not feasible [8,9]. A recurring and powerful pattern in this work is the relative increase in warm-water species and decline of cold-water species accompanying regional warming. In north-west Scotland, both stranding and sighting records showed the cold-water white-beaked dolphin declining and the warm-water common dolphin increasing as local waters warmed [9], and rapid restructuring of the odontocete community—poleward shifts and rising relative abundance of warm-water species—has been reported from the rapidly warming northeastern United States using stranding data [8].
The East Sea, a semi-enclosed marginal sea of the northwest Pacific, is an especially relevant setting for such questions. It is among the most rapidly warming marginal seas in the world, with long-term sea-surface temperature trends well above the global mean—about 2.5–2.6 times the global rate over recent decades, with the most pronounced ocean warming concentrated in the East Sea [10,11]. Its physical setting—the warm Tsushima Current flowing northward along the Korean coast, meeting colder waters of subpolar origin—produces strong thermal gradients and supports a cetacean fauna that spans warm-temperate to cold-temperate affinities [12,13]. The Korean East Sea thus contains species expected to respond in opposite directions to warming, making it well suited to examining whether community thermal structure and ongoing warming together set the stage for reorganization.
Here we use visual sighting data from line-transect surveys conducted off the Korean east coast over 2015–2024 to characterize the thermal structure of the small-cetacean community. Although the surveys were originally designed for abundance estimation, our objective was not to estimate population size but to evaluate thermal niche structure, community composition, and patterns of species occurrence in relation to environmental conditions. We therefore used the complete set of visual sightings, including secondary (off-transect) records, which are not used in conventional abundance estimation but provide valuable information on where and under what conditions species occur. This approach maximizes information on species occurrence across environmental gradients while remaining robust to heterogeneity in survey effort. Specifically, we (1) characterize the realized thermal niches of the constituent species by matching each sighting to satellite sea-surface temperature, and test whether the species form distinct thermal guilds—groups of species occupying similar temperature ranges; (2) quantify regional warming of the survey region from an effort-independent satellite time series; (3) describe the relative composition of the community; and (4) test whether changes in the occurrence of the cold-water guild over the study period are robust to survey effort, specific to that guild, and associated with temperature. By combining a quantitative, observation-based test of thermal niche structure with an independent measure of regional warming, and by interpreting recent changes in the cold-water guild alongside independent bycatch and local-knowledge evidence, we assess the exposure of this community to climate-driven reorganization—and whether that reorganization is already detectable—in one of the ocean’s fastest-warming regions.

2. Materials and Methods

2.1. Study Area

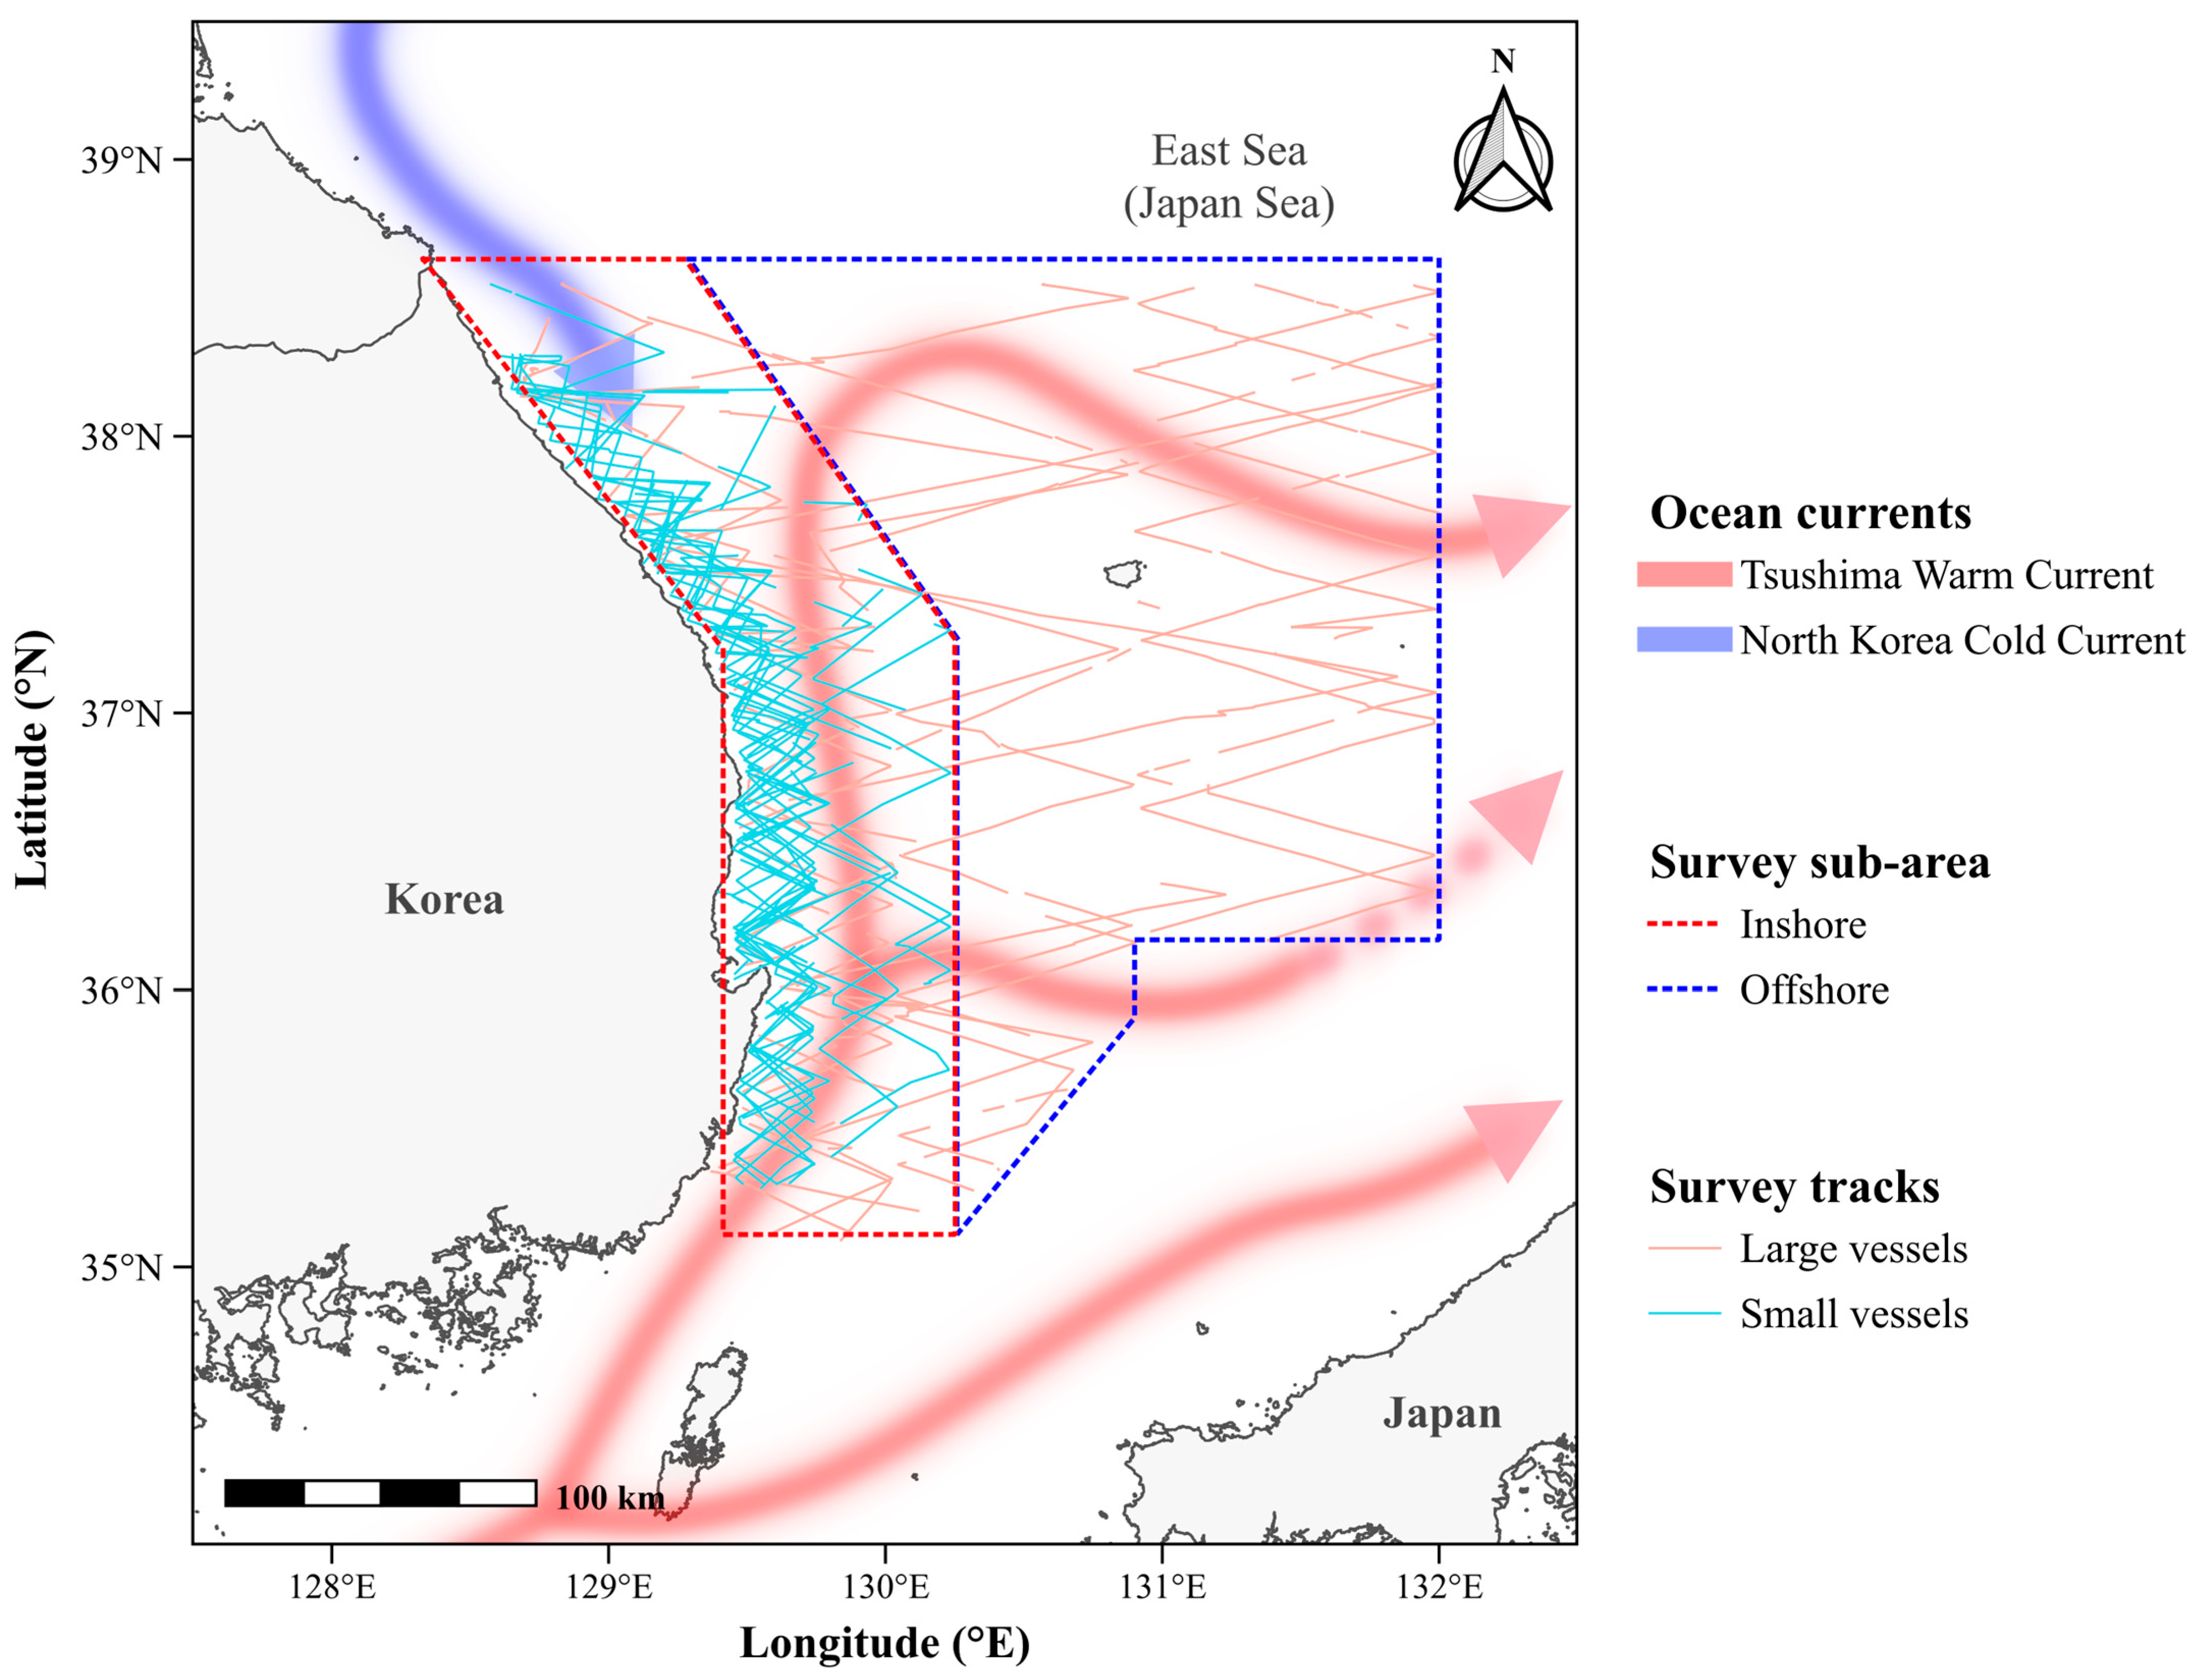
The study was conducted in the Korean waters of the East Sea, a semi-enclosed marginal sea of the northwest Pacific. The region is strongly influenced by the warm Tsushima Current, which enters through the Korea Strait and flows northward along the Korean coast, and by colder waters of subpolar origin further offshore and to the north; the resulting thermal gradients and frontal structures make it a biologically dynamic area for cetaceans [11]. The East Sea is also among the most rapidly warming marginal seas worldwide, with long-term sea-surface temperature (SST) trends reported at roughly two to four times the global mean rate [10,11]. Surveys covered both inshore (coastal) and offshore waters off the Korean east coast (35.1–38.6° N, 128.3–132.0° E; Figure 1). Dedicated cetacean sighting surveys have been conducted in Korean waters since 1999 [12].
Maps (Figure 1 and Figure 2) were produced in QGIS Desktop version 3.40.11 LTR (QGIS Association, Grüt, Switzerland).

2.2. Sighting Surveys

Cetacean sighting data were collected during line-transect visual surveys carried out by the Cetacean Research Institute (CRI) over 2015–2024. Surveys were conducted from two vessel platforms—small vessels and large research vessels—and, in some years, from aircraft. The spring large-vessel survey is the longest-running and core monitoring program of the institute. Transect lines followed a conventional shipboard line-transect design, laid out as randomized zig-zag tracks across the survey area (Figure 1). Each survey was staffed by four to six observers, most with at least two years of cetacean survey experience, and vessels travelled at a search speed of 9–12 knots. Observers searched with the naked eye and with 7×50 binoculars (Fujinon, Fujifilm Corporation, Tokyo, Japan; and Steiner, Steiner-Optik GmbH, Bayreuth, Germany). For each sighting, the platform, date, position (latitude/longitude), species, and group size were recorded, together with whether the detection was made during a primary survey effort (on the planned transect line) or secondary effort (off the planned transect, e.g., while transiting between lines). Survey effort was logged for each survey as the number of survey days and the distance surveyed (nautical miles).
The main survey program consisted of large-vessel surveys conducted in spring (April–June), the season when cetaceans are most frequently reported in Korean waters; small-vessel surveys were carried out intermittently, including some in late winter (February–March), when sea conditions less often permit survey operations. No surveys were conducted in 2018, 2021, or 2023. A summary of survey effort by year and platform is given in Table 1.

2.3. Data Selection and Thermal-Guild Classification

To obtain an internally consistent dataset, we restricted all analyses to vessel-based surveys (small and large vessels) and excluded aircraft surveys, because the detection characteristics, search speed, and spatial coverage of aerial surveys differ substantially from vessel surveys and are not directly comparable. Analyses were further restricted to odontocete and other cetacean species; the northern fur seal (Callorhinus ursinus), a pinniped with different at-sea detectability, was excluded. Two cetacean species that occur year-round throughout Korean waters and are not informative about thermal community structure—minke whale (Balaenoptera acutorostrata) and finless porpoise (Neophocaena asiaeorientalis)—were also excluded, as were four species recorded too rarely or with thermal affinities too uncertain to assign (fin whale, humpback whale, killer whale, and sperm whale). The full species inventory and the rationale for inclusion or exclusion are given in Table 2.
The six retained species were assigned to two thermal guilds—groups of species occupying similar temperature ranges—on the basis of their documented distributions and thermal preferences [7,14]. The cold-water guild comprised Dall’s porpoise (Phocoenoides dalli) and the Pacific white-sided dolphin (Lagenorhynchus obliquidens), both cold-temperate to subarctic North Pacific species; the warm-water guild comprised the common dolphin (Delphinus delphis), Risso’s dolphin (Grampus griseus), bottlenose dolphin (Tursiops truncatus), and false killer whale (Pseudorca crassidens), which are warm-temperate to tropical in affinity. This a priori classification was subsequently evaluated against the temperatures actually associated with sightings (Section 2.5).
The analyzed dataset comprised 178 sightings of the six guild species. Both primary (on-transect) and secondary (off-transect) sightings were retained because the analyses focused on species occurrence, thermal associations, and community composition rather than density estimation. Retaining all sightings maximizes information on species–environment relationships across the surveyed region and captures a broader range of environmental conditions than the subset of detections typically used for abundance estimation. The response variable for community-composition analyses was the number of sighting events (encounters) rather than the number of individuals, because several species form large and highly variable aggregations (e.g., Pacific white-sided dolphin and common dolphin groups comprising hundreds of animals). Using encounter frequency therefore reduces the disproportionate influence of a small number of exceptionally large groups and provides a more stable measure of relative community composition.

2.4. Sea-Surface Temperature

To characterize the thermal conditions associated with each species, we matched every sighting to satellite SST from the National Oceanic and Atmospheric Administration (NOAA) Optimum Interpolation SST (OISST) v2.1 daily product (0.25° resolution) [15,16]. For each sighting we extracted SST at the sighting coordinate for a seven-day window centered on the sighting date (±3 days) and took the mean, yielding a “weekly” SST that is more stable than a single-day value against short-term cloud and diurnal effects. SST could be matched for 177 of the 178 sightings: 1 common dolphin record for which no OISST field was retrievable within its window was omitted, leaving 177 sightings (mean 6.9 of 7 days available per window). Because this metric characterizes the thermal conditions associated with species occurrences rather than the frequency of detections, it is inherently less sensitive to variation in survey effort, survey platform, and spatial coverage than metrics based on sighting counts or abundance.
To quantify warming of the survey region independently of where and when surveys were conducted, we computed a regional mean SST series. For each year of 2015–2024—including the three years without cetacean surveys—we sampled OISST over a fixed box (128–132° E, 35–39° N) at a regular five-day interval through the spring season (April–June) and averaged the box-mean values. Because this series is sampled on an identical spatial and temporal grid every year, it is independent of survey effort and provides a benchmark against which the trend in SST-at-sightings can be interpreted. To test the seasonal specificity of the cold-water guild’s occurrence (Section 3.5), we computed a winter (January–March) regional mean SST series for the same box, grid, and five-day cadence, so that spring and winter series are directly comparable.

2.5. Statistical Analysis

All analyses were performed in Rversion 4.5.3 (R Foundation for Statistical Computing, Vienna, Austria) [17]. Two-sided tests and a significance threshold of α = 0.05 were used throughout. Differences in SST-at-sighting between the cold- and warm-water guilds were tested with Welch’s unequal-variance t-test and, because the warm-water guild sample was larger and right-skewed, the non-parametric Wilcoxon rank-sum test; effect size was quantified with Cohen’s d. To confirm that any separation was not an artefact of where surveys were conducted, we fitted a two-way analysis of variance (ANOVA) with guild and survey sub-area (inshore/offshore) as factors, including their interaction. Thermal niche overlap between guilds, and between all species pairs, was quantified with the overlapping coefficient (OVL), the area shared by two kernel-density distributions (ranging from 0, no overlap, to 1, identical distributions); per-species overlap with the opposing guild was computed to identify species responsible for any blurring of the guild boundary.
Because the guilds were defined a priori, we also examined whether two thermal groupings were supported by the data without that assumption: we applied Hartigan’s dip test for unimodality to the pooled SST distribution and fitted a univariate Gaussian mixture model using the mclust package version 6.1.2 (Mclust function, evaluating one to three components by BIC) [18], comparing the resulting clusters with the a priori guild assignment. To evaluate the robustness of the thermal-guild separation, all guild-separation statistics were recomputed after excluding the warmest Pacific white-sided dolphin sighting. This sensitivity analysis allowed us to assess whether the observed guild differences depended disproportionately on a single record. The trend in spring regional mean SST over 2015–2024 was tested with ordinary least-squares linear regression and, as a distribution-free confirmation, the Mann–Kendall trend test. Guild composition was summarized as the proportion of guild-species encounters attributable to the warm-water guild, computed overall and within the consistently surveyed spring (April–June) window; because cold-water guild species in this region occur mainly in the coldest months while survey effort was concentrated in spring, year-to-year composition is reported descriptively and is not interpreted as a temporal trend (see Discussion). To assess the temporal change in the cold-water guild (Section 3.5), we computed an effort-normalized encounter rate for each guild and surveyed year (sightings per 1000 nmi, using the logged survey distance) and related these rates to spring and winter regional mean SST with Spearman rank correlation; the same procedure was applied to the warm-water guild as a specificity control. Because only seven years were surveyed, these tests are interpreted alongside the effort and spatial-coverage information for each year rather than in isolation.

3. Results

3.1. Thermal Partitioning Between Cold- and Warm-Water Guilds

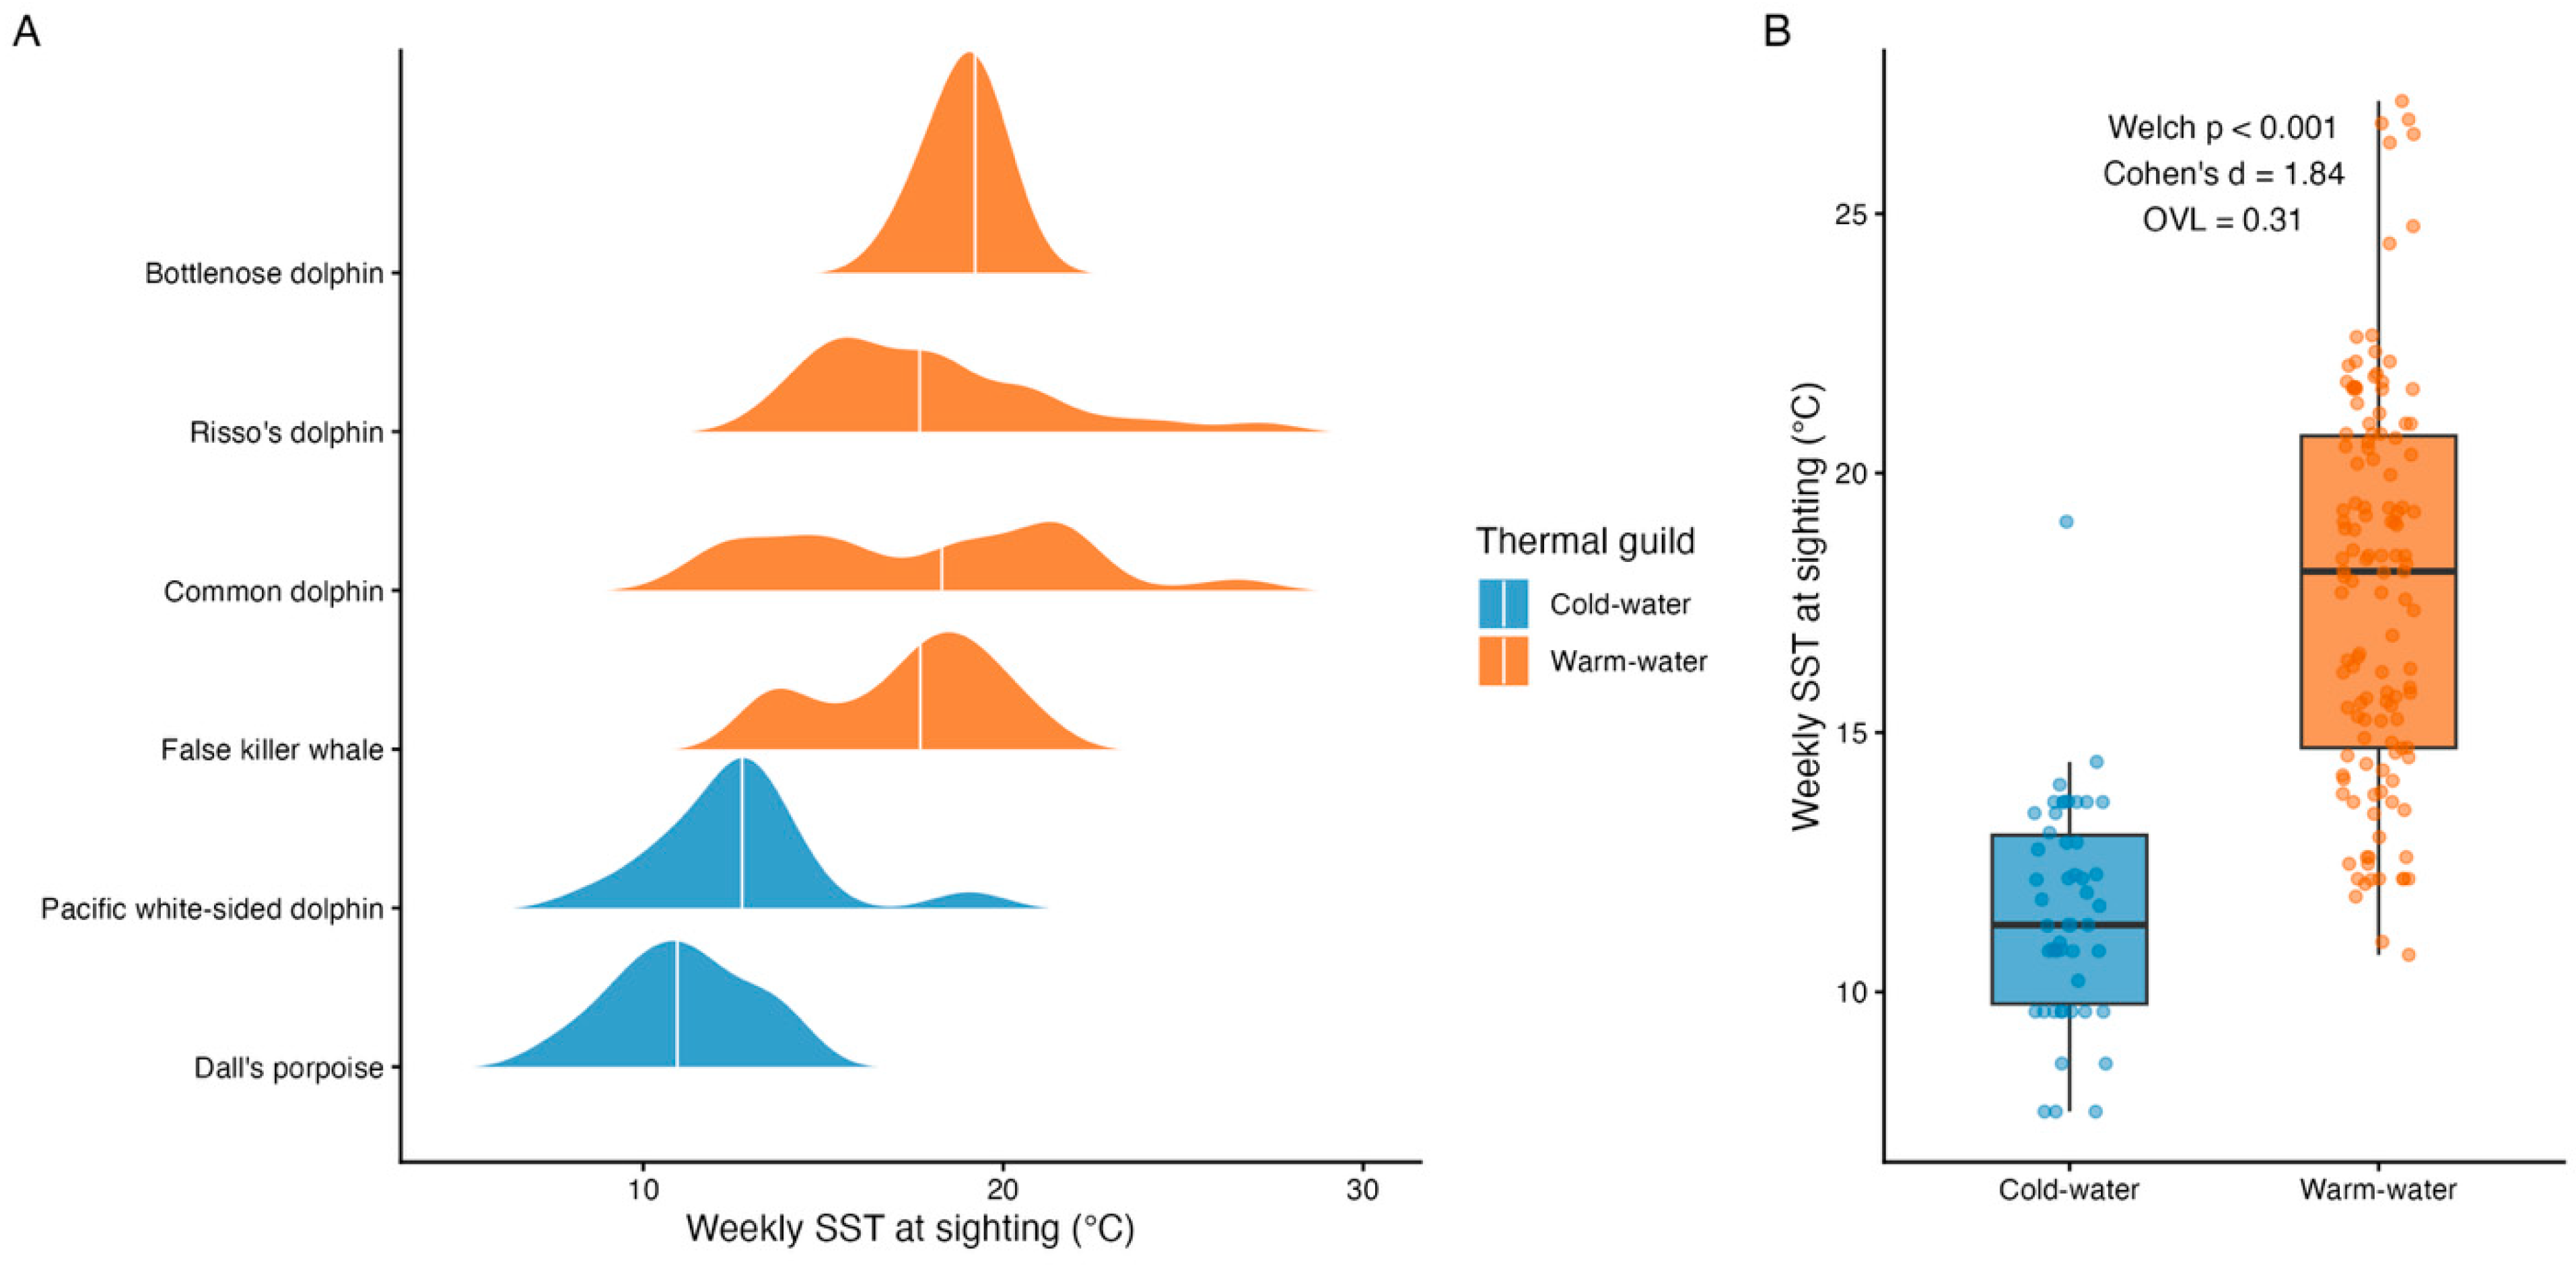
Weekly SST at the location and time of each sighting was obtained for 177 of 178 small-cetacean encounters recorded during vessel-based surveys (1 common dolphin record was excluded because no OISST field could be matched within its ±3-day window). The six species spanned a realized thermal range of roughly 8–27 °C and were arranged along a clear temperature gradient, from Dall’s porpoise at the cold extreme (mean 11.1 °C) to the bottlenose dolphin at the warm extreme (mean 18.9 °C) (Table 3; Figure 2A).
Grouping species into the two a priori thermal guilds, cold-water species (Dall’s porpoise, Pacific white-sided dolphin; n = 50) were sighted in water averaging 11.6 °C, whereas warm-water species (false killer whale, common dolphin, Risso’s dolphin, bottlenose dolphin; n = 127) were sighted in water averaging 17.8 °C—a difference of 6.2 °C. The separation was highly significant under both a Welch t-test (t = 13.9, df = 155, p < 10−28) and a non-parametric Wilcoxon rank-sum test (p < 10−18), and the effect size was very large (Cohen’s d = 1.84). The difference was independent of survey sub-area: in a two-way ANOVA, guild strongly predicted SST (F = 121, p < 10−15) whereas inshore/offshore stratum did not (F = 0.33, p = 0.57), confirming that the thermal signal is not an artefact of where surveys were conducted. The guild × area interaction was statistically significant but small (F = 5.6, p = 0.019), indicating that the size of the guild gap differed slightly between strata without reversing its direction.

3.2. Evidence of Structural Separation Between Cold- and Warm-Water Guilds

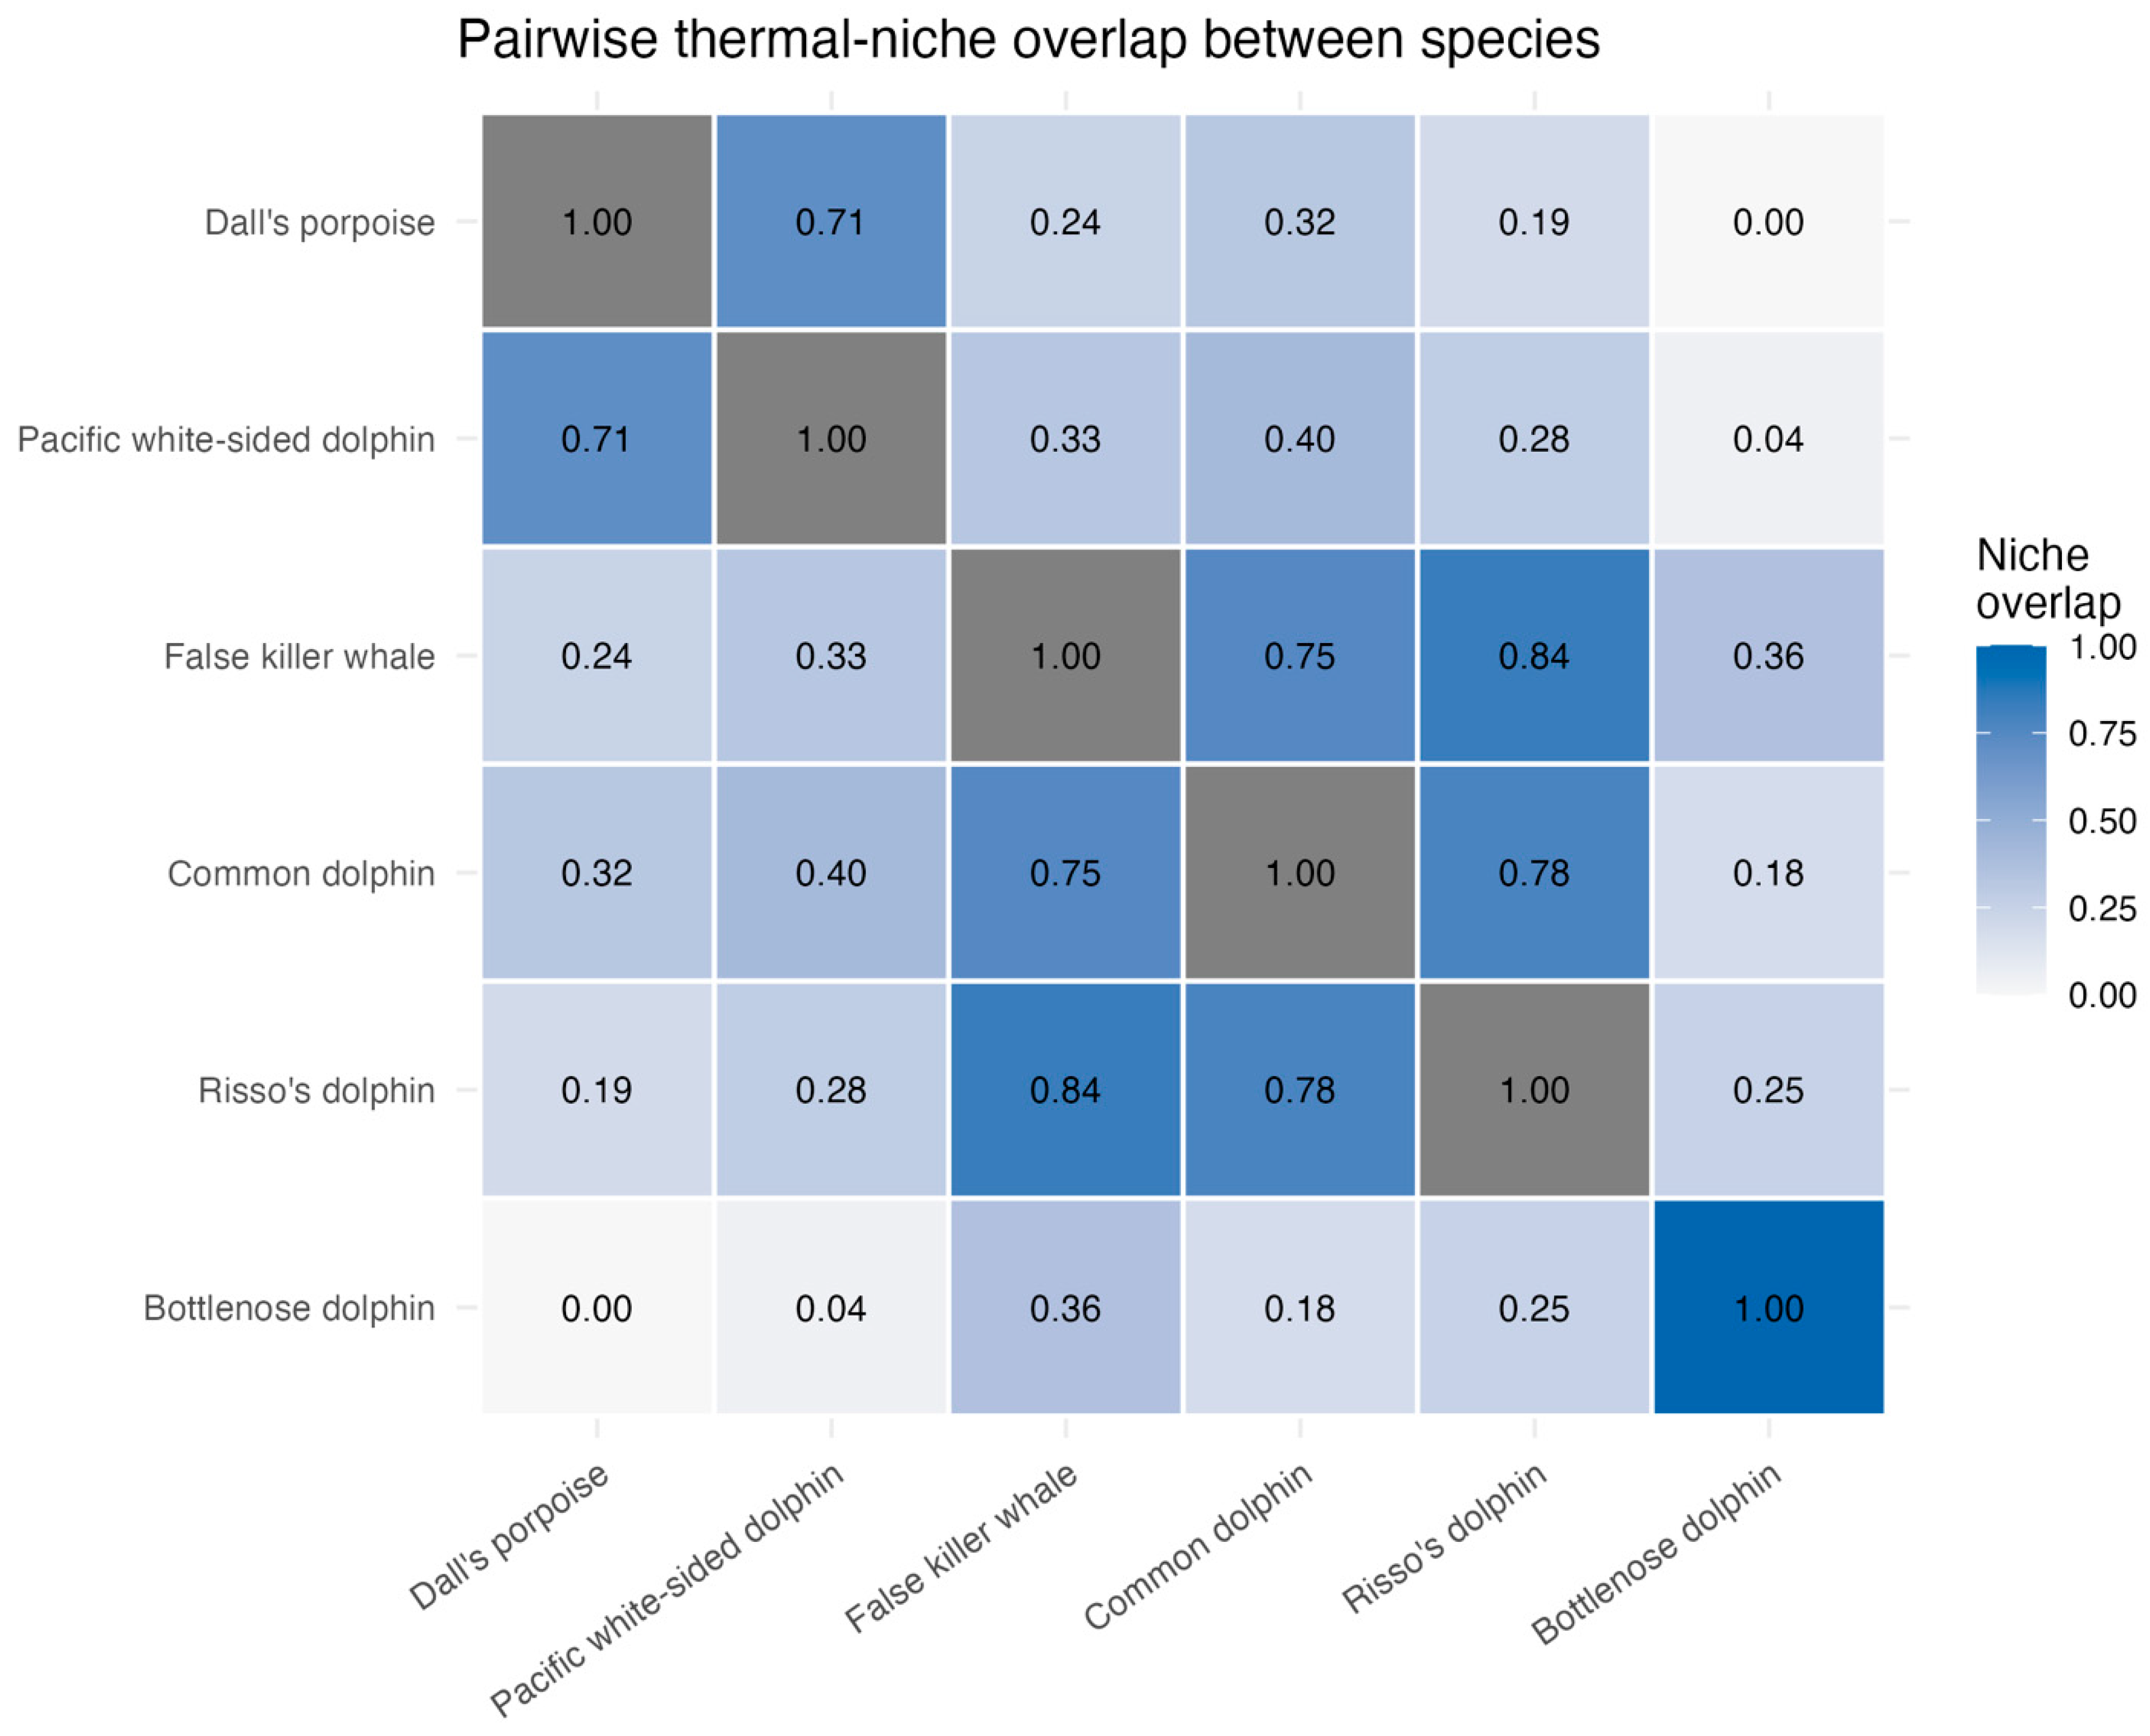
We deliberately tested whether this two-guild description was imposed rather than supported by the data. The pooled distribution of sighting SST was not statistically distinguishable from unimodal (Hartigan’s dip test, D = 0.031, p = 0.25), reflecting the larger and more dispersed warm-water guild sample and a continuous gradient between the groups rather than two cleanly separated peaks. However, an unsupervised Gaussian mixture model selected a two-component solution (Mclust, G = 2), and the guild structure was clearly expressed at the level of between-species niche overlap. Pairwise overlap (OVL) averaged 0.55 among species within the same guild but only 0.23 among species in different guilds—a more than two-fold contrast (Figure 3). The strongest pairwise overlaps were all within guilds (Dall’s porpoise–Pacific white-sided dolphin OVL = 0.71; false killer whale–Risso’s dolphin OVL = 0.84; common–Risso’s OVL = 0.78), whereas the cold and warm extremes did not overlap at all (Dall’s porpoise–bottlenose dolphin OVL = 0.00). Thus, although the community occupies a continuous thermal gradient, species are structured into two thermally distinct assemblages.
Overall overlap between the two guilds was moderate (OVL = 0.31), and this residual overlap was concentrated in two species: Pacific white-sided dolphin (overlap with the opposite guild = 0.36) and common dolphin (0.35). The common dolphin in particular was recorded across a broad thermal range, extending into cooler water and accounting for much of the blurring between guilds, consistent with its recognized status as a thermally generalist species. By contrast, the bottlenose dolphin showed almost no overlap with the cold-water guild (0.01), behaving as a warm-water specialist. A single atypical record—a Pacific white-sided dolphin sighted in warm summer water (20 July 2015, ~19 °C)—lay well outside the cold-water guild’s otherwise cool niche. Critically, the guild separation remained highly significant and very large even with this record included (guild difference 6.2 °C, Welch p < 10−28, Cohen’s d = 1.84, guild OVL = 0.31), demonstrating that the result does not depend on excluding it; removing the record, as expected, strengthened the separation only marginally (guild difference 6.4 °C, Welch p < 10−32, Cohen’s d = 1.91, guild OVL = 0.28). We therefore retained the full dataset (n = 177) for the analyses reported above.

3.3. Rapid Background Warming of the Survey Region

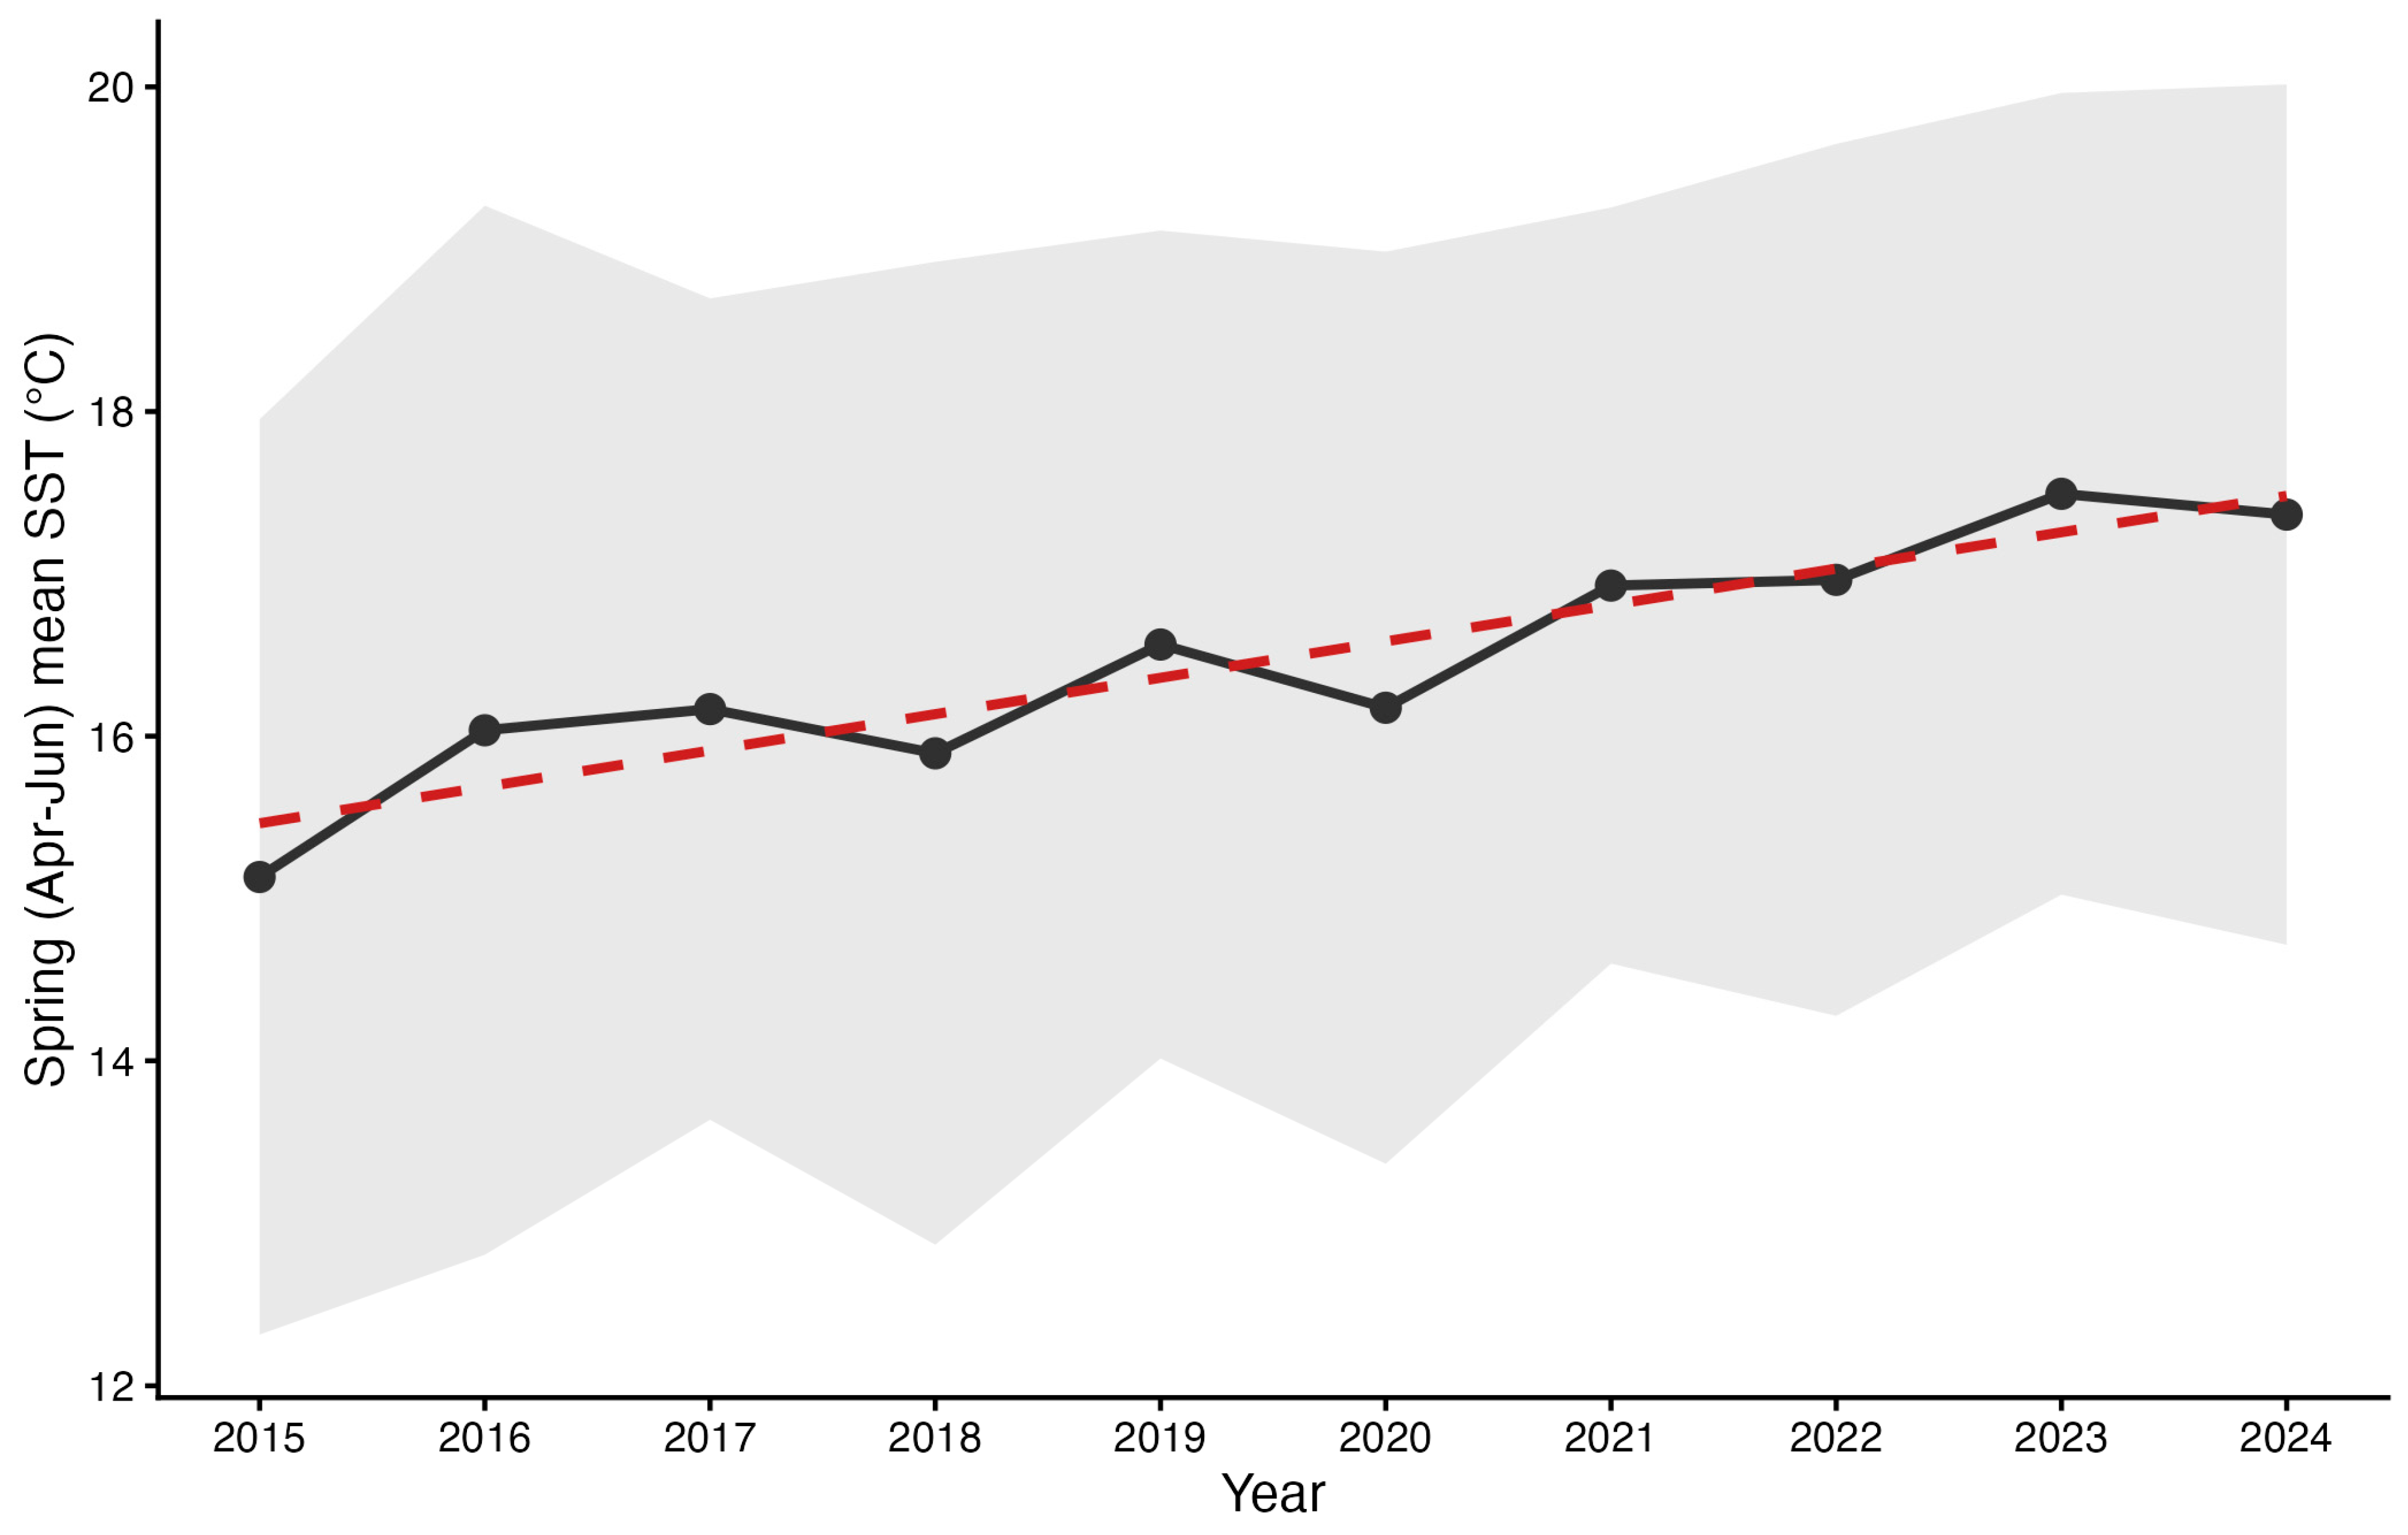
To assess whether the thermal environment of the survey region changed during 2015–2024, we computed spring (April–June) mean SST over a fixed East Sea box (128–132° E, 35–39° N) from OISST v2.1, sampled identically every year and therefore independent of survey effort. Spring SST rose from 15.1 °C in 2015 to 17.4 °C in 2024, an increase of approximately 2.0 °C over nine years (Figure 4). The trend was strong and statistically significant under both a linear regression (slope = 0.22 °C yr−1, R2 = 0.86, p < 0.001) and a non-parametric Mann–Kendall test (Z = 3.22, p = 0.001). A warming rate of ~0.22 °C yr−1 is faster than the global mean rate of ocean-surface warming. The East Sea is recognized as one of the fastest-warming marginal seas, with long-term SST trends reported at roughly 2–4 times the global mean rate [10] and, in Korean waters specifically, about 2.5–2.6 times the global rate with the most pronounced warming concentrated in the East Sea [11]. Our short, spring-only estimate is steeper than these long-term annual means, as expected for a seasonal, decadal-scale window, but is fully consistent with the region’s recognized rapid-warming status.

3.4. Warm-Water Species Dominate the Community

Across all vessel surveys, the cetacean community was numerically dominated by warm-water species. Of 179 cold/warm-water guild encounters, 128 (71.5%) were warm-water guild species and 51 (28.5%) cold-water guild; in the consistently surveyed spring window the warm-water guild share was similar (77.5%). The warm-water guild was also richer, comprising four species (the common dolphin, Risso’s dolphin, false killer whale, and bottlenose dolphin) against two in the cold-water guild (Dall’s porpoise and the Pacific white-sided dolphin), with common dolphin the single most frequently encountered species.
Year-to-year variation in guild composition was substantial. Cold-guild species in the East Sea occur mainly in the coldest months (roughly January–May for the Pacific white-sided dolphin, and January–February for Dall’s porpoise), and survey effort was concentrated in spring (April–June); raw composition is therefore reported descriptively. However, the most striking temporal pattern—the disappearance of the cold-water guild in the most recent years—proved robust to survey effort and specific to that guild, as shown next (Section 3.5).

3.5. Disappearance of the Cold-Water Guild and Its Association with Spring Warming

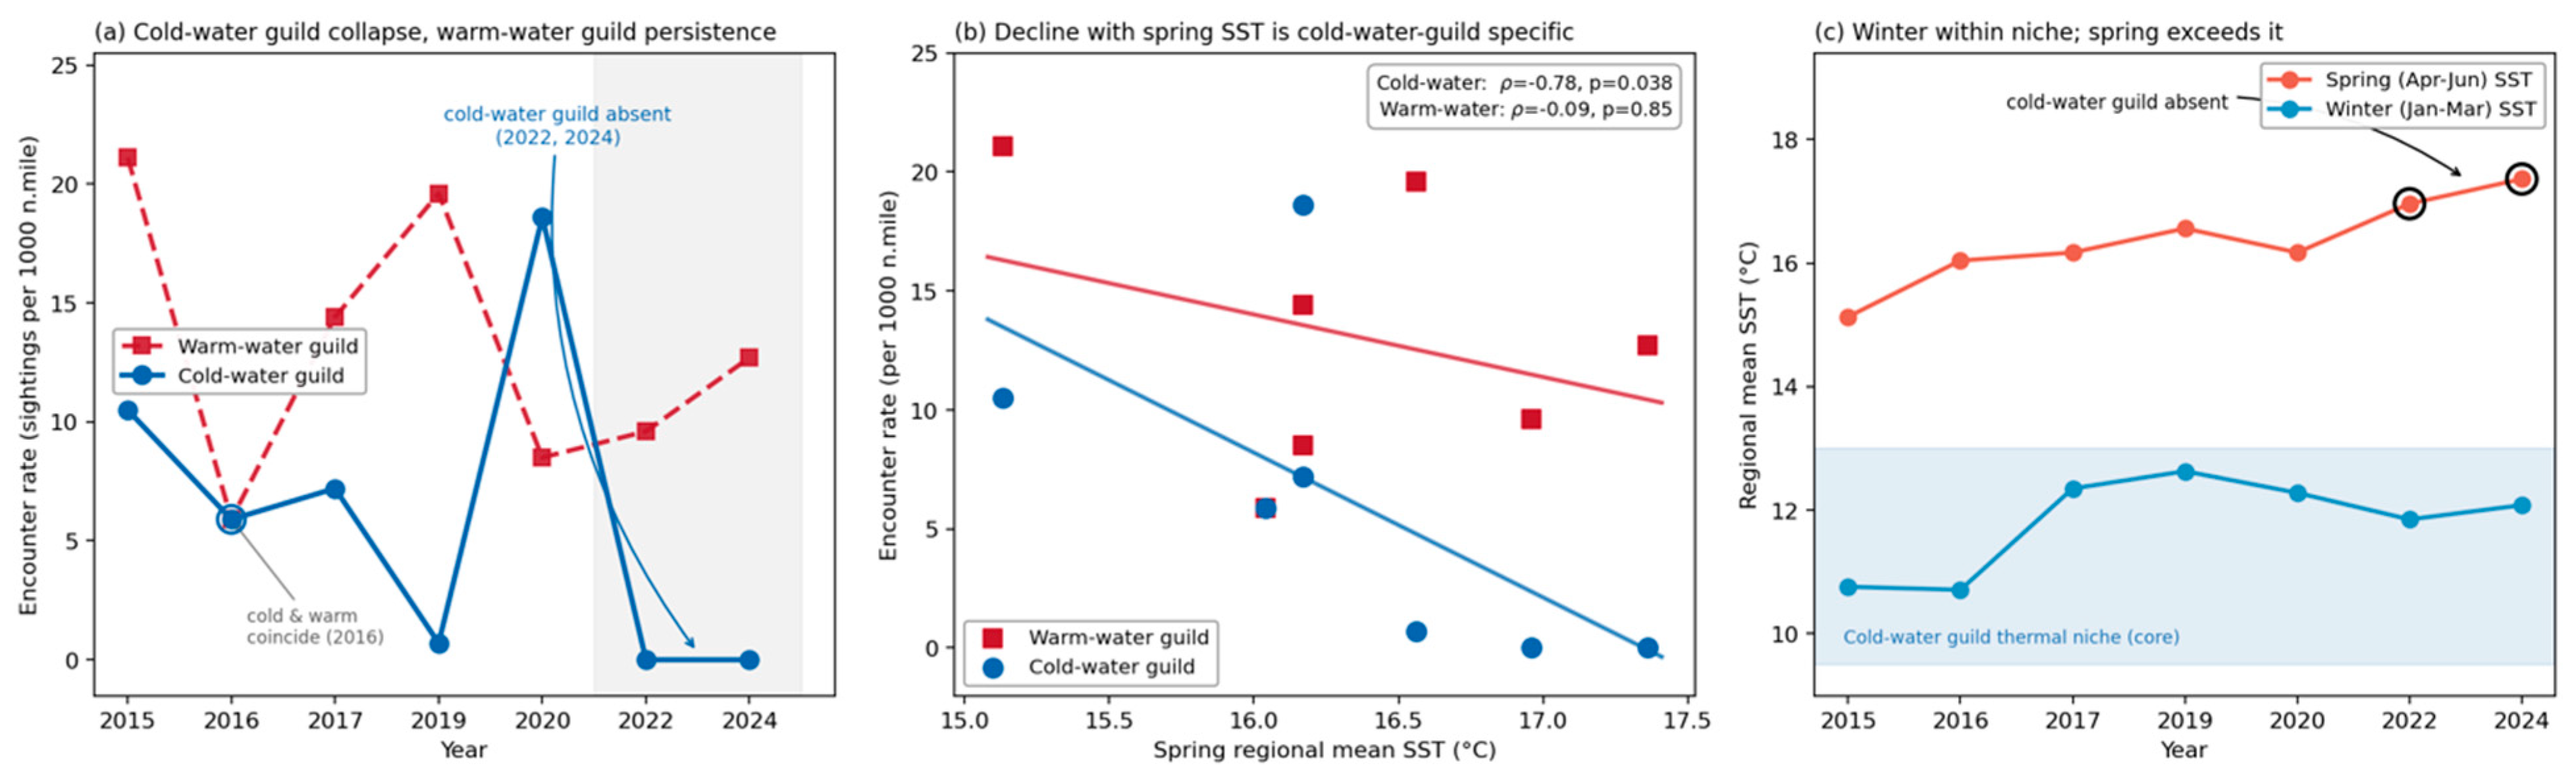
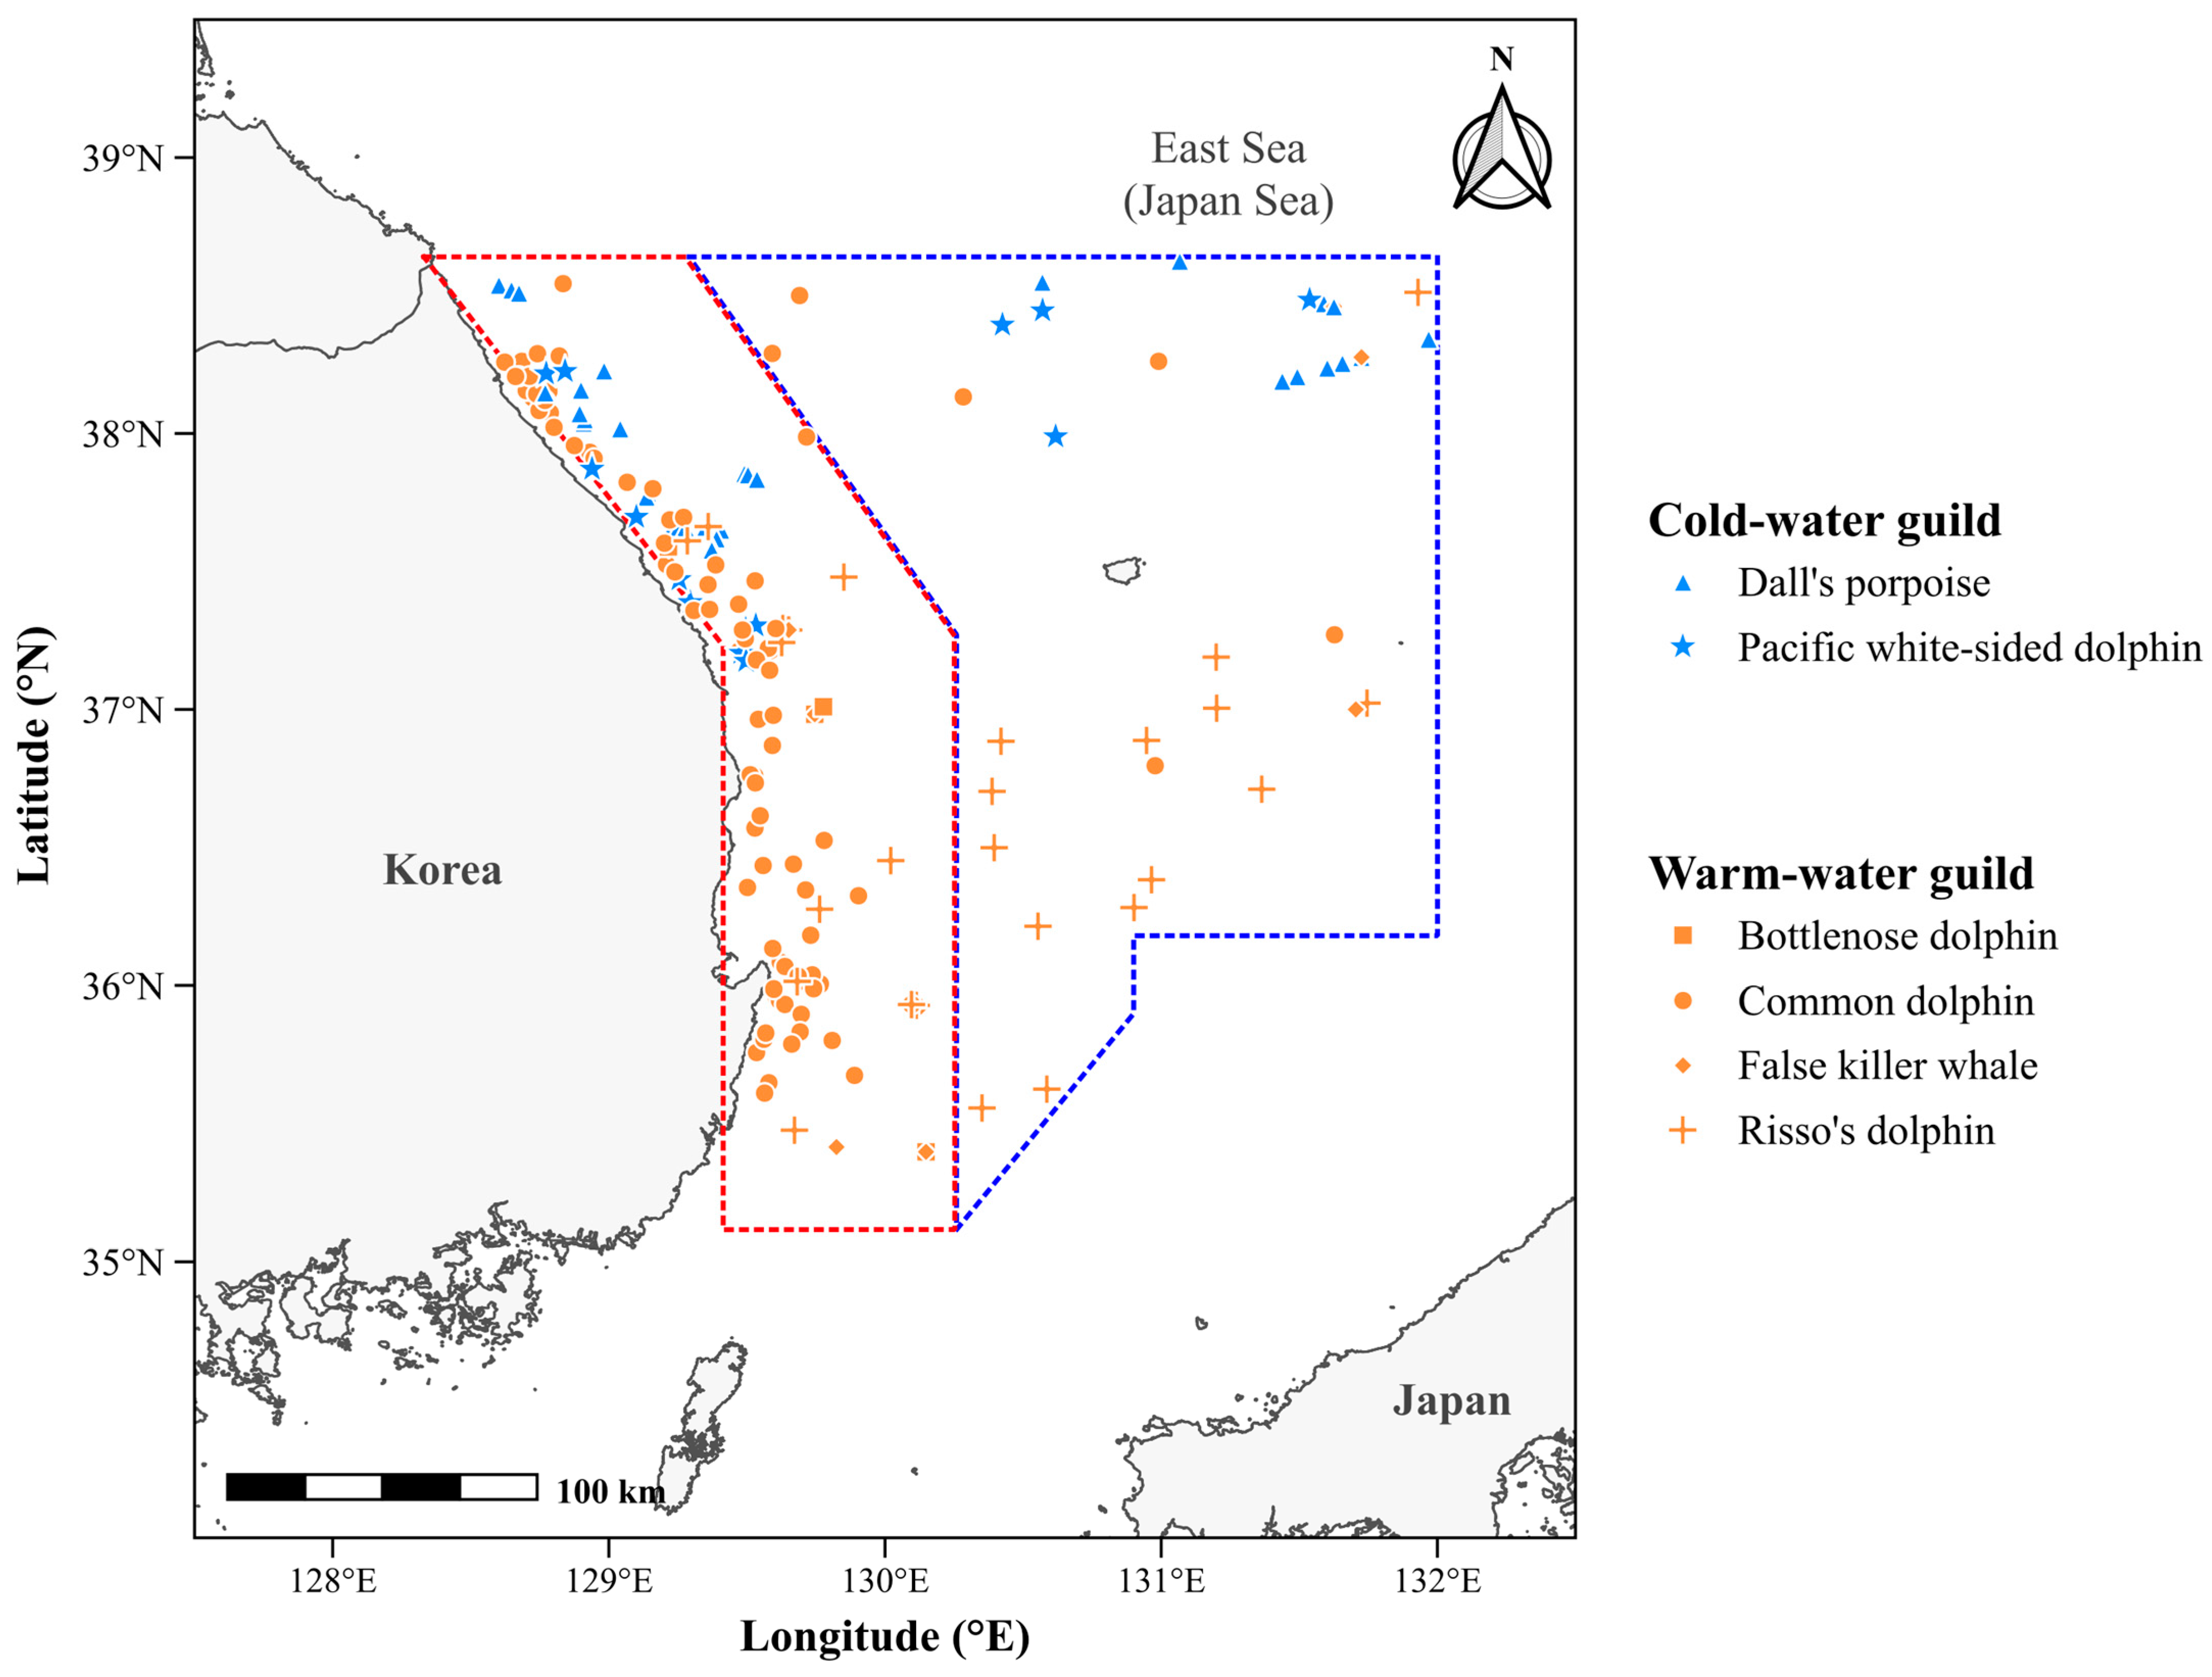
Although the heterogeneous, spring-concentrated survey effort precludes a formal abundance trend, one temporal pattern was pronounced and proved robust to effort: the cold-water guild disappeared from the surveys in the most recent years. Cold-guild species were recorded in every surveyed year from 2015 to 2020 (16, 4, 8, 1, and 22 encounters in 2015, 2016, 2017, 2019, and 2020, respectively) but were entirely absent in 2022 and 2024 (Figure 5a). This absence is not attributable to reduced or mislocated effort: 2022 carried the highest survey effort of any year in the series (≈2200 nmi), and both 2022 and 2024 surveyed the northern coastal and offshore waters (≥37.2° N) where the cold-water guild had previously been concentrated (Figure 6). Other cetaceans, including warm-water guild dolphins, continued to be sighted in those northern waters in both years (21 and 18 warm-water encounters in 2022 and 2024), confirming that the cold-water guild’s absence reflects a real change in occurrence rather than a gap in survey coverage. Expressed as an effort-normalized encounter rate (sightings per 1000 nmi), the cold-water guild rate fell from 10–19 per 1000 nmi in 2015–2020 to 0 in 2022 and 2024, while the warm-water guild rate remained within its usual range (Figure 5a).
The decline was associated with spring temperature and was specific to the cold-water guild. Across surveyed years, the cold-water guild encounter rate was strongly negatively correlated with spring regional mean SST (Spearman ρ = −0.78, p = 0.038), whereas the warm-water guild rate showed no such relationship (ρ = −0.09, p = 0.85) (Figure 5b). The two years without any cold-water guild sighting were the two warmest springs in the series (16.96 °C in 2022 and 17.36 °C in 2024), both warmer than any year in which the cold-water guild was present (≤16.56 °C); cold-water guild presence and absence were thus completely separated by spring SST at approximately 16.8 °C. Because the warm-water guild—surveyed by the identical effort in the same years and waters—showed neither a decline nor an association with SST, the pattern cannot be explained by a survey-wide change in detectability or coverage.
This association was confined to spring. Winter (January–March) regional mean SST, sampled identically across years, showed no separation between cold-water guild-present and cold-water guild-absent years (present years 10.7–12.6 °C; absent years 11.8–12.1 °C; ρ = −0.14, p = 0.77). This contrast is consistent with the realized thermal niche of the guild (Section 3.1): winter SST remained within the cold-water guild’s occupied temperature range (core niche ≈ 9–13 °C) in every year, so winters offered thermally suitable conditions throughout, whereas spring SST exceeded the cold-water guild niche by 3–6 °C in every year and did so most strongly in the two absence years (Figure 5c). The cold-water guild signal therefore emerges specifically when and where ambient temperature departs from the guild’s niche—in spring—and not in winter, when conditions remain suitable.

4. Discussion

4.1. A Temperature-Structured Community

The clearest result of this study is that the small-cetacean community of the Korean East Sea separates into two thermal guilds whose realized niches differ by more than 6 °C. This separation was large, statistically robust, and—importantly—independent of whether sightings were made inshore or offshore, indicating that it reflects the temperatures at which species occur rather than the spatial pattern of survey effort. The species occupied distinguishable thermal envelopes along the strong temperature gradients of the East Sea, consistent with the documented thermal preferences of these species and with temperature-based summer habitat partitioning reported for co-occurring delphinids elsewhere: around the United Kingdom, sea-surface temperature is the primary variable separating the occurrence of white-beaked and common dolphins, the cooler- and warmer-affiliated species, respectively [14]. Sea-surface temperature is likewise a leading predictor of habitat suitability across a suite of sympatric delphinids in the western North Atlantic, with species segregating along thermal gradients [19]. These cases show that temperature structures delphinid communities in other systems, as we find in the East Sea. We note, however, that the identity of the species occupying each thermal position is region-specific: a species’ realized thermal affiliation reflects the local species pool and the local range of conditions, so the same species need not fall in the same guild across ocean basins.
The boundary between guilds was structural rather than a matter of two cleanly separated peaks. Between-species niche overlap was more than twice as high within guilds as between them, and an unsupervised Gaussian mixture model recovered two components, yet the pooled distribution was not formally bimodal. This apparent tension is resolved by the behavior of individual species: the residual between-guild overlap was concentrated in the common dolphin, a thermally generalist, widely distributed species recorded here across a broad temperature range, with the Pacific white-sided dolphin contributing secondarily. In Korean waters the common dolphin’s range is centered on the comparatively warm coastal East Sea and it is absent from the colder, shallower Yellow Sea, consistent with a warm-affiliated thermal preference [20]. The warm extreme, by contrast, was anchored by the bottlenose dolphin, which behaved as a thermal specialist with essentially no overlap into cool water. A community can therefore be strongly temperature-structured at the guild level while still spanning a continuous thermal gradient, because one or two eurythermal species bridge the gap.

4.2. Rapid Warming and Exposure to Reorganization

Over the same period, the survey region warmed rapidly: spring regional mean SST rose by about 2 °C in nine years. Although this short, seasonal estimate is steeper than long-term annual means, its direction and steepness are fully consistent with the East Sea’s recognized status as one of the most rapidly warming marginal seas, where decadal SST trends run at about 2.5–2.6 times the global mean and the most pronounced warming is concentrated in the East Sea [10,11]. Notably, regional analyses indicate that since the 2010s the summer warming trend in Korean waters has overtaken the winter trend, driven in part by a strengthened summer Tsushima Warm Current [11]; our steep spring warming is consistent with this recent, warm-season-led intensification. This warming has a clear spatial expression: satellite analysis over 2000–2024 shows East Sea isotherms migrating northward at a mean ocean climate velocity of about 67 km decade−1—roughly 2.5 times the historical rate—with the area of water warmer than 18 °C more than doubling, driven by atmospheric warming together with intensified Tsushima Warm Current inflow under a persistently negative Pacific Decadal Oscillation [21]. Such rapid poleward displacement of warm isotherms, and the attendant expansion of warm-water habitat at the expense of cooler zones, is precisely the physical reorganization expected to redistribute thermally segregated species.
The combination of these two findings is the central result of this study. A cetacean community this strongly partitioned by temperature, inhabiting a sea warming this rapidly, is by definition exposed to thermally driven reorganization: as isotherms shift, the relative availability of suitable habitat for cold- and warm-affiliated species will change. Comparable temperature-driven restructuring of cetacean and broader marine communities—poleward range shifts, “tropicalization”, and turnover toward warm-affinity species—has been documented in other warming systems [6,8,9,22]. Across European seas, four decades of community data show that ocean warming has driven both increases in warm-water species (tropicalization) and declines in cold-water species (deborealization), with semi-enclosed basins proving especially vulnerable [23]—a pattern of particular relevance to the semi-enclosed East Sea. Our results establish the two preconditions for such change in the East Sea: a temperature-structured community and rapid warming. We next examine the cold-water guild directly.

4.3. Evidence for Decline of the Cold-Water Guild

The thermal structure and rapid warming documented above set the stage for reorganization; our survey data indicate that, for the cold-water guild, reorganization is already evident. The absence of cold-water species from the 2022 and 2024 spring surveys (Section 3.5) is the strongest temporal signal in the dataset, and three features make it difficult to dismiss as a sampling artefact. First, it is robust to survey effort: the two absence years included the highest-effort year in the series and covered the northern coastal and offshore waters where the cold-water guild had previously occurred, where other cetaceans continued to be recorded. Second, it is specific to the cold-water guild: warm-water species, recorded by identical effort in the same years and waters, persisted and showed no association with temperature, ruling out a survey-wide change in detectability. Third, the cold-water guild decline was strongly associated with spring SST (ρ = −0.78), with presence and absence completely separated at a spring temperature of roughly 16.8 °C. That this association appeared in spring but not winter—when ambient temperature remained within the guild’s thermal niche—points to a coherent mechanism rather than coincidence: as spring temperatures rise earlier and higher, conditions in the surveyed season increasingly exceed the cold-water guild’s thermal tolerance, so that by the warmest springs the guild is no longer present when and where the surveys operate.
This survey-based evidence is reinforced by two independent sources. National bycatch statistics (Korea Coast Guard cetacean handling-certificate records) show the Pacific white-sided dolphin falling from 87 individuals in 2019 to 12 in 2024, with no Dall’s porpoise recorded; because the data for both species are derived essentially only in the Korean East Sea, this national statistic effectively represents the East Sea, and—being collected year-round and independently of our survey effort—it is not subject to the seasonal limitation of the sighting data [13,24]. Local fishers likewise report reduced occurrence of these species. The three sources have non-overlapping weaknesses—the sighting series is spring-biased, bycatch depends on fishing effort and reporting, and fisher accounts are anecdotal—yet converge on the same decline, which strengthens the inference well beyond any single source. We therefore regard a decline of the cold-water guild in the surveyed waters as well supported, while emphasizing that our data cannot distinguish local extirpation from redistribution (e.g., a poleward or offshore shift, or a phenological shift in timing), and that absolute counts should not be compared across sources—only the consistency of their direction.
The direction of change matches what has been documented at the warm margins of cold-water cetacean ranges elsewhere. At the southern distributional boundary of the Pacific white-sided dolphin in the Gulf of California, occurrence declined over three decades as waters warmed, interpreted as a poleward range contraction and not attributable to prey or productivity changes [25]; the Korean East Sea is another southern range margin for this species, where a comparable warming-driven contraction would be expected. More broadly, poleward shifts in cetacean distribution have been quantified from fisheries bycatch and stranding records in other rapidly warming regions, in some cases outpacing the climate velocity of their prey [26]—both supporting our use of bycatch records as a complementary line of evidence and offering a plausible destination for animals no longer present in the surveyed waters. This interpretation is reinforced by the local physical setting: the estimated ocean climate velocity in the East Sea (~67 km decade−1) exceeds the global mean biological climate velocity of marine species (~51.5 km decade−1) [21], implying that thermally suitable habitat for cold-water species may be retreating northward faster than in many other seas, consistent with the loss of these species from the southern, surveyed portion of their range.

4.4. Limitations

Several limitations bound our inferences. The sighting data are heterogeneous in effort across years and platforms and are concentrated in spring, so they cannot by themselves support effort-corrected abundance estimation or a formal temporal trend in community composition; this is precisely why we restricted our analyses to effort-robust quantities (the temperature at which species occur, and an independently sampled regional mean SST series). SST at sighting describes a realized rather than a potential thermal niche—it reflects the conditions under which animals were observed, shaped implicitly by prey, behavior, and survey coverage, and is not a substitute for mechanistic habitat modeling [6]. Species traits such as mobility, diet specialization, and thermoregulatory strategy further modulate how closely a cetacean’s distribution tracks temperature, so realized thermal niches should be interpreted as descriptive rather than mechanistic [26]. The regional mean SST series is short and seasonal. Finally, while the disappearance of the cold-water guild proved robust to survey effort and specific to that guild, our spring-concentrated data cannot by themselves distinguish local decline from redistribution or a shift in timing; resolving this requires dedicated cold-season effort and is where the independent bycatch evidence is most valuable.

4.5. Recommendations

The most important methodological recommendation that follows from this study is the need for sustained, all-season monitoring—in particular, dedicated survey effort in late winter and early spring, when the cold-water guild is expected to occur, so that its status can be tracked directly rather than inferred. Standardized transect effort with compiled track-line data would, in time, permit the abundance estimation that the present dataset could not support. More broadly, our findings illustrate the value of extracting distributional and thermal information from surveys—including the secondary, off-transect sightings ordinarily discarded—in regions and seasons where formal abundance estimation is not yet feasible [6].

5. Conclusions

The small-cetacean community of the Korean East Sea is strongly structured by temperature, separating into cold- and warm-water thermal guilds whose realized thermal niches differ by about 6 °C—a structure recovered from the sighting data themselves and robust to survey sub-area and to atypical records. Over the same period, the region warmed rapidly, with spring sea-surface temperature rising roughly 2 °C in a decade. Against this background, the cold-water guild was absent from both of the spring surveys conducted after 2020 (2022 and 2024)—an absence that was robust to survey effort, specific to that guild while warm-water species persisted, and associated with spring (but not winter) warming, consistent with ambient spring temperatures increasingly exceeding the guild’s thermal niche. Independent bycatch statistics and local knowledge corroborate the decline. Our spring-concentrated data cannot distinguish local decline from redistribution or a shift in timing, but the convergence of effort-robust survey evidence with independent sources indicates that climate-driven reorganization of this community is no longer merely a risk but is already detectable. These findings show the value of extracting distributional and thermal information from surveys—including secondary, off-transect sightings—where formal abundance estimation is not feasible, and they make a clear case for sustained, all-season monitoring, particularly in late winter and early spring, to resolve the fate of the cold-water guild and track the reorganization now underway.

Author Contributions

Conceptualization, K.J.P. and K.Y.; methodology, K.J.P. and K.Y.; formal analysis, K.J.P. and K.Y.; data curation, M.J.K., D.L. and S.K.; writing—original draft preparation, K.J.P. and K.Y.; writing—review and editing, K.Y., M.J.K. and N.U.; visualization, K.J.P. and N.U. All authors have read and agreed to the published version of the manuscript.

Funding

This research was supported by the National Institute of Fisheries Science (NIFS), Republic of Korea (grant number 2026004).

Institutional Review Board Statement

Not applicable.

Data Availability Statement

OISST v2.1: NOAA NCEI (25 May 2026). Korea Coast Guard bycatch data: data.go.kr (31 May 2026). Further inquiries can be directed at the corresponding author.

Acknowledgments

The authors sincerely thank Hyun-woo Kim, In-woo Han, Kyunglee Lee, Eun-ho Kim, and Mikyung Lee for their dedicated participation in the visual surveys. We also extend our gratitude to all colleagues at the Cetacean Research Institute (CRI) for their support and contributions throughout this study. We are grateful to the captains and crew members of the R/V Tamgu 3, R/V Tamgu 20, and R/V Tamgu 12 for their assistance during the field surveys. We dedicate this work to the memory of Jonghee Lee, our colleague and collaborator, who passed away in 2024. Her passion for marine mammal research, scientific contributions, and friendship continue to inspire us. During the preparation of this manuscript, the authors used Claude, Opus 4.8 to assist translation, language editing, manuscript drafting, and statistical descriptions. The authors have reviewed and edited the output and take full responsibility for the content of this publication.

Conflicts of Interest

The authors declare no conflicts of interest.

Abbreviations

The following abbreviations are used in this manuscript:
ANOVAAnalysis of variance
BICBayesian information criterion
CRICetacean Research Institute
NIFSNational Institute of Fisheries Science
NOAANational Oceanic and Atmospheric Administration
OISSTOptimum interpolation sea-surface temperature
OVLOverlapping coefficient
SSTSea-surface temperature

References

  1. Poloczanska, E.S.; Brown, C.J.; Sydeman, W.J.; Kiessling, W.; Schoeman, D.S.; Moore, P.J.; Brander, K.; Bruno, J.F.; Buckley, L.B.; Burrows, M.T.; et al. Global imprint of climate change on marine life. Nat. Clim. Change 2013, 3, 919–925. [Google Scholar] [CrossRef]
  2. Pecl, G.T.; Araújo, M.B.; Bell, J.D.; Blanchard, J.; Bonebrake, T.C.; Chen, I.-C.; Clark, T.D.; Colwell, R.K.; Danielsen, F.; Evengård, B.; et al. Biodiversity redistribution under climate change: Impacts on ecosystems and human well-being. Science 2017, 355, eaai9214. [Google Scholar] [CrossRef] [PubMed]
  3. Pinsky, M.L.; Worm, B.; Fogarty, M.J.; Sarmiento, J.L.; Levin, S.A. Marine taxa track local climate velocities. Science 2013, 341, 1239–1242. [Google Scholar] [CrossRef] [PubMed]
  4. Poloczanska, E.S.; Burrows, M.T.; Brown, C.J.; García Molinos, J.; Halpern, B.S.; Hoegh-Guldberg, O.; Kappel, C.V.; Moore, P.J.; Richardson, A.J.; Schoeman, D.S.; et al. Responses of marine organisms to climate change across oceans. Front. Mar. Sci. 2016, 3, 62. [Google Scholar] [CrossRef]
  5. Learmonth, J.A.; MacLeod, C.D.; Santos, M.B.; Pierce, G.J.; Crick, H.Q.P.; Robinson, R.A. Potential effects of climate change on marine mammals. Oceanogr. Mar. Biol. Annu. Rev. 2006, 44, 431–464. [Google Scholar] [CrossRef]
  6. Silber, G.K.; Lettrich, M.D.; Thomas, P.O.; Baker, J.D.; Baumgartner, M.; Becker, E.A.; Boveng, P.; Dick, D.M.; Fiechter, J.; Forcada, J.; et al. Projecting marine mammal distribution in a changing climate. Front. Mar. Sci. 2017, 4, 413. [Google Scholar] [CrossRef]
  7. MacLeod, C.D. Global climate change, range changes and potential implications for the conservation of marine cetaceans: A review and synthesis. Endanger. Species Res. 2009, 7, 125–136. [Google Scholar] [CrossRef]
  8. Thorne, L.H.; Heywood, E.I.; Hirtle, N.O. Rapid restructuring of the odontocete community in an ocean warming hotspot. Glob. Change Biol. 2022, 28, 6524–6540. [Google Scholar] [CrossRef] [PubMed]
  9. MacLeod, C.D.; Bannon, S.M.; Pierce, G.J.; Schweder, C.; Learmonth, J.A.; Herman, J.S.; Reid, R.J. Climate change and the cetacean community of north-west Scotland. Biol. Conserv. 2005, 124, 477–483. [Google Scholar] [CrossRef]
  10. Belkin, I.M. Rapid warming of large marine ecosystems. Prog. Oceanogr. 2009, 81, 207–213. [Google Scholar] [CrossRef]
  11. Han, I.-S.; Lee, J.-S.; Jung, H.-K. Long-term pattern changes of sea surface temperature during summer and winter due to climate change in the Korea Waters. Fish. Aquat. Sci. 2023, 26, 639–648. [Google Scholar] [CrossRef]
  12. Sohn, H.; Park, K.J.; An, Y.R.; Choi, S.G.; Kim, Z.G.; Kim, H.W.; An, D.H.; Lee, Y.R.; Park, T.G. Distribution of whales and dolphins in Korean waters based on a sighting survey from 2000 to 2010. Korean J. Fish. Aquat. Sci. 2012, 45, 486–492. [Google Scholar] [CrossRef]
  13. Lee, J.H.; Kim, E.H.; Lee, K.; Park, K.J.; An, Y.R.; Kim, H.W. Occurrence and spatial distribution of marine mammals by sighting surveys in Korean waters during 2011–2020. Korean J. Fish. Aquat. Sci. 2022, 55, 938–945. [Google Scholar] [CrossRef]
  14. MacLeod, C.D.; Weir, C.R.; Santos, M.B.; Dunn, T.E. Temperature-based summer habitat partitioning between white-beaked and common dolphins around the United Kingdom and Republic of Ireland. J. Mar. Biol. Assoc. UK 2008, 88, 1193–1198. [Google Scholar] [CrossRef]
  15. Huang, B.; Liu, C.; Banzon, V.; Freeman, E.; Graham, G.; Hankins, B.; Smith, T.; Zhang, H.-M. Improvements of the Daily Optimum Interpolation Sea Surface Temperature (DOISST) Version 2.1. J. Clim. 2021, 34, 2923–2939. [Google Scholar] [CrossRef]
  16. Huang, B.; Liu, C.; Banzon, V.; Freeman, E.; Graham, G.; Hankins, B.; Smith, T.; Zhang, H.-M. NOAA 0.25-Degree Daily Optimum Interpolation Sea Surface Temperature (OISST), Version 2.1; NOAA National Centers for Environmental Information: Asheville, NC, USA, 2020. [Google Scholar] [CrossRef]
  17. R Core Team. R: A Language and Environment for Statistical Computing, version 4.5.3 ed; R Foundation for Statistical Computing: Vienna, Austria, 2026; Available online: https://www.R-project.org/ (accessed on 11 March 2026).
  18. Scrucca, L.; Fop, M.; Murphy, T.B.; Raftery, A.E. mclust 5: Clustering, classification and density estimation using Gaussian finite mixture models. R J. 2016, 8, 289–317. [Google Scholar] [CrossRef]
  19. Chavez-Rosales, S.; Palka, D.L.; Garrison, L.P.; Josephson, E.A. Environmental predictors of habitat suitability and occurrence of cetaceans in the western North Atlantic Ocean. Sci. Rep. 2019, 9, 5833. [Google Scholar] [CrossRef] [PubMed]
  20. Yoo, J.-T.; Park, K.J.; Lee, K.; Lee, D. A first study on distribution characteristics of common dolphin in Korean waters: A study using data collected during the past 20 years. J. Mar. Sci. Eng. 2023, 11, 1635. [Google Scholar] [CrossRef]
  21. Ahn, J.; Kim, C.; Han, I.; Joo, H. Estimated ocean climate velocity using satellite sea surface temperature products since the early 2000s in the East Sea. Oceans 2025, 6, 56. [Google Scholar] [CrossRef]
  22. Vergés, A.; Steinberg, P.D.; Hay, M.E.; Poore, A.G.B.; Campbell, A.H.; Ballesteros, E.; Heck, K.L.; Booth, D.J.; Coleman, M.A.; Feary, D.A.; et al. The tropicalization of temperate marine ecosystems: Climate-mediated changes in herbivory and community phase shifts. Proc. R. Soc. B 2014, 281, 20140846. [Google Scholar] [CrossRef] [PubMed]
  23. Chust, G.; Villarino, E.; McLean, M.; Mieszkowska, N.; Benedetti-Cecchi, L.; Bulleri, F.; Ravaglioli, C.; Borja, A.; Muxika, I.; Fernandes-Salvador, J.A.; et al. Cross-basin and cross-taxa patterns of marine community tropicalization and deborealization in warming European seas. Nat. Commun. 2024, 15, 2126. [Google Scholar] [CrossRef] [PubMed]
  24. Korea Coast Guard. Status of Cetacean Handling Certificate Issuance [고래류 처리확인서 발급현황]. Public Data Portal (data.go.kr), Dataset ID 3074254. Available online: https://www.data.go.kr/ (accessed on 1 June 2026). (In Korean)
  25. Salvadeo, C.J.; Lluch-Belda, D.; Gómez-Gallardo, A.; Urbán-Ramírez, J.; MacLeod, C.D. Climate change and a poleward shift in the distribution of the Pacific white-sided dolphin in the northeastern Pacific. Endanger. Species Res. 2010, 11, 13–19. [Google Scholar] [CrossRef]
  26. Thorne, L.H.; Nye, J.A. Trait-mediated shifts and climate velocity decouple an endothermic marine predator and its ectothermic prey. Sci. Rep. 2021, 11, 18507. [Google Scholar] [CrossRef] [PubMed]
Figure 1. Study area in the Korean waters of the East Sea, showing the survey blocks/areas and the randomized zig-zag line-transect tracks. Inset locates the region within the northwest Pacific; the warm Tsushima Current and its branches (red) and the colder, subpolar-origin North Korea Cold Current (blue) that shape the regional thermal gradient are labeled.
Diversity 18 00422 g001
Figure 2. Realized thermal niches of the six small-cetacean species. (A) Ridgeline plot of the distribution of sea-surface temperature at sighting for each species, ordered from coldest (Dall’s porpoise) to warmest (bottlenose dolphin); (B) box plots of Sea-surface temperature (SST) at sighting grouped by thermal guild, showing the ~6 °C separation between the cold- and warm-water guilds. n = 177 sightings.
Diversity 18 00422 g002
Figure 3. Pairwise thermal niche overlap (Overlapping coefficient, OVL) between all species pairs, shown as a heatmap. Colour indicates the magnitude of overlap (see scale); grey cells on the diagonal are self-comparisons (OVL = 1 by definition) and are not interpreted. Overlap is high within guilds (e.g., false killer whale–Risso’s dolphin OVL = 0.84) and low between the cold and warm extremes (Dall’s porpoise–bottlenose dolphin OVL = 0.00); within-guild overlap averaged 0.55 versus 0.23 between guilds.
Diversity 18 00422 g003
Figure 4. Spring (April–June) regional mean sea-surface temperature of the survey region (fixed box 128–132° E, 35–39° N), 2015–2024, sampled identically each year and therefore independent of survey effort. Points and the solid black line show the annual spring mean; the grey band shows ±1 standard deviation of the sampled daily box-mean values within each spring, reflecting the seasonal warming that occurs across April–June rather than uncertainty in the annual mean. The red dashed line is the ordinary-least-squares fit(slope = 0.22 °C yr−1, R2 = 0.86, p < 0.001; Mann–Kendall Z = 3.22, p = 0.001), corresponding to a rise of approximately 2 °C over the study period.
Diversity 18 00422 g004
Figure 5. Disappearance of the cold-water guild and its association with spring warming, 2015–2024 (surveyed years only). (a) Effort-normalized encounter rate (sightings per 1000 nmi) for the cold- and warm-water guilds by year; the cold-water guild falls to zero in 2022 and 2024 (shaded) while the warm-water guild persists. (b) Encounter rate versus spring regional mean SST for each guild, with linear fits; the decline is steep and significant for the cold-water guild (Spearman ρ = −0.78, p = 0.038) but absent for the warm-water guild (ρ = −0.09, p = 0.85). (c) Winter (January–March) and spring (April–June) regional mean SST by year relative to the cold-water guild’s core thermal niche (shaded band, ≈9–13 °C); winter SST remains within the niche every year, whereas spring SST exceeds it, most strongly in the two years when the cold-water guild was absent (circled).
Diversity 18 00422 g005
Figure 6. Locations of the analyzed cetacean sightings in the Korean East Sea (2015–2024), coded by thermal guild (cold-water guild: Dall’s porpoise and the Pacific white-sided dolphin; warm-water guild: common, Risso’s, and bottlenose dolphins and false killer whale). Symbols distinguish the six species. Inshore/offshore survey sub-area boundaries are overlaid (identified by those in Figure 1); cold-water guild sightings were confined to the northern coastal and offshore waters (≥37.2° N).
Diversity 18 00422 g006
Table 1. Vessel-based survey effort, Korean East Sea, 2015–2024 (no surveys in 2018, 2021, 2023; SV = small vessel, LV = large vessel).
YearPlatform(s)No. SurveysSurvey DaysEffort (nmi)Months Surveyed
2015LV, SV42615173, 4, 5, 7, 10, 11
2016LV186834, 5
2017SV31811083, 7, 10, 11
2019LV, SV32113762, 3, 5, 6, 9, 10
2020LV, SV21911823, 4, 5
2022LV43621954, 5, 8, 9, 10
2024LV, SV32314224, 5, 6, 9
Total 201519483
Table 2. Cetacean species recorded during vessel surveys, with thermal-guild assignment and analysis status. Sightings = number of sighting events. Six species were retained for analysis; others were excluded for the reasons shown.
Common NameScientific NameThermal GuildSightingsStatus
Dall’s porpoisePhocoenoides dalliCold-water35Included
Pacific white-sided dolphinLagenorhynchus obliquidensCold-water15Included
Common dolphinDelphinus delphisWarm-water89Included
Risso’s dolphinGrampus griseusWarm-water26Included
False killer whalePseudorca crassidensWarm-water9Included
Bottlenose dolphinTursiops truncatusWarm-water4Included
Minke whaleBalaenoptera acutorostrata59Excluded (resident, year-round)
Northern fur sealCallorhinus ursinus20Excluded (pinniped, not a cetacean)
Finless porpoiseNeophocaena asiaeorientalis16Excluded (resident, year-round)
Sperm whalePhyseter macrocephalus10Excluded (rare/affinity unclear)
Killer whaleOrcinus orca4Excluded (rare/affinity unclear)
Fin whaleBalaenoptera physalus3Excluded (rare/affinity unclear)
Humpback whaleMegaptera novaeangliae1Excluded (rare/affinity unclear)
Table 3. Per-species realized thermal niche (SST at sighting): sample size, mean, median, interquartile range, and range.
GuildSpeciesnMedianMeanSDQ025Q25Q75Q975MinMax
ColdDall’s porpoise3510.911.11.87.79.612.213.77.714
ColdPacific white-sided dolphin1512.712.62.39.211.513.417.48.619.1
WarmFalse killer whale917.717.42.513.715.919.320.513.720.8
WarmCommon dolphin8818.317.74.111.914.221.226.510.726.8
WarmRisso’s dolphin2617.7183.313.915.519.925.513.427.2
WarmBottlenose dolphin419.218.90.817.818.819.319.317.719.3
Disclaimer/Publisher’s Note: The statements, opinions and data contained in all publications are solely those of the individual author(s) and contributor(s) and not of MDPI and/or the editor(s). MDPI and/or the editor(s) disclaim responsibility for any injury to people or property resulting from any ideas, methods, instructions or products referred to in the content.