Article

Diversity and Community Composition of Light-Attracted Canopy Insects and Their Relationship with Neutral Genetic Diversity of Tilia cordata (Mill.) in Protected Forests of Lithuania


by
Jūratė Lynikienė
*,
Rita Verbylaitė
,
Artūras Gedminas
,
Valeriia Mishcherikova
,
Adas Marčiulynas
and
Virgilijus Baliuckas
Lithuanian Research Centre for Agriculture and Forestry, Institute of Forestry, Kėdainiai District, LT-58344 Akademija, Lithuania
*
Author to whom correspondence should be addressed.
Diversity 2026, 18(6), 378; https://doi.org/10.3390/d18060378
Submission received: 30 April 2026 / Revised: 5 June 2026 / Accepted: 16 June 2026 / Published: 17 June 2026

Abstract

Temperate broadleaved forests support diverse arthropod communities, but canopy-dwelling insects in European lime (Tilia cordata Mill.) stands are still poorly known. We surveyed light-attracted canopy insects in six T. cordata Genetic Conservation Units and related protected stands across Lithuania. One modified, solar-powered UV light trap was installed in the canopy (10–15 m) at each site and operated twice per month from June to August in 2023 and 2024. We used diversity metrics, similarity indices, multiple regression, and non-metric multidimensional scaling (NMDS) together with PERMANOVA to examine the structure of insect communities and assess the influence of environmental factors. In total, 6031 individuals representing 295 insect species were recorded, with higher abundance, species richness and Shannon diversity in 2024 than in 2023. Across both years and all sites, Shannon H diversity index ranged from 3.21 to 3.92. Sørensen indices indicated moderate species similarity among sites and distinct species composition at the Ukmergė genetic reserve. The 20 most abundant taxa comprised over 60% of all individuals, and dominance structure changed markedly between years: Serica brunnea dominated in 2023 but was nearly absent in 2024. Regression revealed a significant positive effect of air temperature on insect abundance (about a 31% increase per 1 °C), while precipitation had no significant effect on insect abundance. NMDS and PERMANOVA showed strong spatial structuring, with sites explaining most of the variation, and weaker but significant temporal and site-by-year effects. Overall, insect diversity metrics showed non-significant correlations with T. cordata genetic diversity parameters. Results demonstrate that mature T. cordata forest stands are important reservoirs of canopy insect diversity and highlight pronounced spatial heterogeneity, interannual dynamics, and temperature sensitivity of canopy assemblages in Lithuanian forests.

1. Introduction

Temperate broadleaf and mixed forests create intricate environments that host a wide variety of arthropods. Many of these arthropods play key roles in the ecosystem, acting as herbivores, pests, predators, decomposers, and pollinators [1,2,3]. Within these forests, the canopy layer constitutes a distinct ecological domain characterized by high microclimatic variability, resource heterogeneity, and spatio-temporal dynamics that differ substantially from conditions near the forest floor [4,5]. Canopy-dwelling insects, in particular, respond sensitively to forest stand structure, host tree identity, and landscape context, and thereby form an important component of overall forest biodiversity [6,7]. Despite their ecological importance, canopy arthropod communities in temperate Europe remain comparatively less studied than those in tropical regions [7,8], and many dominant tree species in European temperate forests are still poorly characterized in terms of their associated canopy-dwelling insect assemblages [9].
Small-leaved lime is a characteristic broad-leaved tree species of mesic, moderately fertile temperate forests in northern and central Europe [10]. In Lithuania and neighboring countries, T. cordata occurs in mixed stands and forms both natural and managed forest ecosystems, often on temporarily waterlogged but nutrient-rich mineral soils. The species is valued not only for its ecological roles such as nectar provision for pollinators and habitat value for epiphytes and saproxylic organisms but also for genetic conservation and seed production, as it is included in national networks of Genetic Conservation Units (GCUs) and seed stands [11,12].
Nevertheless, in contrast to other major European broadleaved species like Quercus robur and Fagus sylvatica, there remains a lack of detailed research on the insect communities found in the canopies of Tilia cordata, especially within protected or semi-natural forests in northeastern Europe [13]. Previous research on forest arthropods in this region has primarily concentrated on under-storey, ground-dwelling or saproxylic assemblages [14,15], with comparatively fewer investigations targeting the canopy layer.
Sampling arthropods in forest canopies poses logistical challenges, and numerous methods have been used to access this habitat, including canopy fogging, crane systems, single-rope techniques, and various trapping approaches [7,16,17]. Among these, light traps provide an efficient, standardized and relatively low-impact means of surveying nocturnal, light-attracted insects such as many Lepidoptera, Coleoptera and Diptera [18,19,20]. Light trapping has been widely used to monitor temporal dynamics in insect abundance and diversity, to assess forest management effects, and to detect responses to climate variability [21,22,23]. However, most light-trap studies in forests place traps at ground level or in open habitats, and there are comparatively few investigations that specifically deploy light traps in the canopy to characterize canopy-dwelling insect assemblages [24].
Temperature and precipitation, among other climatic and weather conditions, are major factors shaping insect phenology, activity, and population dynamics [25,26]. In temperate regions, elevated temperatures often enhance insect activity, reproduction, and voltinism up to species-specific thresholds [26,27], and recent decades have seen widespread shifts in insect distributions and community structure in response to climate warming [9,28]. Short-term variation in weather conditions within and between years can also influence light-trap catches by altering flight activity, dispersal behavior, and vertical stratification in the forest [29].
At the landscape scale, forest configuration, surrounding land use, and habitat connectivity are additional factors known to affect forest insect diversity and community composition [30]. Forest interior stands embedded in continuous forest cover tend to harbor different assemblages from edge stands bordering agricultural land or clear-cuts [31,32,33]. Genetic Conservation Units (GCUs) of forest trees are typically located in relatively mature, structurally complex stands with restricted management, potentially providing important refugia for forest-specialist insects in otherwise intensively managed landscapes [11,34]. Yet the biodiversity value of such GCUs for canopy-dwelling insect communities is still rarely assessed, and little is known about spatial variation in insect assemblages among GCUs within a country.
In Lithuania, networks of T. cordata GCUs and forest seed stands have been established to conserve genetic resources and provide high-quality reproductive material. These stands represent a range of site conditions, soil types and surrounding landscapes, from extensive forest interiors to forest blocks adjacent to agricultural fields or regeneration areas. Given the ongoing concerns about insect declines across Europe [9,35], there is a pressing need to characterize insect communities in these conservation stands and to evaluate how local and landscape factors may influence canopy-dwelling taxa associated with T. cordata.
Genetic diversity within foundation plant species can significantly affect associated communities and ecosystem processes [36,37,38]. Studies in canopy-dominant trees such as cottonwoods, willows, eucalypts and oaks have reported that higher host genetic diversity can be associated with increased arthropod richness, diversity or altered community composition, presumably via genetically based differences in traits such as architecture, phenology and foliar chemistry that modify resource quality and habitat structure for herbivores [39,40,41]. However, much of this evidence comes from experimental gardens or highly specialized guilds like gall-forming insects [40,42,43], whereas several field studies in natural forests have found weak or non-significant relationships between neutral genetic diversity and canopy arthropod communities [44,45,46]. These contrasting results highlight that the strength and detectability of host-arthropod genetic associations may depend on ecological context, spatial scale, the focal insect assemblage, and the genetic metrics considered [38] and caution that correlations based solely on neutral molecular markers may be difficult to interpret and sometimes statistically unstable. However, such associations, if found, could be of high importance in guiding conservation decisions in protected forest habitats.
Given this background, the objective of this study was to characterize the diversity, abundance, and community composition of light-attracted, canopy-dwelling insects in T. cordata Genetic Conservation Units across Lithuania. Specifically, we (i) quantified insect diversity metrics (abundance, species richness and Shannon diversity) in the canopies of mature T. cordata stands over two years; (ii) assessed spatial variation in species composition among six GCUs using similarity indices and multivariate ordination; (iii) identified the most numerically dominant taxa contributing to canopy insect assemblages; (iv) evaluated the influence of short-term climatic variables (air temperature and precipitation) on insect abundance; and (v) explored relationships between insect diversity metrics and T. cordata genetic diversity parameters presented in Verbylaitė et al. (2026) [47].

2. Materials and Methods

2.1. Study Areas

Permanent study plots were set up in six Tilia cordata GCUs distributed across the country, with one site per unit (Figure 1). Two of the GCUs are classified as forest seed stands [Raseiniai (RAS) and Anykščiai (ANK)]; one as a genetic reserve [Rokiškis (ROK)]; and three as state genetic reserves—two in Jurbarkas (JU4 and JU5) and one in Ukmergė (UKM). All sites belong to different regional branches of the State Forest Enterprise.
A comprehensive overview of the GCUs and their principal stand attributes is presented in Table 1. The selected stands were generally similar with respect to stand structure and site conditions. At all locations, small-leaved lime constituted the dominant tree species, representing approximately 40–70% of the total stand basal area. The stands were at a mature developmental stage, with tree ages ranging from 79 to 138 years. T. cordata was primarily associated with periodically waterlogged mineral soils of moderate to high fertility, most commonly characterized by the aegopodiosa vegetation type.
All study plots were located within forest interiors and were surrounded by at least 1–2 km of mixed forest, with the exception of the RAS site, where agricultural fields approximately 1 km wide extend from north to south along the forest margin. In the vicinity of the ANK site, there is a clear-cut area with abundant natural regeneration of Tilia spp. and Populus spp. The landscape context of the GCU sites was characterized using forest cadastre data obtained from the Lithuanian Geoportal (https://www.geoportal.lt/geoportal/, accessed on 15 April 2025).

2.2. Light Traps

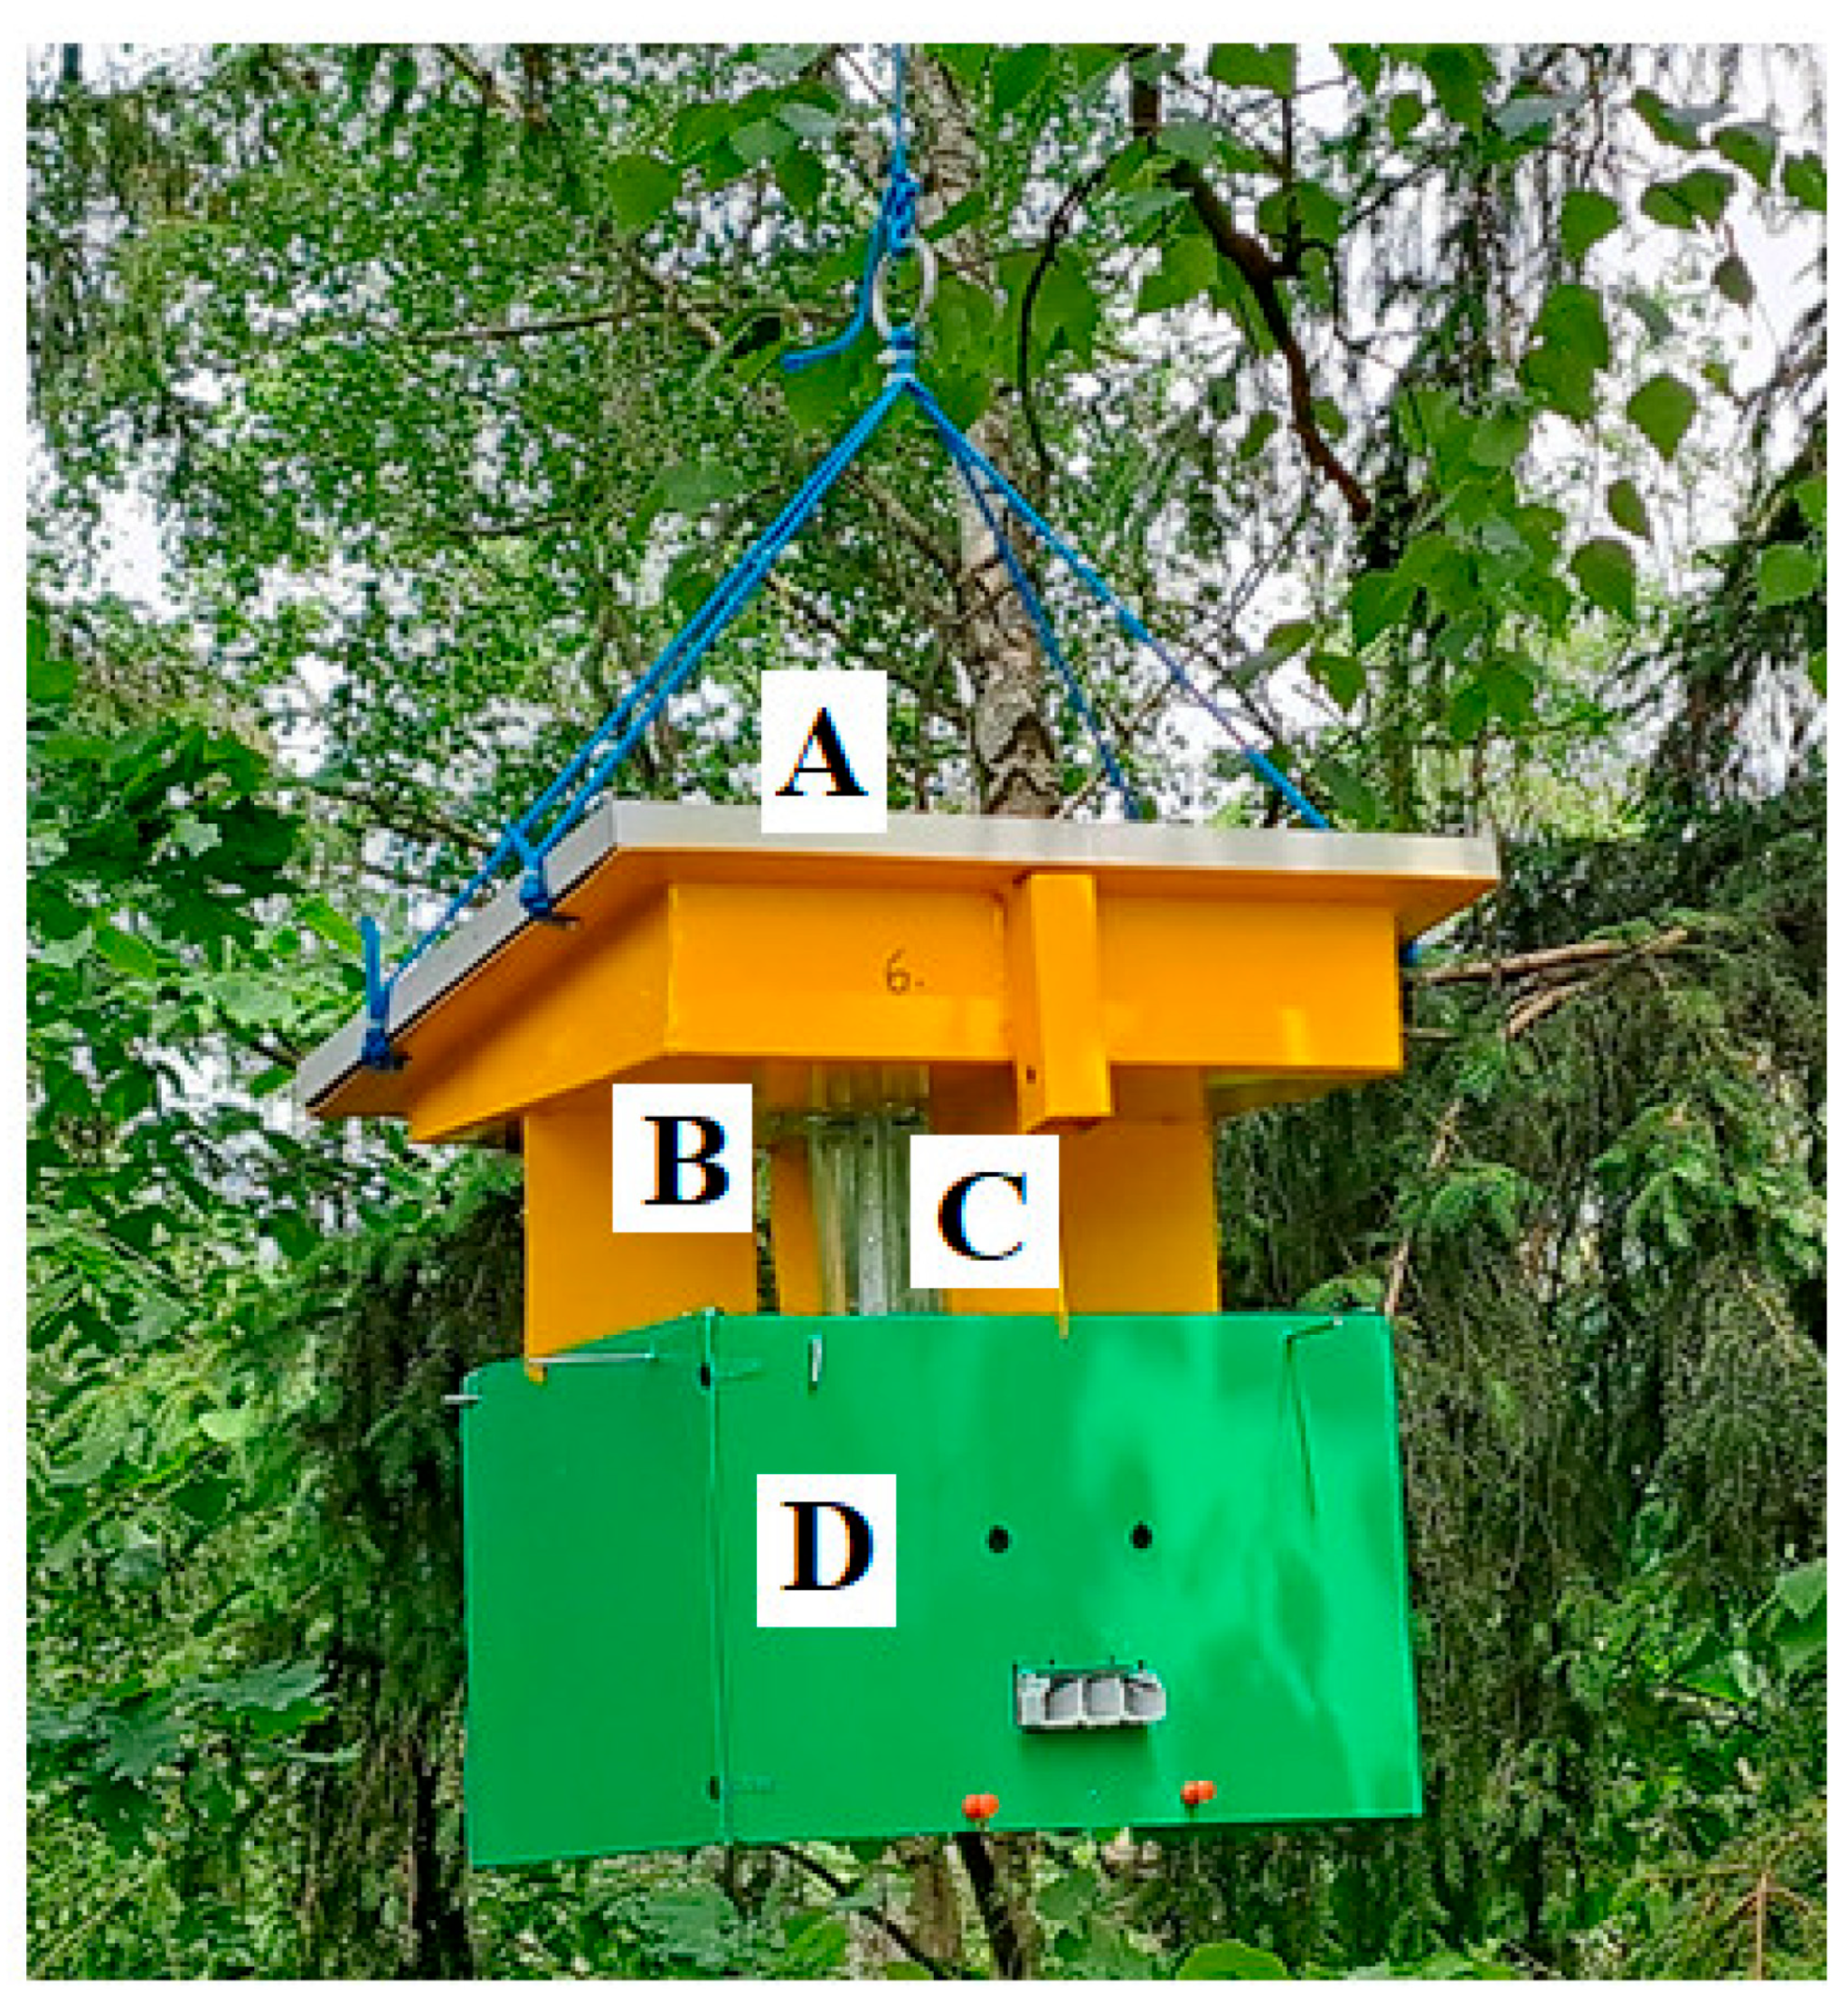
One light trap per study site was used to monitor canopy-dwelling insects in 2023 and 2024. Jumbo Soral light traps (Hectare, Ahmedabad, India; https://www.amazon.in/Hectare-Automatic-Insect-Battery-Collection/dp/B07T3C5MDR, accessed on 20 February 2023) were modified for this study: the original water tub was replaced with a polycarbonate insect collector, and the freestanding ground frame was substituted with a hanging mount to enable installation in T. cordata canopies. Each light trap was equipped with a solar panel, a UV lamp (blue light), a battery providing approximately 5 h of operation, and an insect collection unit (Figure 2).
Traps were deployed in the tree crown at a height of 10–15 m above ground level, yielding a total of six traps per monitoring year. A Big Shot® slingshot (Notch Equipment, Greensboro, NC, USA) with a weighted throwline was used to install ropes in the crowns for hoisting the traps. Light traps were mounted at the highest practicable level between two trees and in a relatively open space to ensure adequate solar exposure during the day. Traps were lowered twice per month (every 10–14 days). In total, each site was sampled five times during the 2023 season (June–September) and six times during the 2024 season (May–August), resulting in temporal replication that captured within-season variation in community composition On each sampling occasion, the insect collectors were emptied, and the captured insects were transferred into separate plastic containers, brought to the lab on the same day, air-dried at room temperature, and subsequently stored at 5 °C until taxonomic identification. For each trapping interval, mean air temperature and total precipitation were obtained from the meteorological station nearest to each study site. A summary of the climatic data for the two study years is provided in Table S2.

2.3. Taxonomic Identification

Numerous specimens were determined to the species level, while others could only be assigned to the genus, family, or order. Taxonomic determination was performed using a Zeiss Stemi 2000-C stereomicroscope (Oberkochen, Germany), based on morphological characters and employing standard identification keys [50,51,52], complemented by information from online databases [53,54,55].

2.4. Genetic Diversity of T. cordata

Genetic diversity parameters of T. cordata used in the present study were obtained from Verbylaitė et al. (2026) [47], who analyzed the same six protected T. cordata stands in Lithuania as those surveyed for canopy insects in this study. In that study, mature trees and naturally regenerated juveniles were sampled at each site, DNA was extracted from wood and leaf material, and individuals were genotyped using nuclear microsatellite (SSR) markers. Multi-locus genotypes were used to identify clonal individuals, and standard population genetic analyses were applied to estimate genetic diversity parameters. For the present analyses, the stand-level indices reported by Verbylaitė et al. (2026) [47]—including Shannon information index (I), observed heterozygosity (Ho), expected heterozygosity (He), and inbreeding coefficient (FIS)—were used for comparison with insect diversity metrics. Detailed sampling, laboratory procedures, and genetic analyses are provided in Verbylaitė et al. (2026) [47].

2.5. Data Analysis

The Shannon diversity index [56] was employed to quantify the diversity of insect communities associated with small-leaved lime trees at each site and in each year. Differences in Shannon diversity among sites and years were evaluated using the nonparametric Mann–Whitney–Wilcoxon test in Minitab v.19.2 (Minitab® Inc., Pennsylvania State University, State College, PA, USA). The qualitative pairwise Sørensen index (Cs) was applied to assess the similarity of insect species assemblages between study sites. To evaluate how variation in insect abundance depended on climatic factors, we applied regression modeling. The relationship between insect abundance and temperature, precipitation, and year was examined using a multiple linear regression model fitted to log-transformed abundance, with temperature and precipitation as continuous predictors and year as a categorical factor. Analyses were performed in R version 4.0.5 (R Core Team, Vienna, Austria). Linear models were fitted using the base stats package, and negative binomial models were implemented using the MASS package. Mixed-effects models, fitted with the lme4 package, were also explored to account for potential non-independence among observations by including site (and, where appropriate, trap identity) as random intercepts. However, these models did not improve model fit relative to the simpler fixed-effects models (as assessed by AIC and residual diagnostics), and in some instances failed to converge. Consequently, we report the results of the multiple linear regression models in the main text. In addition, we explored analogous models with species richness as the response variable, but these did not reveal robust effects of temperature or precipitation (effect sizes were small and uncertainty high), so we do not report them further, as they do not change the main conclusions of the study. The overall significance of the final linear regression model was assessed using an F-test and the associated p-value. Data manipulation and preparation were conducted using the dplyr package, and graphical visualizations were produced using the ggplot2 package. Label repulsion in ordination plots was implemented using the ggrepel package. The composition of insect assemblages was analyzed using non-metric multidimensional scaling (NMDS) based on Bray–Curtis’s dissimilarities, implemented in the vegan package. The resulting NMDS ordinations were visualized with the ggplot2 package. Permutational multivariate analysis of variance (PERMANOVA) was carried out using the adonis2 function in vegan to evaluate differences in community composition among study sites and years. To assess whether our PERMANOVA results could be biased by differences in multivariate dispersion among groups, we examined within-group dispersion patterns visually in the NMDS ordination (distance of samples to group centroids) and summarized within-group Bray–Curtis dissimilarities, but we did not perform a formal PERMDISP test due to the relatively unbalanced design and small group sizes for some site × year combinations. One sampling event at the UKM site showed an atypical community composition, most likely due to malfunctioning of the light trap during heavy rainfall; however, this sample was retained in all analyses. To assess relationships between insect diversity and host genetic parameters, both Pearson correlation tests were performed using cor.test. All pairwise combinations were evaluated using functions from the purrr package.
For all inferential analyses, we present the corresponding test statistics and effect size measures together with p-values (Mann–Whitney–Wilcoxon W, Kruskal–Wallis H, linear regression model F and adjusted R2, PERMANOVA F and R2). For the NMDS ordinations, the two-dimensional stress value is reported to evaluate the quality of the ordination.

3. Results

3.1. Insect Diversity

A total of 6031 individuals representing 295 light-attracted insect species were recorded. Overall abundance, species richness, and diversity were slightly higher in 2024 (3298 individuals, 232 taxa, Shannon H = 4.17) than in 2023 (2733 individuals, 200 taxa, Shannon H = 3.72) (Table 2). However, Kruskal–Wallis tests indicated that differences in species richness and abundance across years did not reach statistical significance (H = 5.4 and 6.1, respectively; p > 0.06). Similarly, a Mann–Whitney-Wilcoxon test indicated that the difference in Shannon diversity between 2023 and 2024 was not significant (W = 13.5, p = 0.16) when data were combined across all study sites.
Relative abundance of light-attracted insects varied among sites within each year. In 2023, the largest proportion of individuals was recorded at site ROK (42.8% of all individuals), whereas at the other sites abundances ranged from 6.5% to 19.7% (differences among sites significant, p < 0.05). In 2024, the highest relative abundances occurred at sites JU4 and JU5, which together accounted for over 60% of all individuals and showed high species richness and diversity (Shannon H = 3.73 and 3.72), compared with ANK (abundance 8.5%, Shannon H = 3.37) and UKM (abundance 7.9%, Shannon H = 2.81; Table 2). Differences in relative abundance and Shannon diversity among these sites were statistically significant (p < 0.05).
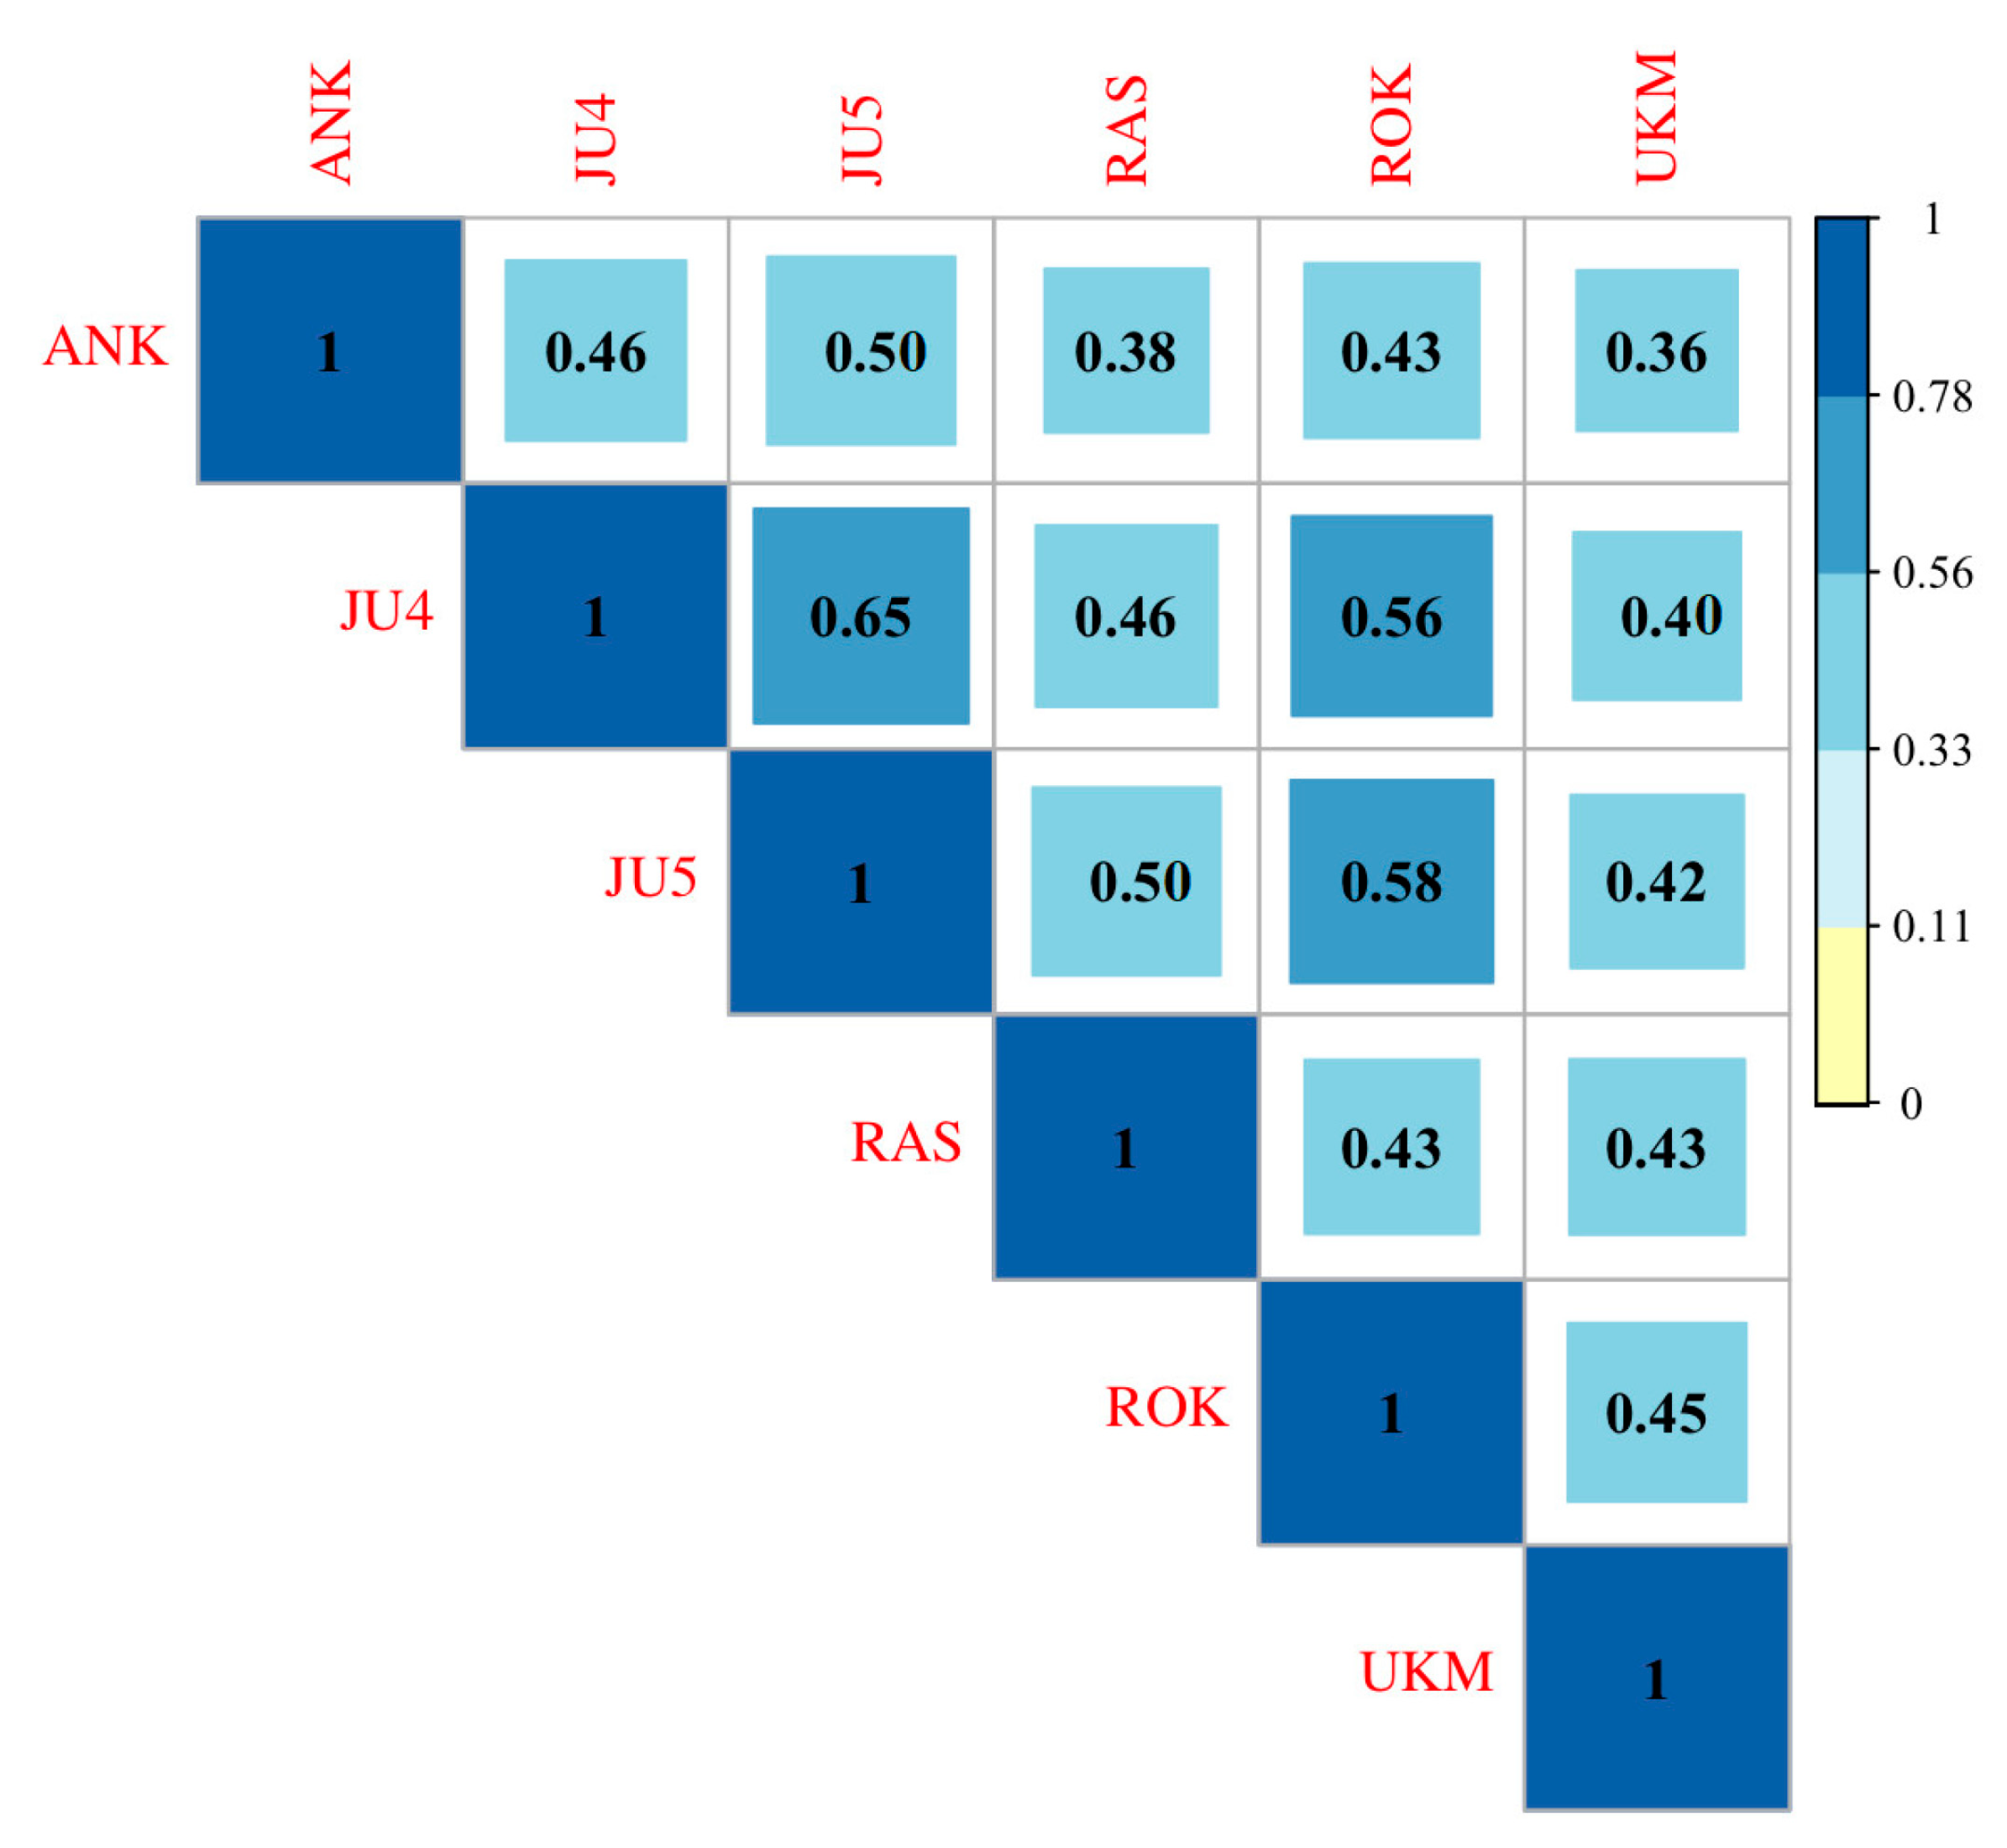
Sørensen similarity indices (Cs) indicated moderate overlap in insect species composition among the six study sites (Figure 3). The highest similarity was observed between JU4 and JU5 (Cs = 0.65) and between JU5 and ROK (Cs = 0.60), suggesting relatively similar assemblages at these site pairs. In contrast, the lowest similarities involved UKM, particularly in comparison with ANK (Cs = 0.36), JU4 (Cs = 0.40), and JU5 (Cs = 0.42), indicating comparatively more distinct communities at this site.
The 20 most common light-attracted insect taxa across all Tilia cordata GCUs together accounted for 68.6% of individuals in 2023 and 60.8% in 2024, representing 64.3% of all individuals across both years (Table 3). In 2023, the community was strongly dominated by the scarab beetle Serica brunnea (18.8%), followed by the diving beetle Ilybius fuliginosus (9.8%) and Gracillarioidae sp. 3 (6.0%), whereas several Lepidoptera and Diptera taxa (e.g., Miltonchrista miniata, Eilema sp. 1, Lauxaniidae sp. 1, Diptera sp. 2) each contributed more modest shares (Table 3).
In 2024, Serica brunnea almost disappeared from the catches (0.3%), and relative abundance became more evenly distributed among several taxa, including Diptera sp. 2 (7.8%), Colymbetes fuscus (5.8%), Miltonchrista miniata (6.3%), and Lauxaniidae sp. 1 (5.3%). Across both years combined, the numerically dominant taxa were Serica brunnea (8.7%), Ilybius fuliginosus (6.8%), Diptera sp. 2 (5.5%), Colymbetes fuscus (5.2%), and Miltonchrista miniata (5.1%), indicating that a relatively small subset of taxa contributed disproportionately to overall insect abundance (Table 3). The full list of insect taxa and their relative abundances across study sites and years is presented in Supplementary Table S1.
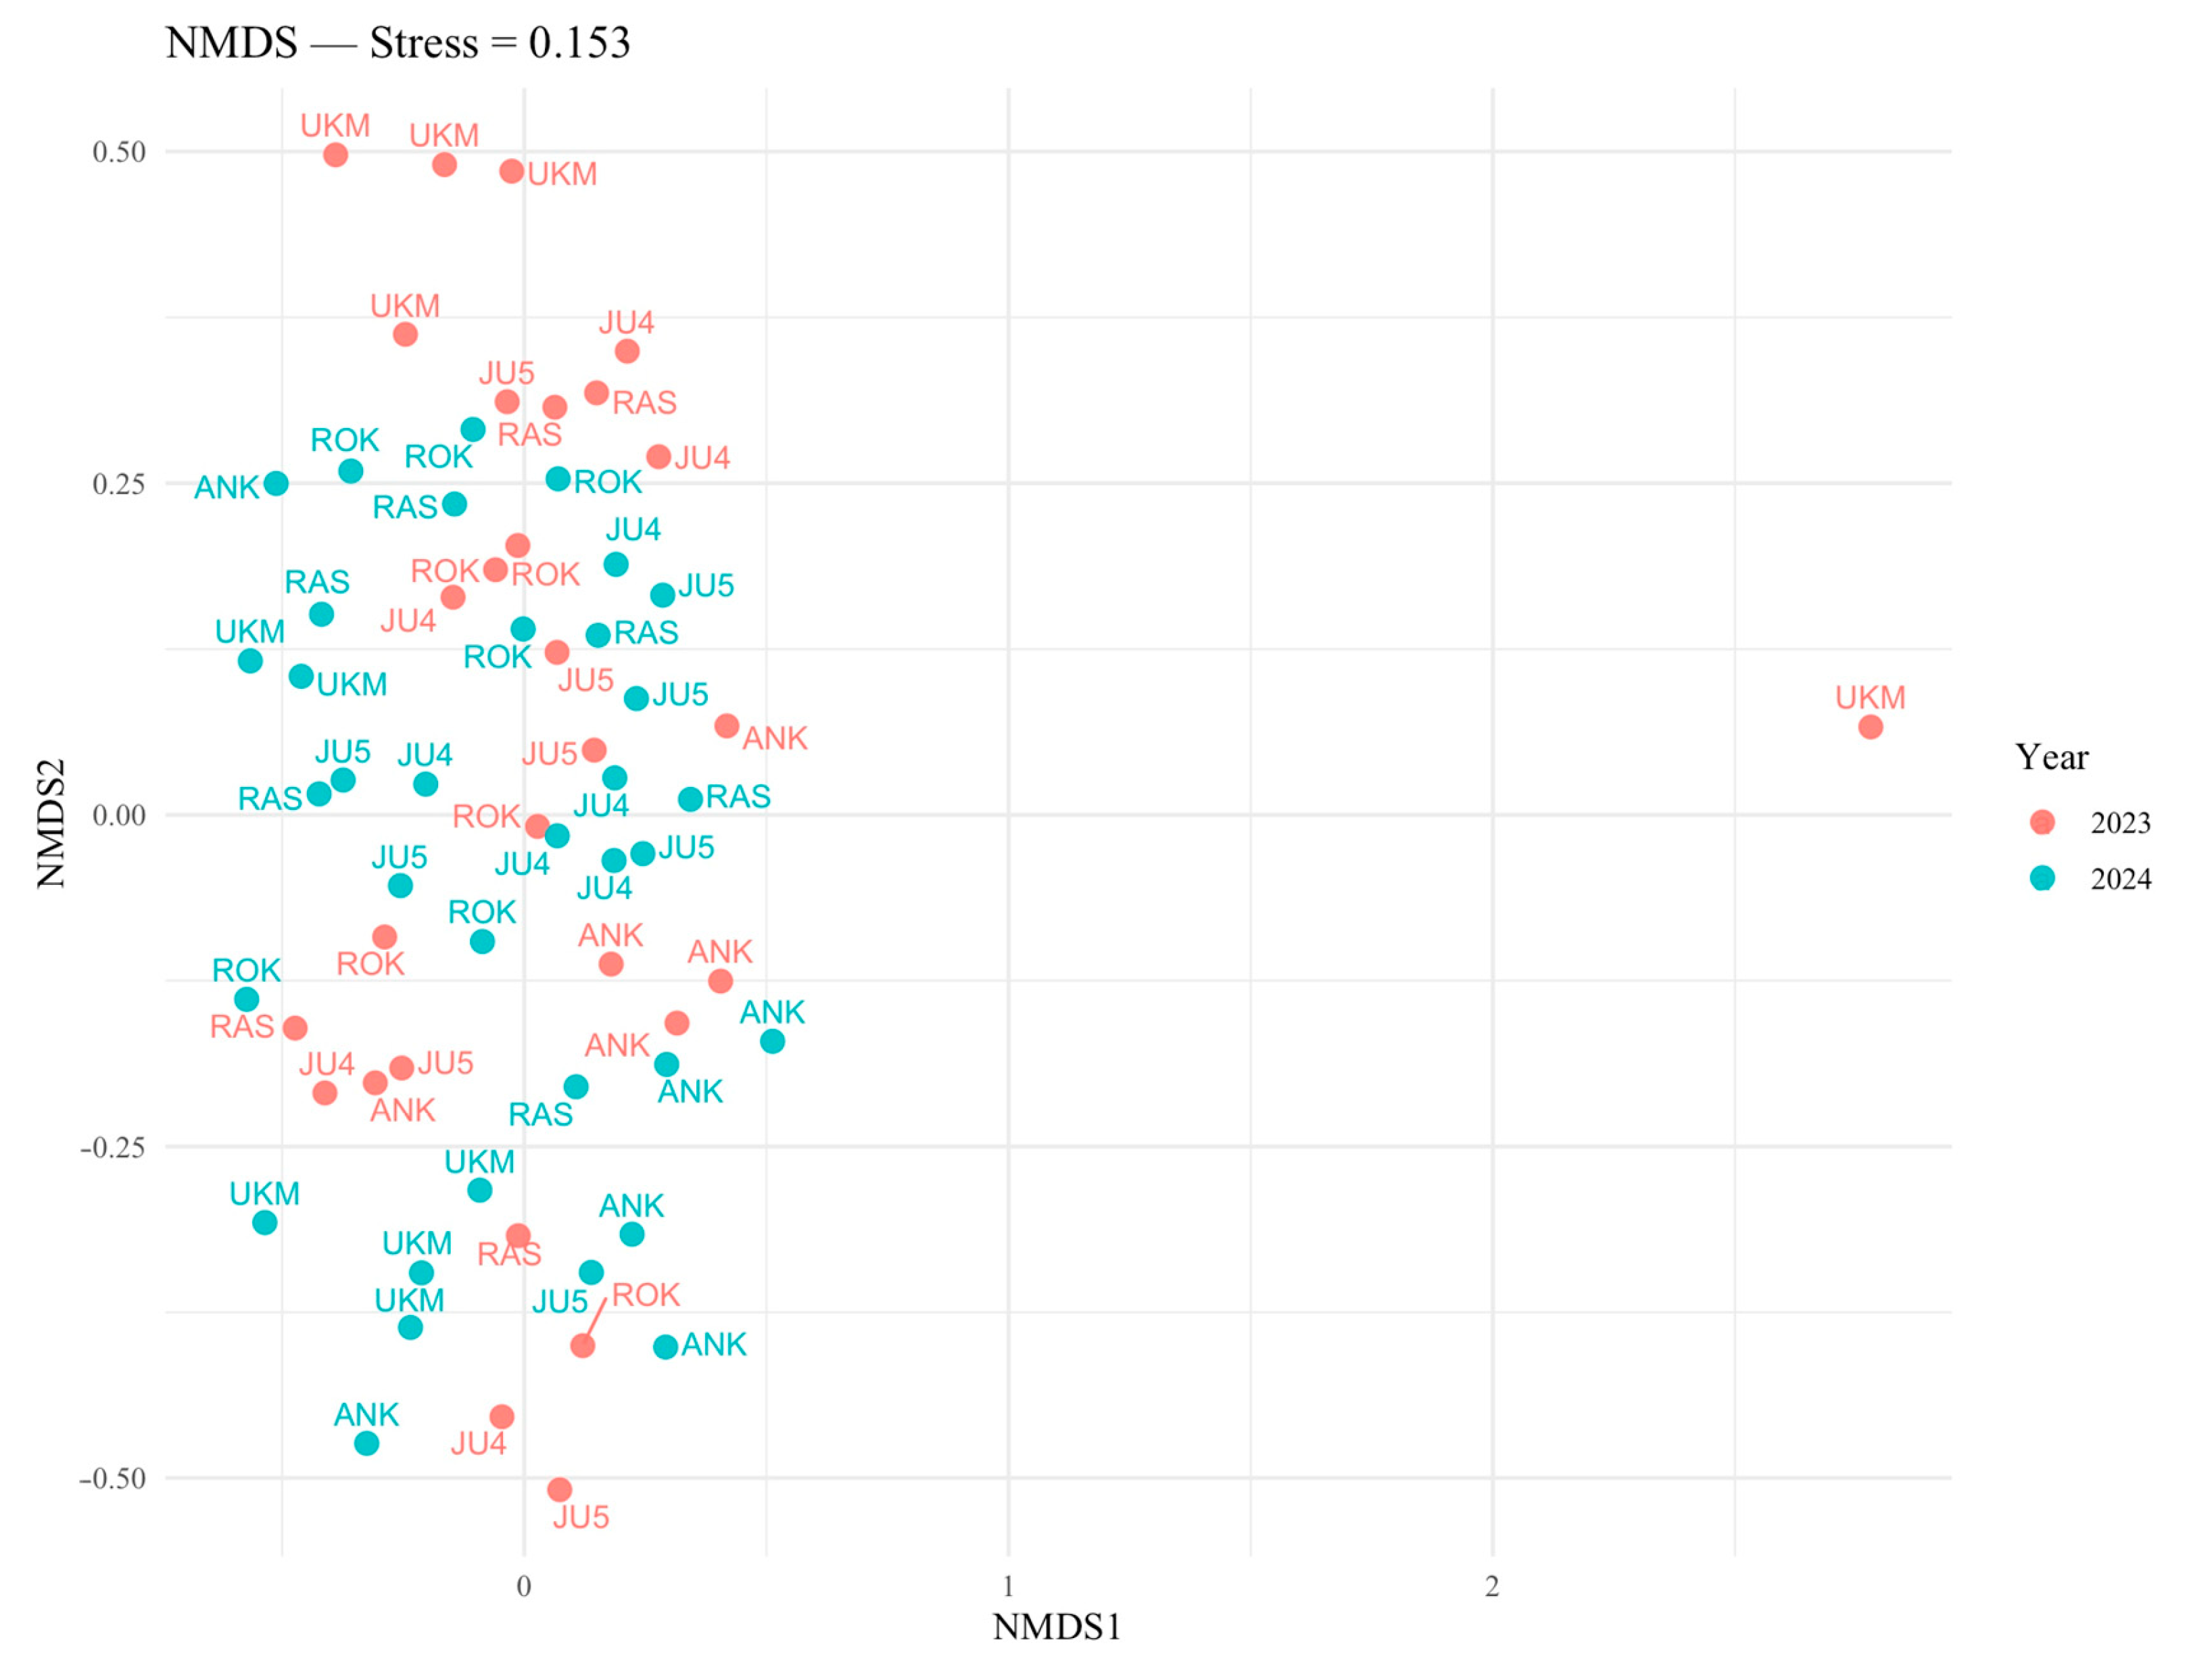
The two-dimensional NMDS ordination (stress = 0.153) showed a moderate fit, indicating some distortion in representing the full multivariate structure in two dimensions. Ordination points for different years were largely overlapping, suggesting that overall insect community composition was broadly similar between 2023 and 2024 and that interannual differences were relatively subtle (Figure 4). In contrast, separation among sites was more evident, consistent with the PERMANOVA results showing that site explained the largest proportion of variation in species composition (R2 = 0.151, p = 0.001). PERMANOVA also detected a significant, but smaller, effect of year (R2 = 0.041, p = 0.001) and a significant site × year interaction (R2 = 0.090, p = 0.012), indicating that modest interannual shifts in community composition occurred and that these shifts were not uniform across sites. One sampling event at the UKM site appeared as an outlier in the ordination and showed an atypical community composition, which is consistent with the likely malfunctioning of the light trap during heavy rainfall. Nevertheless, this sample was retained in all analyses. The relatively high stress value and overlapping NMDS configurations therefore support the interpretation that communities remained broadly similar among years, with statistically detectable but visually subtle changes.
Figure 4. Ordination based on non-metric multidimensional scaling (NMDS) of insect assemblages sampled using light traps across the study sites in 2023 and 2024. Symbols indicate individual sampling events. Different symbols/labels correspond to different sites and years (see legend). The ordination primarily reflects differences in community composition among sites.
Diversity 18 00378 g004

3.2. Effect of Climatic Factors and T. cordata Genetics on Insect Diversity Metric

The linear regression model of log-transformed insect abundance was statistically significant (F = 2.96, p = 0.008, adjusted R2 = 0.30) and explained about 30% of the variation in abundance. The effect of temperature on log-transformed abundance was positive and statistically significant (β = 0.270, SE = 0.087, t = 3.11, p = 0.003), corresponding to an approximate 31% increase in expected insect abundance per 1 °C increase in temperature, holding other variables constant (exp (0.270) = 1.31, Figure S1). Precipitation showed no evidence of an association with insect abundance (β = 0.001, SE = 0.004, t = 0.24, p = 0.82), and there was no detectable difference in the variation in precipitation-driven abundance between 2023 and 2024. (β = −0.035, SE = 0.217, t = −0.16, p = 0.87, Figure S2). These results indicate that, within the observed range, higher insect abundances were associated with substantially higher air temperatures, whereas variation in precipitation and interannual differences between 2023 and 2024 do not appear to influence insect abundance (Figures S1 and S2).
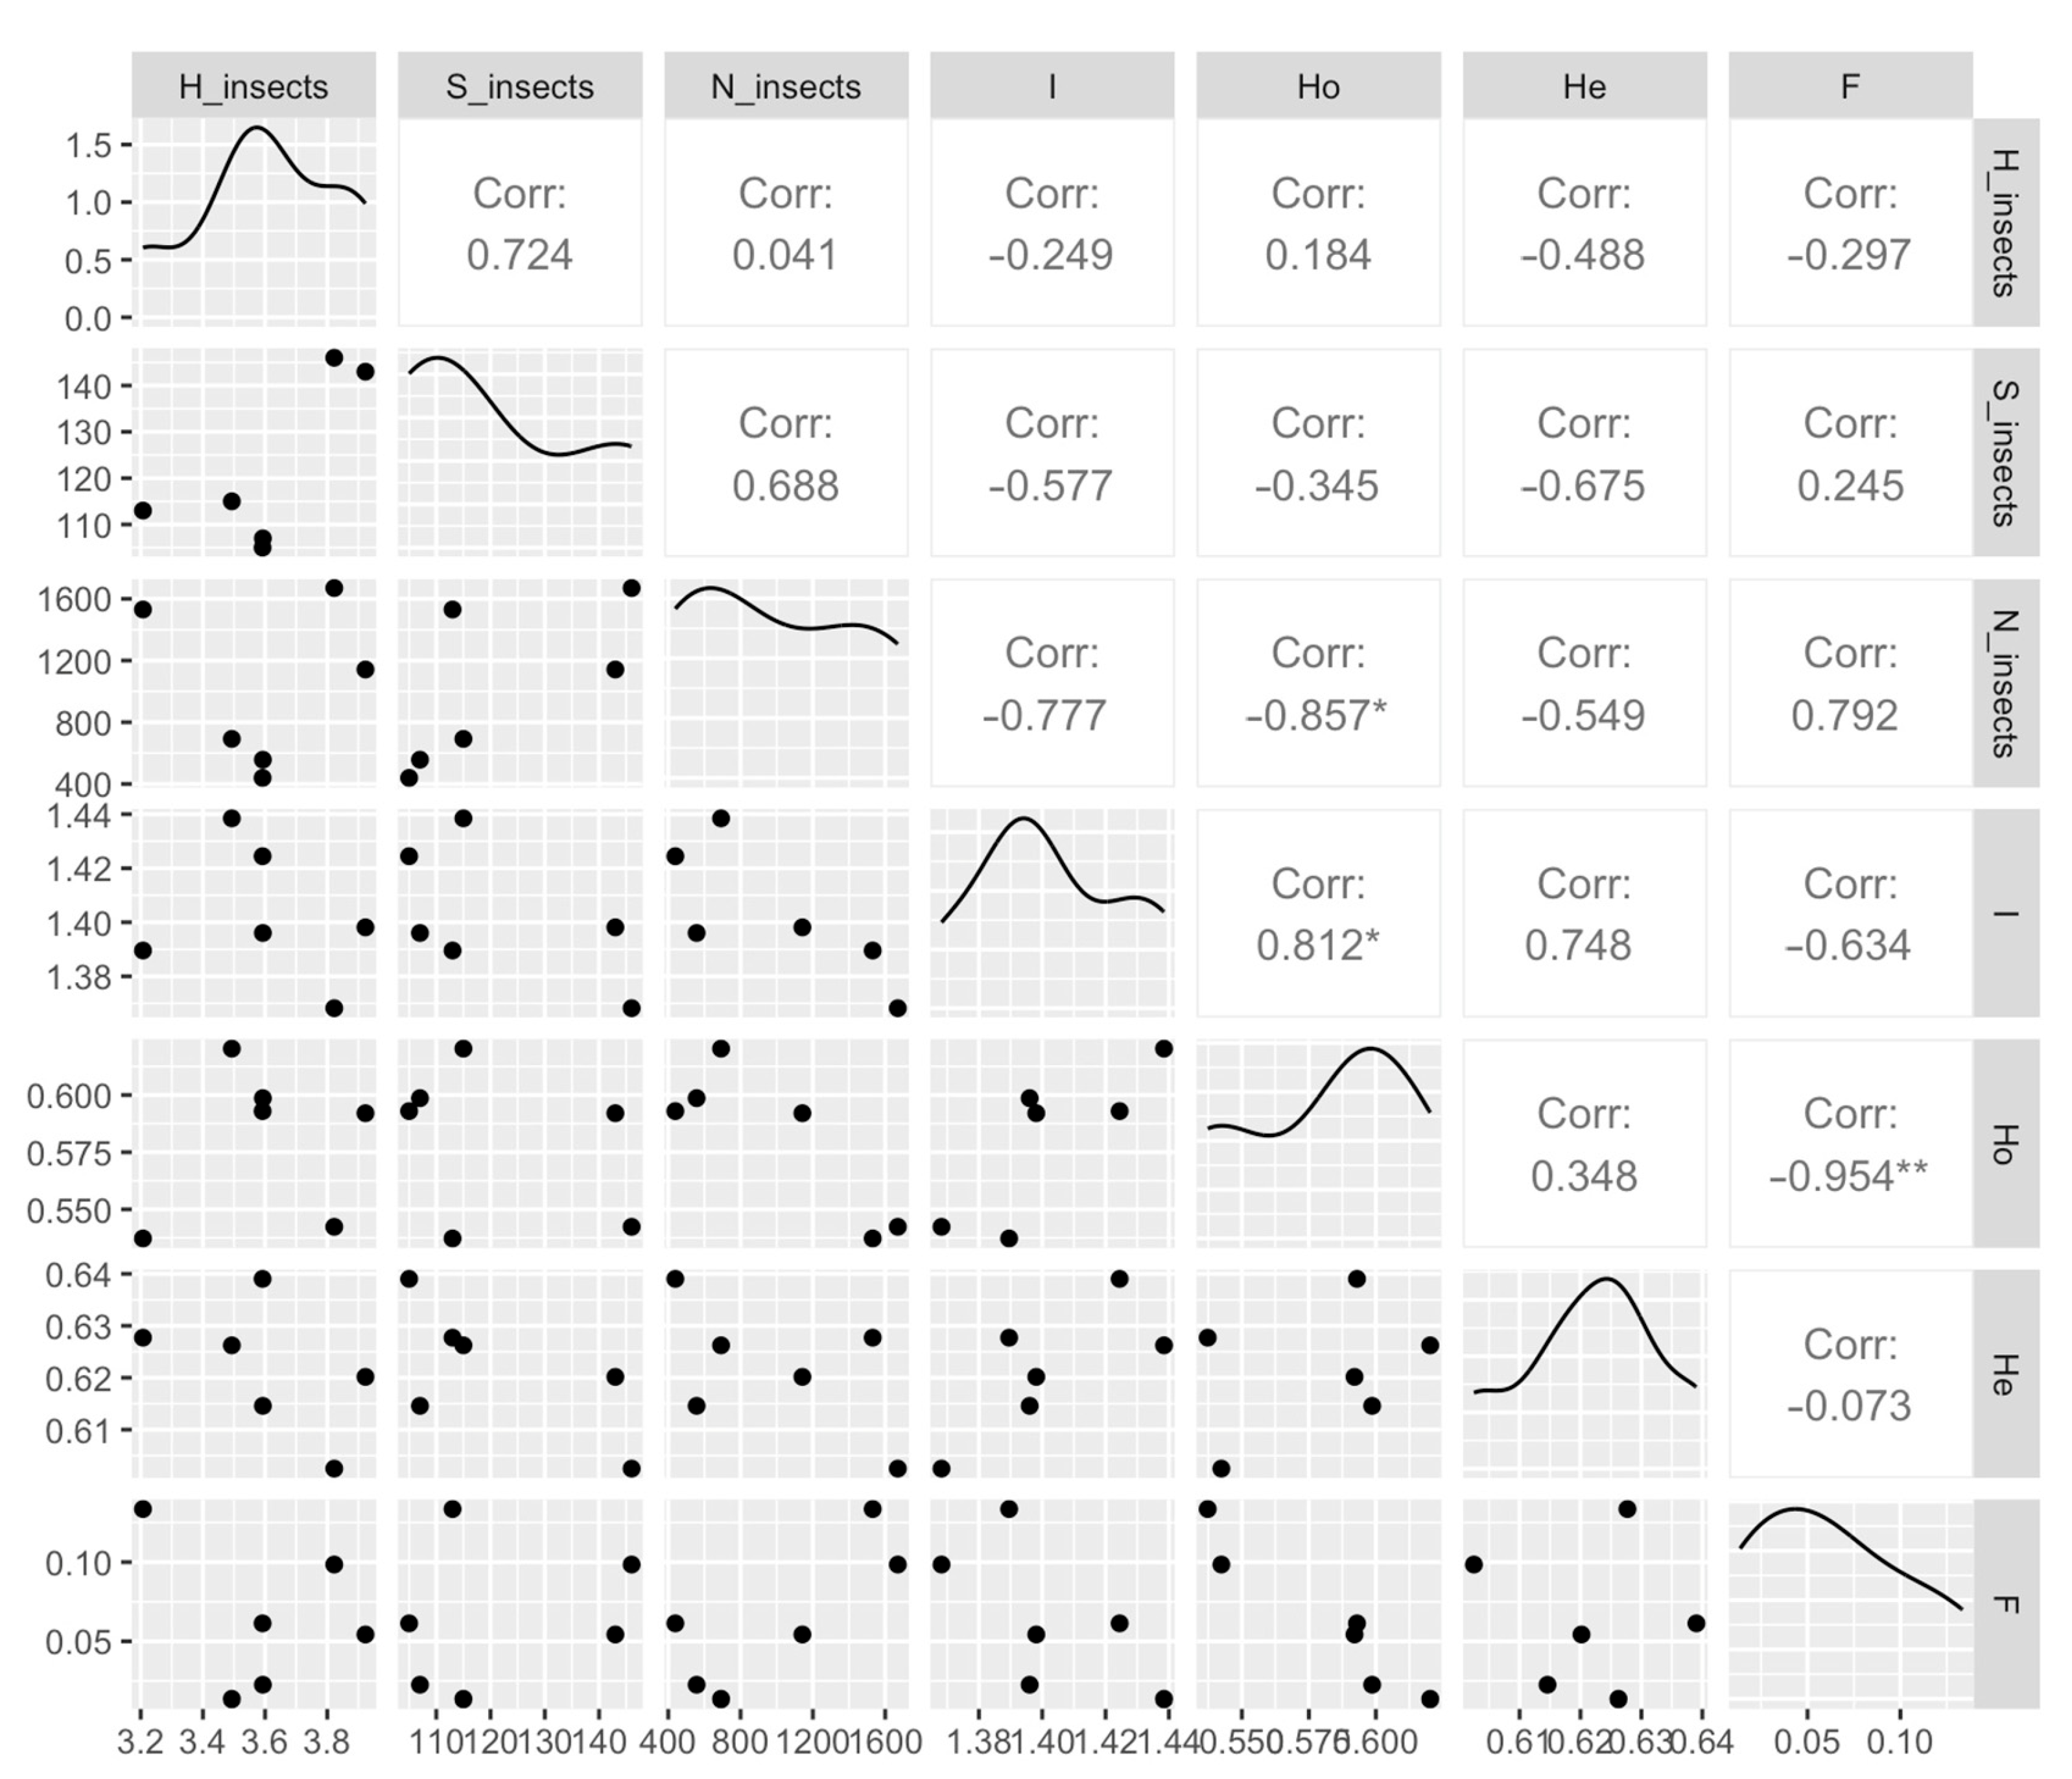
Figure 5 summarizes the pairwise relationships between insect diversity indices and genetic diversity parameters of T. cordata. The strongest association was a negative correlation between insect abundance (N_insects) and observed heterozygosity (Ho) (Pearson r = −0.857, p = 0.03), suggesting that trees with higher observed genetic diversity tended to harbor fewer individual insects. Relatively strong, though statistically non-significant, relationships were also observed between insect abundance and the inbreeding coefficient F (positive) and between insect species richness (S_insects) and expected heterozygosity He (negative). Overall, the remaining insect diversity metrics showed weak and non-significant correlations with T. cordata genetic diversity parameters, indicating that neutral genetic variation explains only a limited fraction of the variability in insect assemblage composition represented in our data.

4. Discussion

This study offers one of the earliest systematic evaluations of canopy, light-attracted insect assemblages associated with small-leaved lime trees in protected forest stands throughout Lithuania. Using canopy-mounted light traps in six Genetic Conservation Units, we documented high overall species diversity, richness, and clear spatial structuring in community composition, alongside strong interannual turnover in dominant taxa. The results underscore the role of mature T. cordata forests as important reservoirs of insect diversity and illustrate how local stand characteristics, surrounding landscape context, and short-term climatic conditions jointly shape canopy insect communities. The relationship between insect diversity and host genetic diversity has been largely unexplored. Consequently, this investigation constitutes a systematic effort to explore this relationship in order to improve the understanding of ecological processes in forest ecosystems in Lithuania.
Across both years, the T. cordata GCUs supported species-rich communities of light-attracted insects, with Shannon diversity values and species richness comparable to or exceeding those reported for canopy-dwelling arthropods in other temperate broadleaved forests or in forests with conifer mixtures [57]. Previously collected data from the same sites and study years (2023–2024) allow a direct comparison between ground-/lower-canopy and canopy-level insect communities. In the lower canopy/understory, standardized sweep-net sampling yielded 5045 individuals representing 207 taxa [13], whereas our canopy-mounted light traps recorded 6031 individuals representing 295 light-attracted insect taxa. These results indicate that both strata support species-rich assemblages but differ in taxonomic composition and sampling selectivity (active day-flying vs. nocturnal/light-attracted insects), consistent with documented vertical stratification in forest insect communities [6,58].
The data show significantly higher abundance, species richness, and Shannon diversity in 2024 compared to 2023. Interannual differences in abundance, species richness, and Shannon diversity of comparable magnitude to those observed here are common in forest insect assemblages and are often linked to year-to-year variation in temperature, resource availability, and phenology [26]. For example, Bouget and Duelli (2004) [59] and Ulyshen (2011) [6] reported pronounced interannual fluctuations in canopy-dwelling beetles and other arthropods in European temperate and boreal forests, emphasizing the sensitivity of tree-associated insect communities to short-term climatic and phenological shifts. Our finding of higher abundance and diversity in 2024 is therefore consistent with documented high natural interannual variability in insect–tree systems in this region and should be interpreted as reflecting short-term fluctuations rather than a longer-term directional trend [60].
Spatial differentiation among sites was pronounced. GCUs in south-western Lithuania (JU4, JU5) consistently exhibited the highest insect abundance and diversity, whereas central Lithuania (UKM) supported comparatively distinct assemblages. Pairwise Sørensen indices indicated moderate compositional similarity overall, with the greatest similarity between JU4 and JU5, reflecting their geographic proximity, similar stand characteristics and shared landscape context. These patterns suggest that even within a single tree species and forest type, canopy-dwelling insect communities can differ substantially over relatively modest spatial scales, likely in response to variation in microclimate, stand structure, management history, and surrounding land use [61]. The lower similarity of UKM with other GCUs may be related to differences in soil conditions, forest composition, or landscape configuration, including the degree of isolation from other mature broadleaved stands [62]. Likewise, RAS, bordered by agricultural land, and ANK, adjacent to a clear-cut with abundant natural regeneration, are embedded in more heterogeneous landscapes that may favor species associated with forest edges or early successional habitats [31]. Our finding that the site was the main factor explaining variation in community composition is in line with previous work demonstrating strong spatial structuring of forest insect communities at stand and landscape scales [9].
A comparatively limited subset of insect species comprised a substantial proportion of all individuals. The 20 most abundant light-attracted taxa comprise over 60% of individuals across both years. Such dominance by a limited number of species or higher-level taxa is typical of insect assemblages sampled with light traps, which selectively attract certain nocturnal groups [18,23].
Nonetheless, the strong shift in community dominance structure between 2023 and 2024 is noteworthy. In 2023, the scarab beetle Serica brunnea was the single most abundant species, whereas in 2024 it nearly disappeared from the catches, and relative abundances became more evenly distributed among several Coleoptera, Diptera, and Lepidoptera taxa. Such year-to-year shifts in dominant taxa are likely influenced by a combination of factors, including weather-related variation in phenology and flight activity, density-dependent population dynamics, and landscape-level processes such as dispersal or local outbreaks [21,63,64,65,66]. For univoltine soil-dwelling beetles such as many Scarabaeidae, small differences in temperature and soil moisture during key developmental stages can strongly affect larval survival, pupation success, and the timing and magnitude of adult emergence peaks, leading to marked inter-annual variability in adult abundance even under modest differences in weather during the flight period [67], as shown by [26,68]. Pronounced inter-annual fluctuations in abundance and dominance of individual insect species have likewise been documented in long-term monitoring of other taxa and are frequently linked to climate-driven variation in development rates, overwintering success, and cohort synchrony [21,25].
In this context, the near absence of S. brunnea in 2024 may therefore reflect cohort dynamics or unfavorable conditions during earlier life stages rather than a decline in the broader canopy insect community. For example, altered soil temperature and moisture regimes in the year(s) preceding adult emergence could have reduced larval survival or shifted emergence outside the sampling window, as shown for other root-feeding Coleoptera and soil-dwelling scarabs [26]. Dispersal behavior and aggregation responses to local habitat conditions may further modulate apparent dominance at individual sites and years [27]. Conversely, the increased relative abundance of taxa such as Colymbetes fuscus, Lauxaniidae and various Lepidoptera in 2024 underscores the temporal variability in which functional groups dominate the canopy assemblage and mirrors patterns reported from other insect communities, where different guilds assume dominance under contrasting climatic regimes or in different years [21]. A more mechanistic understanding of these dynamics will require integration of species-specific life-history information (e.g., voltinism, larval habitat, and phenology of S. brunnea) with high-resolution local climatic data across relevant temporal lags [25,26,68].
Our regression results are consistent with the general expectation that warmer conditions enhance insect activity, development rates, and detectability in temperate forests. However, given the relatively short (two-year) temporal span and the limited range of climatic conditions covered, the inferred relationships between weather and insect abundance should be viewed as indicative rather than definitive, and they highlight the need for longer-term monitoring across broader climatic gradients.
From a conservation and monitoring perspective, the observed interannual changes in dominant taxa highlight the importance of multi-year datasets when assessing canopy insect diversity and community structure [35,63]. Single-year surveys may overemphasize transient peaks or troughs in particular species and thus provide a misleading picture of longer-term community dynamics. While our two-year dataset is still short relative to the temporal scales of climate change and forest management, it already demonstrates that canopy insect assemblages in T. cordata stands are dynamic and likely influenced by year-to-year variation in environmental conditions.
The positive association between air temperature and insect abundance identified in this study aligns with a broad body of experimental and observational work demonstrating that elevated temperatures generally enhance insect metabolic rates, movement, and flight activity, and, over longer time scales, can promote population growth up to species-specific thermal optima [25,26,27]. In the specific context of light trapping, warmer nights are known to increase flight activity and trap catches of many nocturnal Lepidoptera and other insects [22]. In contrast, the absence of a detectable effect of precipitation on insect abundance is consistent with findings from systems where short-term variation in rainfall exerts weaker or more context-dependent influences on insect activity and population dynamics than temperature. First, the temporal resolution of our precipitation data (totals over trapping intervals) may not capture short, intense rainfall events that can directly suppress flight activity during specific nights. Second, many nocturnal insects can resume activity quickly after rainfall if temperatures remain suitable, potentially diluting the effect of precipitation when averaged over the sampling period [69]. Third, the canopy position of the traps may provide some shelter from light rain, and canopy insects may be less exposed to ground-level microclimatic variation, emphasizing temperature over precipitation as the primary short-term driver of activity [4,6].
Importantly, although 2024 exhibited higher overall diversity metrics, the regression model did not detect a direct year effect on abundance once temperature and precipitation were accounted for, suggesting that the observed increase in diversity is driven more by changes in community composition and evenness than by a simple rise in total individual numbers. This finding underscores that climate-insect relationships may differ among abundance, richness, and community structure, and that a mechanistic understanding requires the joint consideration of multiple facets of diversity [9,25].
Consistent with this more nuanced view, our analysis of light-attracted canopy insects in protected T. cordata Lithuanian forests revealed only weak and statistically unreliable correlations between insect diversity indices and neutral genetic diversity parameters of the host trees, suggesting that in this system any effects of host genetic diversity on the broader insect assemblage are modest relative to other environmental and stochastic drivers. One explanation for the absence of clear correlations between insect diversity metrics and T. cordata genetic diversity parameters is that the genetic data used here were based on neutral microsatellite markers, which are well suited for describing overall population structure and diversity, but may be less effective for detecting functional variation directly related to local adaptation and plant traits influencing associated insect assemblages [70,71,72]. In this context, higher-resolution approaches such as SNP-based analyses or whole-genome sequencing could provide a more sensitive assessment of adaptive genetic differences among stands [71,72]. In addition, all study sites were located in protected areas with relatively limited human impact and broadly comparable conservation status, which may have reduced environmental contrast among stands. Because local forest structure, heterogeneity, and management context are important drivers of insect diversity and community composition, this relative similarity among sites may have made correlations between host genetic diversity and insect diversity more difficult to detect.
Given the mixed evidence for host-plant genetic effects on arthropod communities and the reliance on neutral molecular markers, any detected associations in this study are expected to be subtle and should be interpreted in the context of other environmental drivers and sampling limitations. By focusing on canopy-level communities in a network of protected T. cordata stands, this study provides novel baseline information on the biodiversity value of lime-dominated forests in northeastern Europe and a framework for future, more targeted tests of genetic effects on associated insect communities.
The documented high diversity and distinct community composition of canopy-dwelling insects in T. cordata GCUs reinforce the notion that genetic conservation and seed stands can provide substantial additional biodiversity benefits beyond their primary function of conserving tree genetic resources [11,12,34]. Mature, relatively unmanaged stands with a high proportion of T. cordata and structurally complex canopies likely promote habitat heterogeneity and resource availability for a broad spectrum of insect taxa, encompassing herbivorous, predatory species, and pollinators [1]. Given widespread concern about insect declines and homogenization of biotas in intensively managed landscapes [9,35], the maintenance and proper management of such stands may be particularly important for preserving regionally characteristic canopy insect assemblages. Our findings also suggest that spatial representativeness within conservation networks is critical. The compositional distinctness of UKM and the influence of surrounding land use at RAS and ANK indicate that insect communities in T. cordata canopies are sensitive to both local stand conditions and landscape context, in line with metacommunity perspectives on forest insect biodiversity [62,73]. Therefore, ensuring that GCUs collectively encompass the range of environmental conditions and landscape configurations occupied by T. cordata may help capture a broader spectrum of associated insect diversity.
Furthermore, the strong link between temperature and insect abundance observed in this study has implications under ongoing climate warming. Increased average temperatures and more frequent warm nights in the vegetation season could lead to higher activity levels and potentially greater voltinism for some canopy insects but may also exacerbate the risk of population outbreaks for certain herbivores, with cascading effects on forest health [26,74]. Long-term monitoring of canopy insect communities in GCUs could thus support early detection of changes associated with climate warming and inform adaptive forest management strategies.
Finally, given the conservation significance of T. cordata and its associated biota, it would be valuable to explore the degree of host specificity and functional dependence of key canopy insect taxa on T. cordata relative to co-occurring tree species. Such information could clarify the potential consequences of shifts in tree species composition for canopy insect communities and associated ecosystem functions, including pollination, herbivory, and nutrient cycling [1,6,75].

5. Conclusions

In general, mature Tilia cordata Genetic Conservation Units and related protected stands in Lithuania support diverse and spatially structured assemblages of light-attracted canopy-dwelling insects. Over the two sampled years, community composition varied markedly among stands and between years, with a small number of dominant taxa contributing disproportionately to total abundance and with clear positive effects of air temperature on insect abundance. These short-term patterns highlight the ecological value of T. cordata conservation stands for forest insect biodiversity, emphasize the importance of spatial and temporal replication in canopy insect surveys, and underline the need for long-term, climate-sensitive monitoring of forest canopy communities in temperate Europe to determine whether the observed patterns are persistent or reflect short-term fluctuations. Although overall no significant correlations between insect biological and host genetic diversities were detected, several modest or strong associations suggest the importance of conducting more comprehensive analyses in future research.

Supplementary Materials

The following supporting information can be downloaded at https://www.mdpi.com/article/10.3390/d18060378/s1. Figure S1: A linear model with log-transformed insect abundance showing the relationship between abundance and air temperature (t0 C) across study sites and years. Figure S2: A linear model with log-transformed insect abundance showing the relationship between abundance and precipitation (mm) across study sites and years. Table S1: Relative abundance (%) of all light-attracted insects across study sites at Tilia cordata GCUs in 2023–2024. Table S2. Mean air temperature and total precipitation during the light-trapping intervals, based on data from the meteorological station nearest to the study site.

Author Contributions

Conceptualization, J.L., A.G., and R.V.; methodology, J.L., A.G., R.V., and A.M.; validation, J.L. and A.G.; formal analysis, J.L., A.G., R.V., and V.M.; investigation, J.L., A.G., and R.V.; data curation, J.L., A.G., and R.V.; writing—original draft preparation, J.L., R.V., and A.M.; writing—review and editing, J.L., A.G., R.V., V.B., V.M., and A.M.; visualization, J.L., V.M., and A.M.; supervision, V.B.; project administration, J.L., R.V., and V.B.; funding acquisition, J.L., A.G., R.V., and V.B. All authors have read and agreed to the published version of the manuscript.

Funding

This project has received funding from the Research Council of Lithuania (LMTLT), agreement No [S-MIP-23-21].

Data Availability Statement

The original contributions presented in this study are included in the article’s Supplementary Material. Further inquiries can be directed to the corresponding author.

Conflicts of Interest

The authors declare no conflicts of interest.

References

  1. Schuldt, A.; Baruffol, M.; Böhnke, M.; Bruelheide, H.; Härdtle, W.; Lang, A.C.; Nadrowski, K.; Von Oheimb, G.; Voigt, W.; Zhou, H.; et al. Tree diversity promotes insect herbivory in subtropical forests of south east China. J. Ecol. 2010, 98, 917–926. [Google Scholar] [CrossRef] [PubMed]
  2. Stamps, W.T.; Linit, M.J. Plant diversity and arthropod communities: Implications for temperate agroforestry. Agrofor. Syst. 1998, 39, 73–89. [Google Scholar] [CrossRef]
  3. Hébert, C. Forest Arthropod Diversity. In Forest Entomology and Pathology; Allison, J.D., Paine, T.D., Slippers, B., Wingfield, M.J., Eds.; Springer: Cham, Switzerland, 2023. [Google Scholar] [CrossRef]
  4. Ozanne, C.M.P.; Anhuf, D.; Boulter, S.L.; Keller, M.; Kitching, R.L.; Körner, C.; Meinzer, F.C.; Mitchell, A.W.; Nakashizuka, T.; Dias, P.L.S.; et al. Biodiversity meets the atmosphere: A global view of forest canopies. Science 2003, 301, 183–186. [Google Scholar] [CrossRef] [PubMed]
  5. Lowman, M.D.; Rinker, H.B. (Eds.) Forest Canopies, 2nd ed.; Elsevier Academic Press: Burlington, MA, USA, 2004; pp. 73–106. [Google Scholar]
  6. Ulyshen, M.D. Arthropod vertical stratification in temperate deciduous forests: Implications for conservation-oriented management. For. Ecol. Manag. 2011, 261, 1479–1489. [Google Scholar] [CrossRef]
  7. Basset, Y.; Cizek, L.; Cuenoud, P.; Didham, R.K.; Guilhaumon, F.; Missa, O.; Novotny, V.; Ødegaard, F.; Roslin, T.; Schmidl, J.; et al. Arthropod diversity in a tropical forest. Science 2012, 338, 1481–1484. [Google Scholar] [CrossRef] [PubMed]
  8. Leather, S.R. (Ed.) Insect Sampling in Forest Ecosystems; John Wiley & Sons: Chichester, UK, 2008. [Google Scholar]
  9. Seibold, S.; Gossner, M.M.; Simons, N.K.; Blüthgen, N.; Müller, J.; Ambarlı, D.; Ammer, C.; Bauhus, J.; Fischer, M.; Habel, J.C.; et al. Arthropod decline in grasslands and forests is associated with landscape-level drivers. Nature 2019, 574, 671–674. [Google Scholar] [CrossRef] [PubMed]
  10. Pigott, C.D. Lime-Trees and Basswoods: A Biological Monograph of the Genus Tilia; Cambridge University Press: Cambridge, UK, 2012. [Google Scholar]
  11. Koskela, J.; Vinceti, B.; Dvorak, W.; Bush, D.; Dawson, I.K.; Loo, J.; Kjaer, E.D.; Navarro, C.; Padolina, C.; Bordács, S.; et al. Utilization and transfer of forest genetic resources: A global review. For. Ecol. Manag. 2013, 333, 22–34. [Google Scholar] [CrossRef]
  12. Bozzano, M.; Jalonen, R.; Thomas, E.; Boshier, D.; Gallo, L.; Cavers, S.; Bordács, S.; Smith, P.; Loo, J. Genetic Considerations in Ecosystem Restoration Using Native Tree Species. State of the World’s Forest Genetic Resources—Thematic Study; FAO: Rome, Italy; Bioversity International: Rome, Italy, 2014; 281p. [Google Scholar]
  13. Lynikienė, J.; Gedminas, A.; Verbylaitė, R.; Baliuckas, V.; Mishcherikova, V.; Suchockas, V. Diversity Patterns of Insect Assemblages in Tilia cordata Stands in Lithuanian Protected Areas: A Two-Year Study Indicating Modest Support for Pollinator Guilds. Insects 2026, 17, 360. [Google Scholar] [CrossRef] [PubMed]
  14. Pozsgai, G.; Baird, J.; Littlewood, N.A.; Pakeman, R.J.; Young, M.R. Long-term changes in ground beetle (Coleoptera: Carabidae) assemblages in Scotland. Ecol. Entomol. 2016, 41, 157–167. [Google Scholar] [CrossRef]
  15. Seibold, S.; Rammer, W.; Hothorn, T.; Seidl, R.; Ulyshen, M.D.; Lorz, J.; Cadotte, M.W.; Lindenmayer, D.B.; Adhikari, Y.P.; Aragón, R.; et al. The contribution of insects to global forest deadwood decomposition. Nature 2021, 597, 77–81. [Google Scholar] [CrossRef] [PubMed]
  16. Bar-Ness, Y.D.; McQuillan, P.B.; Whitman, M.; Junker, R.R.; Cracknell, M.; Barrows, A. Sampling Forest canopy arthropod biodiversity with three novel minimal-cost trap designs. Aust. J. Entomol. 2012, 51, 12–21. [Google Scholar] [CrossRef]
  17. Schowalter, T.; Chao, J.T. Canopy Insect Sampling. In Measuring Arthropod Biodiversity; Santos, J.C., Fernandes, G.W., Eds.; Springer: Cham, Switzerland, 2021. [Google Scholar] [CrossRef]
  18. Yela, J.L.; Holyoak, M. Effects of moonlight and meteorological factors on light and bait trap catches of noctuid moths (Lepidoptera: Noctuidae). Environ. Entomol. 1997, 26, 1283–1290. [Google Scholar] [CrossRef]
  19. Wang, Q.; Guo, Z.; Zhang, J.; Chen, Y.; Zhou, J.; Pan, Y.; Liu, X. Phototactic behavioral response of the ectoparasitoid beetle Dastarcus helophoroides (Coleoptera: Bothrideridae): Evidence for attraction by near-infrared light. J. Econ. Entomol. 2021, 114, 1549–1556. [Google Scholar] [CrossRef] [PubMed]
  20. Wilson, R.; Wakefield, A.; Roberts, N.; Jones, G. Artificial light and biting flies: The parallel development of attractive light traps and unattractive domestic lights. Parasites Vectors 2021, 14, 28. [Google Scholar] [CrossRef] [PubMed]
  21. Conrad, K.F.; Warren, M.S.; Fox, R.; Parsons, M.S.; Woiwod, I.P. Rapid declines of common, widespread British moths provide evidence of an insect biodiversity crisis. Biol. Conserv. 2006, 132, 279–291. [Google Scholar] [CrossRef]
  22. Fox, R.; Oliver, T.H.; Harrower, C.; Parsons, M.S.; Thomas, C.D.; Roy, D.B. Long-term changes to the frequency of occurrence of British moths are consistent with opposing and synergistic effects of climate and land-use changes. J. Appl. Ecol. 2014, 51, 949–957. [Google Scholar] [CrossRef] [PubMed]
  23. Szentkirályi, F. Fifty-year-long insect survey in Hungary: T. Jermy’s contributions to light-trapping. Acta Zool. Acad. Sci. Hung. 2002, 48, 85–105. [Google Scholar]
  24. Ozanne, C.M. Techniques and methods for sampling canopy insects. In Insect Sampling in Forest Ecosystems; Leather, S.R., Ed.; Blackwell Science: Oxford, UK, 2005; pp. 146–167. [Google Scholar] [CrossRef]
  25. Altermatt, F. Climatic warming increases voltinism in European butterflies and moths. Proc. R. Soc. B Biol. Sci. 2010, 277, 1281–1287. [Google Scholar] [CrossRef]
  26. Bale, J.S.; Masters, G.J.; Hodkinson, I.D.; Awmack, C.; Bezemer, T.M.; Brown, V.K.; Butterfield, J.; Buse, A.; Coulson, J.C.; Farrar, J.; et al. Herbivory in global climate change research: Direct effects of rising temperature on insect herbivores. Glob. Change Biol. 2002, 8, 1–16. [Google Scholar] [CrossRef]
  27. Wilson, R.J.; Maclean, I.M.D. Recent evidence for the climate change threat to Lepidoptera and other insects. J. Insect Conserv. 2011, 15, 259–268. [Google Scholar] [CrossRef]
  28. Parmesan, C. Ecological and evolutionary responses to recent climate change. Annu. Rev. Ecol. Evol. Syst. 2006, 37, 637–669. [Google Scholar] [CrossRef]
  29. Yoshida, T.; Kusunoki, Y.; Fukano, Y.; Hijii, N. Vertical distribution of arthropod assemblages and the effects of weather conditions on arthropod rain in a temperate conifer forest. Front. For. Glob. Change 2021, 4, 672601. [Google Scholar] [CrossRef]
  30. Nereu, M.; Silva, J.S.; Timóteo, S. Site and landscape scale drivers of bird and insect diversity in native and novel forest ecosystems of Central Portugal. For. Ecol. Manag. 2024, 553, 121634. [Google Scholar] [CrossRef]
  31. Holland, J.; Fahrig, L. Effect of woody borders on insect density and diversity in crop fields: A landscape-scale analysis. Agric. Ecosyst. Environ. 2000, 78, 115–122. [Google Scholar] [CrossRef]
  32. Deans, A.M.; Malcolm, J.R.; Smith, S.M.; Bellocq, M.I. Edge effects and the responses of aerial insect assemblages to structural-retention harvesting in Canadian boreal peatland forests. For. Ecol. Manag. 2005, 204, 249–266. [Google Scholar] [CrossRef]
  33. Stone, M.J.; Catterall, C.P.; Stork, N.E. Edge effects and beta diversity in ground and canopy beetle communities of fragmented subtropical forest. PLoS ONE 2018, 13, e0193369. [Google Scholar] [CrossRef] [PubMed]
  34. Trudić, B.; Stojnić, S.; Avramidou, E.V.; Malliarou, E. Forest Genetic Resources Under Climate Change and International Framework: Conservation Measures of Serbia and Greece. In Ecological Connectivity of Forest Ecosystems; Lapin, K., Oettel, J., Braun, M., Konrad, H., Eds.; Springer: Cham, Switzerland, 2025. [Google Scholar] [CrossRef]
  35. Hallmann, C.A.; Sorg, M.; Jongejans, E.; Siepel, H.; Hofland, N.; Schwan, H.; Stenmans, W.; Müller, A.; Sumser, H.; Hörren, T.; et al. More than 75 percent decline over 27 years in total flying insect biomass in protected areas. PLoS ONE 2017, 12, e0185809. [Google Scholar] [CrossRef] [PubMed]
  36. Whitham, T.G.; Young, W.P.; Martinsen, G.D.; Gering, C.A.; Scheweitzer, J.A.; Shuster, S.M.; Wimp, G.M.; Fischer, D.C.; Bailey, J.K.; Lindroth, R.L.; et al. Community and ecosystem genetics: A consequence of the extended phenotype. Ecology 2003, 84, 559–573. [Google Scholar] [CrossRef]
  37. Whitham, T.G.; Bailey, J.K.; Scheweitzer, J.A.; Shuster, S.M.; Bangert, R.K.; LeRoy, C.J.; Lonsdorf, E.V.; Allan, G.J.; DiFazio, S.P.; Potts, B.M.; et al. A framework for community and ecosystem genetics: From genes to ecosystems. Nat. Rev. Genet. 2006, 7, 510–523. [Google Scholar] [CrossRef] [PubMed]
  38. Hughes, A.R.; Inouye, B.D.; Johnson, T.J.; Underwood, N.; Vellend, M. Ecological consequences of genetic diversity. Ecol. Lett. 2008, 11, 609–623. [Google Scholar] [CrossRef] [PubMed]
  39. Dungey, H.S.; Potts, B.M.; Whitham, T.G.; Li, H.F. Plant genetics affects arthropod community richness and composition: Evidence from a synthetic eucalypt hybrid population. Evolution 2000, 54, 1938–1946. [Google Scholar] [CrossRef]
  40. Wimp, G.M.; Young, P.W.; Woolbright, S.A.; Martinsen, G.D.; Keim, P.; Whitham, T.G. Conserving plant genetic diversity for dependent animal communities. Ecol. Lett. 2004, 7, 776–780. [Google Scholar] [CrossRef]
  41. Tovar-Sánchez, E. Transgressive character expression in hybrid zones between the native invasives Tithonia tubaeformis and Tithonia rotundifolia (Asteraceae) in Mexico. Plant Syst. Evol. 2013, 299, 1781–1792. [Google Scholar] [CrossRef]
  42. Wimp, G.M.; Wooley, S.; Bangert, K.; Young, W.P.; Martinsen, G.D.; Keim, P.; Rehill, B.; Lindroth, R.L.; Whitham, T.G. Plant genetics, intra-annual variation in phytochemistry and arthropod community structure. Mol. Ecol. 2007, 16, 5057–5069.
  43. Crutsinger, G.M.; Collins, M.D.; Fordyce, J.A.; Gompert, Z.; Nice, C.C.; Sanders, D.J. Plant genotypic diversity predicts community structure and governs an ecosystem process. Science 2006, 313, 966–968. [Google Scholar] [CrossRef] [PubMed]
  44. Tack, A.J.; Ovaskainen, O.; Pulkkinen, P.; Roslin, T. Spatial location dominates over host plant genotype in structuring an herbivore community. Ecology 2010, 91, 2660–2672. [Google Scholar] [CrossRef] [PubMed]
  45. Tack, A.J.; Johnson, M.T.J.; Roslin, T. Sizing up community genetics: It’s a matter of scale. Oikos 2012, 121, 481–488. [Google Scholar] [CrossRef]
  46. Tovar-Sánchez, E.; Valencia-Cuevas, L.; Mussali-Galante, P.; Ramírez-Rodríguez, R.; Castillo-Mendoza, E. Effect of host-plant genetic diversity on oak canopy arthropod community structure in central Mexico. Rev. Chil. Hist. Nat. 2015, 88, 12. [Google Scholar] [CrossRef]
  47. Verbylaitė, R.; Lynikienė, J.; Gedminas, A.; Mishcherikova, V.; Baliuckas, V.; Suchockas, V. Genetic diversity and clonal structure of small-leaved lime (Tilia cordata Mill.) in Lithuanian protected forest areas. Plants 2026, 15, 1207. [Google Scholar] [CrossRef] [PubMed]
  48. Vaičys, M. Miško dirvožemių klasifikacija. In Lietuvos Dirvožemiai; Mokslas: Vilnius, Lithuania, 2001; pp. 1040–1043. [Google Scholar]
  49. Karazija, S. Miško tipologija. In Miško Ekologija; Padaiga, V., Stravinskienė, V., Eds.; Enciklopedija: Vilnius, Lithuania, 2008; pp. 220–254. [Google Scholar]
  50. Ivinskis, P. Lietuvos Drugių (Lepidoptera) Katalogas; Petro Ofsetas: Vilnius, Lithuania, 2004. [Google Scholar]
  51. Ivinskis, P.; Meržijevskis, A.; Rimšaitė, J. Data on new and rare for the Lithuanian fauna species of Coleoptera. In New and Rare for Lithuania Insect Species; Lithuanian Entomological Society: Vilnius, Lithuania, 2009; Volume 21, pp. 45–63. [Google Scholar]
  52. Tamutis, V.; Tamutė, B.; Ferenca, R. A catalogue of Lithuanian beetles (Insecta: Coleoptera). ZooKeys 2011, 121, 1–494. [Google Scholar] [CrossRef] [PubMed]
  53. NatureSpot. Species Library. Available online: https://www.naturespot.org/species_library (accessed on 15 May 2024).
  54. Insect-Trade. Coleoptera Catalogue. Available online: https://www.insect-trade.eu/index.php?category=coleoptera&eshop=catalogue (accessed on 10 June 2024).
  55. BugGuide. Insects and Related Arthropods. Available online: https://bugguide.net/node/view/3/bgpage (accessed on 10 February 2024).
  56. Shannon, C.E. A mathematical theory of communication. Bell Syst. Tech. J. 1948, 27, 379–423. [Google Scholar] [CrossRef]
  57. Wildermuth, B.; Penanhoat, A.; Sennhenn-Reulen, H.; Matevski, D.; Drescher, J.; Aubry-Kientz, M.; Seidel, D.; Schuldt, A. Canopy structure influences arthropod communities within and beyond tree identity effects: Insights from combining LiDAR data, insecticidal fogging and machine learning regression modelling. Ecol. Indic. 2024, 160, 111901. [Google Scholar] [CrossRef]
  58. Bouget, C.; Brin, A.; Brustel, H. Exploring the “last biotic frontier”: Are temperate forest canopies special for saproxylic beetles? For. Ecol. Manag. 2011, 261, 211–220. [Google Scholar] [CrossRef]
  59. Bouget, C.; Duelli, P. The effects of windthrow on forest insect communities: A literature review. Biol. Conserv. 2004, 118, 281–299. [Google Scholar] [CrossRef]
  60. Maguire, D.Y.; Nicole, T.; Buddle, C.M.; Bennett, E.M. Effect of fragmentation on predation pressure of insect herbivores in a north temperate deciduous forest ecosystem. Ecol. Entomol. 2015, 40, 182–186. [Google Scholar]
  61. Wardhaugh, C.W. The spatial and temporal distributions of arthropods in forest canopies: Uniting disparate patterns with hypotheses for specialisation. Biol. Rev. 2014, 89, 1021–1041. [Google Scholar] [CrossRef] [PubMed]
  62. Fahrig, L. Rethinking patch size and isolation effects: The habitat amount hypothesis. J. Biogeogr. 2013, 40, 1649–1663. [Google Scholar] [CrossRef]
  63. Hufnagel, L.; Kocsis, M. Impacts of climate change on Lepidoptera species and communities. Appl. Ecol. Environ. Res. 2011, 9, 43–72. [Google Scholar] [CrossRef]
  64. Hunter, M.D. Interactions within herbivore communities mediated by the host plant: The keystone herbivore concept. In Effects of Resource Distribution on Animal-Plant Interactions; Hunter, M.D., Ohgushi, T., Price, P.W., Eds.; Academic Press: San Diego, CA, USA, 1992; pp. 287–325. [Google Scholar] [CrossRef]
  65. Kausrud, K.; Økland, B.; Skarpaas, O.; Grégoire, J.C.; Erbilgin, N.; Stenseth, N.C. Population dynamics in changing environments: The case of an eruptive forest pest species. Biol. Rev. 2012, 87, 34–51. [Google Scholar] [CrossRef] [PubMed]
  66. Franzén, M.; Francioli, Y.; Askling, J.; Kindvall, O.; Johansson, V.; Forsman, A. Yearly weather variation and surface temperature drives the spatiotemporal dynamics of a threatened butterfly and its host plant. Front. Ecol. Evol. 2022, 10, 917991. [Google Scholar] [CrossRef]
  67. Gullan, P.J.; Cranston, P.S. The Insects: An Outline of Entomology; John Wiley & Sons: Chichester, UK, 2014. [Google Scholar]
  68. Logan, J.A.; Powell, J.A. Ecological consequences of climate change altered forest insect disturbanceregimes. In Proceedings of the Pacific AAAS Meeting; American Association for the Advancement of Science: Washington, DC, USA, 2004. [Google Scholar]
  69. Jonason, D.; Franzén, M.; Ranius, T. Surveying moths using light traps: Effects of weather and time of year. PLoS ONE 2014, 9, e92453. [Google Scholar] [CrossRef] [PubMed]
  70. Kirk, H.; Freeland, J.R. Applications and Implications of Neutral versus Non-neutral Markers in Molecular Ecology. Int. J. Mol. Sci. 2011, 12, 3966–3988. [Google Scholar] [CrossRef] [PubMed]
  71. Fischer, M.C.; Rellstab, C.; Leuzinger, M.; Roumet, M.; Gugerli, F.; Shimizu, K.K.; Holderegger, R.; Widmer, A. Estimating genomic diversity and population differentiation—An empirical comparison of microsatellite and SNP variation in Arabidopsis halleri. BMC Genom. 2017, 18, 69. [Google Scholar] [CrossRef]
  72. Zimmerman, S.J.; Aldridge, C.L.; Oyler-McCance, S.J. An empirical comparison of population genetic analyses using microsatellite and SNP data for a species of conservation concern. BMC Genom. 2020, 21, 382. [Google Scholar] [CrossRef] [PubMed]
  73. Tscharntke, T.; Tylianakis, J.M.; Rand, T.A.; Didham, R.K.; Fahrig, L.; Batáry, P.; Bengtsson, J.; Clough, Y.; Crist, T.O.; Dormann, C.F.; et al. Landscape moderation of biodiversity patterns and processes-Eight hypotheses. Biol. Rev. 2012, 87, 661–685. [Google Scholar] [CrossRef] [PubMed]
  74. Anderegg, W.R.L.; Hicke, J.A.; Fisher, R.A.; Allen, C.D.; Aukema, J.; Bentz, B.; Hood, S.; Lichstein, J.W.; Macalady, A.K.; McDowell, N.; et al. Tree mortality from drought, insects, and their interactions in a changing climate. New Phytol. 2015, 208, 674–683. [Google Scholar] [CrossRef] [PubMed]
  75. Southwood, T.R.E.; Wint, G.W.; Kennedy, C.E.; Greenwood, S.R. Seasonality abundance, species richness and specificity of the phytophagous guild of insects on oak (Quercus) canopies. Eur. J. Entomol. 2004, 101, 43–50. [Google Scholar] [CrossRef]
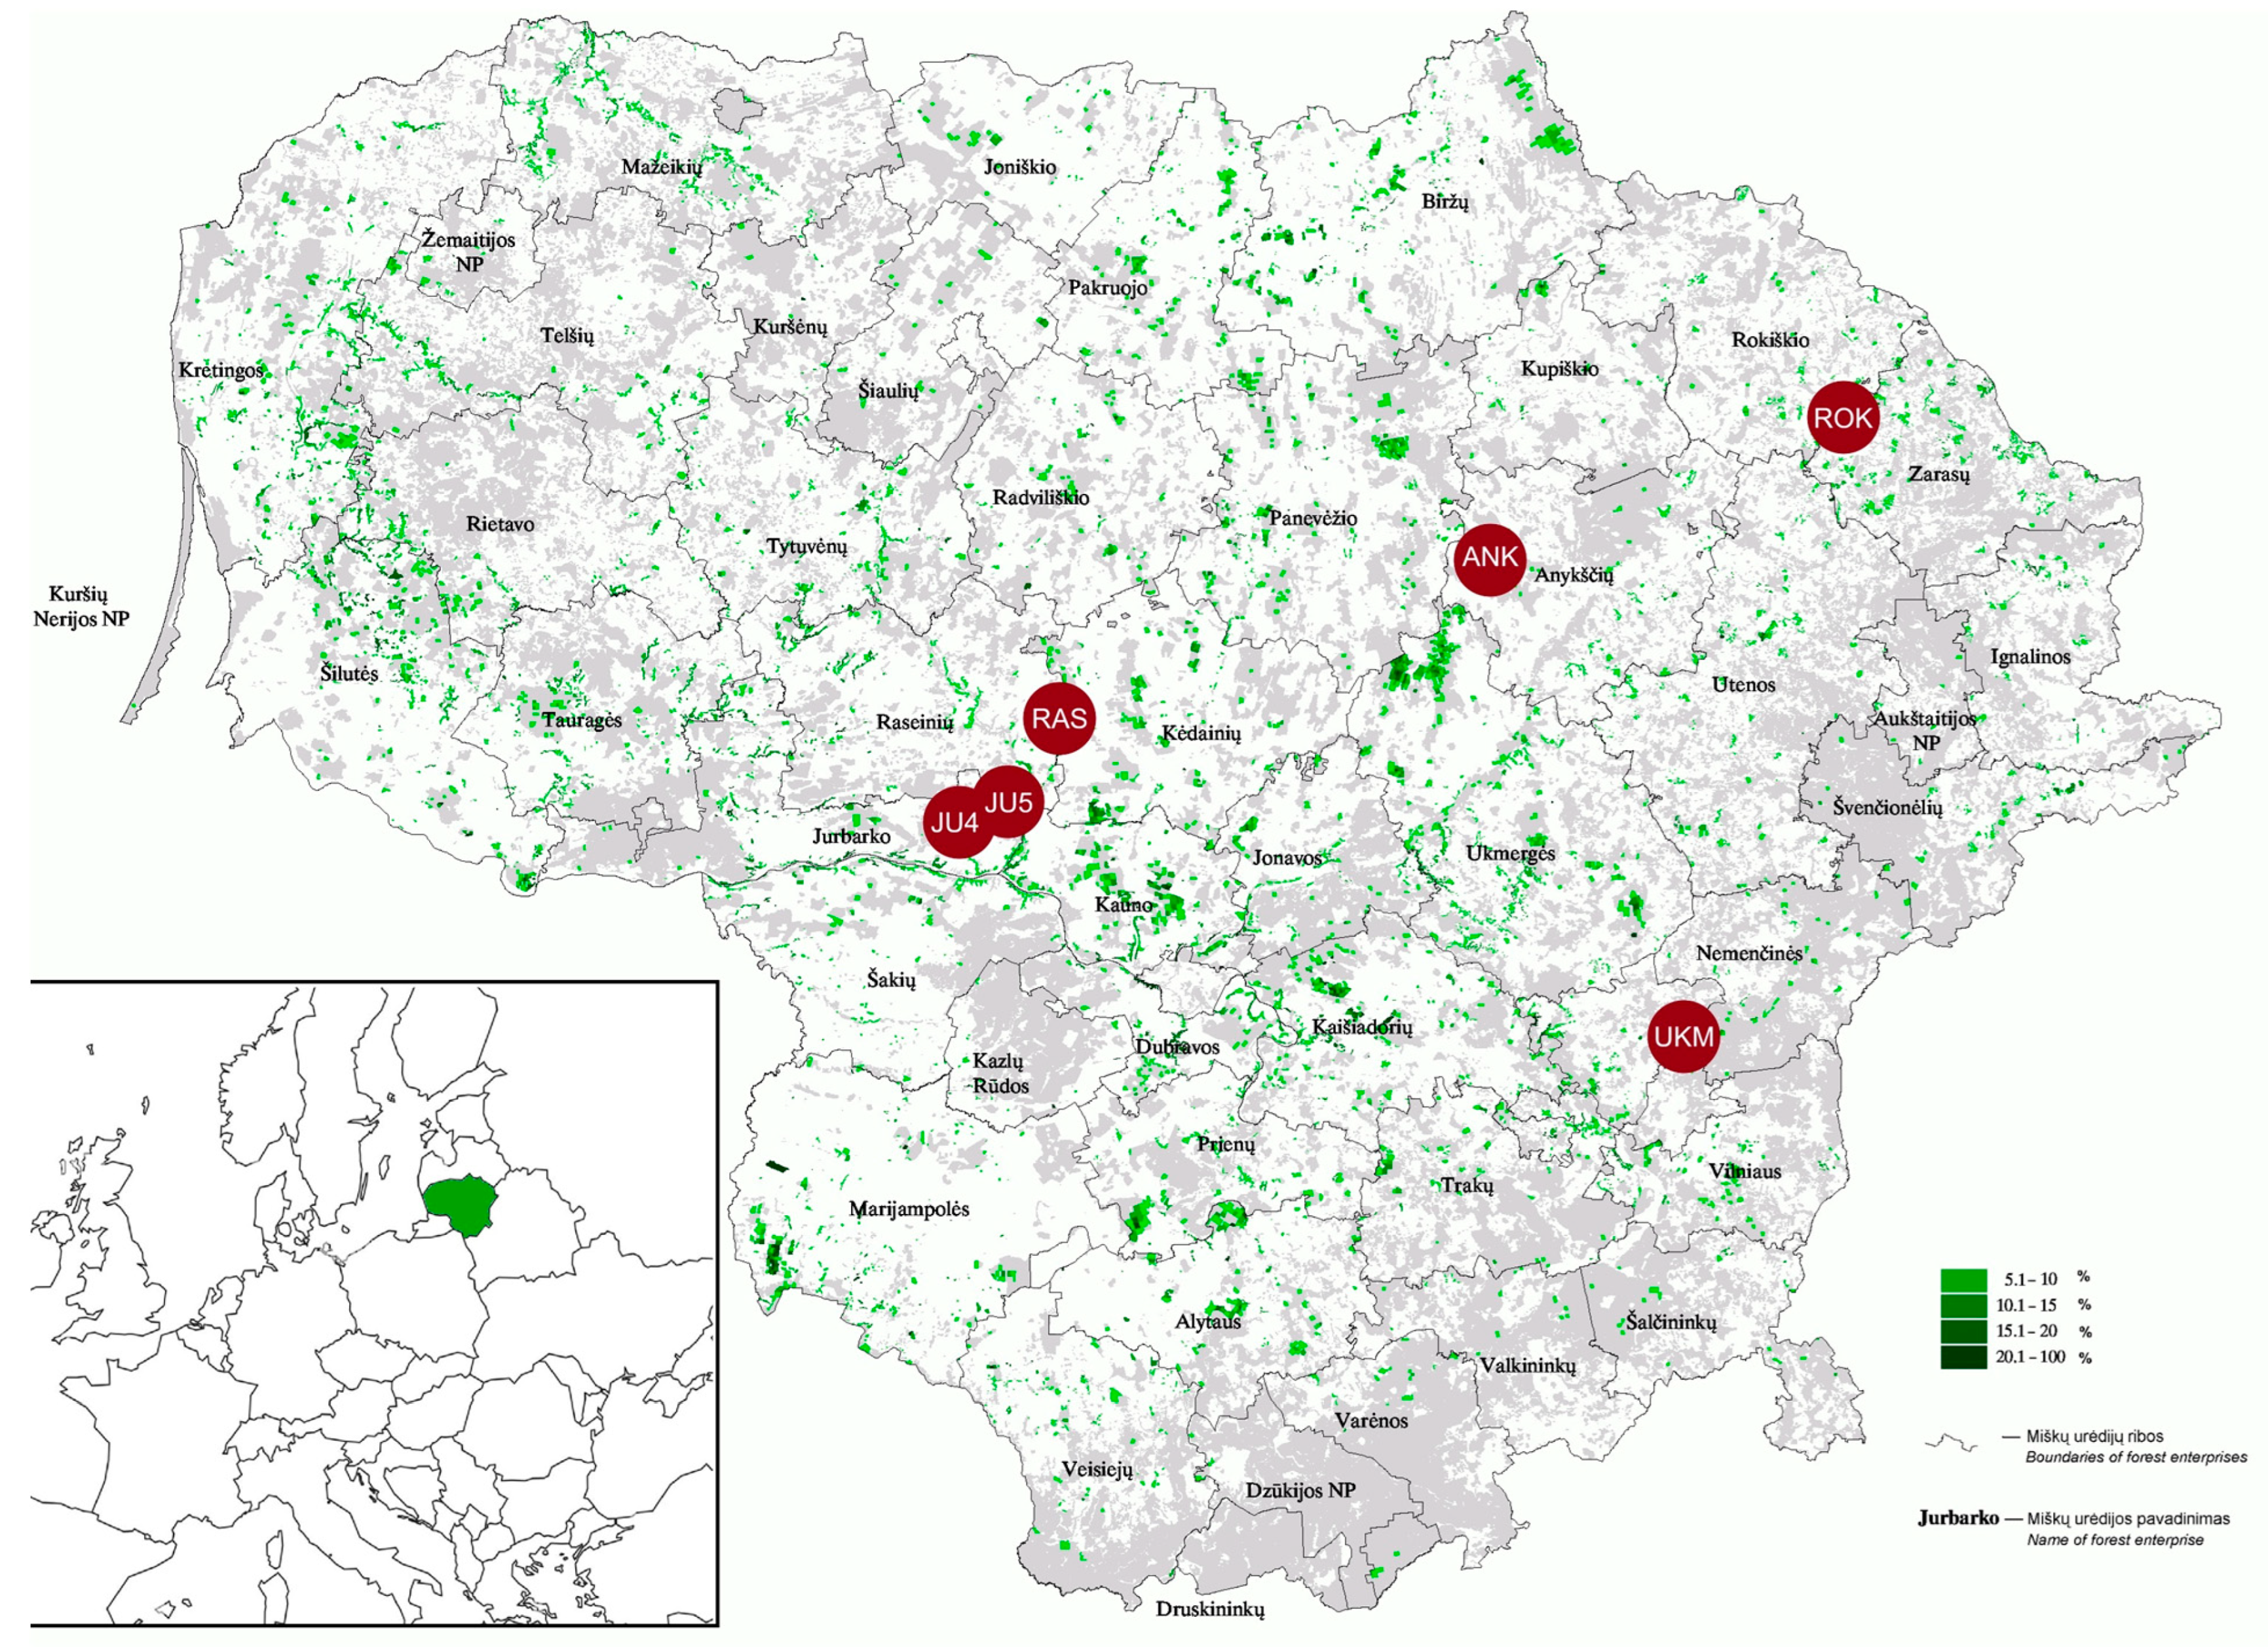
Figure 1. Spatial distribution of the study plots within small-leaved lime (Tilia cordata) Genetic Conservation Units (GCUs). Site abbreviation: ROK: Rokiškis; ANK: Anykščiai; RAS: Raseiniai; JU4 and JU5: Jurbarkas and UKM: Ukmergė.
Diversity 18 00378 g001
Figure 2. Light trap with automatic on/off function: 10 W solar panel (A); 5000 mAh Li-ion battery (B); UV lamp (C); insect collector (D). Estimated trapping area approximately 0.8 ha, as specified by the manufacturer.
Diversity 18 00378 g002
Figure 3. Sørensen index (Cs) indicating the similarity between insect taxa composition between Tilia cordata GCUs. Data are combined across 2023 and 2024.
Diversity 18 00378 g003
Figure 5. Pairwise Pearson’s correlation between insect diversity metrics and Tilia cordata genetic diversity parameters. The upper right triangle presents Pearson correlation coefficients, with the gradient and significance stars indicating the strength and statistical support of each association, while the lower right triangle shows the corresponding scatterplots. Insect diversity parameters: Shannon H (H_insects), species richness (S_insects), abundance (N_insects). Parameters of Tilia cordata genetic diversity: Shannon’s information index (I), observed heterozygosity (Ho), expected heterozygosity (He) and inbreeding coefficient (F). * Significant strong correlation betwen parameters and ** Significant very strong correlation between parameters.
Diversity 18 00378 g005
Table 1. Main stand parameters of small-leaved lime GCUs. Data were obtained from the State Forest Cadastre as of 30 March 2023.
SiteGCUsForest Site Type *Forest
Vegetation Type **
Tree Species Composition
(%) ***
CoordinatesCodeTypeSize, (ha)Age, (y)
ANK 55°32′12.0228” N,
24°53′ 30.1014” E
46LSM002Seed stand1.8479Lcsmyrtillio-oxalidosa60T30P10B
JU455°10′5.7714” N,
23°19′45.7134” E
23LGD001Genetic reserve3.8138Lfpaegopodiosa60T20S10Q10A
JU555°9′28.6272” N,
23°19′32.16” E
23LGD002Genetic reserve5.3293Lfpaegopodiosa70T20F10S
RAS55°20′25.029” N,
23°38’48.1662” E
17LSM003Seed stand7.2398Ldsaegopodiosa40T20Q20B20S
ROK55°47′56.331” N,
25°48′24.8178” E
55LGD003Genetic reserve2.8784Ldsaegopodiosa70T10B20S
UKM54°58′5.9118” N,
25°11′ 8.7102” E
58LGD004Genetic reserve20.2394Ldsaegopodiosa50T40P10Q
* L: temporarily waterlogged mineral soils; c: moderate fertility; d: high fertility; f: very high fertility.; s: heavy soil texture; p: two-layered soil structure with a light fraction on a heavy fraction or vice versa [48]. ** Forest Vegetation type as provided in Karazija, 2008 [49]. *** T: Small-leaved lime; Q: Pedunculate oak; B: Silver birch; S: Norway spruce; P: European aspen; A: Norway maple; F: European ash. In each stand, the tree species composition is based on the volume.
Table 2. Diversity parameters of light-attracted canopy insects at Tilia cordata GCUs in the period of 2023–2024.
Site20232024Both Years
Relative Abundance, % (No. of Individuals)Species Richness, % (No. of Species)Shannon
H
Relative Abundance, % (No. of Individuals)Species Richness, % (No. of Species)Shannon
H
Relative Abundance, % (No. of Individuals)Species Richness, % (No. of Species)Shannon
H
ANK 15.1 (413)33.0 (66)3.158.5 (279)31.0 (72)3.3711.5 (692)39.0 (115)3.49
JU47.9 (215)31.5 (63)3.5028.1 (927)49.1 (114)3.7318.9 (1142)48.5 (143)3.92
JU519.7 (538)35.0 (70)3.1234.3 (1132)52.6 (122)3.7227.7 (1670)49.8 (147)3.82
RAS8.0 (220)20.5 (41)2.9010.2 (337)37.9 (88)3.539.2 (557)36.3 (107)3.59
ROK42.8 (1169)35.0 (70)2.7311.0 (362)33.6 (78)3.5425.4 (1531)38.3 (113)3.21
UKM6.5 (178)32.0 (64)3.647.9 (261)25.0 (58)2.817.3 (439)35.6 (105)3.59
All sites100.0 (2733)100.0
(200)
3.72100
(3298)
100
(232)
4.17100.0
(6031)
100.0
(295)
3.81
Table 3. Relative abundance (%) of the 20 most frequently recorded insect species captured by light traps in Tilia cordata GCUs. Data are pooled across all sites.
OrderFamilyInsect Species20232024Total
Years
Coleoptera ScarabaeidaeSerica brunnea18.80.38.7
ColeopteraDytiscidaeIlybius fuliginosus9.84.46.8
DipteraUnknownDiptera sp. 22.77.85.5
ColeopteraDytiscidaeColymbetes fuscus4.45.85.2
LepidopteraArctiidaeMiltochrista miniata3.76.35.1
LepidopteraErebidaeEilema sp. 15.34.24.7
DipteraLauxaniidaeLauxaniidae sp. 11.85.33.7
ColeopteraCarabidaeHarpalus rufipes3.33.13.2
LepidopteraGracillarioidaeGracillarioidae sp. 36.0-2.7
ColeopteraCoccinellidaeCalvia decemguttata2.52.92.7
ColeopteraGyrinidaeGyrinus natator1.23.02.2
HemipteraNotonectidaeSigara striata2.22.12.1
LepidopteraErebidaeEilema lurideola1.61.81.8
LepidopteraGeometridaeGeometridae sp. 10.12.71.5
LepidopteraPyralidaePyralidae sp. 10.22.71.5
LepidopteraPyralidaePyralidae sp. 20.32.51.5
DipteraTipulidaeTipulidae sp. 10.82.01.4
HymenopteraIchneumonidaeIchneumonidae sp. 40.52.01.3
LepidopteraArctiidaeLithosia quadra1.21.31.3
ColepteraSilphidaeNicrophorus vespilloides2.00.61.2
Total of 20 most common taxa68.660.864.3
Disclaimer/Publisher’s Note: The statements, opinions and data contained in all publications are solely those of the individual author(s) and contributor(s) and not of MDPI and/or the editor(s). MDPI and/or the editor(s) disclaim responsibility for any injury to people or property resulting from any ideas, methods, instructions or products referred to in the content.