Article

Wintering Waterbirds in the Venice Lagoon, Years 1993–2022: Trends, Spatial Patterns and Management Issues


1
SELC Soc. Coop., Via dell’Elettricità 3/d, Marghera, 30175 Venice, Italy
2
Museo di Storia Naturale di Venezia Giancarlo Ligabue, Santa Croce 1730, 30135 Venice, Italy
3
Rialto, San Polo 571, 30125 Venice, Italy
*
Author to whom correspondence should be addressed.
Diversity 2026, 18(5), 276; https://doi.org/10.3390/d18050276
Submission received: 29 March 2026 / Revised: 27 April 2026 / Accepted: 28 April 2026 / Published: 1 May 2026
(This article belongs to the Special Issue 2026 Feature Papers by Diversity's Editorial Board Members)

Abstract

Using International Waterbird Census data spanning 1993–2022, we analysed temporal trends in the abundance and community composition of wintering waterbirds in the Venice Lagoon (NE Italy). We examined total numbers, major lagoon macro-areas (fish farms, open lagoon, coastal littoral zone, minor wetlands), species-level and guild-level trends and assessed climate-related community changes through the Community Temperature Index (CTI). Total wintering waterbird abundance increased markedly over the study period, from 74,348 birds in 1993 to 445,350 in 2022. Fish farms (about 20% of the total area) hosted the largest number of individuals (about 83%) and accounted for most of the lagoon-wide increase, while open lagoon (15%) and coastal littoral (<2%) areas showed weaker and more variable dynamics. Species-level analyses revealed pronounced heterogeneity, with strong increases in several Anatidae, contrasted by stable or declining trends in other species. The CTI exhibited a significant long-term increase, indicating a progressive shift towards communities dominated by warm-affinity species. CTI decomposition nevertheless showed this signal was disproportionately driven by a limited number of highly abundant species. Our results indicate that wintering waterbird dynamics in the Venice Lagoon are shaped by the interaction between large-scale climatic processes and local habitat management, particularly within fish farms. While management practices can likely sustain exceptionally high wintering numbers and potentially buffer climate-driven redistribution, they may also promote strong species dominance and associated ecological risks. Integrating long-term census data with climate and functional indicators provides a robust framework for understanding and managing Mediterranean wetlands under ongoing climate change.

1. Introduction

Long-term monitoring of wintering waterbirds represents a cornerstone of wetland ecology and conservation, providing key information on population trends, distributional changes and habitat use at local, national and flyway scales [1,2]. The wintering period is particularly informative, as many species concentrate in a limited number of key wetlands outside the breeding season, allowing demographic changes to be detected more effectively than during the breeding phase [3,4].
The International Waterbird Census (IWC), coordinated by Wetlands International, is one of the longest-running standardized biodiversity monitoring programmes worldwide. Initiated in 1967, it provides annual mid-winter counts across Europe, the Mediterranean basin, Africa and parts of Asia, following harmonized protocols that allow robust comparisons across regions and decades [5,6]. These data underpin a wide range of conservation applications, including population trend assessments, Ramsar site designation, Important Bird and Biodiversity Area (IBA) identification and reporting under the EU Birds Directive.
At large spatial scales, analyses of IWC datasets have shown that wintering waterbird populations are highly dynamic, with marked spatial and temporal heterogeneity among species and regions [2,7,8]. Changes in abundance and distribution are driven by multiple interacting processes operating across scales. At the flyway level, population dynamics are influenced by breeding success, survival, hunting pressure and large-scale habitat change [4,9]. At the same time, winter distributions are highly sensitive to climatic conditions, particularly temperature and ice cover, which can induce rapid redistribution among wintering sites [7,10].
Climate warming has been associated with northward and eastward shifts in wintering ranges of many European waterbirds, often resulting in increasing numbers at northern sites and stabilization or decline in southern areas [7,11,12]. However, these responses are not uniform, as local habitat conditions and management practices can strongly mediate, or even counteract, climate-driven redistribution. In particular, wetlands with stable water availability and high food resources, often maintained for hunting or aquaculture, can sustain large wintering populations despite broader climatic trends [13,14,15].
This interaction between climate forcing and local management is especially relevant in Mediterranean wetlands, where regulated systems such as fish farms, saltpans and other managed habitats can act as strong attractors for wintering waterbirds, modifying regional distribution patterns and sustaining very large local concentrations [16,17,18,19,20].
Among coastal systems, the Venice Lagoon stands out as the largest coastal lagoon in the Mediterranean and the most important wintering site for waterbirds in the whole basin. In 2018, the last year for which data referring to the whole of Italy are available [21,22], the lagoon, with its 480,000 birds, hosted about 24% of the two million birds wintering in the whole country. In comparison, the Camargue hosted about 200,000 wintering birds in 2022 [23] and the Ebro Delta between 150,000 and 300,000 in 2013–2025 [24], while the transitional Atlantic–Mediterranean system Doñana hosts about 460,000 birds on a long-term average [25]. Recent data indicate that in the years 2022–2025 the Venice lagoon complied with criterion no. 6 of the Ramsar Convention for 16 species [26]. Despite this relevance, only a small area of about 500 ha has been designated as a Ramsar Site, while the whole lagoon is included in one Special Protection Area (according to the 2009/147 Birds Directive) and two Special Areas of Conservation (1992/43 Habitats Directive). Besides these formal protection measures it is remarkable that no specific waterbird management plan has been adopted or implemented so far on a lagoon scale [27,28].
Systematic IWC monitoring in the Venice Lagoon has been conducted annually since 1993, providing a unique long-term dataset. Previous studies have documented a marked increase in wintering numbers, particularly during the 1990s and early 2000s, and have highlighted the dominant role of fish farms (valli da pesca in Italian) in shaping wintering distributions [16,28]. However, an integrated assessment combining long-term abundance trends, spatial patterns across lagoon macro-areas, species- and guild-level dynamics and community-level climate indicators is still lacking.
In this study, we use nearly three decades of IWC data (1993–2022) to provide a comprehensive analysis of wintering waterbird dynamics in the Venice Lagoon. Specifically, we aim to
(i)
Quantify long-term trends in total wintering abundance;
(ii)
Assess spatial patterns across major lagoon macro-areas with contrasting hydrological and management characteristics;
(iii)
Analyze species- and guild-level trends to identify the main drivers of change;
(iv)
Evaluate community-level responses to climate change using the Community Temperature Index (CTI);
(v)
Test whether the reduction in tidal-flat exposure associated with the observed sea-level rise is reflected in changes in wintering wader abundance.
By integrating abundance-based, spatial and climate-related indicators within a unified framework, this study aims to improve the understanding of how climate change and habitat management jointly shape wintering waterbird communities in Mediterranean coastal wetlands.

2. Materials and Methods

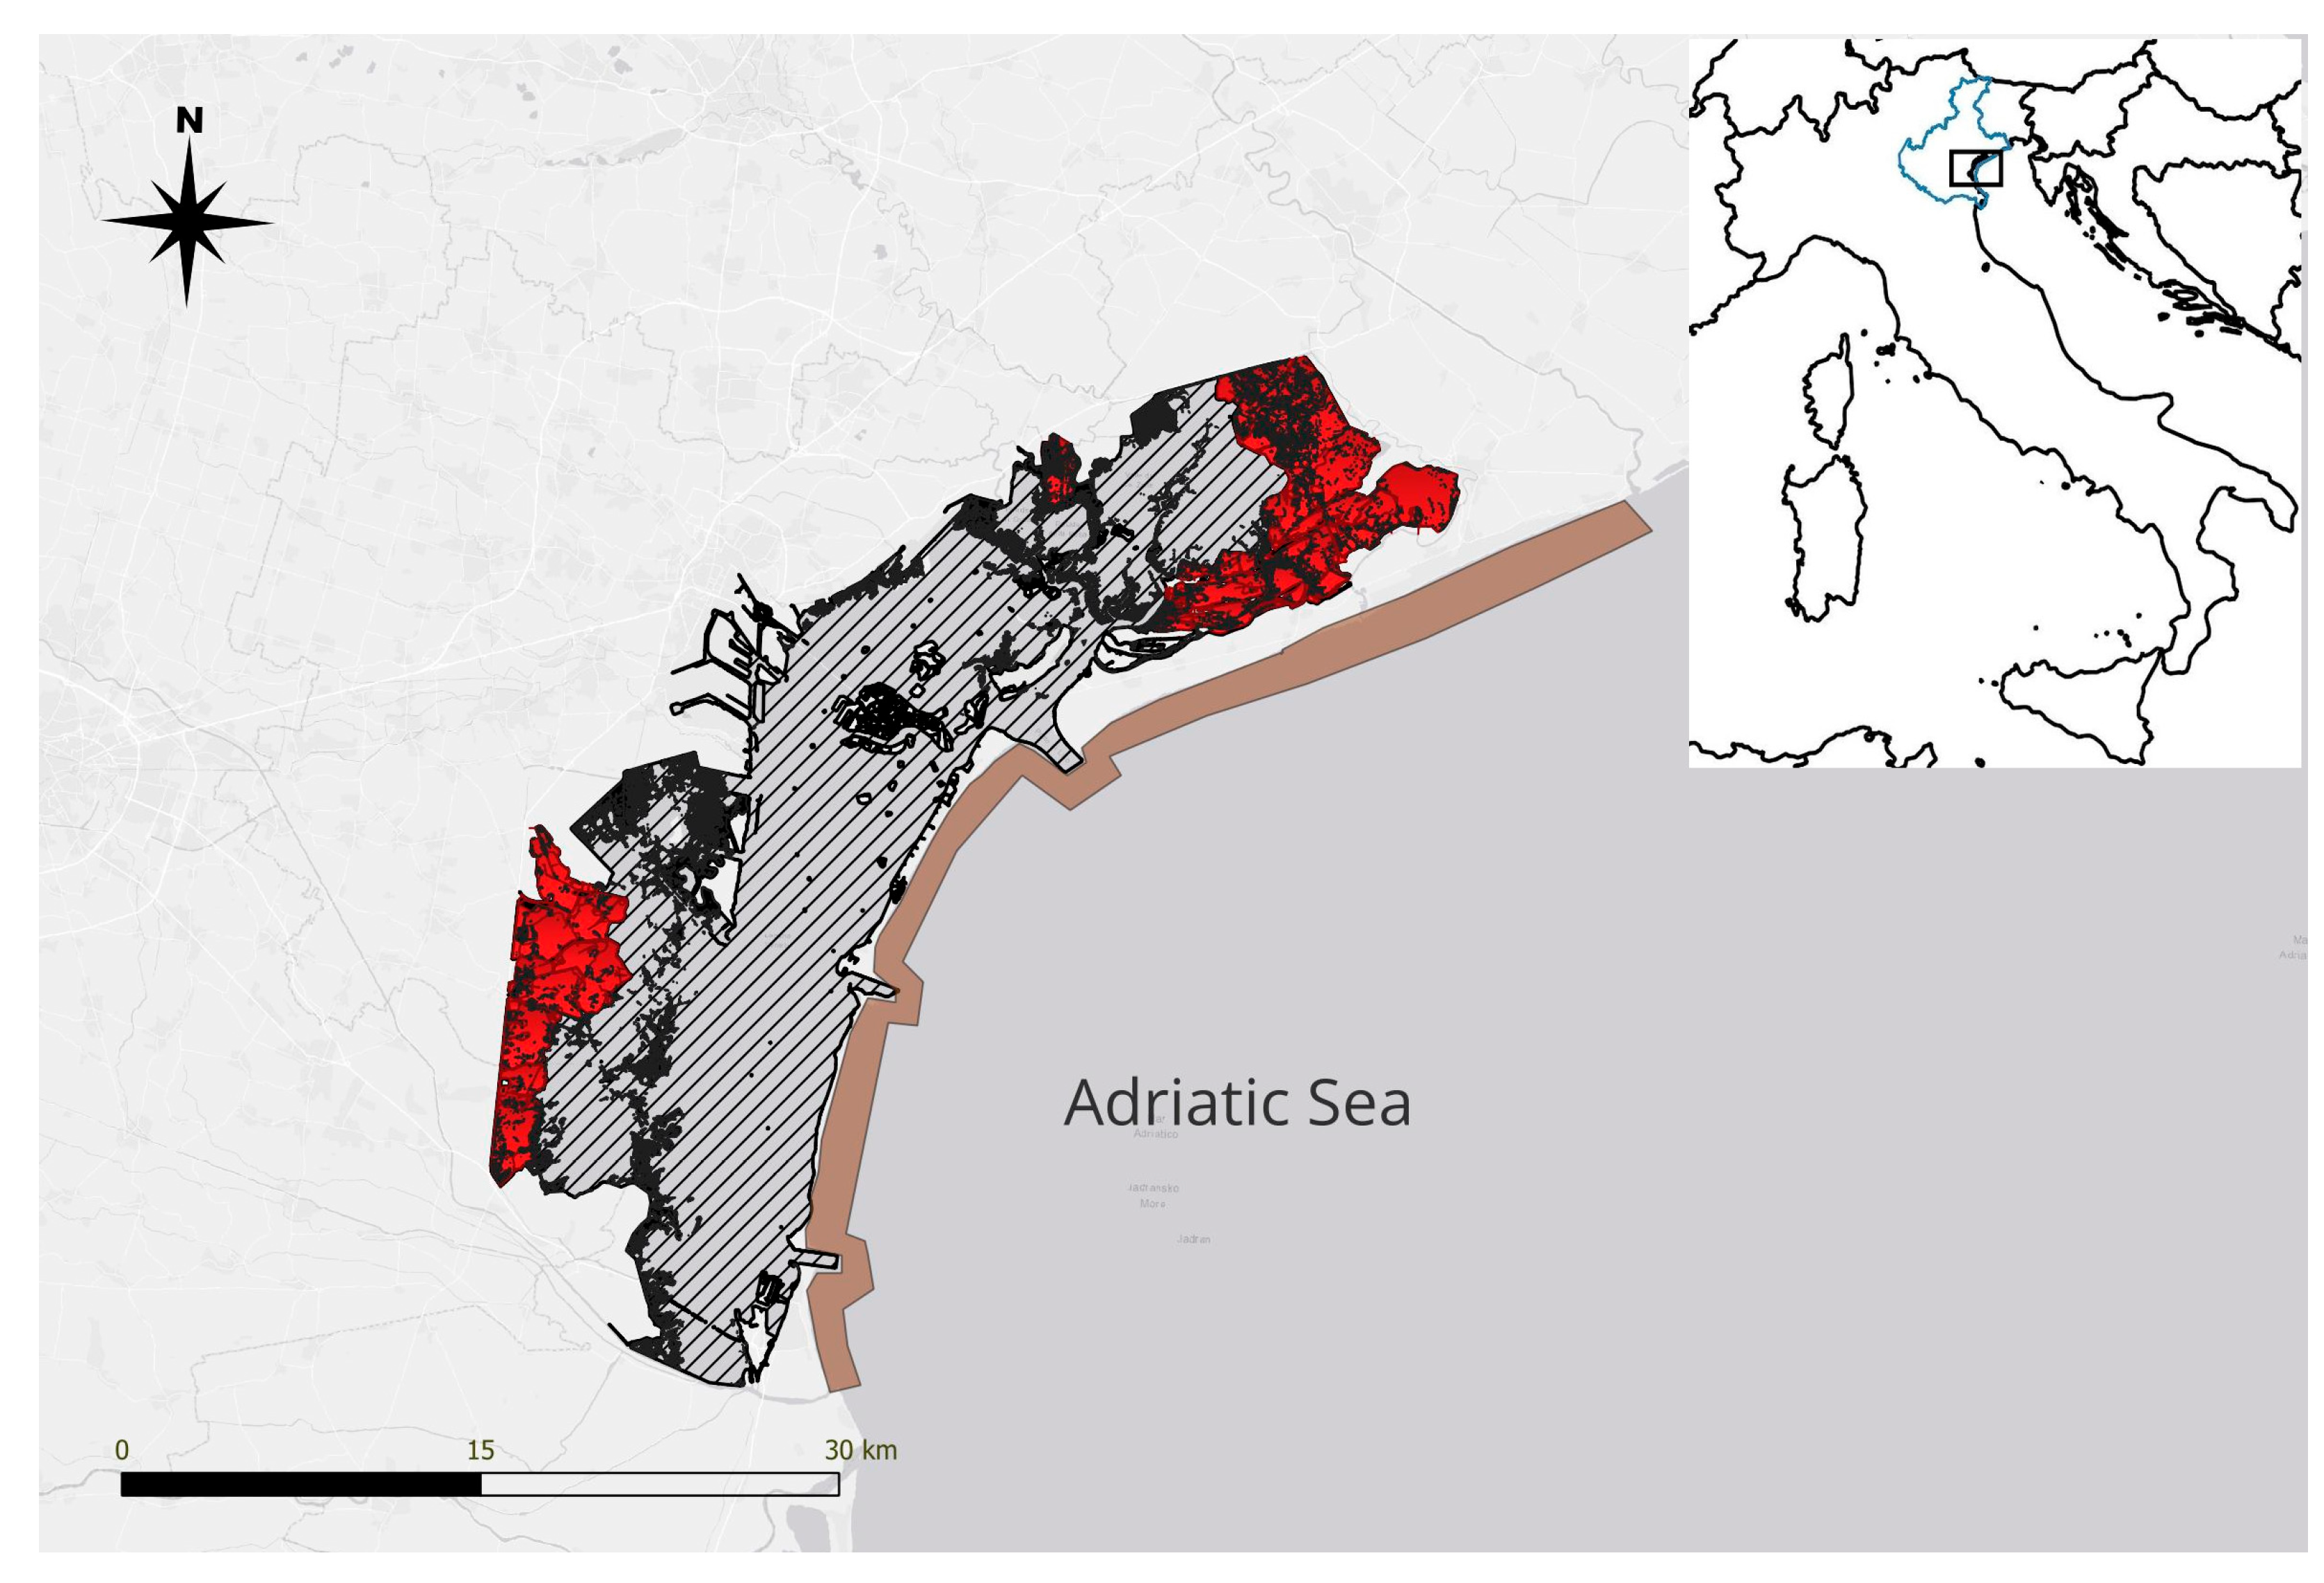
The Venice Lagoon is the largest coastal lagoon in the Mediterranean Sea, covering approximately 550 km2 along the northern Adriatic coast of Italy (approximate center: 45°25′ N, 12°18′ E; Figure 1). It extends for about 50 km from the Piave River in the north to the Brenta River in the south and is separated from the Adriatic Sea by a system of barrier islands and two narrow peninsulas. The lagoon is connected to the sea through three inlets (Lido, Malamocco and Chioggia), which regulate tidal exchange and control the hydrodynamic regime [29]. Tidal amplitude can reach up to 1 m, among the highest in the Mediterranean [30], generating extensive intertidal areas that are key feeding habitats for waders and other waterbirds.
The climate is temperate sub-continental, moderated by marine influence. Mean annual air temperature ranges between 10 and 14 °C, with mild winters and warm summers, while annual precipitation typically ranges between 800 and 1100 mm [31]. The Venice Lagoon is a highly heterogeneous system, comprising a mosaic of shallow open waters, tidal flats (velme), salt marshes (barene), deep channels, reclaimed areas and fish farms. This environmental heterogeneity supports a diverse waterbird community, with habitat use strongly influenced by tidal dynamics, water depth and food availability [16,28].
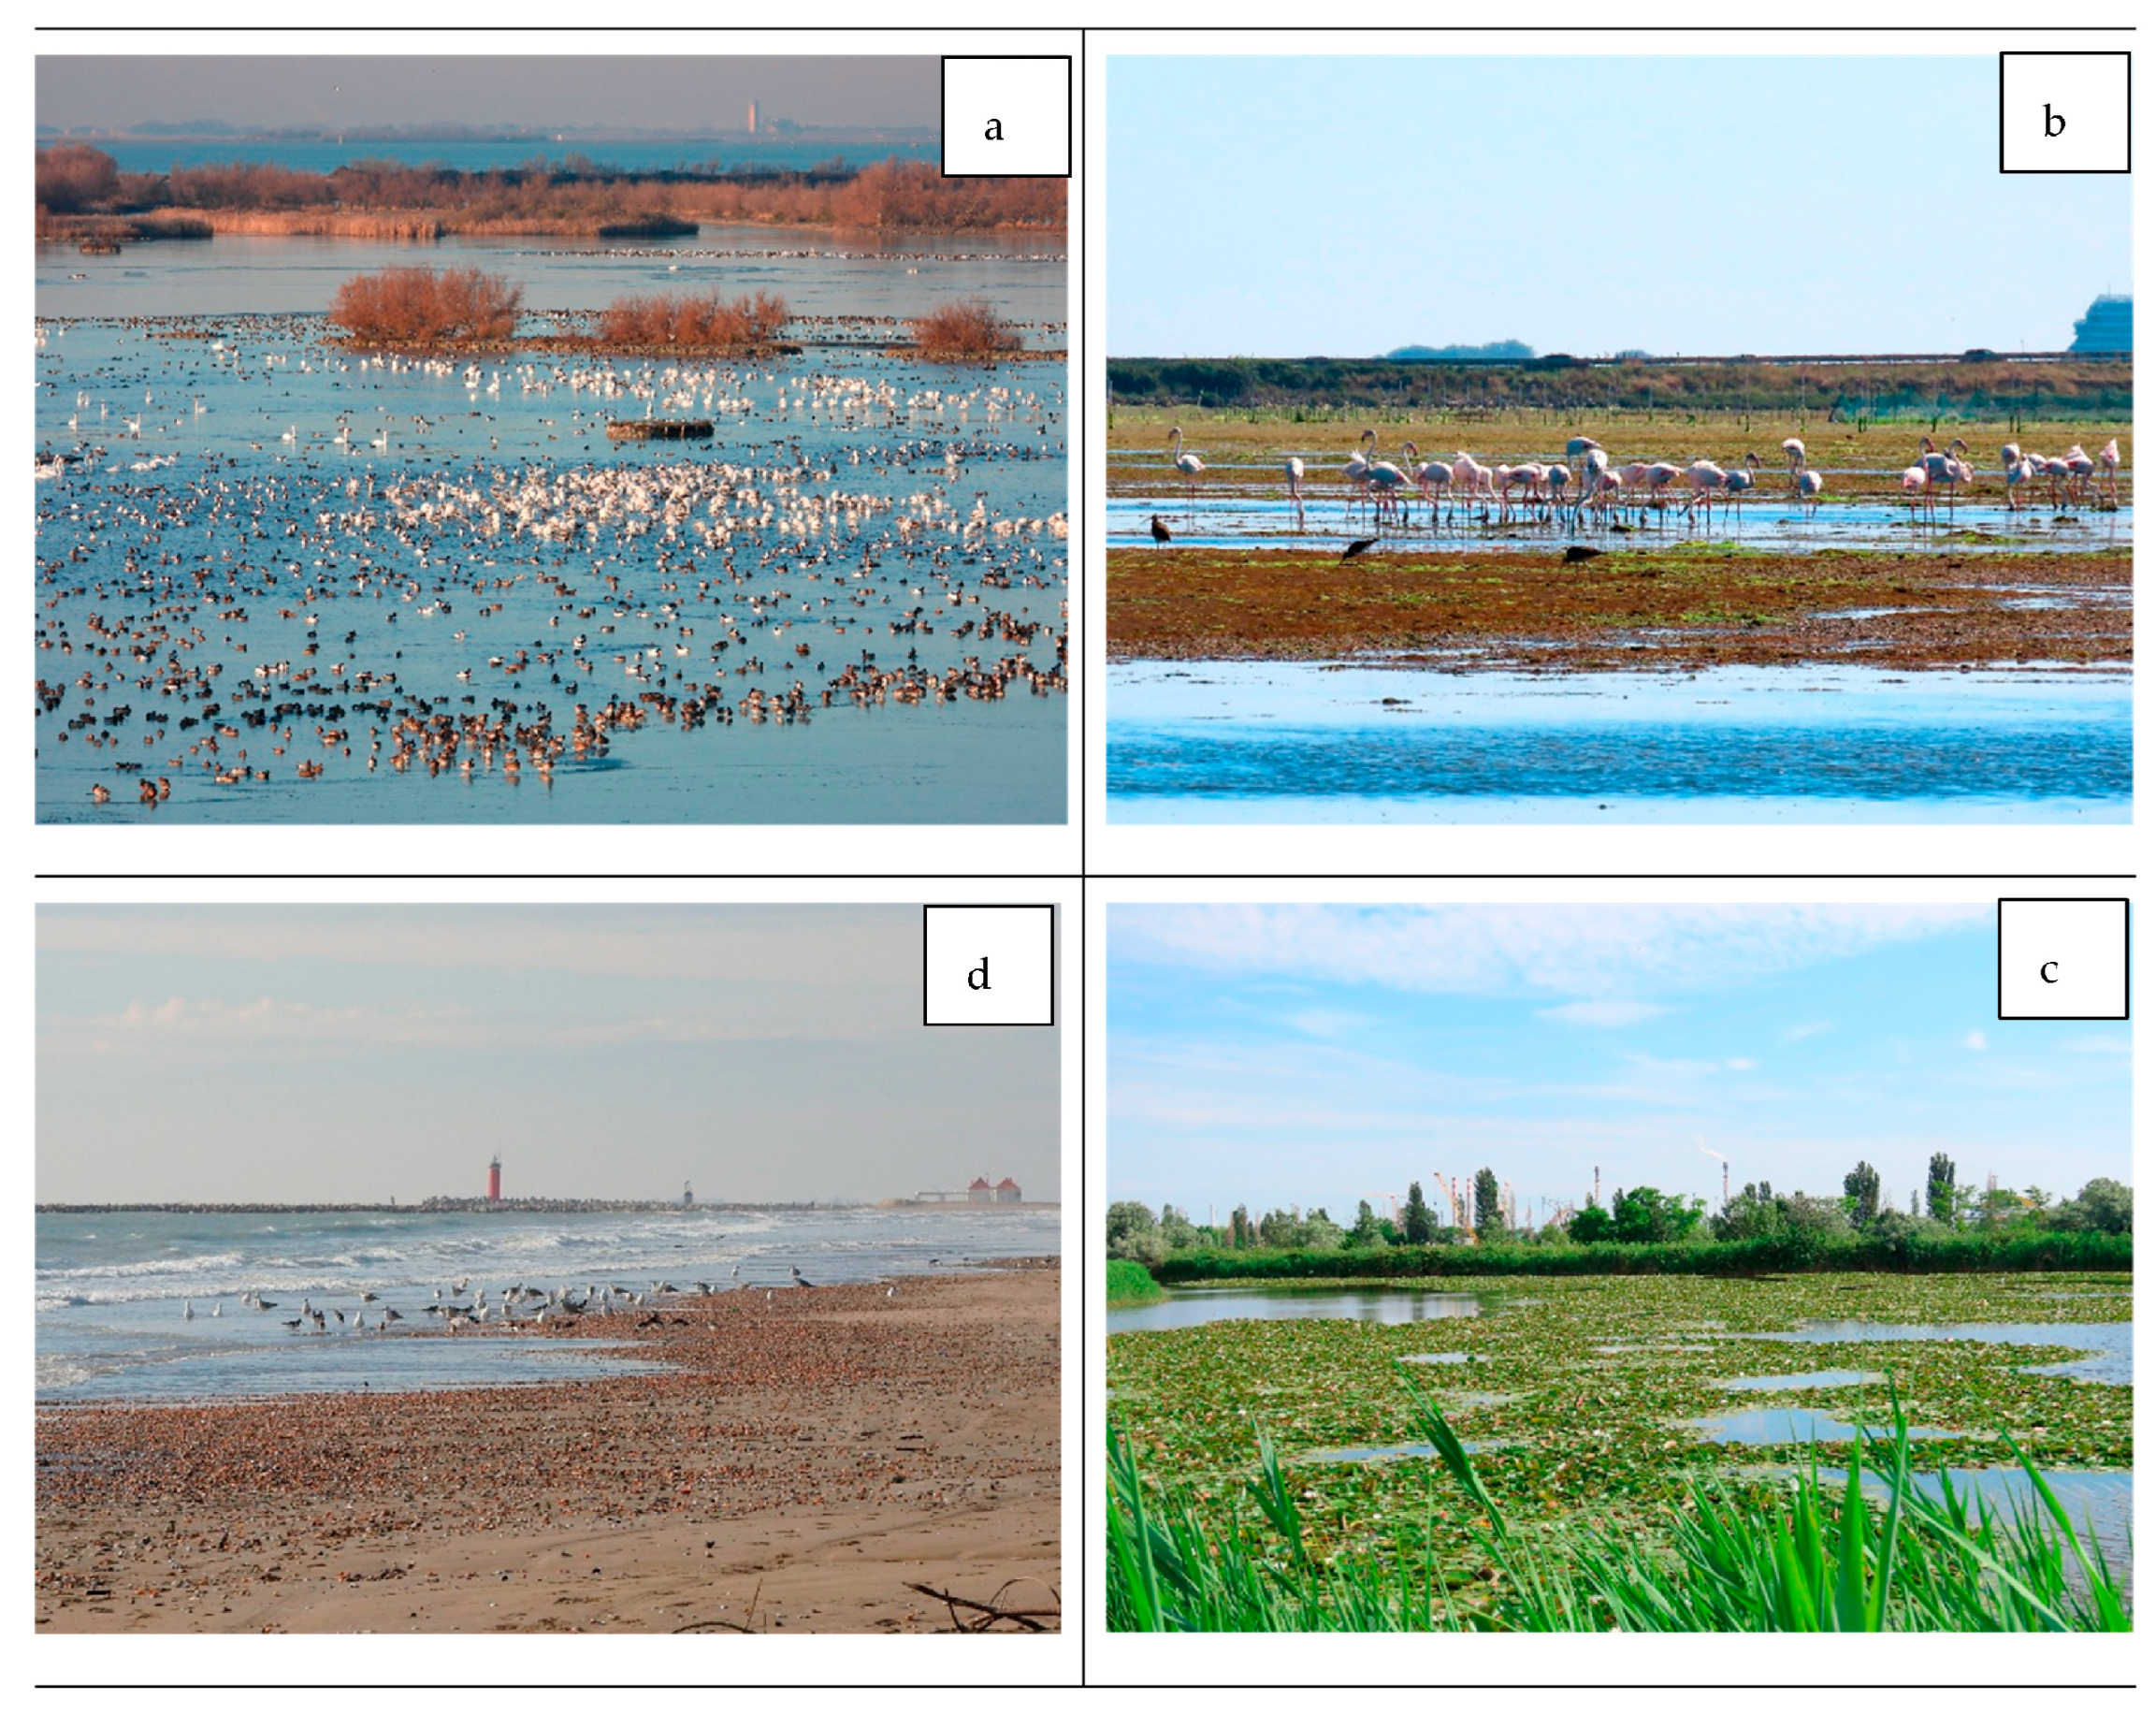
For analytical purposes, the lagoon was subdivided into four major macro-areas reflecting differences in hydrology, management regime and ecological function (Figure 2):
(1)
Fish farms. Approximately 20 privately owned fish farms, covering about 9600 ha, are located along the lagoon margins [32]. These are hydraulically regulated systems, disconnected from natural tidal exchange and where water levels are actively managed. During the whole winter, site managers regularly provide waterbirds with large quantities of food, such as rice, grain and millet; along with water level regulation, this encourages the occurrence of game species in the brackish ponds. They provide stable, shallow habitats with high food resources and low disturbance, supporting very high densities of wintering waterbirds, particularly dabbling ducks [16].
(2)
Open lagoon. This includes all areas directly connected to tidal exchange with the Adriatic Sea and comprises deep channels, shallow waters, tidal flats (ca. 4000 ha), natural salt marshes (ca. 3600 ha) and artificial salt marshes created from dredged sediments (ca. 1300 ha: [33]). These areas host important roosting sites for waders and support a wide range of foraging guilds.
(3)
Coastal littoral zone. This macro-area includes sandy beaches and nearshore marine waters, defined as those within approximately 1 km from the coastline. Coastal infrastructures such as two breakwaters provide additional roosting sites for waterbirds, particularly waders [34].
(4)
Minor wetlands. This category includes small and heterogeneous habitats such as treatment wetlands, freshwater ponds within industrial areas, drainage basins and reclaimed lands. Although limited in extent, these sites can locally support high densities of certain species and contribute to overall habitat diversity.

2.1. Climate and Sea Level Data

Winter temperature trends were assessed using mean seasonal air temperature calculated for each winter between 1992/93 and 2021/22. Following standard practice [3,35] winter temperature was defined as the average of mean monthly temperatures for November, December and January. Data were obtained from the meteorological station of Tessera Airport, located at the edge of the Venice Lagoon. Sea-level data were retrieved from the Punta della Salute gauge (Comune di Venezia: https://www.comune.venezia.it/it/content/dati-e-statistiche (accessed on 12 January 2026)). Water levels are expressed relative to the local datum (VE 1897), which is currently approximately 30 cm below present mean sea level due to long-term sea-level rise and local subsidence [36]. To quantify changes in intertidal habitat availability, we calculated, for each year, the proportion of hours during which water levels were below +10 cm, corresponding to the threshold at which tidal flats begin to be exposed, based on our multidecadal field observations. This metric was used as a proxy for annual tidal-flat exposure.

2.2. Waterbird Counts

Wintering waterbird data were collected in the framework of the International Waterbird Census (IWC), implemented in the Venice lagoon by Associazione Faunisti Veneti through the national monitoring scheme coordinated by ISPRA, the Italian Agency for Environmental Protection [37]. Counts are conducted annually since 1993 in mid-January and mostly by volunteers, following standardized protocols, ensuring comparability across years and sites [28].
The whole lagoon was counted in three consecutive days; it was divided into about 50 survey units, each one counted by teams of two to three trained observers, using a combination of ground-based and boat-based surveys. All the fish farms were surveyed on the same day during non-hunting days, while open lagoon counts were done in a single day, during high or rising tides to maximize detection of roosting birds. The coastal strip was surveyed on foot. No surveys were conducted in 2021 due to COVID-19 restrictions; therefore, the dataset includes 29 annual counts between 1993 and 2022. From the full species list, non-native escapees and species not typically considered waterbirds (e.g., diurnal raptors, Woodcock Scolopax rusticola, etc.) were excluded, resulting in a final dataset of 102 species. All analyses are based on daytime counts.
Waterbird count data derived from large-scale monitoring schemes such as the International Waterbird Census (IWC) are inherently affected by multiple sources of uncertainty, particularly in complex coastal systems such as lagoons. In these environments, counts involve large and spatially dispersed aggregations, making accurate enumeration challenging. Potential sources of bias include imperfect detectability, variation in observer experience, differences in survey conditions (e.g., visibility, weather, water level) and estimation errors in large flocks. Detectability may also vary among habitats and species, for example, between open-water areas, tidal flats and vegetated zones. Although detailed metadata on observer identity and effort were not systematically archived for the entire study period, the survey design, spatial coverage and counting protocols remained consistent over time, as coordinated within the national IWC framework. This consistency supports the use of the dataset for long-term trend analyses despite the inherent limitations discussed above.
Standardized protocols, repeated coverage of the same count units and coordinated surveys, such as those adopted within the Venice lagoon IWC framework, are designed to minimize these sources of variability and ensure temporal consistency; however, they do not fully eliminate them. Consequently, inaccuracies in absolute counts may occur, particularly for highly gregarious species or under suboptimal survey conditions. Despite these limitations, the consistency of methods through time makes IWC data well suited for detecting medium- to long-term changes in waterbird populations [38].

2.3. Data Aggregation and Community Metrics

Analyses were conducted at three levels: (i) lagoon-wide totals, obtained by summing counts across all macro-areas, (ii) macro-area totals, including fish farms, open lagoon, coastal littoral zone and minor wetlands and (iii) species- and guild-level datasets. Species were assigned to ten eco-functional guilds based on trophic and foraging-habitat traits [1,39], including surface dabblers/filter-feeders, benthic feeders, diving feeders and shoreline invertivores. Community structure was further described using species richness and the Shannon diversity index. Interannual similarity between consecutive winters was quantified using the Jaccard index (presence–absence) and the Bray–Curtis index (abundance-based) [40].

2.4. Trend Analysis

Trends were estimated using the software TRIM v. 3.54 [41]. The analysis was conducted using standard TRIM model settings, including correction for overdispersion and serial correlation. Missing values were handled within the TRIM framework. Species recorded in fewer than 10 winters were excluded from trend analyses, obtaining a list of 66 species. Trends were estimated for both the full period (1993–2022) and the most recent decade (2013–2022), always excluding 2021, to assess temporal consistency. The absence of data for 2021 was handled differently depending on the analytical approach. TRIM models explicitly account for missing values within the time series, while regression-based analyses were conducted excluding 2021. Given the length of the time series and the overall magnitude of the observed trends, the exclusion of a single year is unlikely to substantially influence the results.
For each analytical unit (total abundance, macro-areas, species and guilds), we estimated (1) annual indices relative to a reference year, (2) overall log-linear trends and (3) trend classifications according to standard TRIM categories (strong increase, moderate increase, stable, uncertain, moderate decline, steep decline).

2.5. Species Temperature Index (STI) and Community Temperature Index (CTI)

Species thermal affinities were quantified using the Species Temperature Index (STI), defined as the mean January temperature across the non-breeding distribution of each species; STI values (see Table S1) were derived from published datasets based on the intersection of species distribution maps with long-term climatic data (baseline 1950–2000 [20,42]); only for three species we chose different values. From the overall pool of 102 species, 9 were excluded since we did not find STI values in the literature; we also excluded T. aethiopicus, an alien invasive species occurring in just five winters. The Community Temperature Index (CTI) was calculated annually as the abundance-weighted mean of STI values as follows:
C T I y = i = 1 S ( N i , y × S T I i ) i = 1 S N i , y
where N i , y is the abundance of species i in year y, S T I i is the Species Temperature Index of species i, and S is the number of species with available STI values in that year. CTI was calculated for the entire community and also only for waders; the year 2021 was excluded. To identify species driving CTI changes, we decomposed long-term variation into species-level contributions by combining species-specific STI values with changes in abundance between the first and last years of the time series. Contributions were expressed as proportional contributions to the total CTI change, following established approaches for community indicators [43]. To assess the robustness of CTI trends to species dominance, additional sensitivity analyses were performed. In addition to the standard abundance-weighted CTI, we calculated (i) a presence-weighted CTI, in which all species contributed equally regardless of their abundance, and (ii) a truncated-abundance CTI excluding the most abundant species (top 5% in terms of total abundance over the study period). All CTI variants were computed using the same set of species with available STI values and excluding the year 2021. These alternative formulations were used to evaluate the extent to which CTI dynamics were influenced by dominant species and to test whether the inferred thermophilisation trend was consistent across different weighting schemes.

2.6. Statistical Analyses

Temporal trends in climate variables, total abundance and CTI were assessed using linear regression models, whereas species-level trends were estimated using TRIM (see above). Relationships between environmental variables and bird abundance were evaluated using Pearson or Spearman correlation coefficients, depending on data distribution. To account for potential spurious correlations arising from shared temporal trends, additional analyses were conducted on detrended time series, obtained by removing linear temporal trends from the original variables prior to correlation analyses. Apart from TRIM trends, the analyses were performed in R (v4.3.2) [44], with statistical significance assessed at α = 0.05. Because the authors do not routinely rely on R as their primary statistical environment, these analyses were implemented through an AI-assisted workflow using ChatGPT v. 5.2 (OpenAI) to generate Python (v. 3.11) and R code for data filtering, descriptive statistics and regression modelling. All scripts and outputs were systematically checked, validated and interpreted by the authors. All scripts used for CTI calculations and robustness analyses are provided as Supplementary Material S5.

3. Results

3.1. Climate and Sea Level Trends

Mean winter temperature at Tessera station showed moderate interannual variability over the study period (1993–2022), with values fluctuating around a long-term mean of 5.9 ± 1.1 °C. No significant linear trend was detected (r = 0.17, p > 0.05). In contrast, annual mean sea level at Punta della Salute exhibited a significant increasing trend, with a rate of approximately +4.1 mm yr−1 (r = 0.71, p < 0.001). The annual number of hours with water levels below +10 cm, the level when tidal flats become exposed, showed a strong decreasing trend (slope = −38.8 h yr−1, r = 0.75, p < 0.001), declining from approximately 3000 h in the early 1990s to about 2000 h in the most recent years.

3.2. Community Composition and Diversity

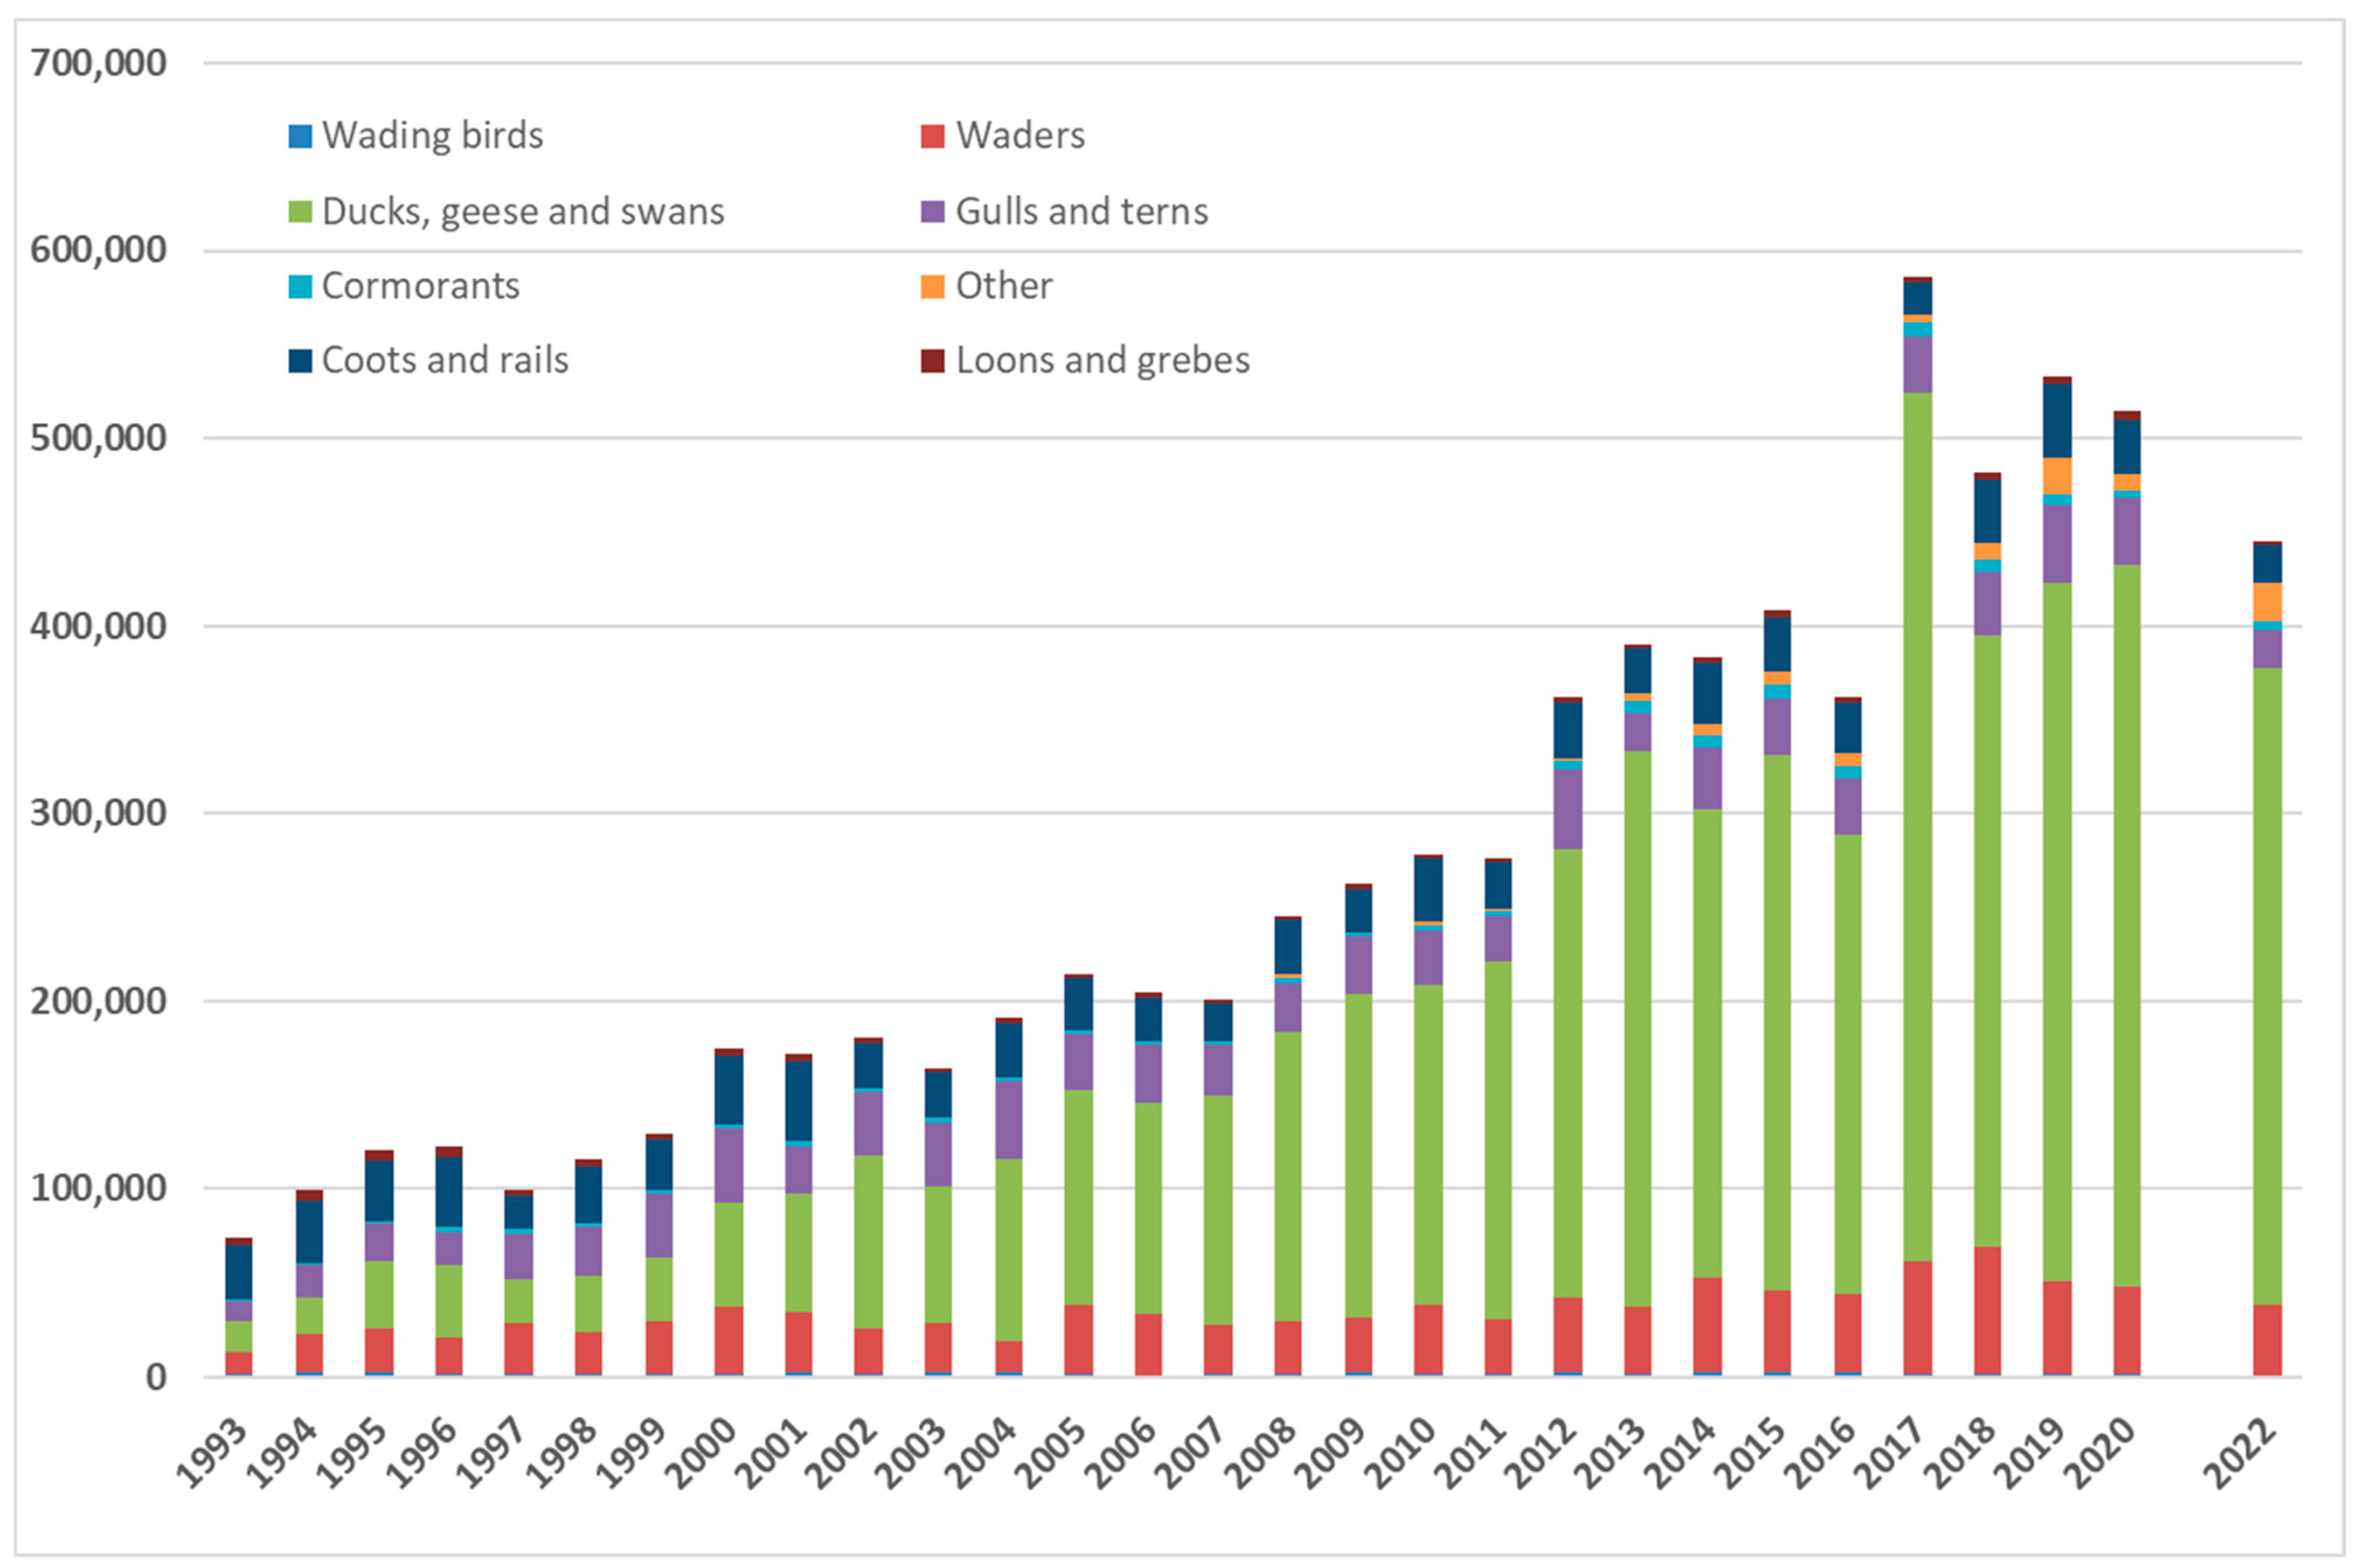
Species richness increased from 48 to 68 species over the study period, with a significant positive trend (r = 0.88, p < 0.001), corresponding to an average increase of 0.72 species per year. Shannon diversity showed a significant declining trend (r = −0.49, p = 0.006). A total of 34 species (34.2%) were recorded in all years, while the mean number of years of occurrence per species was 16.7 ± 11.3. In terms of higher-level group composition, “Ducks and geese” accounted for 61.6% of total individuals, followed by “Waders” (12.5%) and “Gulls and terns” (10.7%).

3.3. Interannual Community Similarity

Jaccard similarity between consecutive winters ranged from 0.65 to 0.85 (mean = 0.76). Bray–Curtis similarity ranged from 0.72 to 0.92 (mean = 0.85). No significant temporal trend was detected for Jaccard similarity (r = 0.02, p = 0.91). Bray–Curtis similarity showed a positive but non-significant trend (r = 0.29, p = 0.14).

3.4. Total Abundance Trends

Total wintering waterbird abundance increased markedly over the study period, from values below 200,000 individuals in the early 1990s to consistently above 450,000 in recent years, with peak values exceeding 500,000 individuals (Figure 3; Table S2). TRIM analysis classified the overall trend as a strong increase, with a highly significant positive slope (6.5%/yr, p < 0.01). The population index (1993 = 100) increased to values exceeding 600–700 in recent years.

3.5. Selected Species Trends

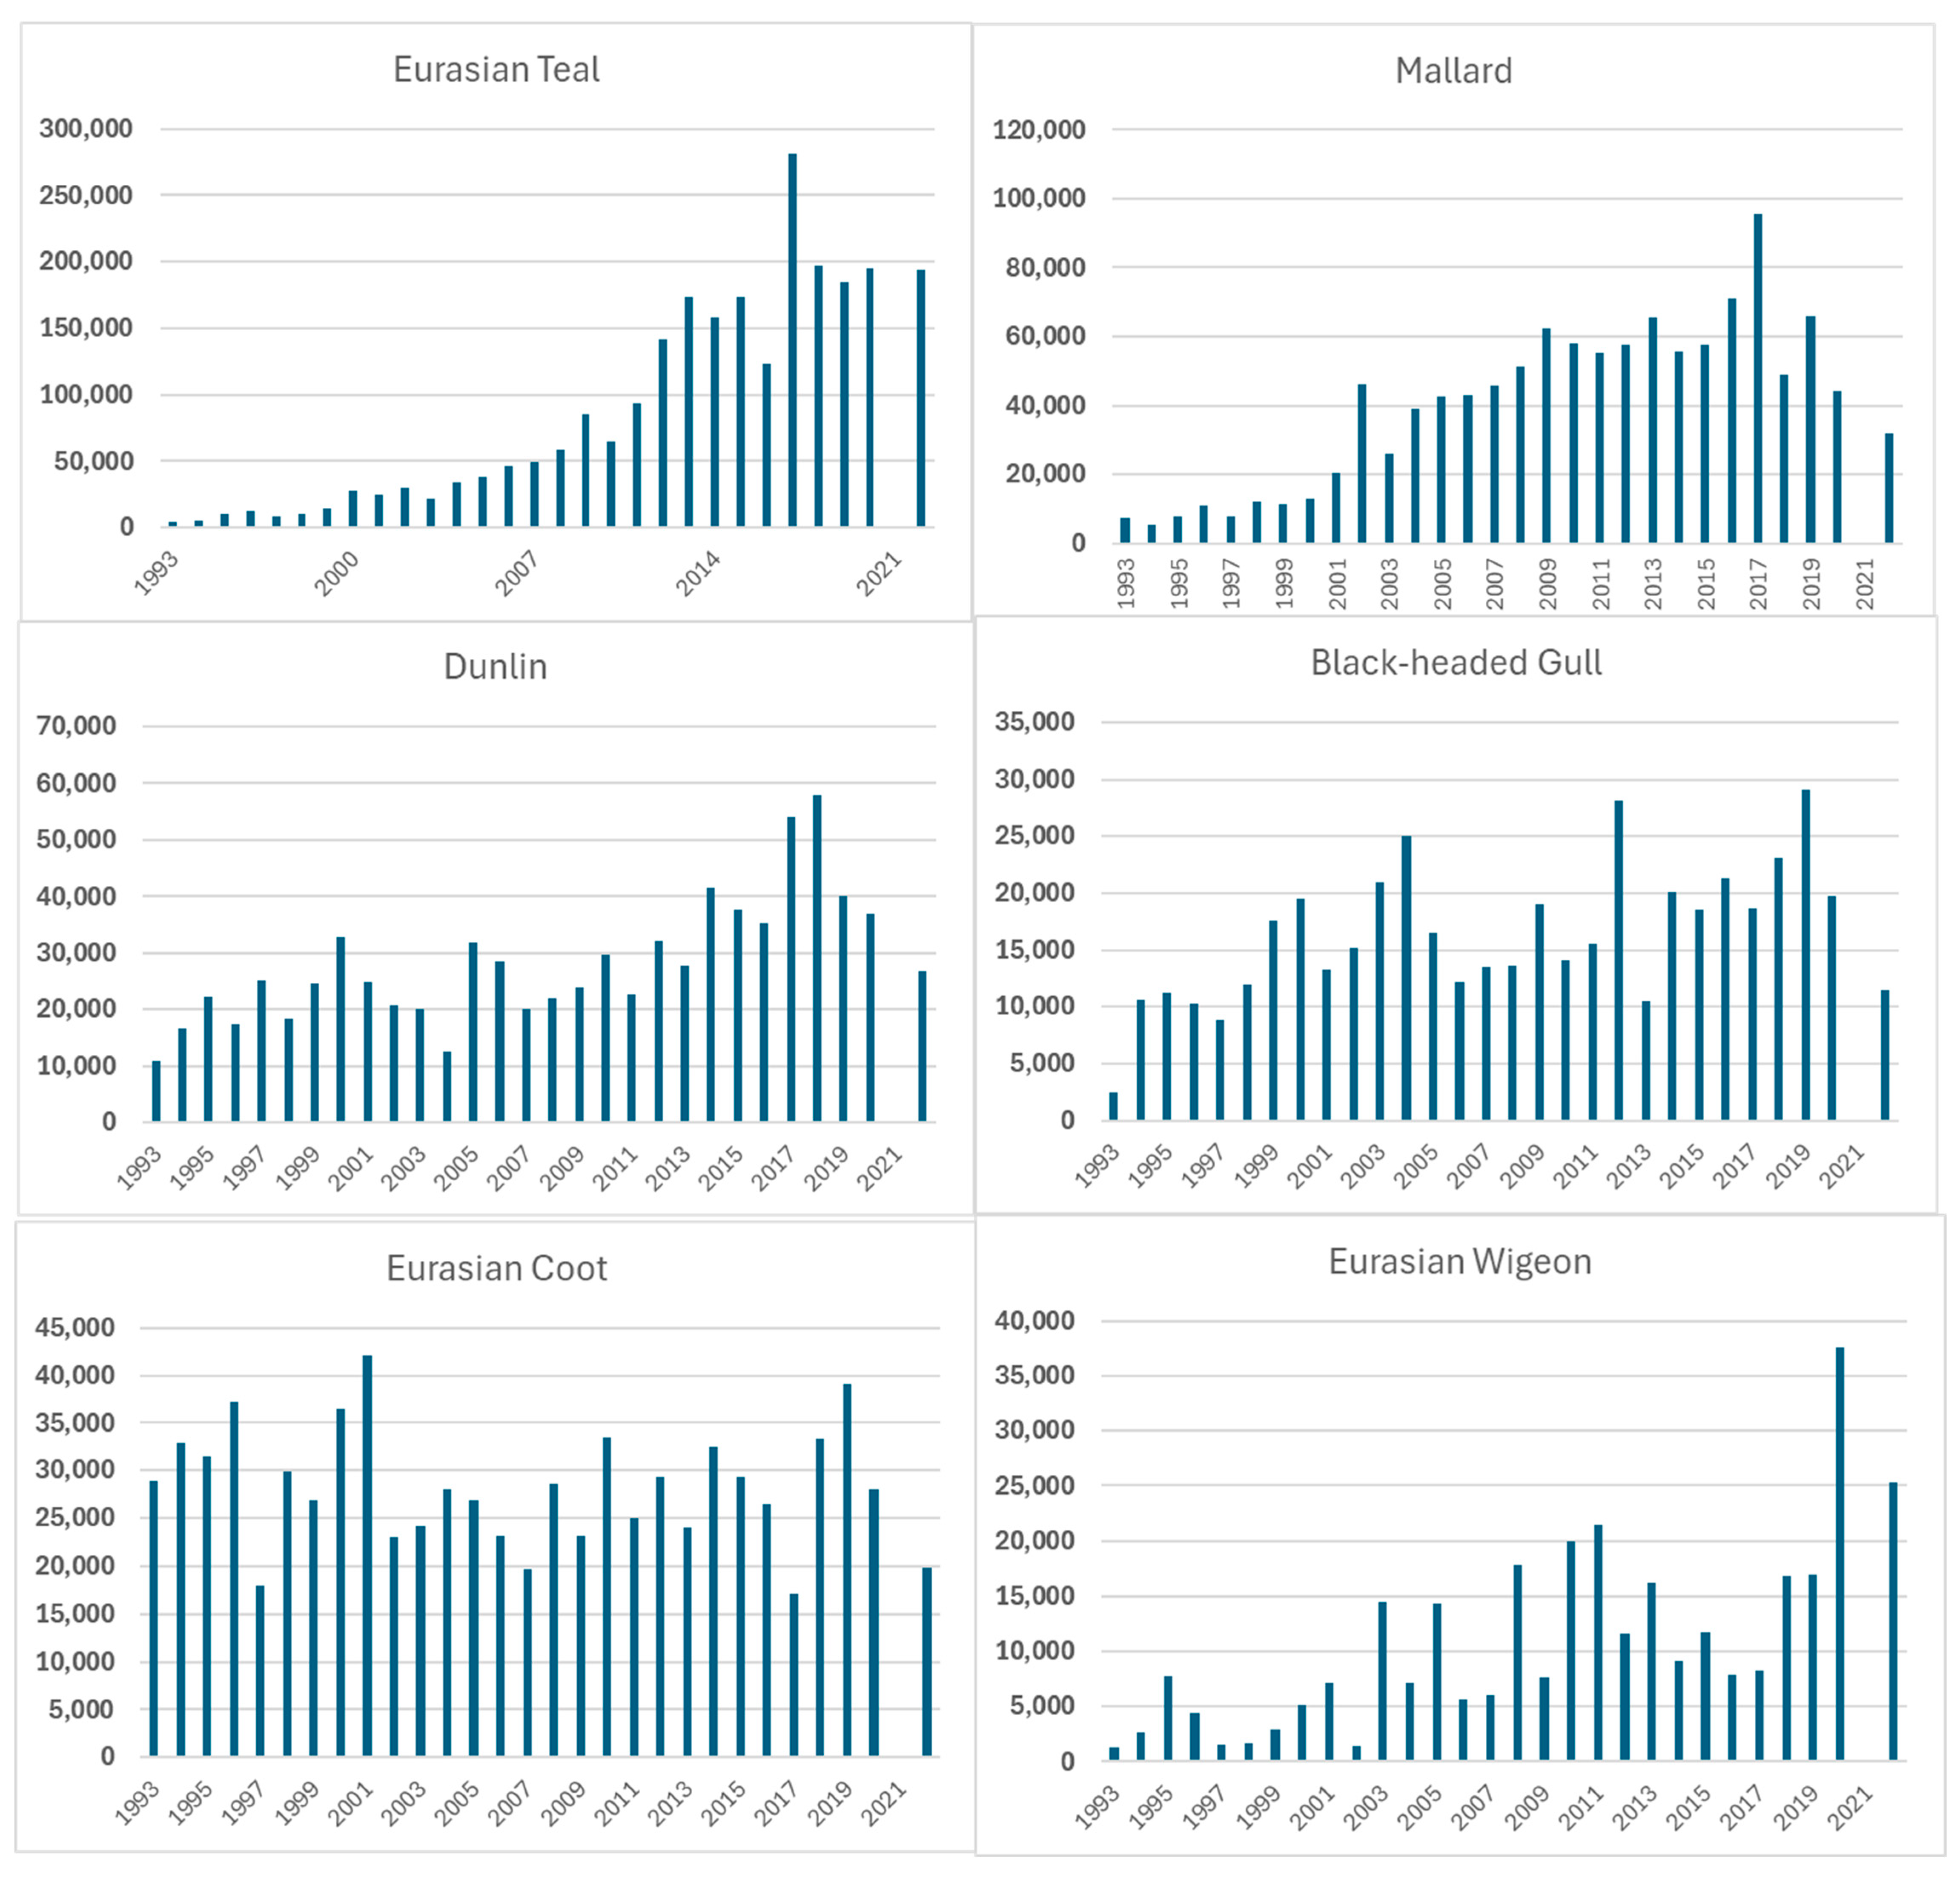
For the six species accounting for at least 4% of the 1993–2022 total, trends are reported in Figure 4; these six species accounted for about 77% of the total. The six species increased up to 2017–2019 and decreased in the following years.

3.6. Species Dominance Structure

Species abundance was highly uneven. Only 13 species accounted for at least 1% of the total abundance over the study period (Table 1) and together represented 92.1% of all individuals. The most abundant species were Eurasian Teal Anas crecca (31.5%), followed by Mallard Anas platyrhynchos (14.9%) and Eurasian Coot Fulica atra (10.5%). The remaining 89 species collectively accounted for less than 10% of the total abundance. In the most recent decade (2013–2022), dominance increased further, with 14 species accounting for 94.7% of all individuals.

3.7. Trends in Species, Systematic Groups and Guilds

Among the 66 species included in the TRIM analysis, 33 (50%) showed strong or moderate increases (Table S3). These included several species with large population changes, such as Greater Flamingo Phoenicopterus roseus, Greater White-fronted Goose Anser albifrons, Eurasian Oystercatcher Haematopus ostralegus, Greylag Goose Anser anser and Common Shelduck Tadorna tadorna. Eight species (12%) were classified as stable, including Grey Heron Ardea cinerea, Little Egret Egretta garzetta and Eurasian Coot Fulica atra. Declining trends were recorded only for three species (5%): Common Snipe Gallinago Gallinago, Great crested Grebe Podiceps cristatus and Common Goldeneye Bucephala clangula. Twenty-two species (33%) were classified as uncertain due to high interannual variability (Northern Lapwing Vanellus vanellus, Western Cattle Egret Ardea ibis) or limited data (Ruddy Shelduck Tadorna ferruginea, Ruff Calidris pugnax). When the analysis was restricted to the most recent decade (2013–2022), most species showed uncertain trends, and no species met the criteria for stable trends.
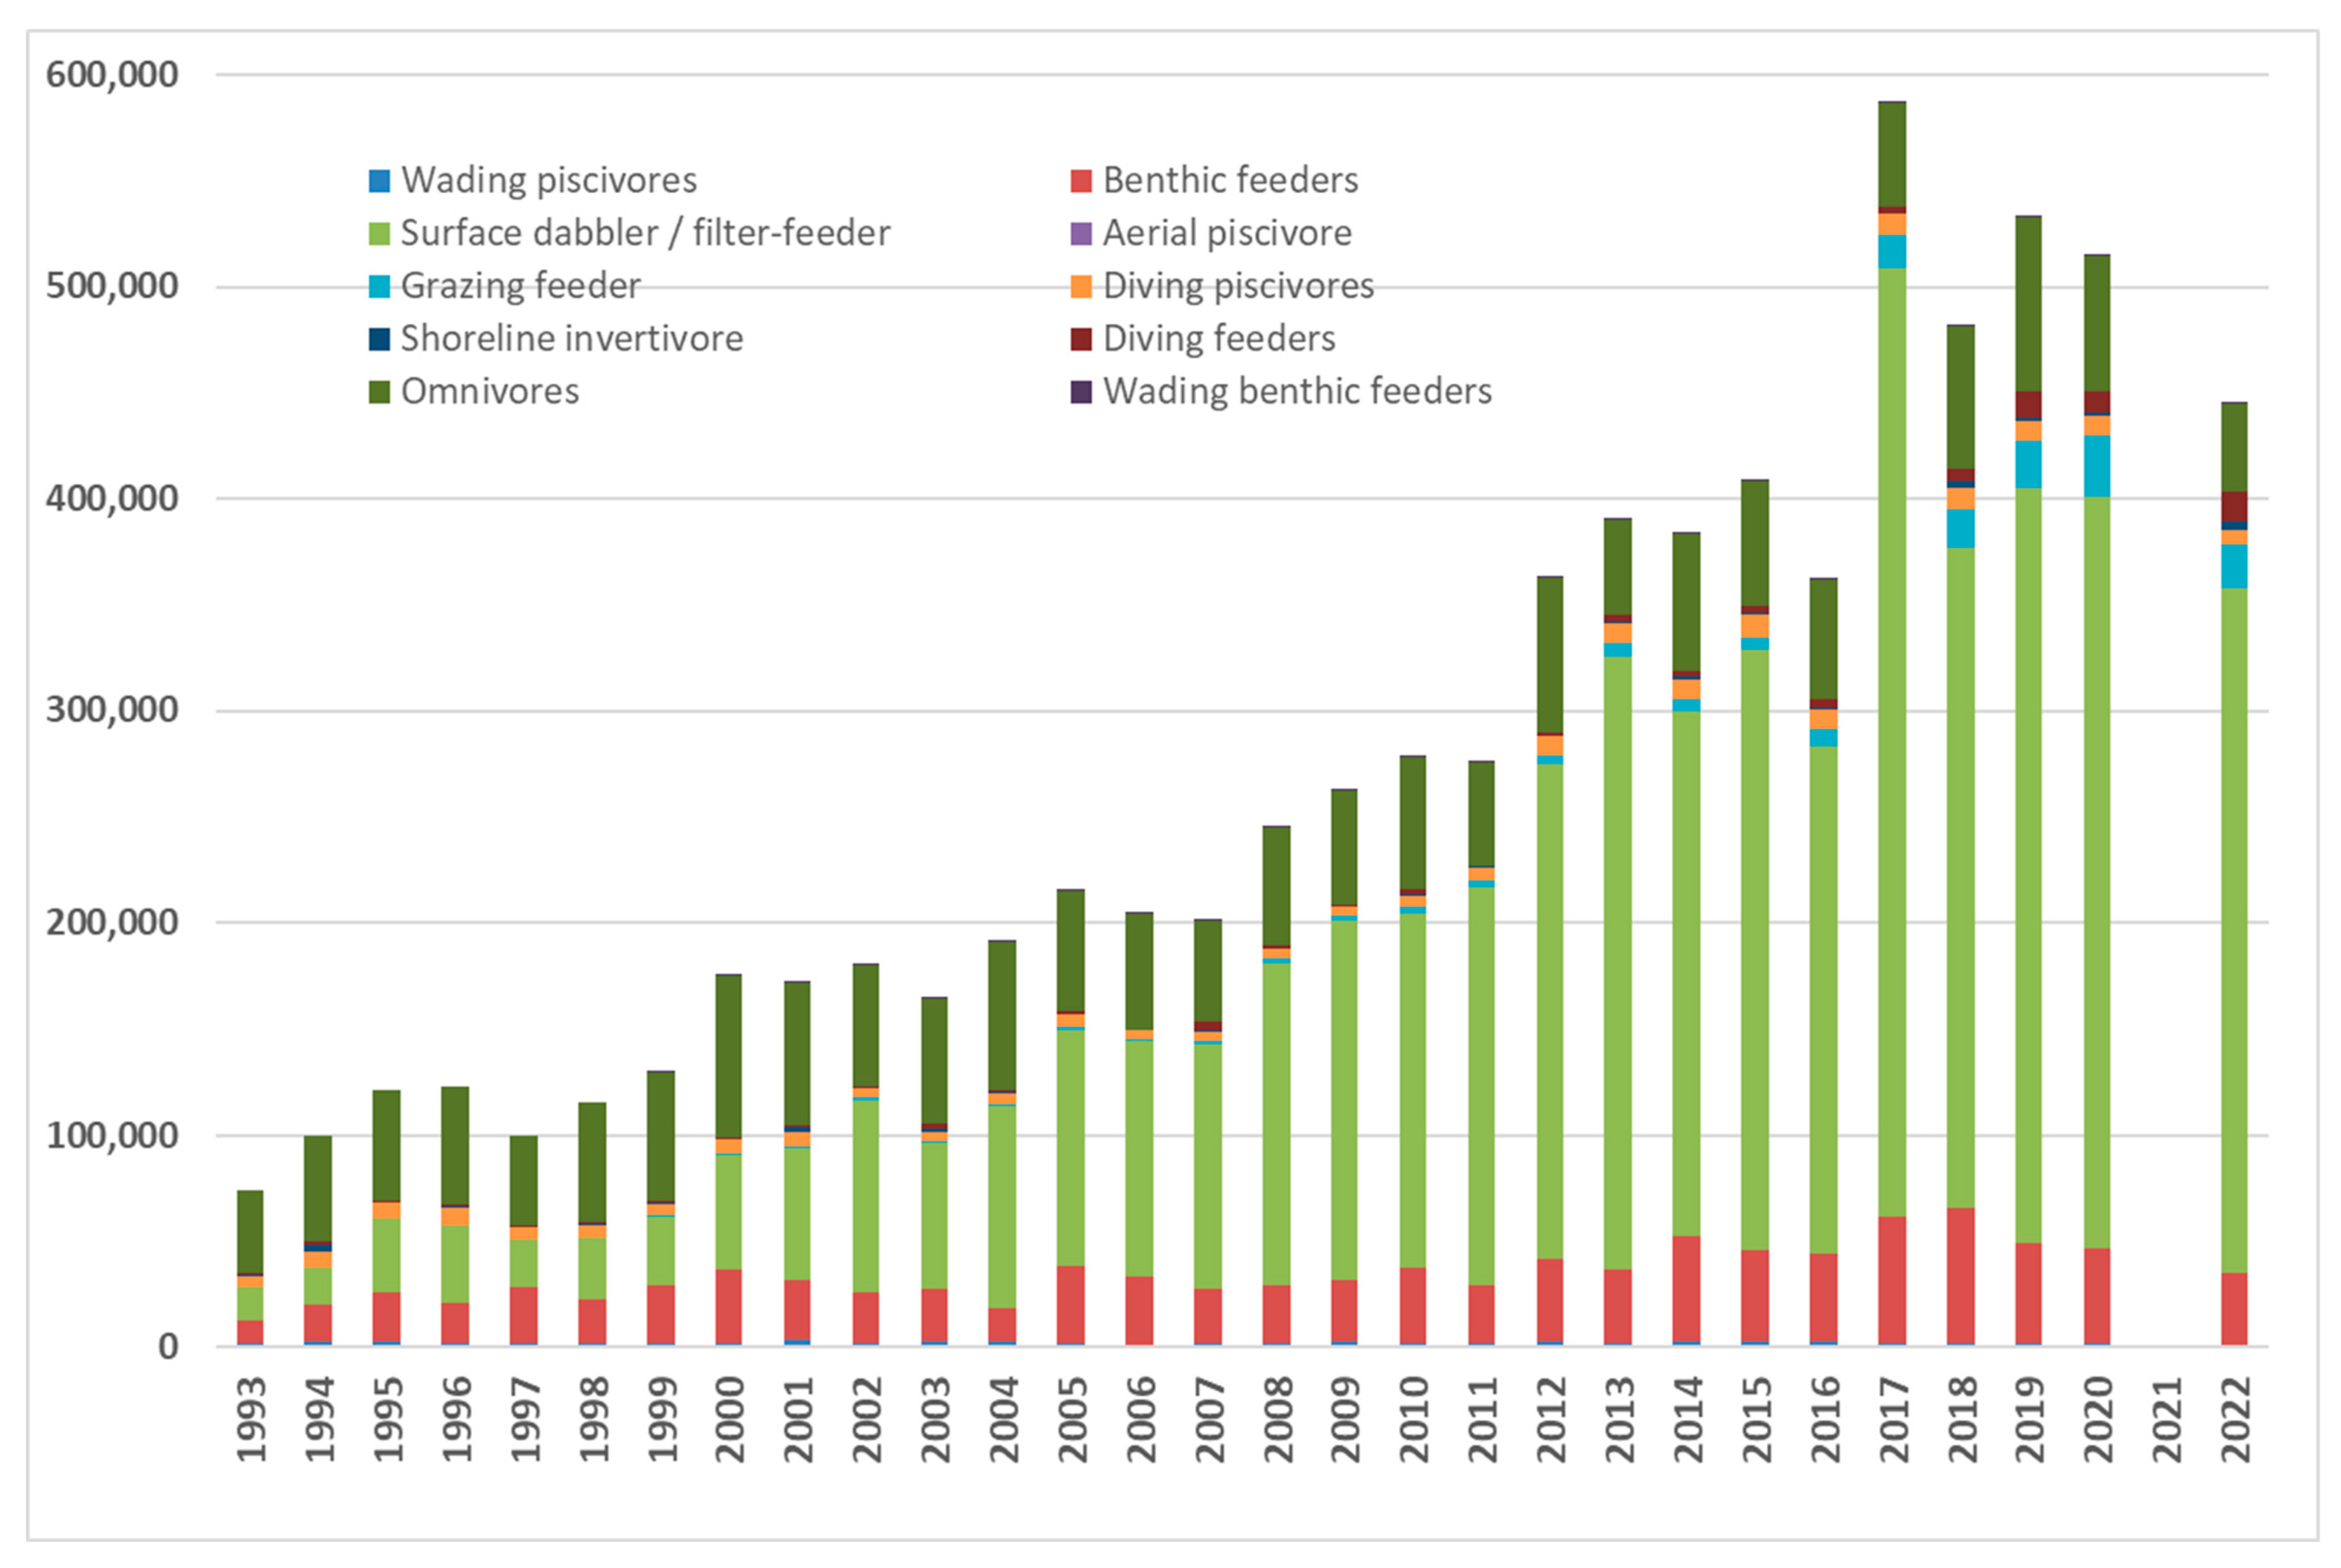
In the 1993–2022 winters “Ducks, geese and swans” showed a strong increase (>10% yr−1, p < 0.001), representing the main contributor to the overall abundance increase (Figure 5 and Table 2). Moderate increases were observed for “Waders” and “Cormorants”. “Wading birds”, “Gulls and terns”, “Coots and rails” and “Loons and grebes” were the only that showed stable trends.
Among co-functional groups, strong increases were observed in “Surface dabblers/filter-feeders”, “Grazing feeders” and “Wading benthic feeders”. Moderate increases were recorded for “Benthic feeders” and “Aerial piscivores” (Table 3). “Diving piscivores”, “Diving feeders”, “Wading piscivores” and “Omnivores” showed stable trends, while “Shoreline invertivores” were classified as uncertain.
In 1993–2022, fish farms accounted for approximately 82% of total wintering waterbirds and showed a strong increasing trend. The open lagoon accounted for approximately 15% of total abundance and showed a moderate increase. Minor wetlands and the littoral strip together accounted for approximately 3% and showed stable trends.

3.8. Species Included in Annex I of the 2009/147/EC Birds Directory

Species included in Annex I of the Birds Directive represented a relatively small proportion of the total number of individuals recorded during the study period, accounting for approximately 14.7% of all individuals (1,142,530 out of 7,796,629). In contrast, they contributed substantially to overall species richness, with 36 out of 102 species (35.3%) belonging to Annex I. The number of Annex I individuals showed a significant positive trend over time (slope = +1982 individuals yr−1, r = 0.84, p < 0.001), although with marked interannual variability. The number of Annex I species recorded annually ranged from 10 to 22 species and exhibited a significant increasing trend over the study period (slope = +0.35 species yr−1, r = 0.90, p < 0.001).

3.9. Community Temperature Index (CTI)

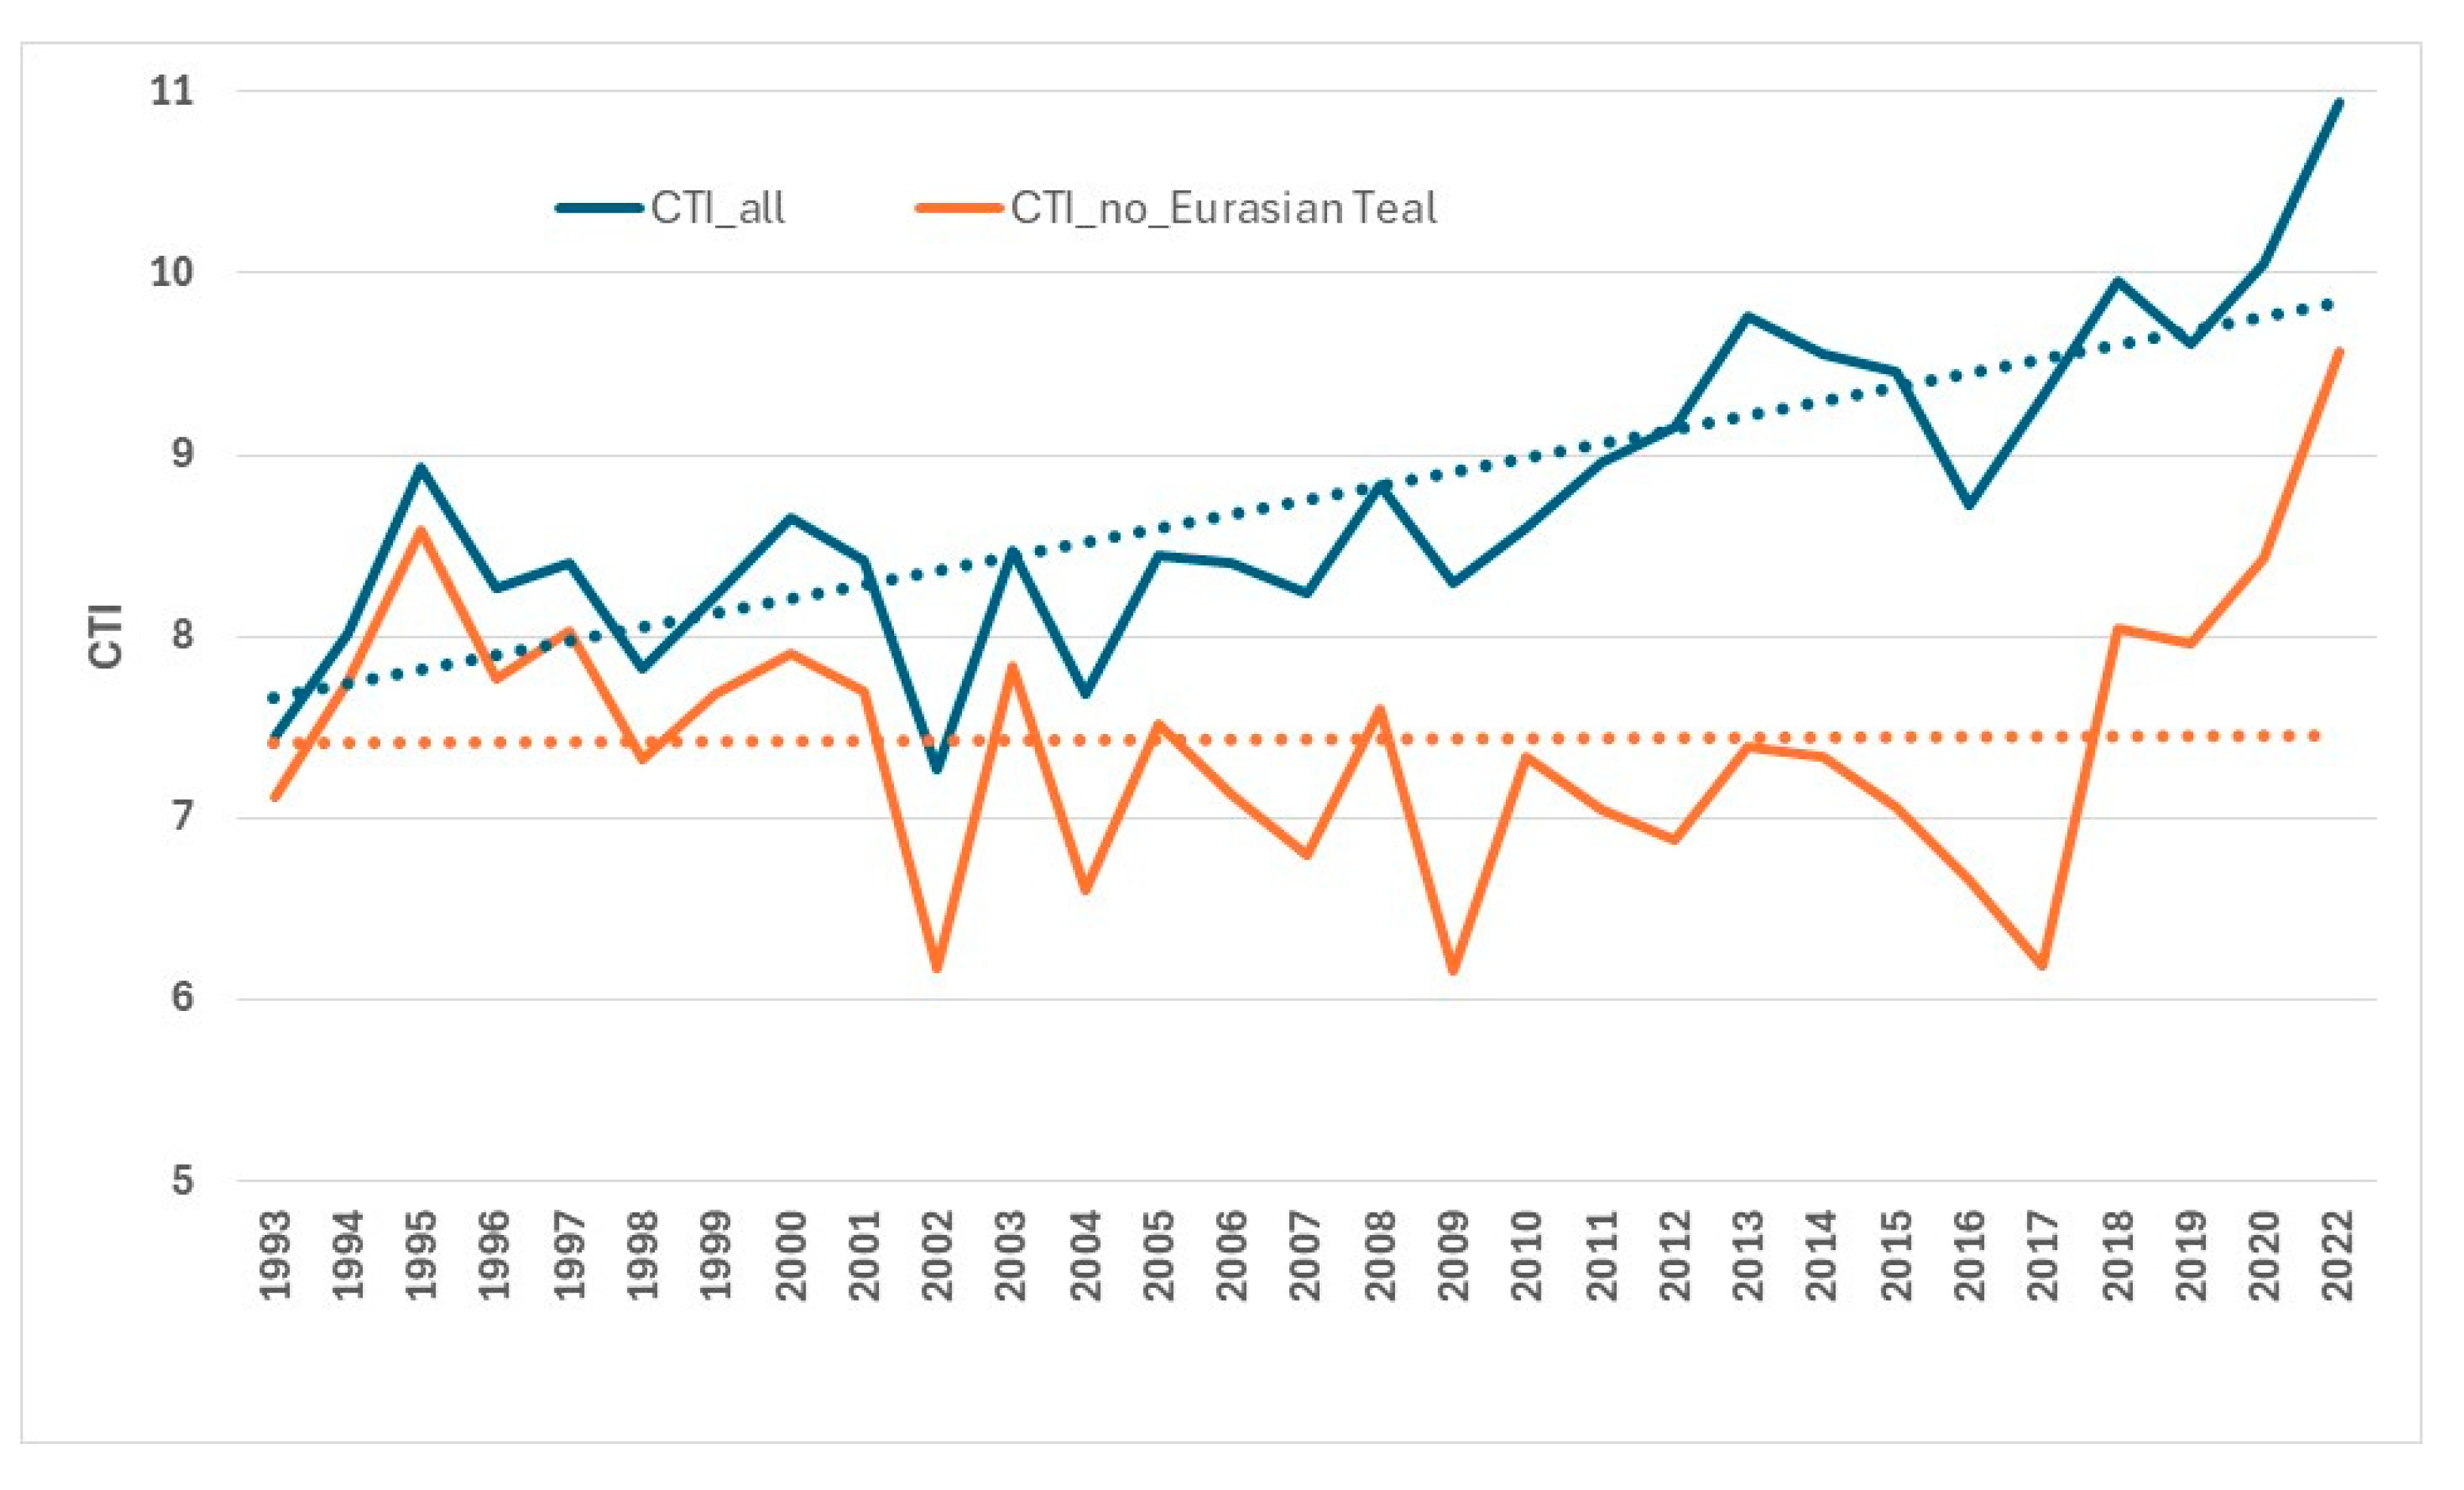
CTI showed a significant positive trend over the study period (slope = +0.078 yr−1, r = 0.80, p < 0.001; Figure 6). Species-level contribution analysis indicated that a limited number of species accounted for most of the CTI increase. Eurasian Teal alone contributed approximately 80% of the total increase, with additional contributions from Pintail Anas acuta, Wigeon Mareca penelope and Dunlin Calidris alpina. Segmented regression analysis identified a breakpoint in CTI trends around the early 2000s (ca. 2001), with a subsequent increase in the rate of change. Although a marked rise in CTI values was observed after 2017, this recent increase does not represent the primary structural shift in the time series but rather a short-term amplification likely driven by fluctuations in dominant species. When the most abundant species (Eurasian Teal) was excluded, the CTI trend was no longer significant (slope = +0.003 yr−1, r = 0.03, p = 0.86: Figure 6). CTI calculated for waders, the second most abundant groups after ducks, showed a weaker but significant positive trend (slope = +0.033 yr−1, r ≈ 0.58, p = 0.001); excluding the most abundant wader (i.e., Dunlin) removed statistical significance. Sensitivity analyses indicated that CTI trends were strongly dependent on species dominance. The presence-weighted CTI showed only a weak and non-significant increase over time (slope = +0.012 yr−1, r = 0.20, p = 0.296; Table S4). Similarly, the truncated-abundance CTI, calculated after excluding the most abundant species (top 5% in terms of total abundance), showed a reduced and non-significant trend (slope = +0.043 yr−1, r = 0.34, p = 0.074) compared with the standard abundance-weighted CTI. These results indicate that the temporal increase in CTI was strongly influenced by a small number of dominant species.

3.10. Tidal Exposure and Wader Abundance

A significant negative correlation was observed between annual tidal-flat exposure (no. of hours) and total wader abundance (Spearman r = −0.72, p < 0.001). After detrending the time series, this relationship was no longer significant. The proportion of waders recorded in fish farms declined significantly over time and was positively correlated with tidal-flat exposure (Spearman r = 0.63, p < 0.001).

4. Discussion

This study provides a comprehensive long-term assessment of wintering waterbird dynamics in the Venice Lagoon, based on nearly three decades of International Waterbird Census data. By integrating abundance trends, spatial patterns and climate-related indicators, our results highlight a system undergoing substantial quantitative and structural changes.
At the lagoon scale, wintering waterbird abundance increased markedly over the study period, with a clear acceleration in the early 2000s followed by stabilization at high levels. This increase was accompanied by a significant rise in species richness but a concurrent decline in Shannon diversity, indicating a progressive increase in community dominance. Indeed, a limited number of species accounted for the vast majority of individuals, and this dominance structure became even more pronounced in recent years. Moreover, Birds Directory Annex I species accounted for a limited share of total abundance but a consistent and substantial proportion of the species assemblage, highlighting their importance from a conservation perspective despite their relatively low numerical contribution. The increase in the number of species throughout the study period highlights the importance of the Venice lagoon for these species of conservation concern.
Despite these quantitative changes, the qualitative composition of the community remained relatively stable. Interannual similarity indices showed consistently high values, indicating that most species were recorded regularly across years. Temporal variability was therefore mainly associated with fluctuations in the abundance of dominant taxa rather than with major shifts in species composition. This combination of increasing abundance, rising richness and stable species composition, coupled with declining diversity, characterizes a community increasingly structured by a few highly abundant species.
The magnitude of change observed for some species was particularly striking. For example, Greater Flamingo increased from negligible numbers in the early 2000s to tens of thousands of individuals in recent years, and species such as Eurasian Oystercatcher and Shelduck also showed substantial increases. Conversely, the marked decline of Common Goldeneye is consistent with broader northward shifts of wintering distribution reported across Europe [3]. These patterns suggest that both large-scale redistribution processes and regional population dynamics contribute to shaping the local assemblage.
The Community Temperature Index (CTI) showed a strong positive trend, which would conventionally be interpreted as evidence of community-level thermophilisation. However, the contribution analysis clearly demonstrates that this signal is highly uneven and largely driven by a very small number of dominant species. In particular, the increase in Eurasian Teal alone accounts for the majority of the observed CTI trend.
When this species is removed, the CTI trend collapses, and similar sensitivity is observed, albeit to a lesser extent, within the wader assemblage. Consistently, additional robustness analyses showed that the CTI trend is strongly dependent on the weighting scheme applied: both the exclusion of the most abundant species and the use of a presence-weighted formulation resulted in a marked reduction of the trend magnitude and a loss of statistical significance.
These results indicate that, in the Venice Lagoon, CTI does not reflect a coherent, community-wide response to climate warming but rather the demographic trajectories of a few highly abundant species. This finding is consistent with previous studies highlighting that community-weighted indices can be strongly influenced by species dominance and uneven abundance distributions [45].
Therefore, while CTI remains a useful synthetic indicator, its interpretation requires caution in systems characterized by high dominance. In such contexts, CTI should be complemented by species-level analyses, contribution assessments and robustness tests to ensure a more reliable interpretation of community-level responses. These results demonstrate that, in highly uneven systems, apparent community-level responses may emerge from the dynamics of a few dominant species rather than from genuine ecological reorganization.
The absence of a detectable increase in winter temperature over the study period suggests that local climatic conditions alone do not explain the observed changes in community structure. Instead, the interaction between large-scale climate processes and local habitat management appears to be a key driver.
Fish farms were strongly associated with the observed increase in wintering waterbirds, consistently hosting the majority of individuals and accounting for a large proportion of the overall trend. These semi-natural wetlands provide stable hydrological conditions, high food availability and relatively low disturbance, thereby supporting very high densities of waterbirds, especially Anatidae. While the observed pattern strongly suggests a key role of habitat management in attracting wintering birds, as observed elsewhere where managed habitats can modify or delay climate-driven redistribution patterns [15,19,20,25,46,47], we acknowledge that the available data in our study area do not allow a formal demonstration of causality. Quantitative data on management intensity (e.g., feeding regimes, water-level control, hunting pressure) were not available for the entire study period, and their inclusion would be necessary to formally test causal relationships. Alternative or concurrent drivers, including flyway-scale population changes, climatic redistribution and hunting-related factors, may also contribute to the observed dynamics. Part of the increase observed in the Venice Lagoon likely reflects broader flyway-scale population dynamics, particularly for widespread dabbling ducks such as Eurasian Teal and Eurasian Wigeon, whose wintering distributions and abundances in Europe are known to be influenced by climatic conditions and large-scale environmental change [9,48]. Nevertheless, ref. [49] indicate a decline in A. crecca in countries along the Mediterranean coasts during the 2013–2022 period, a trend strongly different from that observed in the Venice lagoon.
The role of management is not without potential ecological consequences. Extremely high densities of a few dominant species may increase risks related to disease transmission, eutrophication and altered trophic interactions [13,50,51]. As ref. [19] argues, “… hunting management could provide attractive habitats for duck populations in the southern range of their distribution in the short term. However, if climate warming continues its current trend, these populations will be trapped in southern Europe in a non-optimal ambient temperature environment with regards to the upper limit of their thermoneutral zone.”, resulting in a maladaptive choice. This topic clearly deserves the highest attention for the largest Mediterranean wetland assemblage of wintering waterbirds, that is the lagoon of Venice.
Contrary to our initial hypothesis, the strong reduction in tidal-flat exposure associated with sea-level rise did not result in a decrease in wintering wader abundance, as it is foreseen for other coastal sites elsewhere [52,53]. Although a negative correlation was observed between exposure time and wader numbers, this relationship disappeared after detrending, indicating that it was primarily driven by opposing long-term trends rather than by a direct ecological mechanism. This apparent decoupling may be explained by behavioural flexibility and habitat-related processes. Waders are known to adjust their foraging behaviour in response to tidal constraints, exploiting shorter low-water windows and redistributing their activity across available habitats [46,54]. In addition, the Venice lagoon provides a wide range of alternative or complementary foraging habitats, including shallow areas within fish farms and artificial salt marshes [55,56,57], which may buffer the effects of reduced intertidal exposure. However, the use of fish farms by waders did not increase over time; on the contrary, their relative importance declined, and most individuals were increasingly recorded in the open lagoon. This indicates that fish farms do not function simply as alternative habitats under reduced tidal availability but rather as part of a broader and dynamic habitat mosaic.
Nevertheless, looking ahead, the buffering capacity of the Venice lagoon system may be limited. Under projected sea-level rise scenarios (about 22 cm by 2050 [29]), a substantial reduction in low-water exposure time is expected, potentially leading to a regime in which suitable intertidal conditions become rare and episodic. Under such conditions, behavioural plasticity and habitat substitution may no longer compensate for habitat loss, with potential consequences for wader populations.
Overall, our results highlight that long-term changes in wintering waterbird communities in the Venice Lagoon arise from the interaction between climate forcing and human-mediated habitat management. While climate-related indicators such as CTI provide valuable insights, their interpretation must explicitly account for species dominance and functional structure. In highly uneven communities, apparent signals of thermophilisation may reflect the dynamics of a few dominant taxa rather than a generalized community response.
From a management perspective, the Venice Lagoon illustrates both the potential and the limitations of managed wetlands. While they can support exceptionally high numbers of wintering waterbirds, they may also promote structural imbalances within the community. Future conservation strategies should therefore aim not only to maintain high abundance levels but also to preserve functional diversity and ecological resilience.

Supplementary Materials

The following supporting information can be downloaded at: https://www.mdpi.com/article/10.3390/d18050276/s1. Table S1: STI sources; Table S2: Wintering numbers 1993_2022; Table S3: TRIM_ trends_66_species; Table S4: CTI_Venice_1993_2022; S5: CTI analysis script.

Author Contributions

Methodology, F.S. and M.B.; formal analysis, F.S.; data curation, C.M.; writing—original draft preparation, F.S.; writing—review and editing, F.S., M.B. and R.V. All authors have read and agreed to the published version of the manuscript.

Funding

This research received no external funding.

Data Availability Statement

Results of the 1993–2022 census are included in Table S2.

Acknowledgments

Sincere thanks are extended to the Associazione Faunisti Veneti (AsFaVe) for providing the original database. Many tens of skilled volunteers participated in the mid-January counts, too many to be acknowledged here. M. Basso coordinated surveys since 2004. The then Provincia di Venezia (now Città metropolitana di Venezia) funded the counts between 1996 and 2016, and AsFaVe between 2017 and 2024. During the preparation of this manuscript, the authors used ChatGPT v. 5.2 (OpenAI) for some statistical analysis and styling improvement. The authors have reviewed and edited the output and take full responsibility for the content of this publication. Three referees greatly improved the manuscript with their comments.

Conflicts of Interest

The authors declare no conflicts of interest. Authors F.S. and C.M. were employed by the company SELC soc. coop. The remaining authors declare that the research was conducted in the absence of any commercial or financial relationships that could be construed as a potential conflict of interest.

References

  1. Gaget, E.; Pavón-Jordán, D.; Johnston, A.; Lehikoinen, A.; Hochachka, W.M.; Sandercock, B.K.; Brommer, J.E. Benefits of protected areas for nonbreeding waterbirds adjusting their distribution under climate warming. Conserv. Biol. 2021, 35, 834–845. [Google Scholar] [CrossRef] [PubMed]
  2. Nagy, S.; Langendoen, T. Trends of Wintering Waterbirds in the European Union: 2025 Update; Wetlands International Europe: Ede, The Netherlands, 2025; p. 51. Available online: https://europe.wetlands.org/trends–of-wintering-waterbirds-in-the-eu-2025/ (accessed on 1 March 2026).
  3. Lehikoinen, A.; Jaatinen, K.; Vähätalo, A.V.; Clausen, P.; Crowe, O.; Deceuninck, B.; Hearn, R.; Holt, C.A.; Hornman, M.; Keller, V.; et al. Rapid climate driven shifts in wintering distributions of three common waterbird species. Glob. Change Biol. 2013, 19, 2071–2081. [Google Scholar] [CrossRef] [PubMed]
  4. Godet, L.; Jaffrè, M.; Devictor, V. Waders in winter: Long-term changes of migratory bird assemblages facing climate change. Biol. Lett. 2011, 7, 714–717. [Google Scholar] [CrossRef]
  5. Wetlands International. Waterbird Population Estimates, 5th ed.; Wetlands International: Wageningen, The Netherlands, 2012; 28p, Available online: https://www.wetlands.org/wp-content/uploads/2015/11/Waterbird-Populations-Estimates-Fifth-Edition.pdf (accessed on 28 January 2026).
  6. Nagy, S.; Breiner, F.T.; Anand, M.; Butchart, S.H.M.; Flörke, M.; Fluet-Chouinard, E.; Guisan, A.; Hilarides, L.; Jones, V.R.; Kalyakin, M.; et al. Climate change exposure of waterbird species in the African–Eurasian flyways. Bird Conserv. Int. 2022, 32, 1–26. [Google Scholar] [CrossRef]
  7. Pavón-Jordán, D.; Fox, A.D.; Clausen, P.; Dagys, M.; Deceuninck, B.; Devos, K.; Hearn, R.D.; Holt, C.A.; Hornman, M.; Keller, V.; et al. Climate-driven changes in winter abundance of a migratory waterbird in relation to EU protected areas. Divers. Distrib. 2015, 21, 571–582. [Google Scholar] [CrossRef]
  8. Musilová, Z.; Musil, P.; Zouhar, J.; Šenkýřová, A.; Pavón-Jordán, D.; Nummi, P. Changes in wetland habitat use by waterbirds wintering in Czechia are related to diet and distribution changes. Freshw. Biol. 2022, 67, 309–324. [Google Scholar] [CrossRef]
  9. Fox, A.D.; Dalby, L.; Christensen, T.K.; Nagy, S.; Balsby, T.J.S.; Crowe, O.; Wahl, J. Seeking explanations for recent changes in abundance of wintering Eurasian wigeon (Anas penelope) in northwest Europe. Ornis Fenn. 2016, 93, 12–25. [Google Scholar] [CrossRef]
  10. Lehikoinen, A.; Brotons, L.; Calladine, J.; Campedelli, T.; Escandell, V.; Flousek, J.; Harris, S.; Herrando, S.; Husby, M.; Jiguet, F.; et al. Wintering bird communities are tracking climate change faster than breeding communities. J. Anim. Ecol. 2021, 90, 1085–1098. [Google Scholar] [CrossRef]
  11. Maclean, I.M.D.; Austin, G.E.; Rehfisch, M.M.; Blew, J.; Crowe, O.; Delany, S.; Devos, K.; Deceuninck, B.; Günther, K.; Laursen, K.; et al. Climate change causes rapid changes in the distribution and site abundance of birds in winter. Glob. Change Biol. 2008, 14, 2489–2500. [Google Scholar] [CrossRef]
  12. Lajeunesse, A.; Fourcade, Y. Temporal analysis of GBIF data reveals the restructuring of communities following climate change. J. Anim. Ecol. 2023, 92, 391–402. [Google Scholar] [CrossRef]
  13. Rendón, M.A.; Green, A.J.; Aguilera, E.; Almaraz, P. Status, distribution and long-term changes in the waterbird community wintering in Doñana. Biol. Conserv. 2008, 141, 1371–1388. [Google Scholar] [CrossRef]
  14. Santangeli, A. Disentangling the complexity of climate change and land-management effects on wildlife communities. Anim. Conserv. 2024, 27, 17–18. [Google Scholar] [CrossRef]
  15. Gaget, E.; Ovaskainen, O.; Bradter, U.; Haas, F.; Jonas, L.; Johnston, A.; Brommer, J.E. Changes in waterbird occurrence and abundance at their northern range boundaries in response to climate warming: Importance of site area and protection status. Anim. Conserv. 2025, 28, 490–500. [Google Scholar] [CrossRef]
  16. Scarton, F.; Bon, M. Gli uccelli acquatici svernanti in laguna di Venezia nel periodo 1993-2007: Analisi delle dinamiche temporali e spaziali. Avocetta 2009, 33, 87–99. [Google Scholar]
  17. Ramirez, F.; Rodriguez, C.; Seoane, J.; Figuerola, J.; Bustamante, J. How will climate change affect endangered Mediterranean waterbirds? PLoS ONE 2018, 13, e0192702. [Google Scholar] [CrossRef] [PubMed]
  18. Barnagaud, J.Y.; Papaix, J.; Audevard, A.; Lascève, M.; Wroza, S.; Geoffroy, D. Interspecific variations in shorebird responses to management practices on protected Mediterranean saltpans. Biol. Conserv. 2019, 237, 470–479. [Google Scholar] [CrossRef]
  19. Navedo, J.G. Habitat management favouring duck hunting seems to prevent shifting distribution due to climate warming. Another avenue for hunting ‘greenwashing’? Anim. Conserv. 2024, 27, 19–20. [Google Scholar] [CrossRef]
  20. Jonas, L.; Brommer, J.E.; Jung, M.; Baláž, M.; Borg, J.J.; Božič, L.; Clausen, P.; Derouaux, A.; Devos, K.; Domșa, C.; et al. Interactions between climate warming and management actions determining bird community change in protected areas. Biol. Conserv. 2025, 308, 111213. [Google Scholar] [CrossRef]
  21. Zenatello, M.; Baccetti, N.; Luchetta, A. International Waterbird Census Report Italy. 2009–2018. 2018. Available online: https://www.medwaterbirds.net/page.php?id=46 (accessed on 1 March 2026).
  22. De Corso, S.; De Benedetti, A.A.; Cimini, A.; d’Antona, M.; De Fioravante, P.; Di Leginio, M.; Finocchiaro, G.; Vaccaro, L.; Giunta, M.; Munafò, M. Atlante dei Dati Ambientali; ISPRA: Rome, Italy, 2024. Available online: https://www.isprambiente.gov.it/public_files/ATLANTE_DATI_AMBIENTALI_2024_rev2_ottobre.pdf (accessed on 1 March 2026).
  23. Moussy, C.; Quaintenne, G.; Gaudard, C. Comptage des oiseaux d’eau à la mi-janvier en France. In Résultats 2022 du Comptage Wetlands International; LPO BirdLife France: Rochefort, France, 2022; Available online: https://blue-eco-formations.com/wp-content/uploads/Comptage-oiseaux-zones-humides-2022.pdf (accessed on 1 March 2026).
  24. PNDE (Parc Natural Delta de l’Ebre). Resultats Dels Censos d’ocells Aquàtics del Delta de l’Ebre a l’hivern (Gener de 2025); Generalitat de Catalunya: Tarragona, Spain, 2026; Available online: https://parcsnaturals.gencat.cat (accessed on 1 March 2026).
  25. de Felipe, M.; Amat, J.A.; Arroyo, J.L.; Rodríguez, R.; Díaz-Paniagua, C. Habitat changes at the local scale have major impacts on waterfowl populations across a migratory flyway. Glob. Change Biol. 2024, 30, e17600. [Google Scholar] [CrossRef]
  26. Basso, M. Gli Uccelli Acquatici Svernanti in Provincia di Venezia. Censimento IWC Gennaio 2025; Unpublished Report, 2025. Available online: https://atclagunarevenezia.it/wp-content/uploads/2025/02/IWC_Venezia_2025_relazione.pdf (accessed on 1 March 2026).
  27. Bon, M.; Cherubini, G. I censimenti degli uccelli acquatici svernanti in laguna di Venezia: Risvolti gestionali. Boll. Mus. Civ. St. Nat. Venezia 1998, 48, 37–43. [Google Scholar]
  28. Bon, M.; Scarton, F. Lo Svernamento Degli Uccelli Acquatici in Provincia di Venezia (1993–2012); Provincia di Venezia: Venezia, Italy, 2012; p. 164. [Google Scholar]
  29. Ferrarin, C.; Bonaldo, D.; Bergamasco, A.; Ghezzo, M. Sea level and temperature extremes in a regulated Lagoon of Venice. Front. Clim. 2024, 5, 1330388. [Google Scholar] [CrossRef]
  30. Šepić, J.; Pasarić, M.; Međugorac, I.; Vilibić, I.; Karlović, M.; Mlinar, M. Climatology and process-oriented analysis of Adriatic sea-level extremes. Prog. Oceanogr. 2022, 209, 102908. [Google Scholar] [CrossRef]
  31. Torresan, S.; Gallina, V.; Gualdi, S.; Bellafiore, D.; Umgiesser, G.; Carniel, S.; Sclavo, M.; Benetazzo, A.; Giubilato, E.; Critto, A. Assessment of climate change impacts in the North Adriatic coastal area. Part I: A Multi-Model Chain for the Definition of Climate Change Hazard Scenarios. Water 2019, 11, 1157. [Google Scholar] [CrossRef]
  32. Stocco, A.; Basconi, L.; Rova, S.; Pranovi, F. Like little lagoons: The contribution of valli da pesca to ecosystem services. Estuaries Coasts 2023, 46, 616–629. [Google Scholar] [CrossRef]
  33. Scarton, F.; Cecconi, G.; Valle, R. Use of dredge islands for a declining European shorebird, the Kentish Plover Charadrius alexandrinus. Wetl. Ecol. Manag. 2013, 21, 15–27. [Google Scholar] [CrossRef]
  34. Coccon, F.; Baldaccini, N.E. Analisi delle variazioni temporali delle comunità ornitiche costiere e lagunari durante i lavori di costruzione del sistema MOSE. Il Control Ambient. Della Costr. Del MOSE 2017, 10, 37–65. [Google Scholar]
  35. Pavón-Jordán, D.; Clausen, P.; Dagys, M.; Devos, K.; Encarnaçao, V.; Fox, A.D.; Frost, T.; Gaudard, C.; Hornman, M.; Keller, V.; et al. Habitat- and species -mediated short- and long-term distributional changes in waterbird abundance linked to variation in European winter weather. Divers. Distrib. 2018, 25, 225–239. [Google Scholar] [CrossRef]
  36. Zanchettin, D.; Traverso, P.; Tomasino, M.; Lionello, P.; Coppola, E. Sea-level rise in Venice: Historic and future trends. Nat. Hazards Earth Syst. Sci. 2021, 21, 2643–2678. [Google Scholar] [CrossRef]
  37. Zenatello, M.; Baccetti, N.; Borghesi, F. Risultati dei censimenti degli uccelli acquatici svernanti in Italia. In Distribuzione, Stima e Trend Delle Popolazioni nel 2001–2010; Serie Rapporti, 206/2014; ISPRA: Rome, Italy, 2014; 331p. [Google Scholar]
  38. Godeau, U.; Gaget, E.; Dami, L.; Baddour, K.; Daf, D.O.S.O.; Dakki, M.; Frost, T.; Hornman, M.; Kolberg, H.; Lorentsen, S.; et al. Recommendations for Improving the Modeling of Wintering Waterbird Population Sizes and Trends. Ecol. Evol. 2026, 16, e72902. [Google Scholar] [CrossRef]
  39. Ysebaert, T.; Meire, P.; Herman, P.M.J.; Verbeek, H. Large-scale spatial patterns in estuarine macrobenthic communities. Biodivers. Conserv. 2000, 9, 335–355. [Google Scholar] [CrossRef]
  40. Magurran, A. Measuring Biological Diversity; Blackwell Publishing: Malden, MA, USA, 2004. [Google Scholar]
  41. Pannekoek, J.; van Strien, A.J. TRIM 3 Manual: Trends and Indices for Monitoring Data; Statistics Netherlands: Voorburg, The Netherlands, 2005; Available online: https://www.cbs.nl/en-gb/society/nature-and-environment/indices-and-trends--trim-- (accessed on 1 March 2026).
  42. Gaget, E.; Galewski, T.; Jiguet, F.; Le Viol, I. Waterbird communities adjust to climate warming according to conservation policy and species protection status. Biol. Conserv. 2018, 227, 205–212. [Google Scholar] [CrossRef]
  43. Gaüzère, P.; Doulcier, G.; Devictor, V. A framework for estimating species-specific contributions to community indicators. Ecol. Indic. 2019, 99, 74–82. [Google Scholar] [CrossRef]
  44. R Core Team. R: A Language and Environment for Statistical Computing; R v4.3.2; R Foundation for Statistical Computing: Vienna, Austria, 2023; Available online: https://www.R-project.org/ (accessed on 1 March 2026).
  45. Bowler, D.E.; Böhning-Gaese, K. Improving the community temperature index as a climate change indicator. PLoS ONE 2017, 12, e0184275. [Google Scholar] [CrossRef]
  46. Masero, J.A.; Pérez-Hurtado, A.; Castro, M.; Arroyo, G.M. Complementary use of intertidal mudflats and adjacent salinas by foraging waders. Ardea 2000, 88, 177–191. [Google Scholar]
  47. Green, A.J.; Alcorlo, P.; Peeters, E.T.H.M.; Morris, E.P.; Espinar, J.L.; Bravo-Utrera, M.A.; Bustamante, J.; Dıaz-Delgado, R.; Koelmans, A.A.; Mateo, R.; et al. Creating a safe operating space for wetlands in a changing climate. Front. Ecol. Environ. 2017, 15, 99–107. [Google Scholar] [CrossRef]
  48. Guillemain, M.; Pöysä, H.; Fox, A.D.; Arzel, C.; Dessborn, L.; Ekroos, J.; Gunnarsson, G.; Holm, T.E.; Christensen, T.K.; Lehikoinen, A.; et al. Effects of climate change on European ducks: What do we know and what do we need to know? Wildl. Biol. 2013, 19, 404–419. [Google Scholar] [CrossRef] [PubMed]
  49. Dami, L.; Lago, M.; Baddour, K.; Vittecoq, M.N.; Galewski, T. Dénombrements Internationaux des Oiseaux d’eau—Synthèse Méditerranéenne Pour 13 Pays (2019–2023). 2025. Available online: https://tourduvalat.org/wp–content/uploads/2017/11/2025-ROEM-Rapport-General_FR.pdf (accessed on 1 March 2026).
  50. Rodríguez-Pérez, H.; Green, A.J. Waterbird impacts on Ruppia maritima in a Mediterranean wetland. Oikos 2006, 112, 525–534. [Google Scholar] [CrossRef]
  51. Dessborn, L.; Hessel, R.; Elmberg, J. Geese as vectors of nitrogen and phosphorus to freshwater systems. Inland Waters 2016, 6, 111–122. [Google Scholar] [CrossRef]
  52. Fujii, T. Climate change, sea-level rise and implications for coastal and estuarine shoreline management with particular reference to the ecology of intertidal benthic macrofauna in NW Europe. Biology 2012, 1, 597–616. [Google Scholar] [CrossRef]
  53. Verniest, F.; Galewski, T.; Boutron, O.; Dami, L.; Defos du Rau, P.; Guelmami, A.; Julliard, R.; Popoff, N.; Suet, M.; Willm, L.; et al. Exposure of wetlands important for nonbreeding waterbirds to sea-level rise in the Mediterranean. Conserv. Biol. 2024, 38, e14288. [Google Scholar] [CrossRef]
  54. Colwell, M.A. Shorebird Ecology, Conservation, and Management; University of California Press: Berkeley, CA, USA, 2010; p. 344. [Google Scholar]
  55. Scarton, F.; Montanari, M. Use of artificial intertidal sites by birds in a Mediterranean lagoon. J. Coast. Conserv. 2015, 19, 321–334. [Google Scholar] [CrossRef]
  56. Scarton, F. Breeding birds and vegetation monitoring in recreated salt marshes of the Venice Lagoon. In Flooding and Environmental Challenges for Venice and its Lagoon; Fletcher, C.A., Spencer, T., Eds.; Cambridge University Press: Cambridge, UK, 2005; pp. 573–579. [Google Scholar]
  57. Scarton, F. Long-term trend of the waterbird community breeding in a heavily modified lagoon. J. Coast. Conserv. 2017, 21, 35–45. [Google Scholar] [CrossRef]
Figure 1. IWC macrozones used in this paper: (1) red, fish farms; (2) dashed black, open lagoon; (3) brown, littoral strip including marine waters < 1 km from the coastline. Minor wetlands are not reported for reasons of clarity.
Diversity 18 00276 g001
Figure 2. Examples of the four macrozones (from above, clockwise): (a) fish farm; (b) exposed tidal flat in the open lagoon; (c) minor freshwater wetland; (d) beach on the littoral strip.
Diversity 18 00276 g002
Figure 3. Results of IWC counts by systematic group (no data in 2021).
Diversity 18 00276 g003
Figure 4. Trends for the six species accounting for at least 4% of the total.
Diversity 18 00276 g004
Figure 5. Results of IWC counts by eco-functional group (no data in 2021).
Diversity 18 00276 g005
Figure 6. CTI trends for all waterbirds (blue line) and after removing Eurasian Teal (orange line): no data for 2021. Regression lines are dotted.
Diversity 18 00276 g006
Table 1. Species accounting for at least 1% of the total no. of birds counted in 1993–2022 and 2013–2022.
1993–2022
(N = 7,796,629)
% of All Wintering Waterbirds2013–2022
(N = 4,105,085)
% of All Wintering
Waterbirds
Eurasian Teal31.5Eurasian Teal40.9
Mallard14.9Mallard13.0
Eurasian Coot10.5Dunlin8.7
Dunlin10.5Eurasian Coot6.0
Black-headed Gull6.1Common Shelduck5.4
Eurasian Wigeon4.0Black-headed Gull4.2
Common Shelduck3.5Northern Pintail3.6
Northern Pintail3.5Eurasian Wigeon3.6
Yellow-legged Gull3.4Greater Flamingo2.0
Greater Flamingo1.1Greater White-fronted Goose1.6
Great Cormorant1.1Yellow-legged Gull1.5
Mediterranean Gull1Common Pochard1.3
Common Pochard1Greylag Goose1.2
Great Cormorant1
Total92.1 94.7
Table 2. Trends of systematic groups, 1993–2022.
Systematics GroupAnnual Change (% yr−1)TRIM Judgement
Coots and rails−0.38Stable
Cormorants5.1Moderate increase
Ducks, geese and swans11.1Strong increase
Gulls and terns1.6Stable
Loons and grebes−1.7Stable
Other55.6Strong increase
Waders3.7Moderate increase
Wading birds−0.2Stable
Table 3. Trends of eco-functional groups, 1993–2022.
Eco-Functional GroupAnnual Change (% yr−1)TRIM Judgement
Aerial piscivores 6.14Moderate increase
Benthic feeders 3.74Moderate increase
Diving feeders 8.47Moderate increase
Diving piscivores1.8Stable
Grazing feeders16.4Strong increase
Omnivores0.44Stable
Shoreline invertivores 4.15Uncertain
Surface dabblers/filter-feeders 11.1Strong increase
Wading benthic feeders 19.9Strong increase
Wading piscivores−0.38Stable
Disclaimer/Publisher’s Note: The statements, opinions and data contained in all publications are solely those of the individual author(s) and contributor(s) and not of MDPI and/or the editor(s). MDPI and/or the editor(s) disclaim responsibility for any injury to people or property resulting from any ideas, methods, instructions or products referred to in the content.