Article

Soil-Driven Adaptive Strategies: Functional Trait Variation in Dominant Plants of a Karst Plateau Lake Shoreline Wetlands


1
Guizhou Key Laboratory of Plateau Wetland Conservation and Restoration, Guizhou University of Engineering Science, Bijie 551700, China
2
Key Laboratory of Digital Earth Science, Aerospace Information Research Institute, Chinese Academy of Sciences, Beijing 100094, China
*
Author to whom correspondence should be addressed.
Diversity 2026, 18(5), 260; https://doi.org/10.3390/d18050260
Submission received: 27 March 2026 / Revised: 23 April 2026 / Accepted: 24 April 2026 / Published: 27 April 2026

Abstract

Wetland ecosystems have been a central focus of ecological research for an quite some time. Nevertheless, the degradation of wetland riparian zones has markedly accelerated due to anthropogenic activities, climate change, and habitat heterogeneity. The objective of this paper is to investigate the differences in functional traits of riparian plants under changing wetland environments on a karst plateau, as well as to elucidate the adaptive strategies of wetland plants across different habitats. This study examines the Caohai Wetland located on the Guizhou karst plateau, selecting the leaves of four dominant plant species (Phragmites australis, Onopordum acanthium, Galium odoratum, Paspalum distichum) in the Caohai Wetland lakeshore zone and analyzes the influence of soil factors on the variation of plant functional traits within the wetland riparian zone. The results reveal that: (1) significant differences exist in the functional traits of dominant plants in the riparian zones of karst plateau wetlands, with complex interrelationships among these traits; (2) the coefficients of variation for magnesium (Mg) and calcium (Ca) in the soil are notably high (79.53% and 67.21%, respectively), whereas soil oxidation-reduction potential (ORP) exhibits the lowest coefficient of variation (4.36%)—furthermore, the convergent variation in specific leaf area (SLA) and leaf dry matter content (LDMC) directly reflects the strong environmental filtering imposed by this habitat—and (3) redundancy analysis (RDA) indicates that leaf length (LL), specific leaf area (SLA), leaf area (LA), and plant carbon content (PCC) are particularly sensitive to environmental changes, while soil calcium (Ca), total nitrogen (TN), water-dispersible clay (WDR), soil organic matter (SOM), soil moisture content (SPMC), and total potassium (TK) constitute the principal soil factors influencing plant adaptive strategies in karst plateau wetlands. In conclusion, this study demonstrates that adaptation to karst wetland habitats is mediated through trade-offs in the allocation of photosynthetic products and the regulation of carbon (C), nitrogen (N), and phosphorus (P) nutrient balances under calcium-enriched and phosphorus-limited conditions, thereby reflecting the response characteristics of functional traits in karst plateau wetland plants to environmental changes.

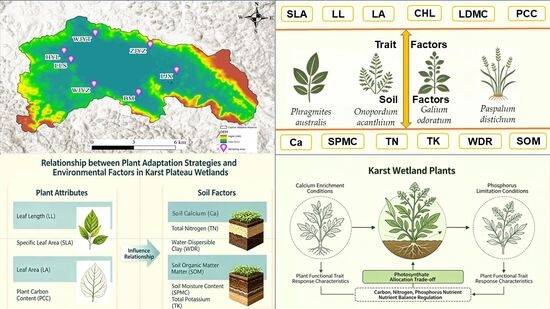
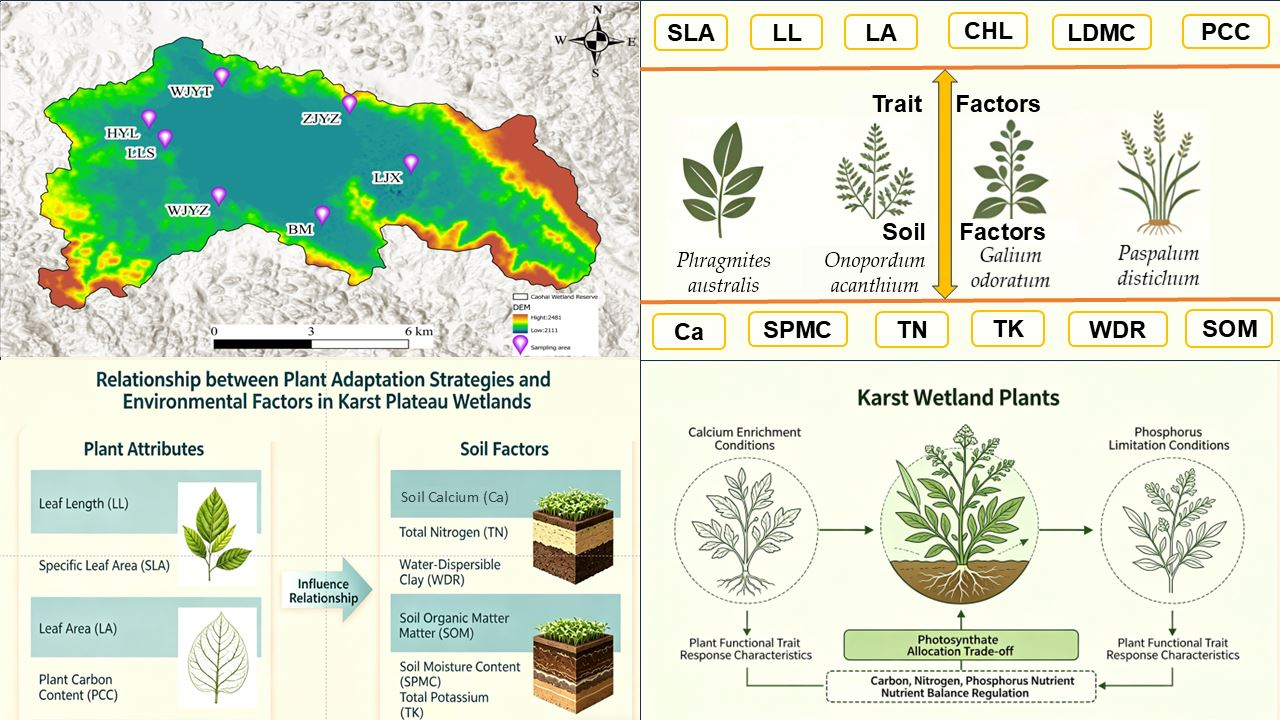
Graphical Abstract

1. Introduction

Plant functional traits encompass a range of morphological, biochemical, physiological, structural, and phenological characteristics that influence plant performance and adaptability [1]. These traits also reveal nutrient trade-offs and survival or adaptation strategies [2]. By linking species, community structure, and ecosystem architecture to ecological processes and functions across various scales, functional traits elucidate species’ adaptation to environments, community assembly mechanisms, and ecosystem functions [3]. Consequently, investigating plant functional traits and their relationships with environmental factors has been a central focus and research hotspot in plant functional and physiological ecology over the past three decades [4,5]. Plant traits are crucial for predicting growth, survival, and reproduction. Recent studies indicate that research on plant functional traits and their relationships with environmental factors has primarily concentrated on terrestrial forests and grasslands [6], arid deserts [7], and high-altitude cold wetland ecosystems on plateaus [8], with relatively fewer investigations in karst plateau wetland ecosystems. Among studies examining plant responses and adaptation strategies to environmental conditions, it is widely recognized that employing plant functional traits provides a means to address the complex networks of ‘plant–plant’ and ‘plant–environment’ interactions, rather than relying solely on taxonomic characteristics [9]. Research on plant functional traits enhances understanding of plant survival strategies and performance across diverse environments [10]. Due to plants’ adaptability and plasticity along soil factors, functional traits exhibit considerable variation across species. Organisms can mitigate environmental stress and improve access to scarce resources by adjusting morphological and physiological characteristics, thereby enhancing their environmental adaptability and increasing fitness [11,12].
Plants play a crucial role in adapting to environmental heterogeneity and exhibit high sensitivity to environmental changes. Their intrinsic physicochemical properties and extrinsic morphological characteristics are closely linked to the functional performance of ecosystems [13]. Moreover, leaf traits reflect plant strategies related to photosynthesis, nutrient allocation, water use, and growth patterns [14], thereby significantly influencing wetland ecosystem net primary productivity, biomass, and carbon input [15]. For instance, specific leaf area and leaf dry matter content indicate a plant’s capacity to capture and utilize light energy during growth [16]. Plants with larger specific leaf areas predominantly inhabit humid environments and enhance foliar gas exchange to cope with flood submersion [17]. Leaf carbon and nitrogen content indicate photosynthetic capacity and correlate with leaf longevity and decomposition rates [18]. Plant functional traits are readily measurable and highly plastic. By studying these traits across diverse regions and scales, we can not only characterize interspecific differences but also elucidate and infer plant adaptation strategies, ecological niche differentiation, and community assembly mechanisms. This provides a theoretical foundation for the sustainable use and conservation of biodiversity resources [19].
Lake littoral zones are transitional areas where aquatic and terrestrial ecosystems intersect, serving as critical interfaces between lake aquatic ecosystems and terrestrial environments [20]. The wetland habitats within these littoral zones are fundamentally linked to human survival, reproduction, and development [21,22], representing some of the most fragile wetland systems on Earth. In recent years, influenced by human activities and climate change [23], the lake area of Caohai on the karst plateau has significantly diminished. Following the lake’s retreat, salinization of the riparian zone has intensified, substantially accelerating its degradation. This has altered the spatial heterogeneity of the riparian zone and further transformed plant communities [24,25]. Employing plant functional trait approaches allows for the quantification of plant characteristics and the prediction of plant responses to environmental disturbances. This methodology facilitates understanding the adaptive mechanisms exhibited by wetland plants in degraded riparian zones in response to environmental changes [26], with important implications for the restoration and reconstruction of vegetation in lake-riparian wetland ecosystems. Therefore, this study focuses on the karst plateau Caohai Wetland as the research area, analyzing the functional trait characteristics of dominant wetland riparian plants and their relationships with soil factors. The objectives are to explore: (1) What are the patterns of variation in the functional traits of leaves among dominant plant species in the lakeshore zone of the Caohai Wetland on the karst plateau? (2) Which soil factors within karst habitats serve as the primary drivers regulating the functional leaf traits of dominant species in the lakeshore zone? (3) To what extent do soil physicochemical properties and nutrient factors account for these variations in leaf traits? Based on the findings, this study provides a theoretical foundation for investigating the mechanisms underlying ecosystem stability and biodiversity maintenance in karst plateau wetland riparian zones.

2. Materials and Methods

2.1. Study Area

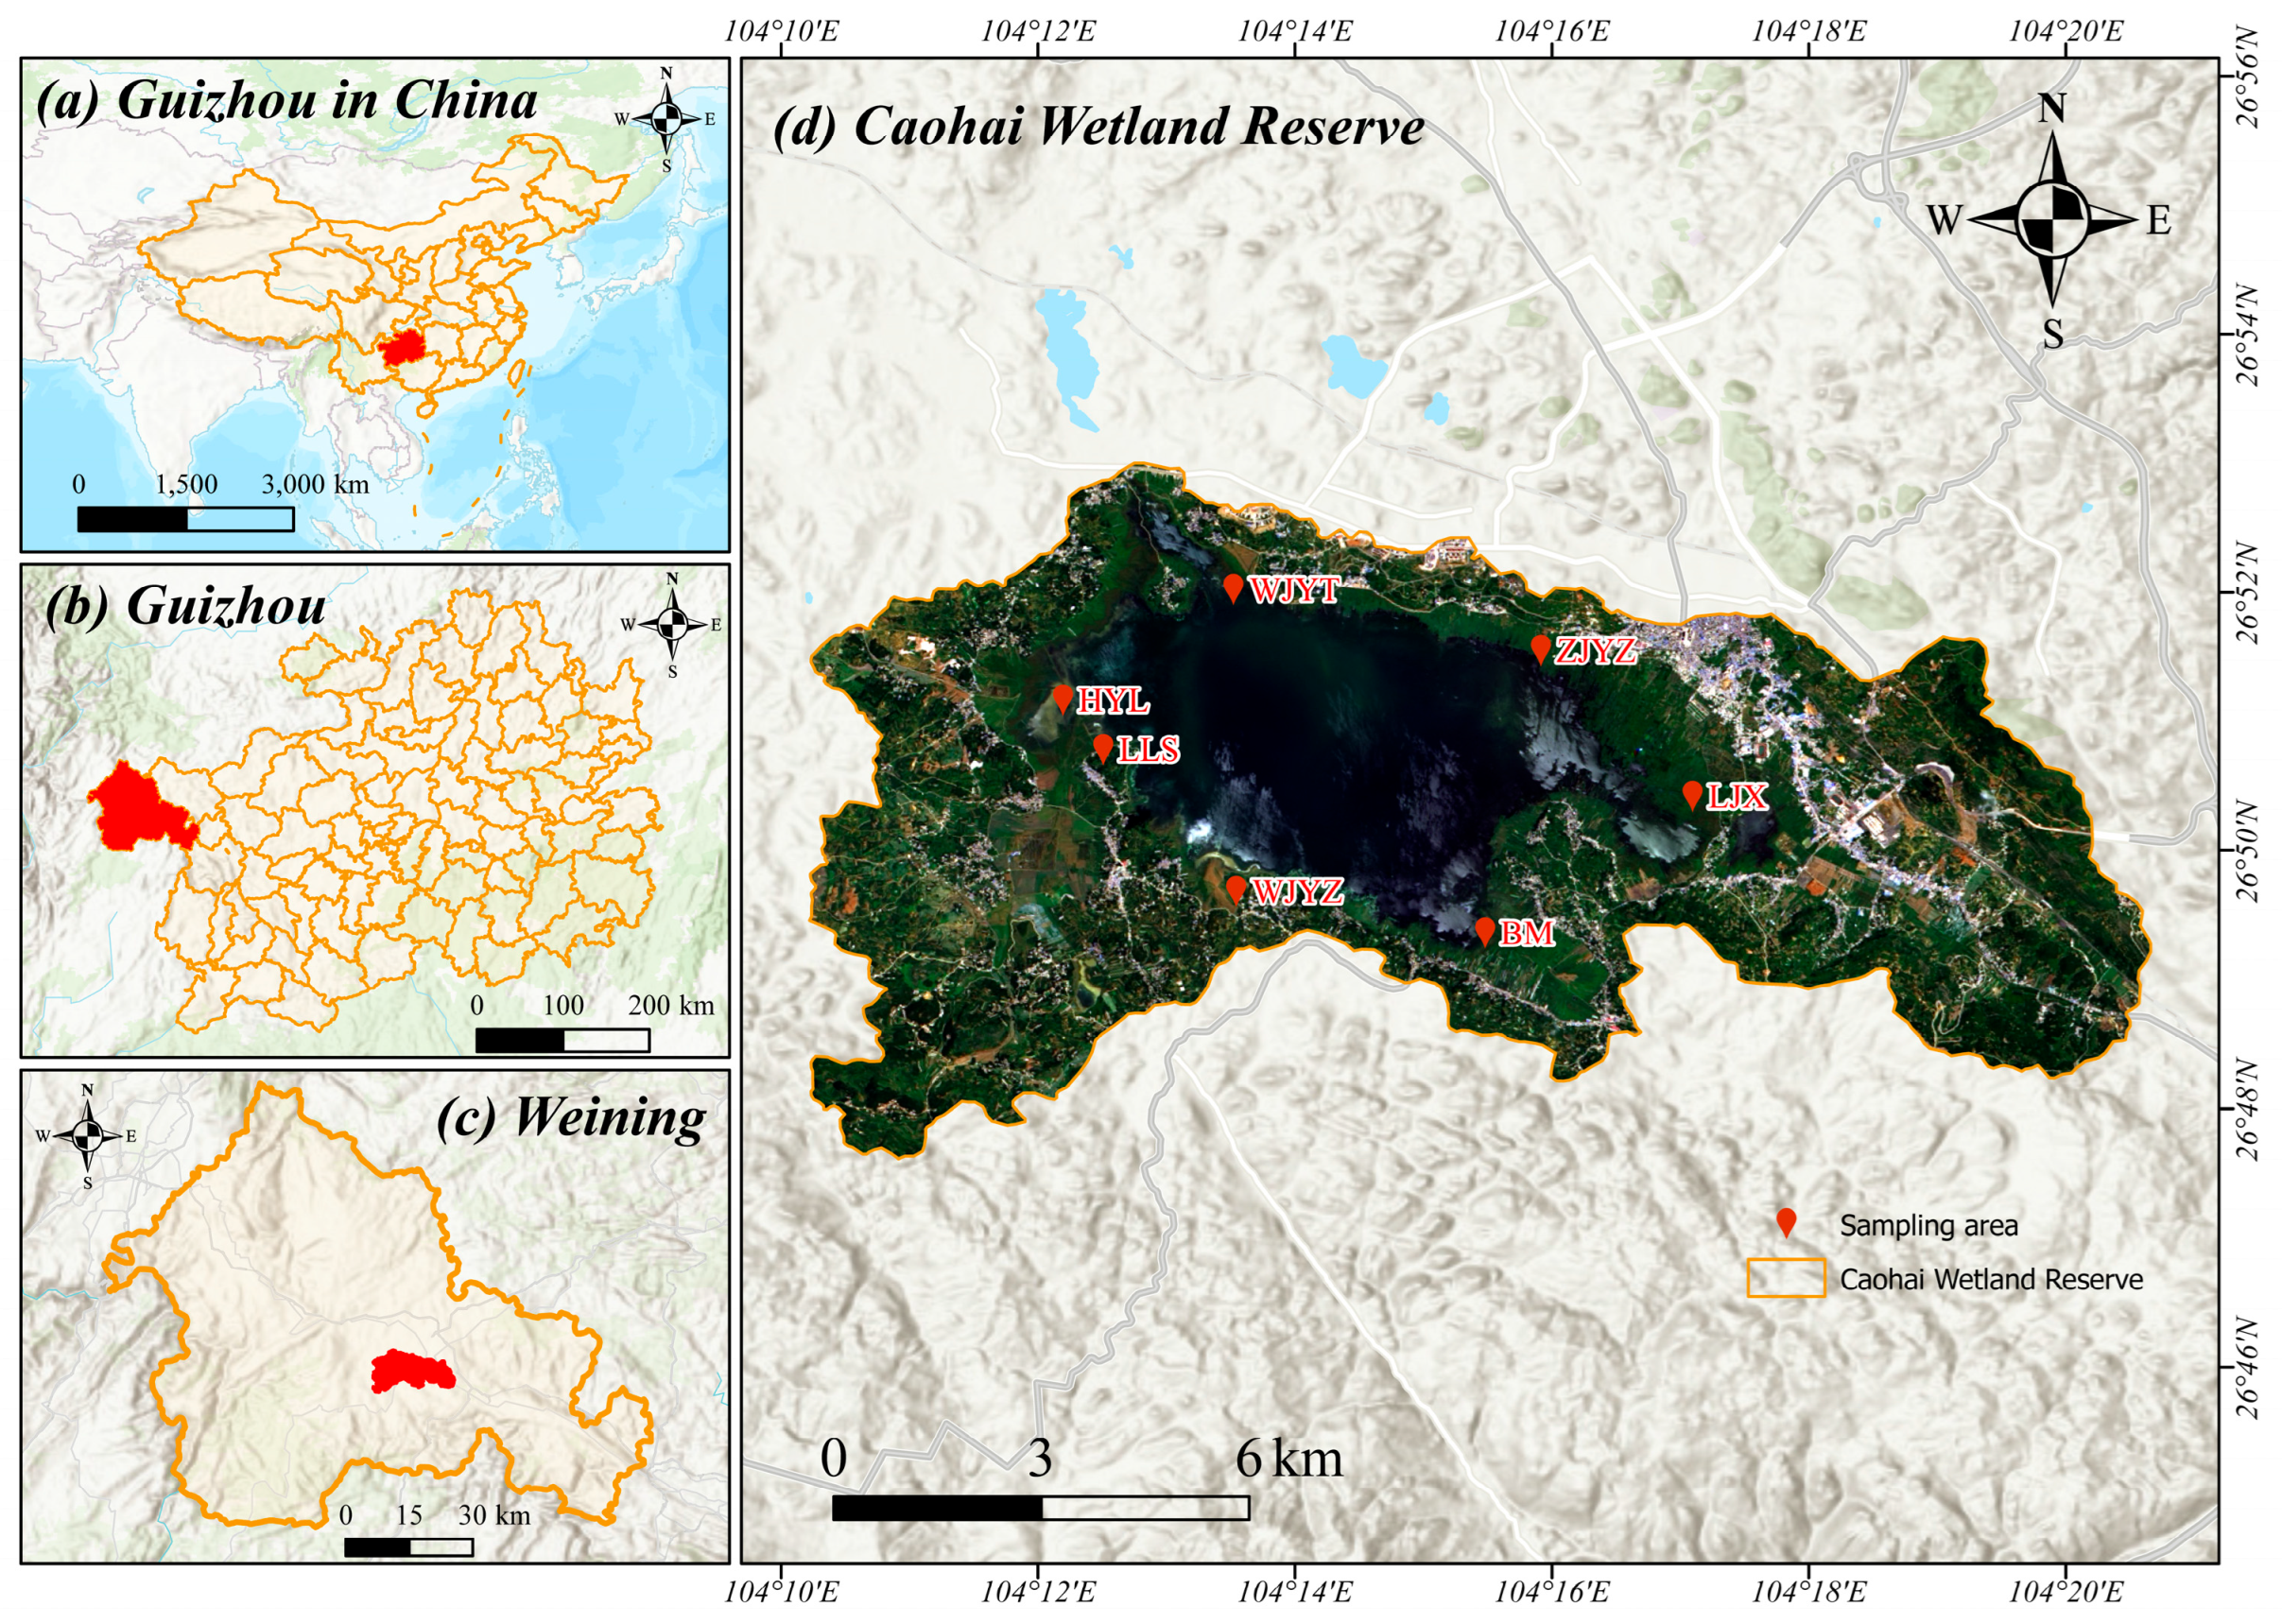
Caohai, the largest natural freshwater lake on the Guizhou Plateau, is situated within the Caohai National Nature Reserve in Weining Yi, Hui, and Miao Autonomous County, northwestern Guizhou Province, China (26°47′32″–26°52′52″ N, 104°10′16″–104°20′40″ E; Figure 1). The reserve lies in the core of the Wumeng Mountains at the apex of the central Yungui Plateau, covering 9600 hectares. The region experiences a subtropical plateau monsoon climate characterized by distinct wet summers and dry winters, with mild annual temperatures (mean: 10.5 °C) and high solar radiation (mean: 1805.4 sunshine hours annually). Annual precipitation averages 950.9 mm, and relative humidity is 80% [27].
Soils are predominantly acidic yellow-brown earths (pH 5.0–6.0). In the hydrologically dynamic lakeshore zone, water-saturated and intermittently flooded conditions have supported the formation of peat bog soils, which are critical for maintaining wetland ecosystem functions and provide essential habitat for migratory waterbirds. Hydrologically, Caohai is part of the upper Yangtze River system, functioning as the headwater lake of the Luoze River, a tributary of the Jinsha River. The lake is primarily fed by atmospheric precipitation, with supplementary groundwater input.

2.2. Plant Sampling and Functional Trait Analysis

Between June and September 2025, a vegetation survey using sampling plots was conducted in the Caohai lakeside wetland ecosystem. Sampling points were arranged in a circular pattern along the lakeside hydrological gradient (Figure 1). At each sampling point, a 10 m × 10 m plot was established, within which three 1 m × 1 m subplots were arranged diagonally for detailed community surveys. This study established a total of seven independent plots and 21 subplots. The detailed geographical coordinates, dimensions, and basic information for all sampling units are clearly compiled in Table 1, while the spatial distribution of the sampling points is shown in Figure 1.
A total of 83 plant species, belonging to 55 genera across 26 families, were recorded during this field survey. We supplemented the data with the specific number of subplots in which each species occurred and fully quantified the occurrence frequency, plot distribution characteristics, and basic information for all species. This approach clarifies the survey scope for each species rather than merely presenting average community cover. Based on the plant community survey results, we determined the relative density, relative frequency, and relative cover of each species within the plots. Relative density refers to the percentage of the total number of individuals of a given species relative to the total number of individuals of all species within the plot. Relative frequency refers to the percentage of plots in which a given species occurs relative to the total number of plots surveyed. Relative cover refers to the percentage of the total vegetation cover within the plot accounted for by the projected cover of a given species. We calculated the importance value for each species using the indicators described above, applying the following formula: importance value = (relative density + relative frequency + relative cover)/3. We then selected the top three species with the highest importance values (dominant species) for sampling.
Species cover was recorded for each plot. Based on cover and dominance, four key species were selected for functional trait analysis: Phragmites australis, Onopordum acanthium, Galium odoratum, and Paspalum distichum (Table 2). Functional traits of the dominant species from each plot were measured following the methodology of Fang et al. [28]. It is important to note that this study does not focus on the absolute differences in trait magnitudes among the four dominant species. Instead, it analyzes the relative changes in each species’ traits under varying soil conditions, as well as their phenotypic plasticity and functional trade-offs, to reveal their adaptive strategies across different habitats.
For each dominant species within a plot, healthy, fully expanded sun leaves were sampled from intact, vigorous individuals. A standardized “S”-shaped multi-point sampling approach was employed to collect a composite sample per species per plot [23]. For each species, 20 plant leaves were collected and placed in an envelope for trait measurement. Separately, approximately 1 kg of plant leaves was collected and placed into larger envelopes for plant nutrient analysis. The envelopes were stored in a cooler containing ice (below 5 °C) and promptly transported to the laboratory for processing. Twelve functional traits were selected and measured according to established plant functional trait assessment protocols [29]. For this study, we carefully selected fully expanded, healthy, pest- and disease-free apical leaves from dominant plants for analysis. Leaves from this region exhibit the highest physiological activity and the greatest accumulation of nutrients and photosynthetic products, thereby providing an accurate reflection of the plants’ growth status and functional traits within the study area. This approach minimizes phenotypic heterogeneity caused by the varying developmental stages of the tender leaves at the base of the stem and the mature leaves in the middle section. Detailed descriptions of the physical trait measurements are provided in Table 3.

2.3. Soil Sample Collection and Soil, Plant Analysis

Soil sampling was conducted in plots representing the dominant vegetation types across the study area. Within each plot, five sampling points were systematically selected using the diagonal method. Surface soils were collected from the 0–20 cm layer; however, owing to the shallow soil profiles typical of karst landscapes, the actual sampling depth was adjusted to the maximum available soil depth, which was recorded and used in subsequent analyses. Equal volumes of soil from the five points were homogenized to produce one composite sample per plot for chemical analyses (e.g., C, N, and P). In parallel, undisturbed soil cores were collected using a ring knife to determine soil moisture content and bulk density. All soil samples were transported to the laboratory, where visible roots, stones, and debris were removed. Samples were air-dried at room temperature, gently ground, sieved (2 mm), labeled, and stored prior to analysis. Ring-knife samples were oven-dried at 100 °C to constant weight for bulk density determination.
Soil organic carbon (SOC) and plant organic carbon were quantified using the potassium dichromate oxidation method with external heating [30]. Saturated hydraulic conductivity (SHC) uses the indoor ring-ring method/field double-ring infiltration method [31]. Redox potential (ORP) uses the potentiometric method (platinum electrode + reference electrode, in-situ measurement of Eh) [32]. Available potassium (PC) comes from extraction with 1 mol/L ammonium acetate and flame photometry/ICP-OES [33]. Drainage rate (WDR) uses the constant head method, measuring drainage volume per unit of time [34]. Chloride content (CHC) comes from extraction with a soil-to-water ratio of 5:1 and ion chromatography/silver nitrate titration [35]. Calcium (Ca) and magnesium (Mg) come from ammonium acetate exchange and atomic absorption/EDTA titration [36].
Plant samples were digested using the H2SO4–H2O2 method, after which total nitrogen (TN) was determined by the indophenol blue colorimetric method and total phosphorus (TP) by the molybdenum–antimony colorimetric method (NY/T 2017-2011) [37]. Soil TN was measured using the Kjeldahl digestion method (LY/T 1228-2015) [37], while soil TP was analyzed using NaOH fusion followed by molybdenum–antimony colorimetry (LY/T 1232-2015) [38]. Potassium (K) concentrations in both soil and plant samples were determined using flame photometry [38].
This study considered the entire community within the study area as the research subject, treating the four dominant plant species and the soil environment as an integrated system. It focused on analyzing the overall differentiation characteristics of the four dominant species and the general variation in soil factors. Due to the limited number of available sample plots, the study was unable to analyze individual sample points independently. Instead, it employed an averaging method for soil data to minimize errors as much as possible, representing an inherent methodological limitation of this research.

2.4. Data Analysis

In this study, the Shapiro–Wilk test was employed to assess the normality of two data types—functional traits of dominant species and soil factors—prior to statistical analysis. The results indicated that most variables followed a normal distribution, while a few exhibited skewed distributions. Variables that did not conform to normality were log-transformed to meet the assumptions required for parametric tests. After log-transformation, all variables met the assumption of normality (Shapiro–Wilk test, p > 0.05). Based on the data distribution characteristics, parametric statistical methods, including Pearson correlation and analysis of variance, were consistently applied to ensure the accuracy and reliability of the results.
Initial data compilation and quality control were conducted in Microsoft Excel 2019. Prior to statistical analyses, all variables were tested for normality and homogeneity of variance. Parametric statistical analyses were performed using SPSS v25.0 (IBM Corp., Armonk, NY, USA). Differences in plant functional traits among dominant species and across soil factors were evaluated using one-way analysis of variance (ANOVA), followed by Tukey’s honestly significant difference (HSD) test for post hoc comparisons. Relationships between plant functional traits and soil properties were examined using Pearson correlation analysis. All results are reported as mean ± standard deviation.
To further elucidate multivariate relationships between dominant plant functional traits and soil factors, redundancy analysis (RDA) was performed using the vegan package in R [39]. In addition, network analysis was applied to characterize the strength and structure of trait–soil interactions, providing an integrated view of ecosystem linkages.
The R packages “ggsci,” “patchwork,” “ggplot2,” “ggpubr,” “ggsignif,” and “reshape2” (version 4.3.2) were employed for box plot visualization. Correlation analysis was performed using the “corrplot” package. Redundancy analysis (RDA) was conducted with the “rdacca.hp” package, while network analysis utilized the “WGCNA” and “igraph” packages. Furthermore, regression analysis was facilitated by the “dplyr” and “tidyr” packages. All statistical analyses and graphical representations were carried out using R version 4.3.2 [40].

3. Results

3.1. Functional Traits of Dominant Plant Species in the Lakeshore Zone

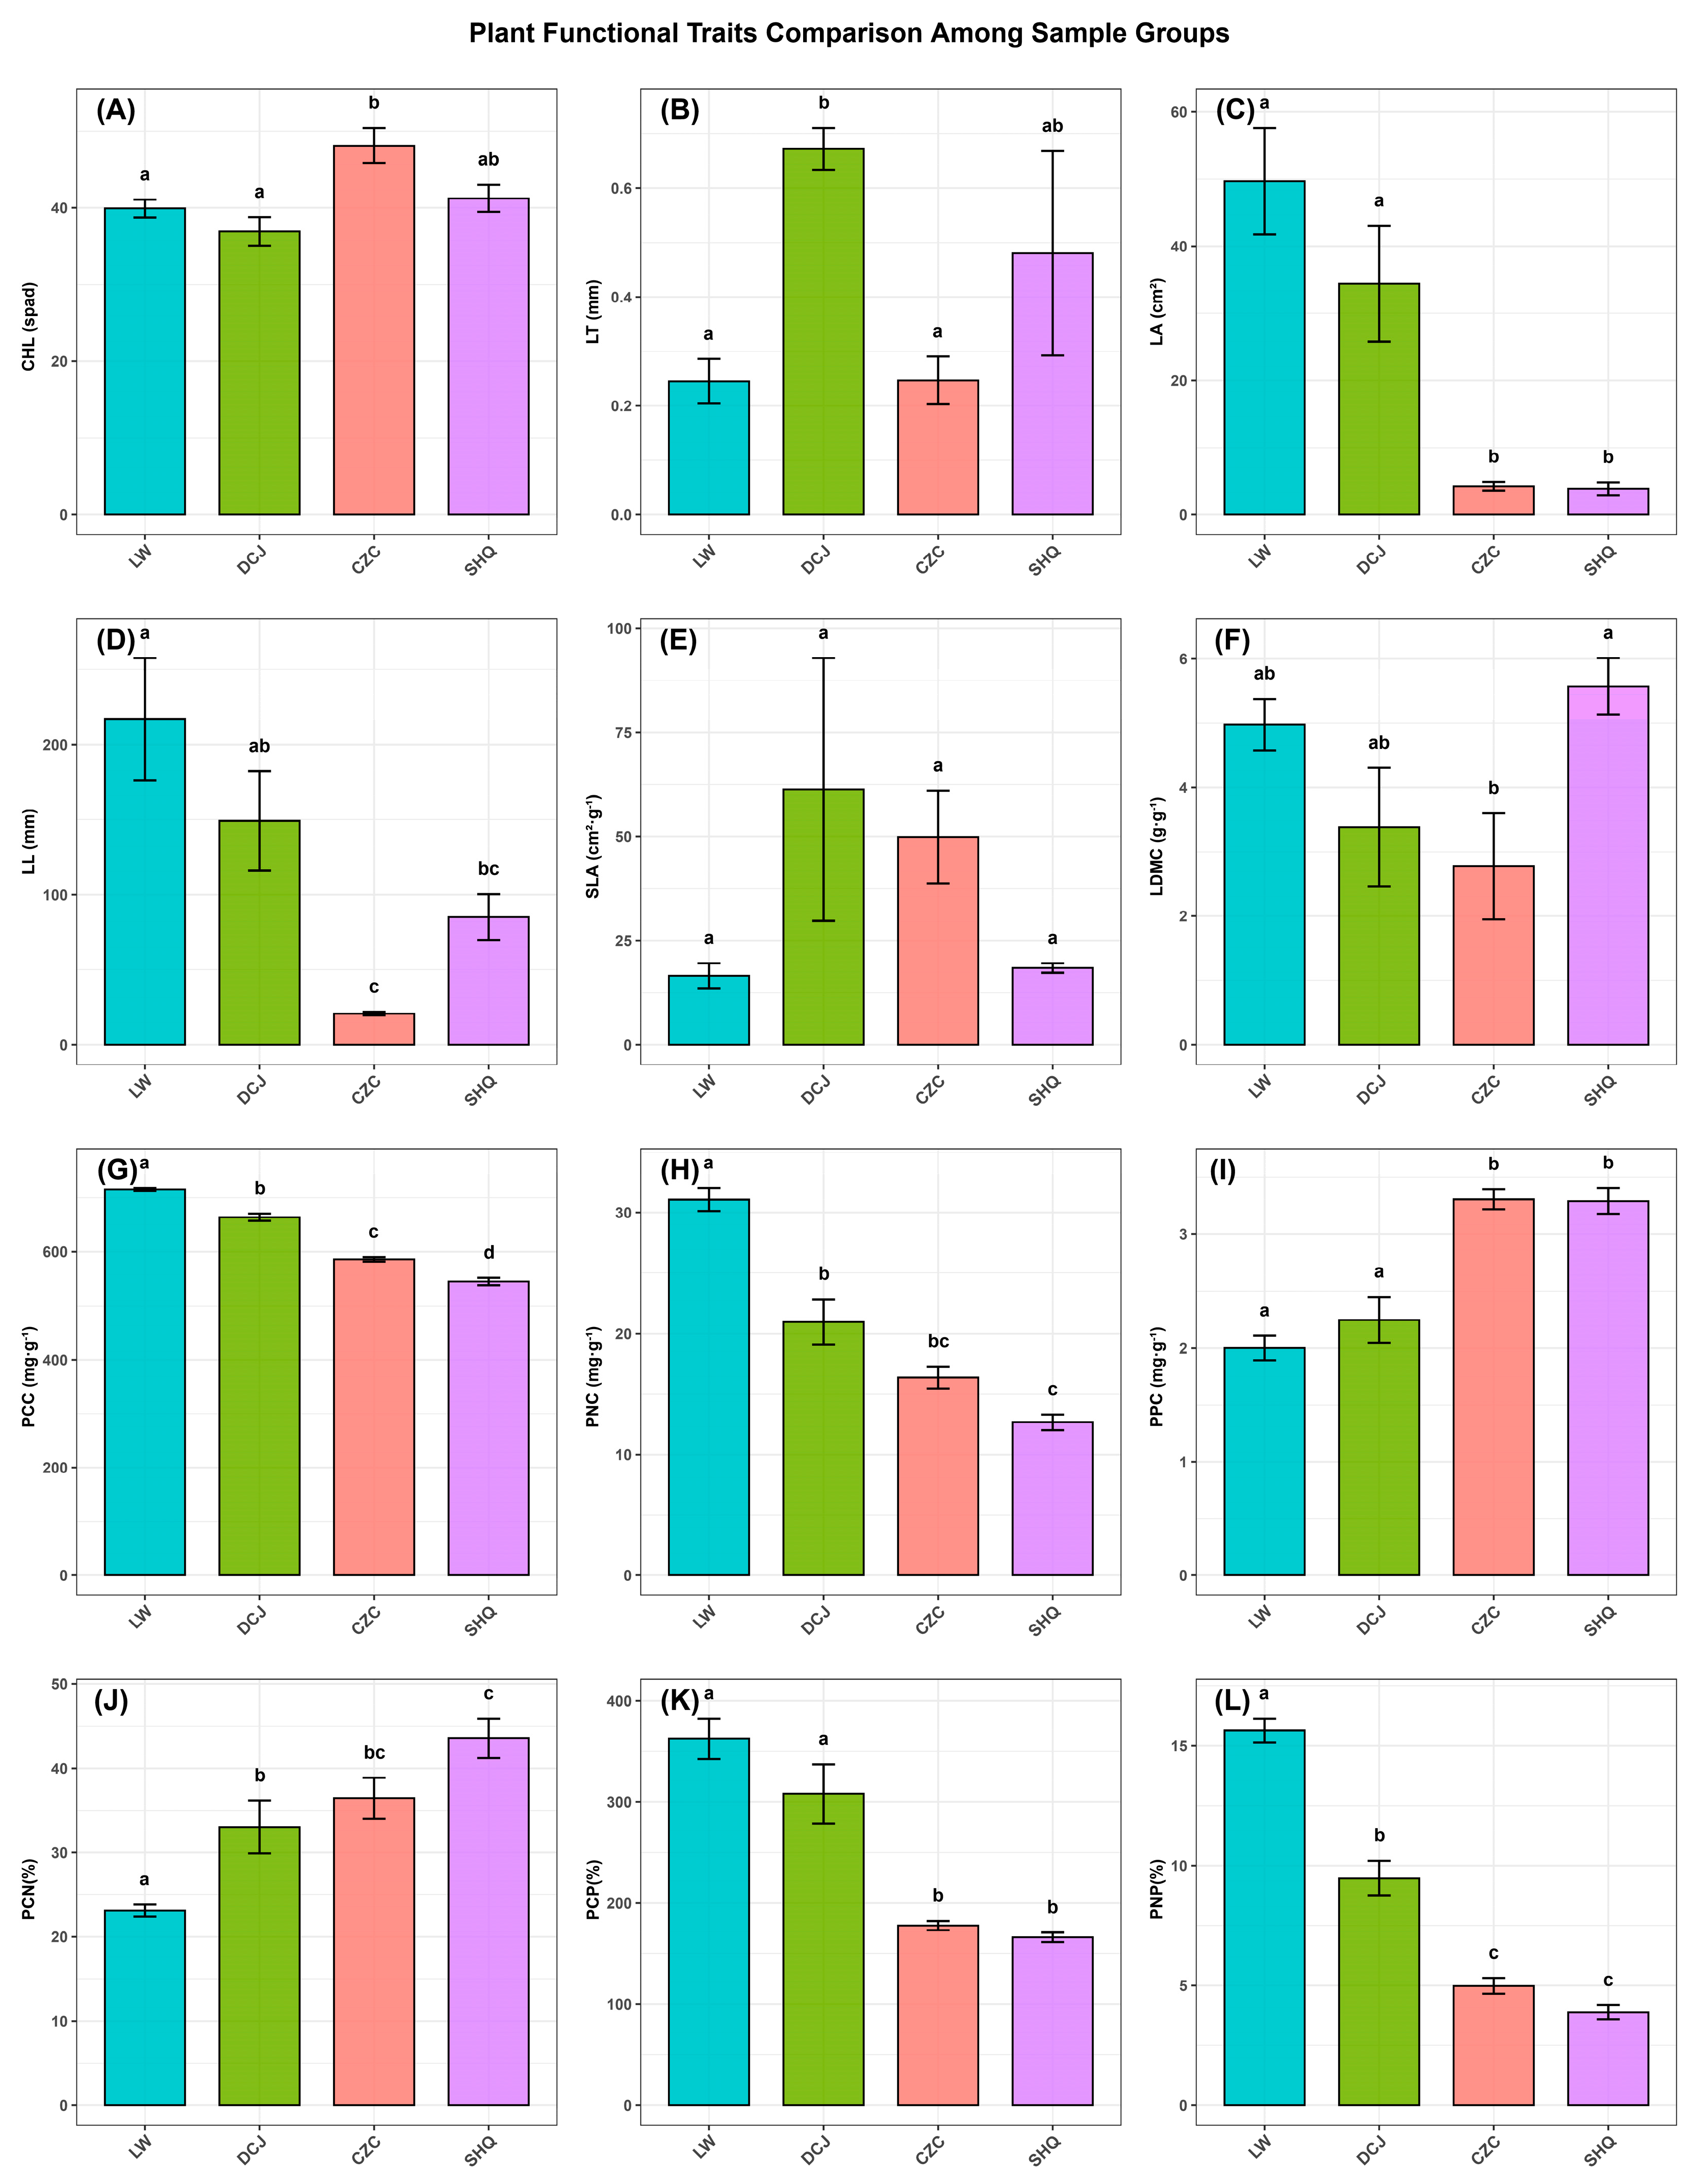
Figure 2 illustrates interspecific differences in functional traits among the four dominant plant species in the lakeshore zone of the Caohai Wetland. One-way ANOVA revealed significant trait differentiation across species (p < 0.05). Phragmites australis exhibited significantly higher leaf carbon content (PCC), leaf nitrogen content (PNC), and leaf N:P ratio (PNP) than the other species (p < 0.05), indicating a nutrient-acquisitive strategy. Both P. australis and Onopordum acanthium showed significantly greater leaf area (LA), leaf length (LL), and leaf carbon-to-phosphorus ratio (PCP) compared with Galium odoratum and Paspalum distichum (p < 0.05). Onopordum acanthium also displayed the greatest leaf thickness (LT) among species (p < 0.05), suggesting enhanced structural investment. In contrast, Galium odoratum and Paspalum distichum had significantly higher leaf phosphorus content (PPC) and lower carbon-to-phosphorus ratio (PCP) than the other species (p < 0.05), reflecting a resource-conservative strategy adapted to nutrient-rich microsites. These results demonstrate clear interspecific divergence in morphological and stoichiometric traits among dominant lakeshore plants.
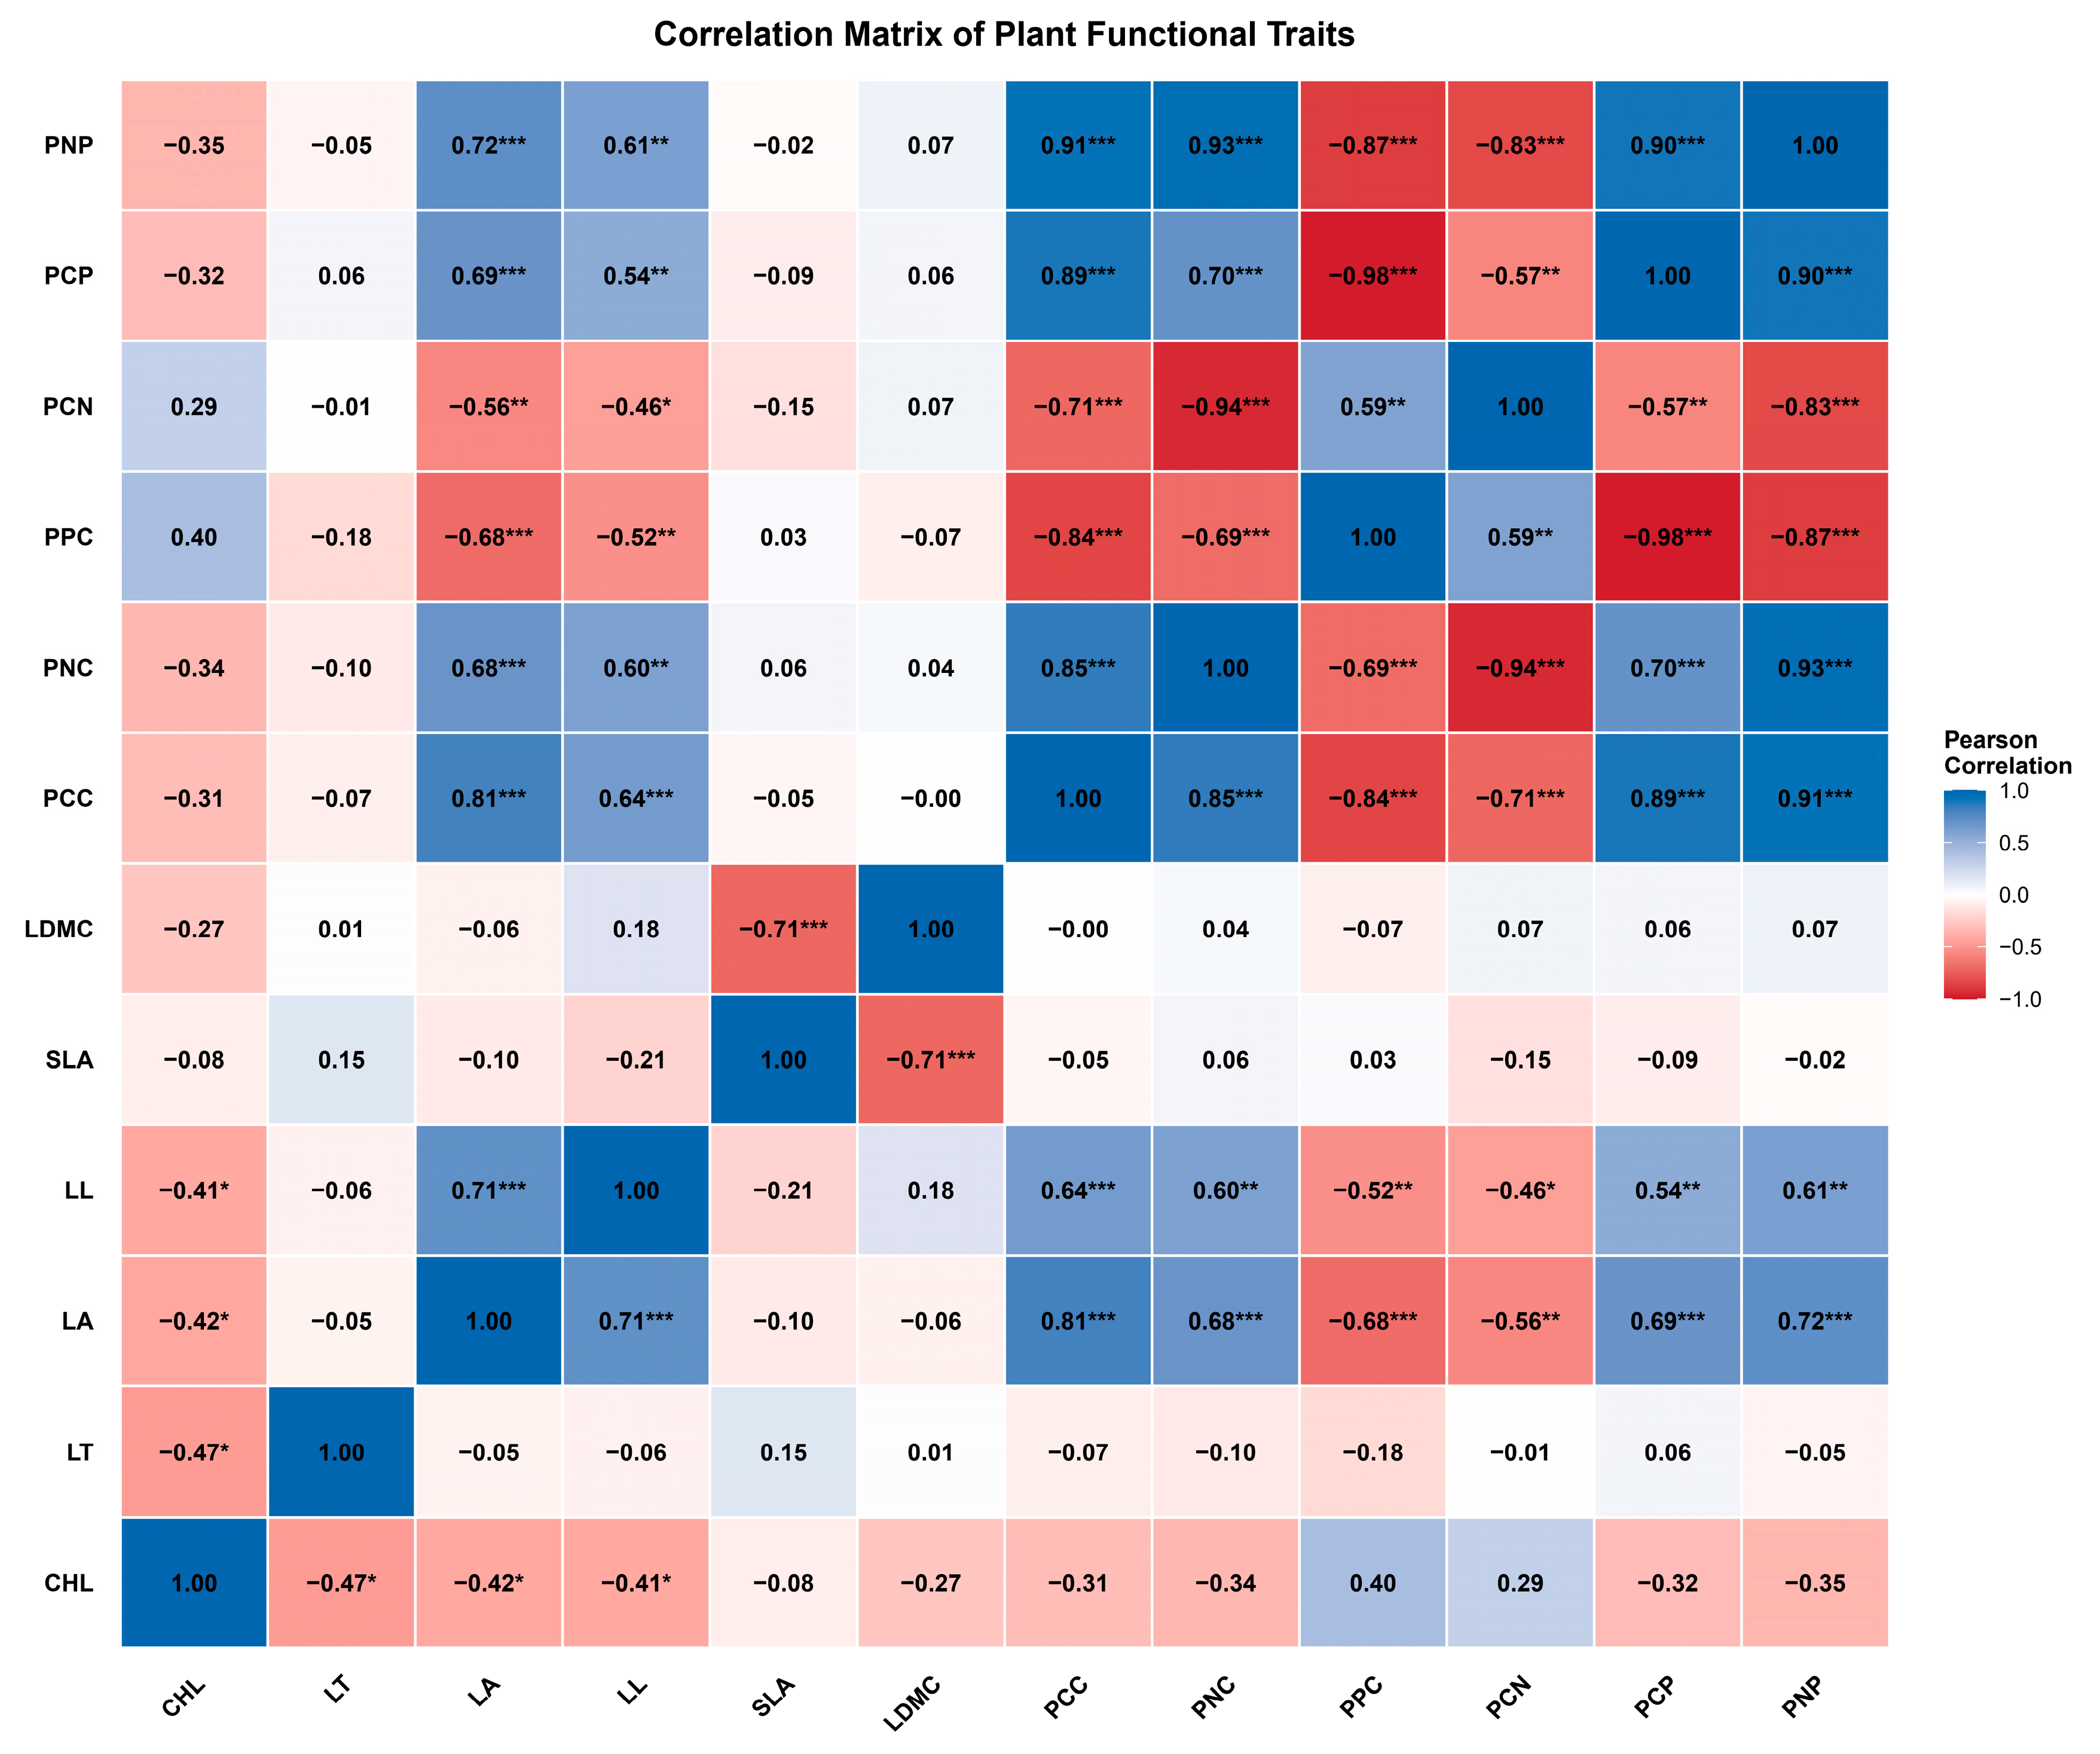
Pearson correlation analysis revealed strong coordination and trade-offs among plant functional traits (Figure 3). Specific leaf area (SLA) was significantly negatively correlated with leaf dry matter content (LDMC) (p < 0.001), consistent with the leaf economics spectrum. Chlorophyll content (CHL) showed significant negative correlations with leaf length (LL), leaf area (LA), and leaf thickness (LT) (p < 0.05), indicating structural–physiological trade-offs.
Leaf length (LL) and leaf area (LA) were positively correlated with stoichiometric ratios, including plant carbon-to-phosphorus ratio (PCP) and plant nitrogen-to-phosphorus ratio (PNP) (p < 0.01), while leaf phosphorus content (PPC) and plant carbon-to-nitrogen ratio (PCN) were negatively correlated with plant leaf carbon content (PCC), plant carbon-to-phosphorus ratio (PCP), and plant nitrogen-to-phosphorus ratio (PNP) (p < 0.01). These relationships highlight coordinated nutrient allocation strategies among dominant species in the karst wetland environment.

3.2. Spatial Variation of Soil Properties in the Lakeshore Zone

Soil properties across the seven sampling sites exhibited considerable spatial heterogeneity (Table 4). Key nutrients such as magnesium (Mg) and calcium (Ca) showed the greatest variability, with CV of 79.53% and 67.21%, respectively. In contrast, soil redox potential (ORP) was the most stable parameter (CV = 4.36%). Other factors demonstrating high spatial variability (CV > 50%) included saturated hydraulic conductivity (SHC) and chloride content (CHC). Conversely, bulk density (BD), pH, and water drainage rate (WDR) were relatively uniform across the sampled gradient (CV < 10%).
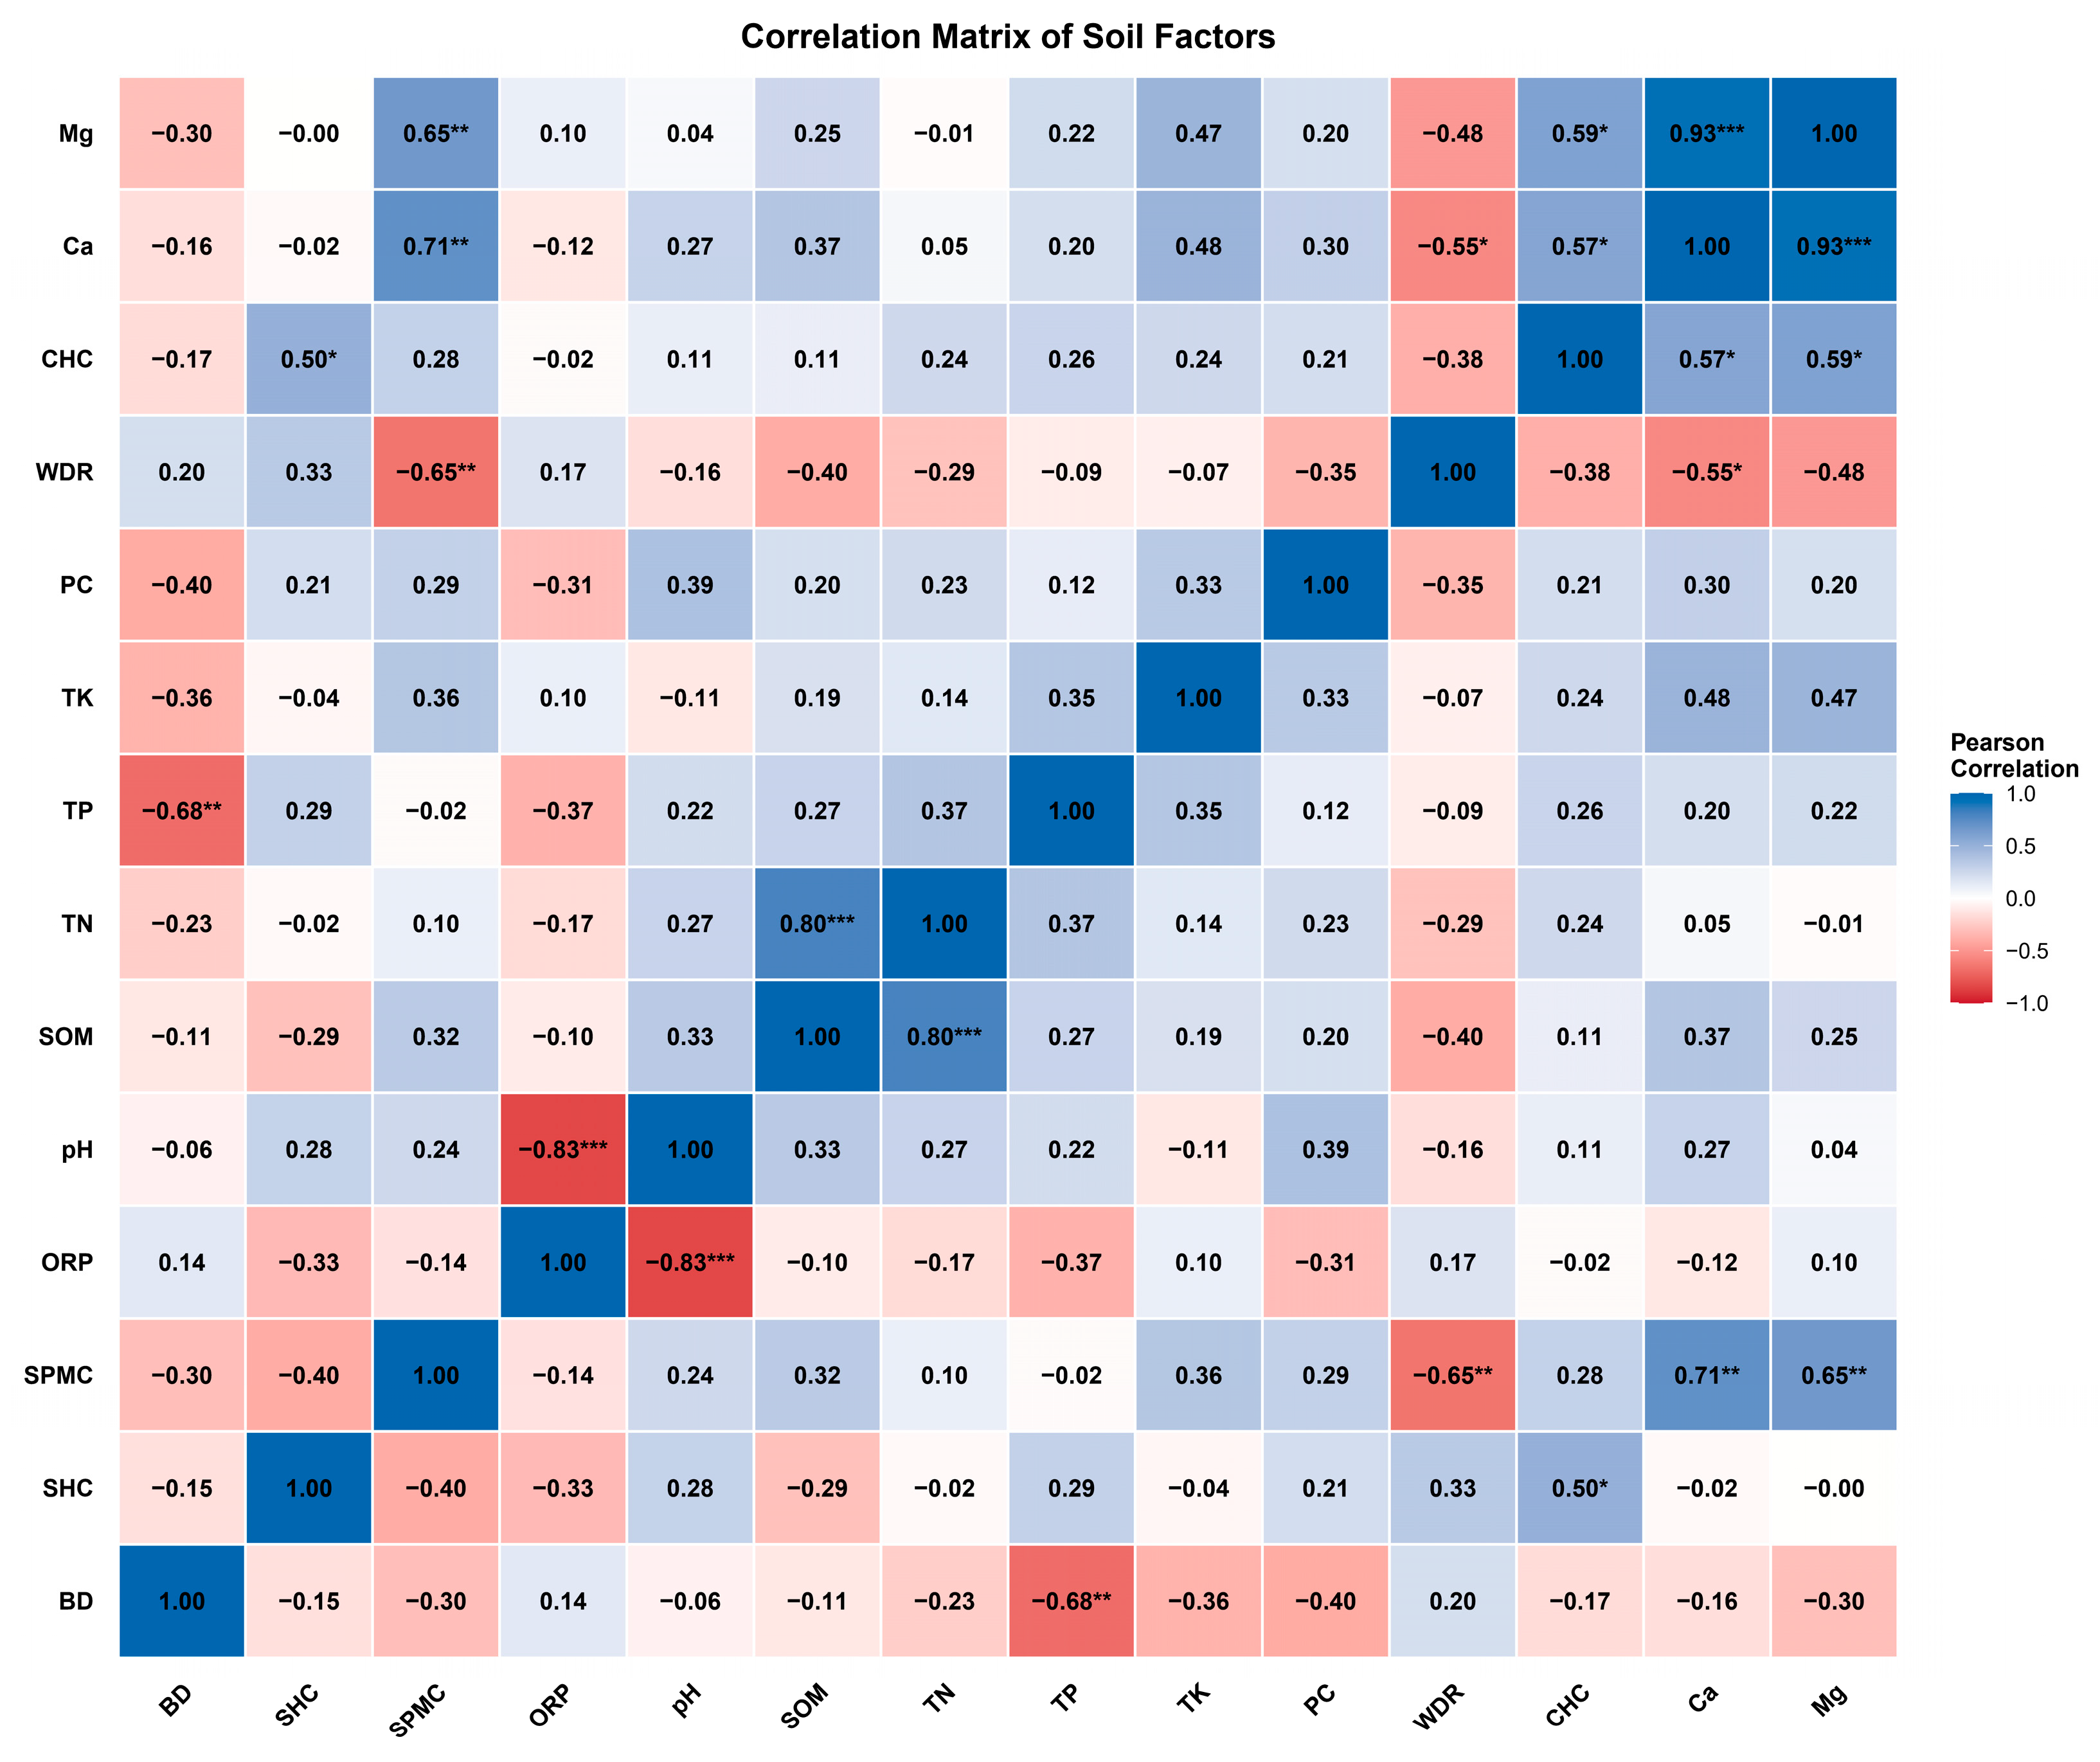
Pearson correlation analysis revealed significant interdependencies among soil factors (Figure 4). Strong positive correlations were identified between soil organic matter and total nitrogen (p < 0.001), and between chloride content and saturated hydraulic conductivity (p < 0.01). Magnesium was positively correlated with soil water content, calcium, and chloride content (p < 0.05). Significant negative correlations were observed between bulk density and total phosphorus (p < 0.01) and between redox potential and pH (p < 0.001). The water drainage rate was negatively correlated with both soil water content and calcium (p < 0.05).

3.3. The Relationship Between Plant Functional Traits and Soil Factors

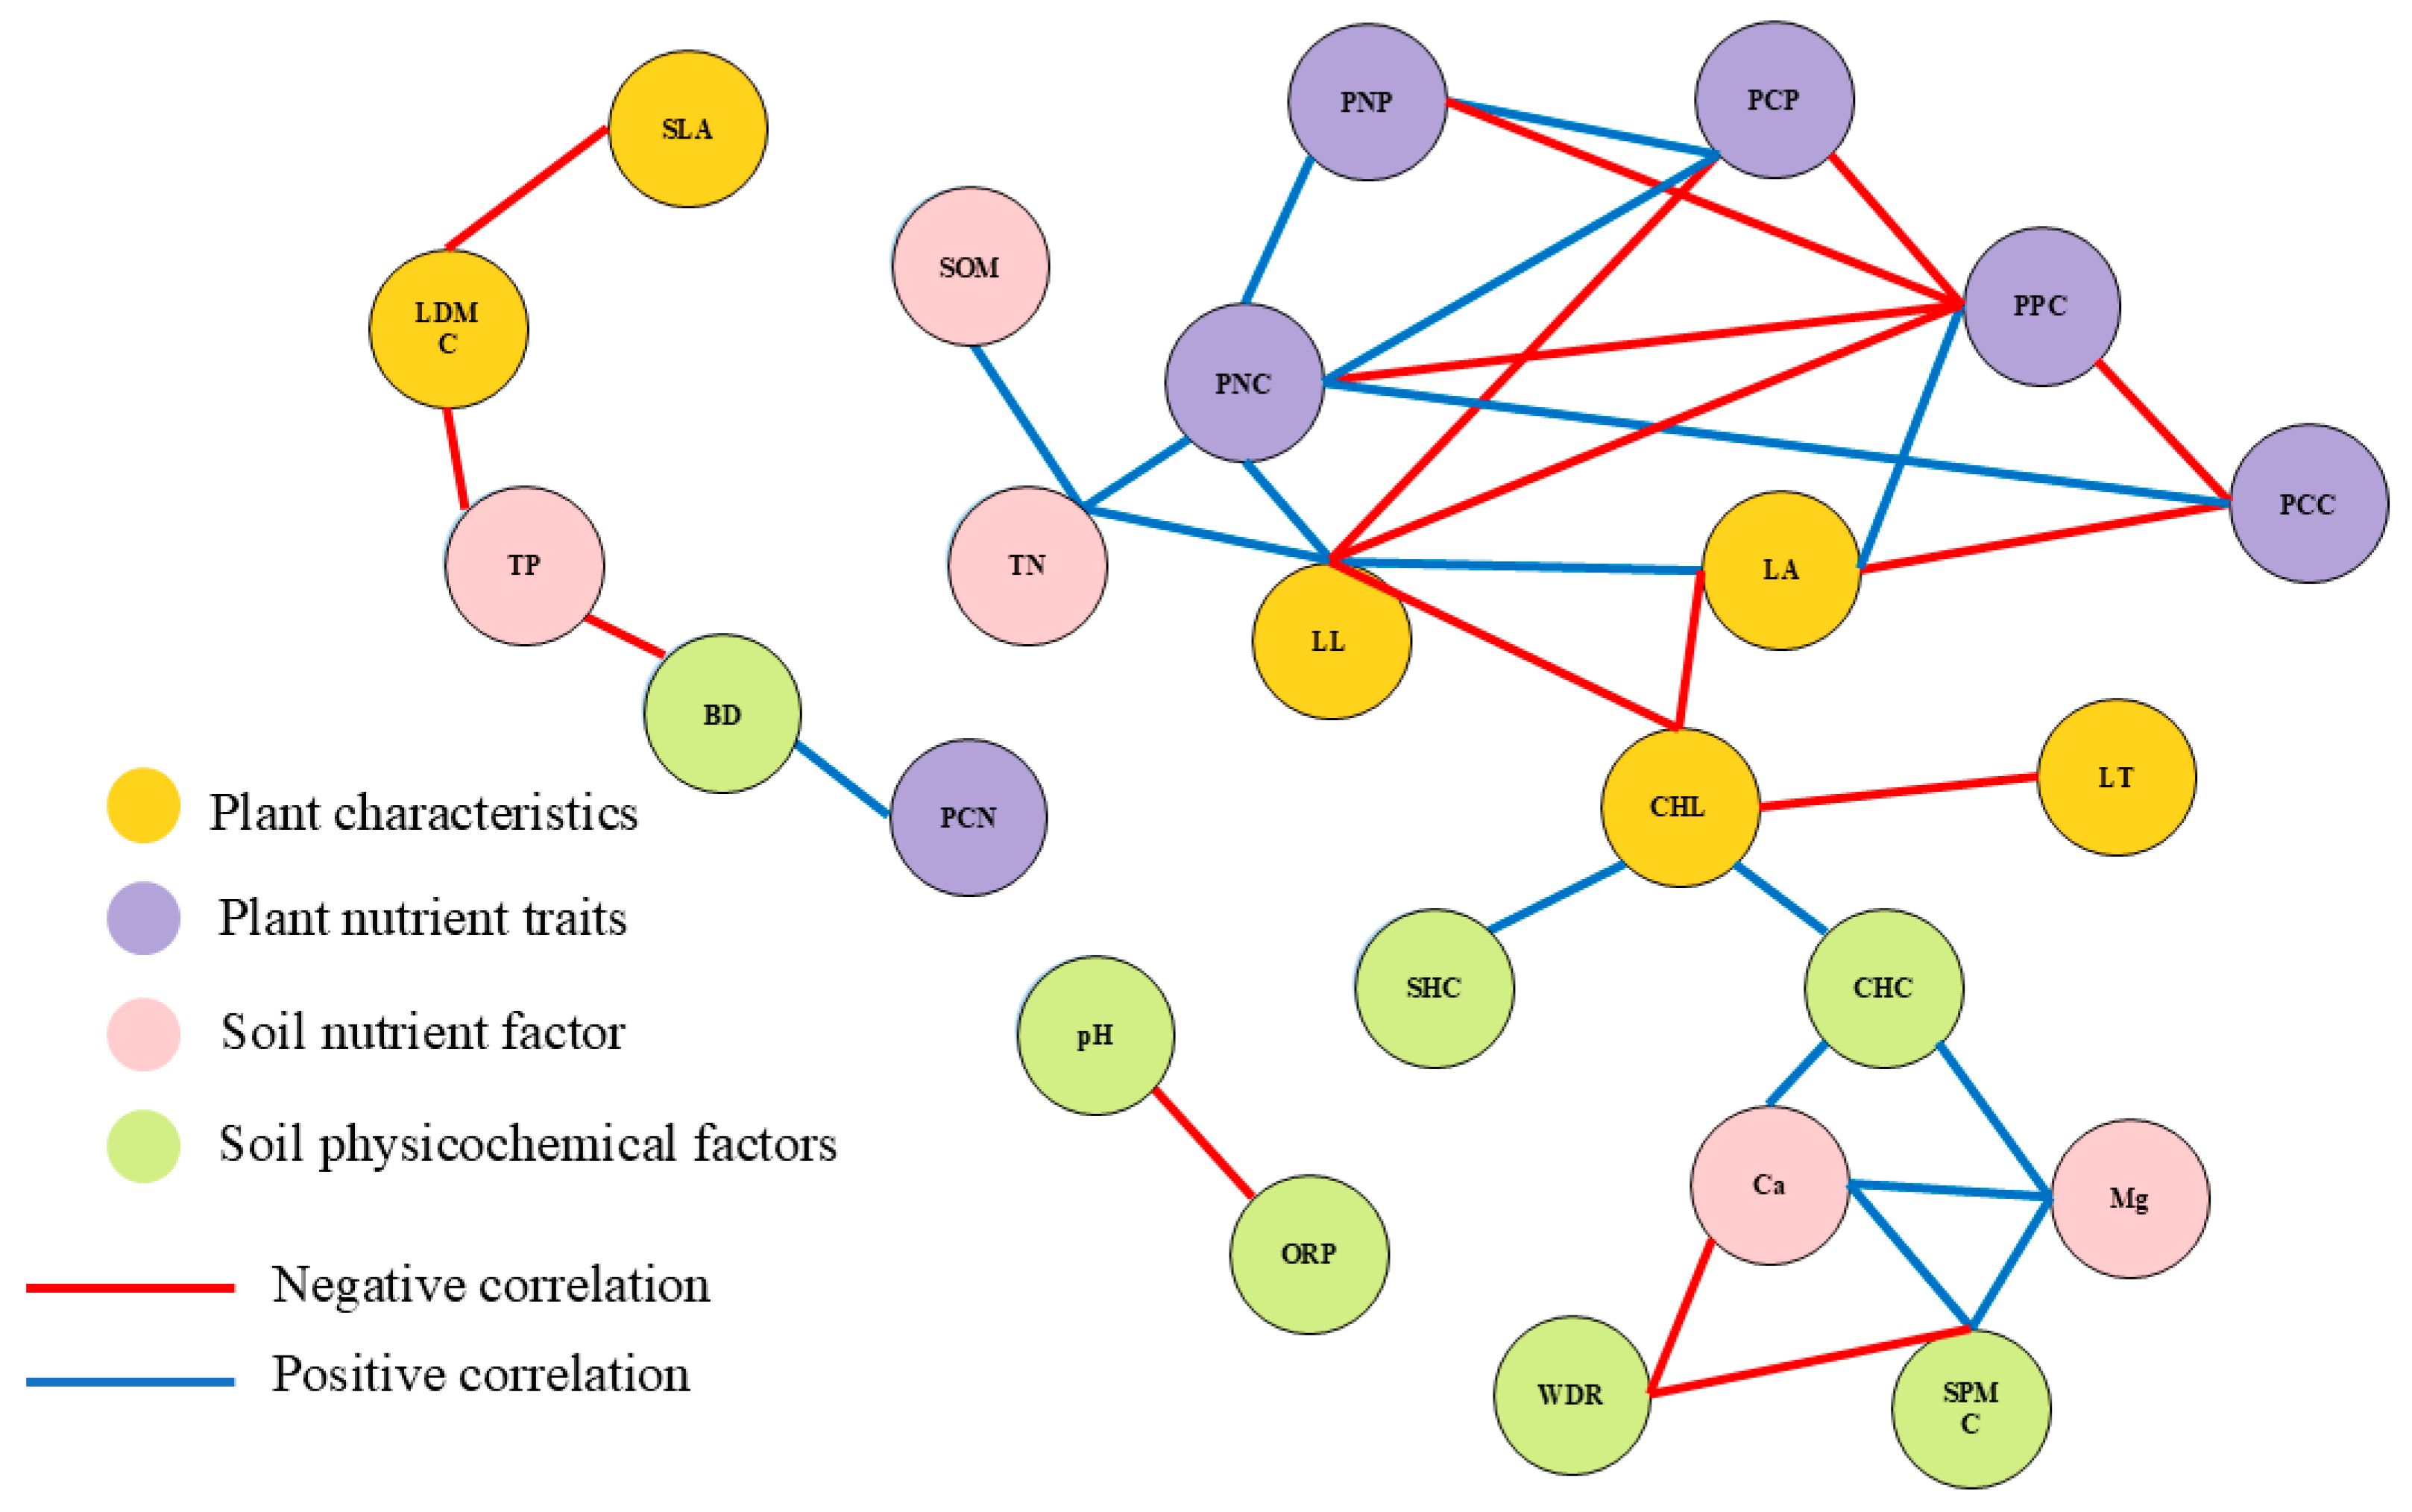
As illustrated in Figure 5, the total number of correlation segments between plant traits and soil factors is 33. Of these, five segments represent correlations between plant traits and plant nutrients, accounting for 15%; six segments correspond to correlations between soil nutrients and soil physicochemical properties, accounting for 18%; one segment indicates a correlation between plant traits and soil nutrients, accounting for 3%; two segments denote correlations between plant nutrients and soil nutrients, accounting for 6%; one segment reflects a correlation between plant nutrients and soil physicochemical properties, accounting for 3%; five segments occur within plant traits, accounting for 15%; seven segments occur within plant nutrients, accounting for 21%; two segments occur within soil nutrients, accounting for 6%; and two segments occur within soil physicochemical properties, accounting for 6%.
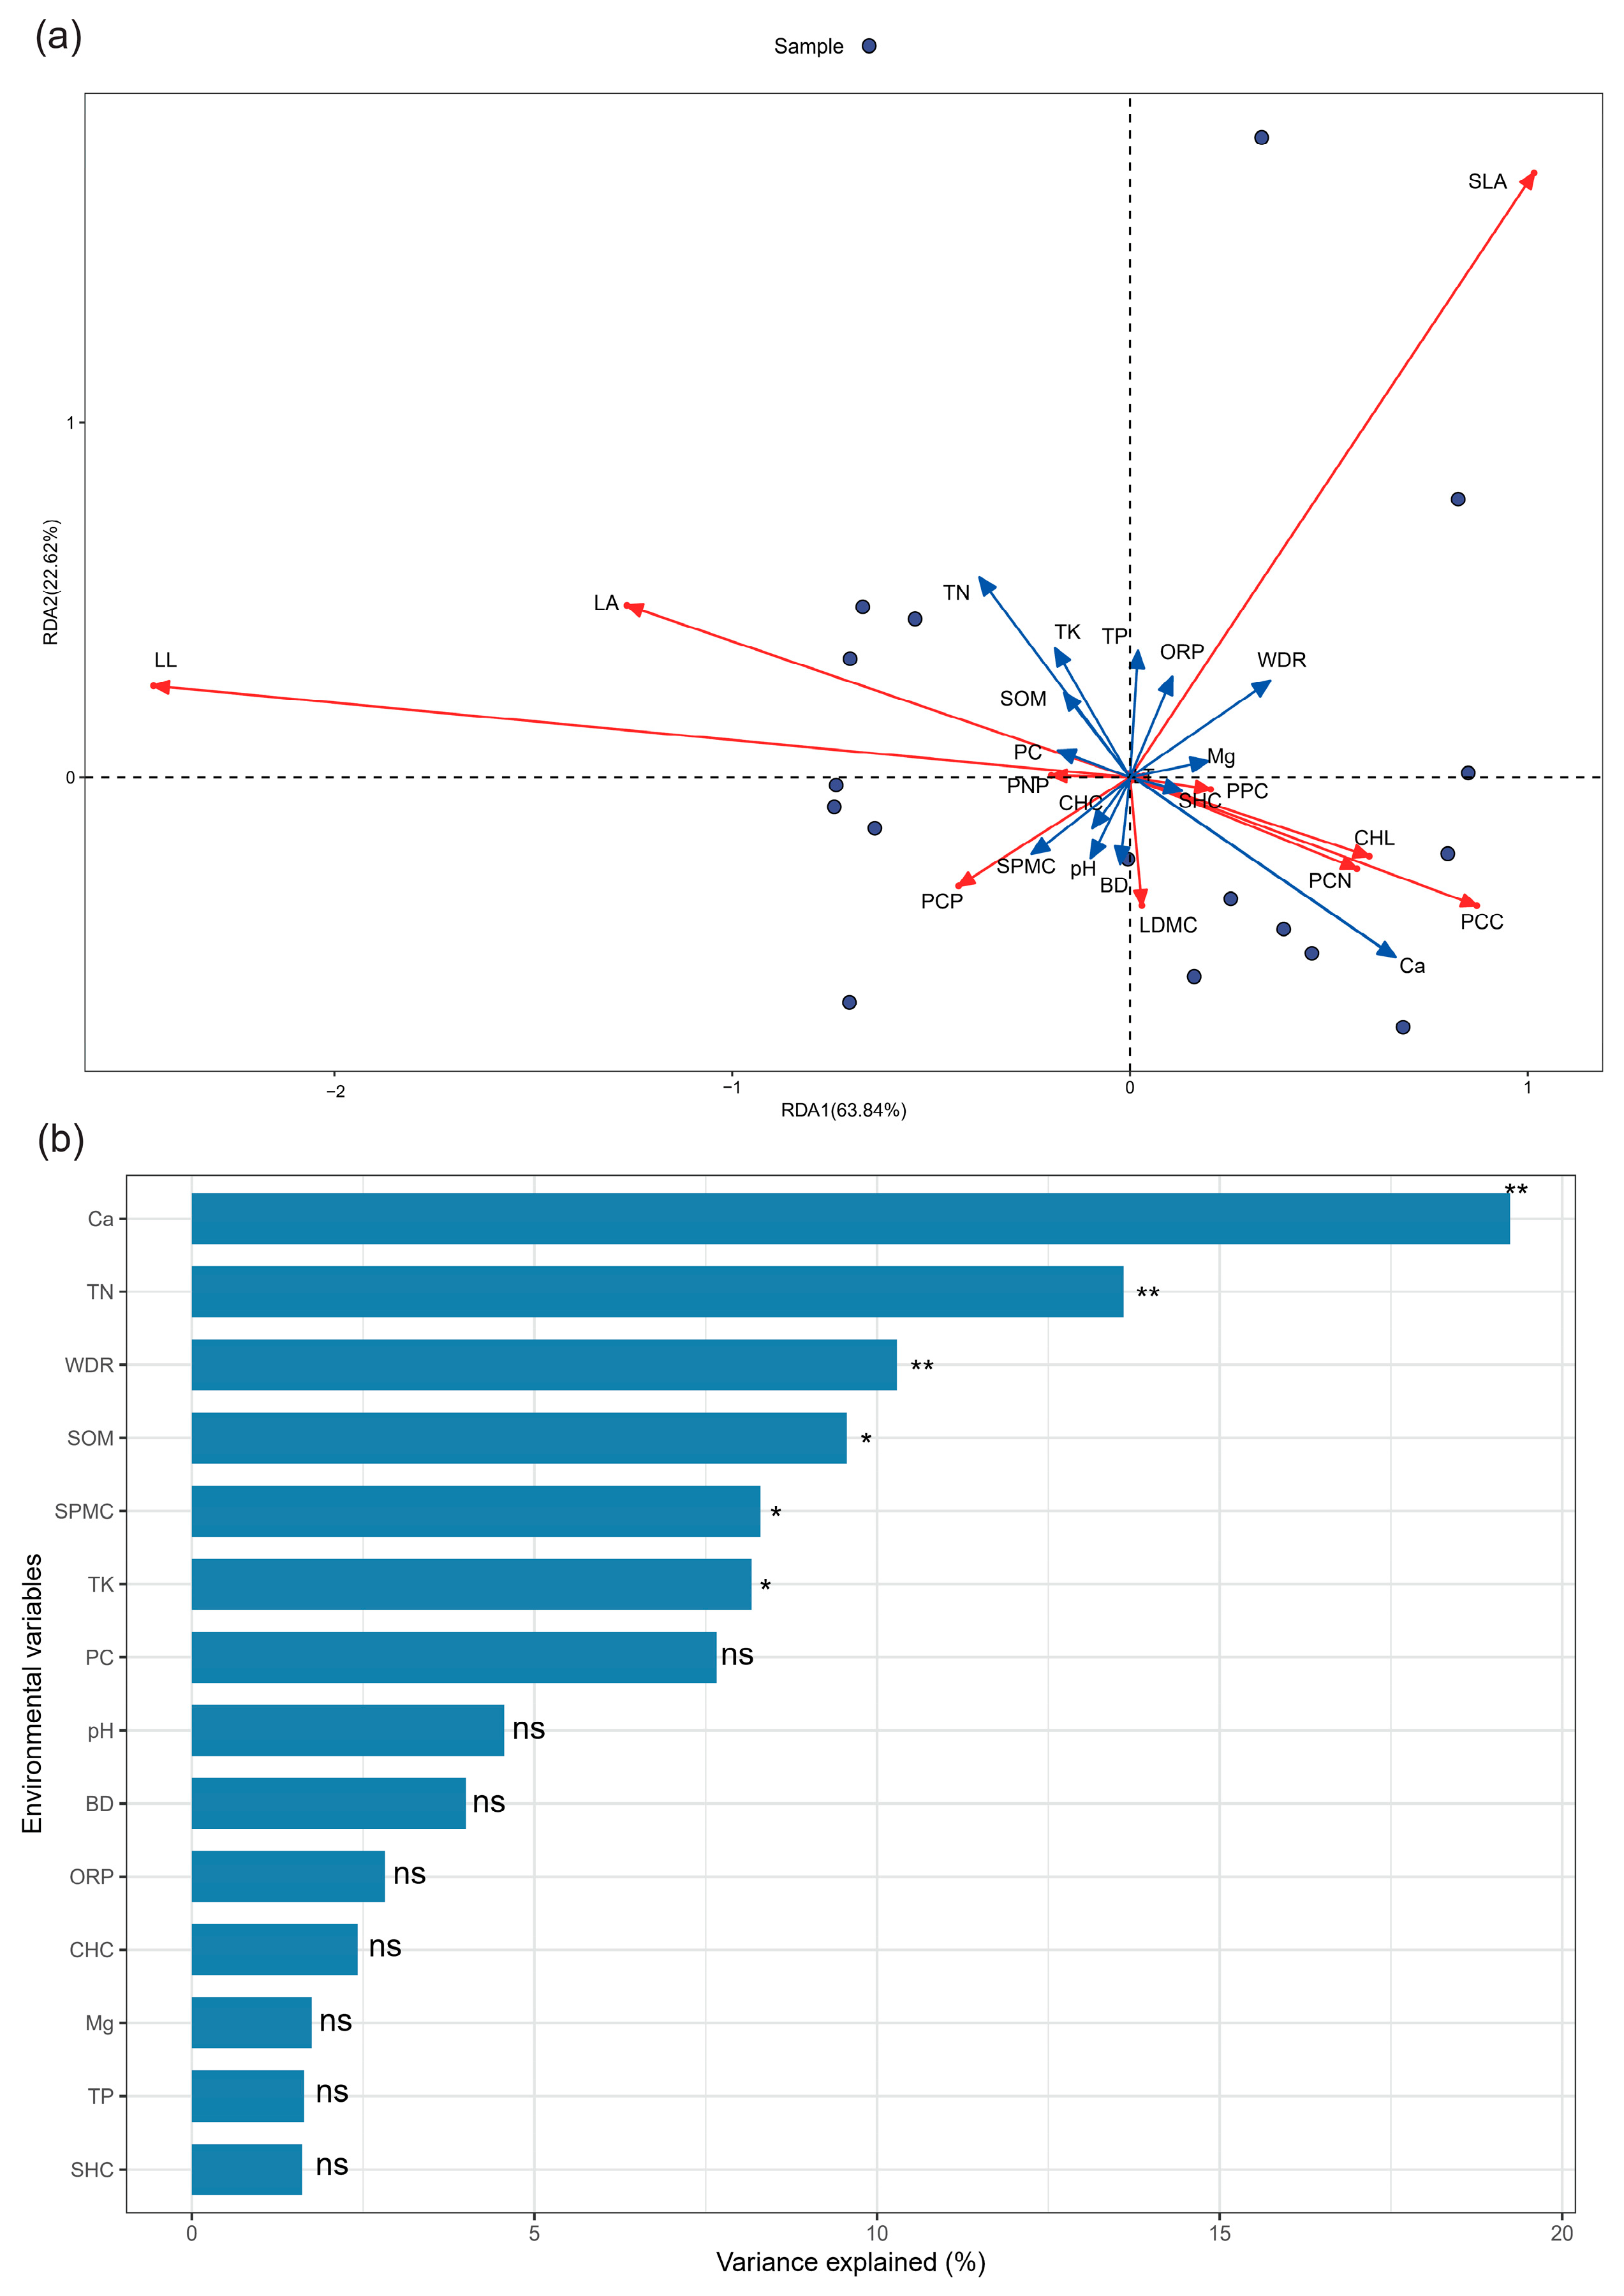
The results of the redundancy analysis and significance tests (Figure 6) indicate that the explanatory powers of Axis I and Axis II were 63.84% and 22.62%, respectively, with a cumulative explanatory power of 86.46% for the first two axes. The primary soil factors influencing the Caohai Wetland on the karst plateau were identified as total potassium, total nitrogen, soil organic matter, calcium, soil water content, and water drainage rate, with their relative influence ranked as calcium > total nitrogen > water drainage rate > soil organic matter > soil water content > total potassium. Additionally, among the plant traits in the Caohai Wetland, leaf length, specific leaf area, leaf area, and plant carbon content demonstrated high sensitivity to soil factors. Specifically, specific leaf area was positively correlated with water drainage rate, redox potential, total phosphorus, and magnesium; leaf length and leaf area were positively correlated with available potassium, soil organic matter, total nitrogen, and total potassium; and plant leaf carbon content was positively correlated with chloride content, bulk density, soil water content, and pH.
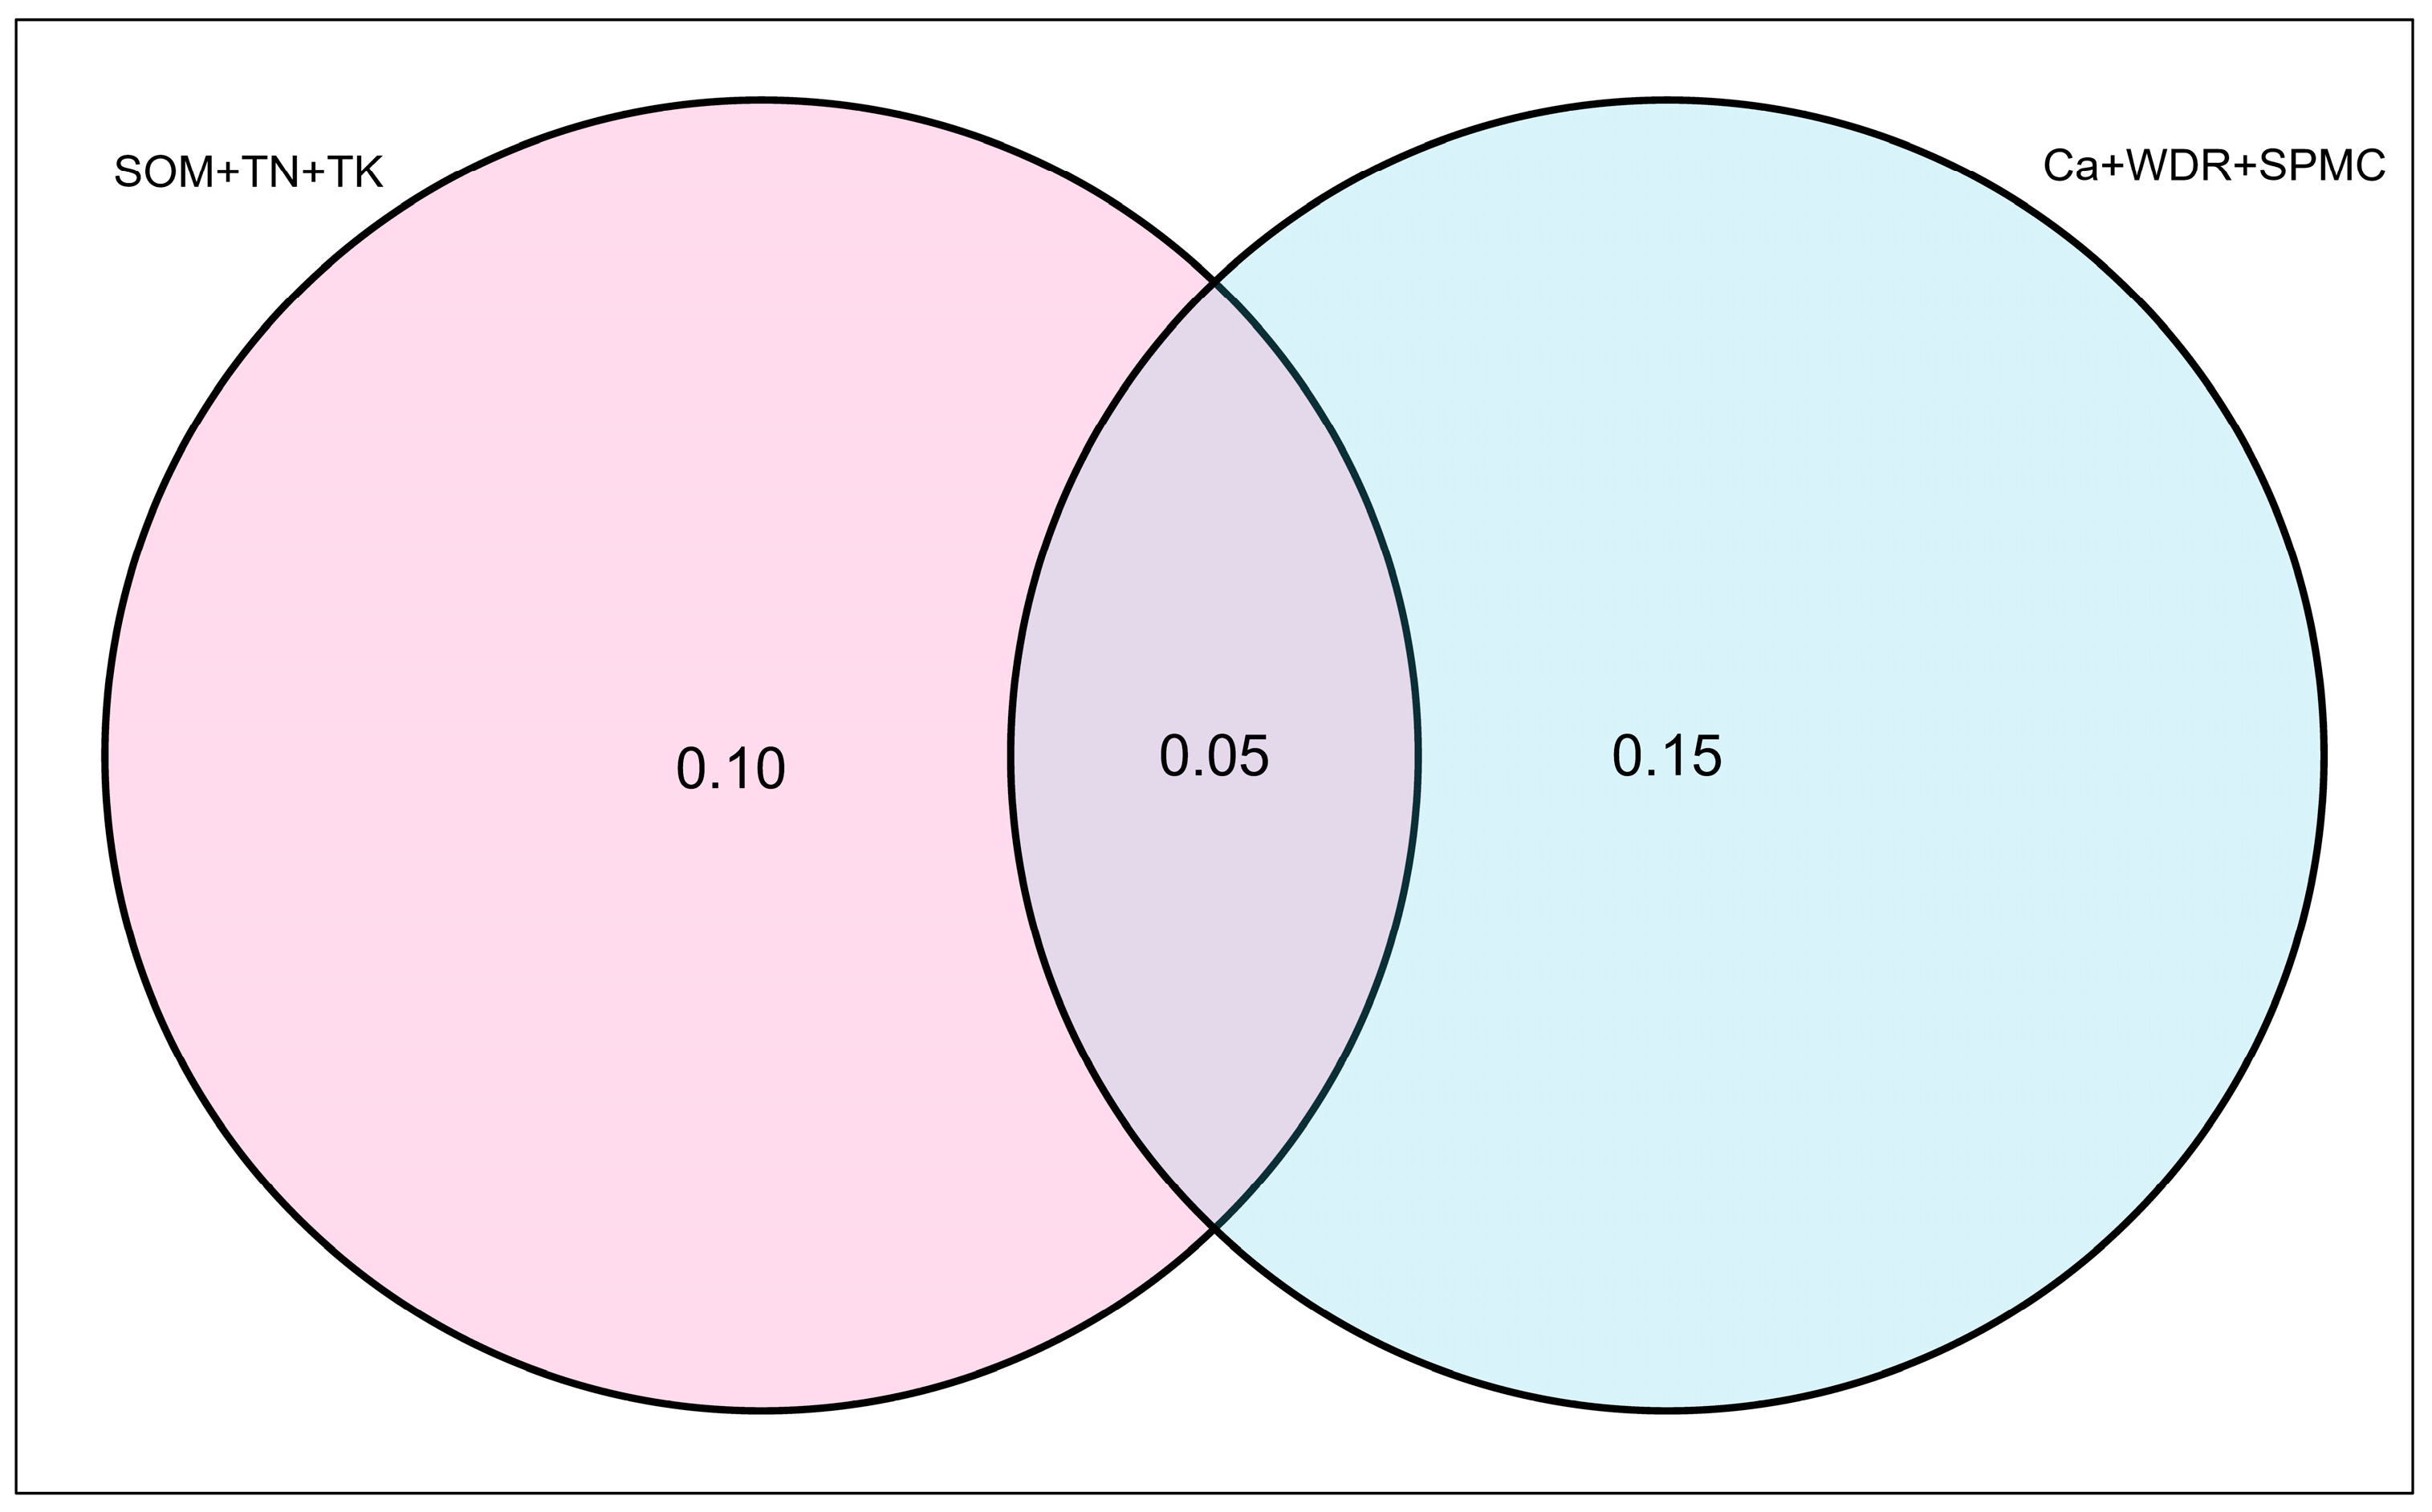
Based on the results of the redundancy analysis (RDA), the explanatory variables were categorized into two groups: physicochemical factors and nutrient factors variance partitioning (Figure 7). Venn diagrams and bar charts were generated to depict the individual and combined explanatory contributions of these two groups. Specifically, soil organic matter, total nitrogen, and total potassium were classified as soil nutrient factors, whereas calcium, water-dispersible clay, and soil water content were classified as soil physicochemical factors. As illustrated in Figure 7, the individual explanatory power of the soil nutrient factors was 0.10, that of the soil physicochemical factors was 0.15, and their combined explanatory power was 0.05.
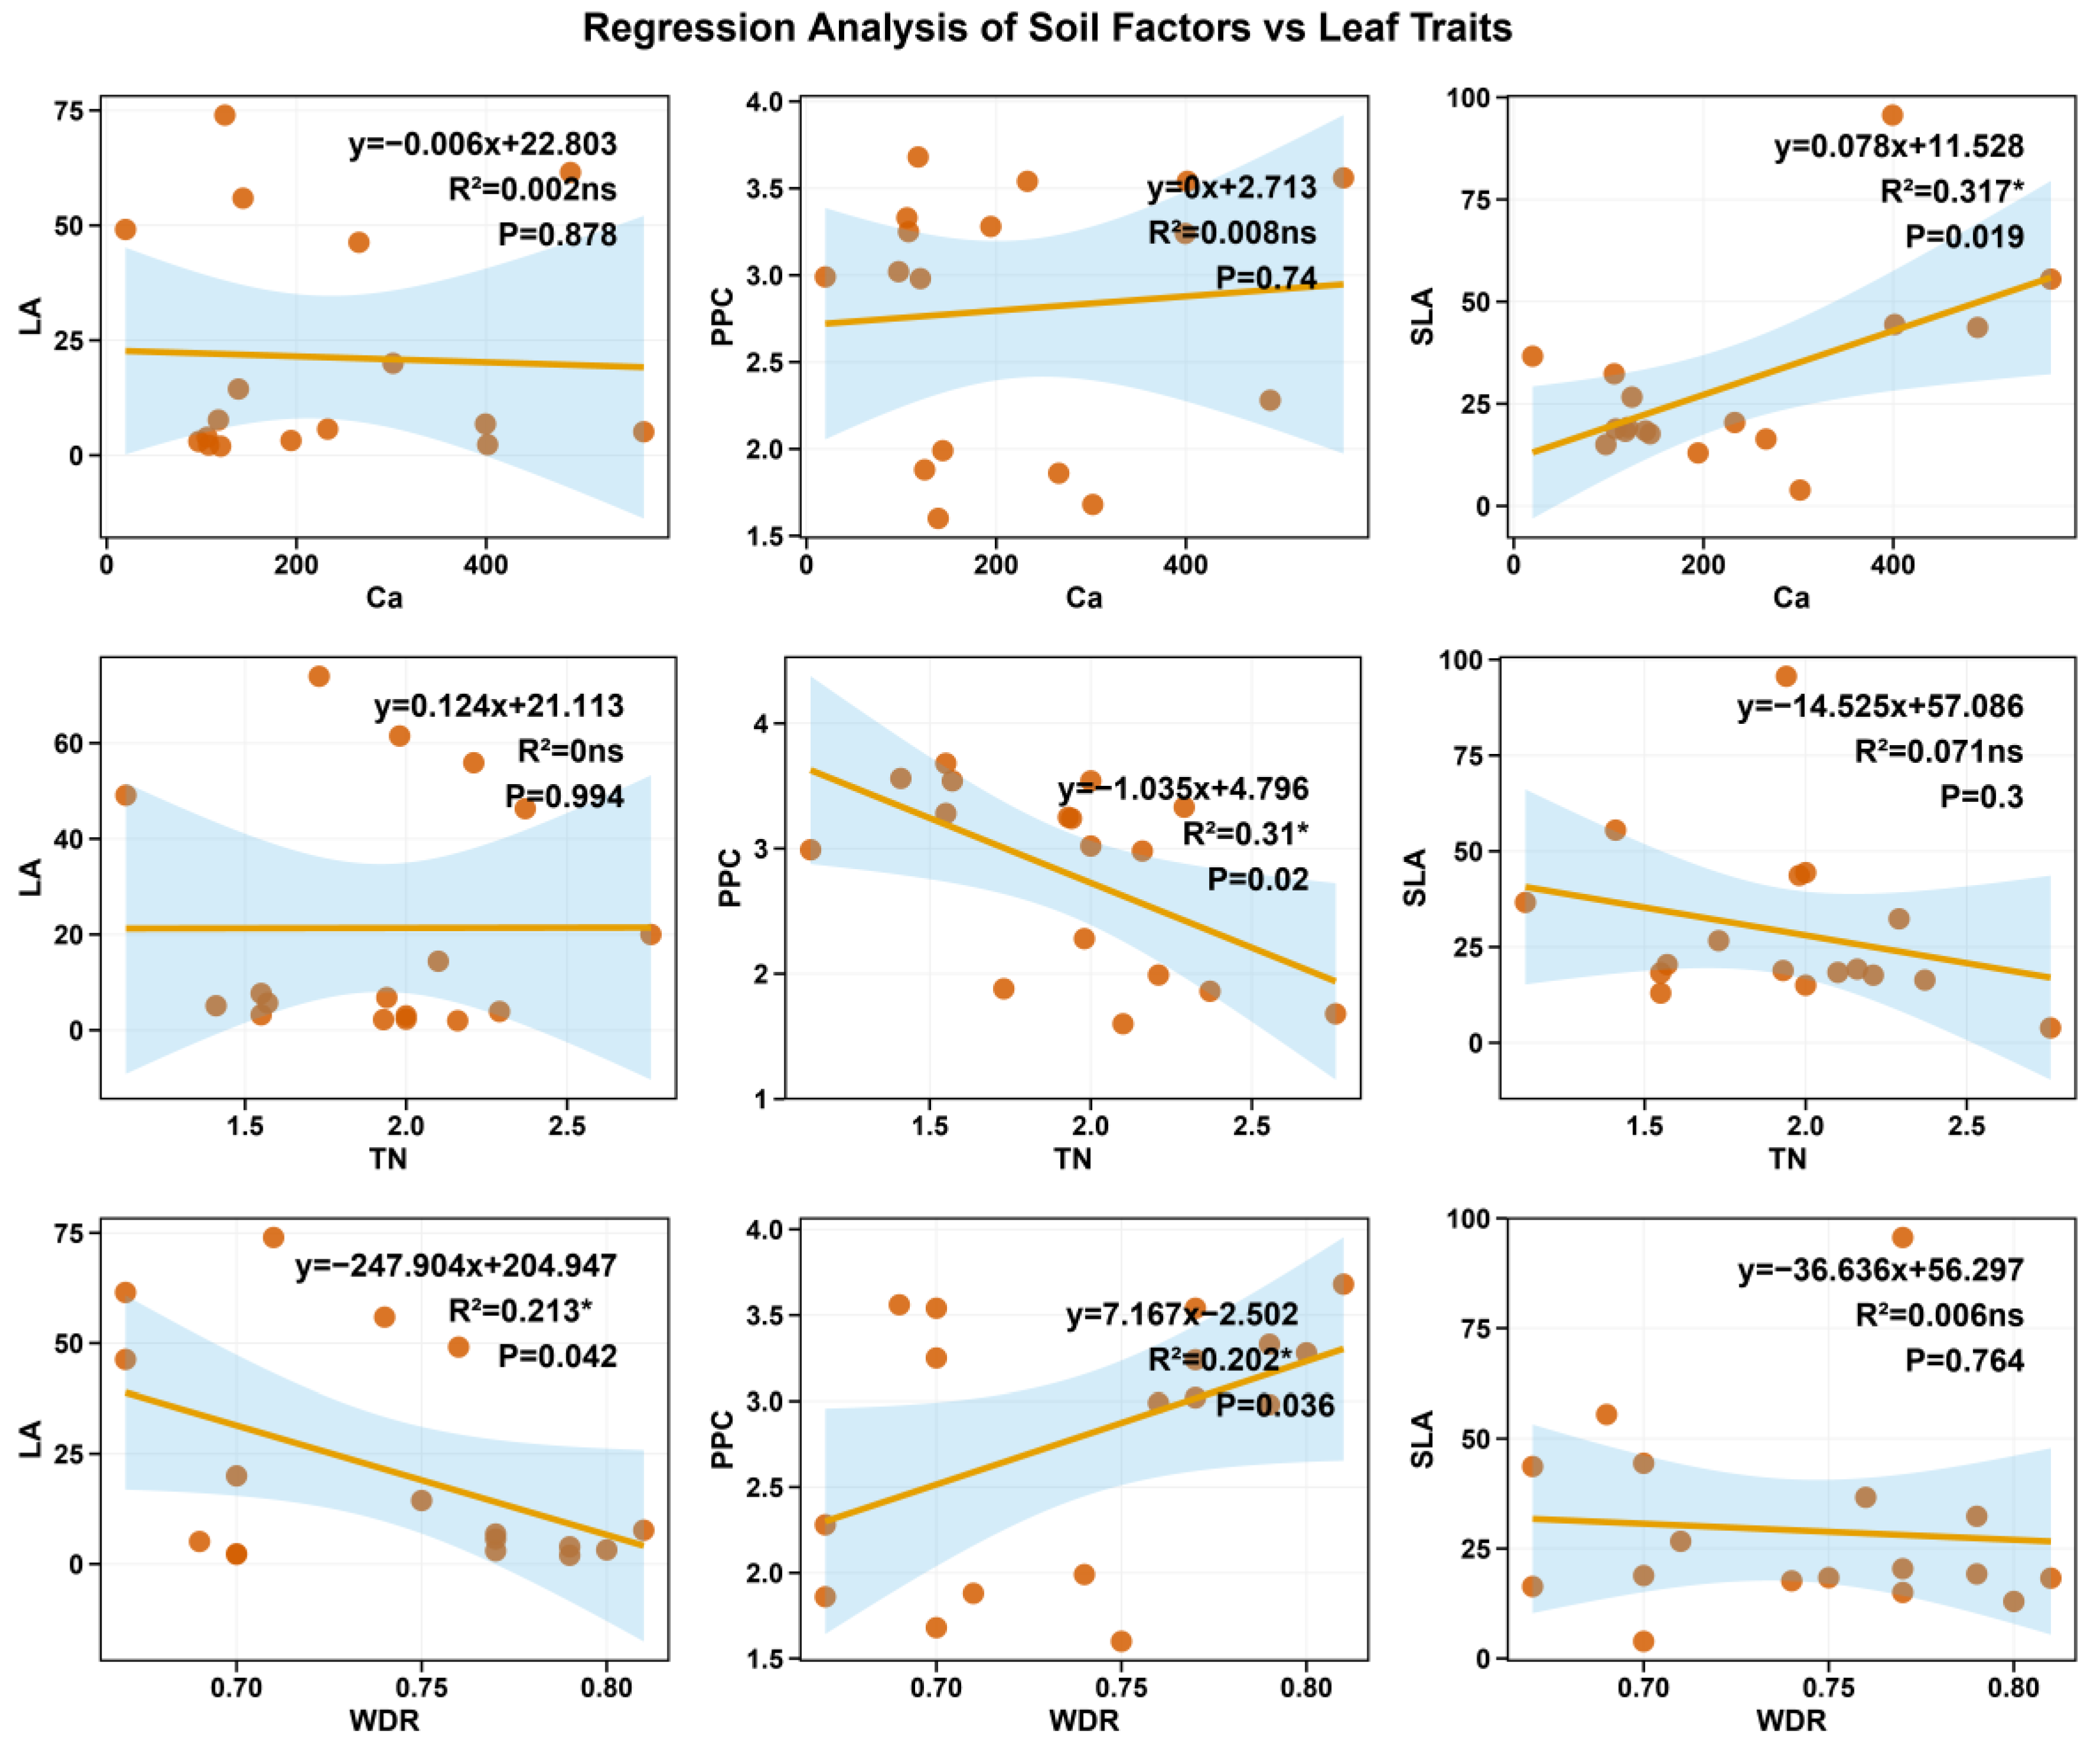
The three soil factors exerting the most significant influence were identified as core soil factors, while the three functional traits demonstrating the highest sensitivity to soil factors were designated as key traits. The core soil factors include calcium, total nitrogen, and water drainage rate, whereas the key traits comprise leaf area, plant leaf phosphorous content, and specific leaf area. As illustrated in Figure 8, significant linear relationships were observed between calcium and specific leaf area, total nitrogen and plant leaf phosphorus content, and water drainage rate and both leaf area and plant leaf phosphorus content. Specifically, calcium exhibited a significant positive correlation with specific leaf area (R2 = 0.317, p < 0.05), and water drainage rate showed a significant positive correlation with plant leaf phosphorus content (R2 = 0.202, p < 0.05). Conversely, total nitrogen was significantly negatively correlated with plant leaf phosphorus content (R2 = 0.31, p < 0.05), and water drainage rate was significantly negatively correlated with leaf area (R2 = 0.213, p < 0.05). Although significant linear relationships were observed, they present very low R square, which indicates a weak fit of the model to the data.

4. Discussion

4.1. Functional Trait Characteristics of Dominant Plants in the Caohai Karst Wetland

Plant functional traits are objective indicators for reflecting species’ adaptation to external environments [41]. In this study, the specific leaf area of dominant plants was lower than the national average (220.2 cm2/g) [42], and this trait enhanced their environmental adaptability in the soil and water-deficient karst plateau habitat by reducing water transpiration and improving nutrient use efficiency, which was consistent with the results of relevant studies in karst areas [43,44]. Habitat heterogeneity in the karst plateau wetland lakeshore zone is the core driver of interspecific differentiation of dominant plant functional traits; the four dominant species formed complementary ecological adaptation strategies through differentiated trait combinations, which reflected the niche differentiation at the community level [1].
Onopordum acanthium had significantly higher leaf thickness, leaf area, and leaf length than other species. Its large plant type and thick leaves constitute a specialized adaptation strategy for efficiently capturing light resources in karst wetlands; the well-developed cuticle of thick leaves can reduce transpiration water loss under the alternating dry-wet condition of the lakeshore zone, adapting to the habitat characteristics of sufficient light but uneven spatiotemporal water distribution in karst plateau wetlands [45] and achieving dual advantages in resource acquisition and nutrient storage. In contrast, Galium odoratum and Paspalum distichum had significantly higher leaf phosphorus content. Phosphorus is the core element of plant photosynthesis and energy metabolism, and high leaf phosphorus content can improve the photosynthetic efficiency of plants in nutrient-poor karst soils, enabling them to maintain competitive advantages in phosphorus-limited habitats [39] and thus adapt well to the resource-deficient stress environment of the lakeshore zone [46].
There were significant correlations among leaf traits of dominant plants: chlorophyll content was significantly negatively correlated with leaf length, leaf area, and leaf thickness, which was due to the inhibited chlorophyll synthesis and accelerated senescence of large-leaved species such as Phragmites australis and Onopordum acanthium with the increase of leaf area [12]. This negative correlation reveals the resource allocation trade-off strategy of plants in karst lakeshore zones: large-leaved species allocate more photosynthetic products to morphological construction for expanding resource capture space rather than chlorophyll synthesis, which is an optimized resource allocation mode for plants in high-light and low-nutrient habitats [17]. In addition, plant carbon-to-nitrogen ratio and plant leaf phosphorus content were significantly negatively correlated with plant carbon-to-phosphorus ratio, plant nitrogen-to-phosphorus ratio, and plant leaf carbon content. This stoichiometric correlation reflects the C, N, and P nutrient balance regulation mechanism of plants in karst calcium-enriched soils: calcium ions form insoluble phosphate with soil phosphorus, leading to limited plant phosphorus absorption and increased N/P and C/P ratios, and plants alleviate the physiological stress caused by phosphorus limitation by adjusting the accumulation ratio of C and N, which is an adaptive response to the unique soil chemical characteristics of karst habitats [47].
Compared with non-karst wetlands, karst forest, and grassland ecosystems, the plants in the karst plateau wetland lakeshore zone form a unique morphological–chemical trait synergistic trade-off network [5]. This network is a comprehensive adaptation strategy of plants to the compound habitat of calcium enrichment, low nutrient, and alternating dry-wet in karst wetlands, and the synergistic regulation of traits can effectively maintain the physiological balance and stability of plants in karst wetland habitats. There is a certain degree of overlap in the biological connotations and calculation methods of some indicator factors involved in this study, which may lead to autocorrelation among variables. This autocorrelation could potentially affect the independent interpretation of the statistical results. Future research should focus on optimizing the indicator screening system by selecting independent indicator factors to minimize the interference caused by variable autocorrelation, thereby enhancing the robustness of the conclusions.

4.2. Relationship Between Dominant Plant Functional Traits and Soil Properties

Variation in plant functional traits is jointly regulated by genetic factors and environmental selection [48]. In this study, the variation coefficients of soil magnesium, calcium, chloride content, and saturated hydraulic conductivity were all ≥ 50.0%. The high variation of calcium and magnesium was due to the limestone parent material characteristics and nutrient deposition in low-lying wetland areas [49,50]; as an aquatic-terrestrial ecotone, the topographic undulation and spatiotemporal heterogeneity of hydrological processes in the karst plateau wetland lakeshore zone further aggravate the spatial differentiation of soil calcium and magnesium: leaching in high terrain areas leads to calcium and magnesium loss, while evaporation in low-lying waterlogged areas causes calcium and magnesium surface accumulation, which is the key hydrological driver for the higher variation coefficients of calcium and magnesium than other soil factors [51,52]. In contrast, the variation coefficients of soil pH and redox potential were <7%, indicating the stability of the habitat environment. This stability is the direct effect of ecological protection measures in Caohai Wetland; the stable acid–base and redox environment provides a foundation for the stable development of plant communities and also verifies the recovery trend of karst plateau wetland ecosystem under artificial protection [53].
At the local scale, soil factors are the decisive ecological factors affecting the variation of plant functional traits [54,55]. This study confirmed that total potassium, total nitrogen, soil organic matter, calcium, soil water content, and water drainage rate are the core soil factors regulating the functional traits of dominant plants. These five factors construct the soil environment system for plant growth in the lakeshore zone from three dimensions of nutrient supply, soil physical structure, and hydrological conditions, and their synergistic effect determines the variation direction of plant traits; compared with a single factor, the combined effect of multiple factors has stronger explanatory power for plant trait variation, which reflects the comprehensive response characteristics of plants to the soil environment [12,51]. Water drainage rate regulates plant specific leaf area through water supply, turgor pressure change, and transpiration [52,56]; the regulation of specific leaf area by water drainage rate is essentially the adaptive response of plants to soil water availability. Sufficient water under high water drainage rate reduces plant water stress, and plants improve nutrient use efficiency by reducing specific leaf area; under low water drainage rate, plants adjust specific leaf area to balance water conservation and resource capture, which is the key adaptive strategy of plants to the hydrological fluctuation in the lakeshore zone [13]. The correlation degree in the study area showed the pattern of soil factors > plant nutrient traits > plant morphological traits, and the correlation between plant morphological traits and soil factors was higher than that between plant nutrient traits and soil factors. This pattern reveals the hierarchical regulation law of the karst lakeshore zone ecosystem: soil factors as the core driving layer, their internal interaction determines the overall characteristics of the soil environment, which further directly regulates plant morphological traits, and the variation of morphological traits indirectly affects plant nutrient allocation and stoichiometric characteristics, forming a hierarchical regulation path of “soil factors-plant morphological traits-plant nutrient traits” [19]. Different from the research results of Wilson et al. [57], soil pH was not a core influencing factor in this study. The reason is that the soil pH of Caohai Wetland is stable in the weak acid to neutral range without forming acid–base stress, and the typical habitat factors of the aquatic–terrestrial ecotone such as water drainage rate and bulk density become the dominant factors, which reflects the essential differences in soil factor regulation mechanisms between wetland ecosystems and arid, rocky desertification ecosystems and highlights the decisive effect of habitat type on plant–soil interaction [4].
This study indicates that soil physicochemical factors have greater explanatory power than soil nutrient factors, suggesting that the fundamental physicochemical characteristics of karst plateau wetland soils—such as calcium enrichment, soil structure, and hydrological conditions—constitute the primary framework influencing plant functional traits. In contrast, nutrient factors appear to play a more subtle modulatory role in trait variation within this established context [58]. Furthermore, the identified linear regulatory relationships between key soil variables (calcium concentration, total nitrogen, and water drainage rate) and principal plant traits (specific leaf area, plant phosphorus content, and leaf area) offer targeted avenues for vegetation restoration in riparian zones of karst plateau wetlands. Specifically, manipulating soil calcium levels, nitrogen availability, and hydrological conditions can facilitate the development of plant functional traits adapted to these habitats [59]. These findings also provide a theoretical foundation for the scientific management of wetlands, emphasizing that conservation efforts must balance nutrient inputs with the stability of soil physicochemical and hydrological processes to maintain the sustainable development of plant communities at the habitat baseline [54]. Due to limitations in sample size, the effectiveness of normalizing some data is restricted. Future studies could employ more robust statistical methods, such as non-parametric tests, to enhance the reliability of the results.
This study did not involve the research on plant root traits, while roots are the direct organs for plants to absorb soil nutrients and water, and their functional traits have a closer interaction with soil factors [60]. The root traits of plants in the karst lakeshore zone may have formed specialized adaptive characteristics to the calcium-enriched and low-nutrient soil environment. Future research needs to integrate the functional traits of multiple plant organs such as roots and leaves, construct a plant–soil interaction model based on whole-plant traits, and, furthermore, comprehensively reveal the ecological adaptation mechanism of plants in karst plateau wetlands [61].

5. Conclusions

This study examined the functional traits of plants in the riparian zones of karst plateau wetlands, focusing on plant functional characteristics and their relationships with soil physicochemical properties. The primary findings are as follows:
(1) In the riparian zone of the Caohai Karst Plateau Wetland, dominant plant species exhibit specific adaptation strategies. Significant interspecific differences are observed in leaf morphology and nutrient stoichiometry. Convergent changes in specific leaf area (SLA) and leaf dry matter content (LDMC) indicate strong environmental filtering. These plants form a coordinated network of trade-offs between morphological and chemical traits, adapting to karst wetland conditions by allocating photosynthetic resources under calcium and phosphorus-rich constraints and adjusting the balance of plant leaf carbon content, plant leaf nitrogen content, and plant leaf phosphorus content.
(2) Soil factors influence the functional characteristics of plants in the study area. Soil physicochemical properties serve as the primary determinants, while nutritional factors provide more precise adjustments. Calcium (Ca), total nitrogen (TN), soil organic matter (SOM), water drainage rate (WDR), soil water content (SPMC), and total potassium (TK) are the main driving factors. Among these, calcium, total nitrogen, and water drainage rate exhibited significant linear effects on specific leaf area (SLA), plant phosphorus content (PPC), and leaf area (LA).

Author Contributions

Conceptualization, Y.W.; methodology, Y.W. and J.R.; software, Y.W. and W.Z.; validation, H.Z., L.L. and Y.D.; formal analysis, Y.W.; investigation, Y.W., J.R. and X.X.; resources, Y.W.; data curation, Y.W.; writing—original draft preparation, Y.W.; writing—review and editing, Y.W., X.X. and W.Z.; visualization, Y.W.; supervision, J.R.; project administration, Y.W.; funding acquisition, Y.W. All authors have read and agreed to the published version of the manuscript.

Funding

This research was funded by Guizhou Key Laboratory of Plateau Wetland Conservation and Restoration (grantnumber: Qiankehe Platform ZSYS [2025]015), Guizhou Caohai Wetland Ecosystem Observation and Research Station, and Guizhou Provincial Science and Technology Program Project: Research and Development of Key Technologies for Water Turbidity Evolution and Water Quality Remote Sensing in Guizhou Caohai (grantnumber: Qiankehe Support [2024] General 124). the Guizhou Provincial Science and Technology Program (grantnumber: Qiankehejichu—ZK [2024] General 601); Bijie Scientist Workstation Project (grantnumber: BKHPT [2025] NO.2). Karst plateau Resources and Environmental Remote Sensing Talent Team (grantnumber: [BWRLT (2023) No. 14]). Intelligent Geographic Spatial Information Application Engineering Center (grantnumber: [BKLH (2023) No. 08]).

Institutional Review Board Statement

Not applicable.

Informed Consent Statement

Not applicable.

Data Availability Statement

The original contributions presented in this study are included in the article. Further inquiries can be directed to the corresponding author.

Conflicts of Interest

The authors declare no conflicts of interest.

References

  1. Wright, I.J.; Reich, P.B.; Westo, Y.M.; Ackerly, D.D.; Baruch, Z.; Bongers, F.; Cavender-bares, J.; Chapin, T.; Cornelissen, J.H.C.; Diemer, M.; et al. The worldwide leaf economics spectrum. Nature 2004, 428, 821–827. [Google Scholar] [CrossRef] [PubMed]
  2. Reich, P.B.; Oleksyn, J. Global patterns of plant leaf N and P in relation to temperature and latitude. Proc. Natl. Acad. Sci. USA 2004, 101, 11001–11006. [Google Scholar] [CrossRef]
  3. Kröber, W.; Plath, I.; Heklau, H.; Bruelheide, H. Relating stomatal conductance to leaf functional traits. Jove-J. Vis. Exp. 2015, 104, 52738. [Google Scholar]
  4. Diaz, S.; Lavorel, S.; de Bello, F.; Quetier, F.; Grigulis, K.; Robson, T.M. Incorporating plant functional diversity effects in ecosystem service assessments. Proc. Natl. Acad. Sci. USA 2007, 104, 20684–20689. [Google Scholar] [CrossRef]
  5. Díaz, S.; Cabido, M. Vive la différence: Plant functional diversity matters to ecosystem processes. Trends Ecol. Evol. 2001, 16, 646–655. [Google Scholar] [CrossRef]
  6. Wang, X.Y.; Huang, X.X.; He, K.J.; Sun, X.N.; Lv, Z.Z.Z.; Zhang, Y.; Zhu, M.; Zeng, R.Q. The relationship between plant functional traits and soil physicochemical properties in alpine meadows in Northwestern Yunnna Province, China. Acta Pratacul. Sin. 2020, 29, 6–17. [Google Scholar]
  7. Huo, J.X.; Ren, L.; Pan, Y.P.; Zhao, J.; Xiang, X.; Yu, C.; Meng, D.H.; Wang, Y.Y.; Lu, R.J.; Huang, Y.M. Functional traits of desert plants and their responses to environmental factors in Qaodam Basin, China. Acta Ecol. Sin. 2022, 42, 4494–4503. [Google Scholar]
  8. Wang, X.; Yang, L.; Zhao, Q.; Zhang, Q.D. Response of grassland community functional traits to soil water in a typical the Loess Plateau watershed. Acta Ecol. Sin. 2020, 40, 2691–2697. [Google Scholar] [CrossRef]
  9. Violle, C.; Navas, M.L.; Vile, D.; Kazakou, E.; Fortuned, C.; Hummel, I.; Gamier, E. Let the concept of trait be functional. Oikos 2007, 116, 882–892. [Google Scholar] [CrossRef]
  10. He, N.; Yan, P.; Liu, C.; Xu, L.; Li, M.; Van Meerbeek, K.; Zhou, G.; Zhou, G.; Liu, S.; Zhou, X.; et al. Predicting ecosystem productivity based on plant community traits. Trends Plant Sci. 2023, 28, 43–53. [Google Scholar] [CrossRef]
  11. Zhou, X.; Xin, J.; Huang, X.; Li, H.; Li, F.; Song, W. Linking Leaf Functional Traits with Soil and Climate Factors in Forest Ecosystems in China. Plants 2022, 11, 3545. [Google Scholar] [CrossRef]
  12. He, N.; Li, Y.; Liu, C.; Xu, L.; Li, M.; Zhang, J.; He, J.; Tang, Z.; Han, X.; Ye, Q.; et al. Plant Trait Networks: Improved Resolution of the Dimensionality of Adaptation. Trends Ecol. Evol. 2020, 35, 908–918. [Google Scholar] [CrossRef]
  13. Fu, H.; Zhang, J.; Yuan, G. Functional traits composition predict macrophytes community productivity along a water depth gradient in a freshwater lake. Ecol. Evol. 2014, 4, 1516–1523. [Google Scholar] [CrossRef]
  14. Zhang, H.; Chen, H.Y.H.; Lian, J.; John, R.; Ronghua, L.; Liu, H.; Ye, W.; Berninger, F.; Ye, Q. Using functional trait diversity patterns to disentangle the scale-dependent ecological processes in a subtropical forest. Funct. Ecol. 2018, 32, 1379–1389. [Google Scholar] [CrossRef]
  15. Chapin, F.R. Effects of plant traits on ecosystem and regional processes: A conceptual framework for predicting the consequences of global change. Ann. Bot. 2003, 91, 455–463. [Google Scholar] [CrossRef]
  16. Wang, J.; Zhu, J.; Ai, X.R.; Yao, L.; Huang, X.; Wu, M.L.; Zhu, Q.; Hong, J.F. Effects of topography on leaf functional traits across plant life forms in Xingdou mountain, Hubei, China. Chin. J. Plant Ecol. 2019, 43, 447–457. [Google Scholar] [CrossRef]
  17. Reich, P.B. The world-wide “fast-slow” plant economics spectrum: A traits manifesto. J. Ecol. 2014, 102, 275–301. [Google Scholar] [CrossRef]
  18. Poorter, L.; McDonald, I.; Alarcon, A.; Fichtler, E.; Licona, J.C.; Pena-Claros, M.; Sterck, F.; Villegas, Z.; Sass-Klaassen, U. The importance of wood traits and hydraulic conductance for the performance and life history strategies of 42 rainforest tree species. New Phytol. 2010, 185, 481–492. [Google Scholar] [CrossRef]
  19. Cadotte, M.W. Functional traits explain ecosystem function through opposing mechanisms. Ecol. Lett. 2017, 20, 989–996. [Google Scholar] [CrossRef] [PubMed]
  20. Ye, C.; Li, Q.H.; Wu, L.; Yang, W.J. Ecological Degradation of Lakeshore Zones and Its Interaction with Human Activities. Res. Environ. Sci. 2015, 28, 401–407. [Google Scholar]
  21. Zhang, L.; Song, C.Y.; Yuan, W.Y.; Jia, Y.; Sang, J.W.; Wu, D.X. Construction of comprehensive evaluation index system of vegetation ecological quality based on field survey. Acta Ecol. Sin. 2023, 43, 128–139. [Google Scholar] [CrossRef]
  22. Ma, F.J.; Ning, D.Q.; Zhang, X.K.; Yin, D.H.; Zhang, J.L.; Tao, F.; Liu, K. Structural Characteristics of Riparian Vegetation Communities at the Anqing Xijiang Yangtze River Dolphin Ex situ Conservation Base. Acta Hydrobiol. Sin. 2019, 43, 623–633. [Google Scholar]
  23. Wang, J.Q.; Liu, B.; Chang, F.; Ma, Z.J.; Fan, J.H.; You, S.X.; Aerziguli, A. Plant functional traits and ecological stoichiometric characteristics under water-salt gradient in the lakeshore zone of Bosten Lake. Chin. J. Plant Ecol. 2022, 46, 961–970. [Google Scholar] [CrossRef]
  24. Peng, Y.; Yang, R. Environmental change Caohai Lake, Guizhou Province from 730 ka to present and future evolution. Chin. J. Earth Enviro. 2014, 5, 194–206. Available online: https://kns.cnki.net/kcms2/article/abstract?v=5ZfW7CBA1F9mhwxgeMnwilMWcX1RY4r4vzOhxK_mlf8OID-ZBKAd5xtorl2SbIVVqHJpazDug31xaNOJBj6A5-gne_lKFsZSuApV_gweVwyslxWsmjxOuwkeK7A3UdEpfK6E-tLPjMaJrRMX5QAV8FtEIDaUIWEZe83QNXs1JHs=&uniplatform=NZKPT (accessed on 9 April 2026).
  25. Song, S.; Li, H.; Li, H.; Shi, R.; Li, X. Remote sensing monitoring of water area changes in Caohai National Nature Reserve in Weining, Guizhou in recent 35 years. Chin. Guizhou Sci. 2021, 39, 76–82. Available online: https://kns.cnki.net/kcms2/article/abstract?v=5ZfW7CBA1F9Zphdnjprz91UyCMIpjjPKqAsYAQ2IzqZ0M__GnGP4t9QzWZH5ICnb3rM_hhQlFZ2HtCO5WuzhjZI_sWUNAeeVIL77-BDTMtmjfLgH2WLwbjXVBwM3fLS72LisrD6nylzd1OvVen5UfsK3fqDxX26fQR8gG8o77Bc=&uniplatform=NZKPT (accessed on 9 April 2026).
  26. Chen, M.M.; Zhang, K.; Zhang, P.; Yan, P.; Zhang, S.G.; Wang, K.W.; Yu, D.P. Spatio-temporal effects of waterway regulation engineering on population abundance and distribution of the Yangtze finless propoise in Anqing section of the Yangtze River. Acta Ecol. Sin. 2023, 43, 4242–4249. [Google Scholar]
  27. Research Center for Nature Reserves, National Forestry and Grassland Administration of China. Caohai National Nature Reserve, Guizhou [EB/OL]; Research Center for Nature Reserves, National Forestry and Grassland Administration of China: Kunming, China, 2025; Available online: https://www.fnrrc.com/ziranbaohuqujianjie/9811.html (accessed on 9 April 2026).
  28. Fang, J.Y.; Wang, X.P.; Shen, Z.H.; Tang, Z.R.; He, J.S.; Yu, D.; Jiang, Y.; Wang, Z.H.; Zheng, C.Y.; Zhu, J.L.; et al. Methods and protocols for plant community inventory. Biodivers. Sci. 2009, 17, 533–548. [Google Scholar] [CrossRef]
  29. Zhang, L.M.; Tan, X.; Dong, Z.; Zheng, J.; Yuan, Z.X.; Li, C.X. The relationship between plant functional traits and soil physicochemical properties in the riparian zones of downtown Chongqing. Acta Ecol. Sin. 2023, 43, 1892–1901. [Google Scholar] [CrossRef]
  30. Bao, S.D. Soil Agrochemical Analysis, 3rd ed.; Agricultural Press: Beijing, China, 2005; pp. 45–52. [Google Scholar]
  31. Li, Y.X.; Lu, G.; Wang, D.H.; Li, C.H.; Song, G.; Du, X.P.; Dong, L. Analyzing the saturated hydraulic conductivity of surface soil in a dump by three measuring methods. Sci. Soil Water Conser. 2019, 17, 65–74. [Google Scholar]
  32. HJ 746-2015; Soils—Determination of Redox Potential—Potentiometric Method. China Environmental Science Press: Beijing, China, 2015.
  33. Xu, J.B.; Zhang, Z.G.; Pan, W.Q.; Xu, Q. The effect of extraction temperature on the determined values of available potassium in soil. Soil 1995, 3, 164–166. [Google Scholar]
  34. Scotter, D.R.; Clothier, B.E.; Harper, E.R. Measuring saturated hydraulic conductivity and sorptivity using twin rings. Aus. J. Soil Res. 1982, 20, 295–304. [Google Scholar] [CrossRef]
  35. Cheng, L. A comparative analysis of two different methods for determining chlorides and sulfates in water. Ground Water 2018, 40, 86–87. [Google Scholar]
  36. LY/T 1245-1999; Determination of Exchangeable Calcium and Magnesium in Forest Soils. China Standards Press: Beijing: China, 1999.
  37. Ministry of Agriculture. Determination of Nitrogen in Forest Soil; Ministry of Agriculture: Beijing, China, 2015. [Google Scholar]
  38. Ministry of Agriculture. Phosphorus Determination Methods of Forest Soils; Ministry of Agriculture: Beijing, China, 2015. [Google Scholar]
  39. Lai, J.S.; Zou, Y.; Zhang, J.L.; Peres-Neto, P. Generalizing hierarchical and variation partitioning in multiple regression and canonical analysis using the rdacca.hp R package. Methods Ecol. Evol. 2022, 13, 782–788. [Google Scholar] [CrossRef]
  40. R Core Team. R: A Language and Environment for Statistical Computing; R Foundation for Statistical Computing: Vienna, Austria; Available online: https://www.R-project.org/ (accessed on 12 February 2024).
  41. Cavender-Bares, J.; Keen, A.; Miles, B. Phylogenetic structure of Floridian plant communities depends on taxonomic and spatial scale. Ecology 2006, 87, S109–S122. [Google Scholar] [CrossRef]
  42. Liu, Z.G. Specific Leaf Area in China: Variations and Control Mechanisms. Master’s Thesis, University of Chinese Academy of Sciences, Jilin, China, 2020. [Google Scholar]
  43. Liu, R.H.; Bai, J.L.; Bao, H.; Nong, J.L.; Zhao, J.J.; Jiang, Y.; Liang, S.C.; Li, Y.J. Variation and correlation in functional traits of main woody plants in the Cyclobalanopsis glauca community in the karst hills of Guilin, southwest China. J. Plant Ecol. 2020, 44, 828–841. [Google Scholar] [CrossRef]
  44. Liu, X.X.; Nan, X.N.; Zhang, G.J.; Li, B.W.; Xu, L.; Mu, R.L.; Li, L.; Yu, R.G. Relationship between species diversity and functional diversity of plant communities on different slopes in alpine meadow. Acta Ecol. Sin. 2021, 41, 5398–5407. [Google Scholar] [CrossRef]
  45. Wang, Y.; Zhang, L.; Chen, J.; Feng, L.; Li, F.; Yu, L. Functional diversity of plant communities in relationship to leaf and soil stoichiometry in karst areas of southwest China. Forests 2022, 13, 864. [Google Scholar] [CrossRef]
  46. Wang, Y.; Zhang, L.; Chen, J.; Feng, L.; Li, F.; Yu, L. Study on the relationship between functional characteristics and environmental factors in karst plant communities. Ecol. Evol. 2022, 12, e9335. [Google Scholar] [CrossRef] [PubMed]
  47. Aziz, I.; Khan, M.A. Experimental assessment of salinity tolerance of Ceriops tagal seedlings and saplings from the Indus delta, Pakistan. Aquat. Bot. 2001, 70, 259–268. [Google Scholar] [CrossRef]
  48. Xing, Y.; Deng, S.; Bai, Y.; Wu, Z.; Luo, J. Leaf functional traits and their influencing factors in six typical vegetation communities. Plants 2024, 13, 2423. [Google Scholar] [CrossRef]
  49. Hao, S.Y.; Zhou, R.; Xu, C.; Chen, T.C.; Rao, M.; Dai, X.Q.; Zhou, X.B. Association between exchangeable Calcium (Ca2+) and Magnesium (Mg2+) with other soil properties in tobacco planting area of northeast Chongqing. Soils 2023, 55, 288–294. [Google Scholar]
  50. Li, J.; Yang, X.C.; He, W.Z.; Wang, S.H. The effect of calcium-magnesium phosphate fertiliser application rates on acidified soil remediation and quality enhancement. South. Chin. Agri. 2025, 9, 11–14, 30. [Google Scholar]
  51. Ren, J.T.; Yang, K.M.; Chen, Q.L.; Mo, S.J.; Wang, Z.H. Evaluation on ecological security of land use landscape in Guizhou Caohai Wetland. Environ. Sci. Technol. 2018, 41, 158–165. [Google Scholar]
  52. Guo, C.; Sheng, M.Y.; He, Y.; Wang, L.J.; Shi, Q.L.; Luo, N.N. Effects of land use types on soil carbon, nitrogen, phosphorus stoichiometric characteristics and enzyme activities in the karst area of Southwest China. Chin. J. Soil Sci. 2023, 54, 382–391. [Google Scholar]
  53. Zhao, L.C.; Qin, A.Z.; Zhao, C.Z.; Duan, K.X.; Wang, J.W.; Wen, J. Responses of composition and functional traits of plant functional groups to different habitats in Jiayuguan Caohu Wetland. Acta Ecol. Sin. 2020, 40, 822–833. [Google Scholar] [CrossRef]
  54. Chapin, F.S.; Schulze, E.; Mooney, H.A. The Ecology and economics of storage in plants. Annu. Rev. Ecol. Evol. Syst. 1990, 21, 423–447. [Google Scholar] [CrossRef]
  55. Song, X.; Liu, Y.; Yu, D.; Li, S.; Gao, W.; Zeng, H.; Cao, D.; Zhou, S.; Cui, X. Environmental determinants of intraspecific variation in five functional traits of Pinus yunnanensis Franch. Front. Plant Sci. 2024, 15, 1501584. [Google Scholar] [CrossRef]
  56. Wu, L.; Chen, H.; Chen, D.; Wang, S.; Wu, Y.; Wang, B.; Liu, S.; Yue, L.; Yu, J.; Bai, Y. Soil biota diversity and plant diversity both contributed to ecosystem stability in grasslands. Ecol. Lett. 2023, 26, 858–868. [Google Scholar] [CrossRef]
  57. Wilson, P.J.; Thompson, K.; Hodgson, J.G. Specific leaf area and leaf dry matter content as alternative predictors of plant strategies. New Phytol. 1999, 143, 155–162. [Google Scholar] [CrossRef]
  58. Li, Y.J.; Zheng, J.M.; Wang, G.Z.; Zhou, J.X.; Liu, Y.G.; Ha, W.X. A study of functional traits of natural secondary forests and their influencing factors in different recovery stages in karst areas: A case study of Dahei Mountain, Yunnan Province. Acta Geol. Sin. 2021, 42, 397. [Google Scholar]
  59. Zhang, Z.K.; Zheng, X.X.; Lin, H.Z.; Lin, X.; Huang, L.Q. Summary of changes in plant functional traits and environmental factors in different recoveryal stages of Island plants. Acta Ecol. Sin. 2019, 39, 3749–3758. [Google Scholar]
  60. Güsewell, S. N: P ratios in terrestrial plants: Variation and functional significance. New Phytol. 2004, 164, 243–266. [Google Scholar] [CrossRef] [PubMed]
  61. Pérezharguindeguy, N.; Díaz, S.; Garnier, E. New handbook for standardised measurement of plant functional traits worldwide. Aust. J. Bot. 2013, 61, 167–234. [Google Scholar] [CrossRef]
Figure 1. Location of the Caohai study area and distribution of sampling points. (a) Map of China; (b) Map of Guizhou Province, China; (c) Map of Weining County, Guizhou Province, China; (d) Map of Caohai Wetland, Weining County, Guizhou Province, China. HYL—Huyelin, LLS—Luoluoshan, WJYZ—Wangjiayuanzi, LJX—Liujiaxiang, BM—Baima, ZJYZ—Zoujiayuanzi, and WJYT—Wujayantou.
Diversity 18 00260 g001
Figure 2. Interspecific variation in functional traits of dominant plant species in the Caohai wetland lakeshore. Data are presented as mean ± standard error (SE) (n = 3 per group). Different lowercase letters (e.g., a, b, c, d) above the bars indicate statistically significant differences at p < 0.05, as determined by one-way analysis of variance (ANOVA) followed by Tukey’s honestly significant difference (HSD) post hoc test for multiple comparisons. Groups sharing the same letter are not significantly different (p > 0.05), whereas groups with no common letters differ significantly (p < 0.05). Within each panel, sample groups are arranged from left to right in ascending order of mean values; the group with the lowest mean is labeled and groups with significantly higher means are labeled (A) group labeled with two letters (e.g., “ab”) indicates that it does not differ significantly from groups labeled either “a” or “b”. X-axis refers to dominant species. LW-Phragmites australis, DCJ-Onopordum acanthium, CZC-Galium odoratum, SHQ-Paspalum distichum. Trait abbreviations (AL) are defined in Table 2.
Diversity 18 00260 g002
Figure 3. Correlation matrix of plant functional traits for dominant species in the Caohai Wetland. Color intensity represents the strength and direction of Pearson correlation coefficients. Asterisks indicate significance levels (p < 0.05; p < 0.01; p < 0.001). * indicates p < 0.05, ** indicates p < 0.01, *** indicates p < 0.001. Trait abbreviations are defined in Table 2.
Diversity 18 00260 g003
Figure 4. Pearson correlation matrix of soil physicochemical properties in the Caohai lakeshore wetland. Asterisks denote significance levels (* p < 0.05, ** p < 0.01, *** p < 0.001). Soil factors abbreviations are defined in Table 3.
Diversity 18 00260 g004
Figure 5. A network relationships among plant functional traits, leaf nutrients, soil physicochemical properties, and soil factors. The nodes represent plant morphological traits (yellow), plant nutrients (purple), soil physicochemical properties (light green), and soil nutrients (pink). The edges indicate significant Pearson correlations (p < 0.05), with blue lines representing positive correlations and red lines representing negative correlations. Trait abbreviations are defined in Table 2. Soil factors abbreviations are defined in Table 3.
Diversity 18 00260 g005
Figure 6. RDA and significance test plots for the relationship between plant traits and soil factors. (a) Presents the redundancy analysis (RDA) of plant functional traits and environmental factors. The origin denotes the distribution of sample points; red vectors correspond to plant functional traits, while blue vectors represent soil factors. The x-axis and y-axis indicate the first and second RDA axes, respectively. (b) Illustrates the significance test results for soil factors, where ** denotes p < 0.01, * denotes p < 0.05, and ns indicates non-significance. Trait abbreviations are defined in Table 2. Soil factors abbreviations are defined in Table 3. The vertical axis lists environmental factors, and the horizontal axis represents the coefficient of determination.
Diversity 18 00260 g006
Figure 7. Analysis of variance plot for soil factors. The pink section denotes the unique explanatory power of soil nutrients, the blue section indicates the unique explanatory power of soil physicochemical properties, and the purple section represents the shared explanatory power of both factors. Soil factors abbreviations are defined in Table 3.
Diversity 18 00260 g007
Figure 8. Regression plots showing the relationship between key soil factors and key traits. Each subgraph illustrates the relationship between a single soil factor (x-axis) and a single leaf trait (y-axis). Scatter points represent individual observations, solid orange lines indicate the fitted linear regression lines, and light blue shaded areas depict the 95% confidence intervals of the regression lines. Regression statistics—including equations, R2 values, and p-values—are displayed in bold black font in the upper right corner of each subgraph. Significance levels are denoted by * denotes p < 0.05 and ns denotes not significant (p ≥ 0.05). Trait abbreviations are defined in Table 2. Soil factors abbreviations are defined in Table 3. All analyses were conducted using ordinary least squares linear regression.
Diversity 18 00260 g008
Table 1. Information of plant survey sampling sites in the lakeshore zone.
Site CodeSite NameLongitude (°)Latitude (°)LengthWidth
Y1ZZYZ104.26523726.85915210 m10 m
Y2WJYT104.22534626.86703810 m10 m
Y3LJX104.27812526.84204210 m10 m
Y4BM104.25801026.82271810 m10 m
Y5WJYZ104.22570626.82806010 m10 m
Y6HYL104.20323726.85275010 m10 m
Y7LLS104.20845626.84636110 m10 m
Table 2. Dominant plant species selected for functional trait analysis in the Caohai lakeshore wetland.
SpeciesFamilyGrowth HabitMean Coverage (%)
Phragmites australisPoaceaePerennial herb70
Onopordum acanthiumAsteraceaeBiennial herb75
Galium odoratumRubiaceaePerennial herb60
Paspalum distichumPoaceaePerennial herb60
Table 3. Plant functional traits measured, their units, and measurement protocols.
Trait (Abbrev.)UnitMeasurement Protocol
Chlorophyll content (CHL)SPADUsing the (SPAD-LD-YA) portable chlorophyll meter (Shandong Laide Intelligent Technology Co., Ltd., Shandong, China), measurements were taken at three randomly selected locations along the leaf midrib, avoiding the main vein itself. The average of the three readings was recorded as the chlorophyll content.
Leaf Thickness (LT)mmMeasurements were taken using a digital micrometer (DELIXI, Delixi Electrical Appliances Co., Ltd. Yueqing, China) with an accuracy of 0.001 mm. Three random locations were selected along the leaf blade, avoiding the midrib, and the average of three measurements was recorded as the leaf thickness.
Leaf Area (LA)cm2Measured the leaf area of each leaf using a leaf area meter (Yaxin-1241, Beijing Yaxin Li Yi Technology Co., Ltd., Beijing, China).
Leaf Length (LL)mmMeasured the length of each leaf using a leaf area meter (Yaxin-1241, Beijing Yaxin Li Yi Technology Co., Ltd., Beijing, China).
Leaf dry Matter Content (LDMC)mg/gSelected representative leaves to remove impurities and weigh their fresh weight. Deactivated the leaves at 105 °C for 30 min, then dried them at 80 °C until they reached a constant weight. The ratio of dry weight to fresh weight represents the dry leaf weight (Model: YT1004, Kunshan Youkewei Electronic Technology Co., Ltd., Suzhou, China).
Specific Leaf Area (SLA)cm2/gSLA = LA/LDMC
Plant Leaf Carbon Content (PCC)mg/gMeasured via elemental analyzer on oven-dried, pulverized leaf material.
Plant Leaf Nitrogen Content (PNC)mg/gMeasured via elemental analyzer on oven-dried, pulverized leaf material.
Plant Leaf Phosphorus Content (PPC)mg/gMeasured via elemental analyzer on oven-dried, pulverized leaf material.
Plant Carbon-to-Nitrogen Ratio (PCN)%Calculated as PCC/PNC.
Plant Carbon-to-Phosphorus Ratio (PCP)%Calculated as PCC/PPC.
Plant Nitrogen-to-Phosphorus Ratio (PNP)%Calculated as PNC/PPC.
Table 4. Descriptive statistics of soil physicochemical properties in the Caohai lakeshore wetland (n = 7).
Soil Property (Abbrev.)Mean ± SDMaximumMinimumCoefficient of Variation, CV (%)
Bulk density, BD (g/cm3)1.28 ± 0.081.45 1.11 6.54
Saturated hydraulic conductivity, SHC (d/cm2)0.09 ± 0.050.28 0.04 55.02
Soil water content, SPMC (%)13.62 ± 2.5818.53 10.53 18.97
Redox potential, ORP (mV)551.34 ± 24.01602.20 507.70 4.36
pH6.62 ± 0.427.02 5.52 6.32
Soil organic matter, SOM (g/kg)31.23 ± 9.6154.28 7.34 30.78
Total nitrogen, TN (g/kg)1.92 ± 0.392.76 1.13 20.12
Total phosphorus, TP (g/kg)0.56 ± 0.090.81 0.42 16.87
Total potassium, TK (g/kg)16.07 ± 2.1120.40 10.92 13.12
Available potassium, PC (g/kg)0.22 ± 0.070.37 0.07 33.43
Water drainage rate, WDR (%)0.74 ± 0.040.81 0.67 5.98
Chloride content, CHC (mg/kg)23.92 ± 13.2461.96 9.12 55.34
Calcium, Ca (mg/kg)225.05 ± 151.26566.00 19.90 67.21
Magnesium, Mg (mg/kg)12.74 ± 10.1336.53.179.53
Disclaimer/Publisher’s Note: The statements, opinions and data contained in all publications are solely those of the individual author(s) and contributor(s) and not of MDPI and/or the editor(s). MDPI and/or the editor(s) disclaim responsibility for any injury to people or property resulting from any ideas, methods, instructions or products referred to in the content.