Article

Seasonal Plasticity of Trophic Niches and Food Web Architecture in a Newly Constructed Regulation Reservoir


1
School of Life and Environmental Science, Hangzhou Normal University, Hangzhou 311121, China
2
Zhejiang Provincial Key Laboratory of Wetland Intelligent Monitoring and Ecological Restoration, Hangzhou 311121, China
3
Zhejiang-Canada Joint Laboratory on Biodiversity and Global Change, Hangzhou 311121, China
4
Hangzhou Municipal Reservoir Management Service Center, Hangzhou 311122, China
5
Department of Biology, Queen’s University, Kingston, ON K7L 3N6, Canada
*
Authors to whom correspondence should be addressed.
Diversity 2026, 18(5), 248; https://doi.org/10.3390/d18050248
Submission received: 16 March 2026 / Revised: 16 April 2026 / Accepted: 20 April 2026 / Published: 23 April 2026
(This article belongs to the Special Issue Aquatic Biodiversity and Habitat Restoration)

Abstract

Newly constructed regulation reservoirs experience dramatic seasonal environmental shifts, yet the temporal dynamics of their aquatic food webs remain poorly understood. In this study, we investigated the seasonal variations in fish community structure and trophic niches in Xianlin Reservoir (Zhejiang, China) using catch surveys and stable isotope analysis (δ13C and δ15N). Our results revealed that the fish assemblage was persistently dominated by the non-native fish Lepomis macrochirus and the native Xenocypris argentea. Community-wide isotopic metrics, calculated via SIBER, demonstrated pronounced seasonal plasticity in the trophic architecture. During winter, driven by limited basal resources, the community exhibited a “dietary expansion” strategy, resulting in the longest vertical food chain, the broadest core isotopic niche area (SEAc = 16.33), and the lowest trophic redundancy (indicated by the highest mean nearest neighbor distance). Conversely, the spring community displayed a highly compressed trophic structure characterized by dense species packing and maximum redundancy. These findings highlight that the reservoir food web exhibits a reduced functional buffering capacity during winter due to weak functional substitutability among high-trophic-level species. Given the ongoing community assembly in this newly constructed reservoir, the system is potentially more susceptible to seasonal environmental perturbations.

1. Introduction

A reservoir is an artificial water storage basin formed by constructing a dam across a river or valley [1]. Combining the characteristics of both lakes and rivers, reservoirs represent semi-artificial, semi-natural aquatic ecosystems [2,3]. They serve multiple essential functions, including flood control, water supply, irrigation, and hydropower generation, while also providing critical habitats for diverse aquatic organisms [4,5,6,7,8,9]. However, dam construction fundamentally alters the hydrological regime, sediment transport, and water quality of the original river system, creating distinct limnological characteristics [10]. This transition from a lotic (flowing) to a lentic (still) environment substantially impacts the composition, diversity, and productivity of aquatic communities, ultimately reshaping the food web structure. Specifically, slowed water currents, expanded surface areas, and increased sediment deposition strongly favor fish species adapted to still waters, while impeding the survival and migration of rheophilic (riverine) species [11,12,13,14,15]. Such fundamental shifts in species composition inevitably lead to the reorganization of the fish trophic structure, which dictates the pathways of energy flow and material cycling within the ecosystem [16]. Therefore, understanding the trophic structure of reservoir fish assemblages is crucial for grasping ecosystem complexity and predicting their response mechanisms to environmental changes [17,18].
To accurately depict these complex trophic interactions, stable isotope analysis (SIA), particularly of carbon (δ13C) and nitrogen (δ15N), has become a prevalent and robust methodology approach [19]. While δ13C is typically used to trace the basal sources of dietary carbon, δ15N provides a continuous estimate of trophic positions [20]. Beyond delineating simple linear food chains, advanced community-wide metrics based on SIA have been developed to quantify the multidimensional characteristics of food webs. For instance, the quantitative metrics proposed by Layman et al. [21] allow ecologists to evaluate trophic diversity and functional redundancy by measuring the dispersion of species within the isotopic space. Furthermore, Bayesian approaches such as SIBER (Stable Isotope Bayesian Ellipses in R) [22] and nicheROVER [23] have significantly enhanced the robustness of these metrics against sample size variations, enabling precise quantification of isotopic niche widths and interspecific niche overlaps across different ecosystems or temporal scales.
Despite the widespread application of SIA in aquatic ecology, traditional surveys in reservoirs have predominantly focused on static community structure, species diversity, and spatial distribution. The temporal dynamics—particularly the seasonal shifts in trophic niches and food web topology—remain insufficiently explored [19,24]. In newly constructed regulation reservoirs, environmental conditions such as water temperature, water levels, and primary productivity fluctuate dramatically across seasons, driving massive variations in basal resource availability. According to optimal foraging theory, fish may exhibit dietary expansion or contraction in response to these seasonal resource pulses, thereby altering the overall trophic redundancy and structural stability of the community. However, empirical evidence mapping these seasonal adaptive strategies in reservoir ecosystems remains scarce.
To bridge this knowledge gap, this study investigates the seasonal patterns of trophic diversity and food web characteristics in Xianlin Reservoir, a vital regulation reservoir in Zhejiang Province, China. The specific objectives of this research are to: (1) characterize the seasonal variation in species composition (with particular attention to non-native species) and the trophic level spectrum of the biological community; (2) quantify the seasonal dynamics of isotopic niche breadth and trophic redundancy using community-wide SIA metrics; and (3) elucidate the adaptive foraging strategies of the fish assemblage in response to seasonal environmental changes. By mapping the seasonal trophic architecture, this study provides critical theoretical support for the conservation of fisheries resources, the monitoring of non-native species, and the maintenance of long-term ecological stability in reservoir ecosystems.

2. Materials and Methods

2.1. Study Area

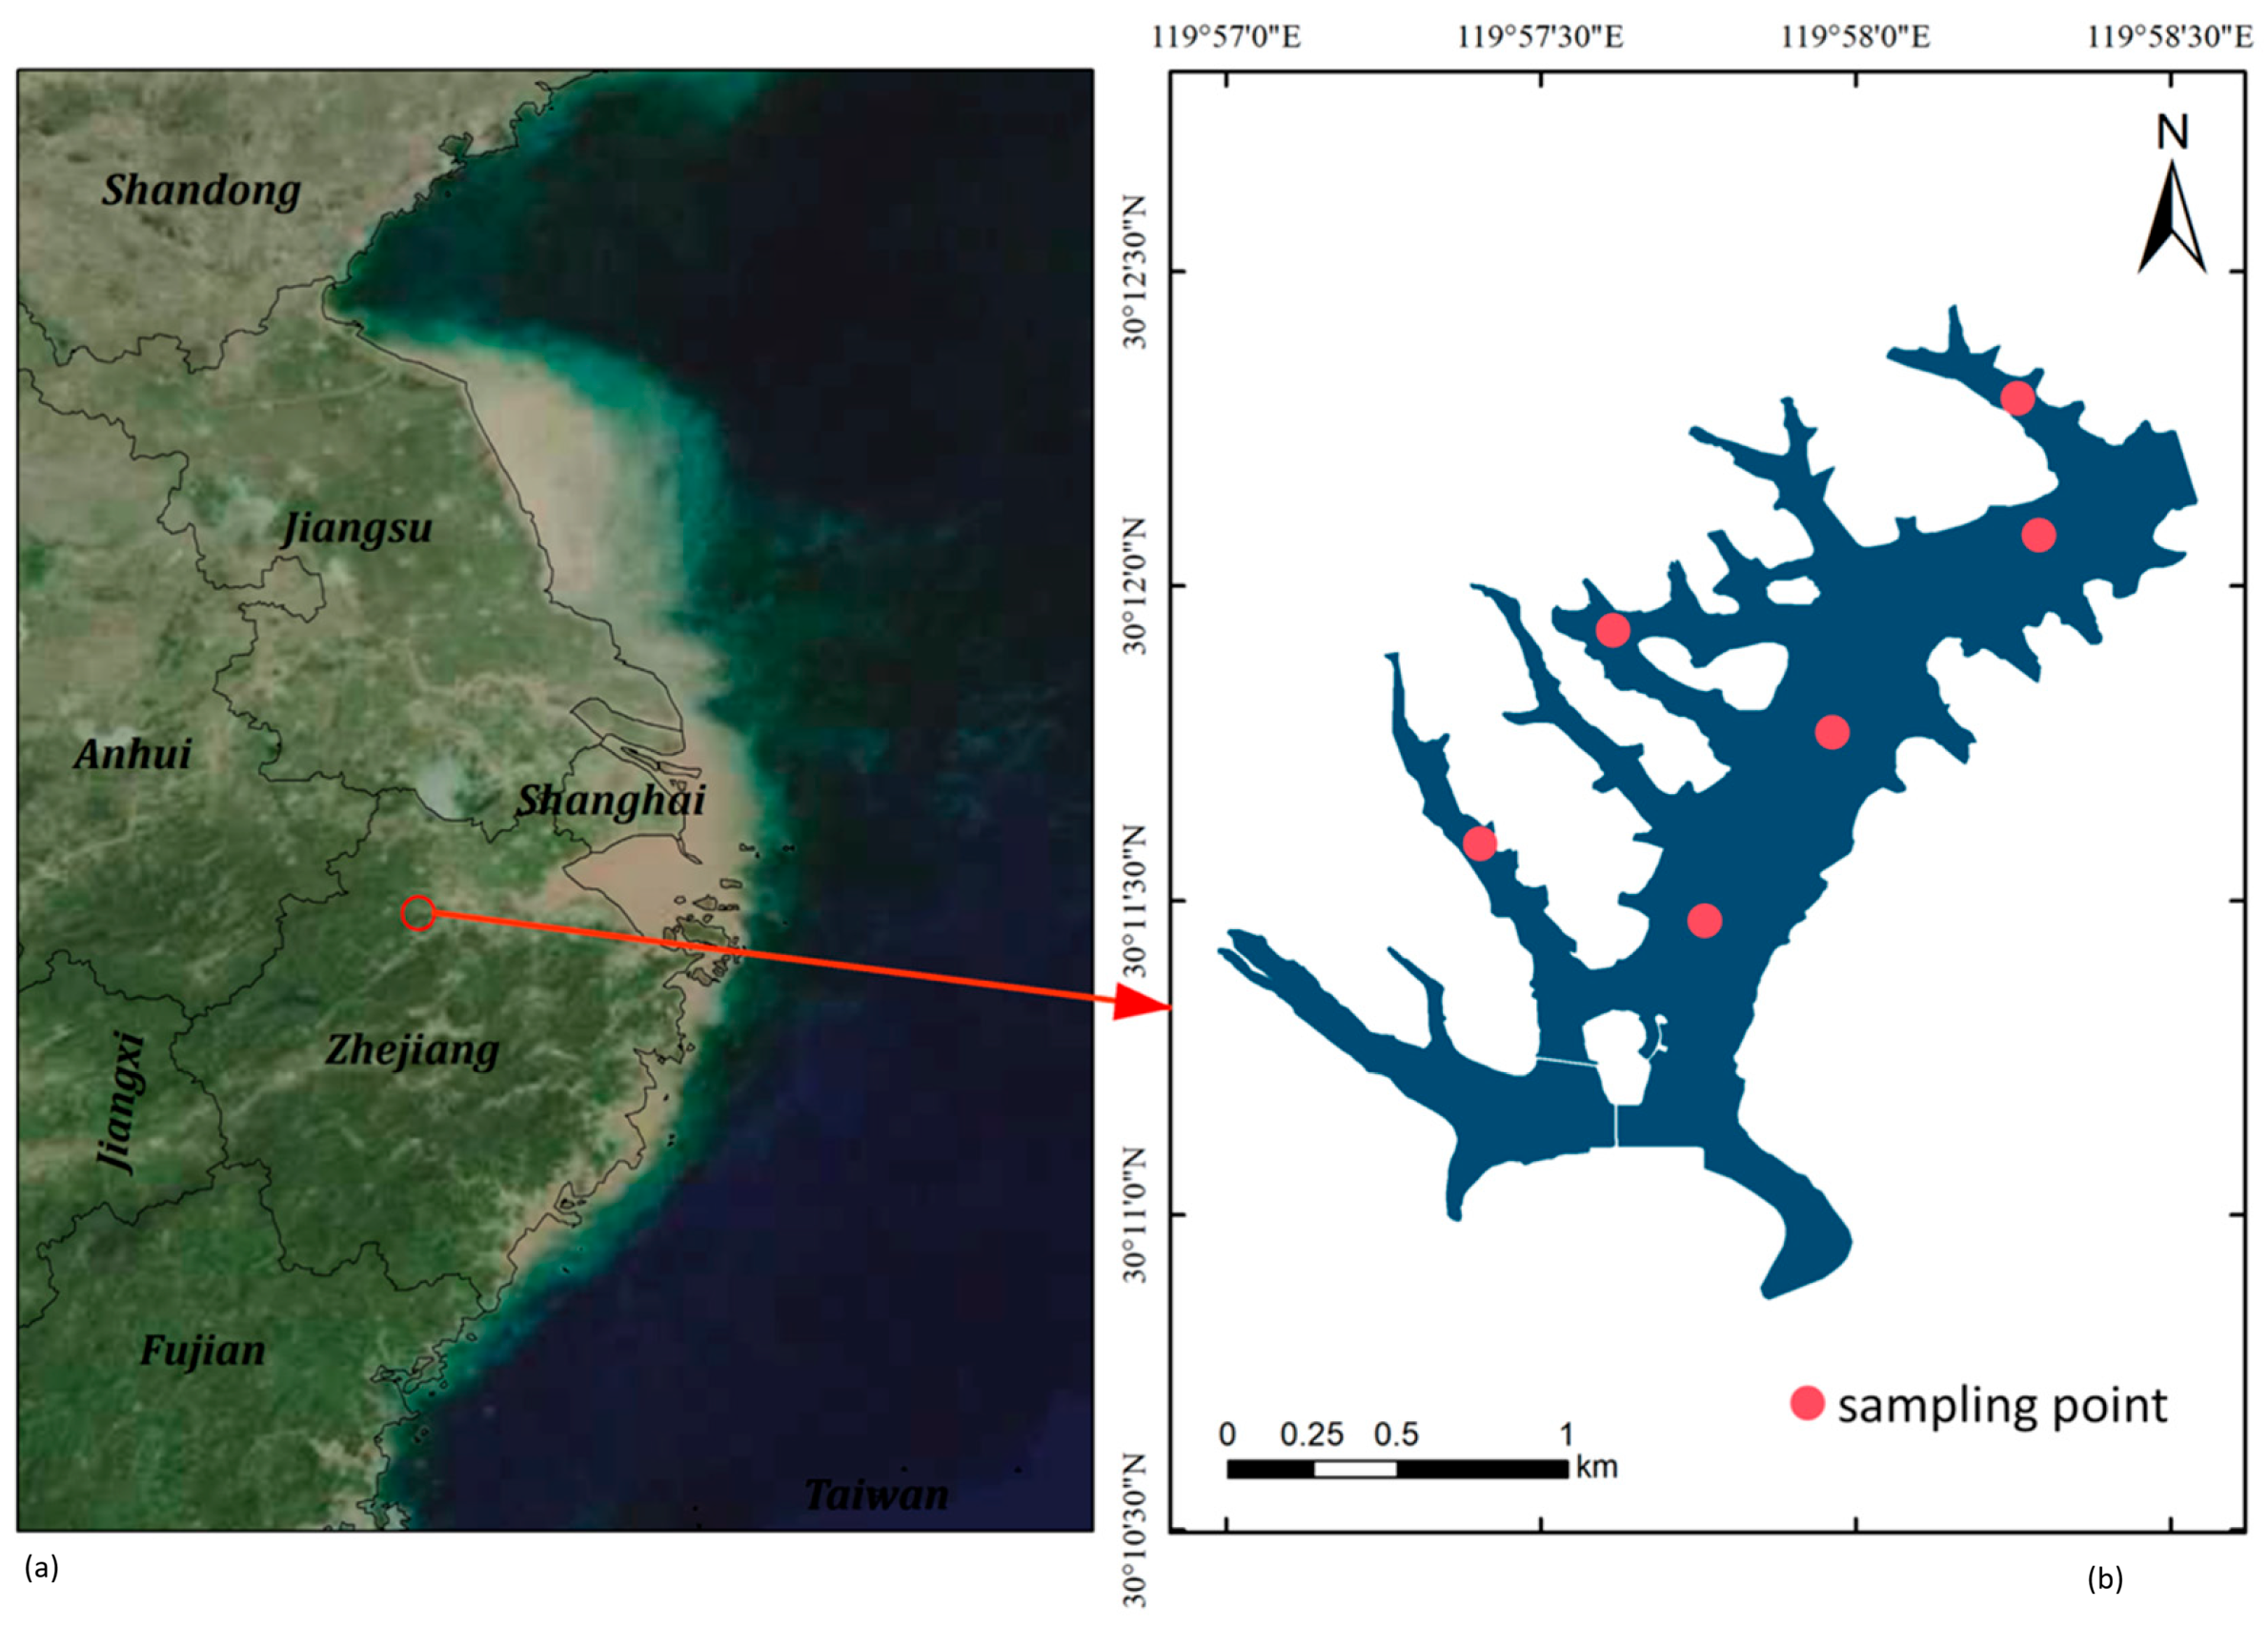
Xianlin Reservoir, located in Yuhang District, Hangzhou City (Figure 1), within the Shangbu River basin, serves as a critical emergency backup water source for Hangzhou and a regulating reservoir for the Qiandao Lake Water Distribution Project. Its primary functions include emergency water supply, saline intrusion control, flood prevention, and water environment improvement [25]. Construction of the reservoir commenced in August 2010, followed by impoundment in April 2016 and full completion in December 2017. The reservoir encompasses a catchment area of 16.89 km2 and a total storage capacity of approximately 19.8 million m3, providing a water supply capacity of about 17.9 million m3 [25,26].
Hangzhou relies primarily on the Qiantang River and Dongtiao Creek for its water supply, which face threats from sudden water pollution and saline intrusion [25]. To mitigate these risks and enhance the safety of drinking water sources, the Qiandao Lake Water Diversion Project was implemented to achieve a multi-source water supply [27]. Within this network, Xianlin Reservoir plays a vital regulatory role: it reduces pressure in water conveyance tunnels during periods of abundant inflow and supplements the system during deficits to prevent distribution wells from running dry, thereby ensuring operational stability [28]. As the terminal receiving station and a key storage hub, the operational safety and water quality of Xianlin Reservoir directly impact the regional water supply network. Consequently, dynamic monitoring of this reservoir’s ecosystem is a critical component of regional water security and environmental protection.
Figure 1. Map showing the geographical location of Xianlin Reservoir and the distribution of sampling sites. (a) Location of Xianlin Reservoir (red circle) within Zhejiang Province, China. (b) Detailed bathymetric map of the reservoir showing the spatial arrangement of the six sampling sites.
Diversity 18 00248 g001

2.2. Sampling

2.2.1. Field Surveys and Fish Sampling

Comprehensive biological surveys were conducted quarterly at Xianlin Reservoir to capture seasonal variations in the aquatic community. Sampling sessions were carried out in summer (26–28 August 2024), autumn (11–16 November 2024), winter (6–10 January 2025), and spring (10–13 April 2025).
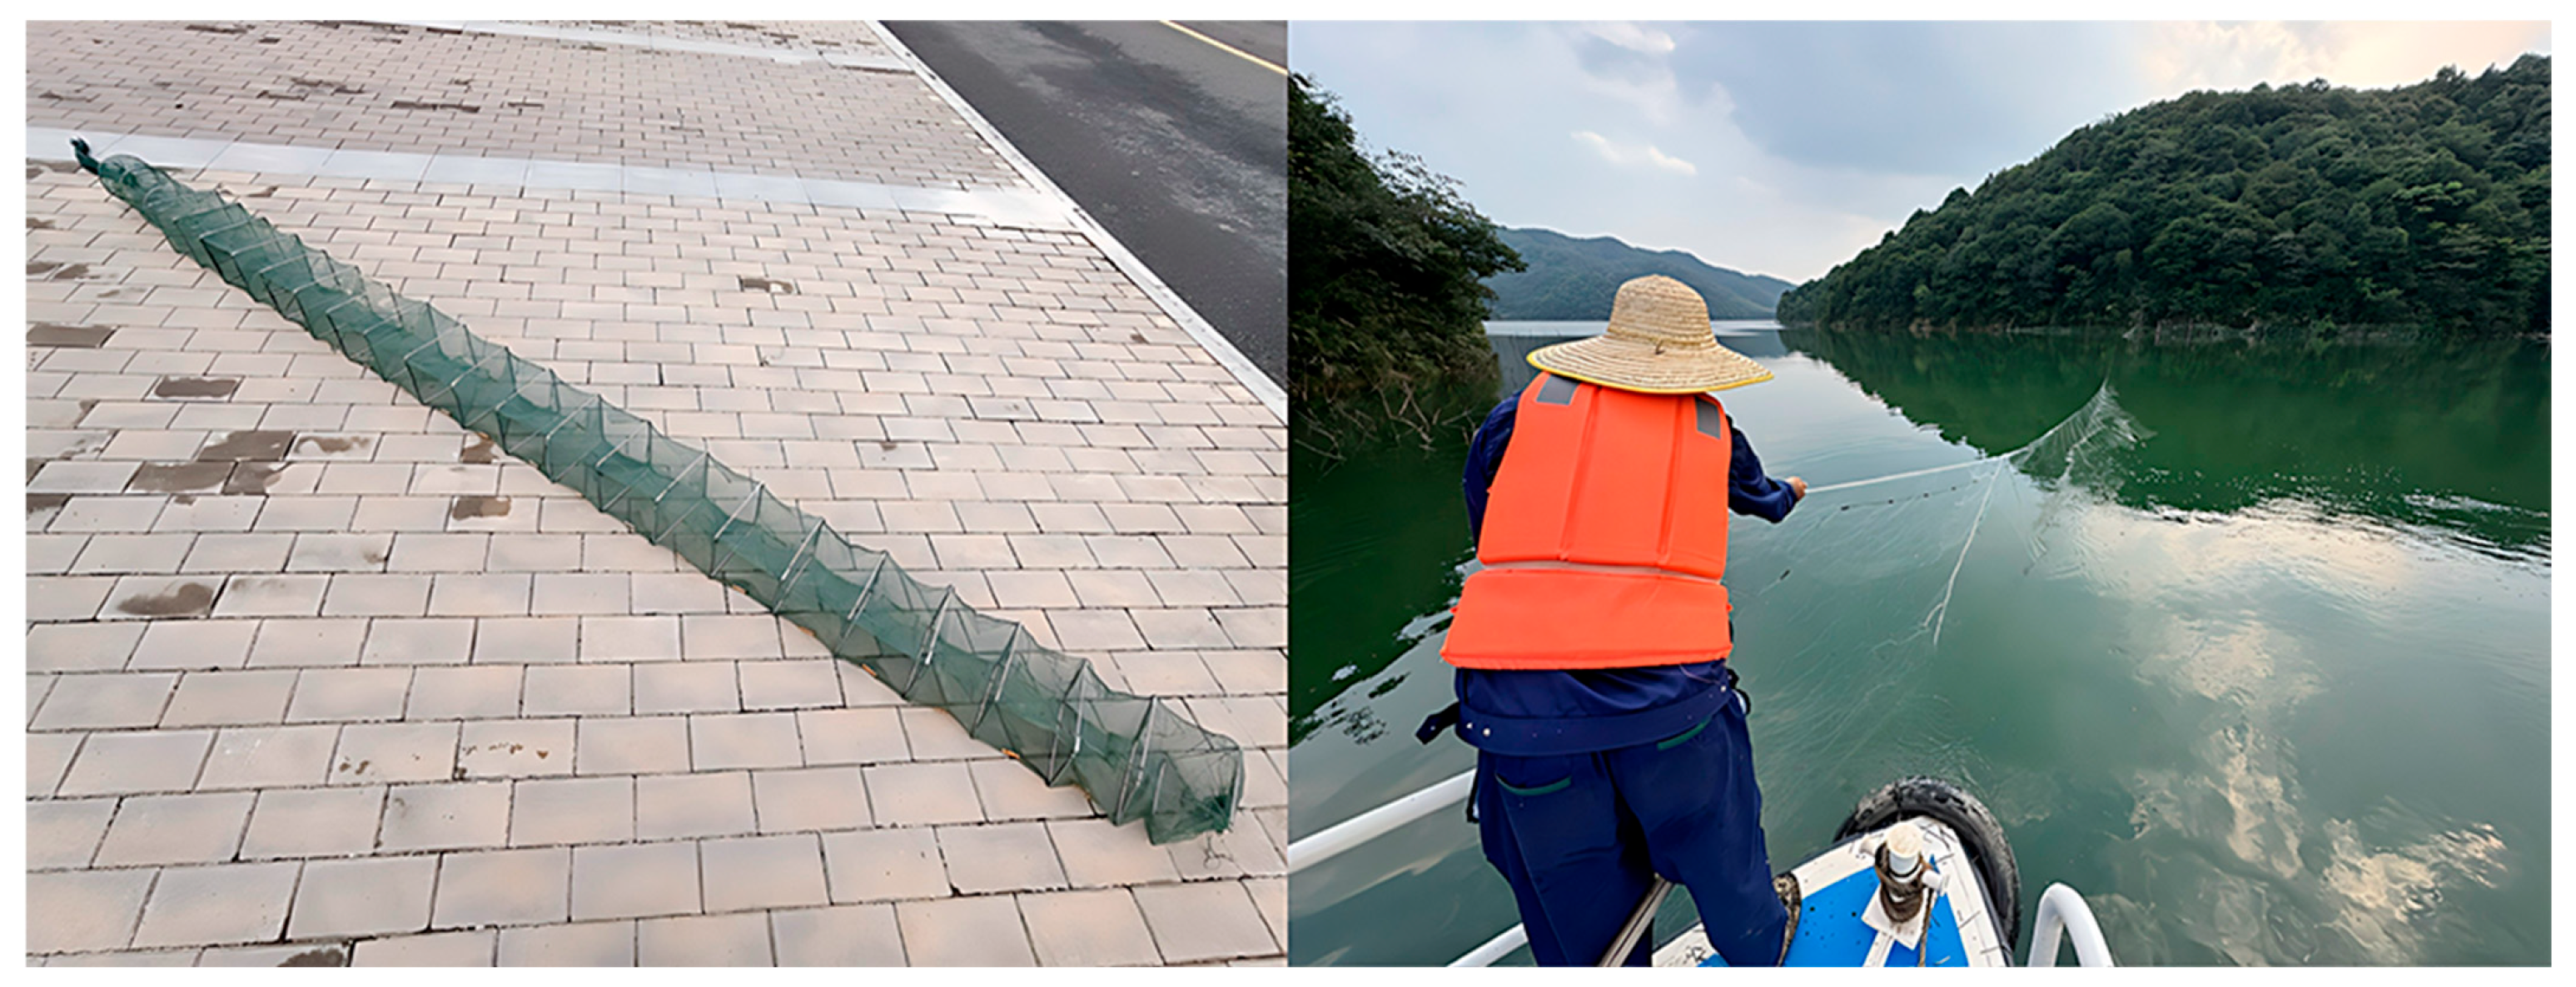
Fish specimens were collected using a combination of multi-mesh gillnets and ground cages (trap cages) (Figure A1) to ensure representative sampling across different water layers and habitat types. Multi-mesh gillnets, each measuring 100 m in length and 5 m in height with four distinct mesh sizes (4, 6, 8, and 10 cm), were deployed primarily to target pelagic and semi-pelagic fish species. Ground cages (6.5 m × 0.25 m × 0.30 m, with a 0.4 cm mesh size across 25 compartments) were utilized to capture small benthic fish and invertebrates. Upon retrieval, all captured specimens were immediately placed on ice and transported to the laboratory. Species identification was performed to the lowest possible taxonomic level, and standard length (to the nearest 0.1 cm) and wet body weight (to the nearest 0.1 g) were recorded.
To achieve a holistic representation of the reservoir’s trophic structure and capture the full functional breadth of the fish community, stable isotope analysis was performed on all collected species, including those with lower abundances, rather than focusing solely on dominant taxa. We prioritized community completeness to ensure that rare but potentially functionally distinct species were integrated into the food web architecture. The detailed distribution of sample sizes (n) for each analyzed species across the four seasons is explicitly provided in Appendix A Table A1.

2.2.2. Collection of Basal Food Sources

Particulate organic matter (POM) was obtained by collecting 3 L surface water samples from various sampling points; these samples were subsequently filtered through pre-combusted (450 °C for 12 h) Whatman GF/F glass fiber filters, with three filters constituting one composite sample and three replicates collected per season. Sediment organic matter (SOM) was acquired using a 1/16 m2 Peterson grab sampler to collect surface sediments, also with three replicates per season. Epiphytic algae were gently scraped from submerged surfaces, such as rocks and artificial substrates, using a spoon and rinsed with distilled water. Aquatic plants dominant in the littoral zone were manually harvested using stainless steel scissors and thoroughly rinsed with distilled water to remove attached impurities, while floating aquatic leaf litter (e.g., dead branches and fallen leaves) was manually collected from the reservoir surface. Additionally, benthic mollusks and crustaceans, representing key primary consumers, were collected simultaneously using the aforementioned ground cages.

2.3. Laboratory Analysis

Muscle tissues were extracted from the dorsal region of fish, the abdomen of shrimp, and the adductor muscles of bivalves. Samples were rinsed with distilled water and dried in an oven at 60 °C for 48 h. The dried tissues were then ground into a homogeneous powder using a mortar and pestle, passed through a 60-mesh screen, and stored in 2 mL centrifuge tubes within a desiccator prior to isotope analysis.
Stable carbon and nitrogen isotope ratios were determined using an elemental analyzer coupled to an isotope ratio mass spectrometer (EA-IRMS; Sercon Integra 2, Sercon Ltd., Crewe, UK) at the Geochemistry and Isotope Laboratory of the Third Institute of Oceanography, Ministry of Natural Resources, China. Isotope values are expressed in delta (δ) notation as parts per thousand (‰) using the following equation: δX = (Rsample/Rstandard − 1) × 103, where X is 13C or 15N, and R is the ratio of the heavy to light isotope 13C/12C or 15N/14N. The standard reference materials for δ13C and δ15N were Vienna Pee Dee Belemnite (VPDB) and atmospheric N2, respectively. Analytical precision was ±0.2‰ for both isotopes.
To account for lipid effects on carbon isotope values, samples with a C:N mass ratio greater than 3.5 were mathematically lipid-corrected using the following equation [29,30]: δ13Cnormalized = δ13Cuntreated − 3.32 + 0.99 × (C:N). The δ13Cnormalized values were utilized in all subsequent data analyses.

2.4. Data Analysis

Trophic positions (TP) of the consumers were calculated using the following equation [31,32]: TP consumer = [(δ15N consumer − δ15N baseline)/TEF] + λ, where δ15N consumer is the nitrogen isotope ratio of the consumer, δ15N baseline is the nitrogen isotope ratio of the designated baseline organism, TEF is the trophic enrichment factor (assumed as 3.4‰ for nitrogen), and λ represents the trophic level of the baseline organism (e.g., λ = 1 for primary producers or λ = 2 for primary consumers).
The community-wide metrics proposed by Layman et al. [21] were employed to characterize the trophic structure of the fish assemblages across seasons. These metrics, derived from the spatial distribution of species within a two-dimensional δ13C-δ15N coordinate system, quantitatively describe trophic diversity and redundancy. Six specific indices were calculated: (1) Nitrogen range (NR), indicating the vertical length of the food web; (2) Carbon range (CR), reflecting the diversity of basal resources; (3) Total area (TA) of the convex hull encompassing all species, representing the overall isotopic niche breadth; (4) Mean distance to centroid (CD), measuring the average trophic diversity; (5) Mean nearest neighbor distance (MNND), assessing the density of species packing (lower values indicate higher trophic redundancy); and (6) Standard deviation of nearest neighbor distance (SDNND), reflecting the evenness of species distribution within the niche space [20].
Since the TA is highly sensitive to sample size, the corrected standard ellipse area (SEAc) was calculated using the SIBER package (version 2.1.9) in R statistical software (version 4.3.1) [22]. SEAc encapsulates the core isotopic niche of the community (typically containing 40% of the data) and allows for robust comparisons of niche breadth across different seasons despite varying sample sizes [20]. Comparisons of these community-wide metrics (SEAc and Layman metrics) across seasons were based on observed point estimates to identify ecological trends, rather than formal Bayesian hypothesis testing, to avoid potential biases under uneven sample sizes.
Prior to statistical comparisons, the normality of the isotopic data and the homogeneity of variance were evaluated using Shapiro–Wilk and Levene’s tests, respectively. As the data did not meet the assumptions for parametric testing, the non-parametric Kruskal–Wallis H test was employed to examine seasonal and inter-specific differences in individual δ13C and δ15N values. When significant differences were detected, Dunn’s post hoc test with Bonferroni correction was applied for pairwise comparisons. The NMDS ordination and alpha diversity calculations were performed using the vegan package (version 2.6-4). Differences were considered statistically significant at p < 0.05. All data analyses and visualizations were conducted using R software (version 4.3.1).

3. Results

3.1. Isotopic Signatures of the Biological Community

During the study period, a total of 1338 fish specimens representing 19 species, 18 genera, and 8 families were collected from Xianlin Reservoir. Among them, the species with the highest relative importance index are Lepomis macrochirus (Bluegill) and Xenocypris argentea (Table A2). From these, 214 samples (16.0% of all) covering the fish species were selected for stable isotope analysis. Notably, both the composition and abundance of the sampled fish exhibited distinct seasonal variations (Table A1).
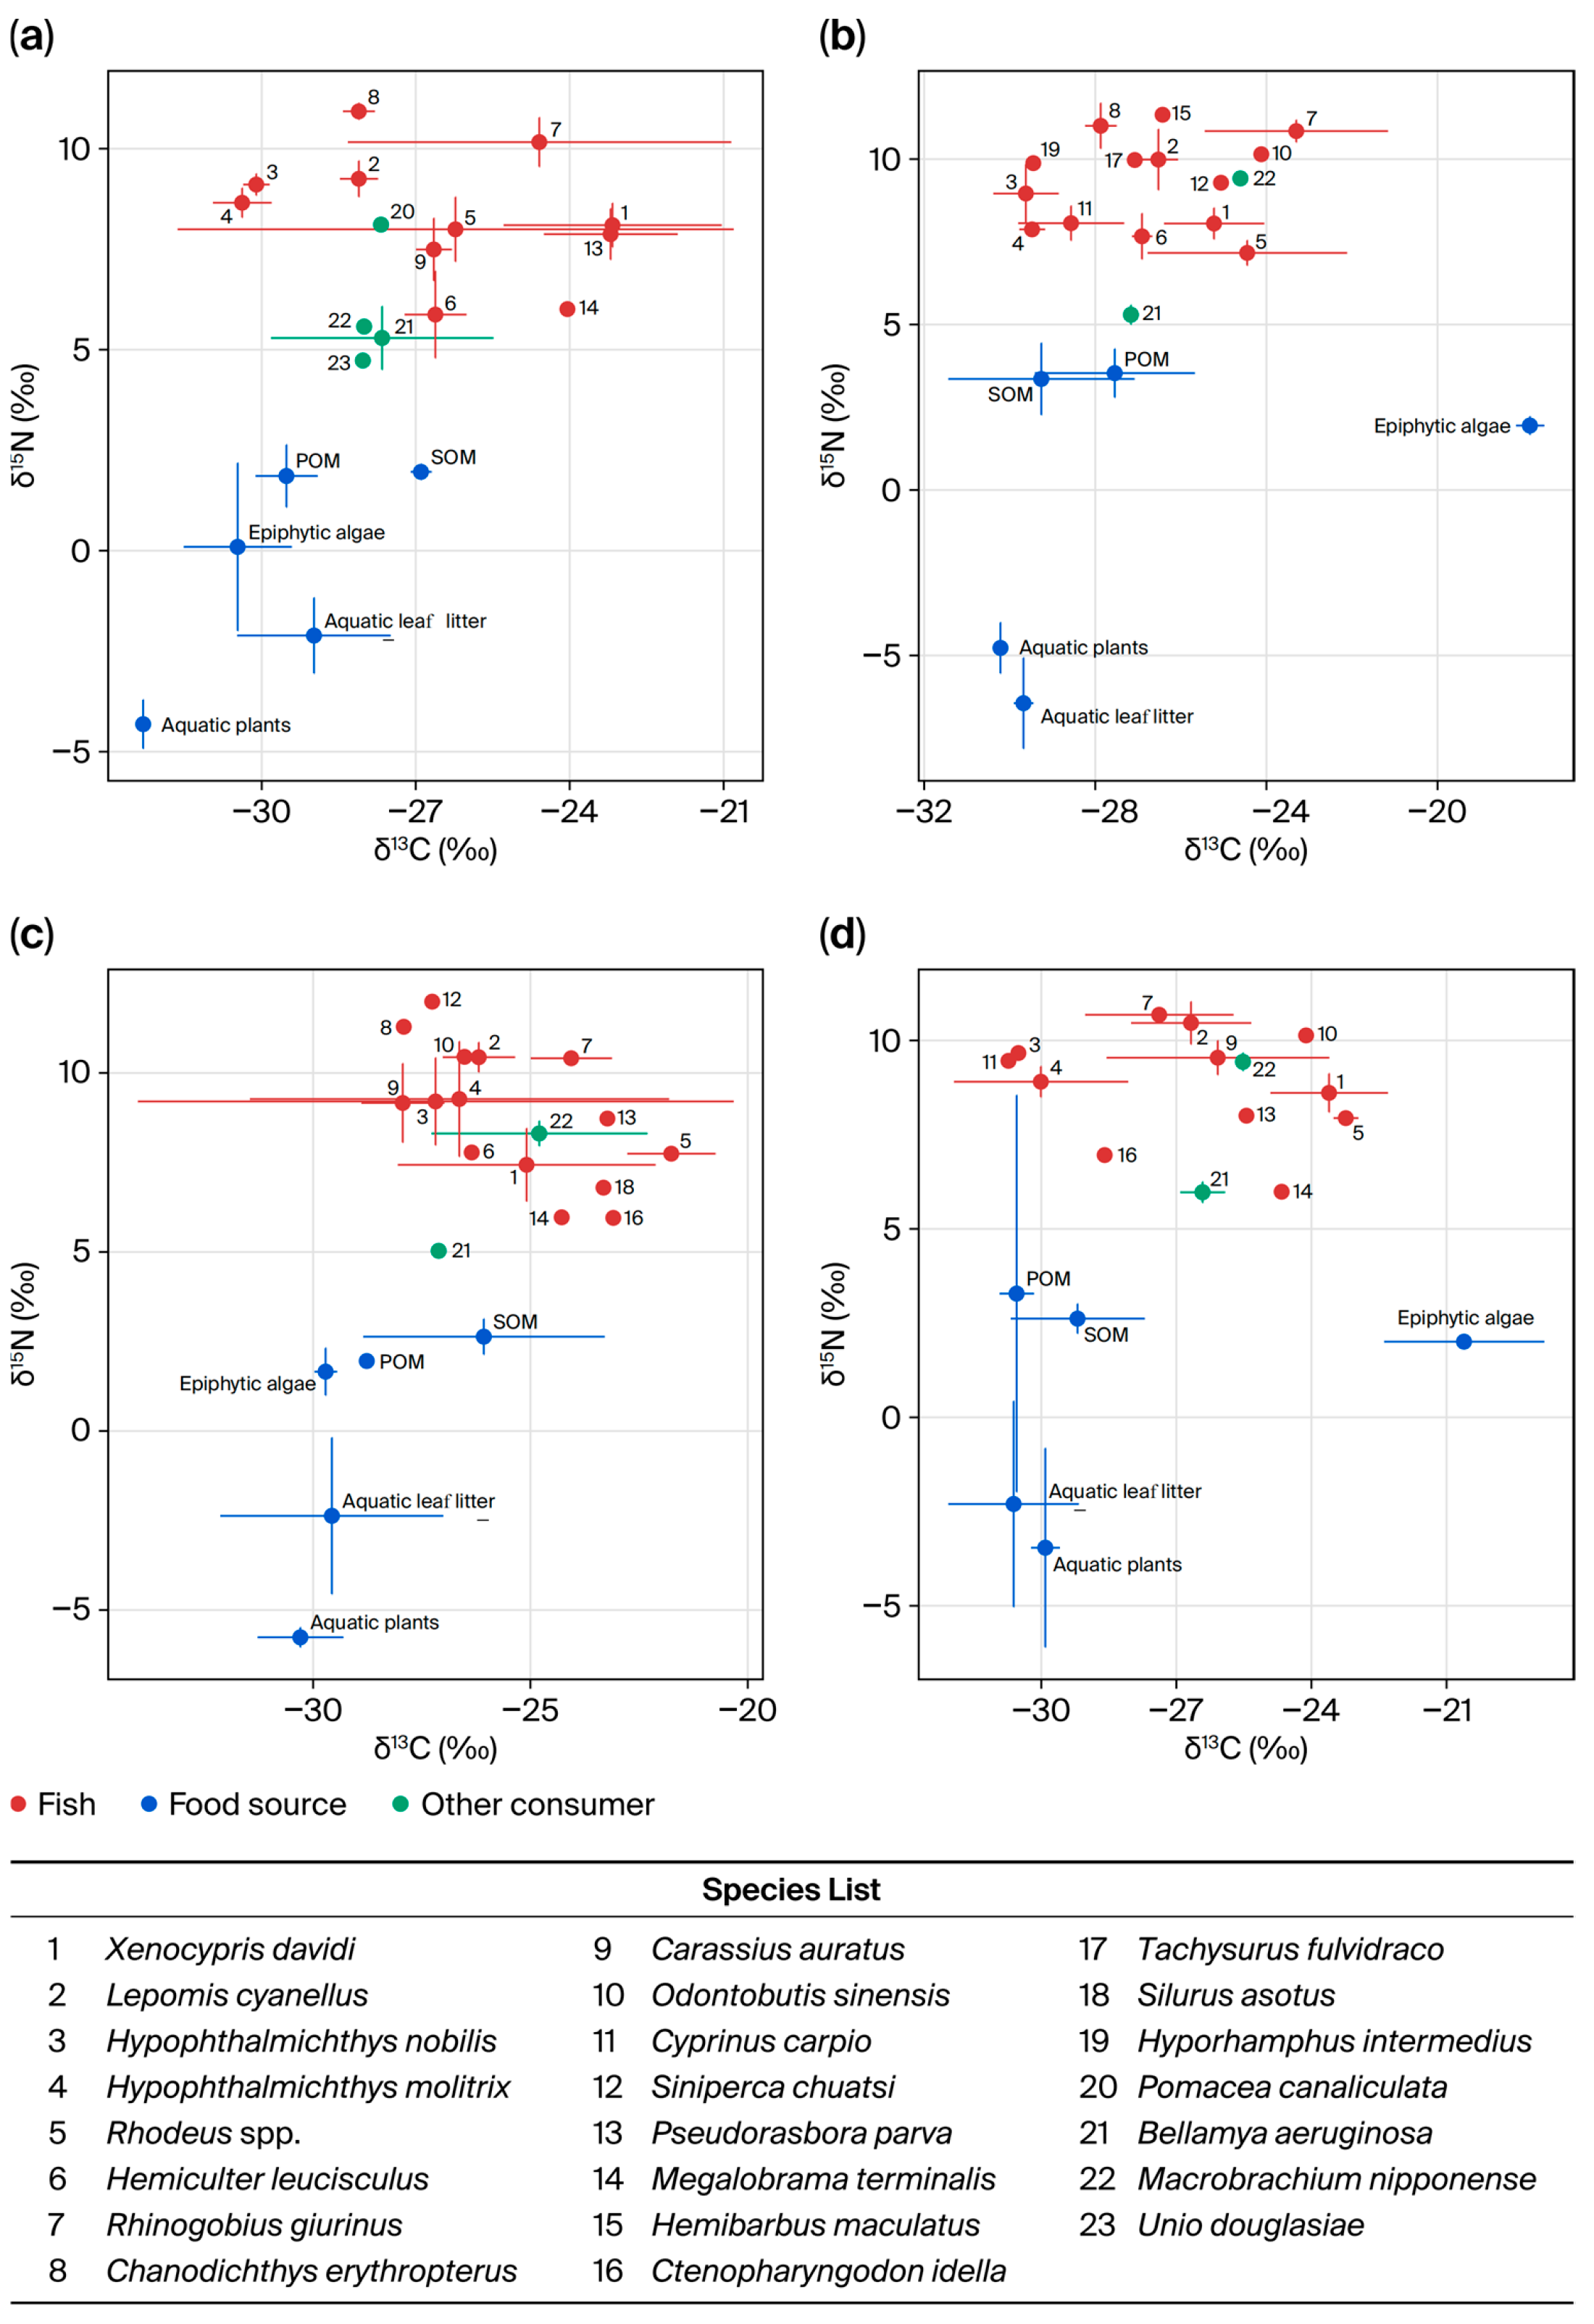
Significant seasonal fluctuations were observed in the nitrogen (δ15N) values of the fish community (Kruskal–Wallis H test, H = 11.071, p = 0.011). In contrast the carbon (δ13C) values showed no significant to overall seasonal differences (H = 5.125, p = 0.163). Overall, fish δ13C values ranged from −30.73‰ to −23.09‰, while δ15N values ranged from 5.87‰ to 11.99‰ (Figure 2). In summer, isotopic signatures exhibited distinct extremes; δ13C values varied from −30.38‰ (Hypophthalmichthys molitrix) to −23.17‰ (Xenocypris davidi), whereas δ15N values ranged from 6.01‰ (Megalobrama terminalis) to 10.93‰ (Chanodichthys erythropterus). Moving to autumn, the carbon spectrum shifted slightly, ranging from −29.62‰ (H. molitrix) to −23.30‰ (Rhinogobius giurinus), with nitrogen values extending from 7.16‰ (Rhodeus spp.) to a maximum of 11.34‰ observed in Hemibarbus maculatus.
During winter, the community displayed a carbon range of −27.94‰ (Carassius auratus) to −23.09‰ (Ctenopharyngodon idella), while nitrogen isotopes spanned from 5.95‰ (C. idella) to the highest trophic level of 11.99‰ (Siniperca chuatsi). Finally, spring recorded the widest variation in carbon sources, spanning from −30.73‰ (Cyprinus carpio) to −23.24‰ (Rhodeus spp.), accompanied by a nitrogen range of 5.99‰ (M. terminalis) to 10.68‰ (R. giurinus). These variations underscore the seasonal plasticity in the feeding ecology of the reservoir’s fish assemblage.

3.2. Trophic Positions and Food Chain Length

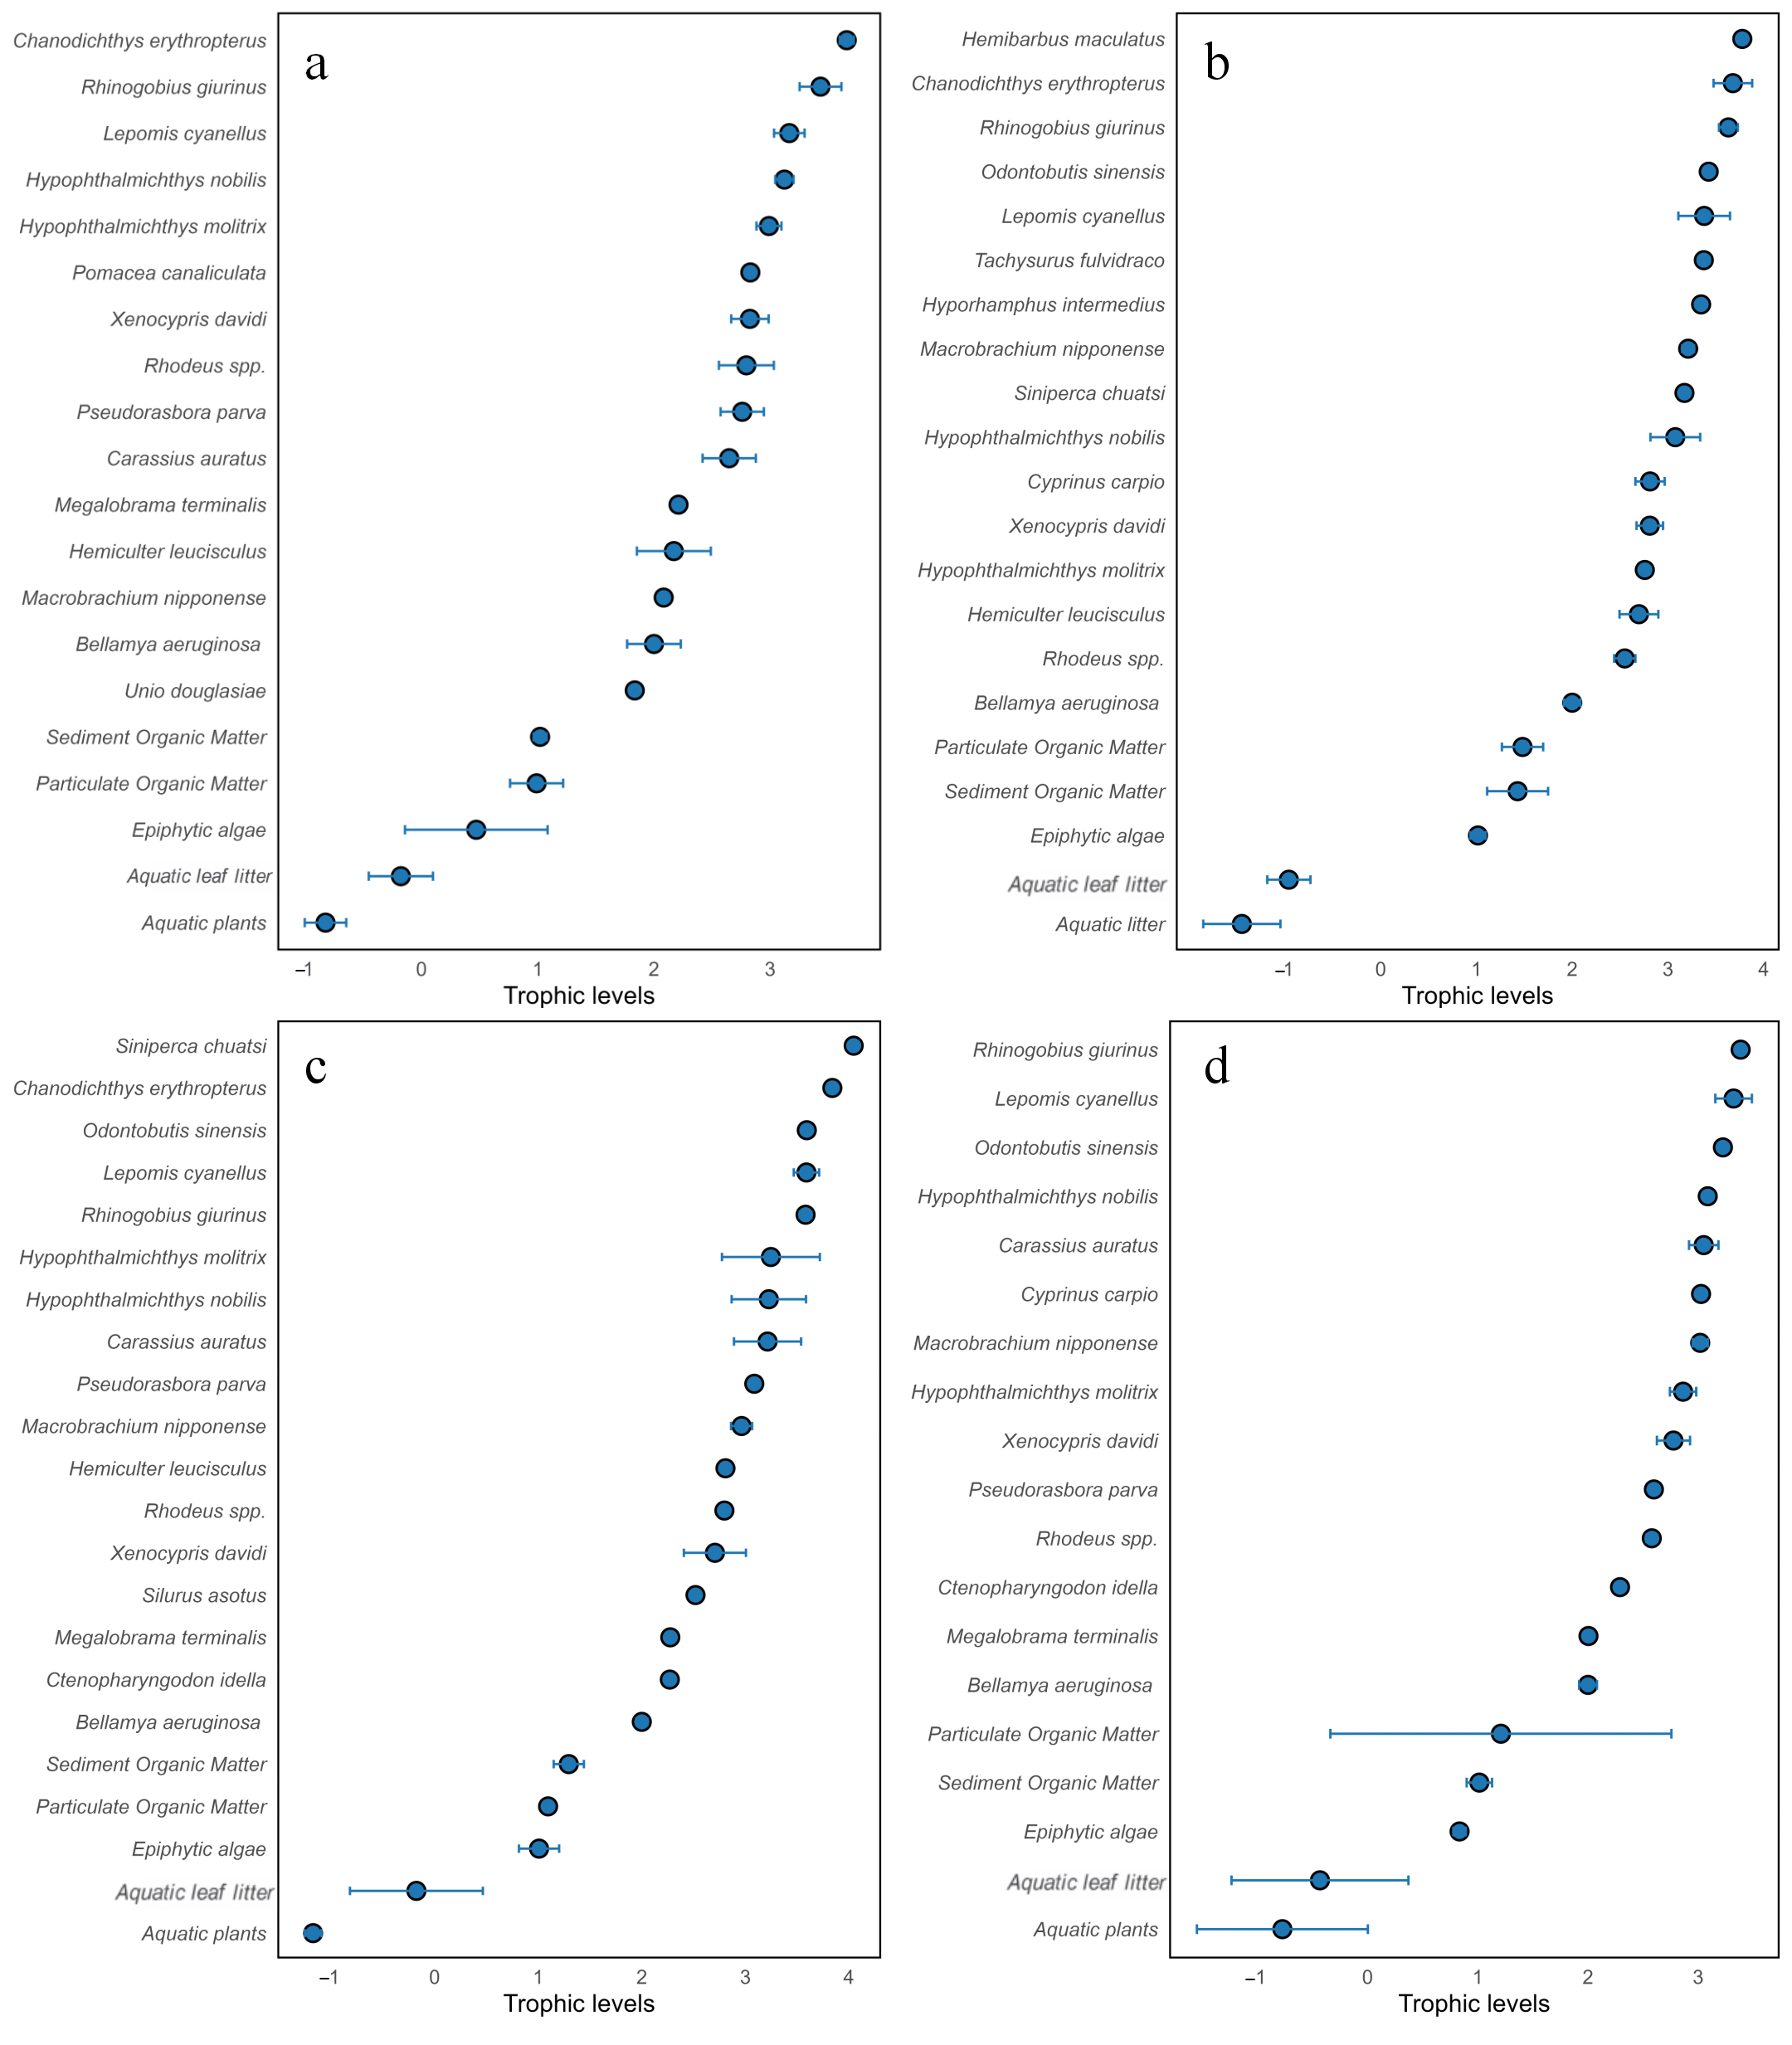
The trophic position (TP) spectrum of the biological community in Xianlin Reservoir exhibited a distinct hierarchical structure, spanning from basal primary producers to top-level carnivores (Figure 3). Basal food sources, including particulate organic matter (POM), sediment organic matter (SOM), epiphytic algae, aquatic plants, and aquatic leaf litter, formed the base of the food web. Macroinvertebrates, such as the snail Bellamya aeruginosa and the prawn Macrobrachium nipponense, generally occupied intermediate trophic positions (TP ≈ 2.0–3.0), acting as crucial conduits for energy transfer from basal sources to higher consumers.
The fish community displayed a broad trophic span, ranging from approximately 2.0 to over 4.2, indicative of diverse functional feeding guilds. Planktivorous and herbivorous species, such as the filter-feeding Hypophthalmichthys molitrix and Aristichthys nobilis (labeled as Hypophthalmichthys nobilis in Figure 3), alongside the herbivorous Ctenopharyngodon idella, consistently occupied the lower end of the fish trophic spectrum (TP ≈ 2.0–2.8). Small-bodied omnivores and generalists, including Hemiculter leucisculus, Rhinogobius giurinus, and Rhodeus spp., occupied intermediate niches (TP ≈ 2.8–3.5), bridging the gap between lower trophic levels and apex predators.
Distinct seasonal dynamics were observed in the food chain length and the specific roles of apex predators. Winter had the most extended food chain, with the maximum trophic level exceeding 4.0. This extension was primarily driven by the presence of the obligate piscivore Siniperca chuatsi (Mandarin fish) at the apex, followed by other high-level consumers such as Silurus asotus and Chanodichthys erythropterus. In contrast, the Summer and Autumn food webs appeared comparatively compressed, with top predators like Chanodichthys erythropterus occupying slightly lower trophic positions (TP < 4.0). Conversely, the winter food web exhibited a distinct vertical elongation, characterized by the presence of Siniperca chuatsi at the top apex, which recorded the highest overall trophic position (TP = 4.04). Furthermore, the relative trophic positions of omnivorous species (e.g., Carassius auratus) showed noticeable plasticity across seasons, reflecting opportunistic shifts in their diet in response to fluctuating resource availability. Overall, while the functional stratification of the food web remained stable, the specific trophic elongation and predator–prey linkages were highly responsive to seasonal environmental changes.

3.3. Trophic Niche Width and Community Metrics

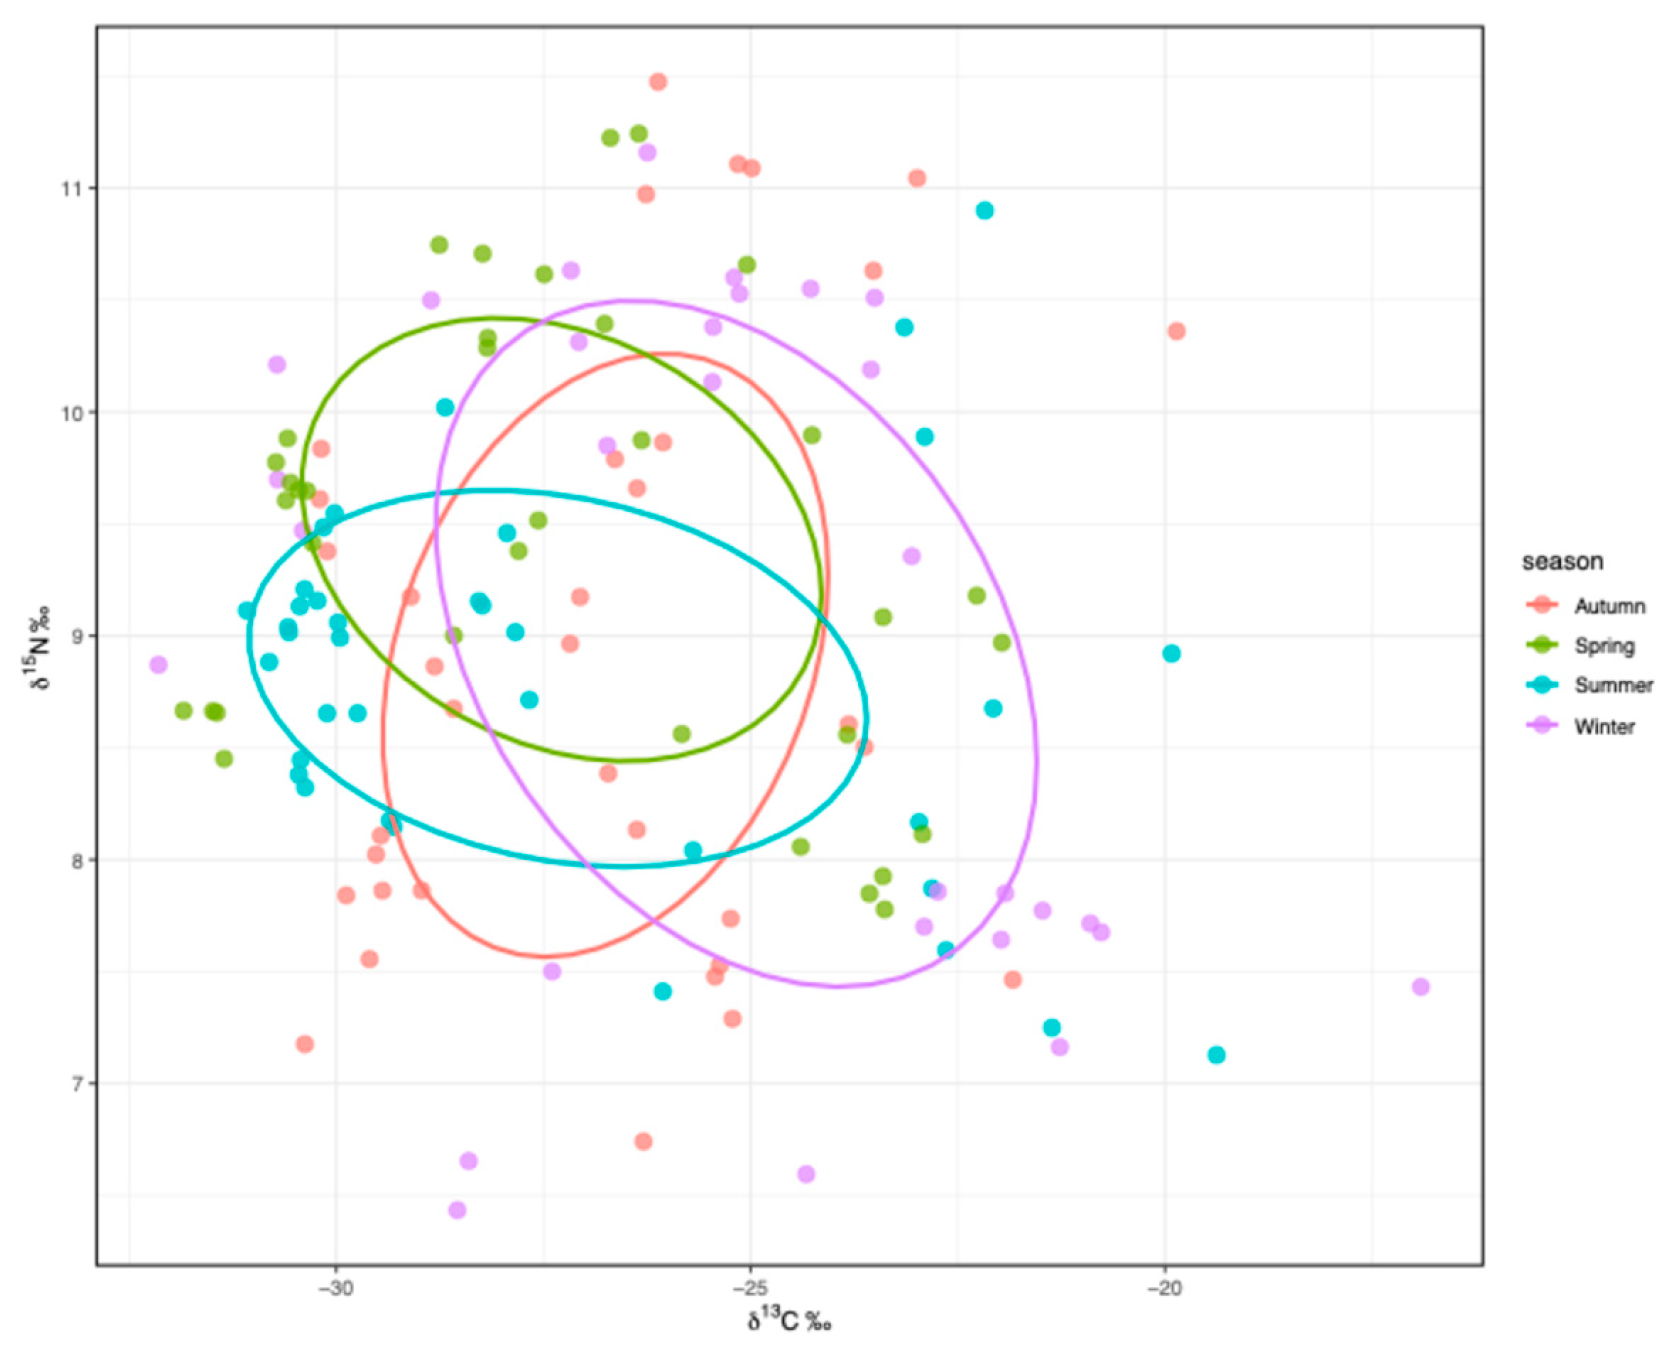
Community-wide trophic metrics, derived from stable isotope data using SIBER, revealed pronounced seasonal dynamics in the trophic structure and resource utilization of the fish assemblage in Xianlin Reservoir (Table 1). The overall trophic niche space expanded markedly during the colder months and became most compressed in spring. Specifically, the total area of the convex hull (TA) and the core isotopic niche area (SEAc) reached their maximum values in winter (TA = 43.20; SEAc = 16.33), indicating that the fish community occupied the broadest isotopic niche space and exploited a highly diverse array of resources during this period (Figure 4). In contrast, the spring community exhibited the smallest niche breadth (TA = 20.90; SEAc = 9.38), suggesting a seasonal convergence in dietary preferences or reduced availability of diverse resources.
The horizontal and vertical dimensions of the food web further supported this seasonal pattern (Table 1). The carbon range (CR), which reflects the diversity of basal carbon sources utilized by the community, peaked in winter (CR = 15.23) and was lowest in spring (CR = 9.87). This implies that fish in winter relied on a wider spectrum of energy pathways (e.g., combining both pelagic and littoral/benthic sources) to meet their energetic demands. Concurrently, the nitrogen range (NR), representing the vertical length of the food chain, was highest in autumn and winter (NR = 4.73) and lowest in spring (NR = 3.47). The elongated vertical structure in autumn and winter aligns with the pronounced presence and active feeding of high-trophic-level apex predators. Furthermore, metrics indicating species packing, such as the mean distance to centroid (CD) and mean nearest neighbor distance (MNND), indicated a spatial reorganization of the community as a result of seasonal fluctuations in resource availability. The highest MNND (0.66) and SDNND (0.80) in winter (Table 1) indicate a more uneven distribution of trophic niches with lower trophic redundancy, whereas the lower values in spring suggest denser species packing and higher potential for trophic competition.

4. Discussion

In summary, this study comprehensively elucidated the seasonal dynamics of the fish community and food web structure in Xianlin Reservoir. Our empirical results revealed that the community composition was consistently dominated by Lepomis macrochirus (Bluegill) and Xenocypris argentea. stable isotope analyses demonstrated significant seasonal shifts in resource utilization and trophic architecture. We found that the winter community clearly stood out from the rest of the year, exhibited the most elongated food chain, the widest isotopic niche space, and the lowest trophic redundancy. In contrast, the food web architectures during spring, summer, and autumn were more convergent, characterized by relatively compressed trophic structures and denser species packing, with the spring community representing the most extreme case of this compression.

4.1. Seasonal Succession of Trophic Levels and Food Chain Length

The vertical food chain length was quantified based on the nitrogen isotope ratio. Using Bellamya aeruginosa as the trophic baseline (TP = 2), the mean vertical length of the reservoir food chain was estimated at 4.04, corresponding to a nitrogen vector length of approximately 3.4‰. Trophic levels constitute a fundamental characteristic of ecosystems, reflecting both the vertical length of food chains and the functional distribution of species within the food web [15]. In this study, the trophic structure of the fish community in Xianlin Reservoir exhibited significant seasonal variations, with the longest food chain (highest NR) observed during winter and the shortest during spring. This contrast is closely linked to the seasonal activity patterns and dietary shifts in top predators, such as the Mandarin fish (Siniperca chuatsi) and Topmouth culter (Chanodichthys erythropterus). As highlighted by Liao et al. in the Three Gorges Reservoir, carnivorous fish consistently exhibit higher δ15N values than herbivorous fish regardless of hydrological fluctuations [33]; similar patterns were also reported by Sharpe et al. in tropical lakes [34]. Consistent with these findings, carnivorous fish in our study persistently occupied the apex trophic positions across all seasons. The significant elongation of the winter food chain may be attributed to a compensatory feeding strategy: under conditions of low water temperature and reduced basal primary productivity, carnivorous fish tend to consume higher-trophic-level benthic prey to meet their energetic demands. Furthermore, this emphasizes that the dietary classification of certain deep-water piscivores (e.g., S. chuatsi) is not rigidly fixed. Rather, they employ a highly opportunistic feeding strategy that dynamically fluctuates according to environmental circumstances, allowing them to exploit alternative benthic prey and thereby driving the elongation of the winter food chain.

4.2. Niche Expansion Strategy Under Resource Scarcity

The nitrogen range (NR) and carbon range (CR) effectively proxy the food chain length and the diversity of basal resources within a food web, respectively [35]. Our results demonstrated that the winter fish community in Xianlin Reservoir possessed the highest CR (15.23) and the largest core isotopic niche area (SEAc = 16.33), whereas the spring community exhibited the most constricted carbon range and niche space. This seasonal contrast strongly supports the application of the Optimal Foraging Theory in fish feeding ecology [36]. During winter, dominant and easily accessible resources such as phytoplankton and zooplankton are relatively scarce and insufficient to sustain the energy requirements of the fish assemblage. This seasonal pattern of niche dynamics aligns well with the fundamental predictions of Optimal Foraging Theory (OFT) [37,38]. According to OFT, foragers should specialize on highly profitable prey when resources are abundant, but must expand their diet breadth to include less profitable, alternative prey when their preferred food becomes scarce [39].
In the Xianlin Reservoir, easily accessible pelagic resources, such as phytoplankton and zooplankton, drastically decline during winter and become insufficient to sustain the energetic requirements of the fish assemblage. To compensate for reduced encounter rates with preferred prey, the fishes adopt a more generalized foraging strategy, shifting towards alternative pathways such as benthic invertebrates, epiphytic algae, and detritus [40]. This theoretically predicted dietary expansion explains the significantly broadened isotopic niche space observed during the winter months. Such high trophic plasticity in resource-limited environments drives the expansion of the community’s overall niche space [41,42]. Conversely, during spring, the resurgence of primary productivity allows fish to forage selectively on preferred prey, leading to a concentration of diets and a subsequent contraction of the isotopic niche space. Ultimately, these seasonal shifts highlight that the degree of opportunistic resource utilization is not a fixed trait; instead, it functions as a highly plastic behavioral strategy that fluctuates in response to environmental constraints [43,44]. Such flexibility allows fishes to maintain energetic requirements when preferred prey is scarce, though it may simultaneously intensify interspecific competition during periods of resource convergence [45].

4.3. Seasonal Response of Trophic Redundancy and Community Stability

The structural stability of a community heavily relies on its internal trophic redundancy, which occurs when multiple species utilize similar resources, occupy overlapping trophic niches, and perform analogous ecological functions [19,46]. Lower values of the Mean Nearest Neighbor Distance (MNND) and the Standard Deviation of Nearest Neighbor Distance (SDNND) indicate denser species packing within the isotopic space and higher trophic redundancy. Our study revealed that the spring community exhibited the lowest MNND (0.41) and SDNND (0.34) values year-round, suggesting exceptionally high trophic redundancy. In this state, multiple species share abundant resources, forming a highly compact and robust community structure that helps the ecosystem maintain its functionality against external disturbances [21,47,48].
However, the winter community peaked in both metrics (MNND = 0.66, SDNND = 0.80), indicating that trophic redundancy was minimized and species arrangement along the food chain was highly dispersed and uneven. Under this low-redundancy condition, specific species occupy distinct and isolated trophic niches, resulting in weak functional substitutability among taxa. It is important to note that Xianlin Reservoir is a newly constructed ecosystem where the process of community assembly is still actively ongoing [49]. Therefore, rather than implying imminent ecological collapse, this low redundancy indicates that the developing food web exhibits a reduced functional buffering capacity during winter. This makes the community potentially more susceptible to environmental perturbations; if certain key nodal species—particularly high-trophic-level predators—are extirpated due to extreme climate events or overfishing, the developing food web structure may struggle to recover [19]. Therefore, from a perspective of sustainable reservoir management, winter should be identified as a critical period, and conservation measures must be prioritized to protect apex predators and their underlying benthic food chains.

4.4. Ecological Role and Impacts of the Non-Native Lepomis Macrochirus

The persistent dominance of the non-native bluegill (Lepomis macrochirus) across all seasons is a striking feature of the Xianlin Reservoir fish assemblage. As an opportunistic omnivore, L. macrochirus exhibits remarkable adaptability to newly formed lentic environments [50,51,52]. Our stable isotope results indicate that L. macrochirus occupies an intermediate trophic position but displays a broad isotopic niche, suggesting high plasticity in resource utilization. This allows it to exploit a wide range of basal resources, putting it in direct potential trophic competition with native species, particularly Xenocypris argentea [53]. In newly constructed reservoirs where ecological niches are not yet fully saturated, such highly adaptable non-native species can rapidly proliferate, potentially disrupting native food web assembly and altering basal energy pathways [54,55]. Continuous ecological monitoring of L. macrochirus is thus imperative to mitigate its potential cascading effects on native biodiversity [56].

4.5. Limitations and Future Perspectives

Primarily, the estimation of trophic positions in this study relied on a fixed trophic enrichment factor (TEF = 3.4‰) and a single baseline organism (Bellamya aeruginosa). In aquatic systems with strong seasonal environmental fluctuations, biogeochemical cycles and primary production dynamics can cause temporal variability in the baseline isotopic signatures [32]. The lack of seasonal baseline validation means that the constant baseline assumption might inadvertently over- or underestimate consumer trophic positions during certain seasons. Therefore, the observed seasonal elongation or compression of the food chain might, to some extent, reflect temporal shifts in the basal δ15N rather than pure dietary changes. Future studies should incorporate season-specific baseline organisms and species-specific TEFs to provide a more precise estimation of seasonal trophic positions.
Second, community-wide metrics such as SEAc and Layman indices can be sensitive to sample size and uneven species representation [22]. Although we included all captured species to achieve a holistic representation (Table A1), the unequal sample sizes across seasons might artificially inflate or compress isotopic niche metrics, meaning the observed seasonal patterns (e.g., winter expansion) may partly reflect sampling structure rather than pure ecological differences. Finally, interpreting isotopic niche expansion as direct evidence of dietary shifts remains speculative without the integration of complementary methods, such as Bayesian mixing models (e.g., MixSIAR) or stomach content analysis [57]. Future studies should incorporate these multi-proxy approaches to provide a more robust mechanistic understanding of food web dynamics.
Finally, interpreting isotopic niche expansion as direct evidence of dietary shifts remains speculative without the integration of complementary methods, such as Bayesian mixing models (e.g., MixSIAR) or stomach content analysis [57]. Future studies should incorporate these multi-proxy approaches to provide a more robust mechanistic understanding of food web dynamics.

5. Conclusions

Our study highlights that the newly constructed regulation reservoir (Xianlin Reservoir) harbors a highly dynamic aquatic food web driven by seasonal changes. The trophic structure demonstrates remarkable plasticity, shifting from a broad, low-redundancy state in winter—necessitated by resource scarcity and dietary expansion—to a compressed, high-redundancy state in spring. The reduced functional buffering capacity observed during winter underscores the necessity for targeted conservation efforts, particularly for high-trophic-level apex predators, to prevent potential cascading effects and protect the developing food web. Furthermore, the persistent dominance and high relative abundance of the non-native bluegill (Lepomis macrochirus) warrant continuous ecological monitoring, given its potential to outcompete native species and disrupt foundational energy pathways. Ultimately, incorporating these seasonal trophic dynamics and species-specific interactions into modern reservoir management is imperative for maintaining long-term ecosystem stability, and regional biodiversity.

Author Contributions

Conceptualization, L.Z. and Q.L.; methodology, L.Z., M.P., Y.W., and B.J.; software, L.Z.; validation, L.Z.; formal analysis, L.Z.; investigation, L.Z. and M.Z.; resources, L.Z.; data curation, L.Z. and Y.H.; writing—original draft preparation, L.Z.; writing—review and editing, L.Z. and B.J.; visualization, L.Z.; supervision, X.Z. and B.J.; project administration, B.J.; funding acquisition, B.J. and H.C. All authors have read and agreed to the published version of the manuscript.

Funding

This research was funded by the National Natural Science Foundation of China, grant number 31960254.

Institutional Review Board Statement

Ethical review and approval were not required for this study.

Data Availability Statement

The data presented in this study are available on request from the corresponding author.

Acknowledgments

We would like to express our sincere gratitude to the Hangzhou Reservoir Management Service Center for their invaluable administrative support and assistance during the field sampling in Xianlin Reservoir.

Conflicts of Interest

The authors declare no conflicts of interest.

Appendix A

Figure A1. Fishing gears used for fish sampling in Xianlin Reservoir: (left) ground cages and (right) multi-mesh gillnets. These gears were deployed to target both benthic and pelagic fish assemblages across different habitats.
Diversity 18 00248 g0a1
Table A1. Summary of fish species collected (N) and the number of samples (n) utilized for stable isotope analysis (SIA) in Xianlin Reservoir.
OrderSpeciesSummerAutumnWinterSpring
NnNnNnNn
BeloniformesHyporhamphus intermedius  11    
CypriniformesXenocypris davidi12716978671107
CypriniformesHypophthalmichthys nobilis1779744377
CypriniformesHypophthalmichthys molitrix11714644167
CypriniformesRhodeus spp.215203195403
CypriniformesHemiculter leucisculus8765711  
CypriniformesChanodichthys erythropterus1048622  
CypriniformesCarassius auratus22  18722
CypriniformesCyprinus carpio  22  11
CypriniformesPseudorasbora parva44  1121
CypriniformesMegalobrama terminalis11  1111
CypriniformesHemibarbus maculatus  65    
CypriniformesCtenopharyngodon idella    1111
PerciformesLepomis cyanellus7963277817277
PerciformesRhinogobius giurinus74235233194
PerciformesOdontobutis sinensis  855565
PerciformesSiniperca chuatsi  1111  
SiluriformesTachysurus fulvidraco  32    
SiluriformesSilurus asotus    11  
Table A2. Seasonal variations in stable isotope compositions δ13C and δ15N (mean ± se), body length (min-max, cm), and Index of Relative Importance of species (IRI) in Xianlin Reservoir.
OrderSpeciesSummerAutumnWinterSpringTotalIRI
δ13Cδ15NBody
Length
δ13Cδ15NBody
Length
δ13Cδ15NBody
Length
δ13Cδ15NBody
Length
  
BeloniformesHyporhamphus intermedius   −29.459.8814      12
CypriniformesXenocypris davidi−23.17 ± 0.88.1 ± 0.2122–32−25.23 ± 0.448.05 ± 0.187–33−25.09 ± 1.127.43 ± 0.3914.5–34.5−23.61 ± 0.498.61 ± 0.1914–353777069
CypriniformesHypophthalmichthys nobilis−30.11 ± 0.19.11 ± 0.138–50−29.62 ± 0.298.96 ± 0.3313–46.5−27.18 ± 3.429.2 ± 0.6112.5–45−30.51 ± 0.069.67 ± 0.0538–53674174
CypriniformesHypophthalmichthys molitrix−30.38 ± 0.218.66 ± 0.1432–36−29.48 ± 0.127.88 ± 0.089–34.5−26.64 ± 2.419.27 ± 0.817–40−30.01 ± 0.738.9 ± 0.1512–35.545941
CypriniformesRhodeus spp.−26.23 ± 2.427.99 ± 0.362.8–4.5−24.45 ± 1.347.16 ± 0.222.5–6.5−21.76 ± 0.457.74 ± 0.033.5–7.5−23.24 ± 0.167.94 ± 0.12.5–4.5100756
CypriniformesHemiculter leucisculus−26.62 ± 0.235.87 ± 0.4115–19.5−26.91 ± 0.097.67 ± 0.2612–22−26.35 17   74577
CypriniformesChanodichthys erythropterus−28.11 ± 0.1510.93 ± 0.133–38−27.87 ± 0.1511.01 ± 0.2813–36.5−27.91 ± 011.29 ± 0.0535   20362
CypriniformesCarassius auratus−26.65 ± 0.247.49 ± 0.554.7–13   −27.94 ± 0.369.16 ± 0.4214–24−26.08 ± 1.749.54 ± 0.3216.5–17.522202
CypriniformesCyprinus carpio   −28.57 ± 0.878.06 ± 0.3723–39   −30.739.4652387
CypriniformesPseudorasbora parva−23.2 ± 0.657.87 ± 0.323.7–4.1   −23.238.735−25.4484739
CypriniformesMegalobrama terminalis−24.056.0124.5   −24.285.9713.5−24.665.9913328
CypriniformesHemibarbus maculatus   −26.43 ± 0.0711.34 ± 0.0716–30     26623
CypriniformesCtenopharyngodon idella      −23.095.9518.5−28.596.96 215
PerciformesLepomis cyanellus−28.11 ± 0.159.25 ± 0.183.1–16−26.53 ± 0.179.99 ± 0.351.5–17.5−26.19 ± 0.3110.44 ± 0.163–17.5−26.68 ± 0.510.46 ± 0.214.5–175144302
PerciformesRhinogobius giurinus−24.59 ± 1.8610.16 ± 0.313.7–4.9−23.3 ± 0.9610.85 ± 0.154–6.5−24.06 ± 0.5410.41 ± 0.113–6.5−27.38 ± 0.8210.68 ± 0.033.5–5.572543
PerciformesOdontobutis sinensis   −24.12 ± 0.0210.15 ± 0.047–11−26.52 ± 0.0810.45 ± 0.049.5–12−24.12 ± 0.0210.13 ± 0.046.5–1119120
PerciformesSiniperca chuatsi   −25.069.2827.5−27.2611.9938   245
SiluriformesTachysurus fulvidraco   −27.08 ± 0.069.97 ± 0.1415–23.5      310
SiluriformesSilurus asotus      −23.326.821   13

References

  1. Liu, Z.; Wu, H.; Chen, Q.; Deng, W.; Liu, H. A Mini Review of Research Trends of Phytoplankton in Chinese Reservoirs: Based on CiteSpace’s Analysis of Bibliometrics. Water 2025, 17, 797. [Google Scholar] [CrossRef] [Scilit]
  2. Banerjee, A.; Banerjee, M.; Mukherjee, J.; Rakshit, N.; Ray, S. Trophic relationships and ecosystem functioning of Bakreswar Reservoir, India. Ecol. Inform. 2016, 36, 50–60. [Google Scholar] [CrossRef] [Scilit]
  3. Xu, Z.; Chen, K.; Xu, C.; Xie, Y.; Cai, Y.; Yang, Z. Reservoir operation optimization approach accounting for methane emission mitigation and water quality improvement targets. J. Hydrol. 2025, 659, 133129. [Google Scholar] [CrossRef] [Scilit]
  4. De Moura, R.S.T.; Angelini, R.; Henry-Silva, G.G. Interactions between cage fish farms and fishing in Brazilian semiarid reservoirs: An ecosystemic approach. Aquaculture 2023, 575, 739714. [Google Scholar] [CrossRef] [Scilit]
  5. Yuan, Y.; Yuan, Y.; Dai, Y.; Gong, Y. Economic profitability of tilapia farming in China. Aquac. Int. 2017, 25, 1253–1264. [Google Scholar] [CrossRef] [Scilit]
  6. Sohoulande, C.D.D. Spatial Analysis to Retrieve SWAT Model Reservoir Parameters for Water Quality and Quantity Assessment. Water 2025, 17, 834. [Google Scholar] [CrossRef] [Scilit]
  7. Bidyasagar, S.; Sushma, K.; Swain, P.R.; Sreekanth, G.B.; Bedajit, Y.; Ramteke, K.; Devi, C.B.; Gogoi, P.; Monalisha, S.; Waikhom, G. Trophic dynamics and ecosystem health of a young tropical reservoir in Northeast India. Environ. Monit. Assess. 2025, 197, 616. [Google Scholar] [CrossRef] [Scilit] [PubMed]
  8. Xiang, M.; Liu, H.; Wei, N.; Meng, Z.; Hu, F.; Li, X. Comparing Ecosystem Structure and Function of the Geheyan Reservoir Based on the Ecopath Model After a Fishing Ban. Fishes 2025, 10, 168. [Google Scholar] [CrossRef] [Scilit]
  9. Yu, Y.; Bai, Y.; Ni, Y.; Luo, Y.; Junejo, S. Water Quality Variation Law and Prediction Method of a Small Reservoir in China. Sustainability 2022, 14, 13755. [Google Scholar] [CrossRef] [Scilit]
  10. Burkholder, J.M.; Kinder, C.A.; Dickey, D.A.; Reed, R.E.; Arellano, C.; James, J.L.; Mackenzie, L.M.; Allen, E.H.; Lindor, N.L.; Mathis, J.G.; et al. Classic indicators and diel dissolved oxygen versus trend analysis in assessing eutrophication of potable-water reservoirs. Ecol. Appl. 2022, 32, e2541. [Google Scholar] [CrossRef] [Scilit] [PubMed]
  11. Miranda, L.E.; Coppola, G.; Boxrucker, J. Reservoir Fish Habitats: A Perspective on Coping with Climate Change. Rev. Fish. Sci. Aquac. 2020, 28, 478–498. [Google Scholar] [CrossRef] [Scilit]
  12. Castro, D.M.P.; do Amaral, P.H.M.; van den Berg, E.; Hughes, R.M.; Callisto, M. Spatial and temporal taxonomic and functional beta diversity of macroinvertebrate assemblages along a tropical dammed river. Aquat. Sci. 2025, 87, 35, Erratum in Aquat. Sci. 2025, 87, 48. [Google Scholar] [CrossRef] [Scilit]
  13. Garcia, T.D.; Fugi, R.; Zanatta, A.S.; Ferreira, D.G.; Birindelli, J.L.O.; Vidotto-Magnoni, A.P. Effects of a small reservoir on the trophic network structure of fishes: A comparison between downstream and upstream stretches. Hydrobiologia 2025, 852, 5121–5133. [Google Scholar] [CrossRef] [Scilit]
  14. Napole, N.; Ospina-Alvarez, A.; Fearnside, P.M.; Macedo Lopes, P.F. Impacts of Belo Monte dam on fish co-occurrence and artisanal fishing. J. Environ. Manag. 2025, 383, 125284. [Google Scholar] [CrossRef] [Scilit] [PubMed]
  15. Xiang, Z.; Chen, T.; Gao, W.; Tian, W.; Bai, J. Influence of south-to-north water transfer project on ecology of typical water receiving area-Xiashan reservoir, China. Water Res. X 2025, 29, 100446. [Google Scholar] [CrossRef] [Scilit]
  16. Zhang, R.; Zhang, H.; Liu, H.; Zhao, J. Differences in trophic structure and trophic pathways between artificial reef and natural reef ecosystems along the coast of the North yellow Sea, China, based on stable isotope analyses. Ecol. Indic. 2021, 125, 107476. [Google Scholar] [CrossRef] [Scilit]
  17. Ward, C.A.; Tunney, T.D.; McCann, K.S. Managing aquatic habitat structure for resilient trophic interactions. Ecol. Appl. 2023, 33, e2814. [Google Scholar] [CrossRef] [Scilit]
  18. Carbonell, J.A.; Donázar-Aramendía, Í.; Pallarés, S.; Franco-Fuentes, E.; Abellán, P. Unraveling food web structure in alpine lakes: Insights from stable isotope analysis. Inland Waters 2025, 15, 2476400. [Google Scholar] [CrossRef] [Scilit]
  19. Wei, X.; Gao, C.; Liu, Y.; Tian, S.; Kindong, R.; Wang, Y. Unveiling seasonal changes in trophic structure of fishery community in the offshore waters of southern Zhejiang Province of China: Insights from stable isotope analysis. Ecol. Indic. 2024, 159, 111672. [Google Scholar] [CrossRef] [Scilit]
  20. Wu, J. Structure and Dynamics of the Aquatic Food Web in the Floodplain Wetlands of Poyang Lake. Master’s Thesis, Nanchang University, Nanchang, China, July 2021. [Google Scholar]
  21. Layman, C.A.; Arrington, D.A.; Montaña, C.G.; Post, D.M. Can Stable Isotope Ratios Provide for Community-Wide Measures of Trophic Structure? Ecology 2007, 88, 42–48. [Google Scholar] [CrossRef] [Scilit]
  22. Jackson, A.L.; Inger, R.; Parnell, A.C.; Bearhop, S. Comparing isotopic niche widths among and within communities: SIBER—Stable Isotope Bayesian Ellipses in R. J. Anim. Ecol. 2011, 80, 595–602. [Google Scholar] [CrossRef] [Scilit]
  23. Swanson, H.K.; Lysy, M.; Power, M.; Stasko, A.D.; Johnson, J.D.; Reist, J.D. A new probabilistic method for quantifying n-dimensional ecological niches and niche overlap. Ecology 2015, 96, 318–324. [Google Scholar] [CrossRef] [Scilit] [PubMed]
  24. Yin, H.; Chen, Y.; Ma, W.; Zhu, W.; Wang, H.; Zhou, Q.; Li, J.; Wang, A.; Li, X.; Xu, Q. δ13C and δ15N stable isotopes demonstrate seasonal changes in the food web of coral reefs at the Wuzhizhou Island of the South China sea. Ecol. Indic. 2023, 146, 109852. [Google Scholar] [CrossRef] [Scilit]
  25. Zhao, X. Water quality protection for emergency backup water sources. Shaanxi Water Resour. 2022, 03, 119–120. [Google Scholar] [CrossRef]
  26. Chu, T.; Yang, N.; Guo, W.; Dai, X. Evaluation of Eutrophication Status and Prevention and Control Measures for Xianlin Reservoir, Zhejiang Province. Zhejiang Agric. Sci. 2020, 61, 2156–2158. [Google Scholar] [CrossRef]
  27. Liu, K. Research on the Selection of Urban Water Sources in Hangzhou. Chin. Hydropower Electrif. 2013, 04, 20–23. [Google Scholar]
  28. Du, Q.; Zhi, H. A Brief Analysis of the Role and Significance of Xianlin Reservoir in the Qiandao Lake Water Diversion Project. Water Resour. Constr. Manag. 2014, 34, 66–69. [Google Scholar]
  29. Post, D.M.; Layman, C.A.; Arrington, D.A.; Takimoto, G.; Quattrochi, J.; Montaña, C.G. Getting to the fat of the matter: Models, methods and assumptions for dealing with lipids in stable isotope analyses. Oecologia 2007, 152, 179–189. [Google Scholar] [CrossRef] [Scilit]
  30. Wu, J.; Chen, H.; Jin, B.; Winemiller, K.O.; Wu, S.; Xu, W.; Zhang, H.; Wu, X. Seasonal Variation in Resource Overlap Between Red Swamp Crayfish (Procambarus clarkii) and Native Species in Poyang Lake Wetland, China. Front. Environ. Sci. 2022, 10, 923962. [Google Scholar] [CrossRef] [Scilit]
  31. Wang, H.; Tang, C.; Zhang, S.; Wu, C.; Zhang, H. Structural characterization and comparative analysis of the food web in China’s largest freshwater Lake. Ecol. Indic. 2025, 178, 113970. [Google Scholar] [CrossRef] [Scilit]
  32. Post, D.M. Using Stable Isotopes to Estimate Trophic Position: Models, Methods, and Assumptions. Ecology 2002, 83, 703–718. [Google Scholar] [CrossRef]
  33. Liao, C.; Wang, J.; Correa, S.B.; Yu, J.; Yang, R.; Yuan, J.; Li, W.; Ye, S.; Guo, C.; Liu, J. Artificial water-level fluctuation modulates trophic niches of benthic fish assemblages in one of the world’s largest reservoirs. Can. J. Fish. Aquat. Sci. 2023, 80, 1921–1934. [Google Scholar] [CrossRef] [Scilit]
  34. Sharpe, D.M.T.; Valverde, M.P.; De León, L.F.; Hendry, A.P.; Torchin, M.E. Biological invasions alter the structure of a tropical freshwater food web. Ecology 2023, 104, e4173. [Google Scholar] [CrossRef] [Scilit]
  35. Toutain, M.; Belouard, N.; Renault, D.; Haubrock, P.J.; Kurtul, I.; Aksu, S.; Emiroğlu, Ö.; Kouba, A.; Tarkan, A.S.; Balzani, P. Assessing the role of non-native species and artificial water bodies on the trophic and functional niche of Mediterranean freshwater fish communities. Sci. Total Environ. 2024, 938, 173520. [Google Scholar] [CrossRef] [Scilit]
  36. Xu, S.; Wang, J.; Zuo, Y.; Ma, L.; Chen, J.; Zhang, Z.; Xie, P.; Yu, J.; Liu, J. Implications from the application of stable isotopes in freshwater food webs east of the Hu Line, China. Ecol. Indic. 2024, 169, 112867. [Google Scholar] [CrossRef] [Scilit]
  37. Werner, E.E.; Hall, D.J. Optimal foraging and the size selection of prey by the bluegill sunfish (Lepomis macrochirus). Ecology 1974, 55, 1042–1052. [Google Scholar] [CrossRef] [Scilit]
  38. Pulliam, H.; Charnov, E. Optimal foraging: A selective review of theory and tests. Q. Rev. Biol 1977, 52, 137–154. [Google Scholar]
  39. Dill, L.M. Adaptive flexibility in the foraging behavior of fishes. Can. J. Fish. Aquat. Sci. 1983, 40, 398–408. [Google Scholar] [CrossRef] [Scilit]
  40. Stewart, S.D.; Kelly, D.; Biessy, L.; Laroche, O.; Wood, S.A. Individual diet specialization drives population trophic niche responses to environmental change in a predator fish population. Food Webs 2021, 27, e00193. [Google Scholar] [CrossRef] [Scilit]
  41. Xie, H.; Wang, T.; Li, C.; Sun, J.; Liu, Y.; Kong, X.; Cai, Y.; Xiao, Y.; Shen, J.; Ao, X.; et al. Trophic adaptation strategies of deep-Sea fish in cold seep environments. Water Biol. Secur. 2026, 5, 100440. [Google Scholar] [CrossRef] [Scilit]
  42. Pelage, L.; Lucena-Frédou, F.; Eduardo, L.N.; Le Loc’h, F.; Bertrand, A.; Lira, A.S.; Frédou, T. Competing with each other: Fish isotopic niche in two resource availability contexts. Front. Mar. Sci. 2022, 9, 975091. [Google Scholar] [CrossRef] [Scilit]
  43. Svanbäck, R.; Bolnick, D.I. Intraspecific competition drives increased resource use diversity within a natural population. Proc. R. Soc. B: Biol. Sci. 2007, 274, 839–844. [Google Scholar] [CrossRef] [Scilit]
  44. Correa, S.B.; Winemiller, K.O. Niche partitioning among frugivorous fishes in response to fluctuating resources in the Amazonian floodplain forest. Ecology 2014, 95, 210–224. [Google Scholar] [CrossRef] [Scilit]
  45. Syväranta, J.; Jones, R.I. Changes in feeding niche widths of perch and roach following biomanipulation, revealed by stable isotope analysis. Freshw. Biol. 2008, 53, 425–434. [Google Scholar] [CrossRef] [Scilit]
  46. Walker, B.H. Biodiversity and Ecological Redundancy. Conserv. Biol. 1992, 6, 18–23. [Google Scholar] [CrossRef] [Scilit]
  47. Ziółkowska, M.; Sokołowski, A. Variation of food web structure in macrobenthic communities in low diversity system as determined by stable isotope-based community-wide metrics. Estuar. Coast. Shelf Sci. 2022, 274, 107931. [Google Scholar] [CrossRef] [Scilit]
  48. Borrvall, C.; Ebenman, B.; Tomas Jonsson, T.J. Biodiversity lessens the risk of cascading extinction in model food webs. Ecol. Lett. 2001, 3, 131–136. [Google Scholar] [CrossRef] [Scilit]
  49. Agostinho, A.A.; Pelicice, F.M.; Gomes, L.C. Dams and the fish fauna of the Neotropical region: Impacts and management related to diversity and fisheries. Braz. J. Biol. 2008, 68, 1119–1132. [Google Scholar] [CrossRef] [Scilit] [PubMed]
  50. Abreo, N.A.; Tibo, J.; Nogueira, A.B.; Nikolaou, A.; Kaya, C.; Tarkan, A.S.; Kurtul, I.; Katsanevakis, S.; Sousa, R. Worldwide Invasions of Centrarchidae: The Dark Side of the Sunfish Family. Fish Fish. 2026, 1–32. [Google Scholar] [CrossRef] [Scilit]
  51. Azuma, M. Ecological release in feeding behaviour: The case of bluegills in Japan. Hydrobiologia 1992, 243, 269–276. [Google Scholar] [CrossRef] [Scilit]
  52. Vander Zanden, M.J.; Casselman, J.M.; Rasmussen, J.B. Stable isotope evidence for the food web consequences of species invasions in lakes. Nature 1999, 401, 464–467. [Google Scholar] [CrossRef] [Scilit]
  53. Cucherousset, J.; Olden, J.D. Ecological impacts of non-native freshwater fishes. Fisheries 2011, 36, 215–230. [Google Scholar] [CrossRef] [Scilit]
  54. Vander Zanden, M.J.; Olden, J.D.; Gratton, C. Food web approaches in restoration ecology. In Foundations of Restoration Ecology; Island Press: Washington, DC, USA, 2006; pp. 165–189. [Google Scholar]
  55. Gallardo, B.; Clavero, M.; Sánchez, M.I.; Vilà, M. Global ecological impacts of invasive species in aquatic ecosystems. Glob. Change Biol. 2016, 22, 151–163. [Google Scholar] [CrossRef] [Scilit] [PubMed]
  56. Carvalho, F.; Pascoal, C.; Cássio, F.; Sousa, R. Direct and indirect effects of an invasive omnivore crayfish on leaf litter decomposition. Sci. Total Environ. 2016, 541, 714–720. [Google Scholar] [CrossRef] [Scilit] [PubMed]
  57. Parnell, A.C.; Phillips, D.L.; Bearhop, S.; Semmens, B.X.; Ward, E.J.; Moore, J.W.; Jackson, A.L.; Grey, J.; Kelly, D.J.; Inger, R. Bayesian stable isotope mixing models. Environmetrics 2013, 24, 387–399. [Google Scholar] [CrossRef] [Scilit]
Figure 2. Stable isotope biplot illustrating the overall trophic structure of the biological community in Xianlin Reservoir. The horizontal axis represents carbon isotope composition (δ13C), and the vertical axis represents the nitrogen isotope (δ15N). Scatter plots illustrate the isotopic niches of basal food sources, macroinvertebrates, and fish species. Each point represents the mean isotopic value, and error bars denote the standard deviation (Mean ± SD). Panels represent: (a) Summer, (b) Autumn, (c) Winter, and (d) Spring. The distribution of points reflects the trophic position (vertical axis) and carbon source utilization (horizontal axis) of the community members. Abbreviations: POM, Particulate Organic Matter; SOM, Sediment Organic Matter. To ensure visual clarity in this comprehensive community plot, all data points are displayed at a uniform size; the unweighted mean values presented here reflect the general isotopic niche positions. The exact sample sizes (reflecting the relative contribution of each species) are detailed in Table A1.
Diversity 18 00248 g002
Figure 3. Seasonal variations in the trophic level spectrum of the biological community in Xianlin Reservoir. The trophic positions (TP) were estimated based on nitrogen stable isotope values (δN), using Bellamya aeruginosa as the baseline (TP = 2). The scatter points represent the mean trophic position for each species or food source, and the horizontal error bars indicate the standard deviation (Mean ± SD). Panels correspond to the four seasons: (a) Summer, (b) Autumn, (c) Winter, and (d) Spring. Note the shift in apex predators and food chain length across seasons.
Diversity 18 00248 g003
Figure 4. Isotopic niche space of the fish community in Xianlin Reservoir across four seasons. The horizontal axis represents the carbon isotope composition (δ13C), and the vertical axis represents the nitrogen isotope composition (δ15N). The ellipses represent the sample-size-corrected standard ellipse areas (SEAc) calculated using the SIBER package (version 2.1.9) in R. These SEAc correspond to 40% prediction ellipses calculated under the assumption of a bivariate normal distribution, encompassing the core isotopic niche space of the community for each season (Summer, Autumn, Winter, and Spring). The scatter points represent the unweighted mean δ13C and δ15N values for each fish species sampled. A larger ellipse area indicates a broader core trophic niche space occupied by the community. For detailed mathematical formulations and Bayesian modeling parameters used to construct these ellipses, please refer to the methodology described in Section 2.4. Exact sample sizes for each data point are detailed in Table A1.
Diversity 18 00248 g004
Table 1. Stable isotope-based community-wide metrics for the fish assemblage in Xianlin Reservoir across four seasons. (Notes: NR, the difference between the maximum δ15N and minimum δ15N values,; CR, the difference between the maximum δ13C and minimum δ13C values; TA, total area of the convex hull; CD, mean distance to centroid; MNND, mean nearest neighbor distance; SDNND, standard deviation of nearest neighbor distance; SEAc, corrected standard ellipse area).
IndexSummerAutumnWinterSpring
NR3.77 4.73 4.73 3.47 
CR11.70 10.51 15.23 9.87 
TA29.09 35.99 43.20 20.90 
CD3.26 2.58 3.40 2.88 
MNND0.43 0.48 0.66 0.41 
SDNND0.49 0.60 0.80 0.34 
SEAc9.55 10.89 16.33 9.38 
Disclaimer/Publisher’s Note: The statements, opinions and data contained in all publications are solely those of the individual author(s) and contributor(s) and not of MDPI and/or the editor(s). MDPI and/or the editor(s) disclaim responsibility for any injury to people or property resulting from any ideas, methods, instructions or products referred to in the content.