Article

Phytoplankton Composition and Functional Groups in Cascade Hydropower Reservoirs of the Drina River (Bosnia and Herzegovina): Trophic Status and Ecological Potential Assessment

1
Faculty of Technology Zvornik, University of East Sarajevo, Karakaj 34A, 75400 Zvornik, Bosnia and Herzegovina
2
Department of Biology, Faculty of Science, University of Zagreb, Rooseveltov trg 6, 10000 Zagreb, Croatia
3
Department of Biology, Josip Juraj Strossmayer University of Osijek, Ulica Cara Hadrijana 8/A, 31000 Osijek, Croatia
4
Institut za vode, d.o.o. Bijeljina, Miloša Obilića 51, 76300 Bijeljina, Bosnia and Herzegovina
5
Faculty of Natural Sciences and Mathematics, University of Tuzla, Urfeta Vejzagića 4, 75000 Tuzla, Bosnia and Herzegovina
*
Author to whom correspondence should be addressed.
Diversity 2026, 18(5), 242; https://doi.org/10.3390/d18050242
Submission received: 23 March 2026 / Revised: 17 April 2026 / Accepted: 19 April 2026 / Published: 22 April 2026
(This article belongs to the Special Issue Advances in Freshwater Diversity and Ecology)

Abstract

Cascade reservoirs on the Drina River (Bosnia and Herzegovina) are heavily modified water bodies that require reliable biological tools for assessing trophic status and ecological potential. Under the Water Framework Directive (WFD), assessments of surface water ecological status and potential rely on biological quality elements, since aquatic communities integrate and respond to prevailing environmental conditions and thus serve as reliable indicators of water quality. This study aims to (i) describe phytoplankton diversity, biomass, and functional-group composition along the Drina reservoir cascade, (ii) examine monthly changes across the studied reservoirs, (iii) determine trophic status and ecological potential, and (iv) provide a preliminary estimate of total phosphorus thresholds that may support future setting of ecological potential boundaries. Phytoplankton composition and functional groups were analysed in three longitudinally connected reservoirs of the Drina River during four monthly surveys in 2024. A total of 80 phytoplankton taxa were recorded, with diatoms dominating most of the study period. The highest biomasses were recorded for Fragilaria crotonensis, Dinobryon divergens, Acanthoceras zachariasii and Sphaerocystis sp., while the dominant functional groups were P, E, A, and F. Phytoplankton assemblage structure showed moderate spatial differentiation among the reservoirs. Mean chlorophyll a and Carlson’s Trophic State Index indicated eutrophic conditions in the Višegrad Reservoir and mesotrophic conditions in the Perućac and Zvornik reservoirs, while biomass showed a pronounced summer maximum, particularly in Perućac. Ecological potential was generally classified as good or better, except for a moderate classification in the Zvornik Reservoir in late summer. The good/moderate TP boundary was estimated at 39 µg L−1, linking EQR-based ecological assessment with the onset of eutrophic conditions. Overall, this study represents the first application of the phytoplankton functional group approach in cascade reservoirs in Bosnia and Herzegovina and may provide a valuable basis for the development of a phytoplankton-based monitoring framework in lakes and reservoirs, which is currently lacking.

1. Introduction

Water reservoirs support integrated water resources management through flow regulation, flood control, hydropower generation, drought mitigation, and a range of economic activities, including tourism, recreation, aquaculture, and fisheries [1,2]. In contrast, dams fragment rivers, leading to substantial habitat alteration and changes in flow and sediment regimes [3], thereby posing a major threat to freshwater biodiversity [4]. Approximately 90% of global river volume is already affected by fragmentation [5].
Despite their apparent similarity to natural lakes, reservoirs differ fundamentally because they integrate riverine conditions in inflow zones with lacustrine features near the dam [6]. Water quality in reservoirs is shaped by interacting environmental and anthropogenic drivers, and excessive nutrient and pollutant inputs from the catchment can trigger progressive degradation. In combination with reduced flow velocity, prolonged water residence time, and increased exposure to solar radiation, these conditions make reservoirs particularly susceptible to eutrophication. Although eutrophication may occur naturally, it is often accelerated by human activities [7]. Its consequences include enhanced primary production, proliferation of algae and cyanobacteria, reduced transparency, oxygen depletion (anoxia), toxic blooms, and gradual biodiversity loss [8].
Water quality of the reservoir exhibits pronounced spatial and seasonal variability, highlighting the need for systematic ecological assessment and continuous monitoring. In this context, phytoplankton is a key biological quality element and a sensitive indicator of trophic conditions in lentic ecosystems. As primary producers in the water column, phytoplankton communities respond rapidly to changes in nutrient availability and physical and chemical conditions [9]. Accordingly, shifts in species composition, abundance, biomass, and functional structure can provide early signals of eutrophication pressures, including within assessment frameworks aligned with the EU Water Framework Directive [10].
Modern trophic assessment systems increasingly use functional classifications that link phytoplankton community structure to environmental constraints and eutrophication pressure [11,12]. Based on this concept, several phytoplankton indices have been developed, notably the Q phytoplankton index [13] and the Hungarian Lake Phytoplankton Index (HLPI) [14], which were successfully applied in both natural and anthropogenic lentic ecosystems. These indices integrate functional composition with biomass-related metrics and can support robust assessment in systems with strong seasonal dynamics [15]. Integrative phytoplankton metrics have been successfully applied in artificial reservoirs, capturing spatial and temporal variability in the community structure and often aligning with trophic state assessments [16,17] and water column stability in cascade reservoirs [18].
Specifically, shifts in functional groups due to stratification mixing dynamics underscore the enhanced diagnostic benefits of functional approaches compared to solely using biomass metrics for reservoir evaluation [17,19]. While phytoplankton-based ecological assessment is not equivalent to trophic state classification, the two can be interpreted in a comparable way when supporting physical and chemical elements and type-specific thresholds are clearly defined. Although phytoplankton functional groups have been applied in individual artificial reservoirs in Europe [16], comparable studies on large, longitudinally connected cascade reservoirs remain much less common and are documented mainly outside Europe, particularly in China [17,18].
Phytoplankton in the freshwaters of Bosnia and Herzegovina remains poorly investigated. Published phytoplankton studies of Blidinje Lake [20] have mainly relied on chlorophyll a concentration, total cell counts, and saprobity index calculations, whereas biomass-based assessments of trophic status have been largely unexplored. Phytoplankton is formally recognised as a biological quality element in the entities’ water-management framework, but its assessment is still not fully operationalised in accordance with European Water Framework Directive principles [21]. For lakes, currently available criteria rely mainly on chlorophyll a and supporting physico-chemical parameters, whereas values for heavily modified and artificial water bodies are still to be defined after their formal designation [22].
We selected three reservoirs along the Drina River in Bosnia and Herzegovina constructed for cascade hydropower exploitation to investigate phytoplankton community structure, algal biomass, functional groups and to demonstrate the applicability of certain metrics for trophic status evaluation and ecological potential assessment in Bosnia and Herzegovina. We proposed a total phosphorus threshold as an additional pilot contribution intended to support future boundary-setting efforts.
The objectives of this study are to (i) assess species diversity and perform qualitative and quantitative analyses of algae and cyanobacteria within phytoplankton functional groups in the three selected reservoirs, (ii) explore monthly phytoplankton dynamics across the cascade of reservoirs, (iii) determine the trophic status and ecological potential of reservoirs, and (iv) provide a preliminary estimate of total phosphorus thresholds that may support future setting of ecological potential boundaries.

2. Materials and Methods

2.1. Study Area

The Drina River is a 346 km long system, with a catchment area of 20,319.9 km2 [23] and a mean discharge at its confluence of approximately 400 m3 s−1 [24]. It is formed by the confluence of the Tara and Piva Rivers near Šćepan Polje at 432 m a.s.l., and it is the largest tributary of the Sava River (Black Sea basin), joining the Sava near Sremska Rača at 75.4 m a.s.l. The mean annual precipitation in the Drina River basin is 1100 mm, while the mean annual air temperature ranges from 10.5 to 11.1 °C in the northern part of the basin and from 4 to 5 °C in the southern part [25].
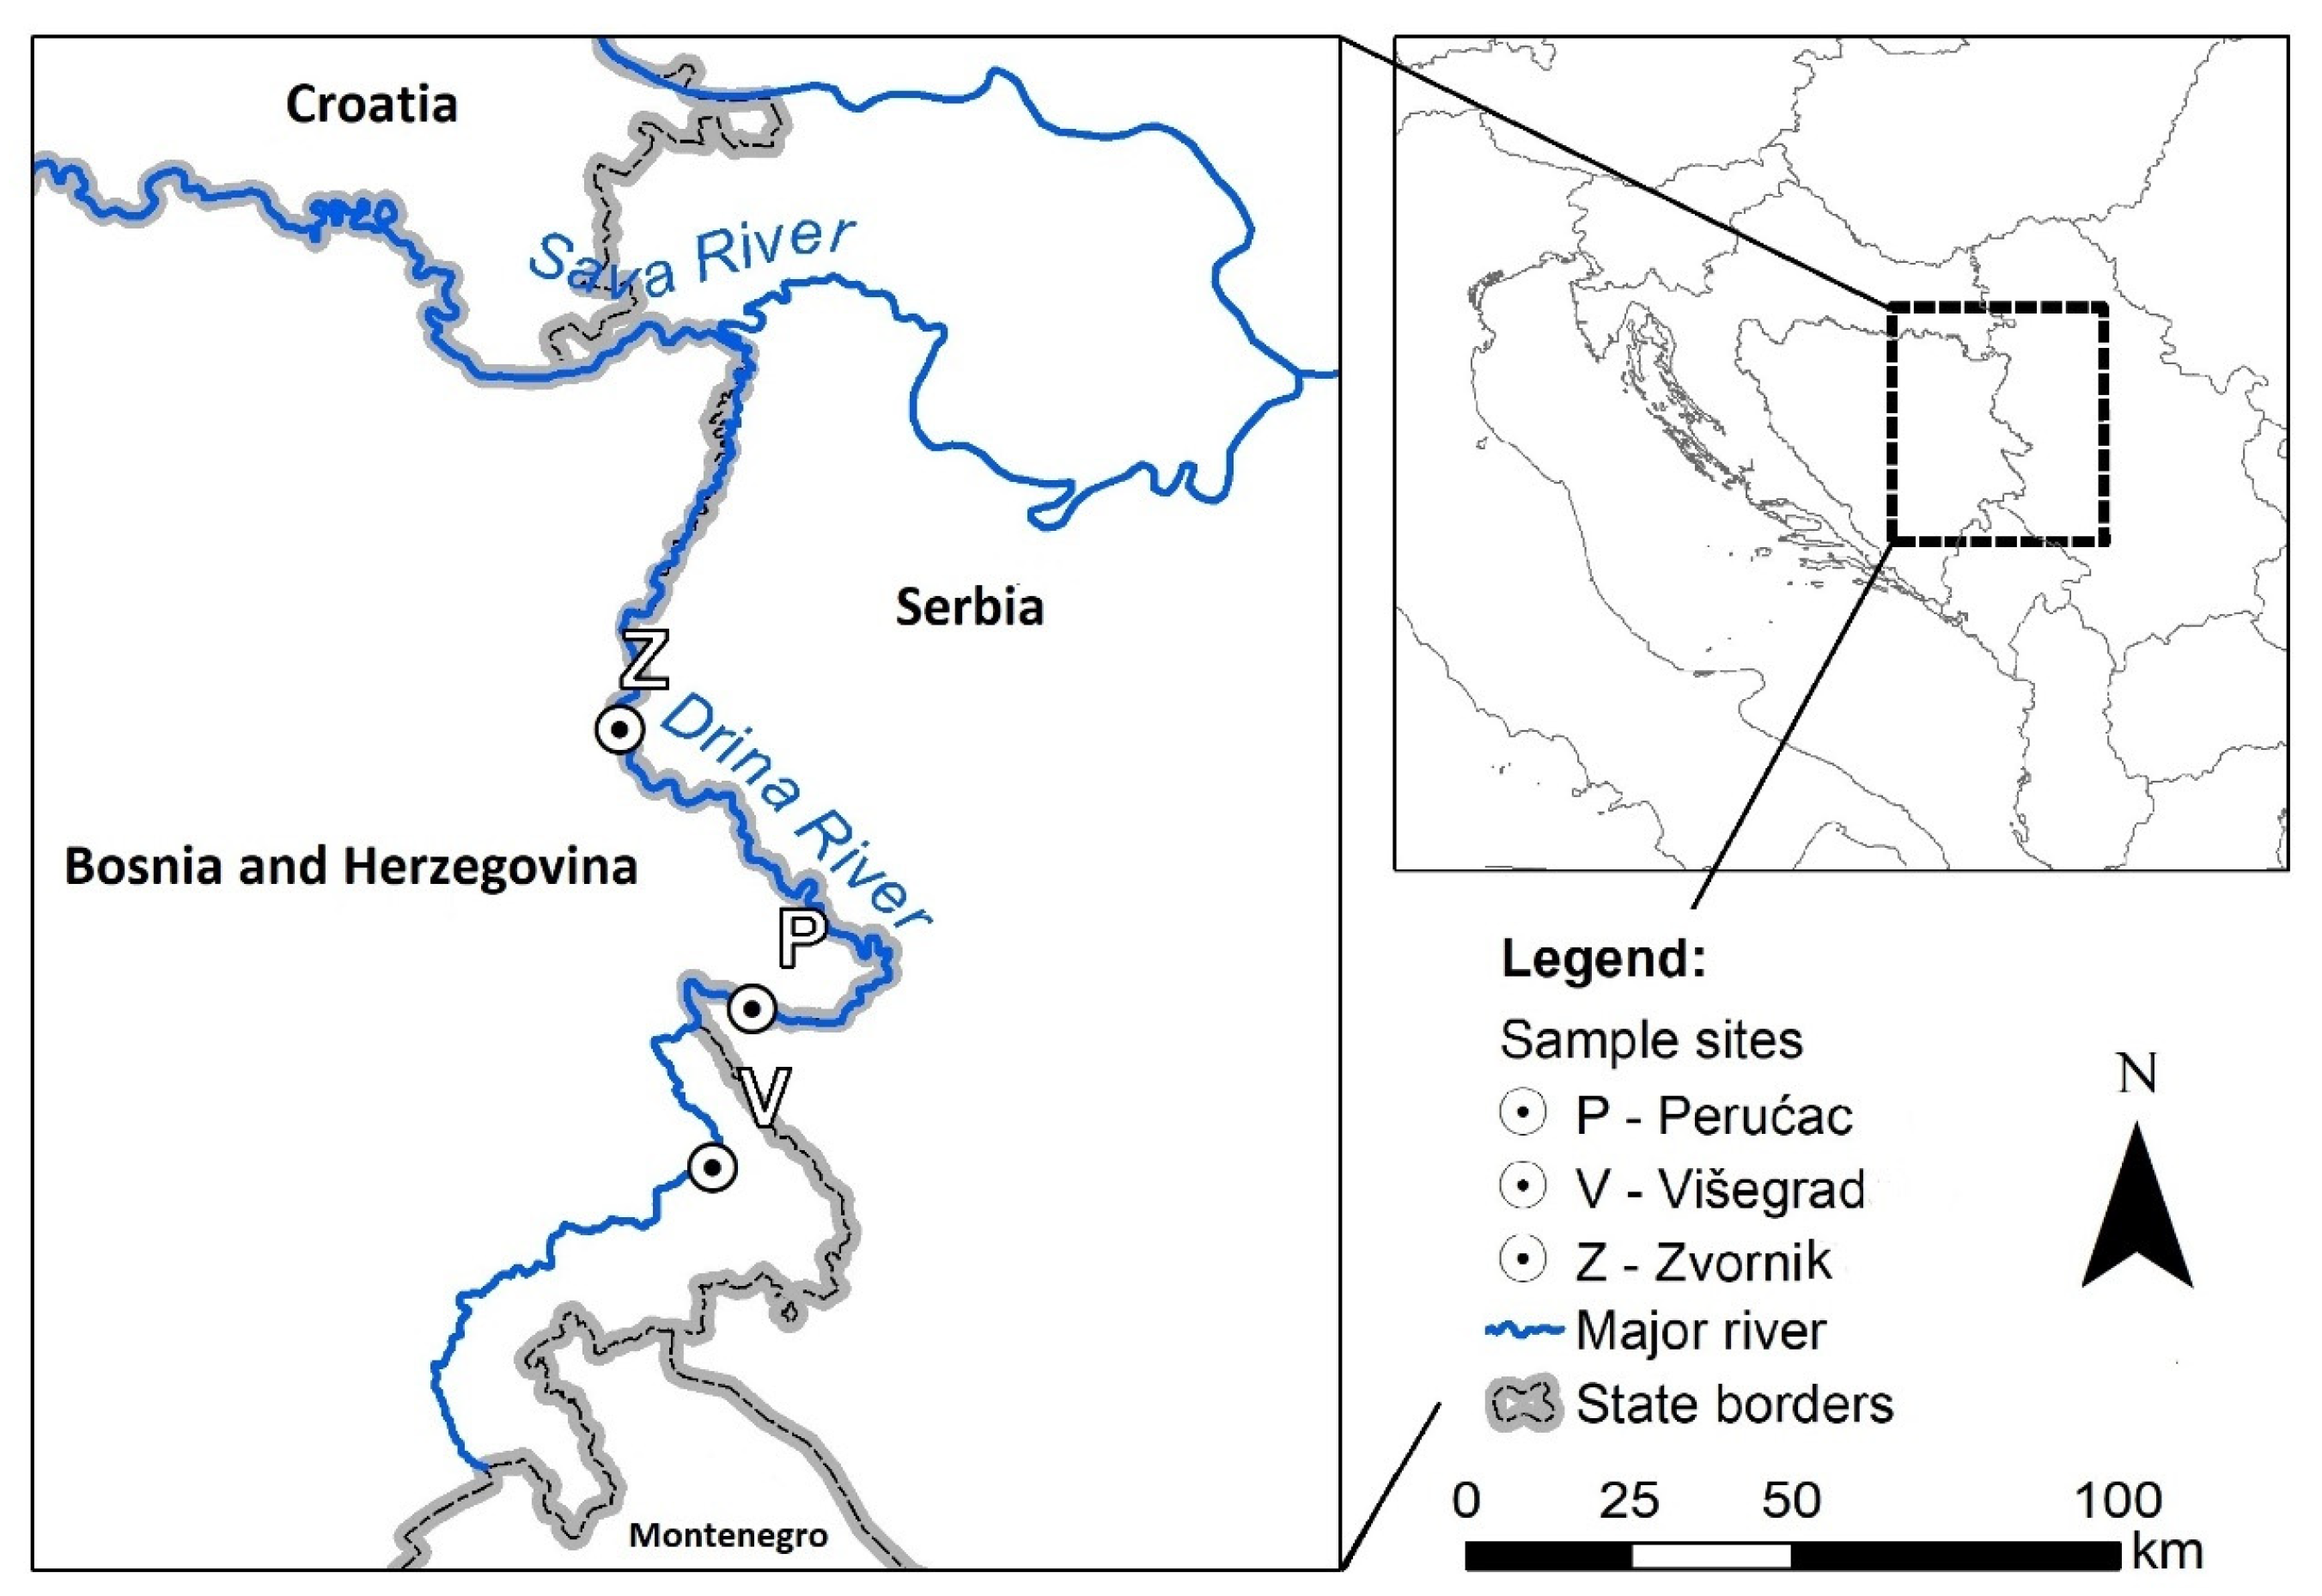
In the present study, three large reservoirs longitudinally arranged along the Drina River were investigated: Višegrad Reservoir (V), Perućac Reservoir (P), and Zvornik Reservoir (Z) (Figure 1, Table 1). The reservoirs have existed for 37, 60, and 71 years, respectively. Višegrad Reservoir is an artificial storage reservoir (surface area 8.1 km2, volume 161 × 106 m3, length 40 km, maximum depth 43 m) created by the construction of the Višegrad Hydropower Plant. Perućac Reservoir (surface area 12.5 km2, volume 340 × 106 m3, length 55 km, maximum depth 60 m) was impounded to support the Bajina Bašta run-of-river hydropower scheme. Most of the reservoir lies within the Drina River canyon and is bordered by steep, rocky cliffs. Zvornik Reservoir (surface area 8.1 km2, volume 47.43 × 10⁶ m3, length 25 km, maximum depth 39 m) was formed by damming for the Zvornik Hydropower Plant. Since impoundment, approximately 50% of its basin has been infilled by erosional deposits delivered by torrential tributaries and small streams discharging into the reservoir. The reservoirs primarily serve hydropower generation but are also used for flood-wave attenuation, tourism, and recreation.

2.2. Sampling and Laboratory Analysis

Samples were collected at the same site in the pelagic (limnetic) zone of each reservoir during four surveys at monthly intervals in 2024: June (Va, Pa, Za), July (Vb, Pb, Zb), August (Vc, Pc, Zc), and October (Vd, Pd, Zd).
Water temperature (T), pH, dissolved oxygen (O2), and conductivity (EC) were measured in situ using a multiparameter WTW MultiLine 3410 (WTW, Weilheim, Germany). Water transparency (ZSD) was determined using a Secchi disk. To determine the thermal stratification depth, temperature, and dissolved oxygen were measured at 2 m intervals from the surface to 20 m depth in the Višegrad and Perućac Reservoirs and at 1 m intervals in the Zvornik Reservoir. A 1.2 L horizontal water sampler (LaMotte, Chestertown, MD, USA) was used to obtain a depth-integrated composite sample every 2 m up to a depth of 20 m in Višegrad and Perućac reservoirs, while in the Zvornik Reservoir, samples were collected to the maximum available depth of 11 m since this is the shallowest reservoir in the cascade. Subsamples for chemical analyses (1 L), chlorophyll a determination (1 L), and phytoplankton analysis (250 mL) were subsequently taken from this composite sample. Water samples (250 mL) for the quantitative analysis of phytoplankton were preserved using Lugol’s solution. Phytoplankton samples from Višegrad and Perućac Reservoirs were collected using a 25 μm mesh and vertically hauled from 20 m to the surface, while from the Zvornik Reservoir, the vertical sample spanned from 11 m to the surface. The samples were preserved with a 2% formaldehyde solution.
Laboratory water chemistry analyses included the quantification of total phosphorus (TP), total nitrogen (TN), nitrates (NO3), nitrites (NO2), ammonium (NH4+), total Kjeldahl nitrogen (TKN), total organic carbon (TOC), chemical oxygen demand (COD), total hardness (GH), chloride (Cl), and sulfate (SO42−). Chlorophyll a concentration was determined spectrophotometrically after filtration and ethanol extraction [27].
Phytoplankton analysis was conducted following the Utermöhl method [28] using an inverted microscope (Axiovert 5, Carl Zeiss®, Göttingen, Germany). Species determination was performed using standard taxonomic literature. Counting and cell measurements were performed according to CEN EN 15204 [29] and Lund et al. [30]. Algal biovolume was calculated using standard geometric approximations [31,32,33,34]. Phytoplankton biomass (mg L−1) was derived by assuming an equivalence of 1 mg biomass per 1 cm3 biovolume [35,36]. Diatoms were identified from permanent slides prepared after chemical sample treatment and mounting in Naphrax [37]. Species nomenclature and classification followed AlgaeBase [38].

2.3. Assessment of Trophic Status and Ecological Potential

The Carlson Trophic State Index [39] was applied for the assessment of trophic status, calculated from Secchi depth (TSISD; ZSD, m), chlorophyll a (TSIChl-a; Chl-a, µg L−1), and total phosphorus (TSITP; TP, µg L−1). In addition, trophic status was evaluated using threshold values for phytoplankton biomass [40], Secchi depth, chlorophyll a, and nutrients (TP), following boundaries given by OECD [41] and the Official Gazette (42/01) [22] (Appendix A Table A1).
The ecological potential of the Višegrad and Perućac reservoirs was assessed using the Hungarian Lake Phytoplankton Index [14]. HLPI integrates the normalized Ecological Quality Ratios (EQR) of two metrics: chlorophyll a concentration (EQRChl-a) and the Qk index (EQRQ). Qk is a compositional metric based on phytoplankton functional groups [11,12,13]. Normalized EQRChl-a values were derived using a polynomial equation adopted from the intercalibrated approach developed for deep Croatian lakes [42]. The Qk index was standardized (Qkstand) by dividing the calculated Qk value by the maximum Q value (Qkmax = 9). Qk_stand was subsequently transformed to EQRQk (HLPI) using a third-order polynomial regression equation, referenced to the hydromorphologically comparable deep Lake Peruća in Croatia [43].
The Hungarian River Phytoplankton Index (HRPI) [44] was applied for Zvornik Reservoir, given its location in the Peripannonian subregion, short water residence time, and absence of thermal stratification. This index is also based on chlorophyll a concentration and a compositional metric derived from phytoplankton functional groups (Qr). Qrstand was gained by dividing the calculated Qr value by a maximum value of 5 and subsequently normalised to EQRQr (HRPI) using a third-order polynomial regression equation, following the intercalibrated equations developed for reservoirs on large rivers with short residence times in the Pannonian ecoregion [45].
Class boundaries for ecological potential (good or better/moderate, moderate/poor, and poor/bad) were set as an equidistant division of the EQR gradient at 0.6, 0.4, and 0.2 [21] (Appendix A Table A2).
Total phosphorus (TP) thresholds were estimated in relation to EQR derived from the HLPI and HRPI indices using the Supporting Elements Toolkit [46]. In this approach, TP was treated as the pressure variable and EQR as the biological response, allowing threshold values to be defined statistically rather than arbitrarily. The analysis focused on class boundaries, and particularly the good/moderate transition was defined by the 75th percentile of the good class.

2.4. Data Analysis

The Shannon diversity index (H′, ln), Simpson index (1 − Λ), and Pielou’s evenness (J′) were calculated based on phytoplankton cell counts, whereas phytoplankton biomass was used in all subsequent statistical analyses. Community composition and characteristic taxa were explored using SIMPER and non-metric multidimensional scaling (nMDS) based on a Bray–Curtis similarity matrix, with overlaid vectors for the dominant species (based on the Pearson correlation of r > 0.5). Shade plots were used for visualisation of compositional data. Prior to analysis, biomass data were log-transformed using log(x + 1). Principal component analysis (PCA) based on Euclidean distance was applied to describe sample patterns regarding the physico-chemical variables. Differences in assemblage structure among the three reservoirs were tested using PERMANOVA. Homogeneity of multivariate dispersions among the reservoirs was assessed using PERMDISP, and significant differences were further explored using pair-wise PERMANOVA tests [47]. All of the aforementioned analyses were performed in PRIMER v6 [48]. Spearman’s rank correlations were computed among physico-chemical parameters, the HLPI index, chlorophyll a, phytoplankton biomass, and TSI values. ANOVA was applied to test for differences in total biomass, chlorophyll a, TSIavg, and EQR values among groups defined by reservoir and by sampling months. These two analyses were performed in IBM SPSS Statistics, version 25.0 [49].

3. Results

3.1. Physico-Chemical Parameters

Results of the physico-chemical water analyses are presented in Appendix A Table A3. Water temperature ranged from 16.5 °C (Zd) to 26.0 °C (Pa). Thermal stratification down to 20 m depth was recorded in the Višegrad Reservoir (monthly temperature range: 5.4–9.0 °C) and the Perućac Reservoir (1.9–8.3 °C). Profiles Va, Vb, and Vc indicated clear thermal stratification, with the most pronounced thermoclines occurring at 2–4 m, 3–5 m, and 6–12 m depth, respectively. In contrast, profile Vd in October showed a weak thermal gradient without a sharply defined thermocline. Similarly, the temperature profiles in Perućac indicated clear thermal stratification in Pa, Pb, and Pc, with the most pronounced thermocline occurring at 4–8 m in Pa and at 6–8 m in Pb and Pc, whereas Pd showed a weak gradual temperature decline and no clearly developed thermocline. In contrast, temperatures in the Zvornik Reservoir profiles were largely homogeneous with a narrow vertical temperature range (0.4–1.5 °C) from the surface to the maximum sampling depth of 11 m.
Secchi depth varied between 1.2 m (Zd) and 5.91 m (Pd). Dissolved oxygen concentrations ranged from 8.48 mg L−1 (Zb) to 11.04 mg L−1 (Vb). Across all reservoirs, pH remained slightly alkaline, ranging from 8.00 to 8.35. Electrical conductivity was low and showed little spatio-temporal variation (276–300 µS cm−1).
Total nitrogen (TN) reached its lowest and highest values in spring and autumn (2.14 and 5.96 mg L−1, respectively) in the Zvornik Reservoir. The highest concentration of nitrates (NO3) occurred in the Višegrad Reservoir in autumn (4.7 mg L−1), whereas the Perućac Reservoir consistently displayed the lowest concentration of nitrates (1.36–2.47 mg L−1). Values of nitrites were generally very low at all sampling sites (≤0.01 mg L−1), with a slight increase observed in autumn at Perućac (0.012 mg L−1). The maximum measured concentration of ammonium was 1.31 mg L−1 (Vd).
Total phosphorus (TP) values ranged from 15 to 53 µg L−1 (Zd and Zc, respectively). Total organic carbon (TOC) peaked at 3.53 mg L−1 (Vb, Pc) and reached its lowest value at 2.13 mg L−1 (Zc). Chemical oxygen demand (COD; mg O2 L−1) varied widely, from 1.92 (Zc) to 13.44 (Vd). Total hardness ranged from 5.32 °dGH (Vc, Pc) to 11.2 °dGH (Pb, Zb). Sulfates and chlorides were uniformly low at all sampling sites.
Statistically significant positive correlations, assessed using Spearman’s rank correlation coefficient (p < 0.05; r > 0.67), were observed between temperature and oxygen saturation, temperature and chloride concentration, dissolved oxygen and total organic carbon, total nitrogen and nitrate concentrations, and ammonium and sulfate concentrations. Statistically significant negative correlations (p < 0.05; r < −0.67) were found between electrical conductivity and oxygen saturation, nitrite and total phosphorus, total Kjeldahl nitrogen and water hardness, and chloride and sulfate concentrations.
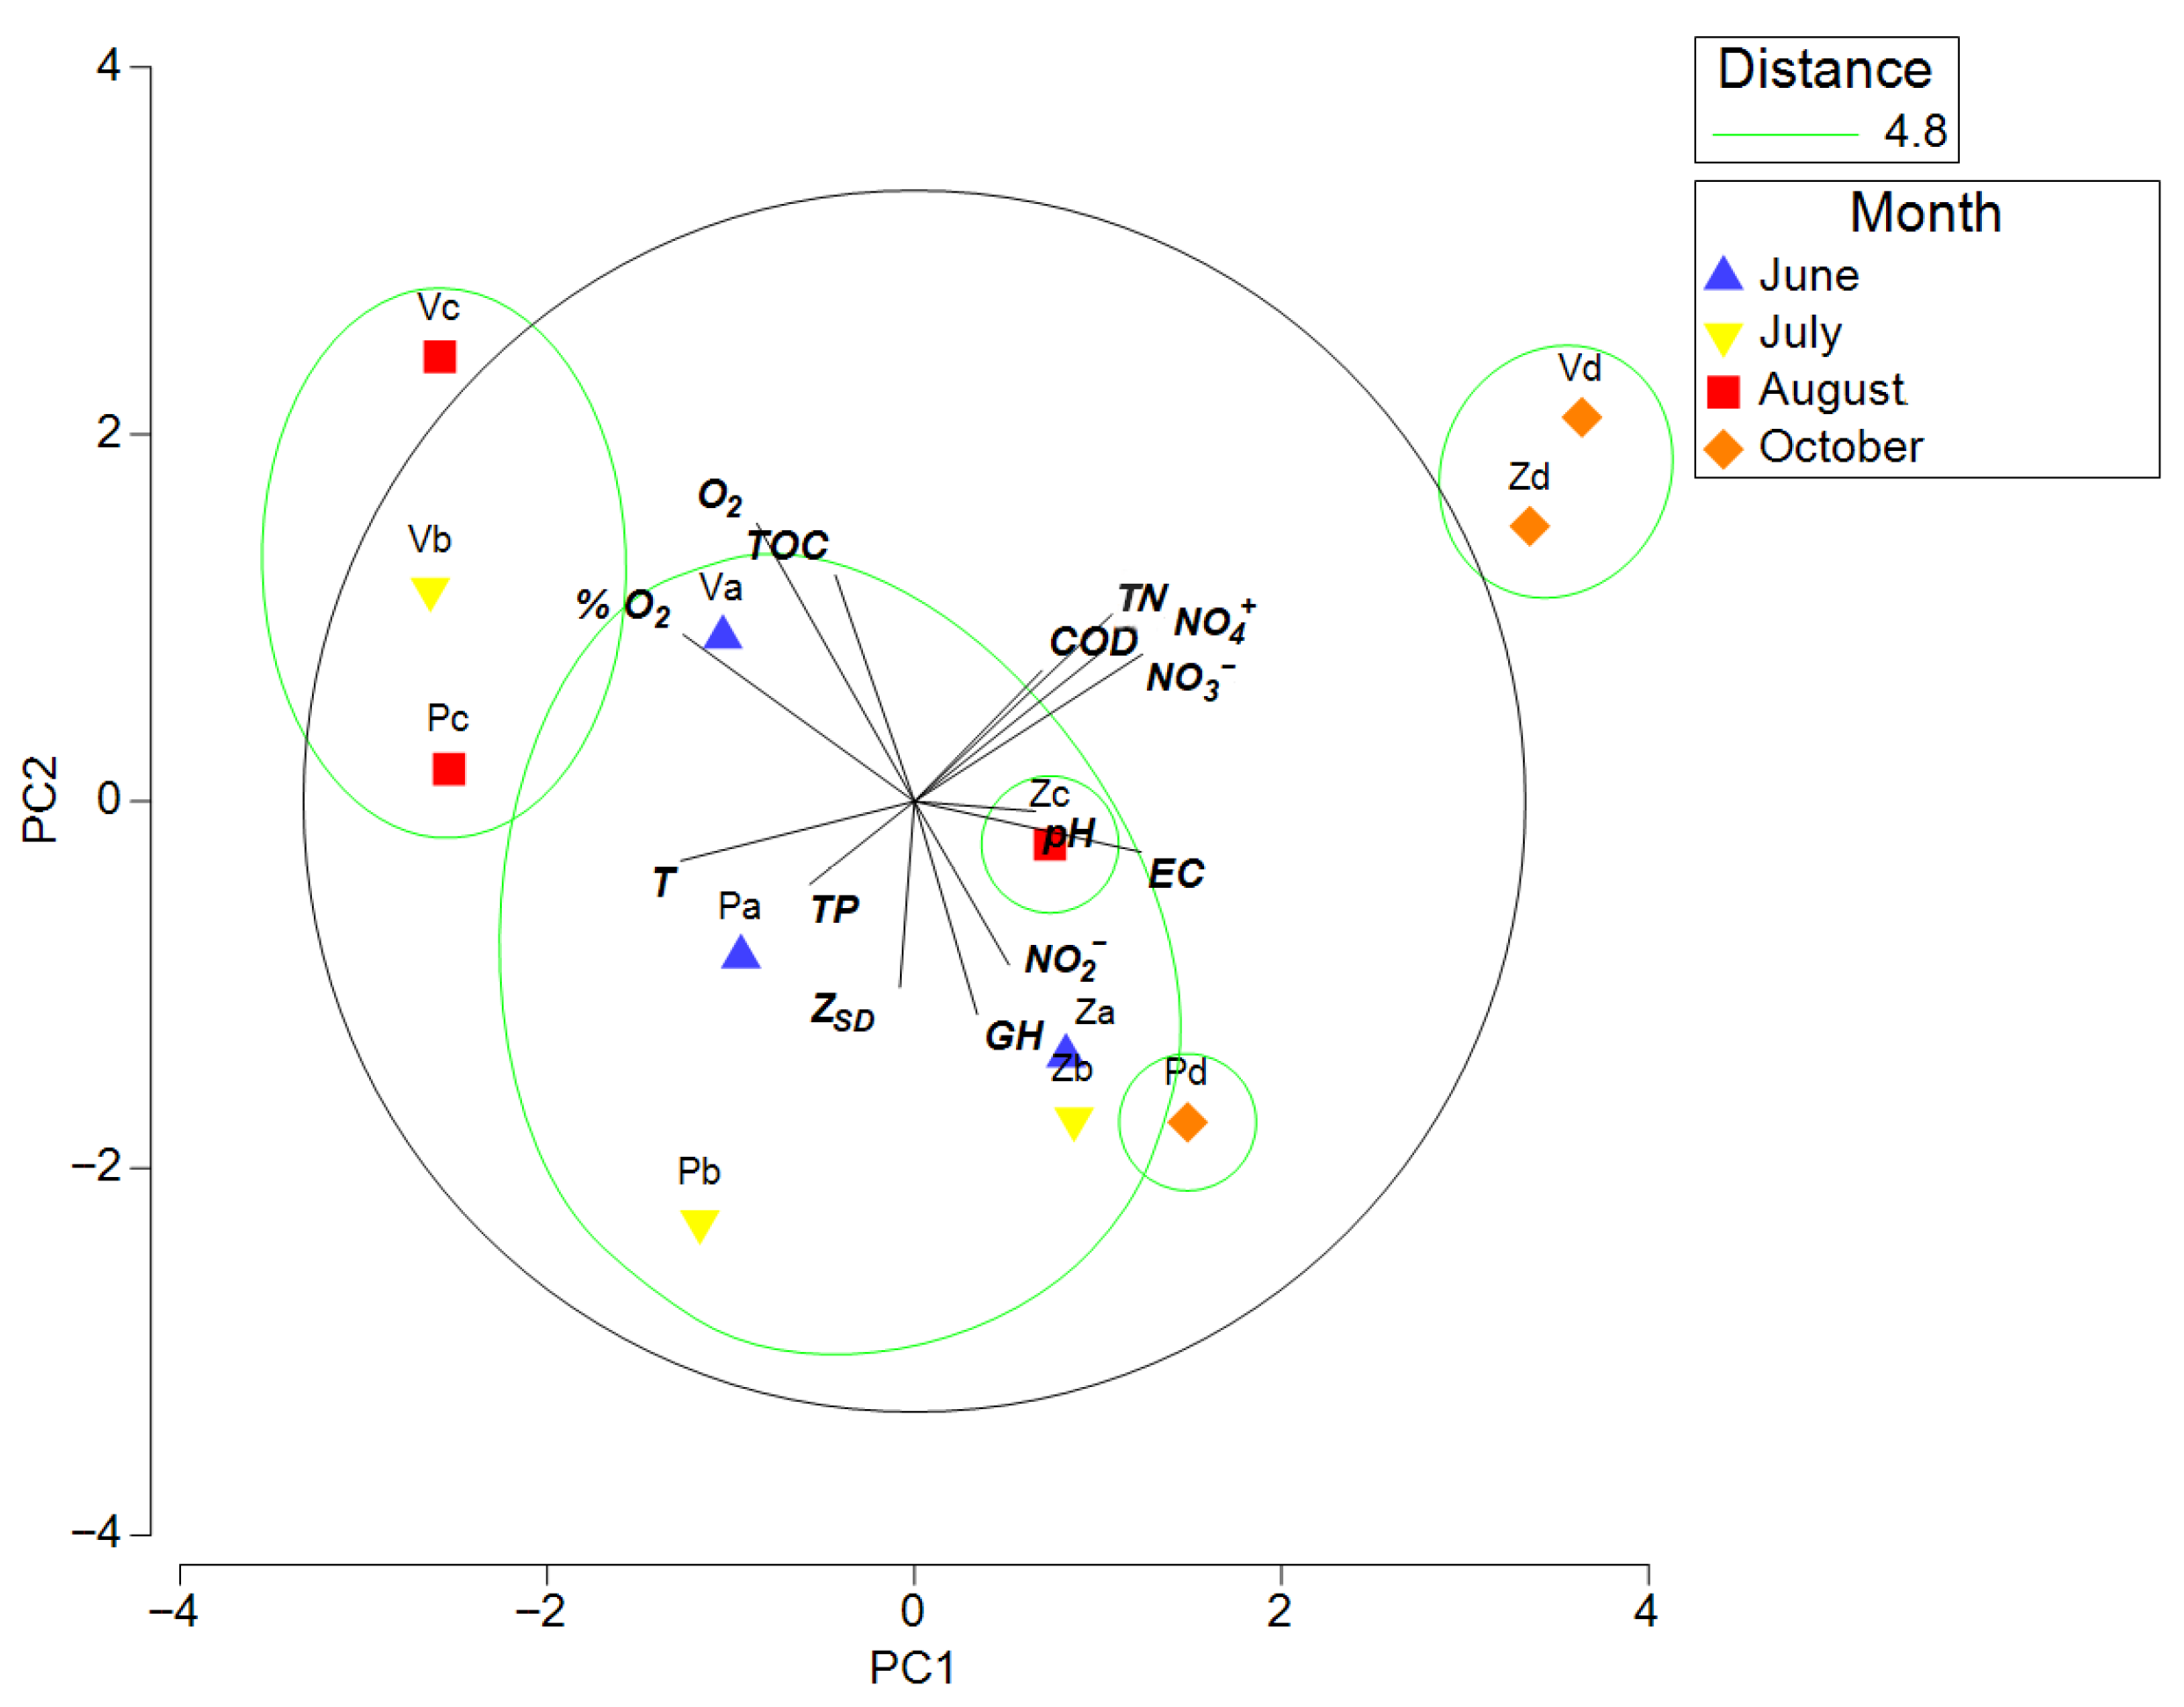
Principal component analysis (PCA) of the 14 environmental variables indicated that the first 2 principal component axes explained 52.4% of the total variance (Appendix A Table A4). Axis 1 was primarily associated with temperature, oxygen saturation, and nitrates (intra-set correlations: −0.382, −0.378, and 0.373, respectively). Axis 2 was driven mainly by dissolved oxygen, total organic carbon, and total hardness (intra-set correlations: 0.455, 0.370, and −0.349, respectively). The ordination (Figure 2) identified three main clusters (Euclidean distance of 4.8), while two samples were positioned outside these groups. The first group comprised all samples collected in June and July (except Vb), the second cluster included sample Vb together with two samples from August marked by the highest values of O2 and TOC, while the third group consisted of samples from October defined by the highest values of TN. Two samples, Zc (in Zvornik in August, with the highest value of TP) and Pd (in Perućac in October, with the highest nitrite), did not cluster with the others.

3.2. Description of Phytoplankton Community

In total, 80 phytoplankton taxa were identified (52 in the Višegrad Reservoir, 37 in the Perućac Reservoir, and 49 in the Zvornik Reservoir). The taxa were assigned to six major taxonomic groups: Charophyta (6), Chlorophyta (27), Cryptista (5), Cyanobacteria (8), Dinoflagellata (2), and Heterokontophyta (32). Within Heterokontophyta, Bacillariophyceae comprised 16 taxa, Mediophyceae 8 taxa, Coscinodiscophyceae 2 taxa, and Chrysophyceae 6 taxa. Within Charophyta, Zygnematophyceae was the most species-rich class, with 5 taxa (Table A5).
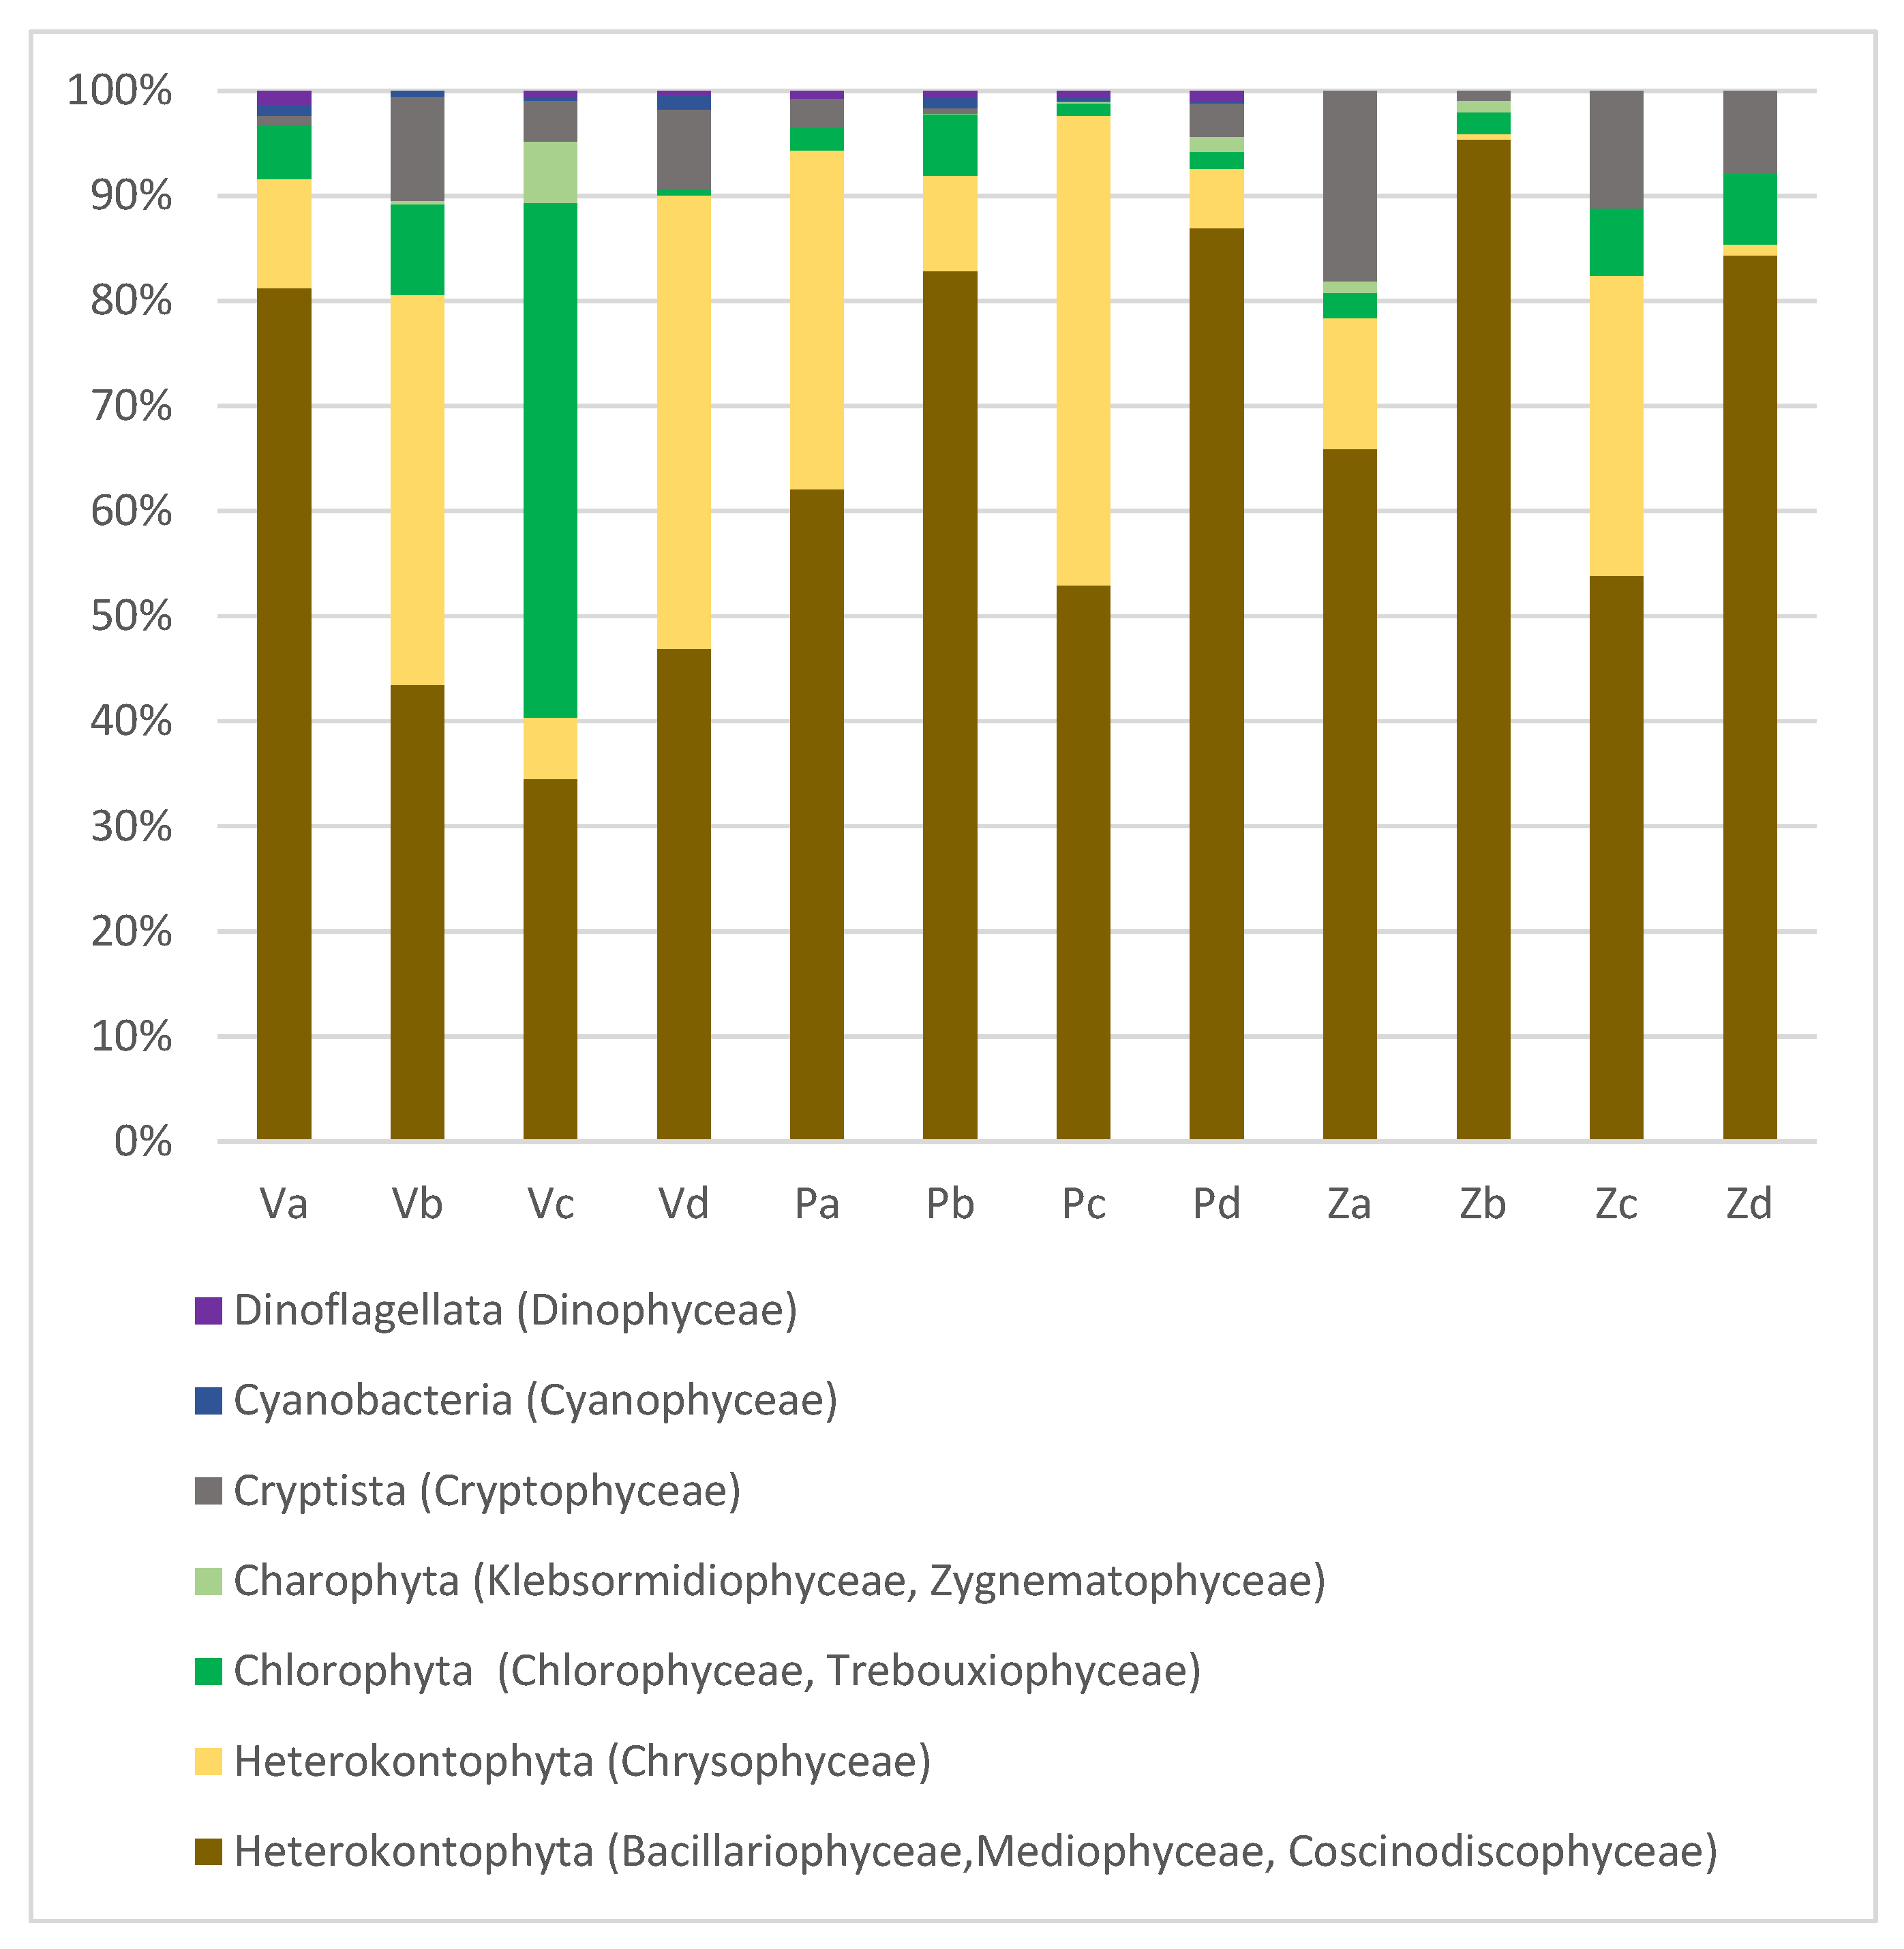
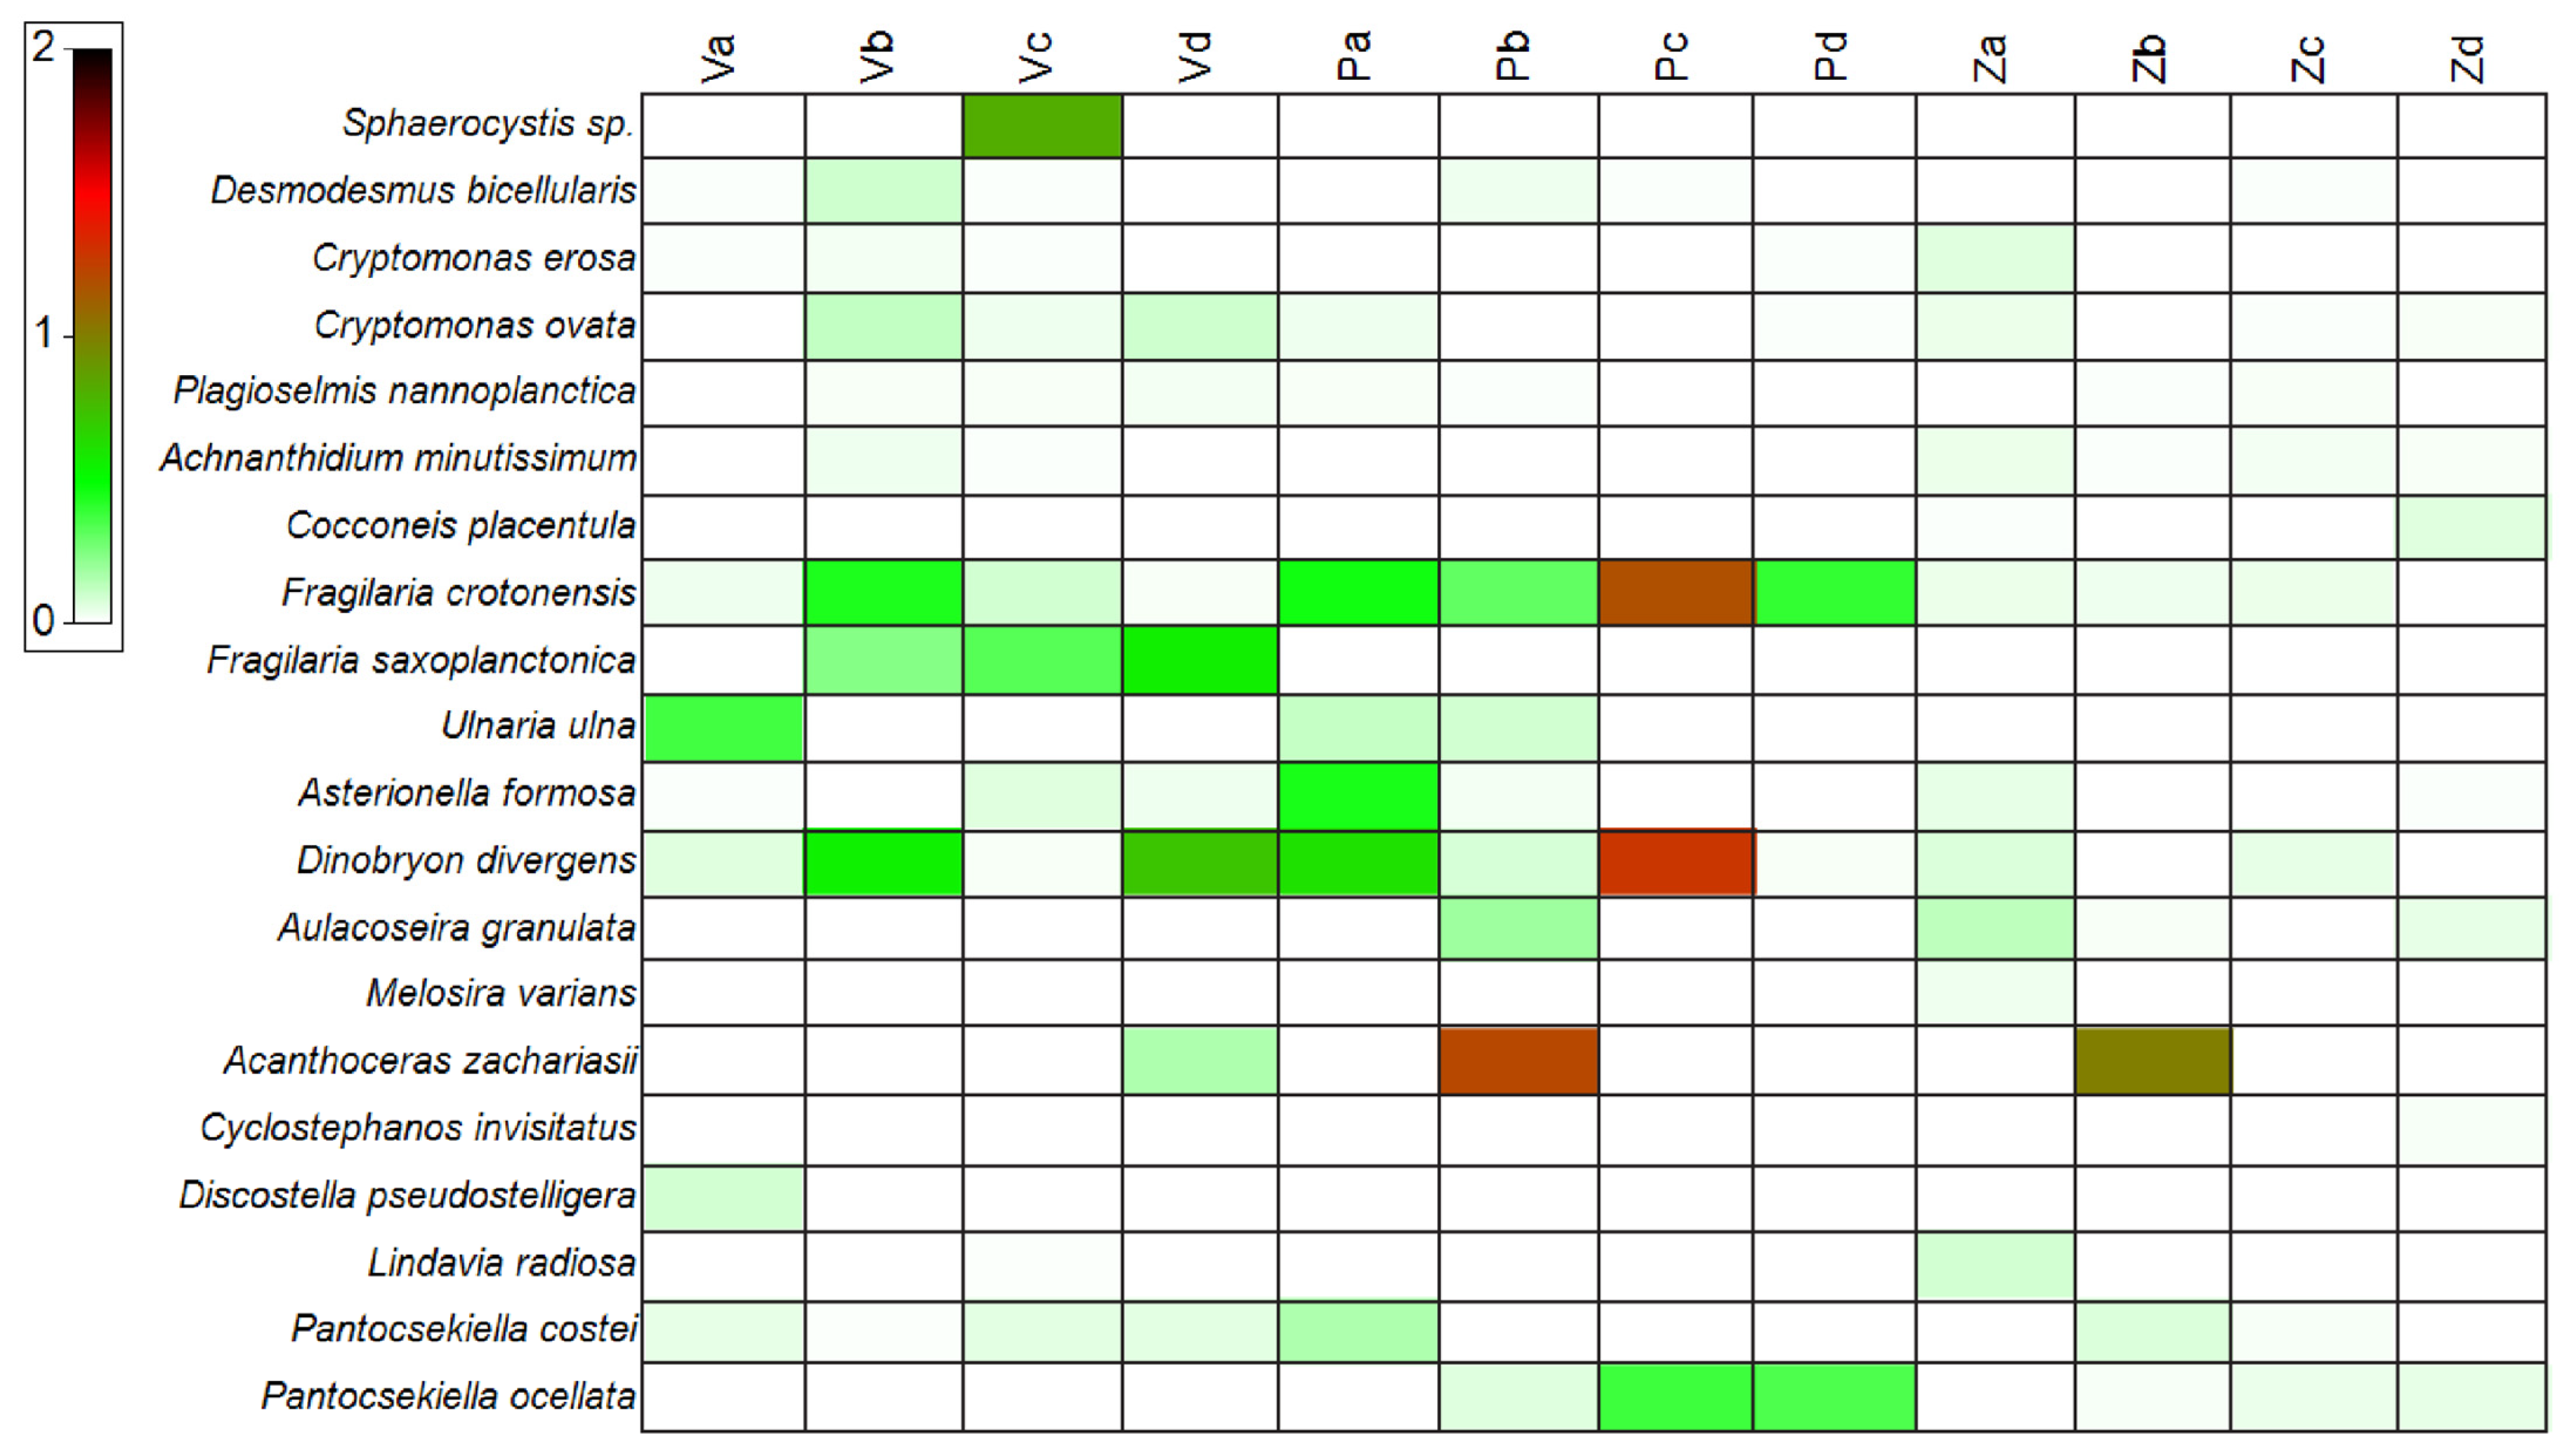
Heterokontophyta, dominated by diatoms (Figure 3), prevailed in biomass across all reservoirs and sampling months (43.5–95.4%), except in August in the Višegrad Reservoir, when Chlorophyta was the dominant group (49%), driven primarily by Sphaerocystis sp. (sample Vc). The most frequently recorded diatoms included Fragilaria crotonensis Kitton and Asterionella formosa Hassall, present in all reservoirs, Fragilaria saxoplanctonica Lange-Bertalot & S. Ulrich (in Vb, Vc, Vd), Ulnaria ulna (Nitzsch) Compère (in Va, Pa), Acanthoceras zachariasii (Brun) Simonsen (in Zb, Pb, Zd), and Pantocsekiella ocellata (Pantocsek) K.T. Kiss & Ács (in Pc, Pd).
Within Heterokontophyta, chrysophytes, particularly Dinobryon divergens O.E. Imhof, also contributed substantially to the total phytoplankton biomass in the Perućac Reservoir during June and August (samples Pa and Pc with 32.3% and 44.7%, respectively), in the Zvornik Reservoir during August (sample Zc with 26.6%), and in the Višegrad Reservoir during July and October (samples Vb and Vd with 37.1% and 43.1%, respectively). The Zvornik and Višegrad reservoirs were further characterized by the presence of Cryptista (including Cryptomonas erosa Ehrenberg, Cryptomonas ovata Ehrenberg, and Plagioselmis nannoplanctica (Skuja) G. Novarino, I.A.N. Lucas & Morrall), reaching from 18% to 11% of the relative biomass contribution in July (sample Vb) and August (sample Zc).
The highest phytoplankton biomass was recorded in the Perućac Reservoir during late August (Pc), where Dinobryon divergens and Fragilaria crotonensis reached 1.27 and 1.18 mg L−1, respectively (Figure 4). Both taxa were also abundant in the Višegrad Reservoir, but their contribution declined toward the Zvornik Reservoir. Acanthoceras zachariasii was another important contributor, codominating in Perućac (Pb: 1.21 mg L−1) and remaining abundant in Zvornik (Zb: 0.99 mg L−1). In the Perućac Reservoir, Asterionella formosa and Pantocsekiella ocellata were also present as subdominant taxa.
The seasonal variation in species composition among the reservoirs is shown as follows. In Višegrad, dominance shifted from Ulnaria ulna (Nitzsch) Compèrein June to D. divergens in July and October, while Sphaerocystis sp. prevailed in late August (Vc: 0.81 mg L−1). In Perućac, June biomass was mainly shared by D. divergens, F. crotonensis, and A. formosa, followed by the dominance of A. zachariasii in July and renewed codominance of D. divergens and F. crotonensis in late August. In October, F. crotonensis remained an important species together with P. ocellata. The Zvornik Reservoir was characterized by dominance of Aulacoseira granulata (Ehrenberg) Simonsen in June, the July peak of A. zachariasii, codominance of Pantocsekiella costei (J.C.Druart & F.Straub) K.T.Kiss & E.Ács, Pantocsekiella ocellata (Pantocsek) K.T.Kiss & Ács, D. divergens, and F. crotonensis in August, and a peak of Cocconeis placentula Ehrenberg, A. granulata, P. ocellata in October.
Analysing species diversity, the highest number of taxa was recorded in the Višegrad Reservoir sample collected in late summer (Vc: S = 31), whereas the lowest richness was observed in the Perućac Reservoir sample collected in June (Pa: S = 16). The lowest cell density (543,760 cells L−1) occurred in sample Zd, which also exhibited the highest values of the Shannon diversity index (H′ loge = 2.67), Simpson’s diversity (1 − Λ = 0.91), and Pielou’s evenness (J′ = 0.89). In contrast, the highest cell density (12,863,038 cells L−1) was counted in sample Va, where the lowest diversity and evenness values were detected (H′ loge = 0.56; 1 − Λ = 0.20; J′ = 0.18) (Table 2).
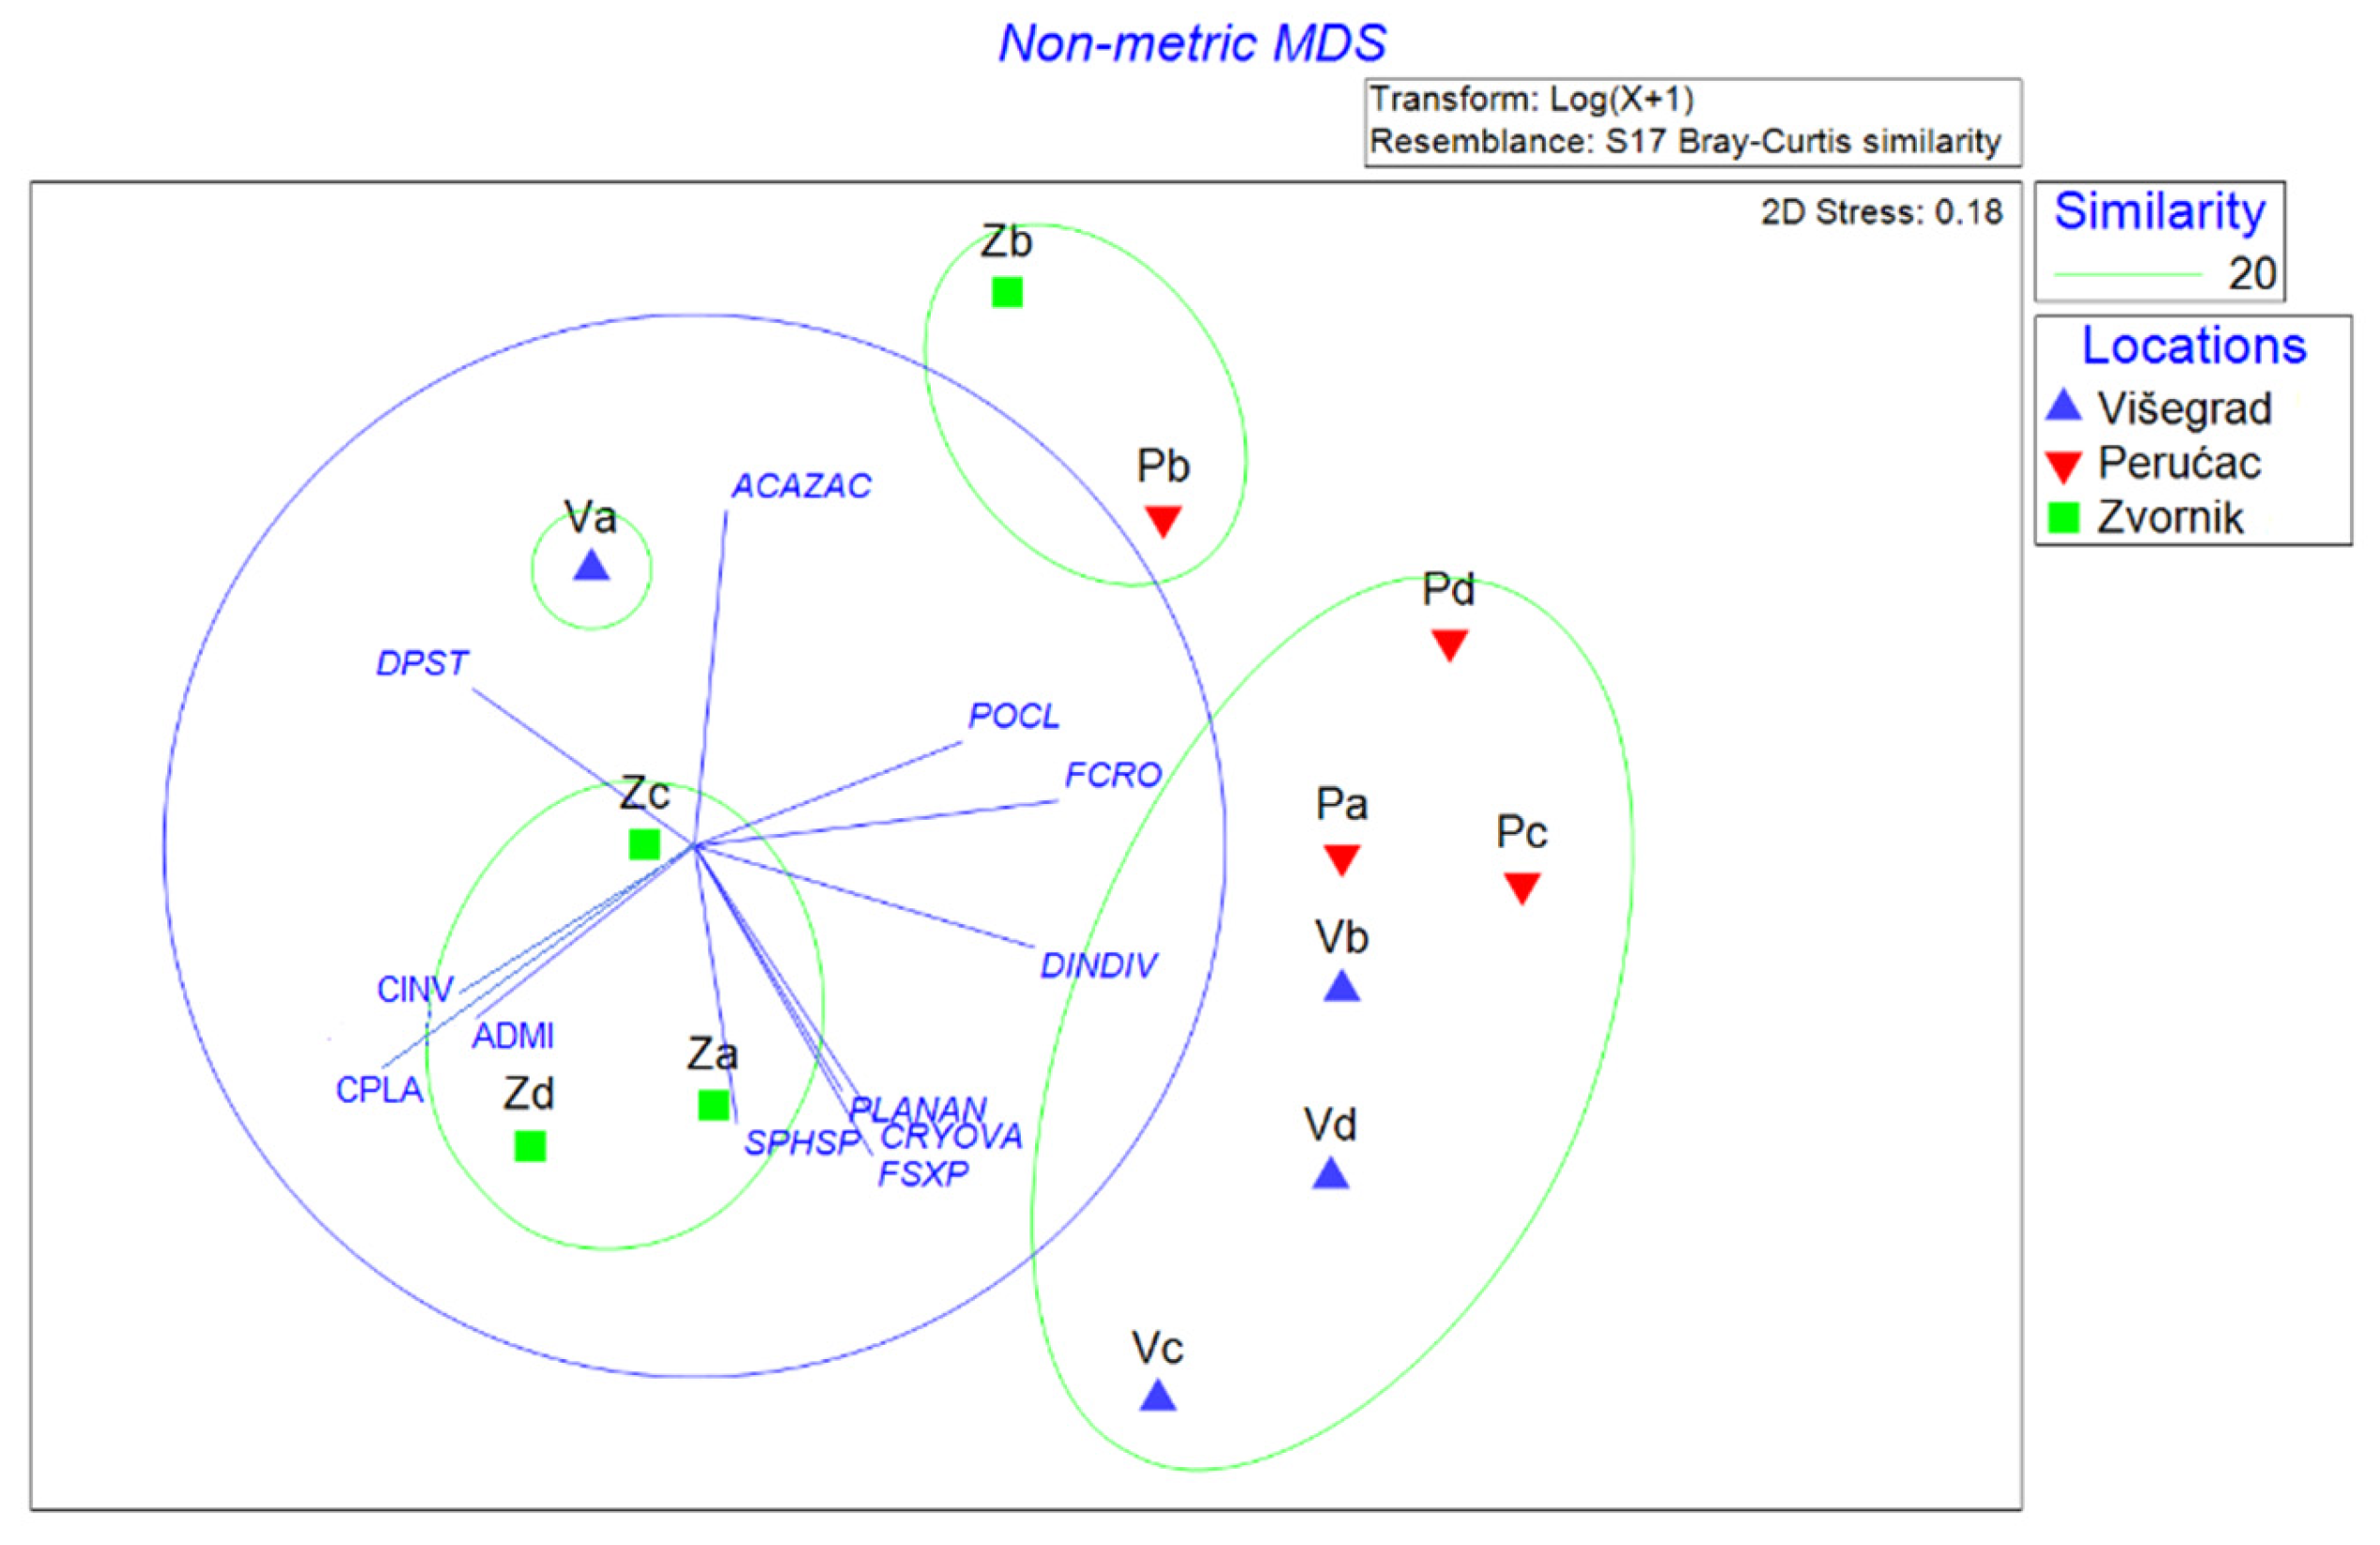
Non-metric multidimensional scaling (nMDS) of phytoplankton species composition at a 20% similarity level grouped samples into three clusters, with sample Va remaining unassigned (Figure 5). The first cluster comprised samples from the Zvornik Reservoir (Za, Zc, Zd), characterized by the occurrence of Cyclostephanos invisitatus (M.H. Hohn & Hellerman) E.C. Theriot, Stoermer & Håkanasson, Cocconeis placentula, and Achnanthidium minutissimum (Kützing) Czarnecki. The second cluster included samples from the Višegrad and Perućac reservoirs, typified by D. divergens, F. crotonensis, P. ocellata, Sphaerocystis sp., P. nannoplanctica, C. ovata, and F. saxoplanctonica. The third cluster consisted of samples Zb and Pb, distinguished by A. zachariasii. Sample Va was characterized by Discostella pseudostelligera (Hustedt) Houk & Klee.
PERMANOVA analysis based on a Bray–Curtis similarity matrix revealed a significant effect of reservoir on assemblage structure (Pseudo-F = 2.151, p = 0.024). PERMDISP showed no significant differences in multivariate dispersion among the locations (F = 1.3318, p = 0.482), indicating that the spatial pattern detected by PERMANOVA was not driven by differences in within-group variability. Pairwise PERMANOVA tests did not detect significant differences between individual reservoir pairs, although the comparison between Perućac and Zvornik approached marginal significance (t = 2.0185, p = 0.054), suggesting that this pair contributed strongly to the observed spatial differentiation. Overall, the results indicate a moderate, marginally supported spatial differentiation in assemblage structure among the reservoirs.
SIMPER analysis identified samples from the Perućac Reservoir as the most similar to each other (35.88%), followed by those from the Višegrad Reservoir (25.77%), while samples from the Zvornik Reservoir showed the lowest within-group similarity in terms of monthly dynamics (19.62%) (Table 3). The highest species contributions within each reservoir group were from F. saxoplanctonica for Višegrad (30.9%), F. crotonensis for Perućac (58.81%), and P. costei for Zvornik (18.32%). SIMPER analysis based on the sampling month showed the greatest similarity among July samples (30.61%), largely driven by the biomass contribution of A. zachariasii. In contrast, the lowest similarity was recorded in autumn (October; 8.02%), with notable contributions from P. ocellata and C. ovata. Across both grouping schemes (reservoirs and months), D. divergens (except in July) and F. crotonensis (except in October) consistently contributed to group similarities.

3.3. Description of Phytoplankton Functional Groups

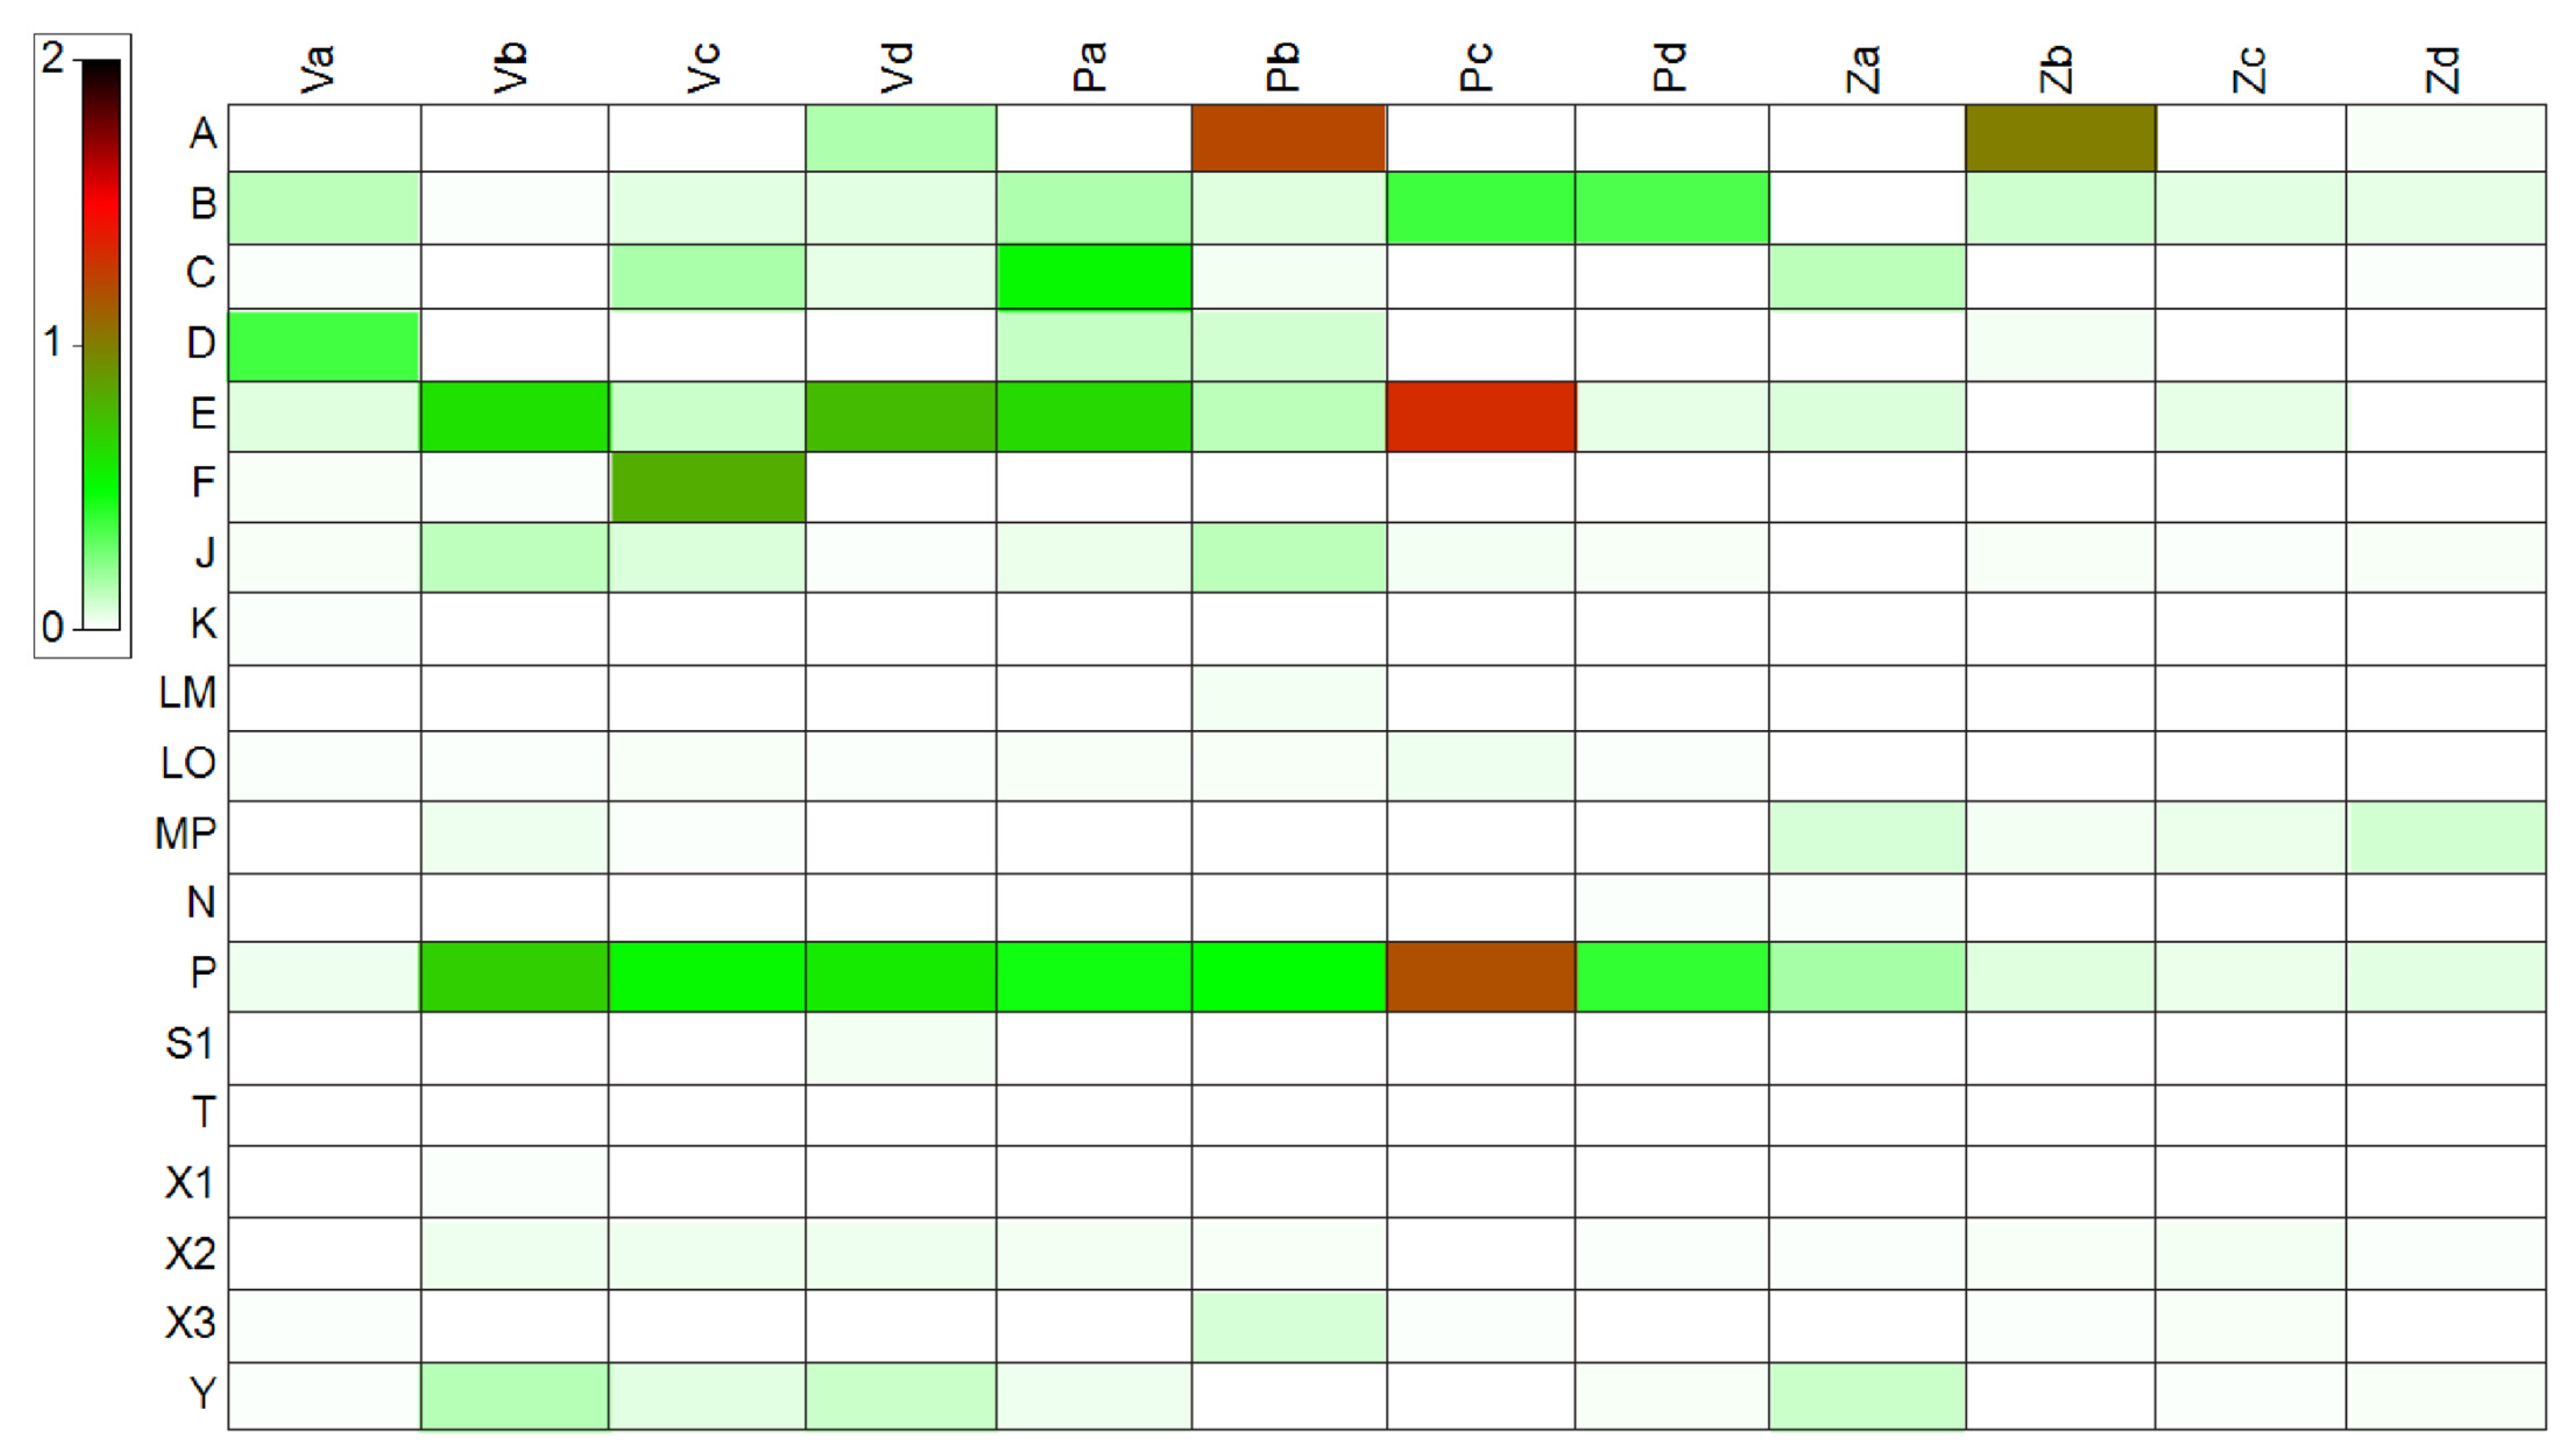
A total of 19 functional groups were identified (Appendix A Table A5). The highest biomass contribution was recorded for functional group E in the Perućac Reservoir in August (Pc: 1.31 mg L−1), and it was also present in the Višegrad Reservoir. Functional group A exhibited high biomass in the Perućac Reservoir in July (Pb: 1.21 mg L−1) and slightly lower values in the Zvornik Reservoir in July (Zb: 0.99 mg L−1). Functional group P reached its maximum biomass in the Perućac Reservoir (Pc: 1.18 mg L−1) and was continuously represented across all three reservoirs, with varying biomass contributions (Figure 6).
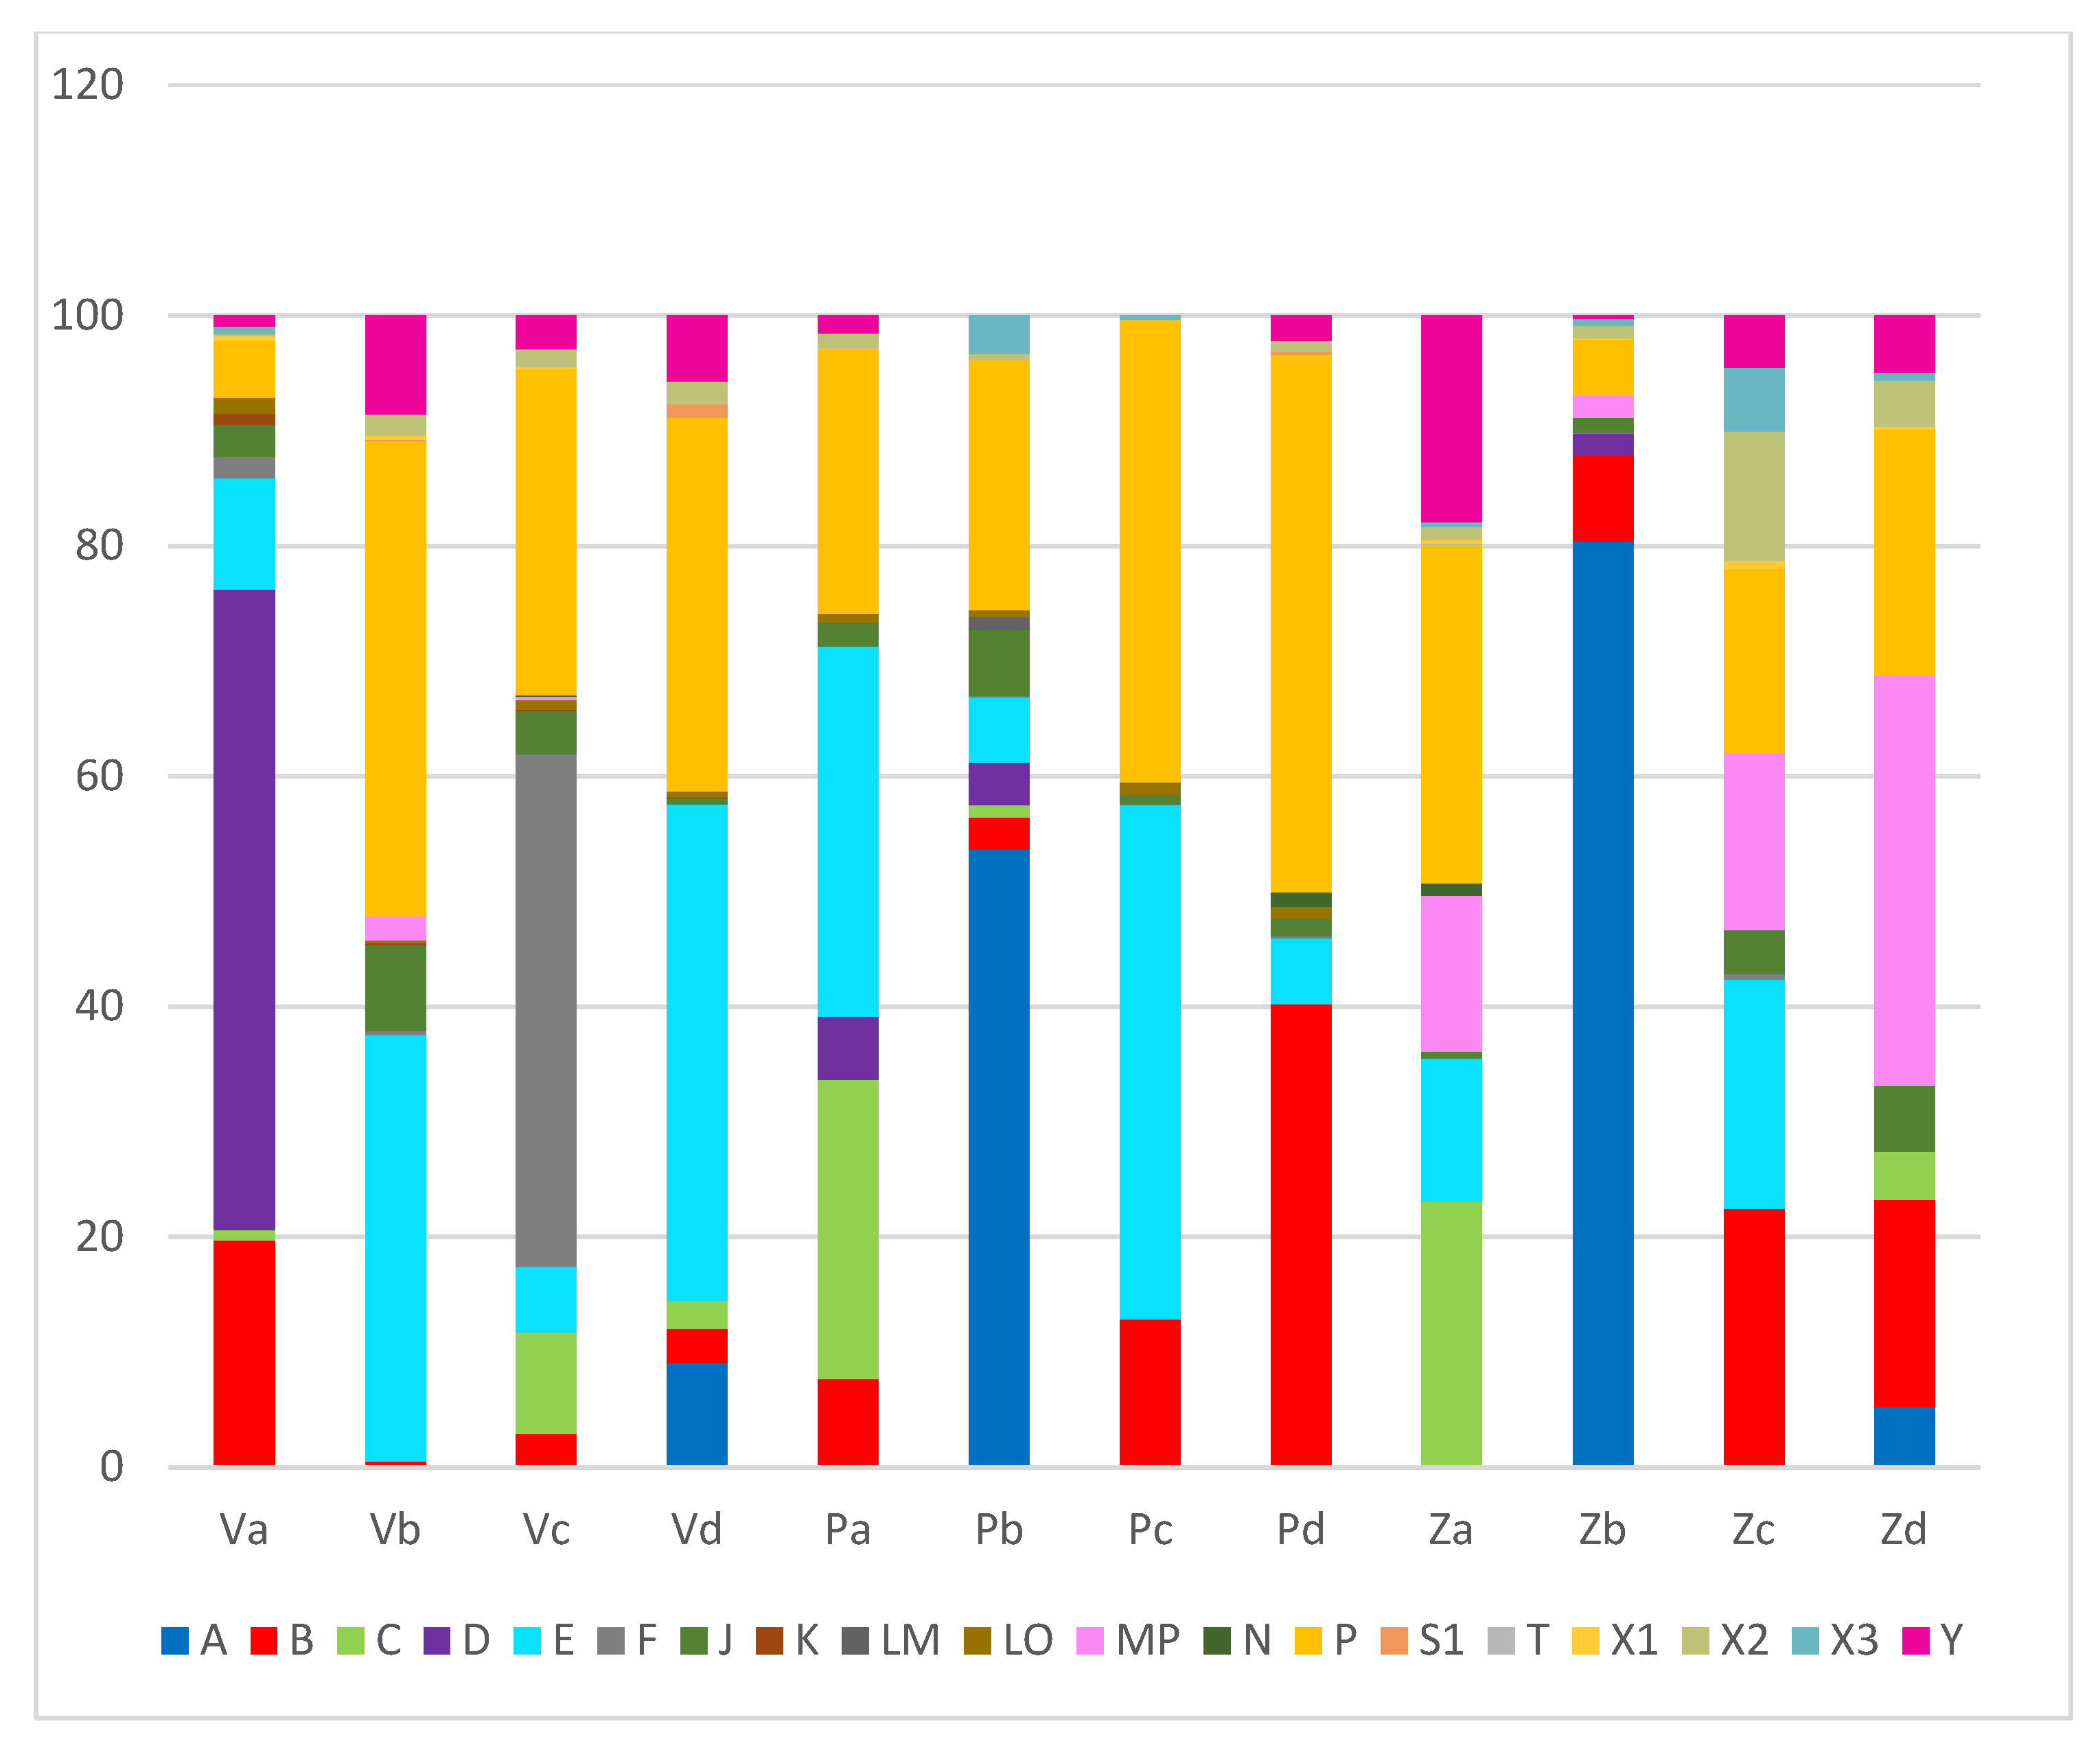
The relative contribution of functional groups varied among reservoirs and sampling months (Figure 7). In the Višegrad Reservoir, functional group D dominated in June (Va: 55%), whereas groups B and E were subdominant (19% and 9%, respectively). In July (Vb), functional groups P and E accounted for most of the biomass (41% and 37%), with a notable contribution from groups Y (8.6%) and J (7.4%). In August (Vc), group F was dominant (44.5%), while P remained substantial (28%) and group C increased to 7%. In October (Vd), functional group E (43%) dominated together with P (32.5%), while in the Perućac Reservoir, functional groups E, C, and P contributed most to biomass in June (Pa; 32%, 26%, and 23%, respectively). In July (Pb), group A dominated (56%), whereas P remained an important contributor (21%). In August (Pc), codominance of groups E and P was observed (45% and 40%), with group B contributing 13%. During autumn (Pd), group P again became dominant (47%), while group E was replaced by group B (6% and 40%, respectively). In the Zvornik Reservoir, the most abundant groups in June (Za) were P, C, Y, MP, and E (29%, 23%, 18%, 14%, and 12%, respectively). In July (Zb), group A showed an overwhelming dominance (80%), whereas group B contributed 8% of the relative phytoplankton biomass. In August (Zc), group A was not recorded in the biomass. Instead, groups B, E, MP, and P co-dominated, accounting for 22%, 20%, 15%, and 16%, respectively. In October (Zd), group A reappeared but with a much smaller share (5%), while groups C, MP, and P contributed 18%, 36%, and 21% of the relative phytoplankton biomass, respectively.
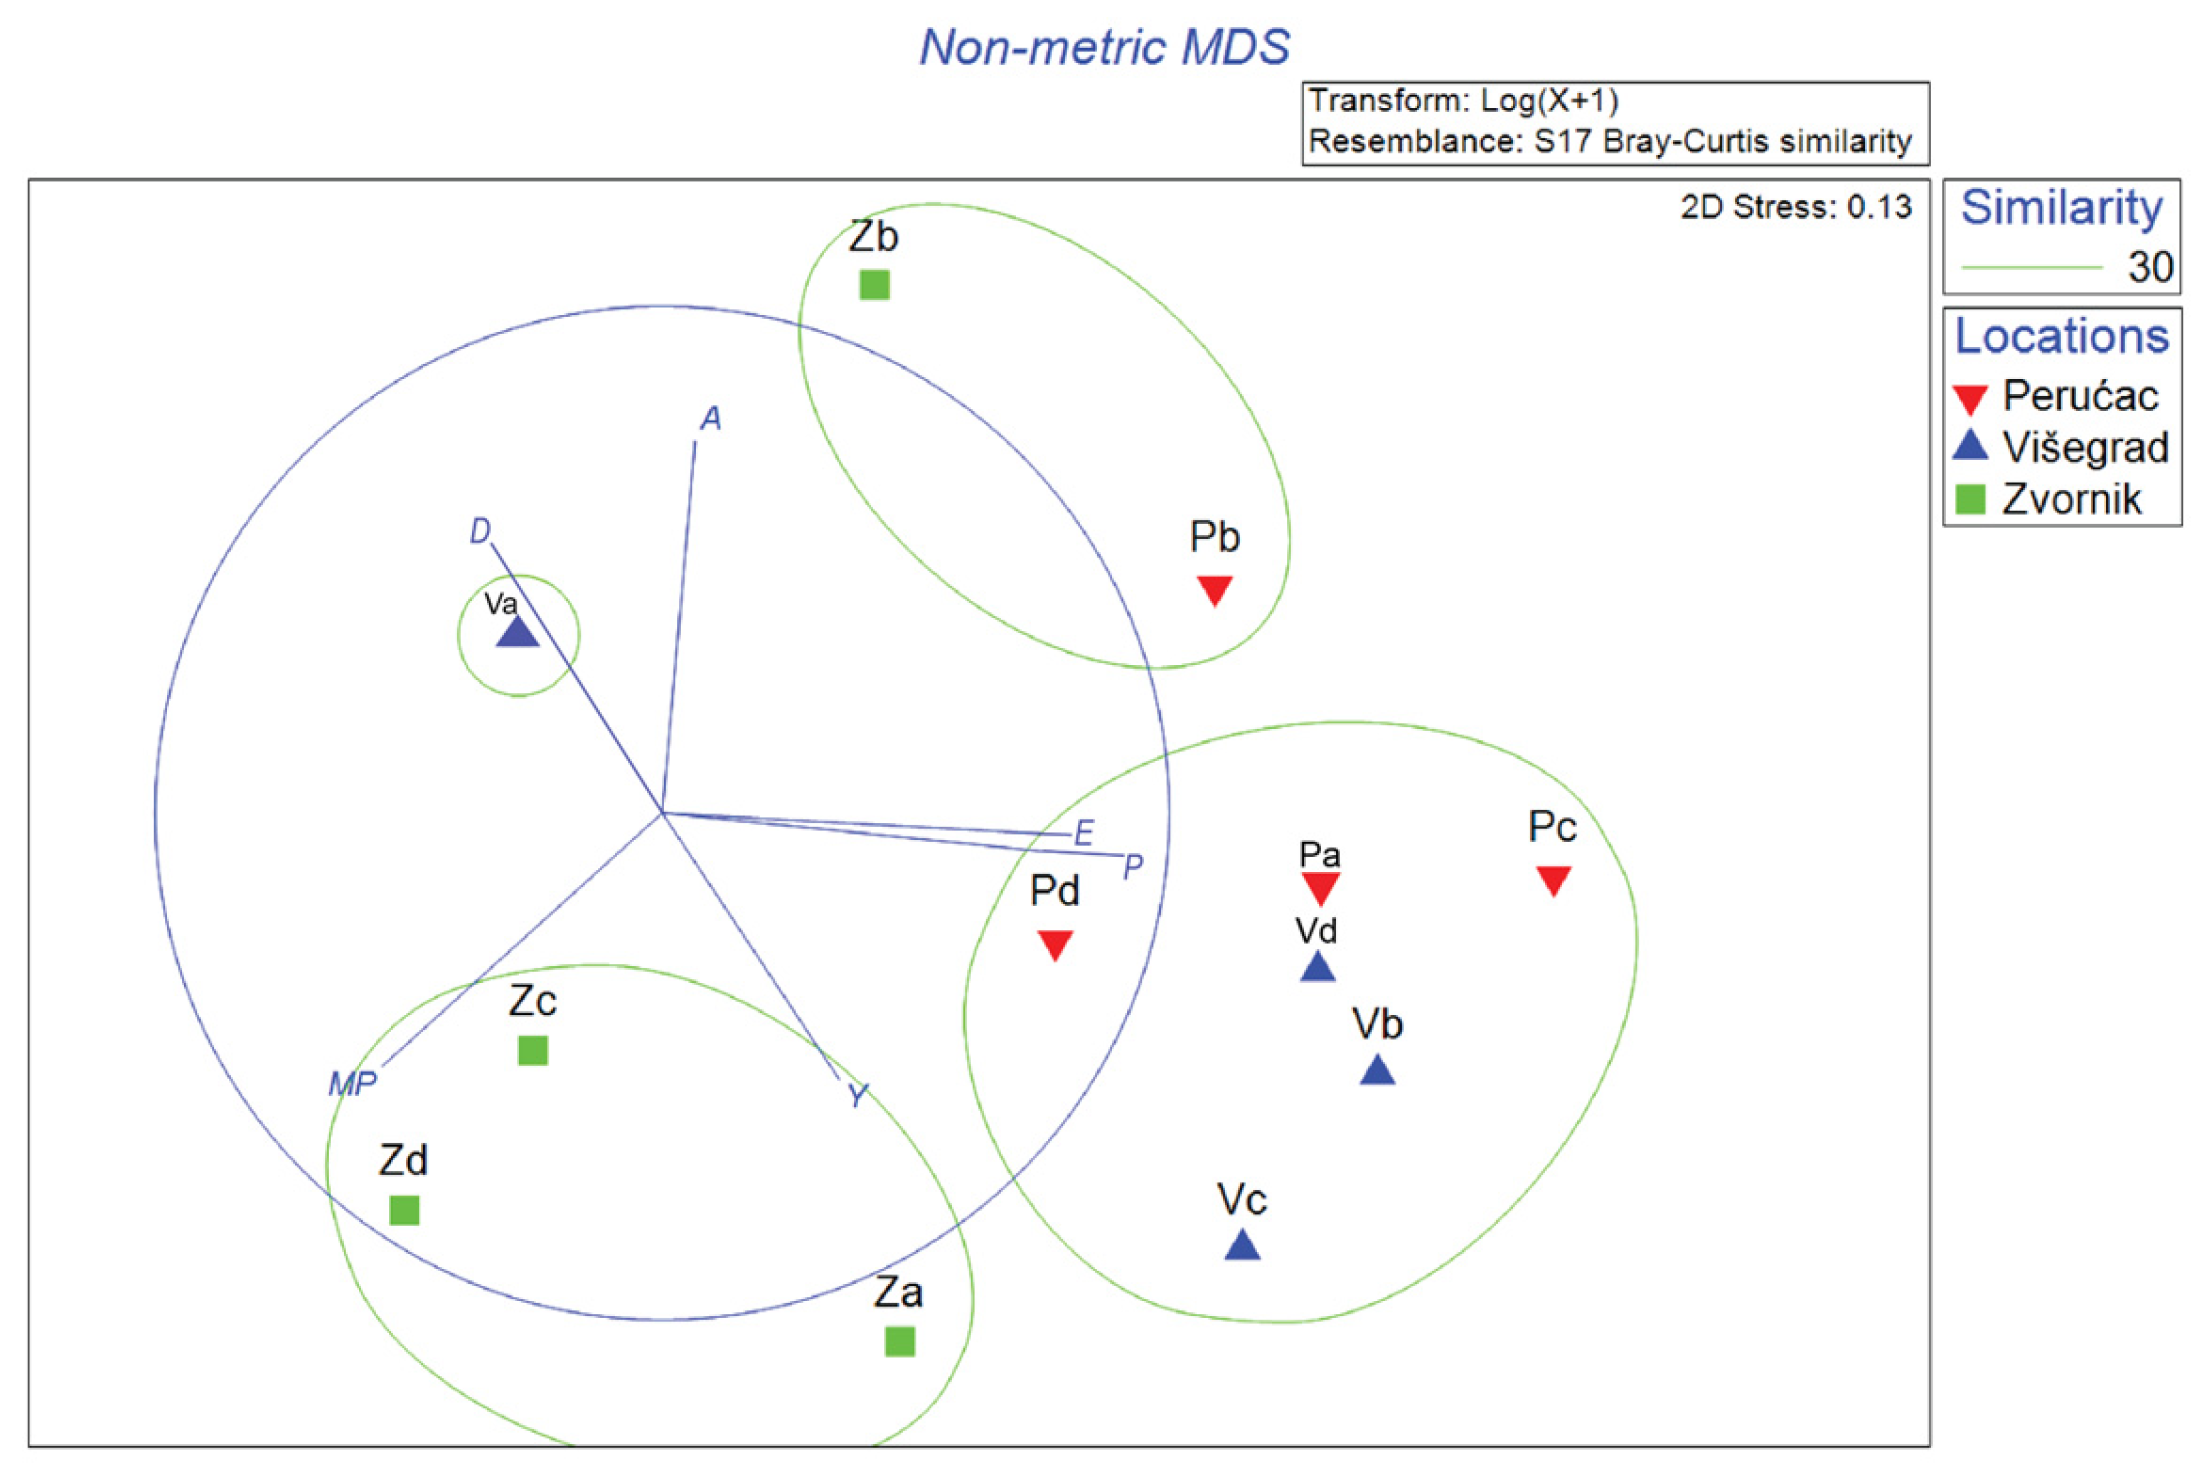
Non-metric multidimensional scaling (nMDS) based on phytoplankton functional groups produced the same sample-grouping pattern as the species-composition approach with a higher similarity threshold (30%), yielding three clusters and one unassigned sample (Figure 8). Applying Pearson correlation vectors (r > 0.5) for functional groups to the ordination, the cluster of samples from the Zvornik Reservoir (Zc, Za, Zd) was primarily associated with functional groups MP and Y. The second cluster, including samples from the Višegrad and Perućac reservoirs, was primarily associated with functional groups E and P. The July samples from the Perućac and Zvornik reservoirs (Pb and Zb) formed a distinct cluster driven by functional group A, whereas the unassigned sample was characterised by functional group D.

3.4. Trophic Status and Ecological Potential of the Cascade Reservoirs

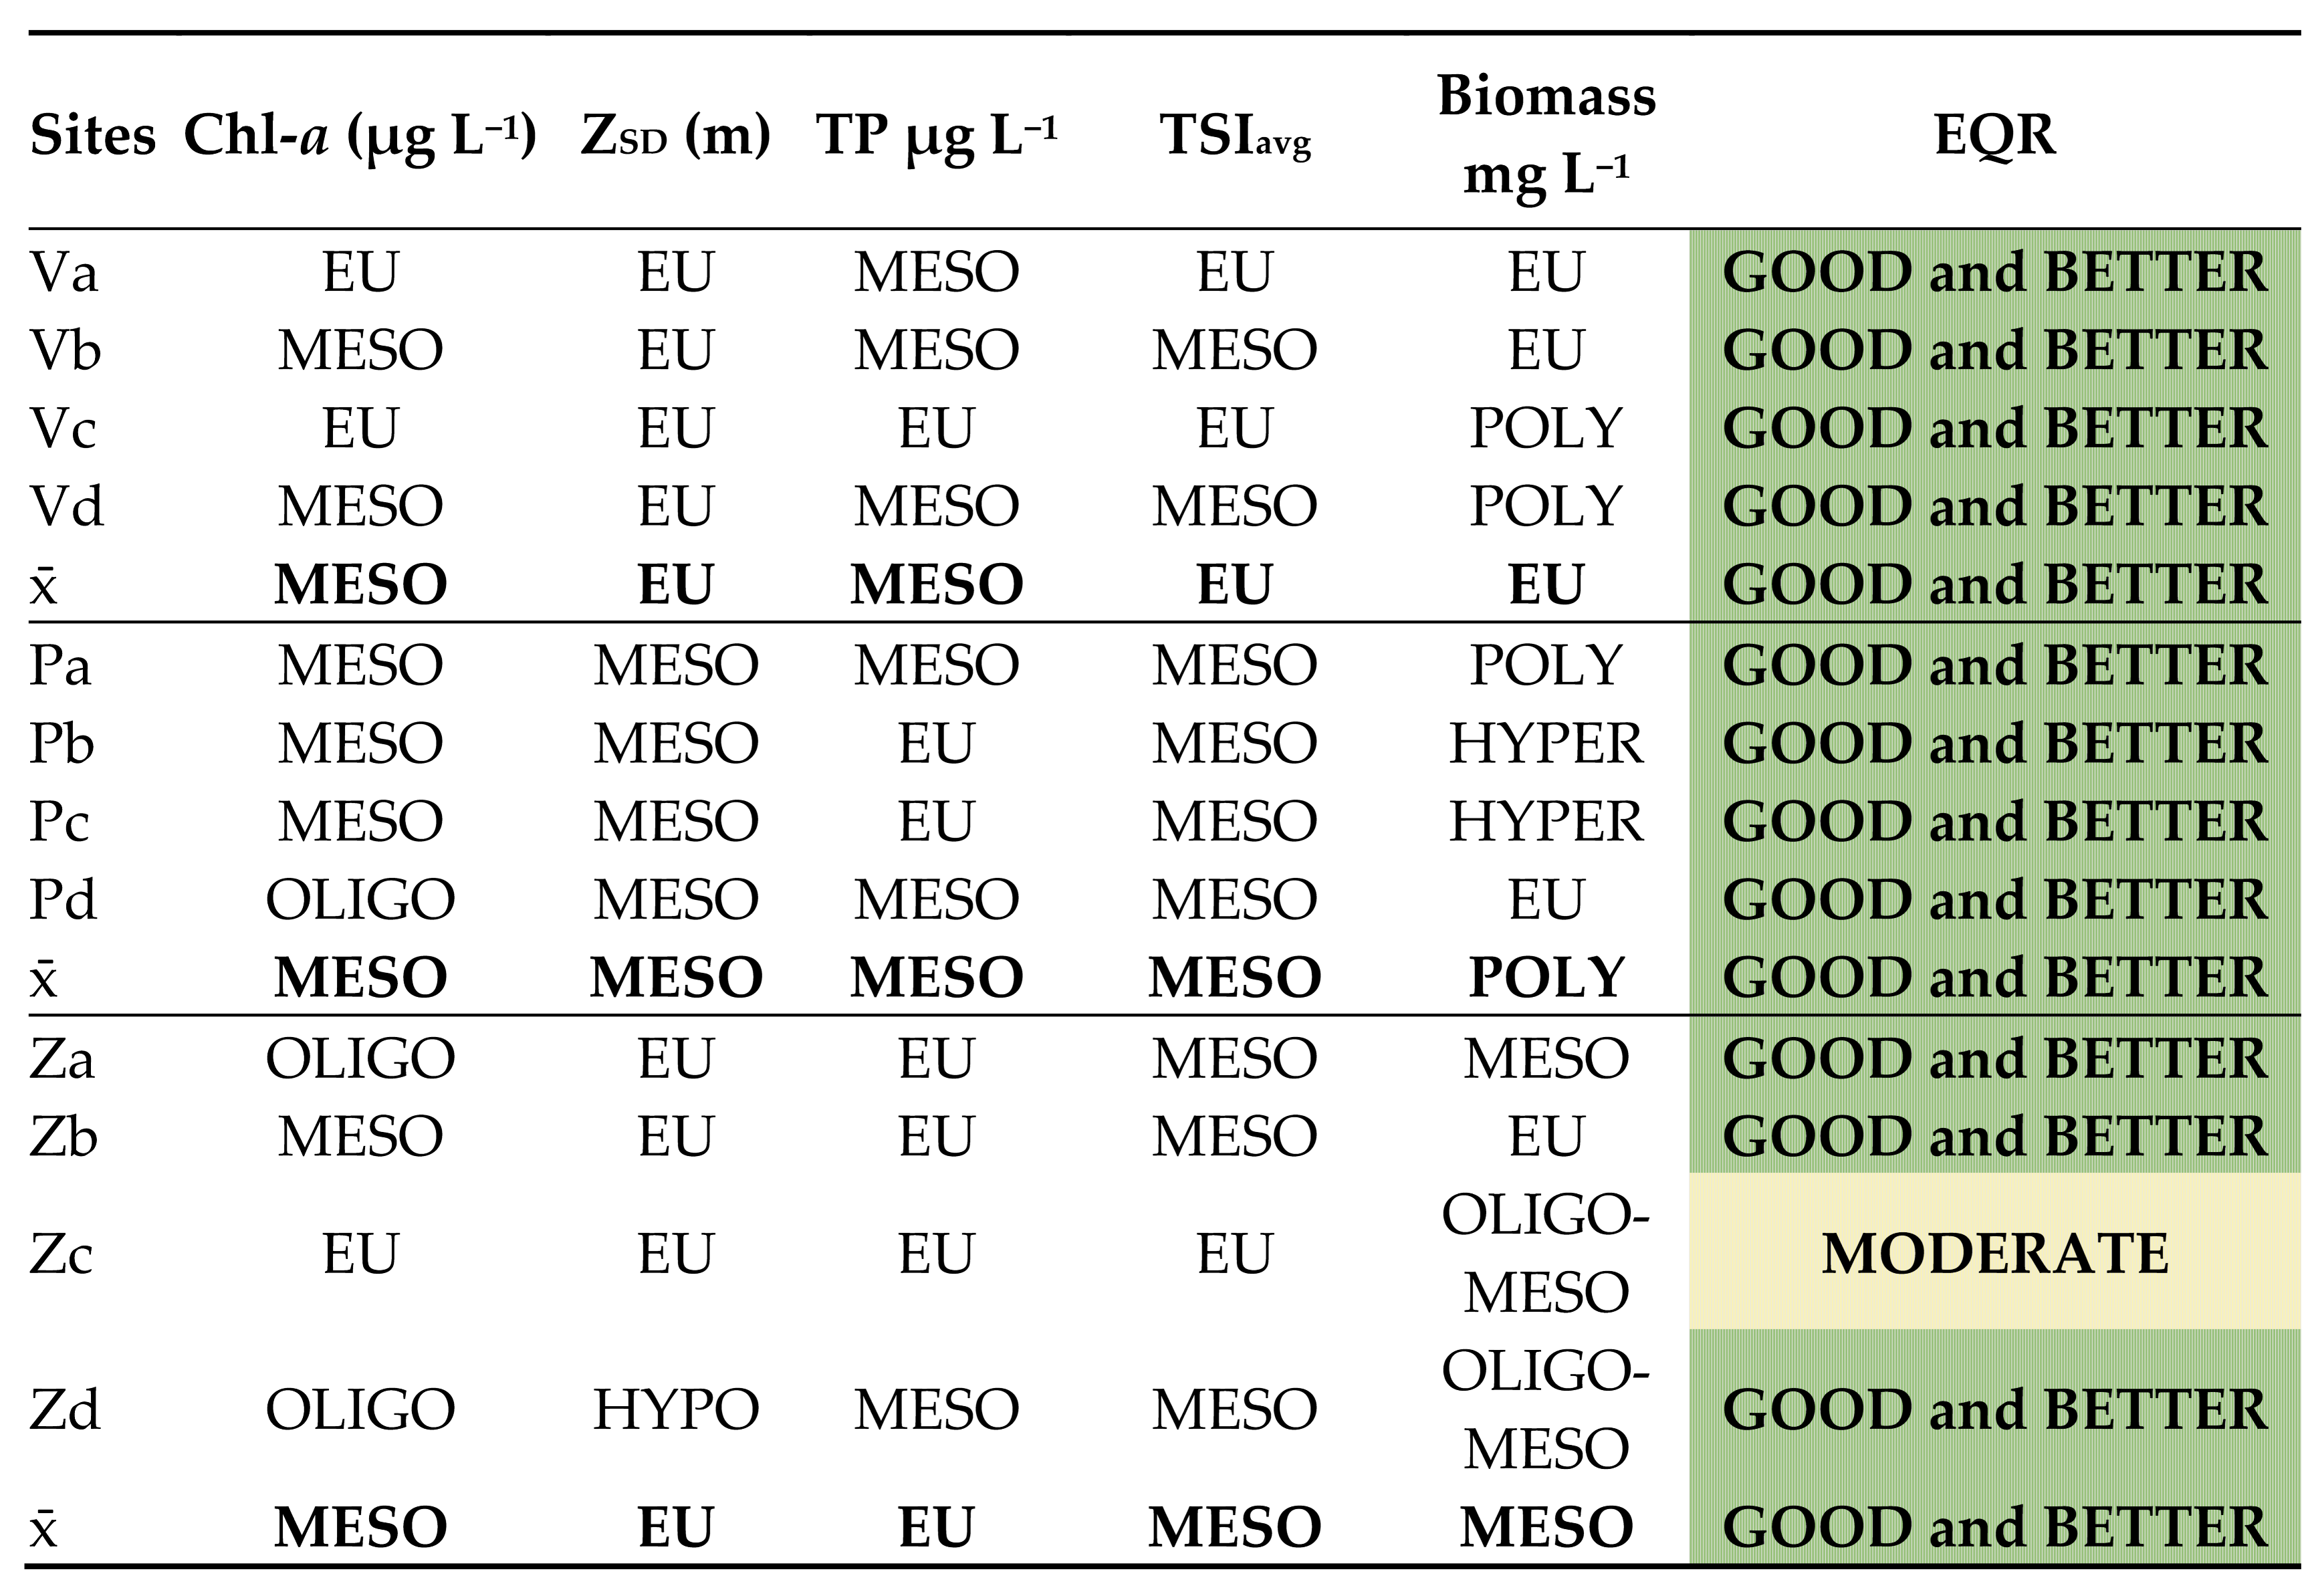
The results of the trophic status and ecological potential analyses are presented in Table 4 and Table A6. The highest measured chlorophyll a concentration was 13.98 µg L−1 (Va), whereas the lowest was 1.97 µg L−1 (Pd). Applying the OECD criteria [41] and Carlson’s Trophic State Index (TSI) based on mean chlorophyll a values, the Višegrad Reservoir was classified as eutrophic, while the other two reservoirs were mesotrophic. Based on mean total phosphorus (TP) concentrations, all investigated reservoirs were mesotrophic, with a tendency toward eutrophic status during the summer period (August). In contrast, mean TSITP values indicated a lower-class assessment, classifying all reservoirs as eutrophic, with a tendency ttowardhypertrophy in summer. Mean water transparency measured with a Secchi disc suggested mesotrophic conditions in the Perućac Reservoir and eutrophic conditions in the other two reservoirs. According to TSISD, the Zvornik and Višegrad Reservoirs ranged from mesotrophic to eutrophic, whereas the Perućac Reservoir was assessed as oligotrophic. Overall, the mean TSI (TSIavg) indicated a eutrophic status for the Višegrad Reservoir and a mesotrophic status for the Perućac and Zvornik Reservoirs. Total plankton biomass ranged from 0.237 mg L−1 to 2.946 mg L−1 (Zc and Pc, respectively). Following the guidance of Brettum [40], mean monthly biomass values indicated mesotrophic conditions in the Višegrad Reservoir, eutrophic conditions in the Perućac Reservoir, and oligo-mesotrophic conditions in the Zvornik Reservoir. All reservoirs showed a pronounced increase in biomass during summer, followed by a decline toward autumn.
EQR showed statistically significant negative correlations (p < 0.05) with temperature, oxygen saturation, (r = −0.582 and r = −0.660, respectively), and a positive correlation with electrical conductivity (r = 0.698). Chlorophyll a correlated positively with oxygen saturation (r = 0.664) and negatively with electrical conductivity (r = −0.741) and EQR (r = −0.919) at a higher significance level (p < 0.01). Total phosphorus and TSIavg were negatively correlated with nitrate concentrations (r = −0.676 and r = −0.790, respectively) (Appendix A Table A7). According to the HLPI and HRPI indices, the reservoirs generally exhibited good to better ecological potential, with the exception of Zvornik Reservoir in August, when ecological potential was classified as moderate. The ANOVA did not reveal significant differences (p > 0.05) in total biomass, chlorophyll a, TSIavg, or HLPI when sampling months and reservoir location were used as factors, except for a statistically significant difference in biomass between reservoirs, specifically Perućac and Zvornik (F = 4.921, p = 0.036).
The boundary value of 39 µg L−1 for total phosphorus (TP) was derived using the categorical (boxplot) approach in the Supporting Elements Toolkit, in accordance with the toolkit’s methodology for establishing preliminary supporting thresholds. The class boundaries were extrapolated equidistantly from the established good/moderate threshold (0.039 mg L−1 TP), using the same class width as between the high/good and good/moderate boundaries (0.010 mg L−1). This resulted in moderate/poor and poor/bad boundaries of 0.049 and 0.060 mg L−1 TP, respectively (Table 5).

4. Discussion

Reservoirs are human-made ecosystems that balance hydropower and water management with sensitivity to multiple stressors. They are typically affected by eutrophication, chemical and organic pollution, and hydromorphological alterations (loss of connectivity, water-level fluctuations), with additional influences from invasive species and land-use changes in the catchment [2]. The present study provides new evidence on phytoplankton community structure and functional groups from a large cascade hydropower system in the Western Balkans. Within the Water Framework Directive (WFD), phytoplankton is a key biological quality element for assessing the ecological potential in heavily modified water bodies [21]. Since the biological metrics for freshwater ecosystems have not yet been intercalibrated in Bosnia and Herzegovina [50], this study relied on regionally developed approaches for phytoplankton to test their applicability in the Drina cascade reservoirs.
The physico-chemical characteristics of the Drina reservoirs indicate moderate nutrient and organic loading, with seasonal and local variability. Total phosphorus generally suggests mesotrophic to eutrophic conditions, while TOC remains within a narrow range. Despite its fluctuations, COD does not exceed the thresholds for very good and good ecological status [22]. Although oxygen solubility typically decreases with increasing temperature, warm conditions in productive systems can enhance photosynthetic activity and lead to higher daytime oxygen saturation [51]. Similarly, the positive relationship between dissolved O2 and TOC may indicate a contribution of autochthonous organic carbon associated with in-lake primary production [52,53]. Nitrate represents a significant fraction of total nitrogen, and the negative nitrite-TP correlation suggests that nitrogen and phosphorus dynamics are not tightly linked because nitrite is a transient and unstable intermediate in surface waters [54].
An interannual comparison was only possible for the Višegrad Reservoir, as the Perućac and Zvornik Reservoirs are not included in the national monitoring program. Compared to the 2023 data [55], phosphorus concentrations in 2024 were similar and mostly indicated mesotrophic conditions. Chlorophyll a also followed a comparable seasonal pattern in both years, while Secchi depth remained consistently below 2.5 m. In contrast, total nitrogen and nitrate were substantially higher in 2024 than in 2023, when both parameters remained below 1 mg L−1. This points to increased nitrogen-related pressure during the study year.
Multivariate analyses support the interpretation that reservoir functioning was structured by both monthly succession and spatial gradients. PCA indicates the main axis of variation as seasonal, driven primarily by temperature, oxygenation, and nitrogen forms, whereas outlying samples reflect local extremes in phosphorus availability or transparency. Specifically, the separation of the late-summer Zvornik sample (Zc) corresponds to maximum TP values, suggesting that episodic phosphorus loading contributes to shifts in community composition and reduced ecological potential. In contrast, the October Perućac sample (Pd) is associated with the highest Secchi depth, indicating that high transparency and reduced resuspension constrain phytoplankton biomass.
Across the Drina cascade, phytoplankton assemblages showed certain monthly turnover and partially reservoir-specific structuring. Diatoms dominated the biomass during most of the study period, favoured by mixed conditions and efficient resource exploitation, while other algal groups peaked only during stable summer conditions. The late summer predominance of chlorophyte Sphaerocystis sp. in the Višegrad Reservoir, together with the high biomass contribution of Dinobryon divergens across all reservoirs, indicates reduced grazing control and selective resistance to zooplankton consumption. Spherical colonies of Sphaerocystis can reach up to 500 µm and are encased in mucilage with robust cell walls, rendering them resistant to zooplankton ingestion [56]. Furthermore, Dinobryon divergens uses a mixotrophic nutritional strategy that combines photosynthesis with bacterivory, allowing it to thrive under moderate temperatures and reduced light conditions in stratified water columns, particularly within the metalimnion. Simultaneously, Dinobryon divergens is considered low-quality food for zooplankton due to its grazing resistance and limited nutritional value, thus further supporting its seasonal dominance in freshwater ecosystems [57]. At the taxonomic level, several species reflected the interaction of trophic conditions, light, and hydrodynamics. Fragilaria saxoplanctonica reached its highest abundance in the Višegrad Reservoir in October, aligning with high nitrate values and nutrient-enriched conditions typical of eutrophic waters [58]. The dominance of Fragilaria crotonensis, especially in Perućac, reflects conditions with sufficient nutrient supplies, slight thermal stratification with adequate light availability, combined with wind velocities sufficient to keep the species within the surface mixed layer [59]. In addition, the co-occurrence of F. crotonensis and Asterionella formosa points to elevated nitrogen availability. While this relationship was originally described for oligotrophic alpine lakes and should therefore be interpreted cautiously in reservoir systems [60]. The phytoplankton assemblage of the Zvornik Reservoir strongly differed from those of the two upstream reservoirs, likely due to its shallower water, lack of stable thermal stratification, and stronger mixing regime. Consistent with these conditions, SIMPER analysis identified the benthic diatom Achnanthidium minutissimum and the mixing-tolerant species Pantocsekiella costei as the principal taxa contributing to this differentiation. The phytoplankton assemblages of the Drina cascade reservoirs revealed certain monthly patterns and particular reservoir-specific features. Višegrad and Perućac Reservoirs showed higher similarity in species composition and functional structure, with assemblages largely characterized by diatoms and functional groups associated with mixed, moderately enriched conditions, whereas the Zvornik Reservoir was more distinct due to its shallow depth, stronger mixing, and higher contribution of benthic and mixing-tolerant taxa.
The functional group approach provided a useful ecological synthesis of these species-level patterns. According to the Reynolds framework, phytoplankton taxa are grouped based on shared adaptive traits and habitat templates rather than taxonomy alone [11,12]. In the Višegrad Reservoir, the co-occurrence of functional groups B, D, and E suggests mixed conditions, diminished light availability, and variable nutrient supply, although these groups should not be treated as ecologically identical. The low transparency in the Višegrad Reservoir is consistent with the shade tolerance of groups B and P, whereas the occurrence of group E is better explained through the mixotrophic strategy of Dinobryon taxa than by its traditional shallow-lake habitat template, especially considering the hydromorphology of the Višegrad Reservoir [11,61,62]. In July, group P codominated with group E in the Višegrad Reservoir. The prevalence of group P, which includes taxa such as Fragilaria crotonensis, adapted to moderately light-limited, eutrophic epilimnetic conditions, further substantiates the eutrophic signal captured by the Carlson Trophic State Index [9,11]. In early summer, group A (predominantly Acanthoceras zachariasii) characterized the Perućac and Zvornik Reservoirs. While its preference for clear, mixed, and base-poor lakes is consistent with the higher transparency of the Perućac Reservoir [63,64], its July dominance under low-transparency conditions in the shallower Zvornik Reservoir likely reflects downstream advection from Perućac rather than exclusively local environmental selection. Furthermore, the co-occurrence of groups MP, P, C, and Y in the Zvornik Reservoir reflects their adaptation to a shallower, optically constrained, and frequently mixed ecosystem. Specifically, group MP is characteristic of frequently stirred, inorganically turbid shallow waters, whereas group Y consists of highly tolerant cryptophyte assemblages capable of thriving across diverse lentic habitats under low grazing pressure [12,65]. The findings primarily reflect late-spring to autumn phytoplankton succession and provide insight into seasonal patterns during this part of the year, while the full annual cycle of trophic dynamics and community turnover remains to be explored in future research.
The Shannon diversity, Simpson diversity, and Pielou’s evenness indices are highly sensitive to pronounced taxonomic dominance. Consequently, conditions promoting high phytoplankton abundance generally reduce overall diversity and evenness, whereas more moderate conditions support a more balanced distribution of abundances among coexisting taxa [66,67,68]. In the present study, the highest cell densities in the Višegrad Reservoir coincided with the lowest diversity and evenness scores, while samples from the Perućac Reservoir exhibited lower cell numbers coupled with higher diversity. The diversity indices further support the interpretation that high biomass events were accompanied by reduced community evenness.
Multivariate analysis revealed that phytoplankton community structure was jointly shaped by reservoir location and partially by monthly succession. nMDS showed that the Zvornik Reservoir formed a distinct cluster based on functional groups MP and Y, whereas the Višegrad and Perućac Reservoirs exhibited high assemblage overlap, characterized by associations E and P. SIMPER further identified a separate July cluster, primarily driven by the proliferation of Acanthoceras zachariasii (group A) across the entire system. The high degree of congruence between species-based and functional group-based ordinations indicates that the Reynolds framework successfully retains key ecological information while simplifying the complex dataset for monitoring purposes [69,70].
Studies on cascade reservoirs demonstrate that phytoplankton succession is shaped by a complex interplay of water column stability, hydrodynamics, and local environmental filtering rather than by nutrient availability alone [18]. While physical stability was not directly measured in the Drina system, the observed functional signatures serve as effective proxies for hydrodynamic conditions. The co-occurrence of groups P, E, and B suggests a shared tolerance to turbulent mixing, a pattern also reported in the Wujiang cascade [18] and Bulgarian reservoirs [16]. Such patterns suggest that these functional associations are frequently observed in temperate reservoir environments, representing a common community response to the specific environmental filters prevalent in these systems. Despite the lack of lateral connectivity typical of floodplain systems in the Danube basin [71], the hydrological impulses generated by reservoir operations and inflow variability in the Drina cascade appear to play a comparable structuring role. These disturbances favor mixing-tolerant taxa (groups P and B), while more specialized groups (A, MP, and D) respond to local seasonal and spatial heterogeneity, mirroring patterns observed in other pulse-dominated systems [44,72]. Furthermore, longitudinal connectivity likely facilitates downstream transport, contributing to a partial homogenization of assemblages [18,73]. However, local environmental sorting driven by variations in transparency, stratification, depth, and residence time maintains distinct differences among the reservoirs. This aligns with the consensus that phytoplankton biogeography is shaped by the interplay between dispersal and local habitat filters [74].
The trophic status of the Drina reservoirs revealed a functional divergence among metrics, reflecting the distinct ecological roles of each parameter: total phosphorus (TP) as a proxy for algal growth, chlorophyll a (Chl-a) as realized biomass, and transparency as a variable influenced by both biotic and abiotic factors [39,41]. While Chl-a levels indicated eutrophic conditions in the Višegrad Reservoir and predominantly mesotrophic states elsewhere, TP and TSITP suggested eutrophy with a shift toward hypertrophy during summer. In contrast, Secchi-based metrics pointed toward more oligotrophic conditions in the Perućac Reservoir. Such variations in trophic classification are characteristic of reservoir ecosystems, where light climate, stratification, and mixing regimes shape the relationship between nutrient availability and algal biomass [75,76]. The mismatch between TP and biomass in some samples, particularly under reduced transparency, suggests that light limitation may constrain algal production even when phosphorus is abundant, as observed in regional reservoir studies [77]. The metrics applied provided partially consistent and partially contrasting assessments. TSI, chlorophyll a, and total biomass described the magnitude of trophic expression, whereas functional groups and HLPI/HRPI reflected the ecological organisation of the phytoplankton assemblage. The trophic indices consistently identified August as the period of strongest trophic expression and indicated generally mesotrophic to eutrophic conditions across the reservoir cascade. Although biomass-based metrics inclined toward stronger trophic enrichment, HLPI/HRPI mostly indicated good or better ecological potential, showing that increased algal quantity was not always matched by an equally pronounced structural deterioration of the phytoplankton assemblage.
Compared to other systems in the Balkan region, such as the Gruža Reservoir [78] or the Grlište Reservoir [77], the Drina reservoirs exhibit similar variations in trophic classification, where phosphorus-based indices may overestimate the actual realized biomass. However, the Drina cascade shows a more pronounced spatial variability in biomass, likely due to higher flow-through rates and the specific connectivity of the reservoir chain. While these regional reservoirs often maintain a more stable eutrophic state, our results indicate that the Drina reservoirs fluctuate between mesotrophy and hypertrophy, driven by pulses in the hydrological regime rather than steady nutrient enrichment alone.
The observed relationship between the EQR-based assessment and the recommended good/moderate threshold of 39 µg L−1 TP reflects a shift in the phytoplankton community toward species typical for moderate status. This value is closely aligned with the threshold for eutrophic status (>35 µg L−1 TP) defined by the Republic of Srpska regulations [22], indicating that the decline to moderate ecological status corresponds to a shift toward eutrophy. While a higher threshold of 50 µg L−1 is established for reservoirs of similar hydromorphology in the Adriatic River Basin District [79], the EQR-based classification for the Drina cascade reflects a direct biological response rather than just nutrient-based potential. The proposed values, therefore, provide a basis for the proposed class boundaries in these reservoirs, even when physical factors such as light and mixing disrupt the link between phosphorus and biomass.
From the WFD perspective, good ecological potential is the appropriate management target for heavily modified water bodies [21]. In this context, the integrative HLPI/HRPI metric combines biomass and community composition. Overall, the Drina reservoirs reached “good or better” ecological potential, although the metric also captured a decline to moderate potential in the late-summer Zvornik sample.
Results show that an integrative phytoplankton assessment is capable of detecting both the general ecological status and short-term seasonal degradation, making it a reliable tool for management in systems where single trophic metrics give conflicting signals. Nevertheless, the similarity between species-based and functional-group analyses indicates that functional groups represent a practical, interpretable, and ecologically responsive tool for assessing the ecological potential of reservoirs in Bosnia and Herzegovina.
Given that the present study primarily focuses on the phytoplankton dynamics from late spring to autumn, broader seasonal coverage and repeated observations over multiple years would help to further refine ecological classification. This would also allow for a more complete interpretation of phytoplankton dynamics in relation to key hydrological descriptors, including inflow, residence time, and stratification.


Author Contributions

Conceptualization, J.K. and M.G.U.; methodology M.G.U., J.K., M.P., S.S. and F.S.; software, J.K.; formal analysis M.P., J.K., M.G.U., F.S. and P.Ž.; investigation, M.P., T.K. and T.L.; resources, S.S., T.L. and F.S.; data curation, M.P. and J.K.; writing—original draft preparation, M.P., J.K., M.G.U. and D.J.; writing—review and editing P.Ž., F.S., S.S., L.V., M.P. and J.K.; visualization, M.P. and J.K.; supervision, J.K.; validation: M.G.U.; funding acquisition, M.G.U. and J.K. All authors have read and agreed to the published version of the manuscript.

Funding

This research was supported through the use of equipment acquired under the Erasmus+ project 609967-EPP-1-2019-1-RS-EPPKA2-CBHE-JP.

Institutional Review Board Statement

Not applicable.

Data Availability Statement

The raw data supporting the conclusions of this article will be made available by the authors on request.

Acknowledgments

The authors would like to express their sincere gratitude to Nikola Palangetić and the Sport Fishing Association of the Republic of Srpska, particularly SRD Bistro Zvornik and SRD Drinska jezera Višegrad, for their valuable assistance in sample collection. The authors also acknowledge the laboratory staff of the Faculty of Technology in Zvornik for their support in conducting the physical and chemical analyses, as well as Ahmed Džaferagić for his contribution to the preparation of the study area map.

Conflicts of Interest

The authors declare no conflicts of interest.

Abbreviations

aJune
ACAZACAcanthoceras zachariasii (Brun) Simonsen
ADMIAchnanthidium minutissimum (Kützing) Czarnecki
bJuly
cAugust
Chl-aChlorophyll a
CINVCyclostephanos invisitatus (M.H. Hohn & Hellerman) E.C. Theriot, Stoermer &Håkanasson
ClChloride
CODChemical oxygen demand
CPLACocconeis placentula Ehrenberg
CRYOVACryptomonas ovata Ehrenberg
d October
DINDIVDinobryon divergens O.E. Imhof
DPSTDiscostella pseudostelligera (Hustedt) Houk & Klee
ECElectrical conductivity
QkCompositional metric based on phytoplankton functional groups for lakes
QkmaxMaximum Q value
QkstandStandardized Qk index
QrCompositional metric based on phytoplankton functional groups for rivers
QrstandStandardized Qr index
EQREcological Quality Ratio
EQRChl-aEcological Quality Ratios of chlorophyll-a concentration
EQRQQk index
EQRQrQr index
EUEutrophic
FCROFragilaria crotonensis Kitton
FSXPFragilaria saxoplanctonica Lange-Bertalot & S. Ulrich
GHTotal hardness
HLPIThe Hungarian Lake Phytoplankton Index
HRPIThe Hungarian River Phytoplankton Index
HYPERHypertrophic
H′The Shannon diversity index
J′Pielou’s evenness
nMDSNon-metric multidimensional scaling
NH4+Ammonium
NO3Nitrate
NO2Nitrite
O2Dissolved oxygen, oxygen concentration
OECDOrganisation for Economic Co
OLIGOOligotrophic
OLIGO-MESOOligo-mesotrophic
PPerućac Reservoir
PaPerućac Reservoir in June
PbPerućac Reservoir in July
PcPerućac Reservoir in August
PCAPrincipal Component Analysis
PC1Principal component 1
PC2Principal component 2
PdPerućac Reservoir in October
POCLPantocsekiella ocellata (Pantocsek) K.T. Kiss & Ács
POLYPolytrophic
PLANANPlagioselmis nannoplanctica (Skuja) G. Novarino, I.A.N. Lucas & Morrall
SO42−Sulfate
SPHSPSphaerocystis sp.
TWater temperature
TKNTotal Kjeldahl nitrogen
TNTotal nitrogen
TOCTotal organic carbon
TPTotal phosphorus
TSIChl-aThe Carlson Trophic State Index (TSI) for chlorophyll a
TSISDThe Carlson Trophic State Index for Secchi Disk
TSITPThe Carlson Trophic State Index for Phosphorus
ULTRA-OLIGOUltra-oligotrophic
VVišegrad Reservoir
VaVišegrad Reservoir in June
VbVišegrad Reservoir in July
VcVišegrad Reservoir in August
VdVišegrad Reservoir in October
ZZvornik Reservoir
ZaZvornik Reservoir in June
ZbZvornik Reservoir in July
ZcZvornik Reservoir in August
ZdZvornik Reservoir in October
ZSDSecchi depth
WFDWater Framework Directive
% O2Oxygen saturation
(1 − Λ)Simpson index

Appendix A

Table A1. Class boundaries of the trophic status for the ZSD—Secchi depth, TP—total phosphorus, Chl-a—Chlorophyll-a, [41,65], Biomass [40] and TSI—Carlson Trophic Index [39].
Trophic StatusZSD (m)TP (µg L−1)Chl-a (µg L−1)Biomass
(mg L−1)
TSI
Ultra-oligotrophic>12<4<1<0.120–30
Oligotrophic12–64–101–2.50.12–0.430–40
Oligo-mesotrophic 0.4–0.6
Mesotrophic6–310–352.5–80.6–1.540–50
Eutrophic3–1.535–1008–251.5–2.550–60
Polyeutrophic 2.5–5
Hypereutrophic<1.5>100>25>5>60
Table A2. Class boundaries of the ecological potential for the studied reservoirs. HLPI—Hungarian Lake Phytoplankton Index [14], HRPI—Hungarian River Phytoplankton Index [44], EQR—ecological quality ratio.
Diversity 18 00242 i002
Table A3. Physical and chemical parameters of studied reservoirs V (Višegrad), P (Perućac) and Zvornik (Z) in different months of sampling: a—June, b—July, c—August/September, d—October in 2024. T—temperature, O2—oxygen concentration, % O2—oxygen saturation, EC—electrical conductivity, ZSD—Secchi depth, TN—total nitrogen, NO3—nitrate, NO2—nitrite, NH4+—ammonium, TKN—total Kjeldahl nitrogen, TP—total phosphorus, TOC—total organic carbon, COD—chemical oxygen demand, Cl—chlorides, SO42−, GH—total hardness.
T (°C)O2 mg/L%O2pH EC µS/cmZSD mTN mg/LNO3 mg/LNO2 mg/LNH4+ mg/LTKN mg/LTP µg/LTOC mg/LCOD mgO2/LGH °dGHCl mg/LSO42− mg/L
mg/L
Višegrad Reservoir
Va25.910.121308.352761.82.872.020.0030.0740.84202.754.88.120.091.63
Vb2610.7213782812.52.191.630.0030.0280.56243.534.88.40.180.002
Vc23.611.041358.032791.63.391.710.00080.0281.68443.486.725.320.090.012
Vd17.99.411038.182923.65.824.70.0040.1311.12183.2613.448.120.0110.3
x ¯ 23.410.321268.142822.43.572.520.00270.0651.0526.53.267.447.490.092.99
SD3.80.715.80.27.00.91.61.50.00140.0490.4811.90.44.11.50.14.9
Perućac Reservoir
Pa26.29.461218.242864.32.341.530.00580.0280.81153.144.38.790.041.44
Pb25.39.111482834.32.281.440.0030.0280.84382.283.8411.20.090.002
Pc24.59.511782764.52.481.360.00020.0281.12453.532.825.320.090.037
Pd17.98.81957.992875.93.322.470.0120.0760.84252.812.887.670.0110.71
x ¯ 23.489.221128.062834.82.611.700.00530.0400.9030.82.943.468.250.063.05
SD3.780.3311.530.124.970.770.480.520.00500.0240.1513.380.530.732.440.045.15
Zvornik Reservoir
Za19.79.061018.32942.12.141.570.010.0280.56333.114.88.620.051.05
Zb24.78.481048.32942.32.452.170.00150.0280.28402.4610.5611.20.090.004
Zc22.78.71028.2528125.74.290.00050.0281.4532.131.925.880.090.011
Zd16.59.51008.243001.25.964.560.0030.0711.4153.045.768.170.0124.72
x ¯ 20.98.941028.272921.94.063.150.00380.03880.9135.32.695.768.470.066.45
SD3.580.451.710.038.020.482.051.500.00430.02150.5815.80.473.592.180.0412.19
Table A4. Relative variance explained and factor coordinates of the variables for the first two principal components (PC1 and PC2) of the Principal Component Analysis (PCA): T—temperature, O2—oxygen concentration, %—oxygen saturation, EC—electrical conductivity, ZSD—Secchi depth, TN—total nitrogen, NO3—nitrate, NO2—nitrite, NH4+—ammonium, TP—total phosphorus, TOC—total organic carbon, COD—chemical oxygen demand, GH—hardness.
VariablePC1PC2
Variation (%) 33.818.6
Cumulative variation (%)33.852.4
Eigenvalues4.732.61
T−0.382−0.097
O2−0.2580.455
% O2−0.3780.273
pH0.198−0.016
EC0.371−0.083
ZSD−0.024−0.304
TN0.3240.307
NO30.3730.241
NO20.155−0.268
NH4+0.3130.25
TP−0.171−0.136
TOC−0.1290.37
COD0.2090.214
GH0.103−0.349
Table A5. Phytoplankton functional groups (FG) and identified species within taxonomic groups (TG) in the studied reservoirs.
FGTaxaTGFGTaxaTG
AAcanthoceras zachariasii (Brun) SimonsenMediLMMicrocystis aeruginosa (Kützing) KützingCyan
Cyclostephanos invisitatus (M.H.Hohn & Hellerman) E.C.Theriot, Stoermer & HåkanassonMediLOChroococcus minutus (Kützing) NägeliCyan
BDiscostella pseudostelligera (Hustedt) Houk & KleeMedi Snowella lacustris (Chodat) Komárek & HindákCyan
Pantocsekiella costei (J.C.Druart & F.Straub) K.T.Kiss & E.ÁcsMedi Synechocystis sp.Cyan
Pantocsekiella ocellata (Pantocsek) K.T.Kiss & ÁcsMedi Ceratium hirundinella (O.F.Müller) DujardinDino
Stephanodiscus parvus Stoermer & HåkanssonMedi Glenodinium sp.Dino
CAsterionella formosa HassallBaciMPAchnanthidium minutissimum (Kützing) CzarneckiBaci
Asterionella formosa var. acaroides LemmermannBaci Cocconeis placentula EhrenbergBaci
Discostella stelligera (Cleve & Grunow) Houk & KleeMedi Nitzschia dissipata (Kützing) RabenhorstBaci
Lindavia radiosa (Grunow) De Toni & FortiMedi Nitzschia palea (Kützing) W.SmithBaci
DUlnaria acus (Kützing) AboalBaci Nitzschia recta HantzschBaci
Ulnaria ulna (Nitzsch) CompèreBaci Gomphonema parvulum (Kützing) KützingBaci
EDinobryon bavaricum ImhofChry Gomphonema pumilum (Grunow) E.Reichardt & Lange-BertalotBaci
Dinobryon crenulatum West & G.S.WestChry Fragilaria vaucheriae (Kützing) J.B.PetersenBaci
Dinobryon divergens O.E.ImhofChry Hippodonta capitata (Ehrenberg) Lange-Bertalot, Metzeltin & WitkowskiBaci
Dinobryon sertularia EhrenbergChry Melosira varians C.AgardhCosc
Elakatothrix gelatinosa WilleKlebNCosmarium subcostatum NordstedtZygn
Sphaerocystis sp.Chlo Cosmarium tinctum RalfsZygn
Raphidocelis danubiana (Hindák) Marvan, Komárek & ComasChloPClosterium acutum BrébissonZygn
Oocystis parva West & G.S.WestTreb Closterium limneticum LemmermannZygn
Willea apiculata (Lemmermann) D.M.John, M.J.Wynne & P.M.TsarenkoTreb Closterium venus Kützing ex RalfsZygn
JCrucigenia quadrata MorrenChlo Fragilaria crotonensis KittonBaci
Crucigenia sp.Chlo Fragilaria saxoplanctonica Lange-Bertalot & S.UlrichBaci
Desmodesmus abundans (Kirchner) E.H.HegewaldChlo Fragilaria sp.Baci
Desmodesmus bicellularis (Chodat) S.S.An, T.Friedl & E.HegewaldChlo Aulacoseira granulata (Ehrenberg) SimonsenCosc
Golenkinia radiata ChodatChloS1Pseudanabaena catenata LauterbornCyan
Scenedesmus ecornis (Ehrenberg) ChodatChlo Pseudanabaena limnetica (Lemmermann) KomárekCyan
Scenedesmus intermedius var. acaudatus HortobagyiChloTPlanctonema lauterbornii SchmidleTreb
Scenedesmus quadricauda (Turpin) BrébissonChloX1Monoraphidium contortum (Thuret) Komárková-LegnerováChlo
Stauridium tetras (Ehrenberg) E.HegewaldChlo Monoraphidium minutum (Nägeli) Komárková-LegnerováChlo
Tetradesmus dimorphus (Turpin) M.J.WynneChlo Pseudodidymocystis planctonica (Korshikov) E.Hegewald & DeasonChlo
Tetradesmus lagerheimii M.J.Wynne & GuiryChloX2Chlamydomonas sp.Chlo
Tetraëdron minimum (A.Braun) HansgirgChlo Plagioselmis lacustris (Pascher & Ruttner) JavornickyCryp
Tetraedron tumidulum (Reinsch) HansgirgChlo Plagioselmis nannoplanctica (Skuja) G.Novarino, I.A.N.Lucas & MorrallCryp
Tetrastrum glabrum (Y.V.Roll) Ahlstrom & TiffanyChlo Kephyrion rubri-claustri ConradChry
Verrucodesmus verrucosus (Y.V.Roll) E.HegewaldChloX3Pseudodidymocystis inconspicua (Korshikov) HindákChlo
Lagerheimia genevensis (Chodat) ChodatTreb Chrysococcus rufescens KlebsChry
Lemmermannia tetrapedia (Kirchner) LemmermannTrebYCryptomonas erosa EhrenbergCryp
KAphanocapsa delicatissima West & G.S.WestCyan Cryptomonas marssonii SkujaCryp
Aphanocapsa holsatica (Lemmermann) G.Cronberg & KomárekCyan Cryptomonas ovata EhrenbergCryp
Table A6. Trophic and ecological status of the cascade reservoir using different metrics. HYPER- hypertrophic, POLY—polytrophic, EU—eutrophic, MESO—mesotrophic, OLIGO-MESO—oligo-mesotrophic, OLIGO—oligotrophic, ULTRA-OLIGO—ultra-oligotrophic. Chl-a—Chlorophyll-a, ZSD—Secchi depth, TP—total phosphorus, TSIavg—mean TSI, EQR—ecological quality ratio based on HLPI or HRPI. The mean trophic categories by reservoir are shown in bold.
Diversity 18 00242 i003
Table A7. Summary of the Spearman’s rank correlation coefficient (r, N = 12) between the environmental variables, Chl-a—Chlorophyll-a, TSIavg—Average Trophic State Index by Carlson, Algal Biomass, EQR—Ecological Quality Ratio. Correlations in bold indicate statistical significance. ** Correlation is significant at the 0.01 level (2-tailed). * Correlation is significant at the 0.05 level (2-tailed). T—temperature, % O2—oxygen saturation, EC—electrical conductivity, ZSD—Secchi depth, TN—total nitrogen, NO3—nitrate, NO2—nitrite, TP—total phosphorus, TP—total phosphorus. Statistically significant values of the correlation coefficient are shown in bold. ** Correlation is significant at the 0.01 level, * Correlation is significant at the 0.05 level.
T (°C)% O2EC (µS cm−1)ZSD (m)TN (mg L−1)NO3−(mg L−1)NO2(mg L−1)TP (mg L−1)Chl-a (µg L−1)Biomass (mg L−1)TSIavgEQR
T (°C)1.0000.806 **−0.5140.182−0.634 *−0.641 *−0.157−0.0070.4380.4810.224−0.582 *
% O20.806 **1.000−0.692 *−0.077−0.343−0.497−0.3740.0530.664 *0.5460.462−0.660 *
EC (µS cm−1)−0.514−0.692 *1.000−0.0840.0670.4320.522−0.412−0.714 **−0.403−0.5520.698 *
ZSD (m)0.182−0.077−0.0841.000−0.357−0.4060.2810.063−0.3220.606 *−0.5590.232
TN (mg L−1)−0.634 *−0.3430.067−0.3571.0000.769 **−0.228−0.0840.245−0.3150.042−0.028
NO3(mg L−1)−0.641 *−0.4970.432−0.4060.769 **1.0000.117−0.252−0.0350.655 *−0.0770.119
NO2 (mg L−1)−0.157−0.3740.5220.281−0.2280.1171.000−0.676 *−0.470−0.166−0.790 **0.423
TP (mg L−1)−0.0070.053−0.4120.063−0.084−0.252−0.676 *1.0000.1120.1280.666 *−0.144
Chl-a (µg L−1)0.4380.664 *−0.714 **−0.3220.245−0.035−0.4700.1121.0000.2070.566−0.919 **
Biomass (mg L−1)0.4810.546−0.4030.606 *−0.315−0.655 *−0.1660.1280.2071.000−0.109−0.120
TSIavg0.2240.462−0.552−0.5590.042−0.077−0.790 **0.666 *0.566−0.1091.000−0.533
EQR−0.582 *−0.660 *0.698 *0.232−0.0280.1190.423−0.144−0.919 **−0.120−0.5331.000

References

  1. Połomski, M.; Wiatkowski, M. Impounding reservoirs, benefits and risks: A review of environmental and technical aspects of construction and operation. Sustainability 2023, 15, 16020. [Google Scholar] [CrossRef]
  2. Biney, E.E.; Gyamfi, C.; Karikari, A.Y.; Darko, D. Reservoir ecological health assessment Methods: A systematic review. Ecol. Indic. 2025, 171, 113130. [Google Scholar] [CrossRef]
  3. Dudgeon, D. Multiple threats imperil freshwater biodiversity in the Anthropocene. Curr. Biol. 2019, 29, R960–R967. [Google Scholar] [CrossRef]
  4. He, F.; Zarfl, C.; Tockner, K.; Olden, J.D.; Campos, Z.; Muniz, F.; Svenning, J.-C.; Jähnig, S.C. Hydropower impacts on riverine biodiversity. Nat. Rev. Earth Environ. 2024, 5, 755–772. [Google Scholar] [CrossRef]
  5. Grill, G.; Lehner, B.; Thieme, M.; Geenen, B.; Tickner, D.; Antonelli, F.; Babu, S.; Borrelli, P.; Cheng, L.; Crochetiere, H. Mapping the world’s free-flowing rivers. Nature 2019, 569, 215–221. [Google Scholar] [CrossRef]
  6. Hayes, N.M.; Deemer, B.R.; Corman, J.R.; Razavi, N.R.; Strock, K.E. Key differences between lakes and reservoirs modify climate signals: A case for a new conceptual model. Limnol. Oceanogr. Lett. 2017, 2, 47–62. [Google Scholar] [CrossRef]
  7. Akinnawo, S.O. Eutrophication: Causes, consequences, physical, chemical and biological techniques for mitigation strategies. Environ. Chall. 2023, 12, 100733. [Google Scholar] [CrossRef]
  8. Pasztaleniec, A. Phytoplankton in the ecological status assessment of European lakes–advantages and constraints. Environ. Prot. Nat. Resour. 2016, 27, 26–36. [Google Scholar] [CrossRef]
  9. Hanžek, N.; Udovič, M.G.; Kajan, K.; Borics, G.; Várbíró, G.; Stoeck, T.; Žutinić, P.; Orlić, S.; Stanković, I. Assessing ecological status in karstic lakes through the integration of phytoplankton functional groups, morphological approach and environmental DNA metabarcoding. Ecol. Indic. 2021, 131, 108166. [Google Scholar] [CrossRef]
  10. Lyche Solheim, A.; Phillips, G.; Drakare, S.; Free, G.; Järvinen, M.; Skjelbred, B.; Tierney, D.; Trodd, W.; Poikane, S. Water Framework Directive Intercalibration Technical Report: Northern Lake Phytoplankton Ecological Assessment Methods; EUR-Scientific and Technical Research Series; Publications Office of the European Union: Luxembourg, 2014. [Google Scholar] [CrossRef]
  11. Reynolds, C.S.; Huszar, V.; Kruk, C.; Naselli-Flores, L.; Melo, S. Towards a functional classification of the freshwater phytoplankton. J. Plankton Res. 2002, 24, 417–428. [Google Scholar] [CrossRef]
  12. Padisák, J.; Crossetti, L.O.; Naselli-Flores, L. Use and misuse in the application of the phytoplankton functional classification: A critical review with updates. Hydrobiologia 2009, 621, 1–19. [Google Scholar] [CrossRef]
  13. Padisak, J.; Borics, G.; Grigorszky, I.; Soróczki-Pintér, É. Use of phytoplankton assemblages for monitoring ecological status of lakes within the Water Framework Directive: The assemblage index. Hydrobiologia 2006, 553, 1–14. [Google Scholar] [CrossRef]
  14. Borics, G.; Wolfram, G.; Chiriac, G.; Belkinova, D.; Donabaum, K.; Poikane, S. Intercalibration of the National Classifications of Ecological Status for Eastern Continental Lakes: Biological Quality Element: Phytoplankton; Publications Office of the European Union: Luxembourg, 2018. [Google Scholar]
  15. Šimunović, M.; Kulaš, A.; Žutinić, P.; Goreta, G.; Gligora Udovič, M. Phytoplankton metrics for trophic and ecological status assessment of a natural karstic lake. Acta Bot. Croat. 2022, 81, 185–196. [Google Scholar] [CrossRef]
  16. Dochin, K. Using phytoplankton as a tool for evaluating changes in the ecological status of two Bulgarian reservoirs (2020–2021). Bulg. J. Agric. Sci. 2023, 29, 252–261. [Google Scholar]
  17. Wu, Z.; Wang, F.; Wang, X.; Li, K.; Zhang, L. Water quality assessment using phytoplankton functional groups in the middle-lower Changjiang River, China. Limnologica 2023, 99, 126056. [Google Scholar] [CrossRef]
  18. Cui, G.; Wang, B.; Xiao, J.; Qiu, X.-L.; Liu, C.-Q.; Li, X.-D. Water column stability driving the succession of phytoplankton functional groups in karst hydroelectric reservoirs. J. Hydrol. 2021, 592, 125607. [Google Scholar] [CrossRef]
  19. Bai, Y.; Huang, T.; Yang, P. Effect of water stratification and mixing on phytoplankton functional groups: A case study of Xikeng Reservoir, China. Water SA 2023, 49, 404–413. [Google Scholar] [CrossRef]
  20. Ivanković, A.; Hafner, D. Water quality assessment of the Blidinje shallow high mountain lake in Bosnia and Herzegovina, based on its biological properties. Ekológia 2012, 31, 295–308. [Google Scholar] [CrossRef]
  21. European Parliament and Council of the European Union. Directive 2000/60/EC of the European Parliament and of the Council of 23 October 2000 establishing a framework for Community action in the field of water policy. Off. J. Eur. Communities 2000, L 327, 1–73. [Google Scholar]
  22. Službeni Glasnik Republike Srpske 42/01. Uredba o Klasifikaciji Voda i Kategorizaciji Vodotoka. 2001. Available online: https://teams.microsoft.com/l/message/19:9cd0b3c3-37be-4e74-8f5a-fb9c0503b9d8_f7cdcbf8-c62a-4f16-8c28-8eeaab20beae@unq.gbl.spaces/1776824161652?context=%7B%22contextType%22%3A%22chat%22%7D (accessed on 17 April 2026). (In Serbian)
  23. ISRBC. 2nd Sava River Basin Analysis Report; International Sava River Basin Commission: Zagreb, Croatia, 2016. [Google Scholar]
  24. Grujović, N.; Milivojević, N.; Stojanović, B.; Fakultet u Kragujevcu, M.; Arsić, M. Relacioni model i sadržaj baze podataka hidro-informacionog sistema Drina, zasnovanog na GIS tehnologiji. Vodoprivreda 2004, 36, 147–158. [Google Scholar]
  25. Prohaska, S.; Simić, Z.; Orlić, A.; Ristić, V. Osnovne hidrografsko-hidrološke karakteristike sliva Drine i hidrometeorološki podaci. Vodoprivreda 2004, 36, 21–38. [Google Scholar]
  26. Zeleznik, N. Support to Water Resources Management in the Drina River Basin: Drina River Basin Roof Report (English); 127740; Public Consultation: Belgrade, Serbia, 2017. [Google Scholar]
  27. ISO 10260:1992; Water Quality—Measurement of Biochemical Parameters—Spectrometric Determination of the Chlorophyll-a Concentration. International Organization for Standardization: Geneva, Switzerland, 1992.
  28. Utermohl, H. Zur Vervollkommung der quantitativen phytoplankton-methodik. Mitt Int. Ver Limnol. 1958, 9, 38. [Google Scholar]
  29. EN 15204:2006; Water Quality—Guidance Standard on the Enumeration of Phytoplankton Using Inverted Microscopy (Utermohl Technique). European Committee for Standardization: Brussels, Belgium, 2006.
  30. Lund, J.W.G.; Kipling, C.; Le Cren, E. The inverted microscope method of estimating algal numbers and the statistical basis of estimations by counting. Hydrobiologia 1958, 11, 143–170. [Google Scholar] [CrossRef]
  31. EN 16695:2015; Water Quality—Guidance on the Estimation of Phytoplankton Biovolume. European Committee for Standardization: Brussels, Belgium, 2015.
  32. Hillebrand, H.; Dürselen, C.D.; Kirschtel, D.; Pollingher, U.; Zohary, T. Biovolume calculation for pelagic and benthic microalgae. J. Phycol. 1999, 35, 403–424. [Google Scholar] [CrossRef]
  33. Rott, E. Some results from phytoplankton counting intercalibrations. Schweiz. Z. Für Hydrol. 1981, 43, 34–62. [Google Scholar] [CrossRef]
  34. Sun, J.; Liu, D. Geometric models for calculating cell biovolume and surface area for phytoplankton. J. Plankton Res. 2003, 25, 1331–1346. [Google Scholar] [CrossRef]
  35. Javornický, P.; Komárková, J. The Changes in Several Parameters of Plankton Primary Productivity in Slapy Reservoir 1960–1967, Their Mutual Correlations and Correlations with the Main Ecological Factors; Academia: Prague, Czech Republic, 1973. [Google Scholar]
  36. Jacques, G.; Sournia, A. Les «eaux rouges» dues au phytoplancton en Méditerranée. Vie Milieu 1978, 175–187. Available online: https://hal.sorbonne-universite.fr/hal-02998549v1/document (accessed on 17 April 2026).
  37. EN 15708:2009; Water Quality—Guidance Standard for the Surveying, Sampling and Laboratory Analysis of Phytobenthos in Shallow Running Water. European Committee for Standardization: Brussels, Belgium, 2009.
  38. Guiry, M.; Guiry, M.A. AlgaeBase. World-wide Electronic Publication, National University of Ireland, Galway. 2025. Available online: https://www.algaebase.org/ (accessed on 23 June 2025).
  39. Carlson, R.E. A trophic state index for lakes 1. Limnol. Oceanogr. 1977, 22, 361–369. [Google Scholar] [CrossRef]
  40. Brettum, P. Alger Som Indikator på Vannkvalitet i Norske Innsjøer. Planteplankton [Algae as Indicators of Water Quality in Norwegian Lakes. Phytoplankton]; NIVA-rapport 0-86116; Norsk Institutt for Vannforskning (NIVA): Oslo, Norway, 1989; p. 111. [Google Scholar]
  41. Organisation for Economic Co-operation and Development (OECD). Eutrophication of Waters: Monitoring, Assessment and Control; Organisation for Economic Co-operation and Development: Paris, France, 1982; p. 154. [Google Scholar]
  42. Gligora Udovič, M.; Žutinić, P. Report on Lake Phytoplankton Classification Method in Case Where the Intercalibration Exercise is not Possible (Gap 3), Revised version 2.0; Hrvatske Vode: Zagreb, Croatia, 2020. [Google Scholar]
  43. Mihaljević, Z.; Alegro, A.; Kerovec, M.; Ternjej, I.; Gottstein, S.; Miliša, M.; Matoničkin Kepčija, R.; Lajtner, J.; Hršak, V.; Previšić, A.; et al. Klasifikacijski Sustav Ekološkog Potencijala za Umjetna i Znatno Promijenjena Tijela Površinskih Voda—2. dio: Stajaćice Dinaridske Ekoregije; Biološki odsjek, Prirodoslovno-matematički fakultet, Sveučilište u Zagrebu: Zagreb, Croatia, 2018. [Google Scholar]
  44. Borics, G.; Várbíró, G.; Grigorszky, I.; Krasznai, E.; Szabó, S.; Kiss, K.T. A new evaluation technique of potamo-plankton for the assessment of the ecological status of rivers. Large Rivers 2007, 17, 466–486. [Google Scholar] [CrossRef]
  45. Mihaljević, Z.; Alegro, A.; Kerovec, M.; Ternjej, I.; Gottstein, S.; Miliša, M.; Matoničkin Kepčija, R.; Lajtner, J.; Hršak, V.; Previšić, A. Klasifikacijski Sustav Ekološkog Potencijala za Umjetna i Znatno Promijenjena Tijela Površinskih Voda—I. Dio: Stajaćice Panonske Ekoregije; Biološki odsjek, Prirodoslovno-matematički fakultet, Sveučilište u Zagrebu: Zagreb, Croatia, 2018. [Google Scholar]
  46. Phillips, G.; Teixeira, H.; Kelly, M.; Lyche-Solheim, A.; Free, G.; Salas Herrero, F.; Poikane, S. Establishing Supporting Element Standards: A Revised Approach and Applications; European Commission: Joint Research Centre, Publications Office of the European Union: Brussels, Belgium, 2024. [Google Scholar]
  47. Anderson, M.J.; Gorley, R.N.; Clarke, K.R. PERMANOVA+ for PRIMER: Guide to Software and Statistical Methods; PRIMER-E: Plymouth, UK, 2008. [Google Scholar]
  48. Clarke, K.; Gorley, R. PRIMER v6: User Manual/Tutorial; PRIMER-E: Plymouth, UK, 2006; 192p. [Google Scholar]
  49. IBM Corp. IBM SPSS Statistics for Windows, Version 25.0; IBM Corp.: Armonk, NY, USA, 2017.
  50. Kamberović, J.; Gligora Udovič, M.; Kulaš, A.; Tapolczai, K.; Orlić, S.; Jusufović, A.; Gajić, A.; Žutinić, P.; Ahmić, A.; Kalamujić Stroil, B. The Diatom Diversity and Ecological Status of a Tufa-Depositing River through eDNA Metabarcoding vs. a Morphological Approach—A Case Study of the Una River (Bosnia and Herzegovina). Microorganisms 2024, 12, 1722. [Google Scholar] [CrossRef] [PubMed]
  51. Harvey, H.H. Supersaturation of lake water with a precaution to hatchery usage. Trans. Am. Fish. Soc. 1967, 96, 194–201. [Google Scholar] [CrossRef]
  52. Mitrovic, S.M.; Baldwin, D.S. Allochthonous dissolved organic carbon in river, lake and coastal systems: Transport, function and ecological role. Mar. Freshw. Res. 2016, 67, I–IV. [Google Scholar] [CrossRef]
  53. Xu, X.; Wu, C.; Xie, D.; Ma, J. Sources, migration, transformation, and environmental effects of organic carbon in eutrophic lakes: A critical review. Int. J. Environ. Res. Public Health 2023, 20, 860. [Google Scholar] [CrossRef]
  54. Zumft, W.G. Cell biology and molecular basis of denitrification. Microbiol. Mol. Biol. Rev. 1997, 61, 533–616. [Google Scholar] [CrossRef] [PubMed]
  55. Savić, M. Rezultati istraživanja fizičko-hemijskih analiza za akumulaciju Višegrad; Institut za Vode: Bijeljina, Bosnia and Herzegovina, 2023. (In Serbian) [Google Scholar]
  56. Kampe, H.; König-Rinke, M.; Petzoldt, T.; Benndorf, J. Direct effects of Daphnia-grazing, not infochemicals, mediate a shift towards large inedible colonies of the gelatinous green alga Sphaerocystis schroeteri. Limnologica 2007, 37, 137–145. [Google Scholar] [CrossRef][Green Version]
  57. Vad, C.F.; Schneider, C.; Lukić, D.; Horváth, Z.; Kainz, M.J.; Stibor, H.; Ptacnik, R. Grazing resistance and poor food quality of a widespread mixotroph impair zooplankton secondary production. Oecologia 2020, 193, 489–502. [Google Scholar] [CrossRef] [PubMed]
  58. Casa, V.; Brancolini, F.; Mielnicki, D.M.; Mataloni, M.G. Fish-killing diatom bloom in an urban recreational pond: An index case for a global warming scenario? Oecologia Aust. 2020, 24, 878–889. [Google Scholar] [CrossRef]
  59. Hartig, J.H. Factors contributing to development of Fragilaria crotonensis Kitton pulses in Pigeon Bay waters of western Lake Erie. J. Great Lakes Res. 1987, 13, 65–77. [Google Scholar] [CrossRef]
  60. Saros, J.E.; Michel, T.J.; Interlandi, S.J.; Wolfe, A.P. Resource requirements of Asterionella formosa and Fragilaria crotonensis in oligotrophic alpine lakes: Implications for recent phytoplankton community reorganizations. Can. J. Fish. Aquat. Sci. 2005, 62, 1681–1689. [Google Scholar] [CrossRef]
  61. Kamjunke, N.; Henrichs, T.; Gaedke, U. Phosphorus gain by bacterivory promotes the mixotrophic flagellate Dinobryon spp. during re-oligotrophication. J. Plankton Res. 2007, 29, 39–46. [Google Scholar] [CrossRef]
  62. Gligora Udovič, M.; Cvetkoska, A.; Žutinić, P.; Bosak, S.; Stanković, I.; Špoljarić, I.; Mršić, G.; Kralj Borojević, K.; Ćukurin, A.; Plenković-Moraj, A. Defining centric diatoms of most relevant phytoplankton functional groups in deep karst lakes. Hydrobiologia 2017, 788, 169–191. [Google Scholar] [CrossRef]
  63. Yang, Y.; Pettersson, K.; Padisak, J. Repetitive baselines of phytoplankton succession in an unstably stratified temperate lake (Lake Erken, Sweden): A long-term analysis. Hydrobiologia 2016, 764, 211–227. [Google Scholar] [CrossRef]
  64. Kozak, A.; Budzyńska, A.; Dondajewska-Pielka, R.; Kowalczewska-Madura, K.; Gołdyn, R. Functional groups of phytoplankton and their relationship with environmental factors in the restored Uzarzewskie Lake. Water 2020, 12, 313. [Google Scholar] [CrossRef]
  65. Shen, H.; Ye, L.; Cai, Q.; Tan, L. Longitudinal variations in physiochemical conditions and their consequent effect on phytoplankton functional diversity within a subtropical system of cascade reservoirs. Front. Ecol. Evol. 2022, 10, 914623. [Google Scholar] [CrossRef]
  66. Magurran, A.E. Measuring Biological Diversity; Blackwell Publishing: Oxford, UK, 2003; p. 256. [Google Scholar]
  67. Naselli-Flores, L.; Padisák, J.; Dokulil, M.T.; Chorus, I. Equilibrium/steady-state concept in phytoplankton ecology. Hydrobiologia 2003, 502, 395–403. [Google Scholar] [CrossRef]
  68. Reynolds, C.S. The Ecology of Phytoplankton; Cambridge University Press: Cambridge, UK, 2006; p. 535. [Google Scholar]
  69. Anneville, O.; Gammeter, S.; Straile, D. Phosphorus decrease and climate variability: Mediators of synchrony in phytoplankton changes among European peri-alpine lakes. Freshw. Biol. 2005, 50, 1731–1746. [Google Scholar] [CrossRef]
  70. Hu, R.; Lan, Y.; Han, B.P.; Naselli-Flores, L. Abandoning the species-based approach: Can we describe phytoplankton community structure and its response to environmental changes by using functional groups? Hydrobiologia 2013, 711, 155–167. [Google Scholar]
  71. Stević, F.; Mihaljević, M.; Špoljarić, D. Changes of phytoplankton functional groups in a floodplain lake associated with hydrological perturbations. Hydrobiologia 2013, 709, 143–158. [Google Scholar] [CrossRef]
  72. Mihaljević, M.; Stević, F.; Horvatić, J.; Čerba, D. Phytoplankton functional groups as indicators of ecological status in a complex floodplain lake. Ecol. Indic. 2015, 48, 486–494. [Google Scholar]
  73. Fraisse, S.; Arfi, R.; Orange, D.; Grolleau, A.; Dufour, P. Connectivity and geometry of reservoir cascades: Impacts on phytoplankton dynamics. Freshw. Biol. 2013, 58, 2465–2476. [Google Scholar]
  74. Naselli-Flores, L.; Padisak, J. Blowing in the wind: How many roads can a phytoplanktont walk down? A synthesis on phytoplankton biogeography and spatial processes. Hydrobiologia 2016, 764, 303–313. [Google Scholar] [CrossRef]
  75. Donis, D.; Mantzouki, E.; McGinnis, D.F.; Vachon, D.; Gallego, I.; Grossart, H.P.; de Senerpont Domis, L.N.; Teurlincx, S.; Seelen, L.; Lürling, M. Stratification strength and light climate explain variation in chlorophyll a at the continental scale in a European multilake survey in a heatwave summer. Limnol. Oceanogr. 2021, 66, 4314–4333. [Google Scholar] [CrossRef]
  76. Filstrup, C.T.; Hillebrand, H.; Heathcote, A.J.; Knops, J.M.; Downing, J.A. Relationship of chlorophyll a to total phosphorus as a function of environmental setting. Environ. Sci. Technol. 2014, 48, 955–964. [Google Scholar]
  77. Vidovic, M. Assessment of the trophic status by monitoring of reservoir’s water quality. J. Water Resour. Prot. 2015, 7, 1–13. [Google Scholar] [CrossRef]
  78. Milošković, A.; Dojčinović, B.; Kovarević, S.; Lalević, B.; Sunjog, K. Estimate of the eutrophication process in the Gruža reservoir (Serbia and Montenegro). J. Environ. Prot. Ecol. 2012, 13, 522–530. [Google Scholar]
  79. Mrđen, S.; Šarac, M.; Sudar, A.; Matković, I.; Bakula, E.; Gašević, T.; Nurković, A.; Marić, S.; Đolo, S. Plan Upravljanja Vodama za Vodno Područje Jadranskog Mora u Federaciji Bosne i Hercegovine (2022.–2027.); Agencija za vodno područje Jadranskog mora Mostar: Mostar, Bosnia and Herzegovina, 2022. [Google Scholar]
Figure 1. Study area of the cascade reservoirs on the Drina River.
Diversity 18 00242 g001
Figure 2. Principal component analysis (PCA) ordination diagram of environmental variables based on the Euclidean distance matrix between samples in the Višegrad (V), Perućac (P) and Zvornik (Z) reservoirs sampled in June (a), July (b), August (c), and October (d) of 2024, overlaid with group average clustering. T—temperature, O2—dissolved oxygen, % O2—oxygen saturation, EC—electrical conductivity, ZSD—Secchi depth, TN—total nitrogen, NO3—nitrate, NO2—nitrite, NH4+—ammonium, TP—total phosphorus, TOC—total organic carbon, COD—chemical oxygen demand, GH—hardness.
Diversity 18 00242 g002
Figure 3. Relative biomass (%) of the phytoplankton taxonomic groups in reservoirs: Višegrad (Va-Vd), Perućac (Pa-Pd) and Zvornik (Za-Zd).
Diversity 18 00242 g003
Figure 4. Shade plot of biomass values (mg L−1) for the most abundant phytoplankton species with relative contributions exceeding 5% in reservoirs: Višegrad (Va-Vd), Perućac (Pa-Pd), and Zvornik (Za-Zd).
Diversity 18 00242 g004
Figure 5. Non-metric multidimensional scaling (nMDS) plot absolute biomass of phytoplankton taxa (>5%), overlaid with ordination group average clustering at 20% similarity, and with Pearson correlation vectors (r > 0.5) in the reservoirs (V—Višegrad, P—Perućac, and Z—Zvornik) across the sampling months (a—June, b—July, c—August, and d—October). Taxa abbreviations: CINV—Cyclostephanos invisitatus (M.H. Hohn & Hellerman) E.C. Theriot, Stoermer &Håkanasson; CPLA—Cocconeis placentula Ehrenberg; ADMI—Achnanthidium minutissimum (Kützing) Czarnecki; SPHSP—Sphaerocystis sp.; PLANAN—Plagioselmis nannoplanctica (Skuja) G. Novarino, I.A.N. Lucas & Morrall; CRYOVA—Cryptomonas ovata Ehrenberg; FSXP—Fragilaria saxoplanctonica Lange-Bertalot & S. Ulrich; DINDIV—Dinobryon divergens O.E. Imhof; FCRO—Fragilaria crotonensis Kitton; POCL—Pantocsekiella ocellata (Pantocsek) K.T. Kiss & Ács; ACAZAC—Acanthoceras zachariasii (Brun) Simonsen; DPST—Discostella pseudostelligera (Hustedt) Houk & Klee.
Diversity 18 00242 g005
Figure 6. Shade plot of absolute biomass values (mg L−1) for phytoplankton functional groups per studied samples.
Diversity 18 00242 g006
Figure 7. Relative contribution of functional groups, expressed as percentages of total biomass, in samples from the Višegrad Reservoir (Va-Vd), the Perućac Reservoir (Pa-Pd), and the Zvornik Reservoir (Za-Zd).
Diversity 18 00242 g007
Figure 8. Non-metric multidimensional scaling (nMDS) plot of absolute biomass of functional groups (>5%), overlaid with ordination group-average clustering at 30% similarity and Pearson correlation vectors with functional group biomass (r > 0.5) in the reservoirs (V—Višegrad, P—Perućac, and Z—Zvornik) across the sampling months (a—June, b—July, c—August, and d—October).
Diversity 18 00242 g008
Table 1. Sampling locations and basic hydrological parameters of the studied reservoirs on the Drina River. The data for volume, Qav, dam height, dam type, installed capacity, and mean annual electricity generation were sourced from [26].
ReservoirsVišegrad (V)Perućac (P)Zvornik (Z)
Longitude of sampling sites (WGS84)19°16′22.66″ E19°21′31.77″ E19° 6′43.40″ E
Latitude of sampling sites (WGS84)43°45′19.49″ N43°58′25.92″ N44°21′39.78″ N
Elevation (a.s.l.) Elevation (m a.s.l.)341290153
Ecoregion/SubecoregionDinaric/Continental Dinaric/ContinentalDinaric/
Peripannonian
Surface area (km2)8.512.58.1
Catchment area (km2)13,93415,30817,423
Reservoir volume
total/active (106 m3)
161/105340/21847.43/21.32
Maximal depth (m)436039
Length (km)405525
Average discharge Qav (m3 s−1)342349369
Year of dam construction198919661955
Dam height (m)79.59042
Dam length (m)280460166.5
Dam typeConcreteConcreteConcrete
Installed capacity (MW)33396368
Mean annual electricity generation (GWh)10105001650
Table 2. Values of total species richness (S), cell abundance, Pielou’s evenness index (J′), Shannon diversity index H′ (loge), and Simpson’s diversity index (1 − Λ) per studied samples.
SamplesSNJ′H′ (loge)1 − Λ
Va2112,863,0380.180.560.20
Vb258,889,6020.541.720.67
Vc3110,434,6100.501.710.66
Vd284,763,1410.692.290.85
Pa162,494,8610.752.070.84
Pb216,280,1370.692.100.78
Pc153,061,4600.621.670.74
Pd161,720,0080.561.550.68
Za20997,8320.752.230.82
Zb281,685,6080.782.590.87
Zc221,192,2590.812.500.89
Zd20543,7600.892.670.91
Table 3. Results of the SIMPER analysis showing taxon contributions (%) by grouping factor reservoirs (V: Višegrad P: Perućac, Z: Zvornik) and sampling months.
SpeciesVPZJune JulyAugustOctober
Average similarity (%)25.7735.8819.6218.7130.1610.61S: 8.02
SpeciesContribution (%)
Fragilaria crotonensis Kitton9.5156.8116.7421.324.2037.45
Dinobryon divergens O.E.Imhof29.0517.729.9438.02 19.847.12
Fragilaria saxoplanctonica Lange-Bertalot & S.Ulrich30.90
Pantocsekiella costei (J.C.Druart & F.Straub) K.T.Kiss & E.Ács8.68 18.32
Achnanthidium minutissimum (Kützing) Czarnecki 16.5
Acanthoceras zachariasii (Brun) Simonsen 56.52
Pantocsekiella ocellata (Pantocsek) K.T.Kiss & Ács 9.93 9.9336.44
Cryptomonas ovata Ehrenberg 19.66
Ulnaria ulna (Nitzsch) Compère 16.28
Plagioselmis nannoplanctica (Skuja) G.Novarino, I.A.N.Lucas & Morrall 6.66 6.66
Asterionella formosa Hassall 9.98
Plagioselmis lacustris (Pascher & Ruttner) Javornicky 7.42
Tetraëdron minimum (A.Braun) Hansgirg 7.28
Table 4. Trophic status and ecological potential parameters of the Višegrad Reservoir (Va-Vd), Perućac Reservoir (Pa-Pd), and Zvornik Reservoir (Za-Zd) (Chl-a—Chlorophyll a; ZSD—Secchi depth; TP—Total phosphorus; TN—Total nitrogen; TSIChl-a—Trophic state index for chlorophyll a; TSITP—Trophic state index for total phosphorus; TSISD—Trophic state index for Secchi depth; TSIavg—mean TSI), Qk—Compositional metric based on phytoplankton functional groups for lakes, Qr—Compositional metric based on phytoplankton functional groups for rivers, HLPI—Hungarian Lake Phytoplankton Index, HRPI—Hungarian River Phytoplankton Index, EQR—Ecological quality ratio.
Diversity 18 00242 i001
Table 5. Proposed class boundaries of the ecological potential status in the studied reservoirs of the Drina River using total phosphorus (TP).
Ecological PotentialTotal Phosphorus (mg L−1)
Good and better≤0.039
Moderate0.040–0.049
Poor0.050–0.060
Bad>0.060
Disclaimer/Publisher’s Note: The statements, opinions and data contained in all publications are solely those of the individual author(s) and contributor(s) and not of MDPI and/or the editor(s). MDPI and/or the editor(s) disclaim responsibility for any injury to people or property resulting from any ideas, methods, instructions or products referred to in the content.