Article

Rhizosphere Microbiome Responses to Root-Knot Nematode Infection in Fagopyrum tataricum: Diversity, Network Dynamics, and Potential Biocontrol Taxa

1
Biotechnology and Germplasm Resources Institute, Yunnan Academy of Agricultural Sciences, Kunming 650204, China
2
Key Laboratory of Agricultural Microbial Resources Development and Utilization of Qianxinan Prefecture, Minzu Normal University of Xingyi, Xingyi 562400, China
3
Yuxi Institute of Inspection, Testing and Certification, Yuxi 653100, China
4
Yuxi Academy of Agricultural Sciences, Yuxi 653100, China
5
Food Crops Research Institute, Yunnan Academy of Agricultural Sciences, Kunming 650204, China
*
Authors to whom correspondence should be addressed.
These authors contributed equally to this work.
Diversity 2026, 18(5), 240; https://doi.org/10.3390/d18050240
Submission received: 8 March 2026 / Revised: 13 April 2026 / Accepted: 14 April 2026 / Published: 22 April 2026
(This article belongs to the Special Issue How Microbiomes Sustain Ecosystem Function and Health)

Abstract

Background: Root-knot nematodes (RKNs) are destructive parasites affecting both agricultural and natural plants. Fagopyrum tataricum, a phenolic-rich edible and medicinal plant, has antidiabetic, anti-inflammatory, and anticancer properties, yet the impact of RKN infection on its rhizosphere microbiome remains unclear. Methods: We employed full-length 16S rRNA gene sequencing (FL16S) to profile bacterial communities in the rhizosphere of healthy and RKN-infected F. tataricum plants. Results: FL16S classified 78.41% of operational taxonomic units (OTUs) at the genus level and 69.18% at the species level. Healthy plants showed higher richness, diversity, and evenness, while principal co-ordinate analysis (PCoA) and PERMANOVA indicated significant RKN-associated shifts in community composition. Dominant phyla included Bacteroidota, Proteobacteria, Patescibacteria, Verrucomicrobiota, Actinobacteriota, Acidobacteriota, and Chloroflexi, with Abditibacteriota enriched in healthy and Acidobacteriota in diseased rhizospheres. At the OTU level, 66 differentially abundant taxa were identified, including nine hub OTUs in healthy plants, suggesting keystone roles in network stability. Network analyses revealed reduced diversity, interactions, and altered intra- and inter-phylum dynamics under RKN infection. Conclusions: These findings provide insight into rhizosphere microbial responses to RKN parasitism in F. tataricum and identify potential microbial biomarkers and biocontrol targets, supporting microbiome-based management strategies.

1. Introduction

RKNs are considered some of the most destructive parasites, posing significant threats to both agricultural crops and natural plants [1,2]. Their parasitic activity can severely impair plant growth, resulting in reduced yields and compromised plant health [3]. The Food and Agriculture Organization of the United Nations (FAO) ranks plant-parasitic nematode infestations as the fourth most devastating plant disease, resulting in considerable annual economic losses worldwide [4].
Among the various plant-parasitic RKN management strategies, such as soil fumigation, crop rotation, and pesticide application, biocontrol methods are considered safer and more practical alternatives [5]. For instance, the inoculants Equity (containing 47 Bacillus strains), BioYield (comprising Bacillus subtilis GB03 and Bacillus amyloliquefaciens), and strain FZB42 (Bacillus amyloliquefaciens) all significantly reduced the number of RKN eggs per gram of root, per milliliter of soil, and the number of galls per plant on tomato [6]. Furthermore, Paenibacillus alvei T30 and Bacillus aryabhattai A08 effectively reduced gall and egg mass indices in carrots and tomatoes, respectively, highlighting their potential as biological control agents against RKNs [7]. Similarly, field trials with the rhizobacterial Bacillus subtilis Jdm2 demonstrated a reduction in RKN disease severity in tomato plants, with biocontrol efficacy reaching 69%, effectively inhibiting RKN activity [8].
The rhizosphere refers to a narrow region, typically 1–2 mm in width, located just outside the roots of plants [9]. The microbial community balance within the rhizosphere plays a crucial role in the shift of the rhizosphere environment from a healthy to a diseased state, and in the onset of pathogen outbreaks [10]. The reassembly of rhizosphere microbial communities can either exacerbate or alleviate plant damage, depending on the composition and interactions of the microbial taxa involved. Rhizosphere bacteria are essential in suppressing RKNs infection [11,12]. These microorganisms utilize multiple mechanisms to limit RKN establishment and proliferation. For instance, certain bacterial taxa produce nematicidal or toxic secondary metabolites that directly inhibit RKN survival [13]. Others reduce RKN colonization by competing for ecological niches and essential nutrients within the rhizosphere [14]. Additionally, some bacteria can induce systemic resistance in the host plant, priming or activating plant defense pathways against RKN invasion [15]. Through these complementary strategies, plant-associated bacteria significantly contribute to the biological control of RKN and enhance plant resilience to parasitic stress. Traditional research on the biological control of RKNs has primarily focused on the interactions between biocontrol bacteria, pathogens, and plants, often overlooking the importance of the overall balance of microbial communities.
To date, numerous studies have been conducted to investigate changes in microbial communities within the rhizosphere soil of both healthy and RKN-infected plants [16]. These studies have primarily focused on Tomato [17], tobacco [18], and soybean [19], while interactions between rhizosphere microbes and root-knot nematodes (RKNs) in other plant species have not been thoroughly investigated. This limited scope may lead to an underestimation of the potential damage caused by RKNs in less studied species. The role of rhizosphere microbes in controlling RKNs is highly host-specific. These species-dependent interactions have led to the development of effective microbial agents for the control of RKNs in certain plant species, although their efficacy is often limited or absent in others.
F. tataricum, belonging to the family Polygonaceae, is a traditionally edible and medicinal plant known for its high content of phenolic compounds [20]. These substances are significant for human nutrition, offering health benefits such as antidiabetic [21], anti-inflammatory [22], and anticancer properties [23]. Furthermore, global F. tataricum production has experienced substantial growth, surpassing 4 million tons in 2021 [24]. The effects of RKNs are primarily manifested in the roots of the crop. In this study, we employed FL16S to conduct a comprehensive analysis of the rhizosphere bacterial composition in both healthy (non-infected) and diseased (RKN-infected) F. tataricum. The objective of this study was to identify specific patterns in the alterations of rhizosphere microbial communities between healthy and diseased individuals, and to explore microorganisms with potential biocontrol functions that may contribute to resistance against RKN infection, particularly in the context of F. tataricum. This study hypothesizes that rhizosphere microbial communities in healthy and diseased plants exhibit distinct patterns or alterations. Furthermore, the interaction structures and species relationships within these microbial communities differ between healthy and diseased plants. This research will contribute to the development of new and effective biological control methods, thereby enhancing our understanding of the rhizosphere microbial communities and their responses to RKN parasitism, and providing critical insights for managing RKN infestations in its cultivation.

2. Materials and Methods

2.1. Field Sampling and Soil Collection

The same F. tataricum germplasm was cultivated in two adjacent fields, 3.1 m apart, at Kunming Farm in Yunnan Province, China. Both fields have been used for F.tataricum cultivation over the past two years, and they were subjected to identical management practices, including irrigation, fertilization, and pest control. Rhizosphere soil samples were collected from F. tataricum plants at approximately 80% grain maturity. Soil adhering to individual plants was carefully collected. For the identification of diseased versus healthy plants, we employed an observation method based on the presence or absence of galls on the roots. In Field I, rhizosphere samples were randomly collected from 10 healthy and 22 diseased plants, while in Field II, samples were randomly obtained from 5 healthy and 8 diseased plants. Additionally, three bulk soil samples (representing unplanted soil) were collected from each field to serve as environmental controls. All samples were placed in sterile sampling bags and transported on ice to the laboratory. Upon arrival, the samples were stored at −80 °C and prepared for nucleic acid extraction. Detailed information for each sample is provided in Table S1.

2.2. DNA Extraction and Quality Control

DNA was extracted following the protocol provided with the Soil DNA Extraction Kit (Nanjing Novogene Bioinformatics Technology Co., Ltd., Nanjing, China, Model: DM401-C3-P2). Genomic DNA concentration and purity were assessed by adding 1 μL of the extracted nucleic acid to 199 μL of 1X dsDNA HS Working Solution (Yisheng Biotechnology Co., Ltd., Shanghai, China). Measurements were performed using a microplate reader (Gene Company Limited, Hong Kong, China, Model: Synergy HTX). The resulting DNA concentration was used to guide the template input for subsequent amplification. Additionally, DNA quality was further assessed using 1% agarose gel electrophoresis.

2.3. PCR Amplification and Sequencing

Primers 27F (5′-AGRGTTTGATYNTGGCTCAG-3′) and 1492R (5′-TASGGHTACCTTGTTASGACTT-3′) were employed to amplify the FL16S. The PCR amplification was carried out using the KOD One™ PCR Master Mix (catalog number: KMM-101) from Beijing Bailingke Biotechnology Co., Ltd. (Beijing, China) The reaction mixture was prepared as follows: 10 µL of KOD One™ PCR Master Mix, 6.5 µL of nuclease-free water (NFW), 2 µL of template DNA, and 1.5 µL of barcode primers, yielding a total reaction volume of 20 µL. The reaction was initiated with an initial denaturation step at 95 °C for 2 min, followed by 22 cycles consisting of denaturation at 98 °C for 10 s, annealing at 55 °C for 30 s, and extension at 72 °C for 1.5 min. The reaction concluded with a final extension at 72 °C for 2 min. The FL16S amplicon was quantified using LabChip analysis.
A 3 μL aliquot of the amplified product was diluted to 15 μL in a 96-well plate and subsequently analyzed on the LabChip GX Touch (PerkinElmer Inc., Shelton, CT, USA, Model: CLS137031/E) for fragment detection and target region library quantification. For libraries passing the LabChip quality check, precise pooling was performed using the Echo 525-nanoliter liquid handler (Beckman Coulter, Brea, CA, USA) according to the calculation table. The pooled graded libraries were purified using VAHTS™ DNA Clean Beads (Nanjing Novozan, Nanjing, China) at a 0.8× ratio to remove primer dimers and reduce the volume to an appropriate size for electrophoresis. The target fragment was recovered by agarose gel electrophoresis and quantified using the Qubit 3.0 fluorometer to ensure an adequate quantity of sample for the next step in library construction. The constructed library was subjected to damage repair, end repair, and adapter ligation using the SMRTBELLS PREP KIT 3.0 provided by PacBio (Menlo Park, CA, USA). These processes were carried out on a PCR machine, and the resulting library was purified and recovered using AMPure PB magnetic beads to yield the final sequencing-ready library. The sequencing-ready library was prepared by binding primers and polymerase using the REVIO SPRQ POLYMERASE KIT. The final reaction products were then purified using cleanup beads. The purified library was subsequently loaded onto the REVIO sequencer for sequencing.

2.4. Bioinformatics Processing and OTU Clustering

The raw subreads were corrected to generate Circular Consensus Sequencing (CCS) reads using SMRT Link (version 8.0), with parameters set to minPasses ≥ 5 and minPredicted Accuracy ≥ 0.9. Subsequently, the CCS reads were processed using the lima software (v1.7.0), in which barcode sequences were used to demultiplex and assign reads to individual samples, and chimeric sequences were removed, yielding high-quality reads ranging from 1200 to 1650 bp. The filtered sequences were clustered into operational taxonomic units (OTUs) at a 97% similarity threshold using USEARCH (version 10.0) [25]. OTUs with relative abundances below 0.005% of the total sequencing reads were removed following the default filtering settings. Taxonomic classification of representative OTU sequences was performed in QIIME (v1.9.0) [26], using the SILVA reference database (release 138) [27]. A summary of the CCS read data is presented in Table S1.

2.5. Statistical Analysis and Diversity Estimations

The processed OTU data were integrated into phyloseq objects using the phyloseq package (v1.50.0) [28]. OTUs associated with mitochondria or chloroplasts were excluded from downstream analysis. Alpha diversity was assessed by Observed Richness, Shannon and Simpson indices, computed using the alpha_div function in USEARCH (version 10.0). Pielou’s evenness was further quantified using the evenness function from the microbiome package (v1.28.0). The aforementioned alpha diversity metrics were calculated from raw count data. Cumulative sum scaling (CSS) was applied to normalize the filtered OTU table using the metagenomeSeq package (v1.48.1) [29]. Data visualization was performed with the ggplot2 package (v3.5.2) [30].
PCoA was conducted based on Bray–Curtis and Euclidean distances for OTUs using the Vegan package in R v4.3.3. Permutational multivariate analysis of variance (PERMANOVA) was performed on the beta-diversity matrices with 999 permutations using the adonis function in Vegan (v2.7-1) [31] to evaluate differences in microbial community composition between healthy and diseased groups. Microbial compositions at both the phylum and genus levels were visualized after converting CSS-normalized counts to relative abundances, facilitating a clear comparison between the two states.
Differential taxa between healthy and diseased states were identified using the compare function from EasyMicrobiome (v1.24). Only taxa with a minimum relative abundance > 0.1% were selected, and taxa with a q-value < 0.05 were deemed significant. The taxonomy of significant taxa was extracted from the phyloseq object.

2.6. Co-Occurrence Network Construction

A global pairwise co-occurrence network was constructed by identifying significant positive and negative associations (ρ > ± 0.75, p-value < 0.05), following similar thresholds used in previous studies [32]. These criteria were chosen to ensure that only strong, ecologically relevant associations were considered. The co-occurrence function in the phylosmith package (v1.0.8) was employed to calculate these associations. The network was visualized with the co_occurrence_network function, where nodes represent OTUs and edges indicate positive and negative associations. To validate predicted co-occurrences, Pearson and Spearman networks were integrated by combining shared nodes and edges. p-values were adjusted for multiple comparisons using the p.adjust function in the stats package, applying the False Discovery Rate (FDR) correction.
Topological features of the co-occurrence networks were characterized using the net_properties function from ggClusterNet (v2.0) [33]. Kleinberg’s hub centrality was calculated with the hub_score function in igraph (v2.1.4) to identify influential taxa [34]. Nodes with hub scores ≥ 0.7 were designated as core species. Unique and shared co-occurrence relationships between healthy and diseased groups were visualized using Venn diagrams generated with ggvenn (v0.1.10).

3. Results

3.1. Rhizosphere Bacterial Community Composition of Healthy (Non-Infected) and Diseased (RKN-Infected) F. tataricum

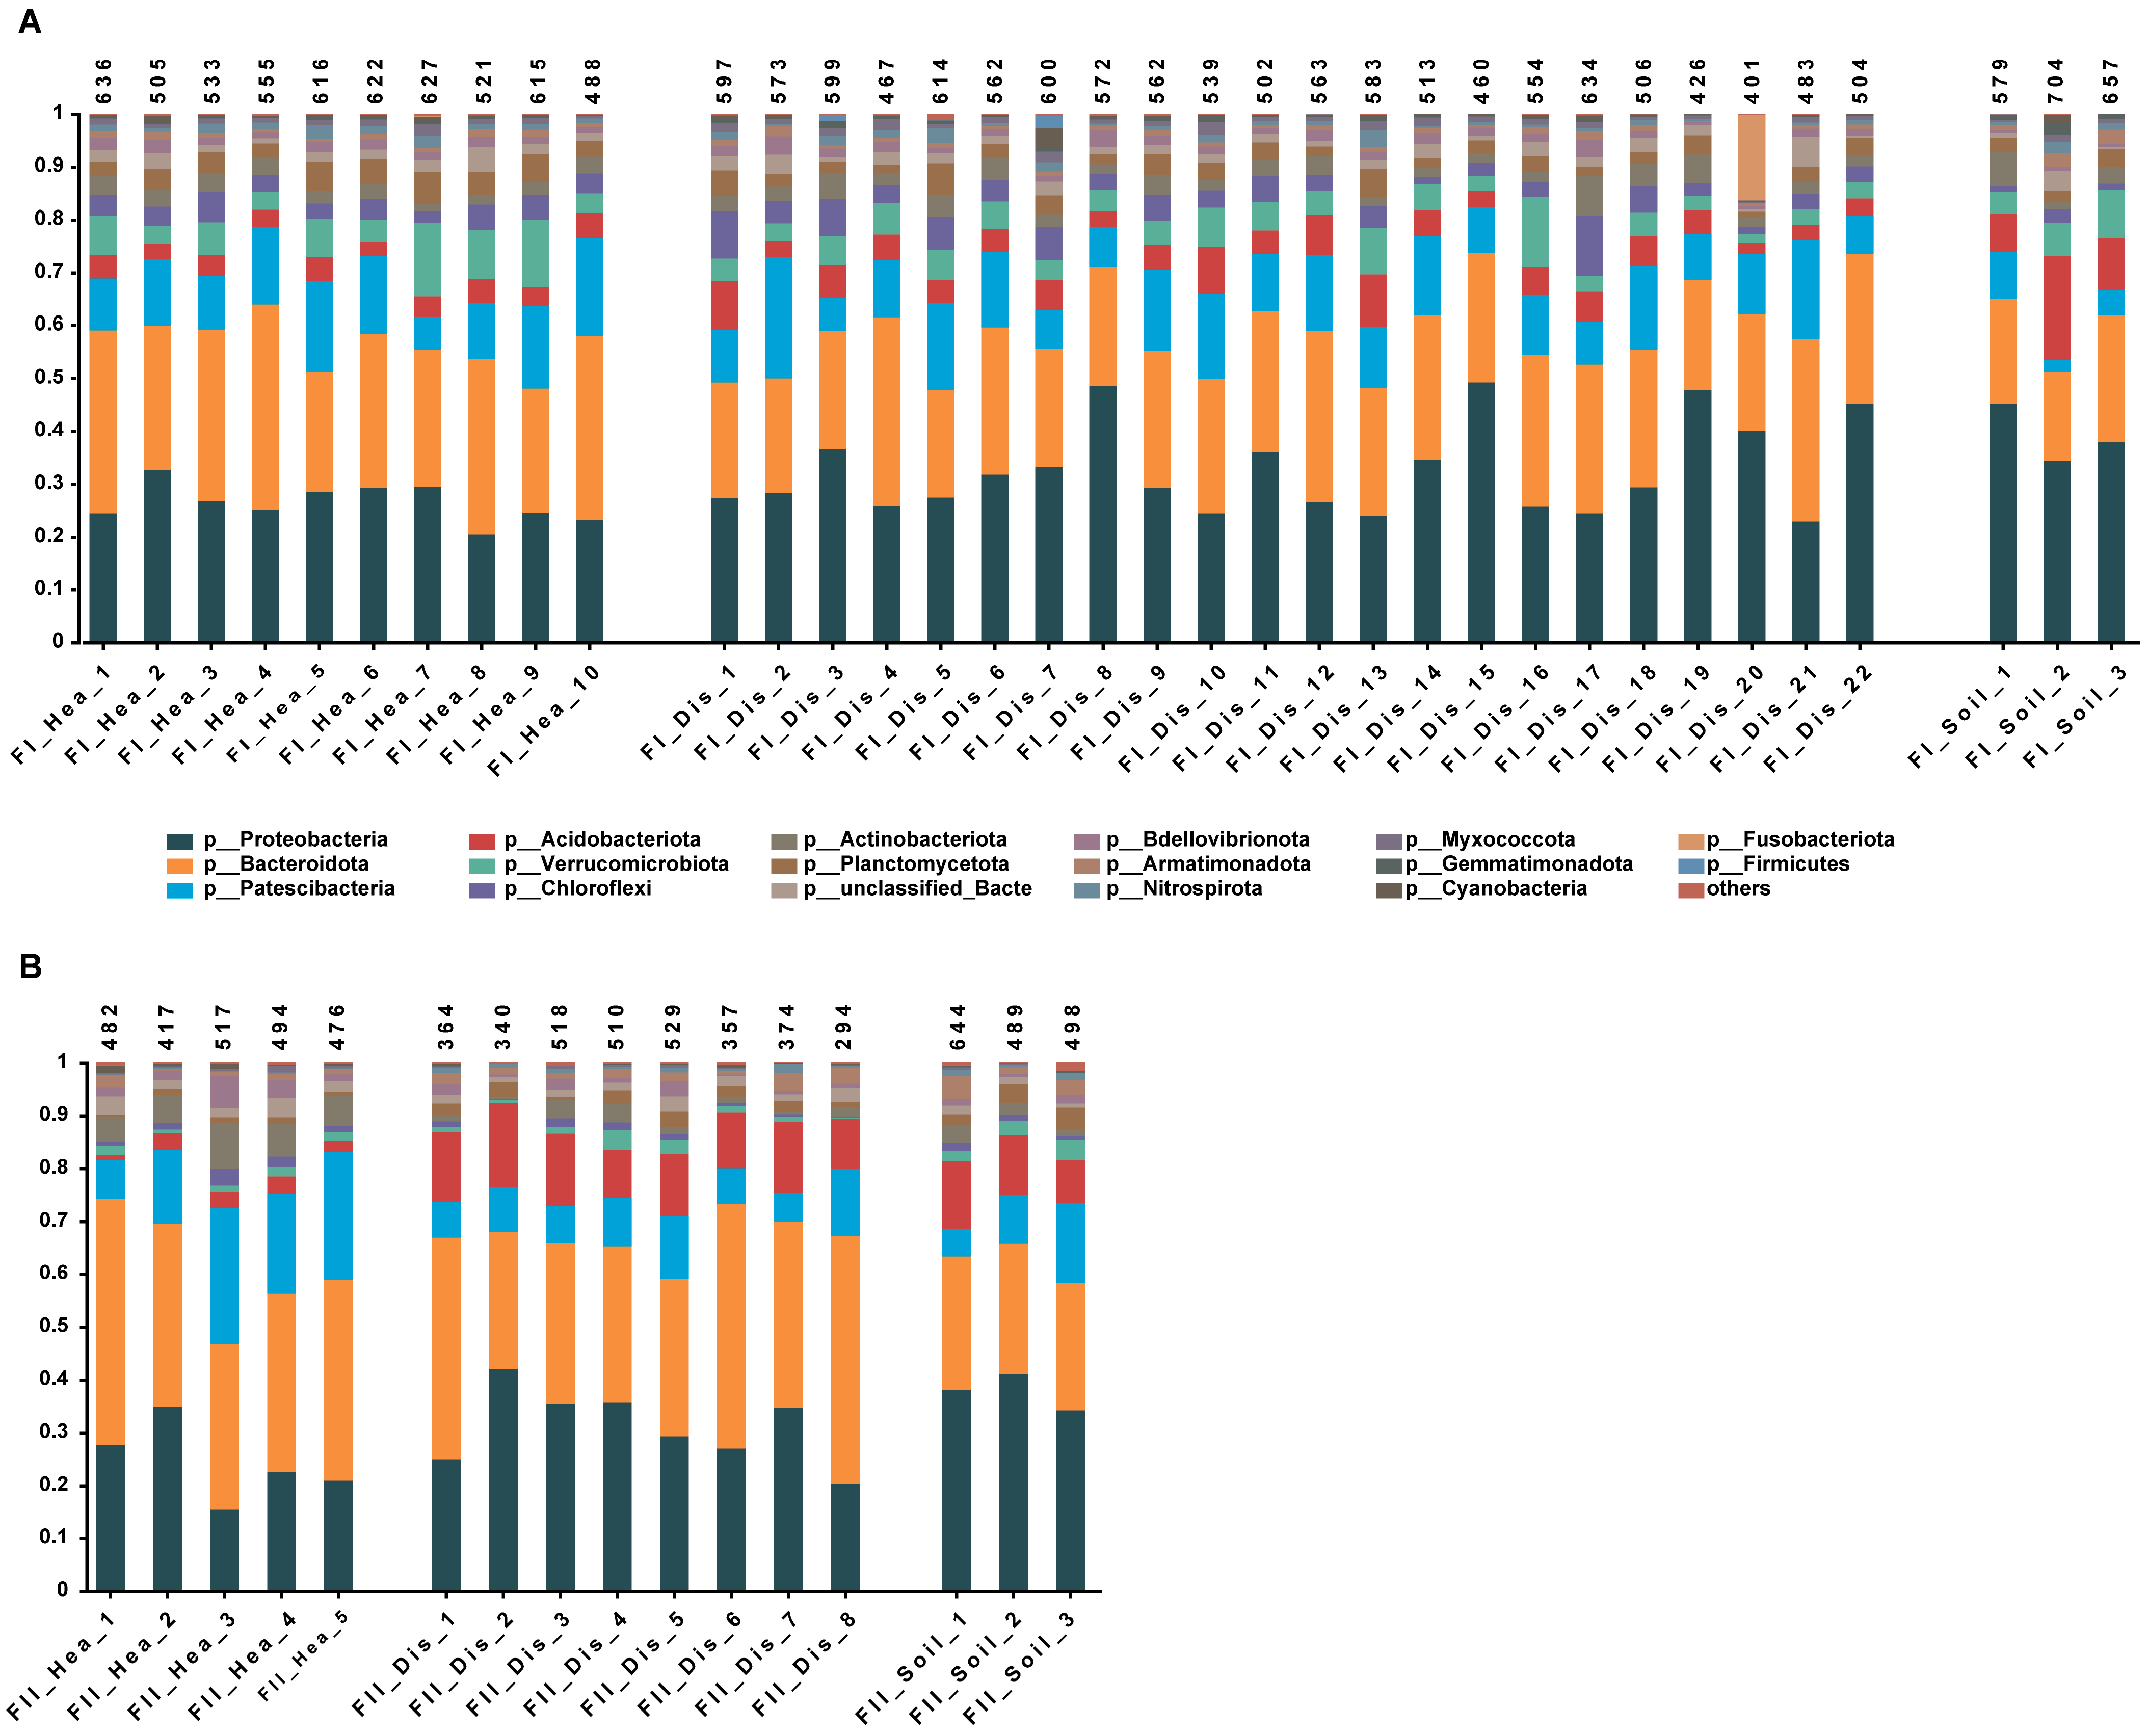
We compared the rhizosphere bacterial communities between healthy and diseased F. tataricum plants using high-quality long-read FL16S data (Figure 1A,B, Table S1). Across all samples, 583,636 circular consensus sequences (CCSs) were obtained, with per-sample read counts ranging from 7730 to 12,931 (median: 11,443 reads; Table S1). These CCSs were clustered into operational taxonomic units (OTUs) at 97% sequence identity, resulting in 954 OTUs in Field I (Figure 1A) and 912 OTUs in Field II (Figure 1B). Rarefaction curves approached saturation (Figure S1), and coverage indices were consistently high, indicating sufficient sequencing depth to capture most bacterial diversity. Specifically, 88.57% of samples in Field I and 93.75% in Field II reached a coverage value of 1.0 (Table S1). Taxonomic assignment based on FL16S classified 78.41% of OTUs to the genus level and 69.18% to the species level. Only OTUs detected in at least three samples were retained for downstream analyses to minimize potential artefacts while preserving low-abundance but consistently observed taxa.
Across all samples, 21 bacterial phyla were detected. For clarity, the most abundant phyla (98%) in each sample are shown, with the remaining phyla grouped as “Others”. Major phyla included Bacteroidota, Proteobacteria, Patescibacteria, Verrucomicrobiota, Actinobacteriota, Acidobacteriota, and Chloroflexi (Figure 1A,B). Bacteroidota was the most abundant, accounting for 16.82–46.95% of the total bacterial community, followed by Proteobacteria (15.52–49.15%). Patescibacteria and Verrucomicrobiota contributed 2.33–25.80% and 0.07–13.84%, respectively, across rhizosphere samples. Among the 19 genera with relative abundances exceeding 5%, Mucilaginibacter (9.84–37.38%), Herminiimonas (1.26–30.51%), and Sphingomonas (0.41–26.93%) predominantly occurred across both fields (Figure S2). Abundance data for other genera are provided in Figure S2.

3.2. Impact of RKN Infection on Rhizosphere Bacterial Diversity and Community Structure

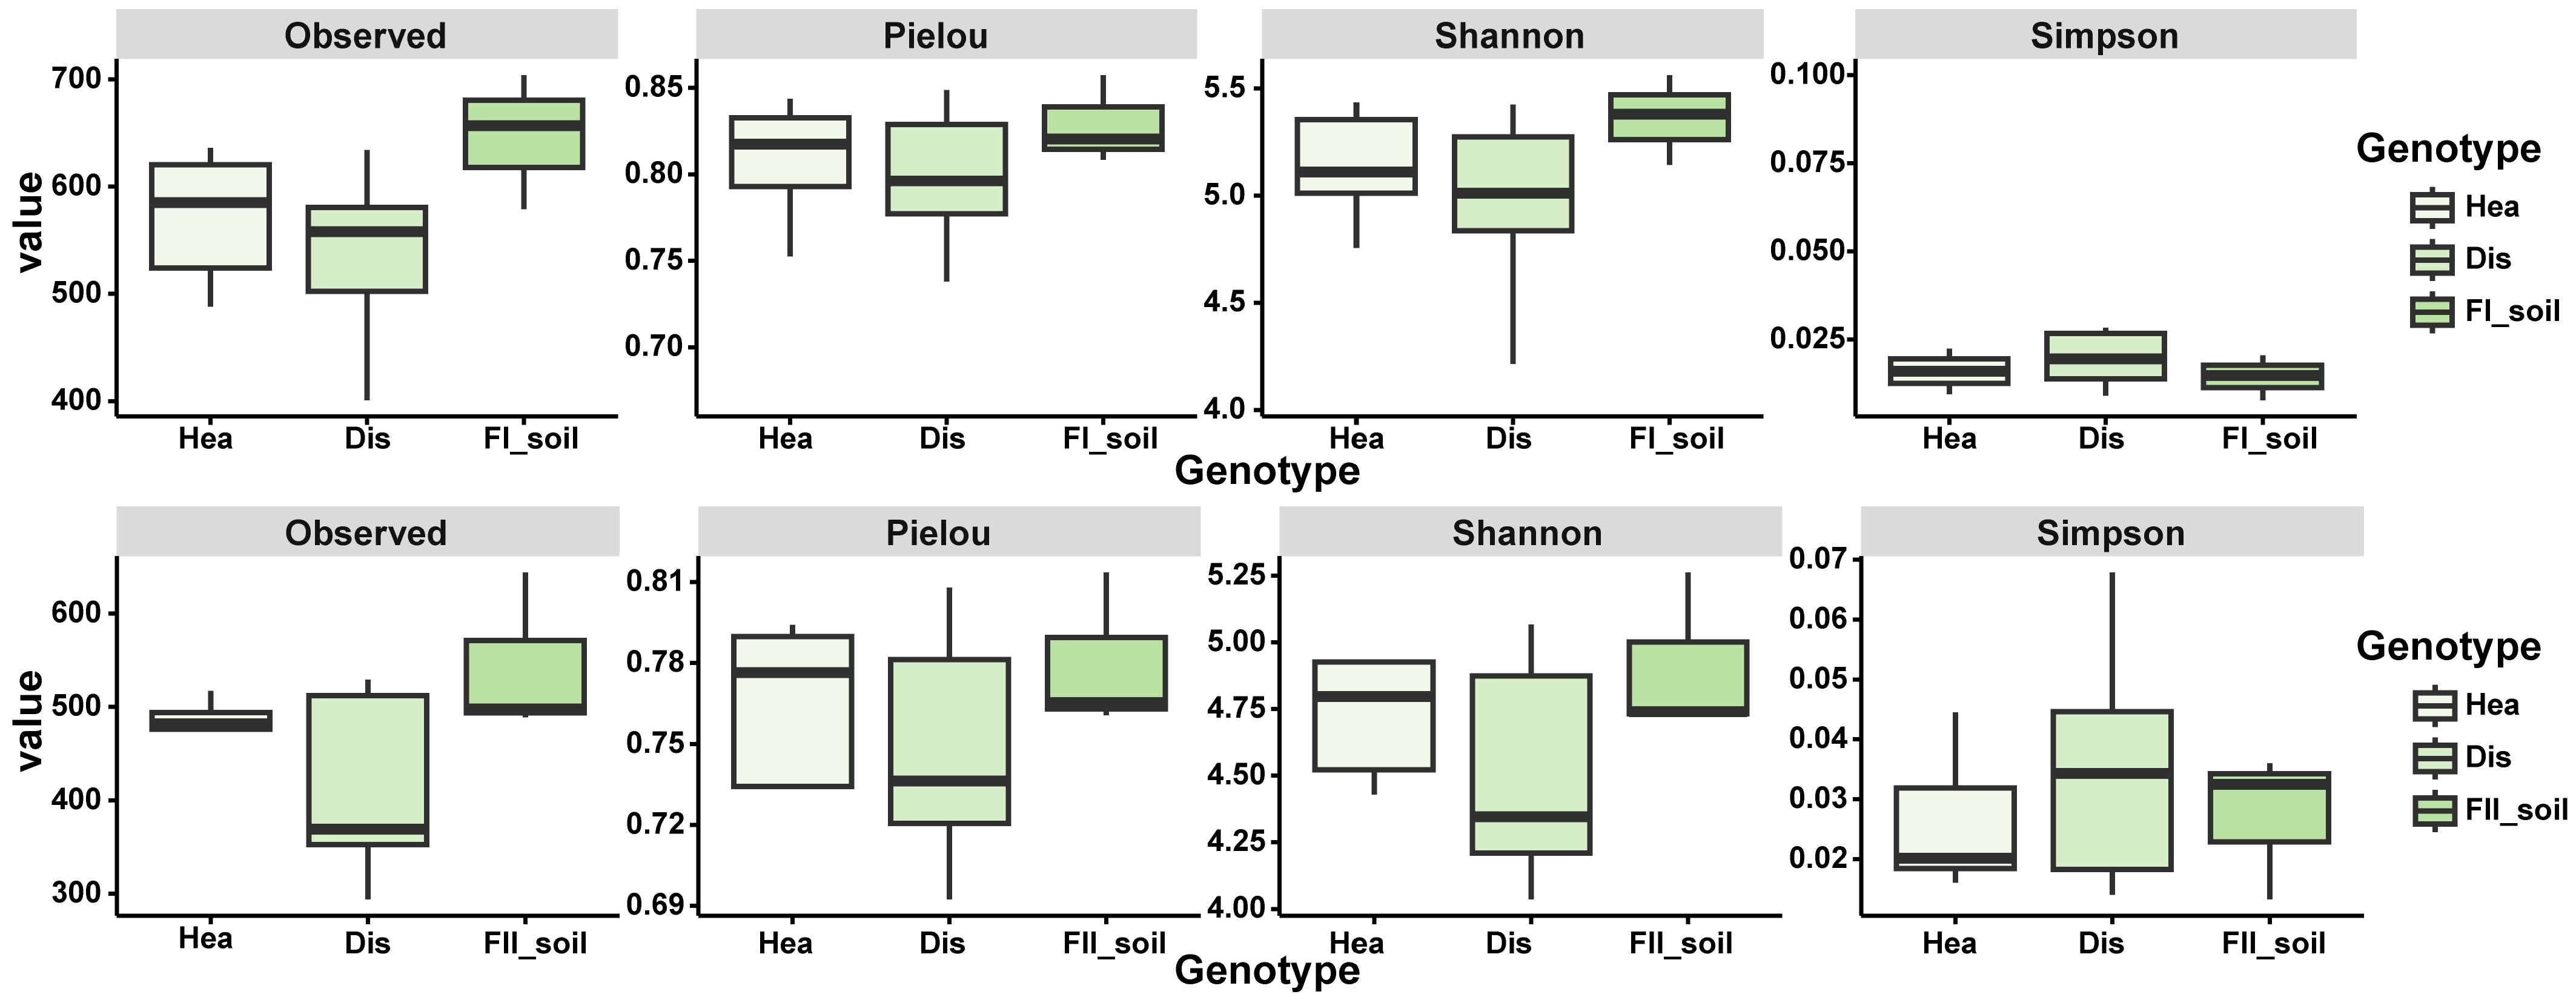
Alpha diversity was assessed to compare the within-sample bacterial diversity between the rhizosphere soils of healthy and diseased plants. For each field, α-diversity was quantified using Observed Richness, Pielou’s Evenness index, and the Shannon and Simpson Diversity Indices (Figure 2). Observed Richness reflects the number of taxa present, while the Shannon and Simpson Indices incorporate diversity, and Pielou’s Index specifically measures community evenness.
In field I, the observed richness in healthy samples ranged from 488 to 636 (mean = 571.8), which was generally higher than that in diseased samples [401–634 (mean = 537)]. Shannon index values in healthy rhizospheres ranged from 4.76 to 5.43 (mean = 5.14), compared to 4.05 to 5.43 (mean = 4.96) in diseased plants. Simpson index (1-D) values were typically lower in healthy samples [0.009–0.035 (mean = 0.017)] than in diseased samples [0.009–0.100 (mean = 0.028)], consistent with higher bacterial diversity in the healthy rhizosphere, as lower Simpson values correspond to higher diversity. Pielou’s Evenness Index also tended to be higher in healthy samples [0.753–0.844 (mean = 0.810)] than in diseased samples [0.669–0.849 (mean = 0.789)]. Similar trends in richness, diversity, and evenness were observed in field II (Figure 2). Although the differences in α-diversity between healthy and diseased rhizosphere communities were not statistically significant in either field, healthy plants consistently exhibited higher bacterial richness and diversity, as indicated by the observed Richness, Shannon, and Simpson indices. Pielou’s Evenness Index further suggested that healthy rhizosphere soils tended to harbor more evenly structured bacterial communities than those associated with diseased plants. Overall, healthy F. tataricum plants were associated with rhizospheres that harbored more diverse, abundant, and evenly distributed bacterial communities compared to those of diseased plants.
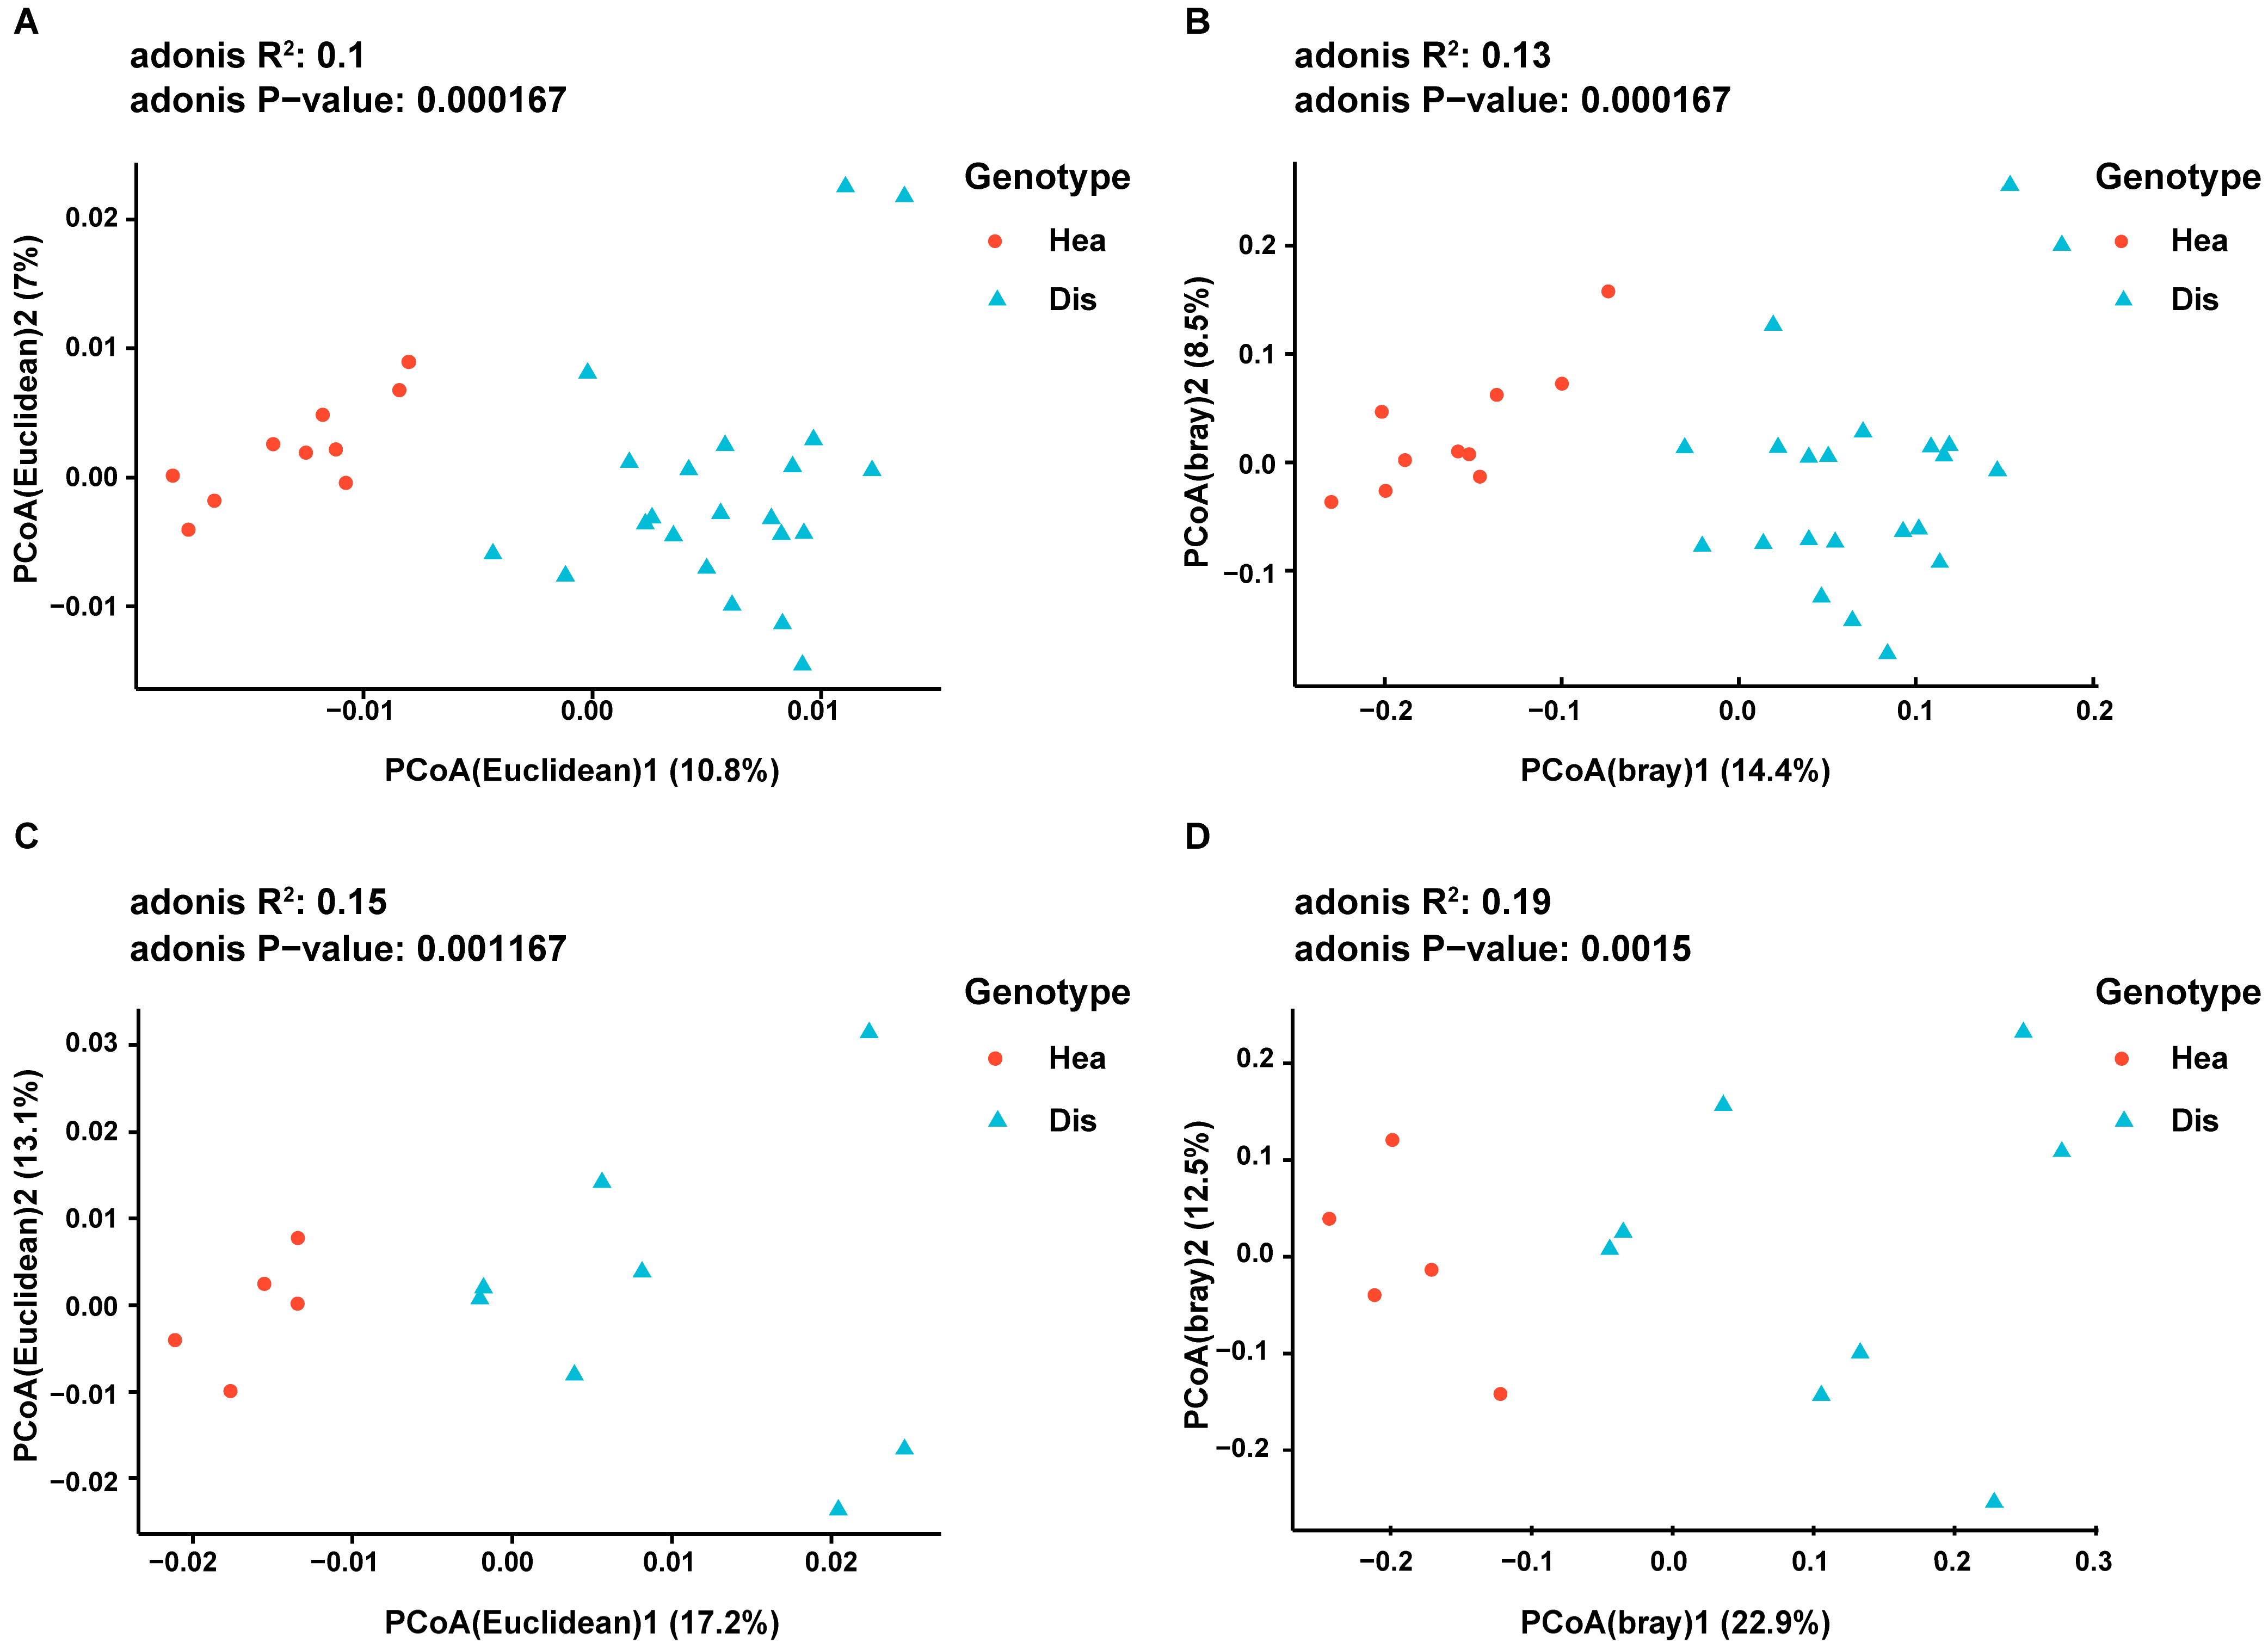
A Principal Co-Ordinate Analysis (PCoA) was performed on all field samples to identify patterns in bacterial community composition. Euclidean and Bray–Curtis distance matrices were visualized for both field I and field II. The first and second principal coordinates (PCoA1 and PCoA2) explained 17.8% and 30.3% of the variance in Field I and Field II, respectively, for Euclidean distances (Figure 3A for Field I, Figure 3C for Field II). In contrast, for Bray–Curtis distances, PCoA1 and PCoA2 accounted for 22.9% and 35.4% of the variance in Field I and Field II, respectively (Figure 3B for Field I, Figure 3D for Field II).
Across both fields, samples clearly separated into two distinct clusters along the PCoA axes, corresponding to healthy and diseased plants (Figure 3). Samples from plants with the same infestation status clustered together, indicating that the infestation state represented the main source of variation in bacterial community structure. Thus, bacterial communities in healthy plants were significantly differentiated from those in diseased plants. The assumption of PERMANOVA, namely homogeneity of multivariate dispersion, was satisfied. PERMANOVA further confirmed that bacterial community composition was strongly influenced by infestation status (p < 0.001) for both Euclidean and Bray–Curtis distance matrices in field I and field II, highlighting the pronounced impact of RKN disease on bacterial diversity and community structure.

3.3. Biomarkers of RKN Infection: Microbial Diversity and OTUs Enrichment in the Rhizosphere

The relative abundance of individual phyla varied between healthy and diseased plants. Overall, rhizosphere samples from healthy plants exhibited a higher relative abundance of Abditibacteriota but a lower abundance of Acidobacteriota compared to those from diseased plants (FDR-adjusted p < 0.05, Wilcoxon rank sum test; Figure S3). These patterns suggest phylum-level shifts in community composition associated with RKN infestation.
Further comparisons of altered microorganisms at the genus level between healthy and diseased F. tataricum revealed significant differences (Figure S4). A total of 21 genera exhibited a significant increase in healthy plants, while 11 genera showed an increase in diseased plants (FDR-adjusted p < 0.05, Wilcoxon rank sum test). The notable enrichment of bacterial genera in healthy plants aligns with the higher microbial diversity observed in these varieties. The abundance of a genus within the family Mitochondria and Prosthecobacter increased approximately 42-fold and 23-fold, respectively, in healthy rhizospheres (FDR-adjusted p < 0.05, Wilcoxon rank sum test). In contrast, the abundance of WWH38, Vibrionimonas, and Phyllobacterium was approximately 10 times lower in healthy rhizospheres compared to diseased ones (FDR-adjusted p < 0.05, Wilcoxon rank sum test; Figure S4).
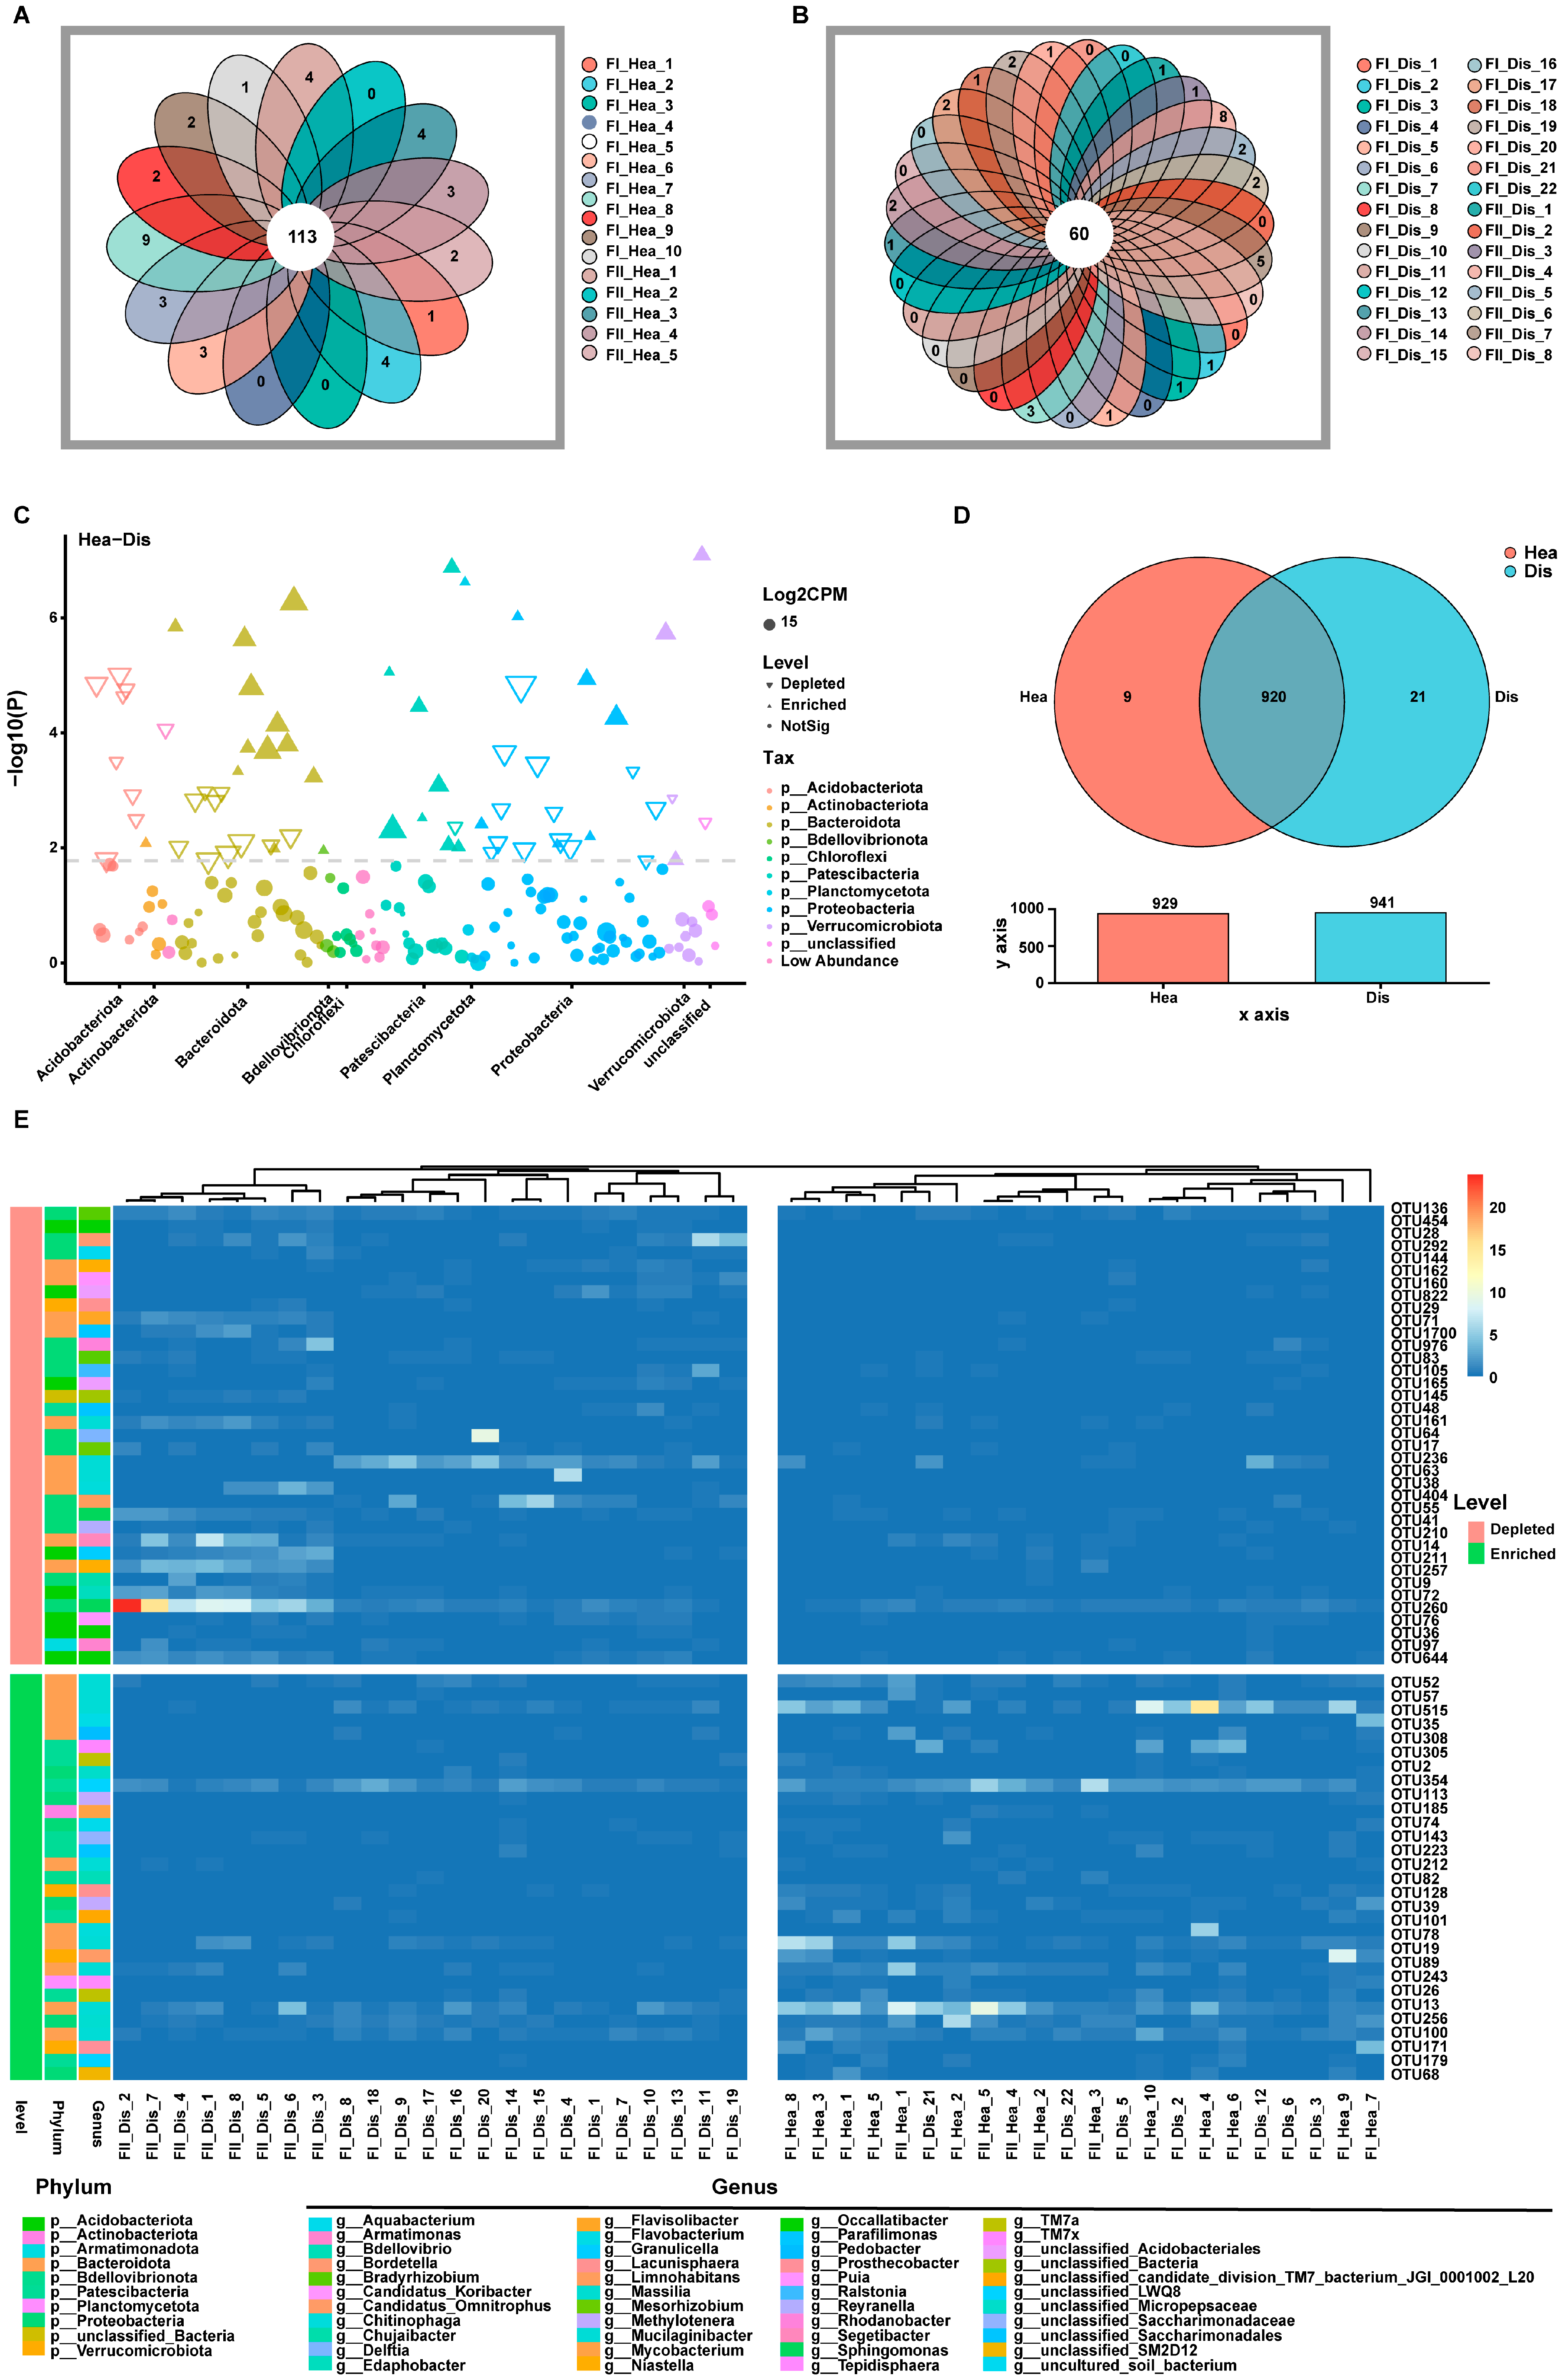
Notably, there was substantial overlap of OTUs within both the healthy and diseased groups. Specifically, 113 OTUs were shared among all healthy samples (Figure 4A), while 60 OTUs were shared among all diseased samples (Figure 4B). Additionally, we observed that a total of 52 OTUs were common across all samples (Figure S5). We next examined the differences at the OTU level using Manhattan plots. Among OTUs with a relative abundance greater than 0.1%, we identified 66 differentially abundant OTUs, which were assigned to 44 genera across 10 bacterial phyla (Figure 4C). Of these, 35 OTUs were enriched in diseased plants, while 31 OTUs were depleted in diseased plants compared to healthy plants (FDR-adjusted p < 0.05, Wilcoxon rank sum test). OTUs enriched in healthy samples belonged to Bacteroidota, Patescibacteria, Proteobacteria, Verrucomicrobiota, Actinobacteriota, Bdellovibrionota, and Planctomycetota. The diseased rhizosphere retained the capacity to enrich OTUs belonging to Proteobacteria, Bacteroidota, Acidobacteriota, Armatimonadota, Patescibacteria, and Verrucomicrobiota; the genus Mucilaginibacter was the most represented, comprising 11 OTUs. A Venn diagram (Figure 4D) was created to distinguish OTUs exclusive to either healthy or diseased rhizospheres. A total of 920 common OTUs were shared between healthy and diseased samples. Based on the presence or absence of infection, we identified 9 OTUs (0.97%) unique to healthy plants and 21 OTUs (2.23%) unique to diseased plants (Figure 4D).
We then analyzed these root microbiota members and found that certain indicator bacterial OTUs could serve as biomarkers to differentiate healthy from diseased plants. A heatmap illustrating the 66 differentially abundant OTUs, identified as indicator bacterial OTUs associated with RKN occurrence in all samples, is shown in Figure 4E. Hierarchical clustering was applied to the rhizosphere samples, resulting in distinct clusters along the x-axis. Most healthy samples formed distinct clusters, separate from those of diseased samples. The model demonstrated 100% accuracy for healthy plants, with 76.7% accuracy for diseased plants (Figure 4E). These results suggest that these 66 OTUs can serve as relatively accurate biomarkers for distinguishing between healthy and diseased plants, though some degree of error may still exist. This finding opens new avenues for exploring potential biomarkers linked to the shifts in microbial community diversity caused by RKN infection.

3.4. Microbial Co-Occurrence Patterns and Network Analysis in Rhizosphere Bacterial Communities

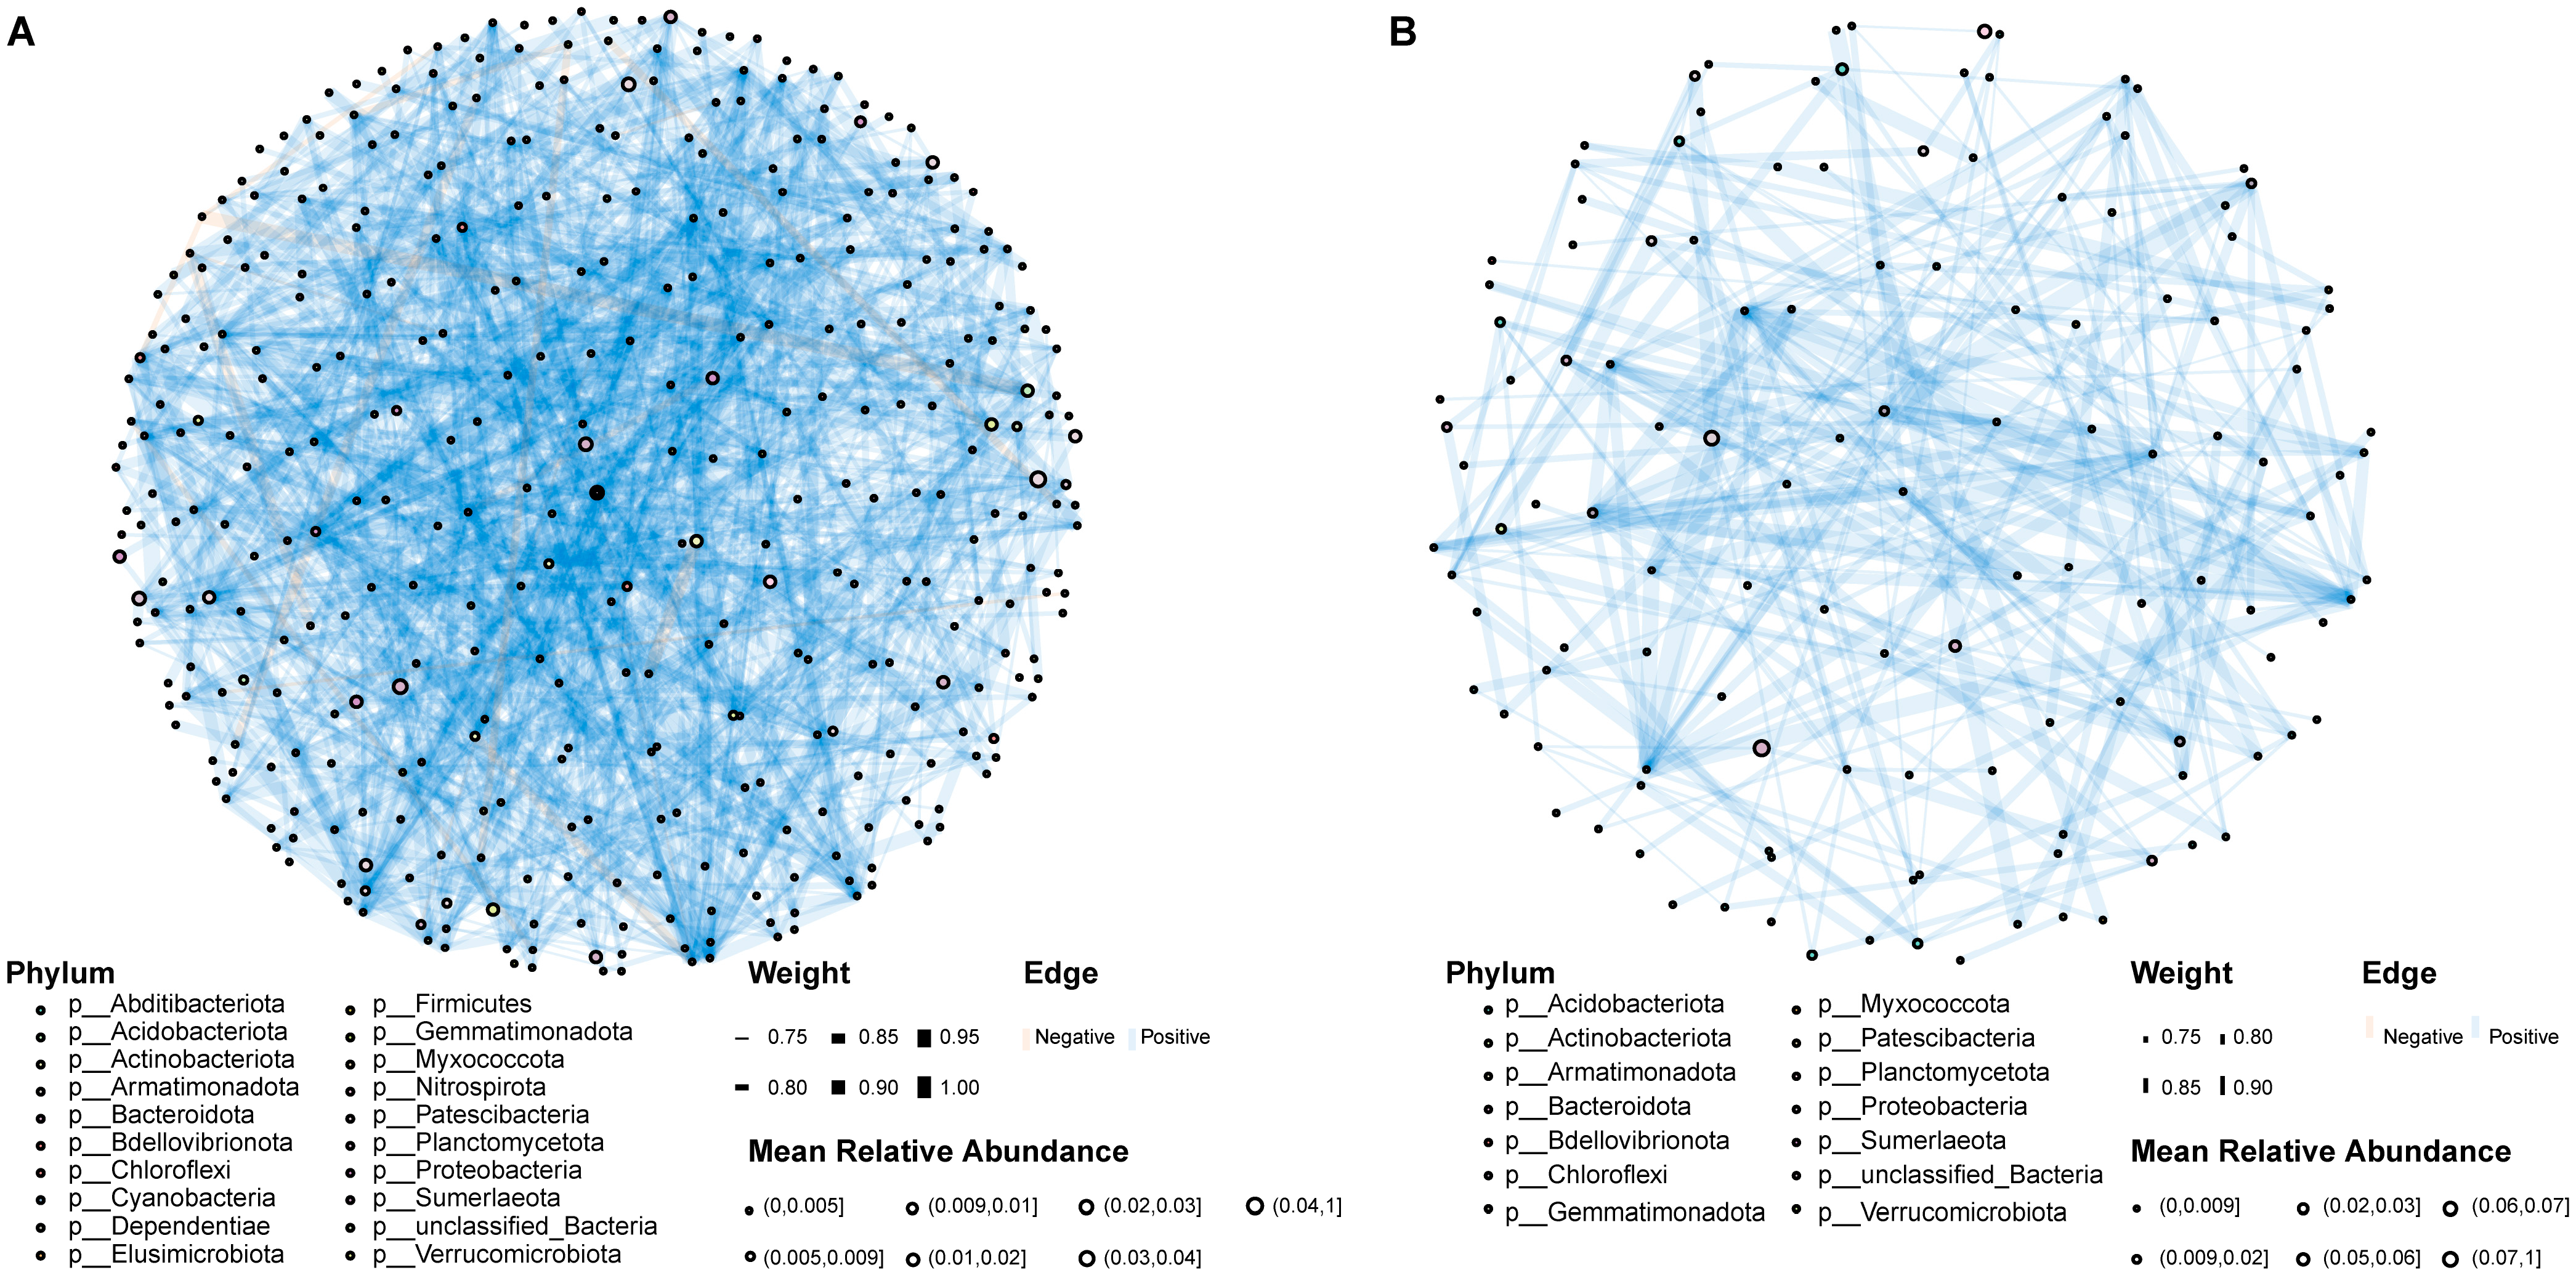
To explore microbial co-occurrence patterns in the rhizosphere bacterial communities of both healthy and diseased F. tataricum plants, we constructed distinct co-occurrence networks for each health condition (Figure 5A,B). Putative OTU-OTU associations were inferred by integrating both Spearman and Pearson correlation methods. For network construction, we included only OTUs detected in a minimum of three healthy samples (healthy network) or three diseased samples (diseased network). To assess network complexity, we evaluated key parameters, such as the number of nodes, edges, and average degree, which collectively characterize the network’s connectivity and structural properties. In summary, the healthy plant network demonstrated a higher level of bacterial interaction complexity, comprising up to 460 OTUs across 18 phyla. In contrast, the diseased plant network contained only 175 OTUs from 15 phyla, with fewer interactions (955 edges in the healthy network compared to 255 edges in the diseased network) (Table 1). The healthy network demonstrates a diverse microbial community with frequent interactions, indicating a more stable and balanced ecosystem. Elevated interaction frequencies typically suggest more symbiotic or competitive relationships between species.
In these networks, healthy and diseased plants harbored distinct sets of associated species and exhibited contrasting interaction structures. Certain OTUs, including OTU586 (Conexibacter sp.), OTU10 (Mucilaginibacter frigoritolerans), OTU81 (Leifsonia xyli), and several members of the LWQ8 family (OTU6, OTU108, OTU23, OTU323), as well as OTU22 (TM7a) and OTU102 (Tetrasphaera sp.), tended to occupy more central hub positions within the microbial network (Table 2). This is supported by their high Kleinberg hub centrality values (vector ≥ 0.7), suggesting that they serve as important hubs linking multiple taxa. In summary, these nine OTUs were positively or negatively correlated with 167 other OTUs in the network, underscoring their extensive connectivity. In contrast, the microbial network of diseased plants was dominated by a distinct set of hub taxa, including OTU1445 and OTU865 (Ktedonobacteraceae), OTU75, OTU103, and OTU1128 (JG30a_KF_32), and OTU263 (1921_3) (Table 1). Overall, these six OTUs were positively or negatively correlated with 86 other OTUs, reflecting substantial connectivity within the network. None of these overlapped with the hub OTUs detected in the healthy plant network, suggesting a marked reorganization of network structure under disease. This suggests that they may be protecting F. tataricum from further harm or performing a crucial role as a keystone species in the dynamics of RKN infection. Based on these interactions, all taxa were classified into 57 distinct modules in the healthy network, compared to 33 modules in the diseased network (Table 1). Detailed information on the topological feature coefficients for both the healthy and diseased networks is provided in Table 1. Network analysis revealed minimal overlap in edges involved in complex interactions between healthy and diseased plants; only 1.6% of these edges were shared by both networks (Figure S6).
The analysis of intra- and inter-phylum interactions in both healthy and diseased networks reveals substantial differences in microbial community structure, emphasizing the dynamics between species within the same phylum and across different phyla. In the healthy network, overall, it exhibits lower intra-phylum interaction values, with diversity preserved through cross-phylum interactions (Table S2). In the diseased network, several phyla exhibit significantly higher intra-phylum interactions, indicating a shift toward more isolated or specialized microbial groups (Table S3). For instance, Acidobacteriota exhibited 21.54% intra-phylum interactions (an increase from 5.74% in the healthy state), and Chloroflexi exhibited 81.82% intra-phylum interactions (an increase from 23.94% in the healthy state). The observed higher inter-phylum interactions suggest that it assumes a more aggressive role in the diseased state. In contrast, the healthy network exhibits a more diverse distribution of intra- and inter-phylum interactions, with a general trend of lower intra-phylum interactions, indicating a balanced and stable microbial ecosystem.

4. Discussion

RKNs are highly destructive, soilborne pathogens that cause considerable damage to crops globally. A growing body of research underscores the critical role that the balance of microbial communities within the rhizosphere plays in suppressing RKN infections [35,36,37]. However, there is a lack of research specifically exploring the relationship between RKN infection and the composition of the F. tataricum rhizosphere bacterial community, particularly at higher taxonomic resolutions, such as the species level. This study aims to establish baseline data to understand the associations between rhizosphere bacterial community profiles at an accurate taxonomic resolution (species levels) using long-read FL16S, and the occurrence of RKNs.
According to our microbiome analysis, Bacteroidota, Proteobacteria, Actinobacteriota, and Acidobacteriota comprised the major bacterial phyla in the rhizosphere (Figure 1A,B). This pattern aligns with previous studies, in which these four phyla have been consistently reported as dominant components of rhizosphere bacterial communities across a variety of crop species, including rice [38], wheat [39], maize [40], soybean [41], tomato [42], and potato [43]. In our study, Bacteroidota was the most abundant phylum, accounting for 16.82–46.95% of the total bacterial community, followed by Proteobacteria, which comprised 15.52–49.15%. However, the phylum-level abundance ranking in F. tataricum differs from those observed in other crops. In particular, the uniquely high abundance of Patescibacteria in F. tataricum comprised 2.33–25.80% of the total bacterial taxa, while Verrucomicrobiota contributed 0.07–13.84% across the F. tataricum rhizosphere samples (Figure 1A,B). In contrast, these phyla are present at much lower levels in other crops [38,40], indicating that each crop may harbor a rhizosphere microbial community with a distinct and species-specific structure [44]. The structure of rhizosphere microbial communities is shaped not only by environmental factors but also by host-mediated mechanisms [45]. Plants selectively recruit or suppress microbes through root exudates and phytohormones (ET, JA, SA) [46], and variation in exudate composition among species or genotypes generates spatial heterogeneity in microbial communities. Even within a species, host genotype drives distinct microbial assemblages under identical soil conditions, thereby affecting richness and structure [47]. These findings highlight the strong host specificity of rhizosphere microbes; microbial taxa that successfully colonize one plant species may not be able to establish on another. Consequently, although many potent microbial agents have been developed for RKN control in other crops [5,7,8], their efficacy in F. tataricum may be limited or absent, highlighting the need for targeted strategies that utilize F. tataricum’s native microbiota for effective biological control.
Previous studies have reported distinct differences in rhizosphere bacterial communities between healthy and RKN-infected crops [17,48], which is consistent with the results of the present study. We calculated the Euclidean and Bray–Curtis distances among samples and performed PERMANOVA along with β-dispersion analyses (Figure 3). In both Field I and Field II, the samples from the healthy and diseased groups formed two distinct clusters. PERMANOVA analysis further confirmed that bacterial community composition was significantly influenced by infestation status (p < 0.001) (Figure 3). Our results suggest that RKN infection is associated with changes in the rhizosphere bacterial community structure of F. tataricum. However, the mechanisms underlying these changes remain largely unexplored.
Subsequently, we assessed the differences at the OTU level using Manhattan plots and identified 66 differentially abundant OTUs (FDR-adjusted p < 0.05, Wilcoxon rank sum test) in the rhizosphere bacterial community structures of healthy and diseased plants (Figure 4C). Furthermore, these 66 bacterial OTUs serve as indicators for distinguishing between healthy and diseased plants, exhibiting high accuracy—100% for healthy plants and 76.7% for diseased plants (Figure 4E). These results suggest that these OTUs may play a role in preventing or mitigating RKN outbreaks. Interestingly, the proportion of specific bacteria exhibiting significantly altered abundances was found to be quite low. For example, the mean relative abundance of OTU161 (Delftia acidovorans) was 0.005% in the healthy rhizosphere and 0.322% in the diseased rhizosphere (Figure 4C). Emerging evidence suggests that microbial taxa present at low relative abundance can nonetheless exert disproportionately important functional influences within rhizosphere microecosystems [49]. Moreover, a significant proportion of species remained taxonomically unresolved, with many unable to be identified even at higher taxonomic ranks, such as phylum or order, in this study. This suggests that the bacterial community in the rhizosphere of F. tataricum is highly complex, with a substantial presence of species whose functions remain unidentified. The existence of these unknown taxa in the rhizosphere warrants further investigation to better understand their potential ecological roles.
Interactions among microbiomes within the root rhizosphere soil are crucial for maintaining a stable microbial community, which, in turn, plays a vital role in promoting plant health [50]. These interactions regulate the dynamics of microbial populations, enhance nutrient cycling, and support plant resistance to pathogens and stressors. Yizhu Qiao et al. demonstrated that healthy rhizosphere soil enhances the stability and complexity of the bacterial community network. This increase in network complexity contributes to a more robust rhizobacterial network, which, in turn, helps reduce the plant disease index [50]. In our study, we constructed microbial networks to illustrate the complex interactions among the microbial communities. The results indicated that the healthy plant network exhibited a more complex bacterial interaction profile, encompassing 460 OTUs across 18 phyla. In contrast, the diseased plant network consisted of only 175 OTUs from 15 phyla and demonstrated significantly fewer interactions, with 955 edges in the healthy network compared to just 255 in the diseased network (Figure 5). Microbial interactions in healthy rhizospheres were considerably more complex than those in diseased rhizospheres. These results suggest that a more intricate and dynamic network of microbial relationships may contribute to the stability and resilience of healthy plant ecosystems.
Traditional research on the biological control of RKNs has predominantly focused on the interactions between plants, pathogens, and biocontrol bacteria, often overlooking the critical role of the overall microbial community balance [6,13,15]. However, a more effective strategy for managing RKN disease involves identifying key species capable of restoring balance to the rhizosphere microbiome and sustaining soil health. In this study, we employed co-occurrence patterns and microbial networks as powerful analytical tools to identify key species. Ultimately, we identified 9 key species—potential probiotic candidates—based on their high Kleinberg hub centrality values (vectors ≥ 0.7), highlighting their central role in microbial network dynamics (Figure 5). OTU586, identified as Conexibacter, exhibited an increase in relative abundance within the healthy samples. Members of this genus are widely recognized as plant growth-promoting bacteria and potential biocontrol agents [51]. Nonetheless, whether OTU586 contributes to nematode suppression remains to be experimentally validated. OTU10 was identified as Mucilaginibacter frigoritolerans, a member of the Sphingobacteriaceae family. Species within the Sphingobacteriaceae family have been reported to exhibit significantly higher abundance in suppressive soils in the presence of pathogens, suggesting that OTU10 may play a crucial role in enhancing soil suppressiveness and contributing to RKNs control in F. tataricum. Interestingly, OTU81 was annotated as Leifsonia xyli, which has been reported as a pathogen of sugarcane crops [52]. Similar to Pseudomonas aeruginosa, which, although an opportunistic pathogen, is also a well-known strain capable of degrading harmful contaminants to plants [53], Leifsonia xyli may not pose a threat to F. tataricum. Instead, it is possible that Leifsonia xyli could provide beneficial metabolites for other biological control bacteria, thereby positively influencing the microbial community. OTU6, OTU108, OTU23, and OTU323 were identified as belonging to the LWQ8 family. Research by Lai et al. has shown that enriched bacterial taxa, particularly LWQ8 at the family level, enhance the stability of the soil microbial co-occurrence network [54]. These species in LWQ8 not only directly influence the quality of medicinal herbs but also indirectly modulate the accumulation of bioactive compounds, highlighting their pivotal role in soil health [54]. OTU102 was classified as Tetrasphaera sp., a bacterium from the genus Tetrasphaera known for its role in enhanced biological phosphorus cycling [55] and its denitrification activity [56]. It may function as a biological control agent, indirectly promoting nutrient absorption and enhancing plant growth by providing essential nutrients in F. tataricum. OTU22 was assigned to the Saccharimonadaceae family, members of which are considered to possess the capacity for carbon transformation through central metabolic pathways [57]. Such metabolic activity is likely to contribute to the release of bioavailable carbon, thereby supporting the growth and metabolic functions of coexisting microorganisms. These findings suggest that these bacteria may act as keystone species in microbial community interactions, playing a crucial role in maintaining microbial community balance and defending F. tataricum against RKN infection. Future studies should focus on verifying the functional roles of these species through functional assays or mechanistic pathway analyses.
Characterizing the rhizobacterial community, especially populations associated with RKNs, is crucial for understanding the mechanisms that restrict RKN establishment and proliferation. This study offers the first comparative analysis of rhizobacterial communities in healthy and diseased rhizospheres in F. tataricum, along with the identification of key and indicator microbiomes. In conclusion, these findings establish a foundation for further investigation into the role of bacterial communities in RKN infection and their potential to inhibit plant pathogen growth, thereby enhancing plant defense mechanisms.
A limitation of the current study is its reliance on a single time-point approach. Future research utilizing longitudinal sampling would provide a more in-depth understanding of microbiome dynamics over time. Additionally, further investigations could examine the influence of field-specific environmental factors—such as soil composition, pH, and moisture—on the structure and diversity of rhizosphere microbial communities associated with F. tataricum under root-knot nematode (RKN) infection.

Supplementary Materials

The following supporting information can be downloaded at: https://www.mdpi.com/article/10.3390/d18050240/s1, Figure S1: Rarefaction curves showing OTU richness of microbial communities in the F. tataricum rhizosphere; Figure S2: Cumulative analysis of the relative abundance of rhizosphere microbial communities at the genus level in Field I and Field II. The numbers above each box represent OTU richness (i.e., the number of OTUs) in each sample. (A) In Field I; (B) In Field II; Figure S3: Taxonomic characteristics of differential bacteria at the phylum level between healthy and diseased rhizosphere microbiota. Statistical comparisons were conducted using the Wilcoxon rank-sum test. Asterisks (*) denote a significant difference with a p-value < 0.05; Figure S4: Volcano plot of taxonomic characteristics of differential bacteria at the genus level between healthy and diseased rhizosphere microbiota. Statistical comparisons were conducted using the Wilcoxon rank-sum test. Red indicates bacterial genera enriched in the healthy rhizosphere, while green represents those enriched in the diseased rhizosphere. Gray points represent no significant difference between the two groups. A p-value < 0.05 denotes a significant difference; Figure S5: Venn diagram illustrating the OTUs shared across all samples. The Venn diagram presents the distribution and overlap of operational taxonomic units (OTUs) among all samples included in this study; Figure S6: Comparison of unique and overlapping interaction edges detected between the healthy and diseased groups, illustrating group-specific and shared network connectivity patterns; Table S1: Overview of statistics for PacBio filtered Circular Consensus Sequence (CCS) reads across multiple sample sets; Table S2: Statistical analysis of the interaction frequency among taxa at the phylum level in the healthy network; Table S3: Statistical analysis of the interaction frequency among taxa at the phylum level in the diseased network.

Author Contributions

Writing—original draft preparation and visualization, C.L.; resources, C.T. and Y.Z.; data curation, C.T.; writing—review and editing, X.W.; supervision, Z.W.; methodology, D.Z.; validation, M.R. All authors have read and agreed to the published version of the manuscript.

Funding

This research was funded by the Science and Technology Planning Project of Yunnan Science and Technology Department (202301AU070225), the Yunnan Academy of Agricultural Sciences Research Pre-project (2024KYZX-08), the Guizhou Provincial Science and Technology Projects (No. 2022-563), and the Science and Technology Platform of Qianxinan Prefecture (No. 2024-2).

Institutional Review Board Statement

This study did not require ethical review or approval, as it relied exclusively on non-invasive ecological field surveys and did not involve human or animal experimentation.

Data Availability Statement

Raw sequence data reported in this paper have been deposited National Center for Biotechnology Information (NCBI) database under project number PRJNA1454328.

Acknowledgments

The authors have reviewed and edited the output and take full responsibility for the content of this publication.

Conflicts of Interest

The authors declare no conflicts of interest. The funders had no role in the design of the study; in the collection, analyses, or interpretation of data; in the writing of the manuscript; or in the decision to publish the results.

Abbreviations

The following abbreviations are used in this manuscript:
RKNsRoot-knot nematodes
OUTOperational taxonomic unit
FL16SFull-length 16S rRNA gene sequencing
CCSCircular Consensus Sequencing
PCoAPrincipal co-ordinates analysis
CSSCumulative sum scaling
PEMANOVAPermutational multivariate analysis of variance
FDRFalse Discovery Rate

References

  1. Hemmati, S.; Saeedizadeh, A. Root-knot nematode, Meloidogyne javanica, in response to soil fertilization. Braz. J. Biol. 2019, 80, 621–630. [Google Scholar] [CrossRef]
  2. Subedi, S.; Thapa, B.; Shrestha, J. Root-knot nematode (Meloidogyne incognita) and its management: A review. J. Agric. Nat. Resour. 2020, 3, 21–31. [Google Scholar] [CrossRef]
  3. Khalil, M.; El-Aziz, A.; El-Khouly, A. Optimization the impact of Fluopyram and Abamectin against the root-knot nematode (Meloidogyne incognita) on tomato plants by using Trichoderma album. Egypt. J. Agronematology 2022, 21, 79–90. [Google Scholar] [CrossRef]
  4. Huang, K.; Jiang, Q.; Liu, L.; Zhang, S.; Liu, C.; Chen, H.; Ding, W.; Zhang, Y. Exploring the key microbial changes in the rhizosphere that affect the occurrence of tobacco root-knot nematodes. Amb Express 2020, 10, 72. [Google Scholar] [CrossRef]
  5. Aioub, A.A.; Elesawy, A.E.; Ammar, E.E. Plant growth promoting rhizobacteria (PGPR) and their role in plant-parasitic nematodes control: A fresh look at an old issue. J. Plant Dis. Prot. 2022, 129, 1305–1321. [Google Scholar] [CrossRef]
  6. Burkett-Cadena, M.; Kokalis-Burelle, N.; Lawrence, K.S.; Van Santen, E.; Kloepper, J.W. Suppressiveness of root-knot nematodes mediated by rhizobacteria. Biol. Control 2008, 47, 55–59. [Google Scholar] [CrossRef]
  7. Viljoen, J.J.; Labuschagne, N.; Fourie, H.; Sikora, R.A. Biological control of the root-knot nematode Meloidogyne incognita on tomatoes and carrots by plant growth-promoting rhizobacteria. Trop. Plant Pathol. 2019, 44, 284–291. [Google Scholar] [CrossRef]
  8. Wei, L.; Shao, Y.; Wan, J.; Feng, H.; Zhu, H.; Huang, H.; Zhou, Y. Isolation and characterization of a rhizobacterial antagonist of root-knot nematodes. PLoS ONE 2014, 9, e85988. [Google Scholar] [CrossRef] [PubMed]
  9. Philippot, L.; Raaijmakers, J.M.; Lemanceau, P.; Van Der Putten, W.H. Going back to the roots: The microbial ecology of the rhizosphere. Nat. Rev. Microbiol. 2013, 11, 789–799. [Google Scholar] [CrossRef]
  10. Zobiole, L.; Kremer, R.; Oliveira, R., Jr.; Constantin, J. Glyphosate affects micro-organisms in rhizospheres of glyphosate-resistant soybeans. J. Appl. Microbiol. 2011, 110, 118–127. [Google Scholar] [CrossRef]
  11. Zhou, D.; Feng, H.; Schuelke, T.; De Santiago, A.; Zhang, Q.; Zhang, J.; Luo, C.; Wei, L. Rhizosphere microbiomes from root knot nematode non-infested plants suppress nematode infection. Microb. Ecol. 2019, 78, 470–481. [Google Scholar] [CrossRef]
  12. AbdelRazek, G.M.; Yaseen, R. Effect of some rhizosphere bacteria on root-knot nematodes. Egypt. J. Biol. Pest Control 2020, 30, 140. [Google Scholar] [CrossRef]
  13. Tian, B.; Yang, J.; Zhang, K.-Q. Bacteria used in the biological control of plant-parasitic nematodes: Populations, mechanisms of action, and future prospects. FEMS Microbiol. Ecol. 2007, 61, 197–213. [Google Scholar] [CrossRef]
  14. Topalović, O.; Heuer, H. Plant-nematode interactions assisted by microbes in the rhizosphere. Curr. Issues Mol. Biol. 2019, 30, 75–88. [Google Scholar] [CrossRef]
  15. Gamalero, E.; Glick, B.R. The use of plant growth-promoting bacteria to prevent nematode damage to plants. Biology 2020, 9, 381. [Google Scholar] [CrossRef]
  16. Meng, X.-R.; Gan, Y.; Liao, L.-J.; Li, C.-N.; Wang, R.; Liu, M.; Deng, J.-Y.; Chen, Y. How the root bacterial community of Ficus tikoua responds to nematode infection: Enrichments of nitrogen-fixing and nematode-antagonistic bacteria in the parasitized organs. Front. Plant Sci. 2024, 15, 1374431. [Google Scholar] [CrossRef] [PubMed]
  17. Lamelas, A.; Desgarennes, D.; López-Lima, D.; Villain, L.; Alonso-Sánchez, A.; Artacho, A.; Latorre, A.; Moya, A.; Carrion, G. The bacterial microbiome of Meloidogyne-based disease complex in coffee and tomato. Front. Plant Sci. 2020, 11, 136. [Google Scholar] [CrossRef]
  18. Cao, Y.; Lu, N.; Yang, D.; Mo, M.; Zhang, K.-Q.; Li, C.; Shang, S. Root-knot nematode infections and soil characteristics significantly affected microbial community composition and assembly of tobacco soil microbiota: A large-scale comparison in tobacco-growing areas. Front. Microbiol. 2023, 14, 1282609. [Google Scholar] [CrossRef] [PubMed]
  19. Zhu, Y.; Tian, J.; Shi, F.; Su, L.; Liu, K.; Xiang, M.; Liu, X. Rhizosphere bacterial communities associated with healthy and Heterodera glycines-infected soybean roots. Eur. J. Soil Biol. 2013, 58, 32–37. [Google Scholar] [CrossRef]
  20. Ruan, J.; Zhou, Y.; Yan, J.; Zhou, M.; Woo, S.-H.; Weng, W.; Cheng, J.; Zhang, K. Tartary buckwheat: An under-utilized edible and medicinal herb for food and nutritional security. Food Rev. Int. 2022, 38, 440–454. [Google Scholar] [CrossRef]
  21. Wu, W.; Li, Z.; Qin, F.; Qiu, J. Anti-diabetic effects of the soluble dietary fiber from tartary buckwheat bran in diabetic mice and their potential mechanisms. Food Nutr. Res. 2021, 65, 10-29219. [Google Scholar] [CrossRef] [PubMed]
  22. Huang, S.; Ma, Y.; Sun, D.; Fan, J.; Cai, S. In vitro DNA damage protection and anti-inflammatory effects of Tartary buckwheats (Fagopyrum tataricum L. Gaertn) fermented by filamentous fungi. Int. J. Food Sci. Technol. 2017, 52, 2006–2017. [Google Scholar]
  23. Dzah, C.S.; Duan, Y.; Zhang, H.; Authur, D.A.; Ma, H. Ultrasound-, subcritical water-and ultrasound assisted subcritical water-derived Tartary buckwheat polyphenols show superior antioxidant activity and cytotoxicity in human liver carcinoma cells. Food Res. Int. 2020, 137, 109598. [Google Scholar] [CrossRef]
  24. Zhu, F. Buckwheat proteins and peptides: Biological functions and food applications. Trends Food Sci. Technol. 2021, 110, 155–167. [Google Scholar] [CrossRef]
  25. Edgar, R.C. UPARSE: Highly accurate OTU sequences from microbial amplicon reads. Nat. Methods 2013, 10, 996–998. [Google Scholar] [CrossRef]
  26. Bolyen, E.; Rideout, J.R.; Dillon, M.R.; Bokulich, N.A.; Abnet, C.C.; Al-Ghalith, G.A.; Alexander, H.; Alm, E.J.; Arumugam, M.; Asnicar, F. Reproducible, interactive, scalable and extensible microbiome data science using QIIME 2. Nat. Biotechnol. 2019, 37, 852–857. [Google Scholar] [CrossRef] [PubMed]
  27. Quast, C.; Pruesse, E.; Yilmaz, P.; Gerken, J.; Schweer, T.; Yarza, P.; Peplies, J.; Glöckner, F.O. The SILVA ribosomal RNA gene database project: Improved data processing and web-based tools. Nucleic Acids Res. 2012, 41, D590–D596. [Google Scholar] [CrossRef]
  28. McMurdie, P.J.; Holmes, S. Shiny-phyloseq: Web application for interactive microbiome analysis with provenance tracking. Bioinformatics 2015, 31, 282–283. [Google Scholar] [CrossRef]
  29. Paulson, J.N.; Stine, O.C.; Bravo, H.C.; Pop, M. Differential abundance analysis for microbial marker-gene surveys. Nat. Methods 2013, 10, 1200–1202. [Google Scholar] [CrossRef]
  30. Wickham, H. Elegant Graphics for Data Analysis; Springer: Cham, Switzerland, 2016. [Google Scholar]
  31. Oksanen, J.; Simpson, G.; Blanchet, F.; Kindt, R.; Legendre, P.; Minchin, P.; O’Hara, R.; Solymos, P.; Stevens, M.; Szoecs, E. Vegan: Community Ecology Package, R Package Version 2.8-0; The Comprehensive R Archive Network (CRAN): Waltham, MA, USA, 2025. [Google Scholar]
  32. Yang, W.; Jing, X.; Guan, Y.; Zhai, C.; Wang, T.; Shi, D.; Sun, W.; Gu, S. Response of fungal communities and co-occurrence network patterns to compost amendment in black soil of Northeast China. Front. Microbiol. 2019, 10, 1562. [Google Scholar] [CrossRef]
  33. Wen, T.; Xie, P.; Yang, S.; Niu, G.; Liu, X.; Ding, Z.; Xue, C.; Liu, Y.X.; Shen, Q.; Yuan, J. ggClusterNet: An R package for microbiome network analysis and modularity-based multiple network layouts. Imeta 2022, 1, e32. [Google Scholar] [CrossRef]
  34. Antonov, M.; Csárdi, G.; Horvát, S.; Müller, K.; Nepusz, T.; Noom, D.; Salmon, M.; Traag, V.; Welles, B.F.; Zanini, F. Igraph enables fast and robust network analysis across programming languages. arXiv 2023, arXiv:2311.10260. [Google Scholar] [CrossRef]
  35. Janvier, C.; Villeneuve, F.; Alabouvette, C.; Edel-Hermann, V.; Mateille, T.; Steinberg, C. Soil health through soil disease suppression: Which strategy from descriptors to indicators? Soil Biol. Biochem. 2007, 39, 1–23. [Google Scholar] [CrossRef]
  36. Tong, W.; Li, J.; Cong, W.; Zhang, C.; Xu, Z.; Chen, X.; Yang, M.; Liu, J.; Yu, L.; Deng, X. Bacterial community structure and function shift in rhizosphere soil of tobacco plants infected by Meloidogyne incognita. Plant Pathol. J. 2022, 38, 583. [Google Scholar] [CrossRef] [PubMed]
  37. Xu, X.; Sun, T.; Qing, X.; Liu, S.; Yang, P.; Dong, M.; Liu, J.; Ren, Y.; Shen, Q.; Scheu, S. Meloidogyne nematodes reprogram rhizosphere metabolism to suppress antagonistic microbiota and enable bacterial pathogen co-infection. Cell Rep. 2026, 45, 116949. [Google Scholar] [CrossRef] [PubMed]
  38. Moronta-Barrios, F.; Gionechetti, F.; Pallavicini, A.; Marys, E.; Venturi, V. Bacterial microbiota of rice roots: 16S-based taxonomic profiling of endophytic and rhizospheric diversity, endophytes isolation and simplified endophytic community. Microorganisms 2018, 6, 14. [Google Scholar] [CrossRef] [PubMed]
  39. Mahoney, A.K.; Yin, C.; Hulbert, S.H. Community structure, species variation, and potential functions of rhizosphere-associated bacteria of different winter wheat (Triticum aestivum) cultivars. Front. Plant Sci. 2017, 8, 132. [Google Scholar] [CrossRef]
  40. Yang, Y.; Wang, N.; Guo, X.; Zhang, Y.; Ye, B. Comparative analysis of bacterial community structure in the rhizosphere of maize by high-throughput pyrosequencing. PLoS ONE 2017, 12, e0178425. [Google Scholar] [CrossRef]
  41. Sugiyama, A.; Ueda, Y.; Zushi, T.; Takase, H.; Yazaki, K. Changes in the bacterial community of soybean rhizospheres during growth in the field. PLoS ONE 2014, 9, e100709. [Google Scholar] [CrossRef]
  42. Lee, S.A.; Park, J.; Chu, B.; Kim, J.M.; Joa, J.-H.; Sang, M.K.; Song, J.; Weon, H.-Y. Comparative analysis of bacterial diversity in the rhizosphere of tomato by culture-dependent and-independent approaches. J. Microbiol. 2016, 54, 823–831. [Google Scholar] [CrossRef]
  43. Hou, Q.; Wang, W.; Yang, Y.; Hu, J.; Bian, C.; Jin, L.; Li, G.; Xiong, X. Rhizosphere microbial diversity and community dynamics during potato cultivation. Eur. J. Soil Biol. 2020, 98, 103176. [Google Scholar] [CrossRef]
  44. Abdelrahman, M.; Jogaiah, S.; Abdelmoteleb, M.; Fokar, M.; Nguyen, H.T.; Tran, L.-S.P. Deciphering crop-specific rhizobacteriome assembly in cotton, sorghum, and soybean under hot semi-arid field conditions in Texas. Environ. Microbiome 2025, 20, 105. [Google Scholar] [CrossRef]
  45. Hong, S.; Yuan, X.; Yang, J.; Yang, Y.; Jv, H.; Li, R.; Jia, Z.; Ruan, Y. Selection of rhizosphere communities of diverse rotation crops reveals unique core microbiome associated with reduced banana Fusarium wilt disease. New Phytol. 2023, 238, 2194–2209. [Google Scholar] [CrossRef]
  46. Jones, P.; Garcia, B.J.; Furches, A.; Tuskan, G.A.; Jacobson, D. Plant host-associated mechanisms for microbial selection. Front. Plant Sci. 2019, 10, 452782. [Google Scholar] [CrossRef]
  47. Hernández-Terán, A.; Navarro-Díaz, M.; Benítez, M.; Lira, R.; Wegier, A.; Escalante, A.E. Host genotype explains rhizospheric microbial community composition: The case of wild cotton metapopulations (Gossypium hirsutum L.) in Mexico. FEMS Microbiol. Ecol. 2020, 96, fiaa109. [Google Scholar] [CrossRef]
  48. Cao, Y.; Yang, Z.-X.; Yang, D.-M.; Lu, N.; Yu, S.-Z.; Meng, J.-Y.; Chen, X.-J. Tobacco Root Microbial Community Composition Significantly Associated With Root-Knot Nematode Infections: Dynamic Changes in Microbiota and Growth Stage. Front. Microbiol. 2022, 13, 807057. [Google Scholar] [CrossRef]
  49. Shi, S.; Nuccio, E.E.; Shi, Z.J.; He, Z.; Zhou, J.; Firestone, M.K. The interconnected rhizosphere: High network complexity dominates rhizosphere assemblages. Ecol. Lett. 2016, 19, 926–936. [Google Scholar] [CrossRef] [PubMed]
  50. Qiao, Y.; Wang, T.; Huang, Q.; Guo, H.; Zhang, H.; Xu, Q.; Shen, Q.; Ling, N. Core species impact plant health by enhancing soil microbial cooperation and network complexity during community coalescence. Soil Biol. Biochem. 2024, 188, 109231. [Google Scholar] [CrossRef]
  51. Shi, L.; Li, Y.; Shao, S.; Liu, J.; Zhang, J.; Chen, R.; Hong, Y.; Li, Q.; Cai, P. Effects of Intercropping Tea Plants with Bamboo Fungus on Soil Physical/Chemical Properties and Microbial Community Diversity. Pol. J. Environ. Stud. 2025. [Google Scholar] [CrossRef]
  52. Carneiro, J., Jr.; Barroso, L.; Olivares, F.; Ponte, E.; Silveira, S. Plant growth promotion of micropropagated sugarcane seedlings var. Co 412 inoculated with endophytic diazotrophic bacteria and effects on the Ratoon Stunting Disease. Australas. Plant Pathol. 2021, 50, 513–522. [Google Scholar] [CrossRef]
  53. Binyamin, R.; Nadeem, S.M.; Akhtar, S.; Khan, M.Y.; Anjum, R. Beneficial and pathogenic plant-microbe interactions: A review. Soil Environ. 2019, 38, 127–150. [Google Scholar] [CrossRef]
  54. Lai, K.; Wan, X.; Xiao, J.; Wang, H.; Shi, S.; Yan, B.; Lyu, C.; Zhang, C.; Zhang, Y.; Yuan, F. Microbial community mediated by microbial agents improves the quality of Epimedium pubescens Maxim. Sci. Tradit. Chin. Med. 2024, 3, 270–281. [Google Scholar] [CrossRef]
  55. Zhang, Y.; Kinyua, M.N. Identification and classification of the Tetrasphaera genus in enhanced biological phosphorus removal process: A review. Rev. Environ. Sci. Bio/Technol. 2020, 19, 699–715. [Google Scholar] [CrossRef]
  56. Cruz-Silva, A.; Laureano, G.; Pereira, M.; Dias, R.; Silva, J.M.d.; Oliveira, N.; Gouveia, C.; Cruz, C.; Gama-Carvalho, M.; Alagna, F. A new perspective for vineyard terroir identity: Looking for microbial indicator species by long read nanopore sequencing. Microorganisms 2023, 11, 672. [Google Scholar] [CrossRef]
  57. Yadav, P.; Quattrone, A.; Yang, Y.; Owens, J.; Kiat, R.; Kuppusamy, T.; Russo, S.E.; Weber, K.A. Zea mays genotype influences microbial and viral rhizobiome community structure. ISME Commun. 2023, 3, 129. [Google Scholar] [CrossRef] [PubMed]
Figure 1. Microbial Community Composition in the Rhizosphere of F. tataricum. (A) Phylum-level relative abundance of microbial communities in the rhizosphere of Field I. The numbers above the boxes represent operational taxonomic unit (OUT) richness for each sample; (B) Phylum-level relative abundance of microbial communities in the rhizosphere of Field II.
Diversity 18 00240 g001
Figure 2. α-diversity indices of root-associated and bulk soil microbiota from healthy and diseased plants across two fields. Boxplots show the Observed Richness, Pielou’s Evenness, Shannon Diversity, and Simpson Diversity Indices for both healthy and diseased datasets, including corresponding bulk soils. The horizontal line within each box indicates the median, while the lower and upper edges represent the 25th and 75th percentiles (first and third quartiles). The top row panels represent Field I, and the bottom row panels represent Field II.
Diversity 18 00240 g002
Figure 3. Principal Co-Ordinates Analysis (PCoA) based on Euclidean and Bray–Curtis distances. This figure shows the separation of the root microbiota from healthy and diseased plants across different fields, visualized along the first (PCoA1) and second (PCoA2) principal coordinate axes. The analysis compares the microbiota profiles using two different distance metrics: Euclidean and Bray–Curtis. A PERMANOVA test (Adonis) was applied, revealing a significant separation (p < 0.05) between healthy and diseased plants in both Field I and Field II. (A) PCoA based on Euclidean distances for Field I; (B) PCoA based on Bray–Curtis distances for Field I; (C) PCoA based on Euclidean distances for Field II; (D) PCoA based on Bray–Curtis distances for Field II.
Diversity 18 00240 g003
Figure 4. Comparative analysis of rhizosphere microbial communities between healthy and diseased groups. (A) Overlapping OTUs within healthy samples; (B) Overlapping OTUs within diseased samples; (C) Manhattan plot displaying OTUs differentially enriched between healthy and diseased groups. Each symbol (dot or triangle) represents a single OTU, arranged by taxonomic hierarchy and colored according to phylum-level affiliation. Filled triangles indicate OTUs enriched in healthy samples, while open triangles denote those enriched in diseased samples; (D) Unique and shared OTUs identified in healthy and diseased groups; (E) Heatmap of relative abundances of key indicator bacteria, with hierarchical clustering along the x-axis. The left cluster represents taxa strongly associated with RKN presence, and the right cluster represents taxa associated with RKN absence.
Diversity 18 00240 g004
Figure 5. Co-occurrence networks of rhizosphere microbial communities in healthy and diseased groups. Each node represents an individual OTU. Edges represent significant correlations (|r| > 0.75, p < 0.05). Node size is proportional to relative abundance, and node color denotes phylum-level taxonomy. Blue edges represent positive correlations, while light yellow edges indicate negative correlations. (A) Healthy F. tataricum; (B) Diseased F. tataricum.
Diversity 18 00240 g005
Table 1. Network topology metrics of microbial communities in the rhizosphere of F. tataricum.
MetricHeaDisMetricHeaDis
Mean degree4.152.91MNC5.964.31
Average path length4.993.11Edge count955255
Centralization degree0.050.09Node count460175
Connectance0.010.02Giant component size32554
Hub count96Modularity0.670.69
Cluster count5733KS stat0.160.15
Table 2. Properties of microbial hub taxa with high Kleinberg hub centrality (≥0.7) in the Healthy Rhizosphere Network.
IDlog2FClog2CPMp ValueFDRLevelMean AMean BPhylumSpecies
OTU5861.138.990.160.37NotSig0.060.02ActinobacteriotaConexibacter_sp.
OTU10−1.1614.290.030.12NotSig1.112.27BacteroidotaMucilaginibacter_frigoritolerans
OTU810.5611.380.150.35NotSig0.320.22ActinobacteriotaLeifsonia_xyli
OTU6−0.3013.560.480.70NotSig1.021.25Patescibacteriauncultured_soil_bacterium
OTU1020.4111.460.260.51NotSig0.320.25ActinobacteriotaTetrasphaera_sp.
OTU1080.9210.190.400.63NotSig0.160.07Patescibacteriaunclassified_LWQ8
OTU23−0.2611.920.670.83NotSig0.330.39Patescibacteriaunclassified_LWQ8
OTU22−0.4111.800.370.60NotSig0.270.37Patescibacteriaunclassified_TM7a
OTU3232.089.840.000.00Enriched0.160.04Patescibacteriaunclassified_bacterium_LWQ8
Disclaimer/Publisher’s Note: The statements, opinions and data contained in all publications are solely those of the individual author(s) and contributor(s) and not of MDPI and/or the editor(s). MDPI and/or the editor(s) disclaim responsibility for any injury to people or property resulting from any ideas, methods, instructions or products referred to in the content.