Article

Habitat-Driven Variation in Sexual Dimorphism of Amphipods

by
Amey Danole
1,2,*,
Fernando Tuya
2,
Francisco Otero-Ferrer
2,
Sonia Díaz-Vergara
2 and
Sandra Navarro-Mayoral
2
1
University of Groningen, Zernikepark 1, NL-9700 AE Groningen, The Netherlands
2
Biodiversity and Conservation Research Group, IU-ECOAQUA, Scientific and Technological Marine Park of the Universidad de Las Palmas de Gran Canaria, 35214 Telde, Spain
*
Author to whom correspondence should be addressed.
Diversity 2026, 18(4), 237; https://doi.org/10.3390/d18040237
Submission received: 18 March 2026 / Revised: 16 April 2026 / Accepted: 16 April 2026 / Published: 20 April 2026

Abstract

Sexual dimorphism in morphological traits is widespread across animals and can result from differing life-history strategies, sex-specific competition, and ecological interactions influenced by habitat structure. For epifaunal organisms such as amphipods, habitat complexity mediates access to food, mate encounters, and refuge. This study investigates sex-related variation in body size and gnathopod 2 ratio (gnathopod 2 length/body length) in two amphipod species, Ampithoe ramondi and Caprella acanthifera, across four benthic habitats: rhodolith beds, macroalgae-dominated reefs, seagrass meadows, and black coral forests. A. ramondi occurred in all habitats except black coral forests, with males larger than females only in macroalgae-dominated reefs and exhibiting higher gnathopod ratios, increasing across macroalgae-dominated reefs, seagrass meadows and rhodolith beds. C. acanthifera was found in macroalgae-dominated reefs and black coral forests, with males larger on average but no significant habitat-related variation in dimorphism. These results indicate that sexual dimorphism patterns are species-specific, shaped by habitat-specific ecological pressures and life-history strategies. Expanding such analyses to more taxa and with balanced sampling across habitats and environmental gradients will offer deeper insight into how natural and sexual selection interact and inform how these dynamics may shift under changing climate regimes.

1. Introduction

Sexual dimorphism refers to differences between males and females of a species, which can result from sexual or fecundity selection or from intersexual niche divergence [1,2,3]. Sexual selection favours traits that increase mating success, whereas fecundity selection acts primarily on traits enhancing reproductive output. In contrast, intersexual niche divergence arises when males and females experience different ecological pressures and consequently specialise on distinct resources or habitats. These differences may be morphological, physiological, or behavioural, and their magnitude and direction are often shaped by abiotic (e.g., temperature, nutrient availability or habitat structure) and biotic factors (e.g., predation pressure or interactions with other organisms) [1,4]. For example, shared parental care or limited mate availability can limit the development of certain traits, reducing dimorphism and favouring more similar (monomorphic) characteristics [5]. By contrast, when sexual selection strongly favours one sex, intense competition for mates can drive the evolution of exaggerated traits and behaviours, resulting in pronounced sexual dimorphism [2,6,7]. While sexual dimorphism across habitats has been widely studied in terrestrial organisms [8,9], there are very few studies in marine systems examining how sexual dimorphism varies within the same species across different habitats [10,11,12]. Past studies in marine-associated species have shown that sexual dimorphism can be associated with sex-specific habitat use [10] or with differences in selection pressures across environments [12], yet comparative evidence of how dimorphic traits vary across marine habitats within species is scarce, limiting our understanding of how environmental context shapes the expression of dimorphic traits.
The Amphipoda is one of the most ecologically diverse crustacean orders, encompassing over 10,000 species [13,14] and inhabiting all aquatic environments worldwide, from hadal depths to alpine freshwater streams, from lightless groundwaters to tropical forests, and from sea bottom sediments to the entrails of gelatinous plankton [15]. Amphipods display diverse mating strategies and pronounced sexual dimorphism, particularly in the enlarged male gnathopods in some families. This variation provides an opportunity to examine how ecological context shapes trait expression [16]. For instance, in caprellid amphipods (family Caprellidae) from the Pagasitikos Gulf, pronounced sexual dimorphism in body size has been reported [17]. In some amphipod families, the first two pairs of pereopods are modified into gnathopods, with the second pair typically enlarged in males and used during copulation [18]. Such marked dimorphism in gnathopods suggests a role as sexually selected traits as proposed or demonstrated in their use in intrasexual contests, defence, nest-guarding, territorial interactions, courtship displays, assessment of female quality or as weapons [19,20,21,22,23]. Although direct evidence for amphipod gnathopods as weapons is limited, their morphology and associated behaviours suggest a role in mating competition, likely shaped by selective pressures such as mate guarding or signalling in complex habitats. Thus, understanding sexual dimorphism in amphipods requires considering ecological context, as habitat structure, host associations, and feeding ecology influence the selective pressures acting on these traits [19,24,25].
Habitat complexity, in particular, can modulate the intensity and expression of sexual dimorphism by altering predation risk, resource availability, and mate encounter rates. In structurally complex habitats, such as macroalgae-dominated reefs, increased shelter and niche availability may reduce predation pressure and allow the persistence of a wider range of phenotypes [26,27]. This can facilitate the expression of exaggerated traits associated with sexual selection. In contrast, in less complex habitats with limited refuge and resources, such as black coral forests lacking epiphytic layers, smaller body sizes and reduced trait exaggeration may be favoured due to energetic constraints and higher exposure to predation [28]. More broadly, habitat structure can influence mating systems by shaping mate encounter rates and competitive interactions, thereby affecting the strength of sexual selection [1,4]. For example, in amphipods, structurally complex environments may allow males with different body sizes or gnathopod morphologies to succeed under different microhabitat conditions, highlighting how habitat architecture can modulate patterns of sexual dimorphism [29]. Although previous work has highlighted the role of habitat complexity in shaping sexual dimorphism, the mechanisms linking ecological context to trait expression in amphipods remain poorly understood. The present study aims to address this gap by examining how habitat and ecological factors influence body size and gnathopod dimorphism.
The coastal habitats of the Canary Islands include black coral forests, rhodolith beds, seagrass meadows and macroalgae-dominated beds on reefs [30,31,32,33]. These complex habitats can affect survival, predation risk, mate encounters, and the expression of morphological and behavioural traits. Although all four habitats share three-dimensional architecture, they differ in structural arrangement, a factor that may shape the selective pressures acting on amphipods and the development of sexually dimorphic traits [29]. Amphipods, in particular, maintain a close relationship with their habitats due to their direct development, limited mobility and, in some cases, specialised feeding strategies, which constrain their dispersal [28,34]. Recent studies on amphipods show that sexual dimorphism can be lineage-specific and context-dependent, with certain traits diverging adaptively among cryptic freshwater lineages [35] or differing in specific morphological traits consistent with sexual dimorphism in marine populations [36]. Few studies have compared sexual dimorphism across habitats within marine amphipod species. Thus, taking advantage of their strong habitat association, we studied amphipods across habitats with varying structural complexity to assess how these differences influence trait expression and sexual dimorphism. We sampled amphipod species across the four aforementioned benthic habitats in Gran Canaria. Morphological traits (i.e., body length and gnathopod 2 size) were measured as functional traits to assess how habitat influences sexual dimorphism. We focused on two amphipod species, A. ramondi and C. acanthifera, exhibiting contrasting morphologies and mating strategies, allowing us to explore how sexual dimorphism varies across habitats.

2. Materials and Methods

2.1. Study Sites and Habitats

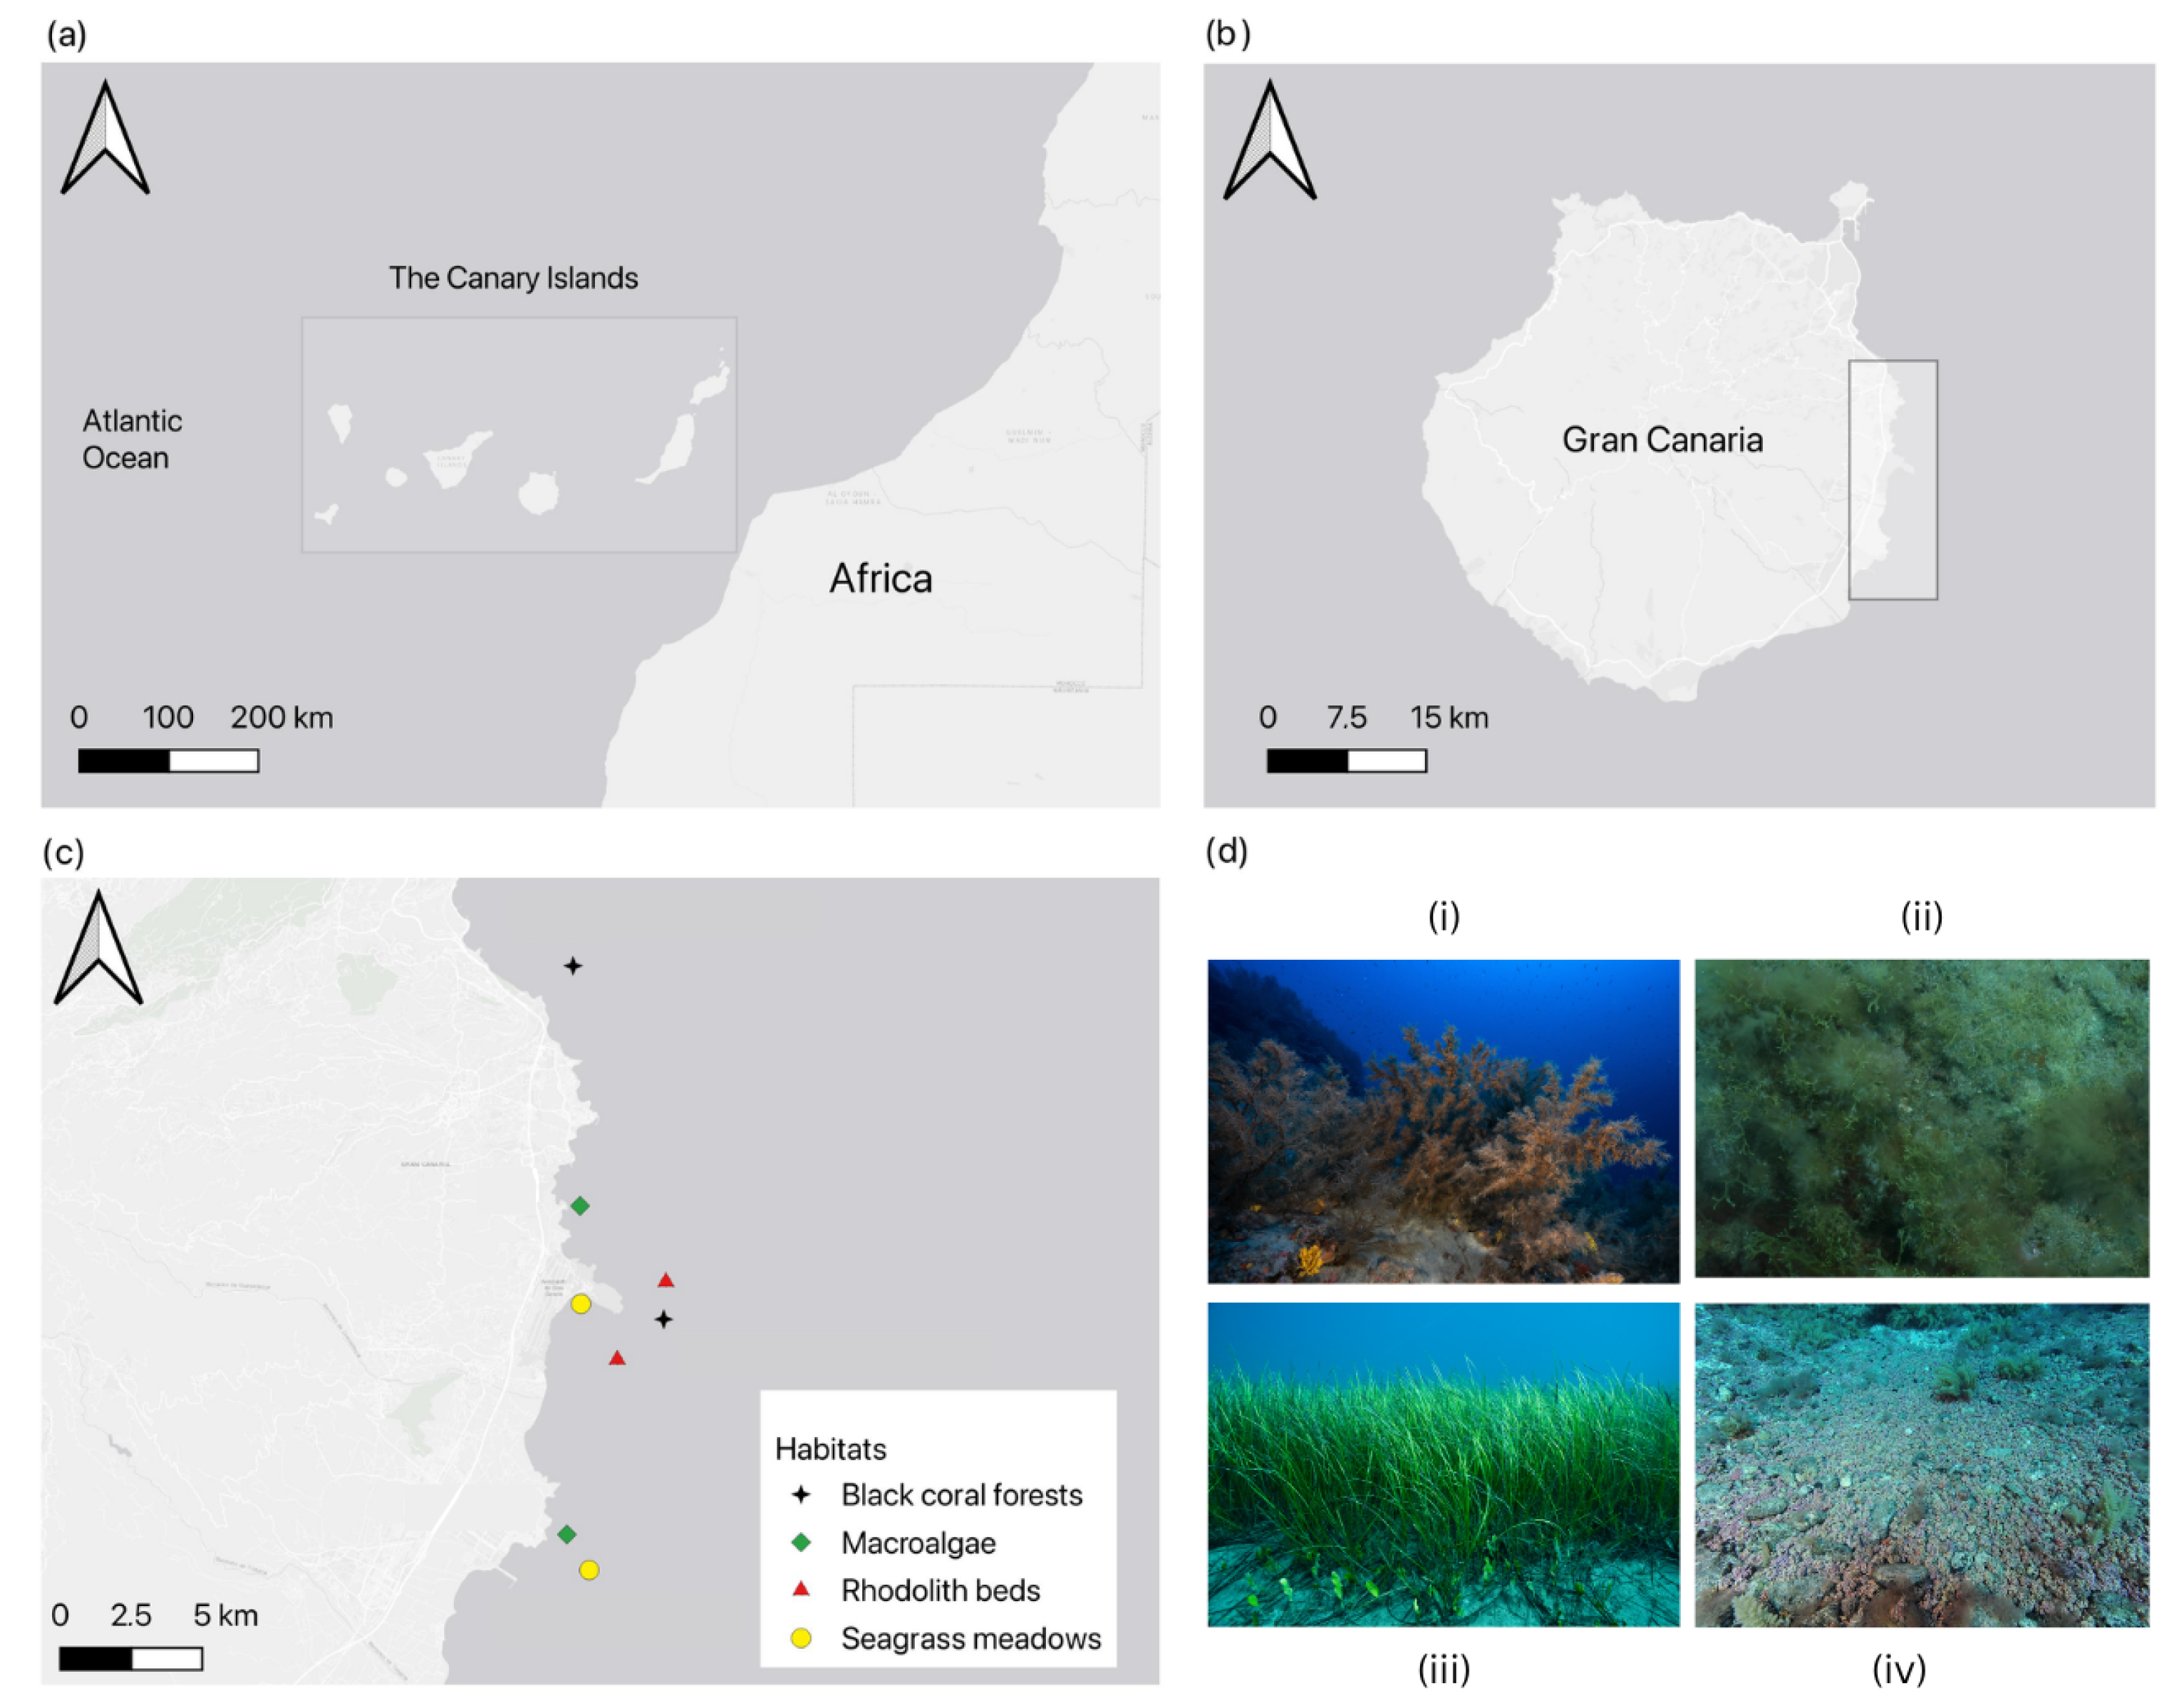
Specimens were collected from two locations at each of four marine habitats around the eastern coastal areas of Gran Canaria (Figure 1), viz. seagrass meadows, rhodolith beds, macroalgae-dominated reefs, and black corals. Sampling was conducted from 2018 to 2022. Rhodolith beds were sampled in 2015 and 2016 [26], seagrass meadows between 2016 and 2018 [37], and black coral forests in November–December 2022 [28]. Amphipods from macroalgae-dominated reefs were collected in the summer of 2024. Detailed information on sample sizes, including the number of individuals per habitat, year, and species, as well as the specific sampling methodologies, is provided in the referenced studies.
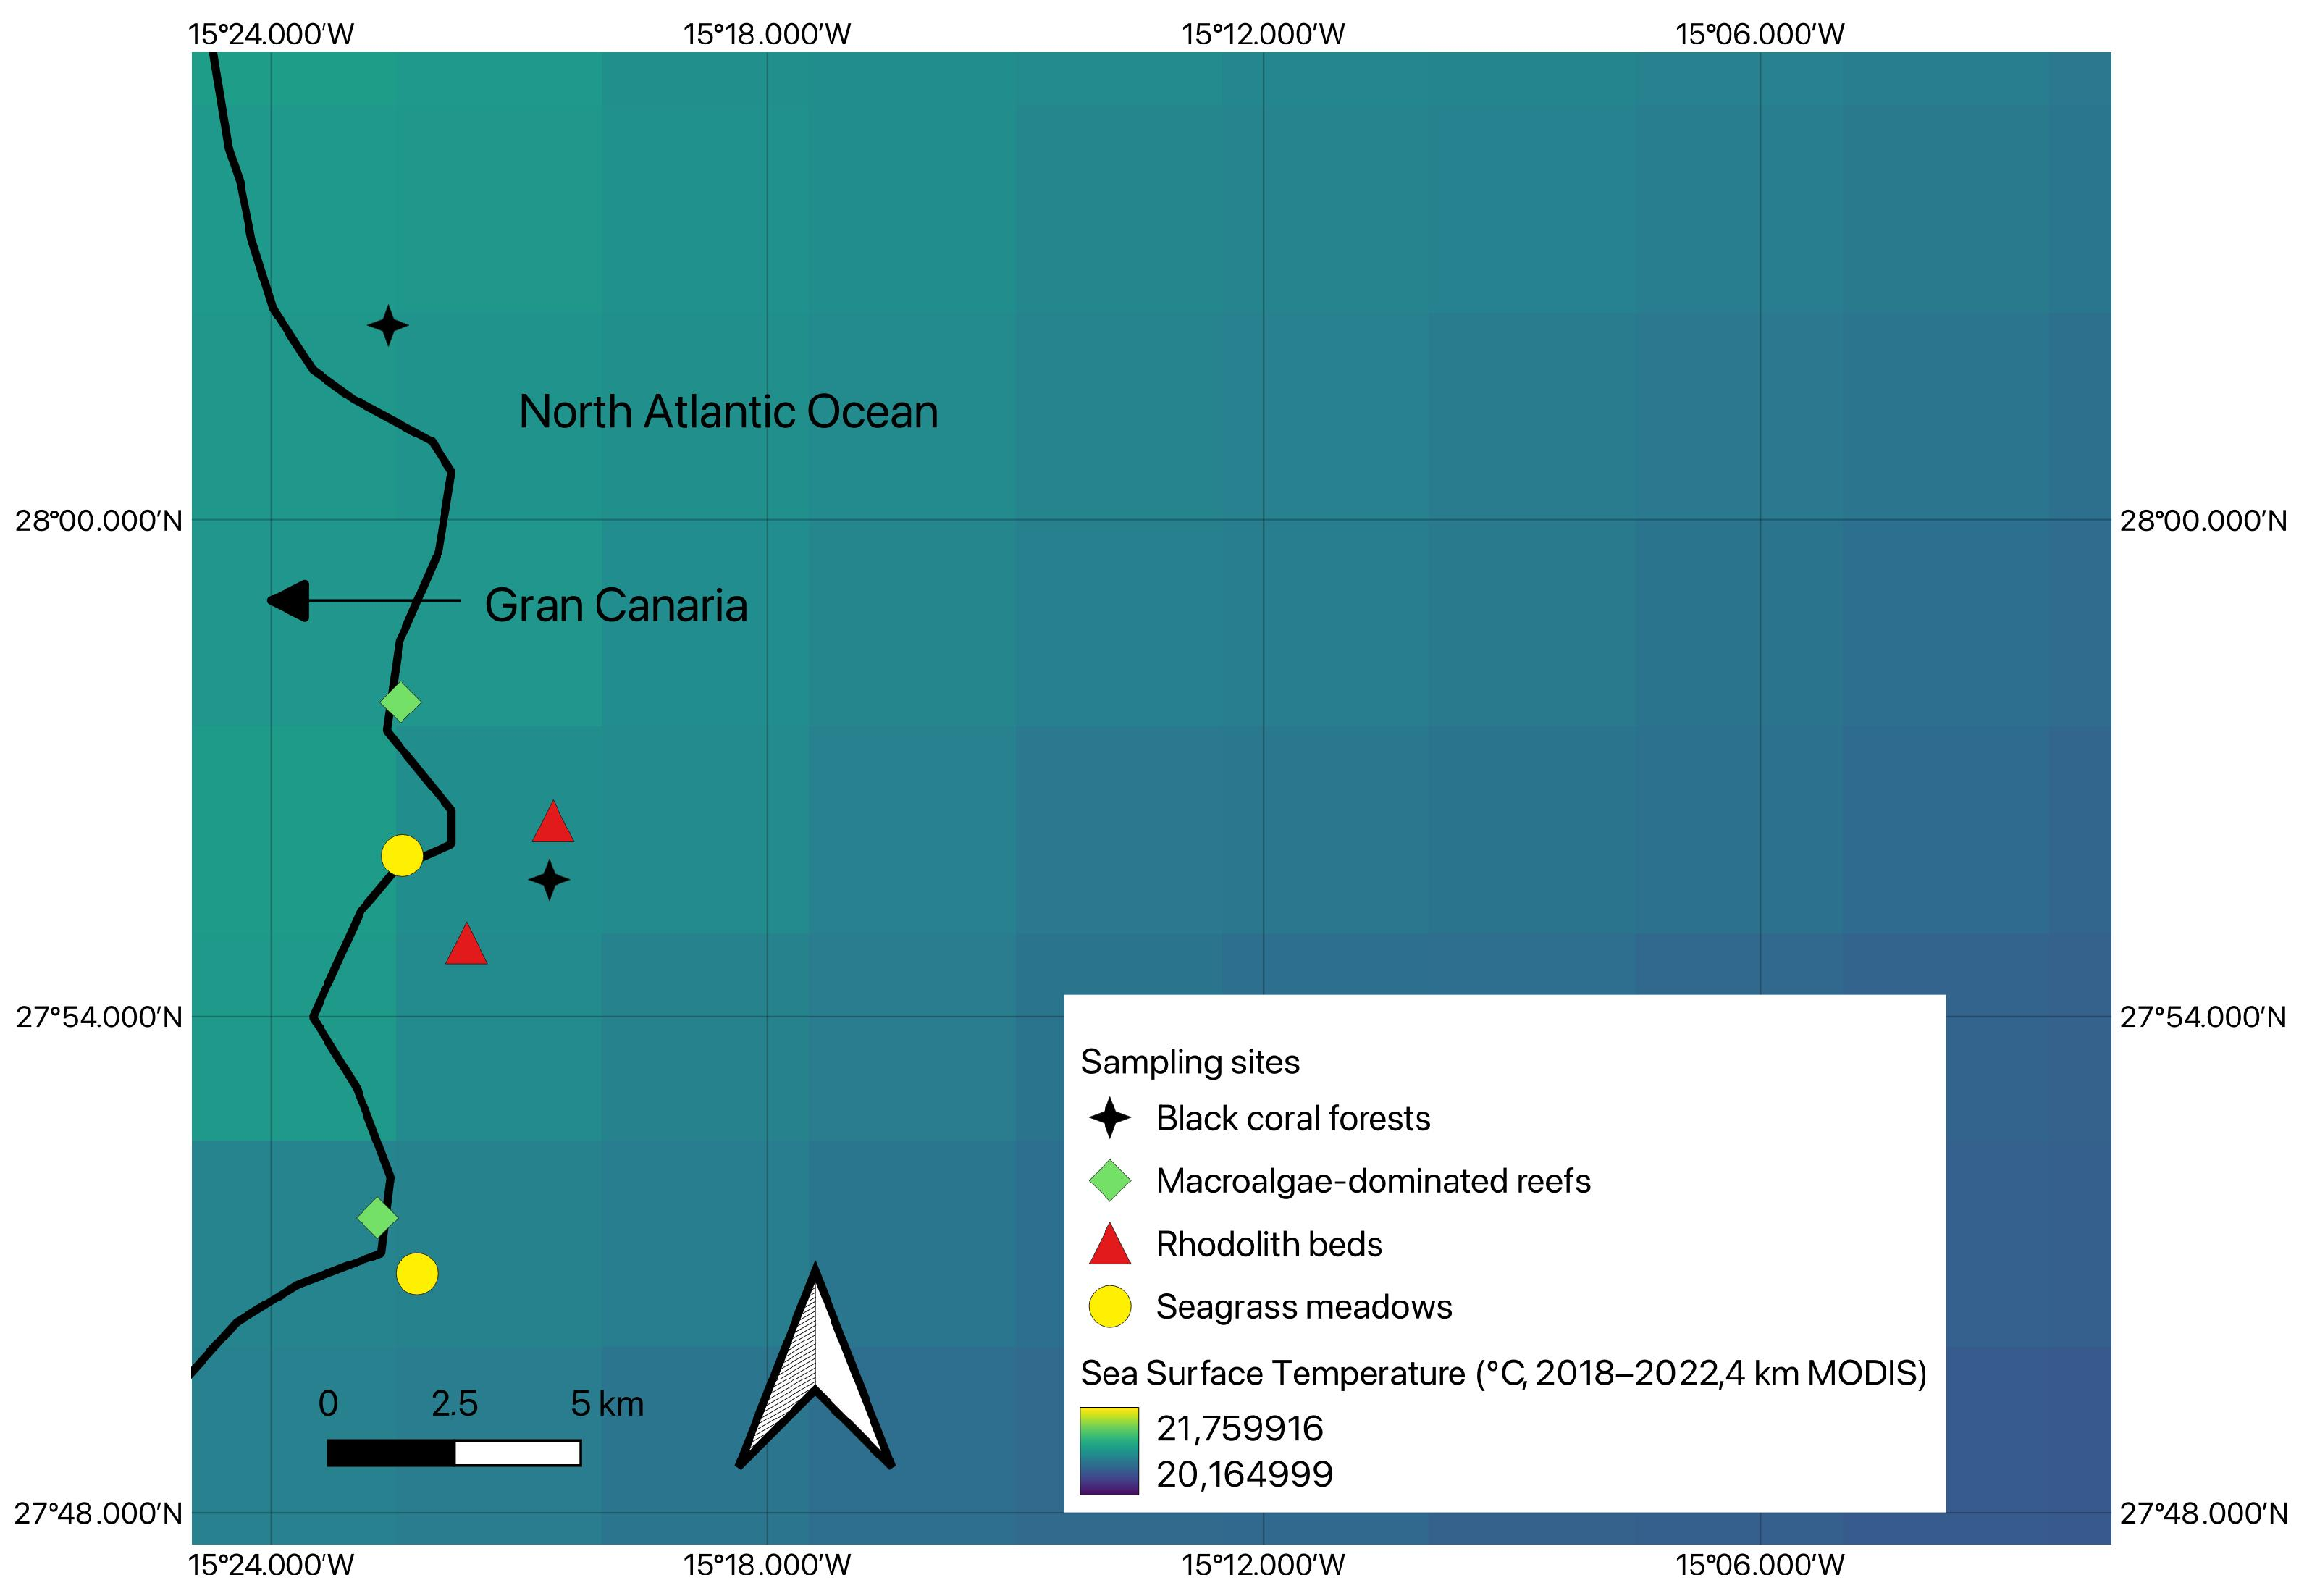
Because the sites are geographically close and experience similar broad-scale environmental conditions (see Appendix A, Figure A4), any differences observed in sexual dimorphism among habitats are likely attributable to habitat-specific structural features rather than overall environmental variation. Because sampling across habitats was conducted in different years and originates from independent sampling campaigns, temporal effects cannot be statistically separated from habitat effects in this dataset. The traits analysed are expected to exhibit relatively low inter-annual variability compared to the pronounced structural differences among habitats, although temporal variation cannot be fully excluded.
The eastern coast of Gran Canaria is characterised by steep volcanic slopes and a mixture of hard and soft substrates that support diverse benthic habitats. Local hydrography is influenced by persistent northeast trade winds, which generate wind-driven waves and swells [38], while surrounding waters are largely oligotrophic, with occasional inputs of cooler, nutrient-rich water from coastal upwelling [39]. The eastern shoreline features a range of subtidal habitats including extensive rocky platforms, sandy plains, and biogenic assemblages. Based on existing knowledge of habitat distribution and ecological relevance to amphipod assemblages, representative sites were selected within the four most abundant and structurally distinct habitats in the region.

2.2. Sampling Design and Specimen Collection

Sampling was conducted by SCUBA diving at depths of 18–50 m for rhodolith beds, 8–12 m for seagrass meadows, 3–8 m for macroalgae-dominated reefs, and 25–32 m for black coral forests. Samples associated with each habitat were retrieved and processed in the laboratory to extract epifaunal amphipods. For rhodolith beds, five random 25 × 25 cm quadrats of rhodolith nodules were hand-collected by SCUBA divers, frozen at −20 °C, and epifauna extracted and sorted. For seagrass meadows, five random 25 × 25 cm quadrats containing seagrass canopy were bagged, cut at sediment, and sieved for epifauna. For macroalgae-dominated reefs, holdfasts were cut within five random 25 × 25 cm quadrats, bagged, frozen, washed, sieved, and mobile fauna identified. Following the method described by [37], for black coral forests, epifauna was collected by briefly vacuuming the top branches of Antipathella wollastoni underwater and preserved in ethanol. Vacuuming was performed using an ad hoc vacuum cleaner for a standardized duration of 20 s per colony. Collected samples were transported to the laboratory in seawater-filled containers. Except for black coral samples, which were processed fresh to prevent epifaunal damage, all other samples were stored at −20 °C until sorting.

2.3. Specimen Processing and Preservation

In the laboratory, each sample was inspected, and epifauna was separated from plant and algal matter, sediment, and coral mucus using a 250 μm mesh. To avoid bias in size-based comparisons, all habitats used the same mesh size. Organisms were preserved in 96% ethanol. No ethical approval was required for all but black corals [40], as none of the other species are legally protected in Spain.

2.4. Identification and Species Determination

All individuals were identified to the lowest possible taxonomic level using a stereomicroscope (OPTIKA SZP-10, Ponteranica, Italy) and a compound microscope (Leica DM1000 LED, Wetzlar, Germany), and preserved in absolute ethanol. Standard taxonomic keys were employed for identification [41,42,43,44], with specific references for the genus Caprella [45]. Sex determination for all specimens was carried out using the same taxonomic keys.
Ampithoe ramondi and Caprella acanthifera were the primary focus of this study, as sufficient individuals of both sexes were collected across habitats to allow analysis of sexual dimorphism. A. ramondi occurred in three habitats (rhodolith beds, seagrass meadows, and macroalgae-dominated reefs), whereas C. acanthifera was restricted to two habitats (macroalgae-dominated reefs and black coral forests).

2.5. Morphometric Measurements

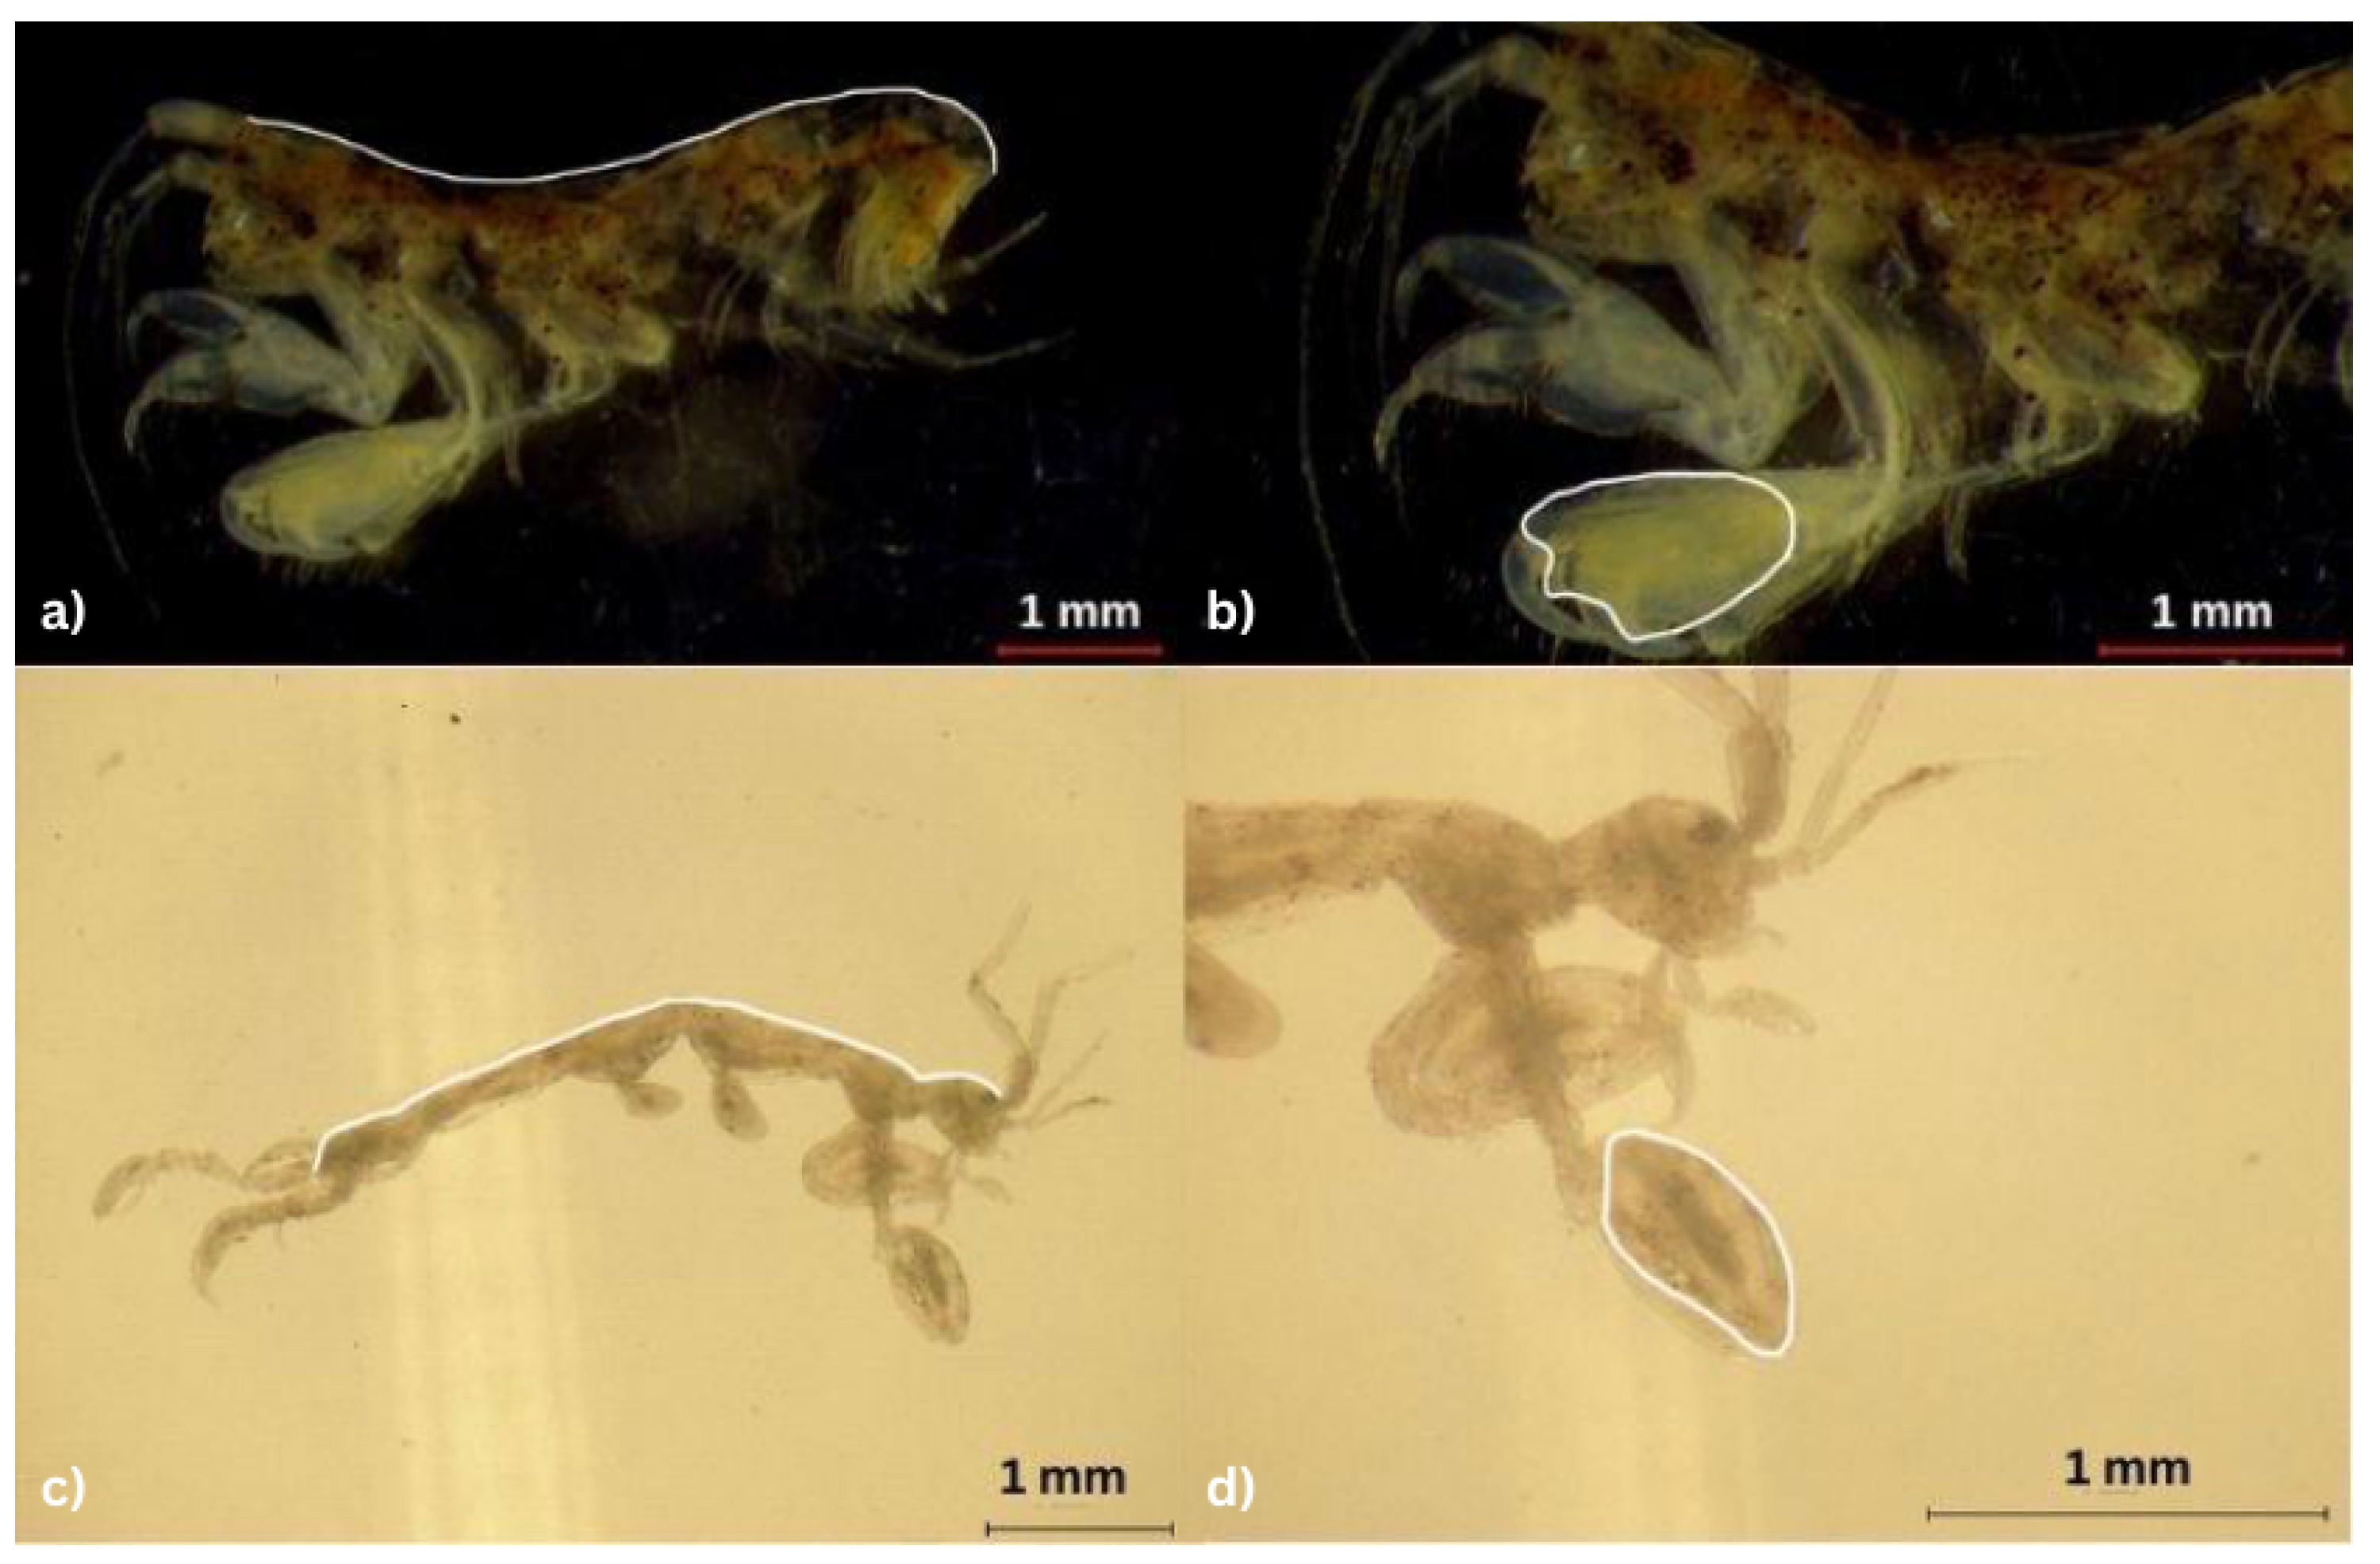
In the laboratory, individuals were examined under a stereomicroscope (OPTIKA, SZP-10, C-P8, Ponteranica, Italy) mounted with its associated camera. Images were analysed using ImageJ version 1.54p [46]. Morphometric traits measured included body length (determined by measuring the distance from the dorsal margin at the base of the first antennae to the posterior end of the telson following the methodology described in [47]) and gnathopod 2 length, which was calculated by measuring along the circumference of the gnathopod 2 oriented towards the observer under the microscope (refer Table A1 and Figure 2). Measurement resolution was estimated at 0.01–0.05 mm, depending on image scale calibration (either 0.5 mm or 1 mm per image). To ensure that only sexually mature adults were included in the analyses, we selected the largest individuals from each population for analysis.

2.6. Data Analysis

The Sexual Dimorphism Index (SDI) was calculated using the standard formula:
SDI = ( mean male trait mean female trait ) / mean female trait ,
which was applied to each of the traits analysed (refer Figure A1). A positive SDI value indicates that males have larger average trait values, which is often interpreted as male-biased sexual selection, whereas a negative SDI indicates that females have larger average trait values, which is typically associated with fecundity-based selection. We note that these associations represent general expectations and have not been empirically demonstrated for the species studied. This approach follows the widely used method proposed in [48] for quantifying sexual dimorphism in morphological traits.
Data wrangling and statistical analysis were carried out in RStudio version 2024.09.1+394 “Cranberry Hibiscus” using R version 4.4.2 [49]. For interspecific comparisons, we included a minimum of five individuals per sex of the two targeted species and fitted linear models to test the effects of species, sex, and their interaction on body length and gnathopod ratio. Gnathopod ratio was calculated by dividing the gnathopod 2 length by the individual’s body length to account for differences in body size. For species-specific analyses, univariate linear models were applied separately to each species to test for the effects of sex and habitat on each morphometric trait. For gnathopod ratio data, which are constrained between 0 and 1, beta regression models were implemented using the glmmTMB package version 1.1.14 [50] with a logit link. Model diagnostics, including residual distribution, heteroscedasticity, and normality, were assessed visually and using simulation-based methods via the DHARMa package version 0.4.7 [51]. We computed estimated marginal means (EMMs) using the emmeans package version 2.0.2 [52] to examine interaction effects (Sex × Habitat), followed by visualisation of these contrasts. Visualisations were generated using ggplot2 version 4.0.2 [53].

3. Results

3.1. Sex-Specific Allometry Comparisons

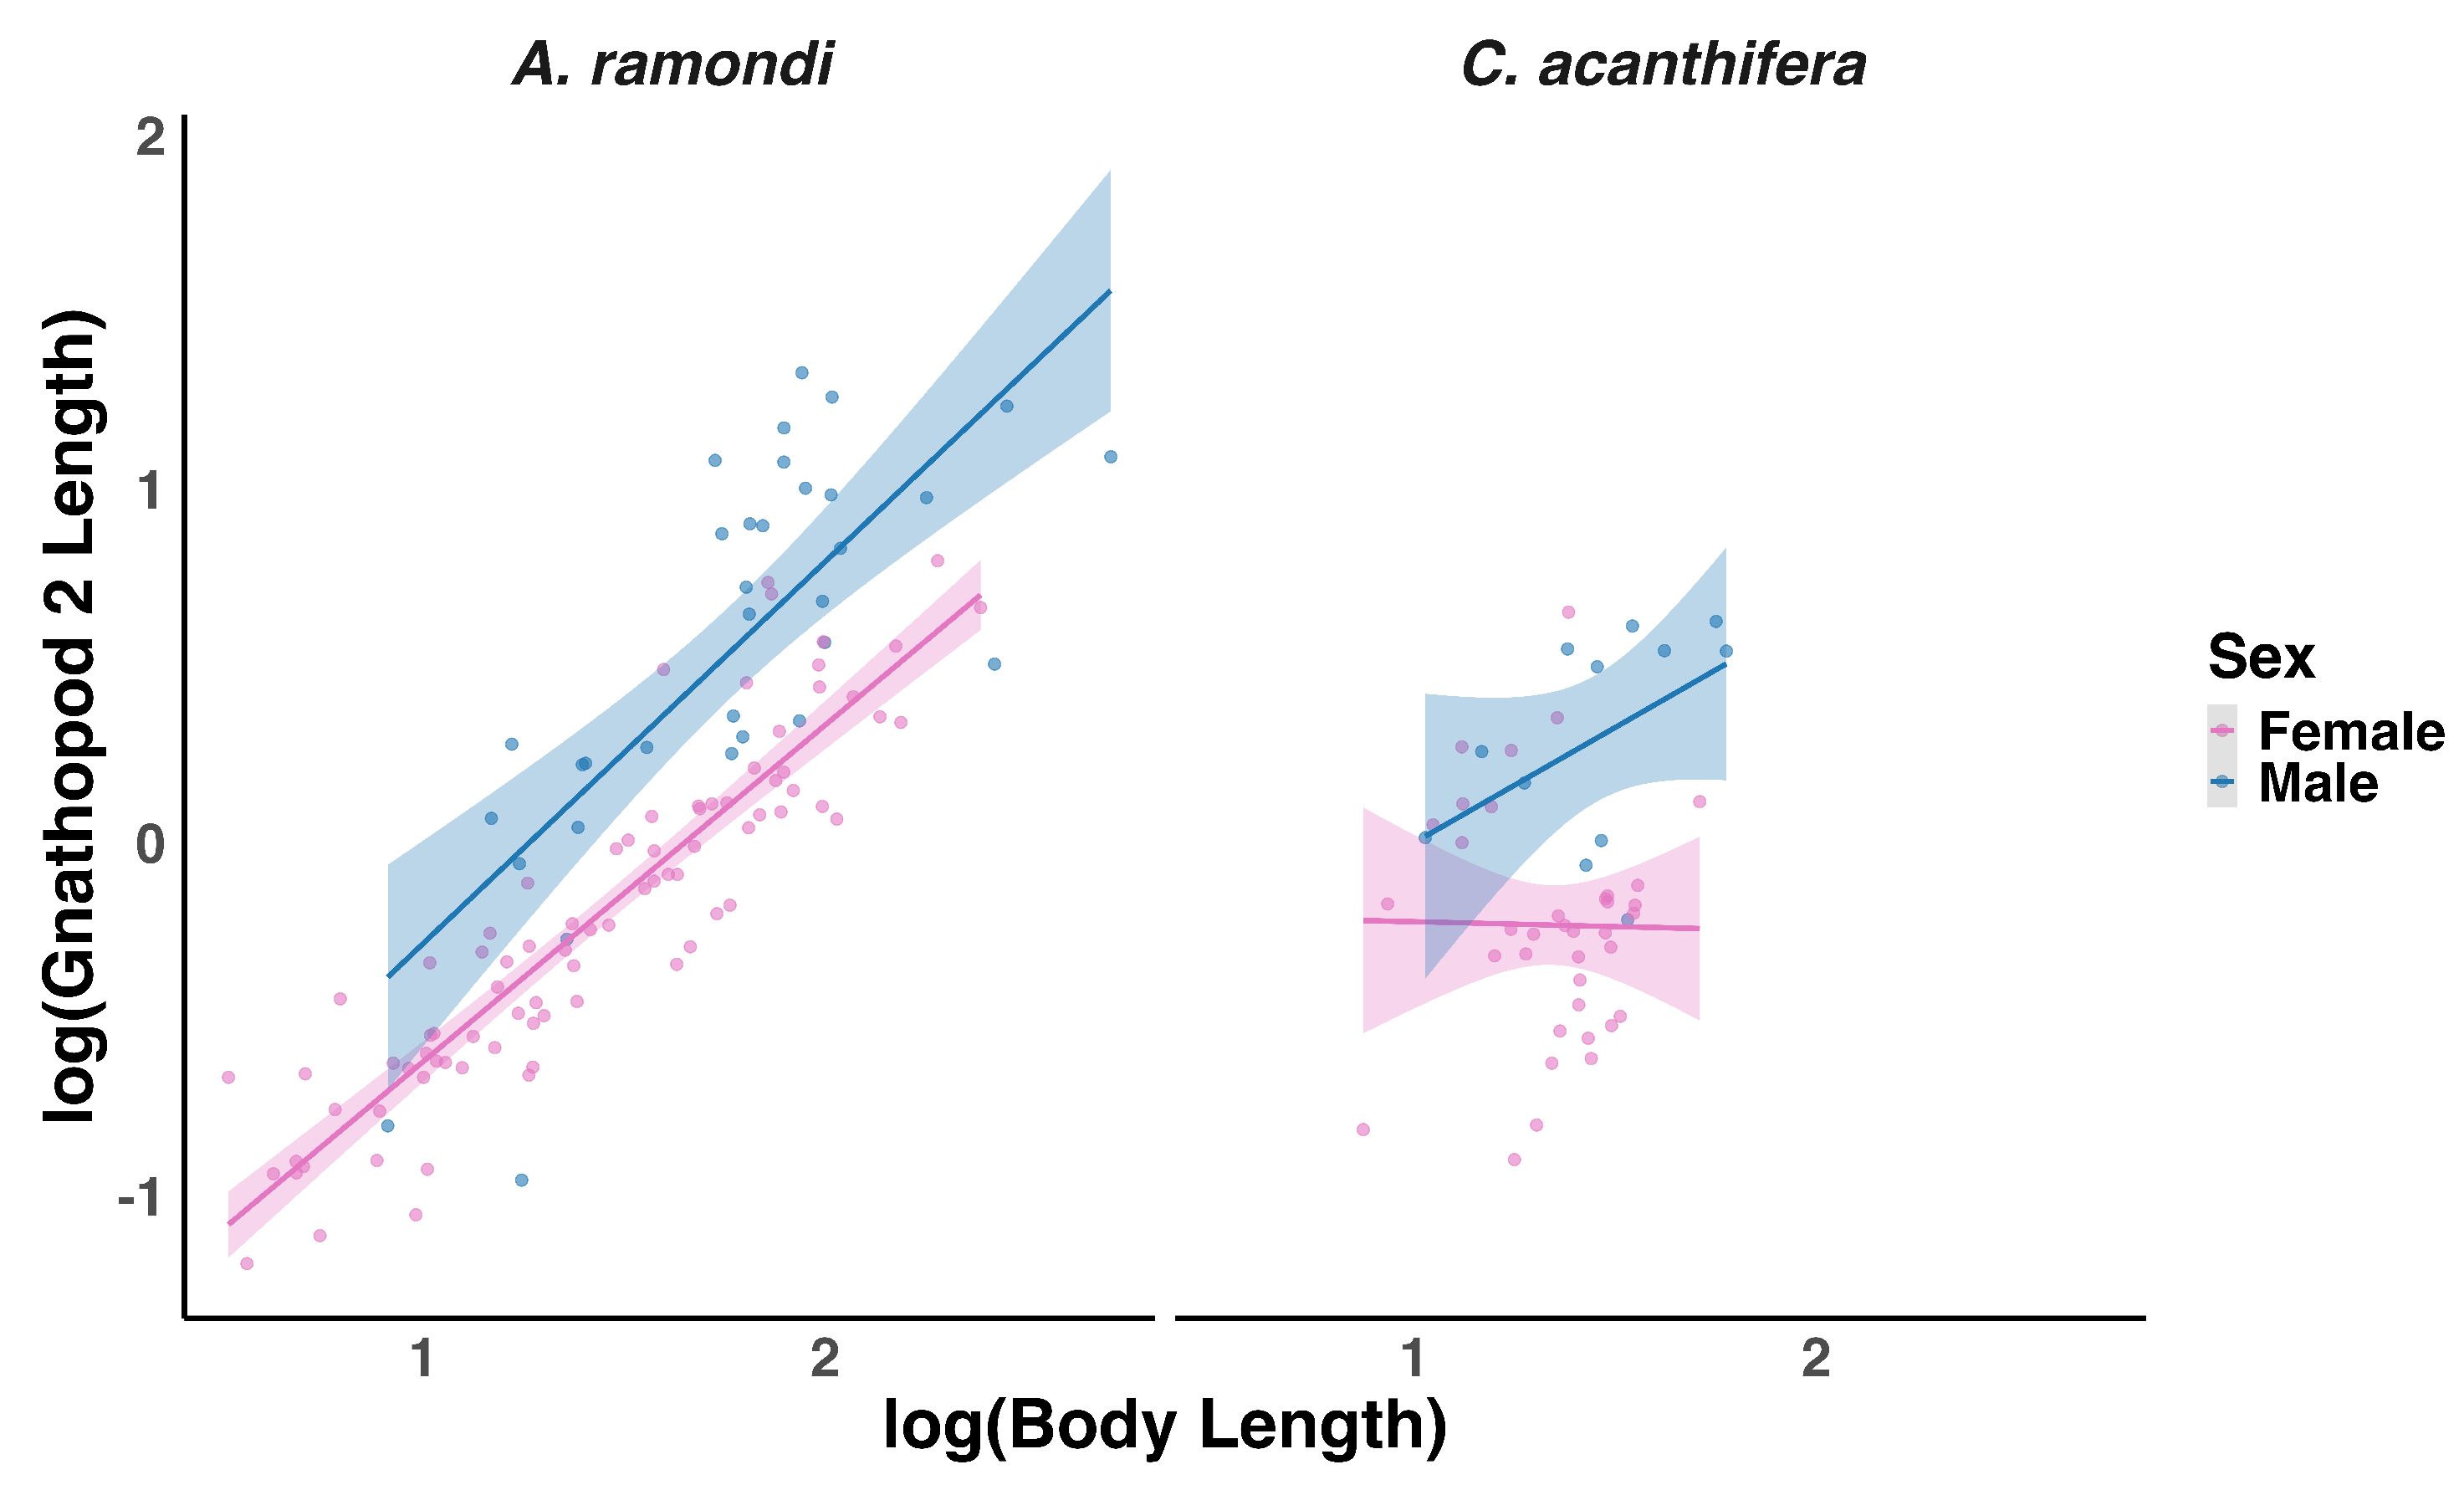
In A. ramondi, gnathopod 2 length scaled positively with body size ( β = 0.95 , the slope of the regression of gnathopod 2 length on body length; p < 0.001 ; Figure 3), with males exhibiting a marginally steeper slope than females ( β = 0.13 , p = 0.32 ), although this difference was not statistically significant. The sex effect alone was also non-significant ( β = 0.21 , p = 0.36 ), indicating that while males tend to have longer gnathopods, the scaling relationship between gnathopod 2 length and body length is broadly similar across sexes. Conversely, in C. acanthifera, neither body length ( β = 0.03 , p = 0.93 ), sex ( β = 0.46 , p = 0.56 ), nor their interaction ( β = 0.68 , p = 0.21 ) significantly predicted gnathopod 2 length. These results suggest that sexual dimorphism in gnathopod 2 exaggeration is less pronounced or absent in C. acanthifera, with both sexes exhibiting comparable scaling patterns.
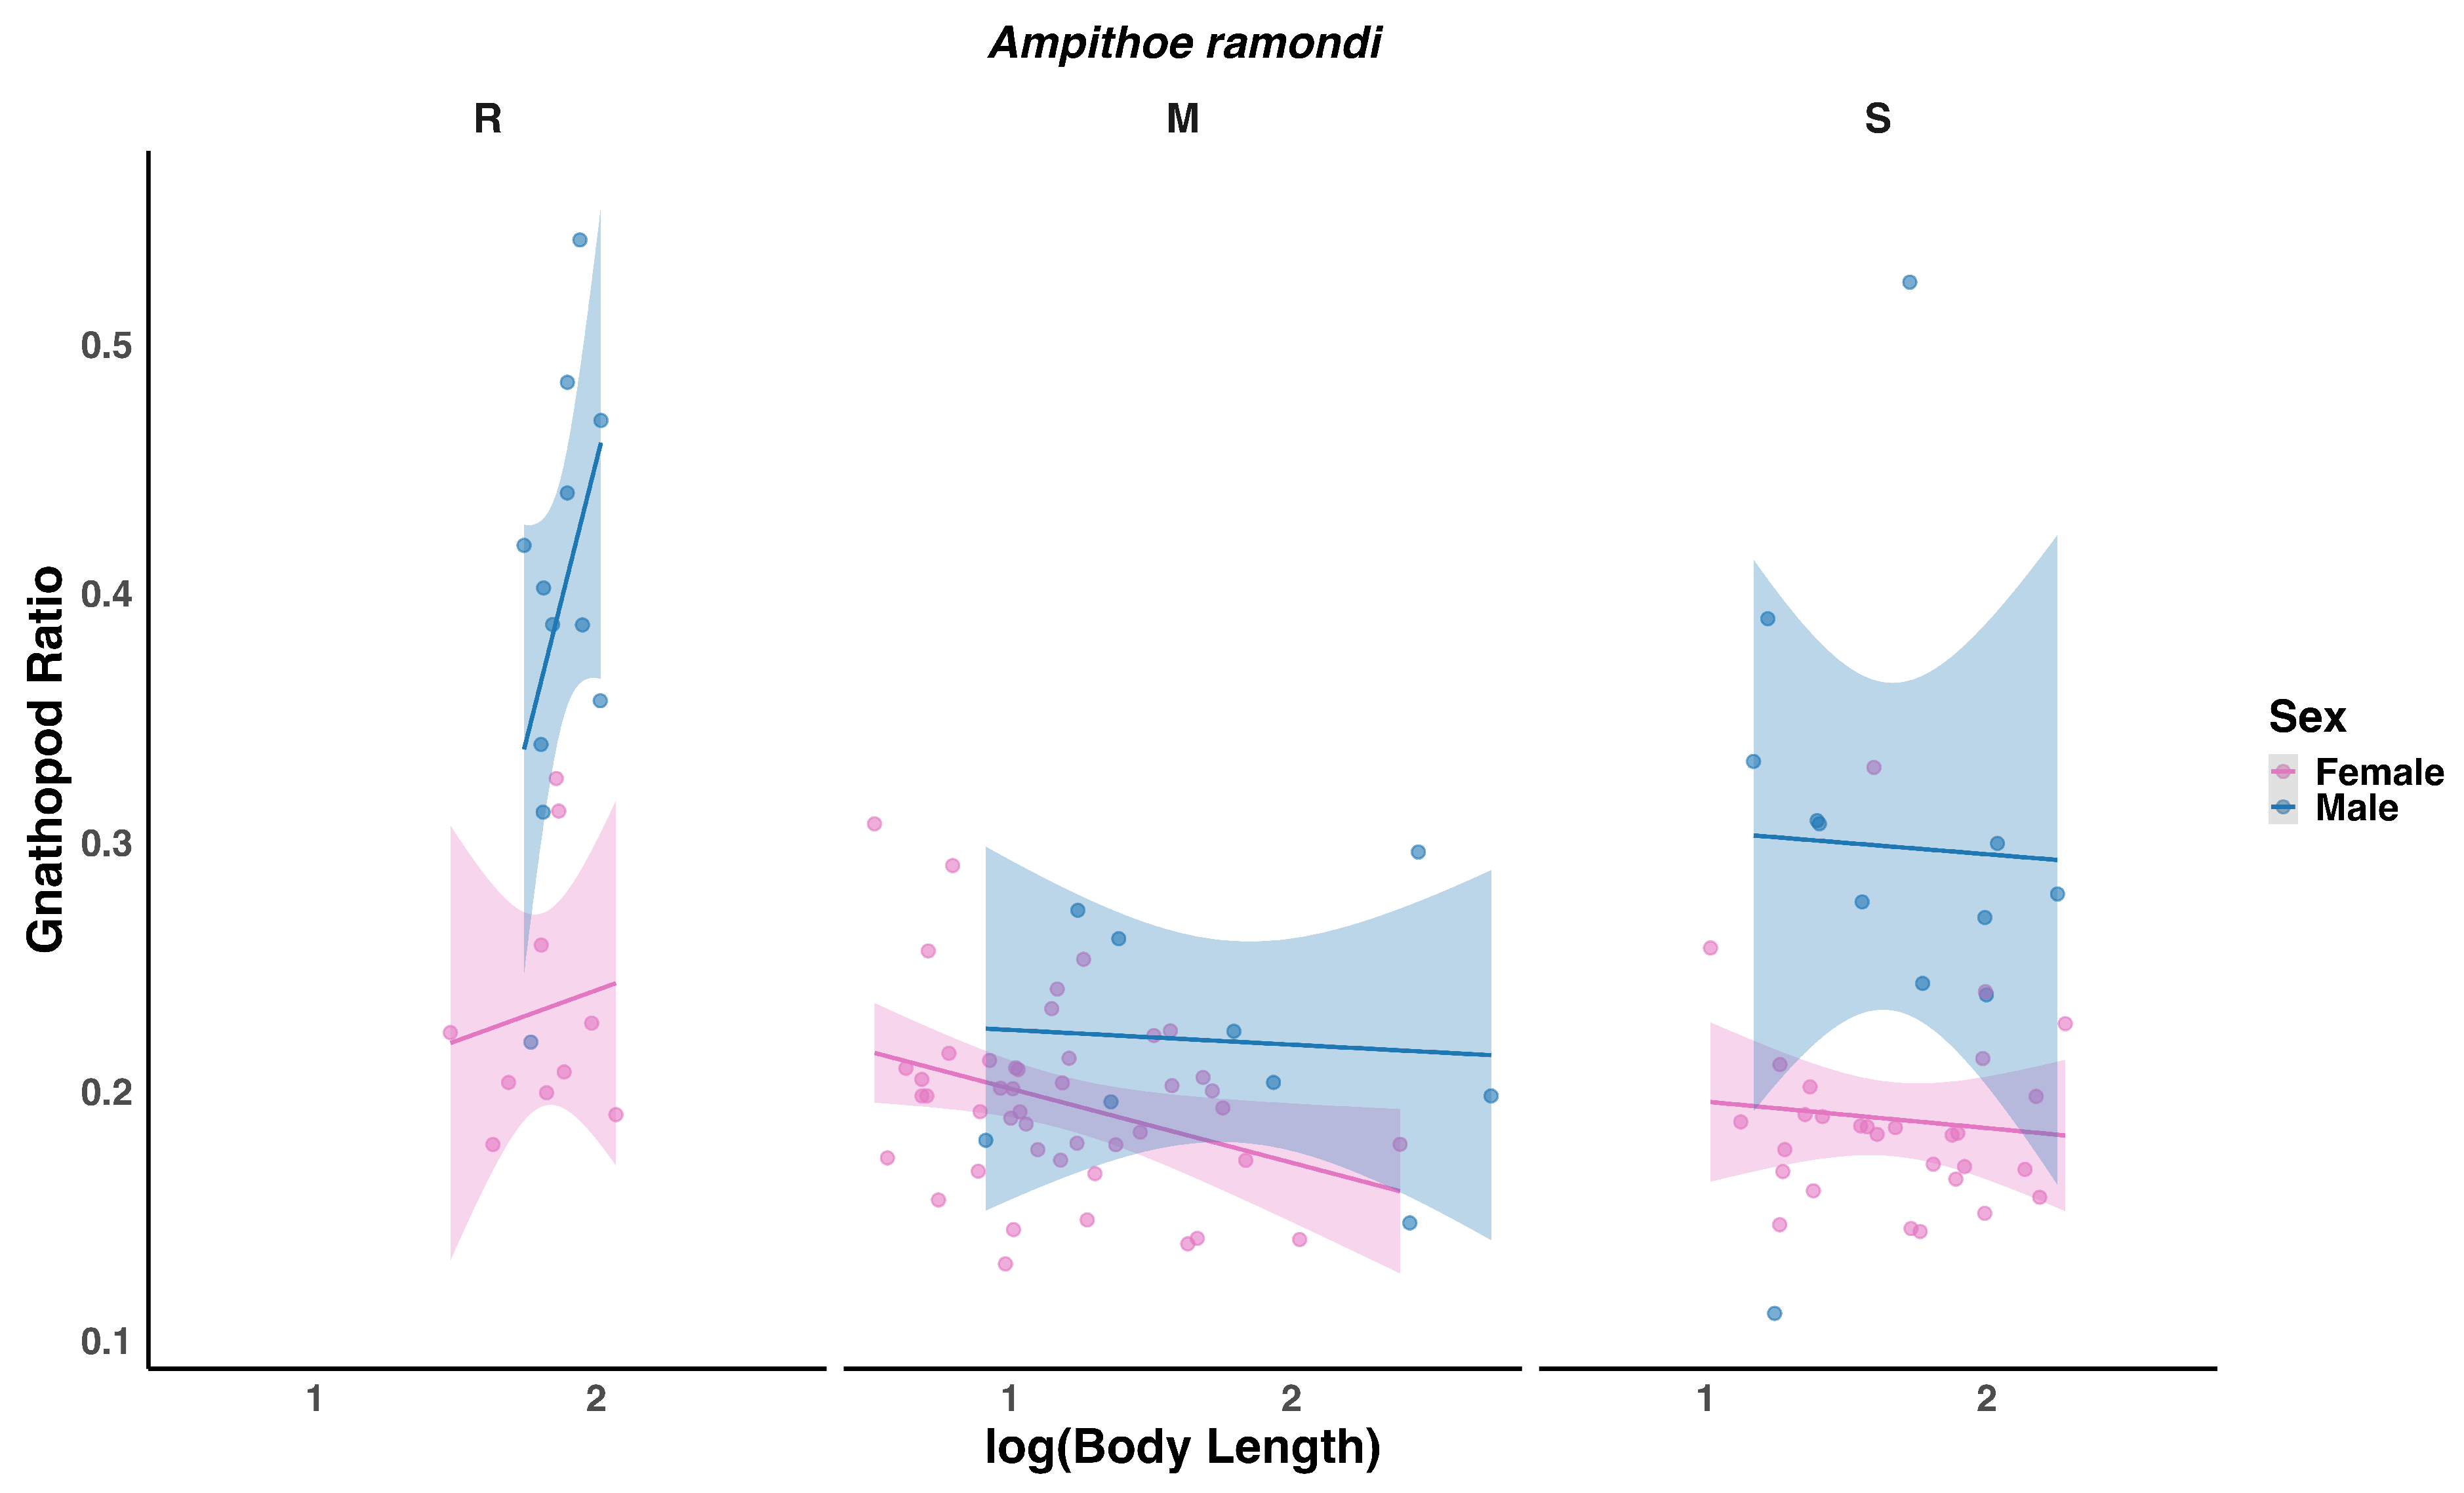
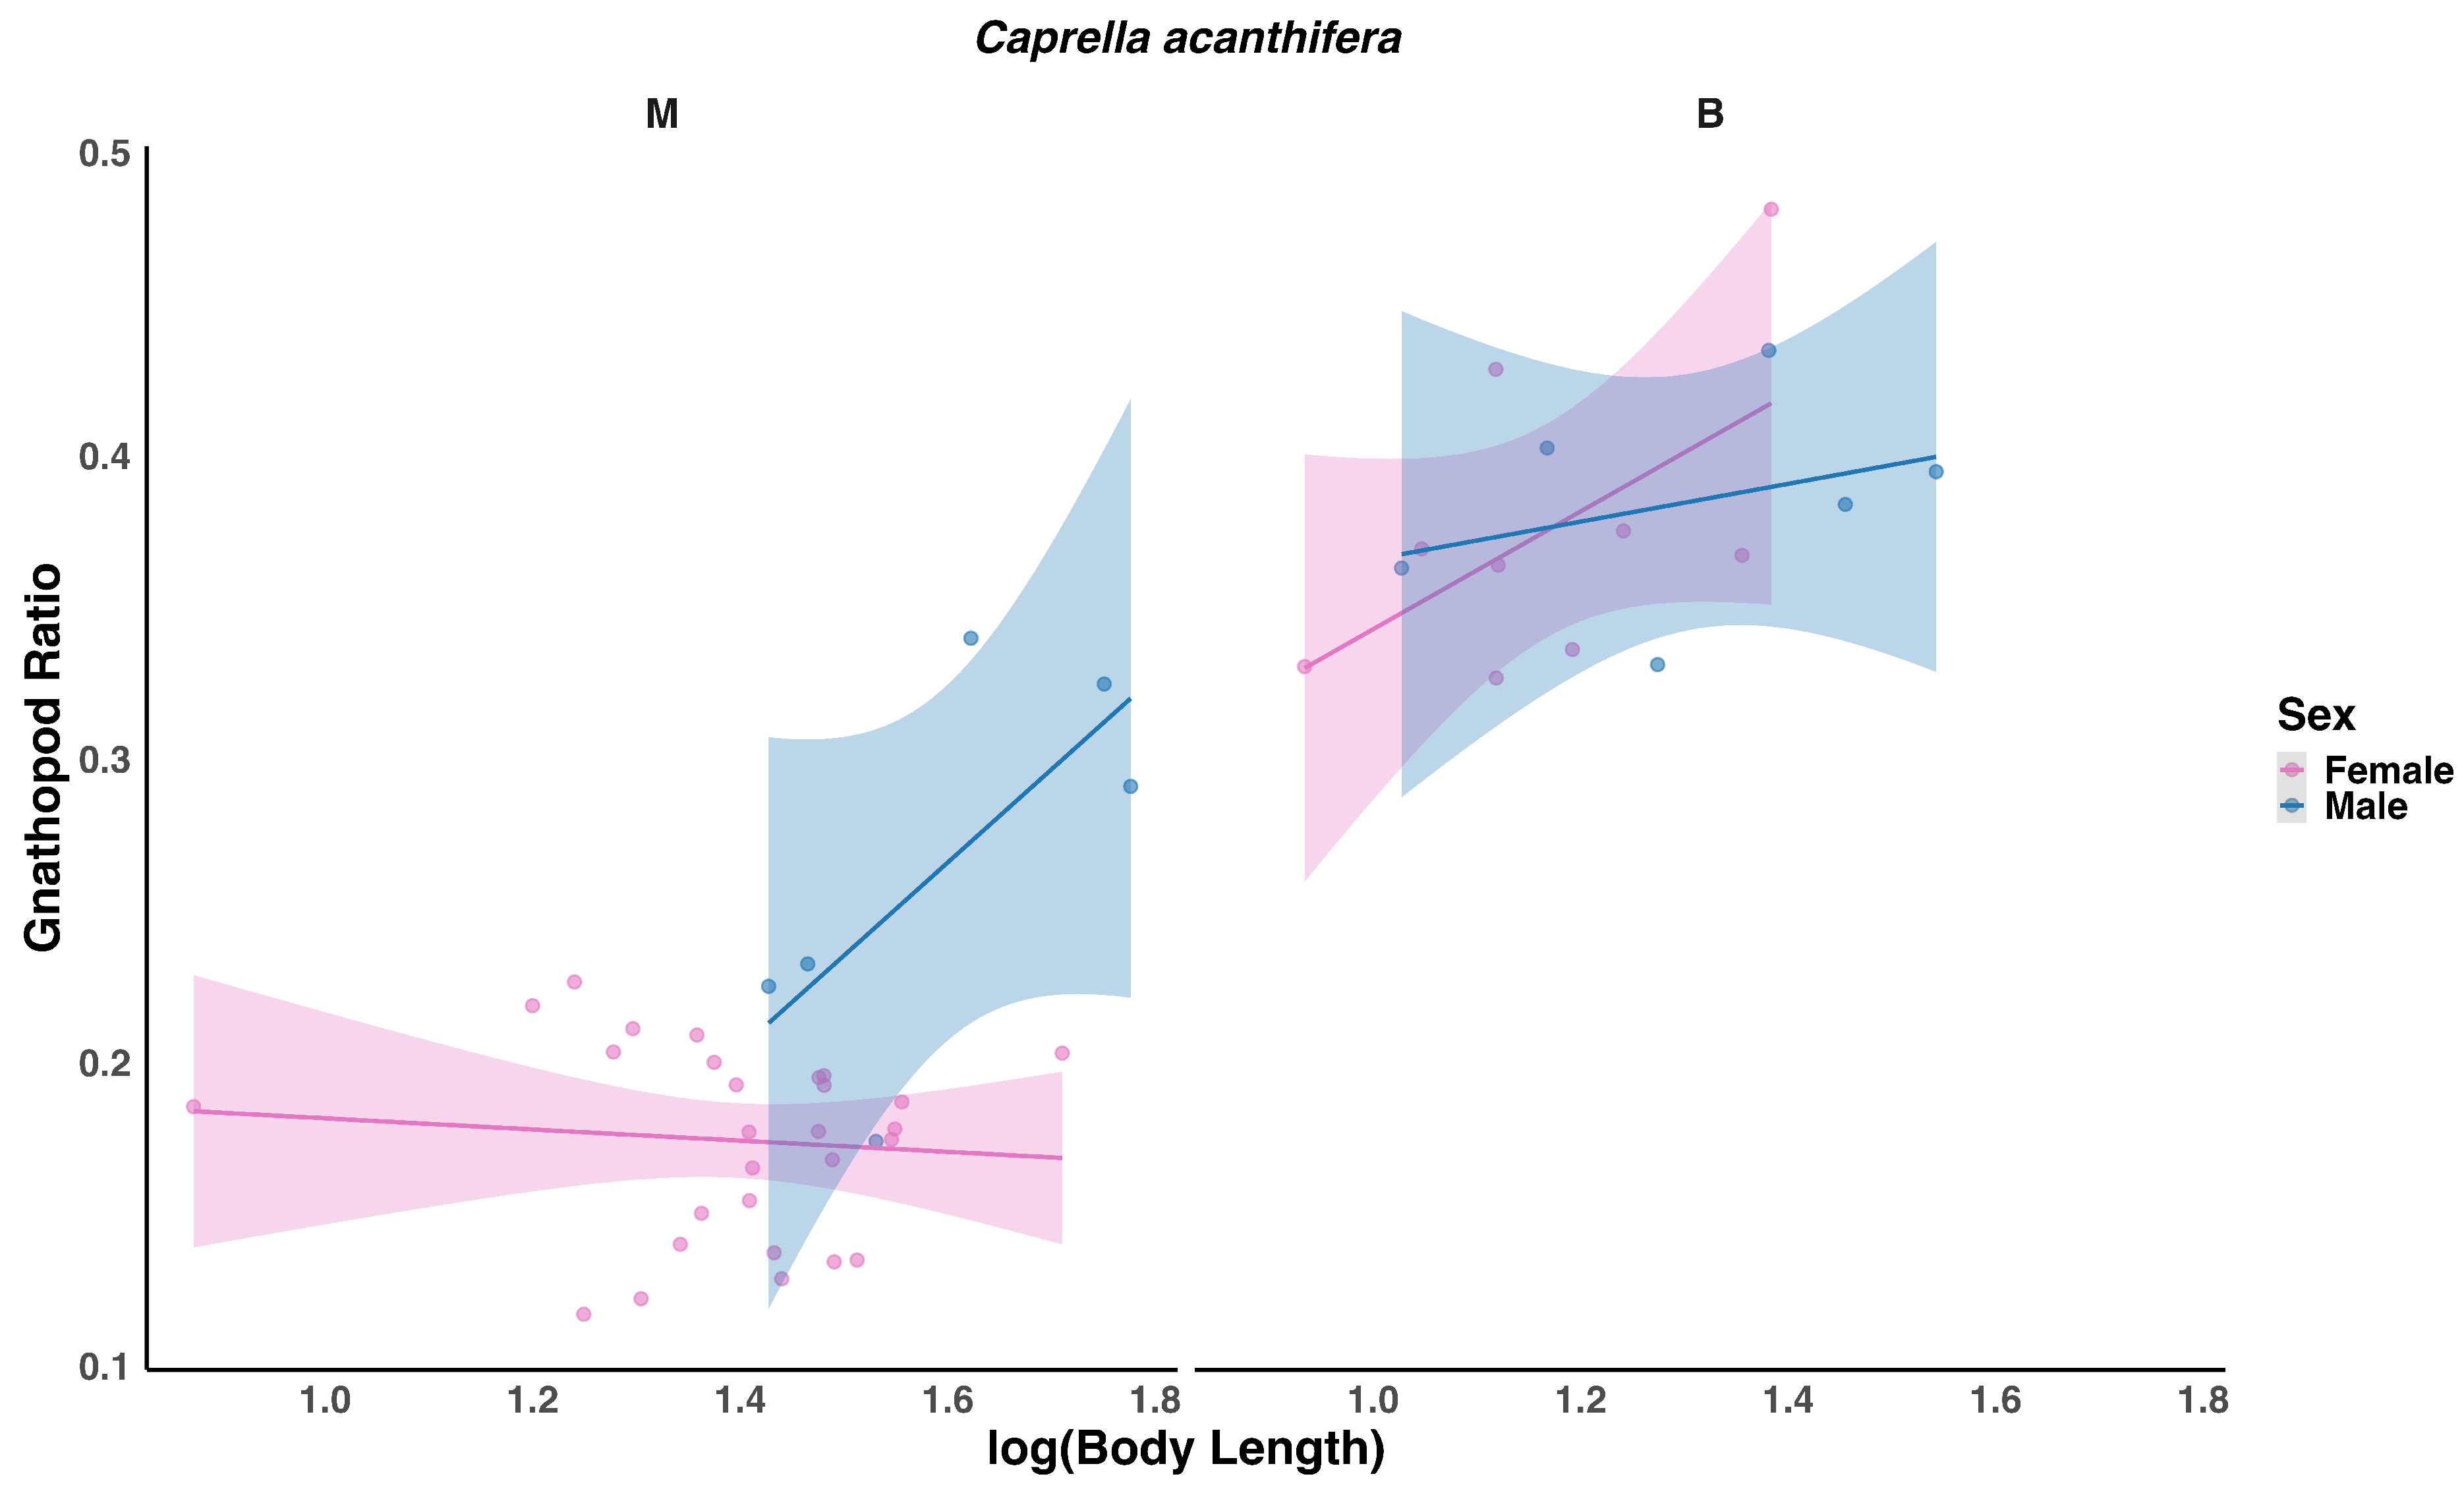
We also examined habitat-specific allometry of gnathopod ratios within each sex using log-transformed body length. In A. ramondi, males exhibited positive scaling of gnathopod ratio with body size in rhodolith beds (slope = 0.45, 95% CI [0.13, 0.77]), whereas females showed no strong scaling (0.04, 95% CI [−0.15, 0.23]). In macroalgae-dominated reefs and seagrass meadows, slopes were near zero for both sexes, indicating broadly consistent gnathopod ratios across body sizes (refer Figure A2). For C. acanthifera, neither sex showed strong allometric scaling of gnathopod ratio with body size across the sampled habitats of black-coral forests and macroalgae-dominated reefs, with slopes ranging from −0.01 to 0.19 and 95% confidence intervals overlapping zero (refer Figure A3). These results suggest that sex-specific exaggeration of gnathopod ratio is most pronounced in male A. ramondi in rhodolith beds, while habitat has little effect on allometry in other cases. While gnathopod-to-body length ratios were used to compare traits, their interpretation relies on the assumption of approximate isometric scaling. For A. ramondi, where scaling is near isometric, ratios provide a meaningful comparison. For C. acanthifera, where scaling deviates from isometry, ratios should be interpreted cautiously, and results are primarily descriptive rather than indicative of strict allometric relationships.

3.2. Species-Specific Analyses

3.2.1. Ampithoe ramondi

Body length
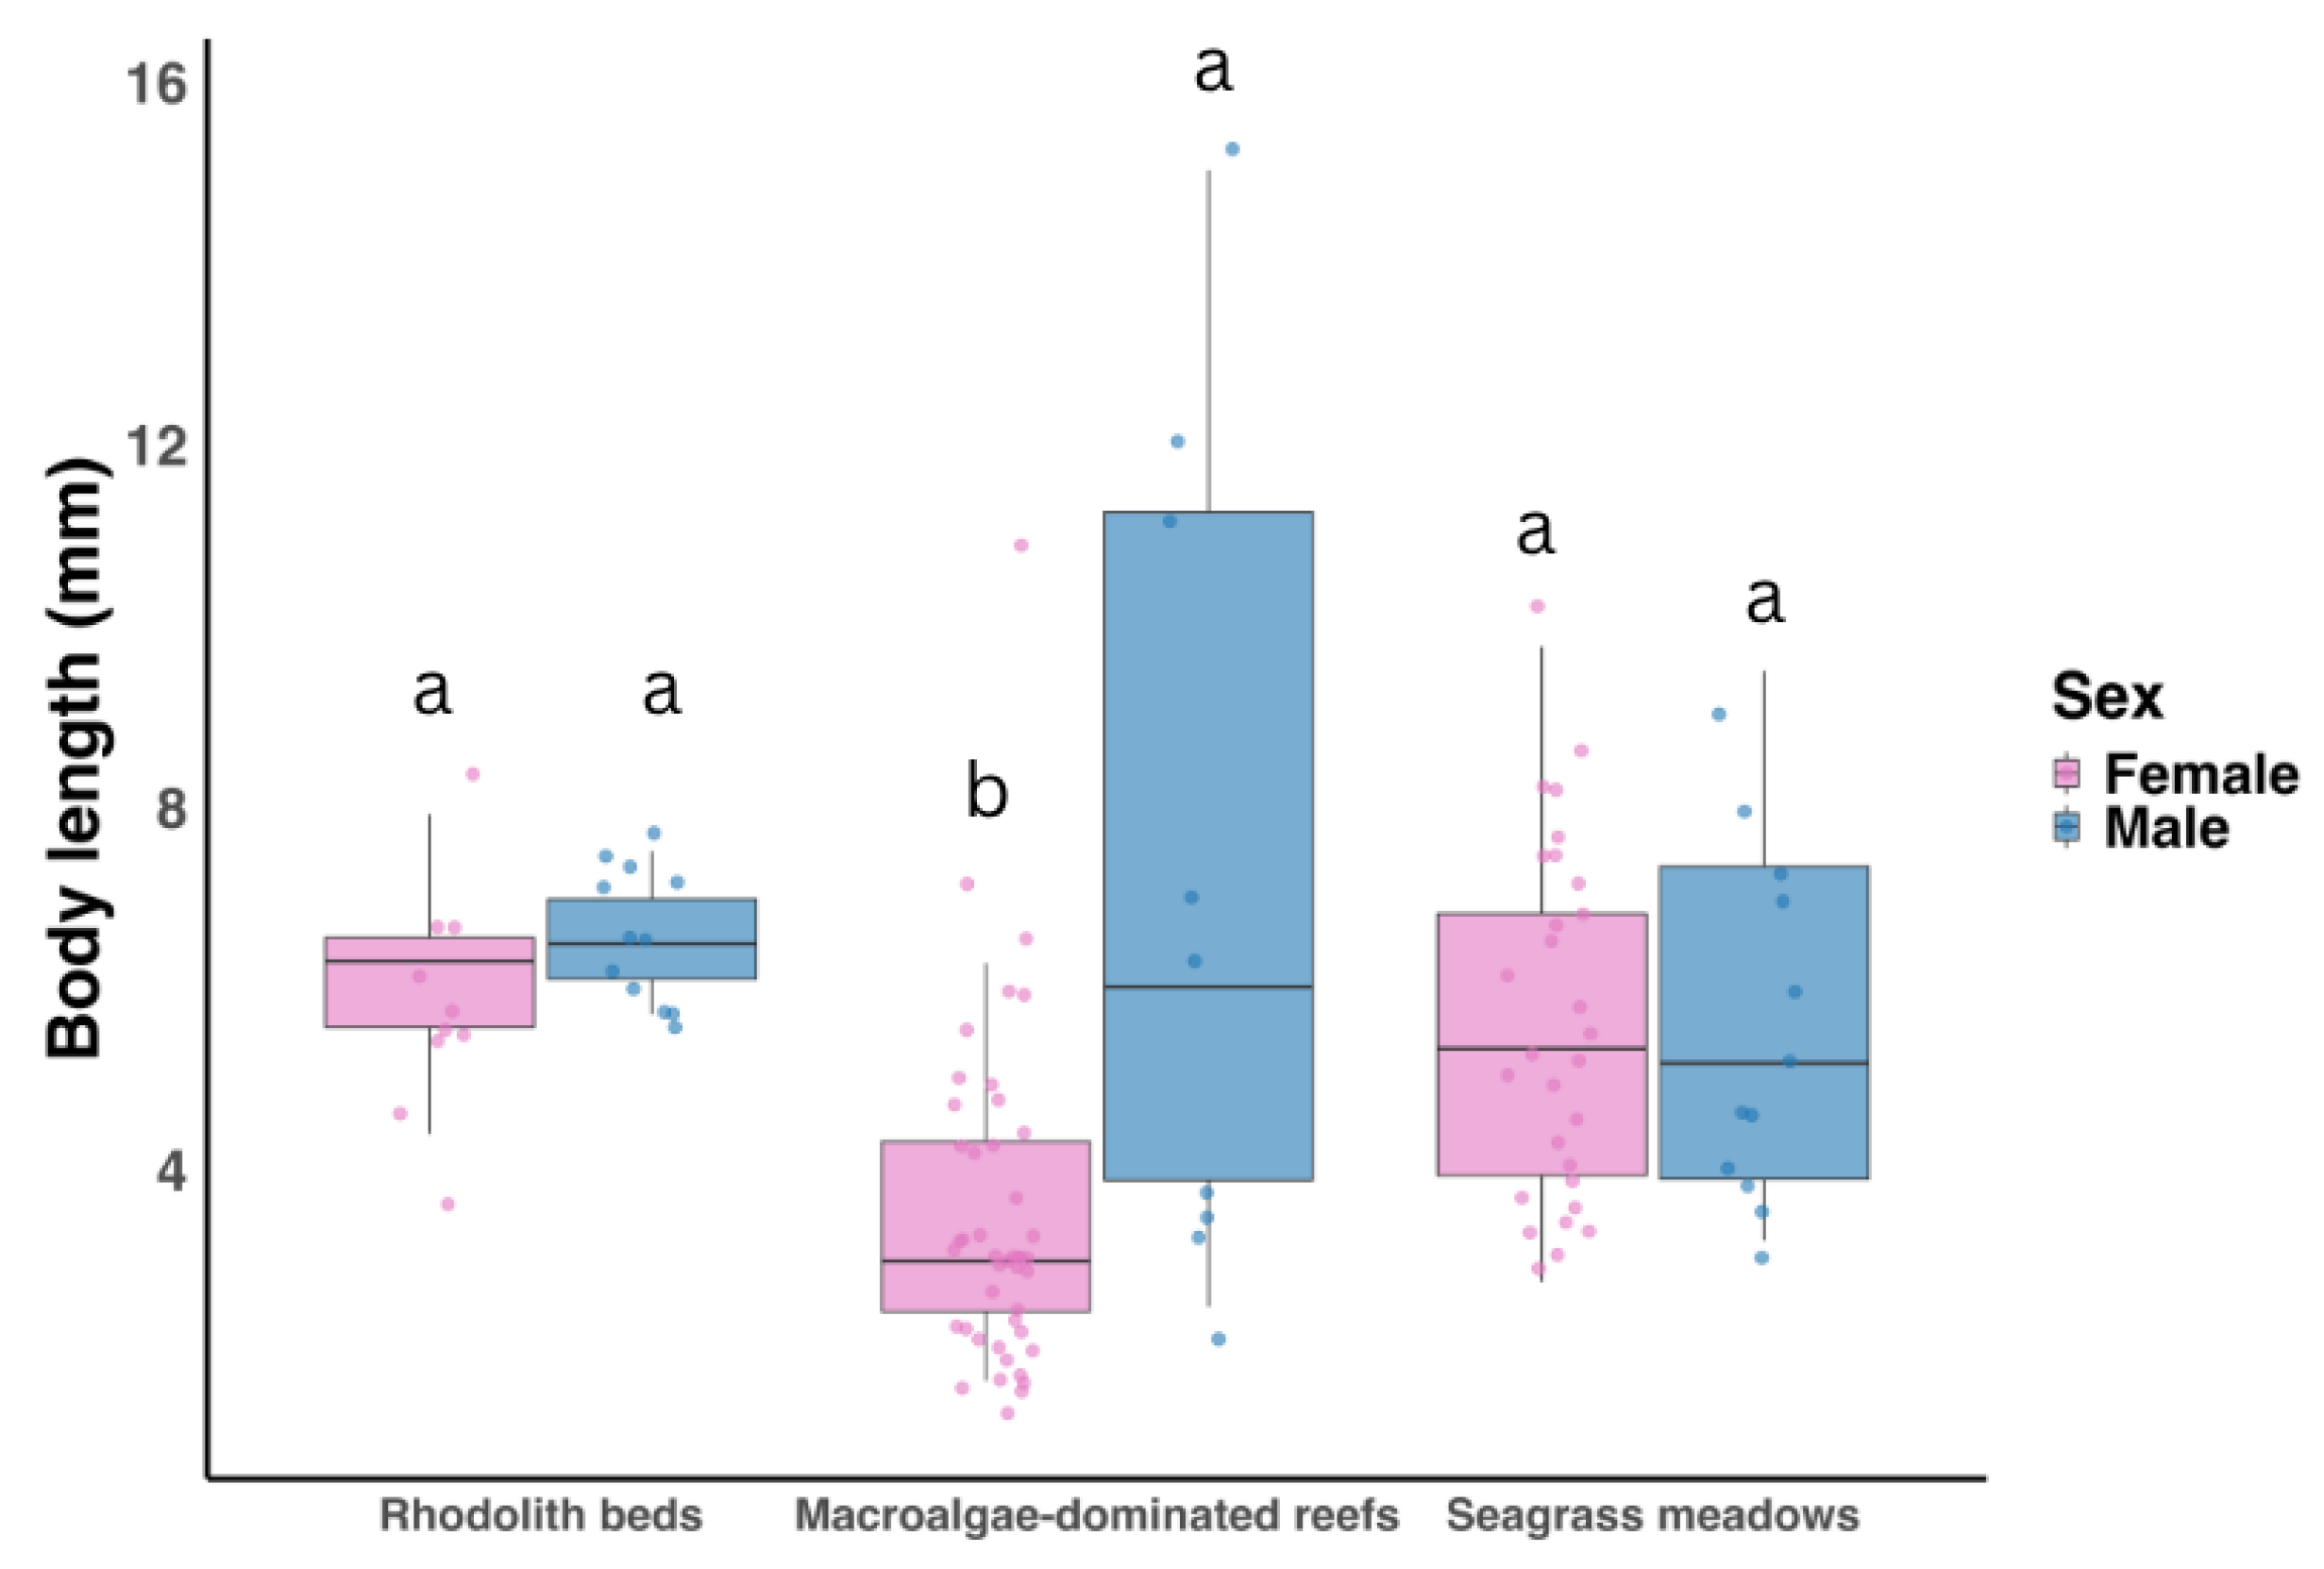
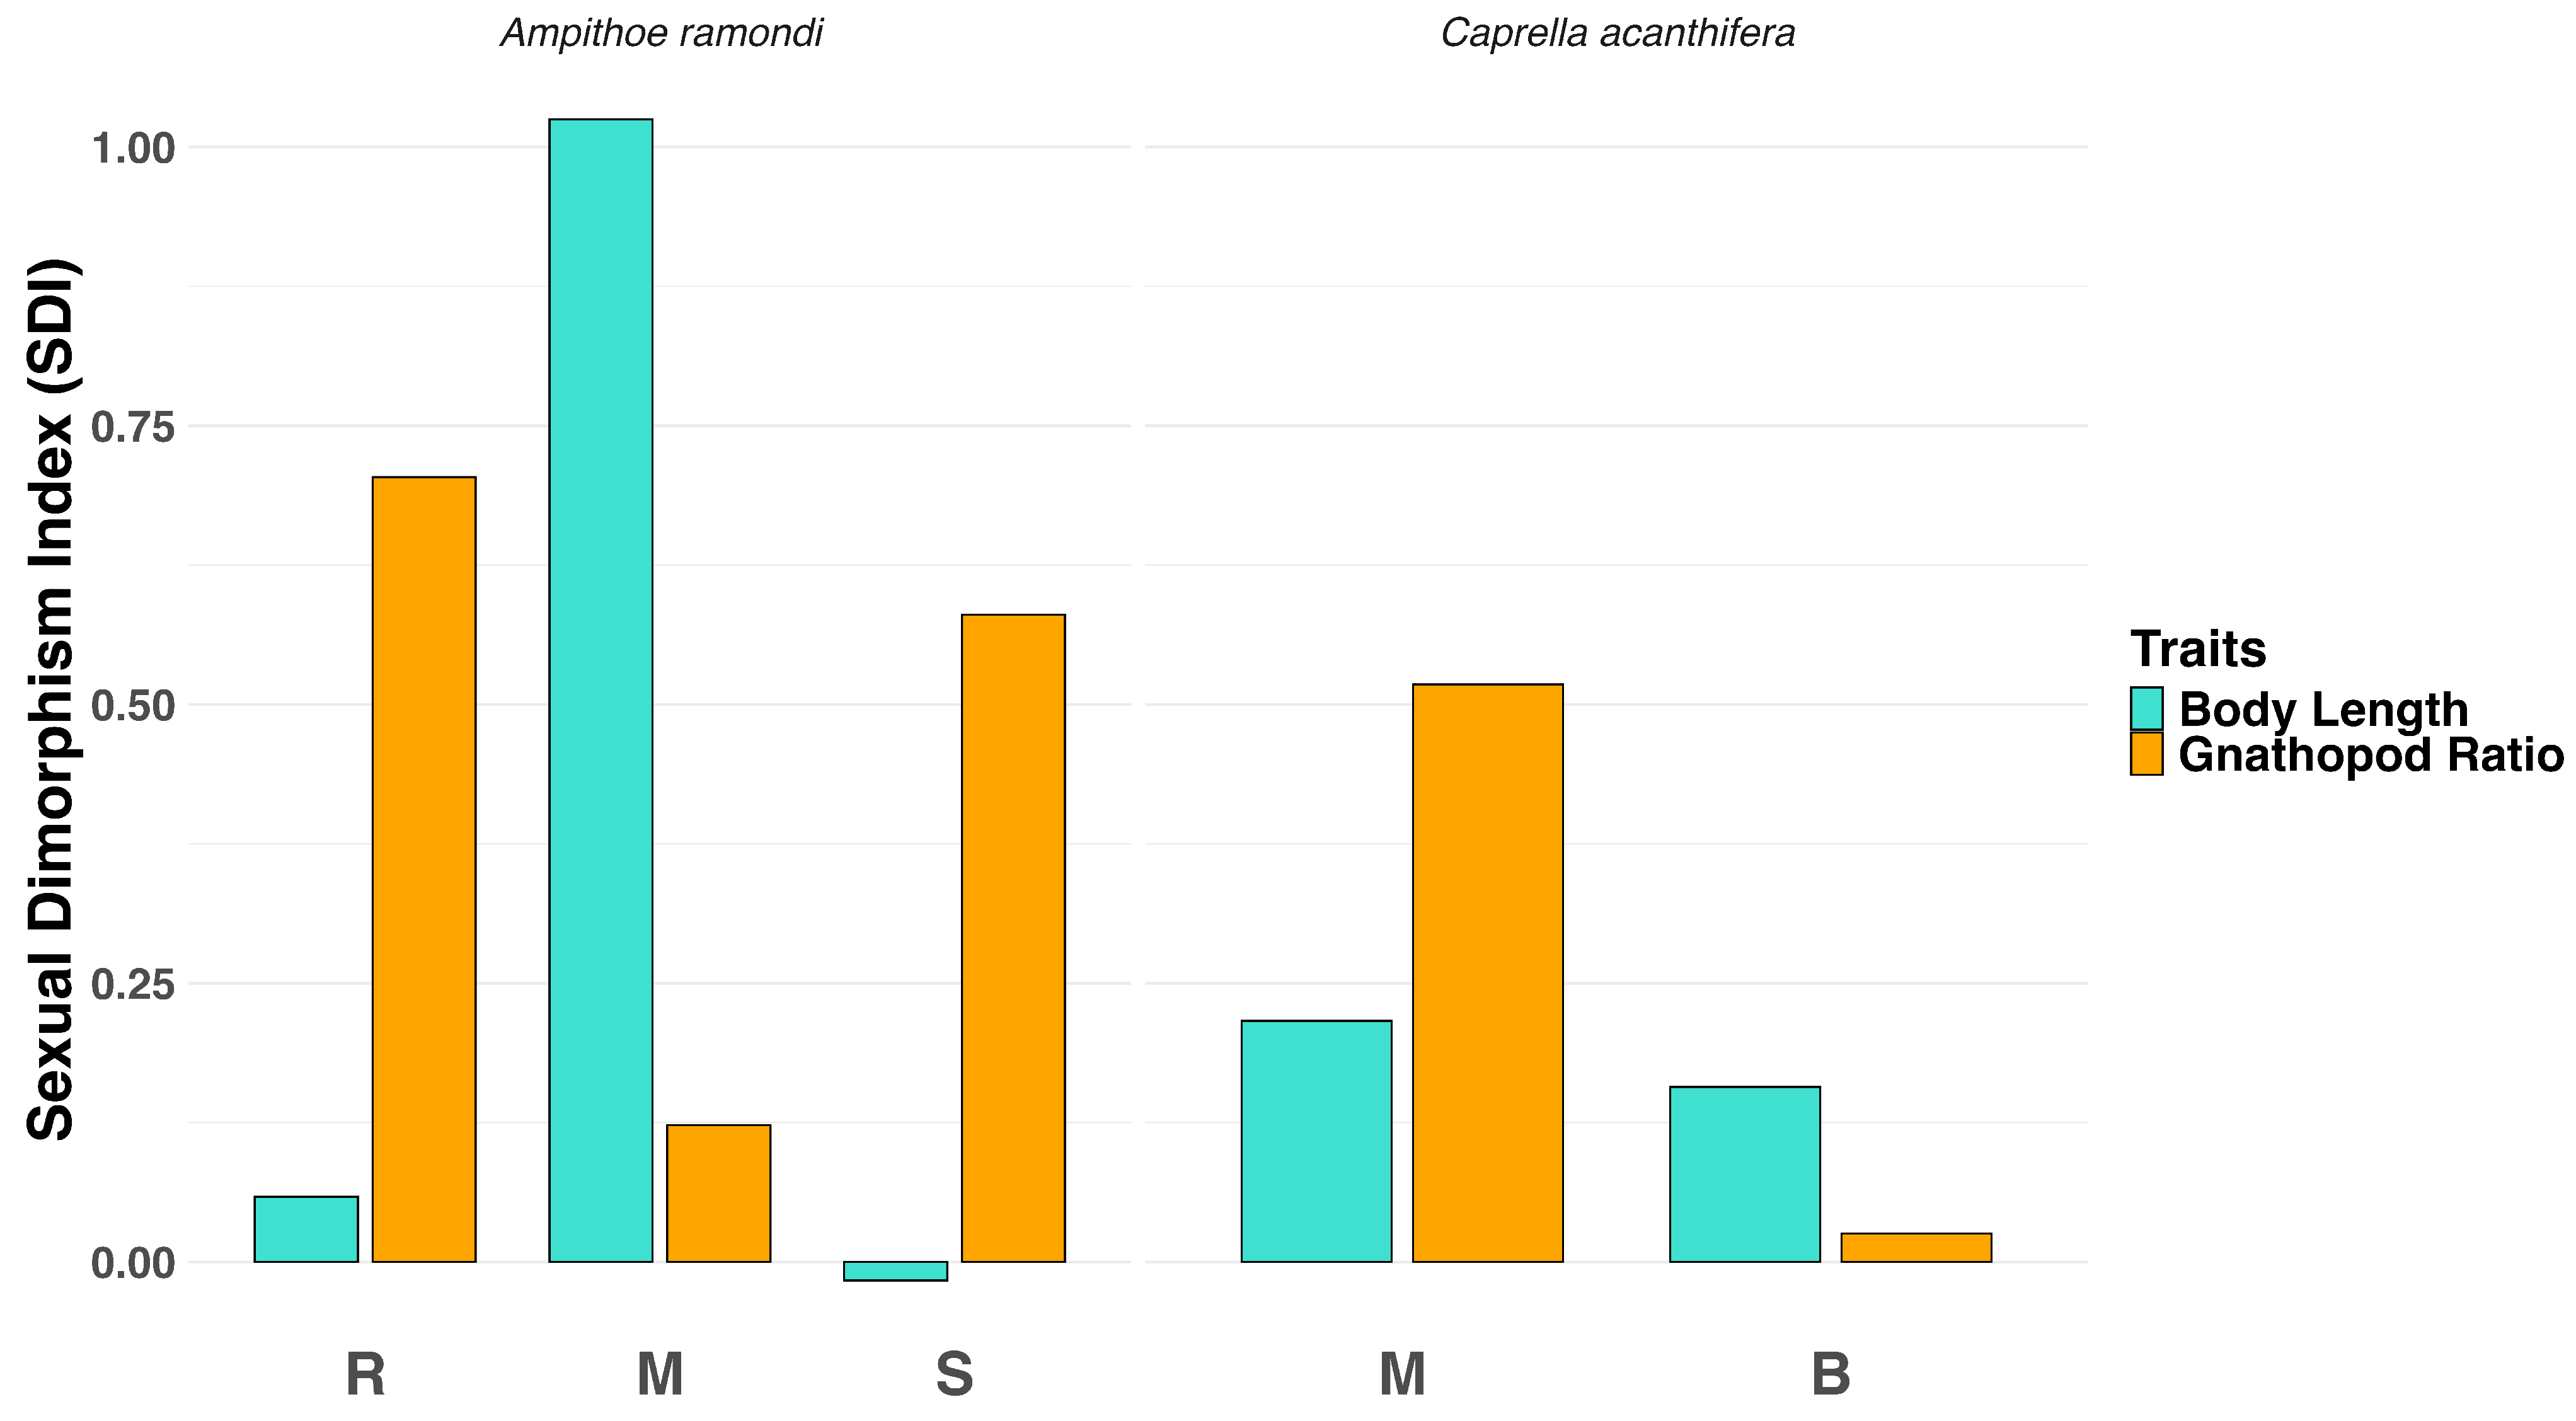
Ampithoe ramondi occurred in rhodolith beds, macroalgae-dominated reefs, and seagrass meadows, but was not found in black coral forests during sampling. For A. ramondi, SDI for body length was low across habitats (rhodolith beds: 0.059; macroalgae-dominated reefs: 0.12; seagrass meadows: −0.017), whereas gnathopod ratios showed stronger dimorphism, particularly in rhodolith beds (0.7) and seagrass meadows (0.58; see Figure A1). Body length in A. ramondi was significantly influenced by habitat, sex, and their interaction (adjusted R 2 = 0.27 , p < 0.001 ; Figure 4). Individuals from macroalgae-dominated reefs were significantly smaller than those from rhodolith beds ( β = 2.64 , p < 0.001 ), while body length in seagrass meadows did not differ significantly from rhodolith beds ( β = 0.56 , p = 0.45 ). Although males were on average larger than females, this difference was not statistically significant overall ( β = 0.36 , p = 0.68 ). A significant Sex × Habitat interaction ( p < 0.005 ) indicated that the effect of sex on body length varied among habitats, with the greatest difference observed in macroalgae-dominated reefs, where males were larger than females. In contrast, sex-related differences were negligible in seagrass meadows and rhodolith beds.
Gnathopod ratio
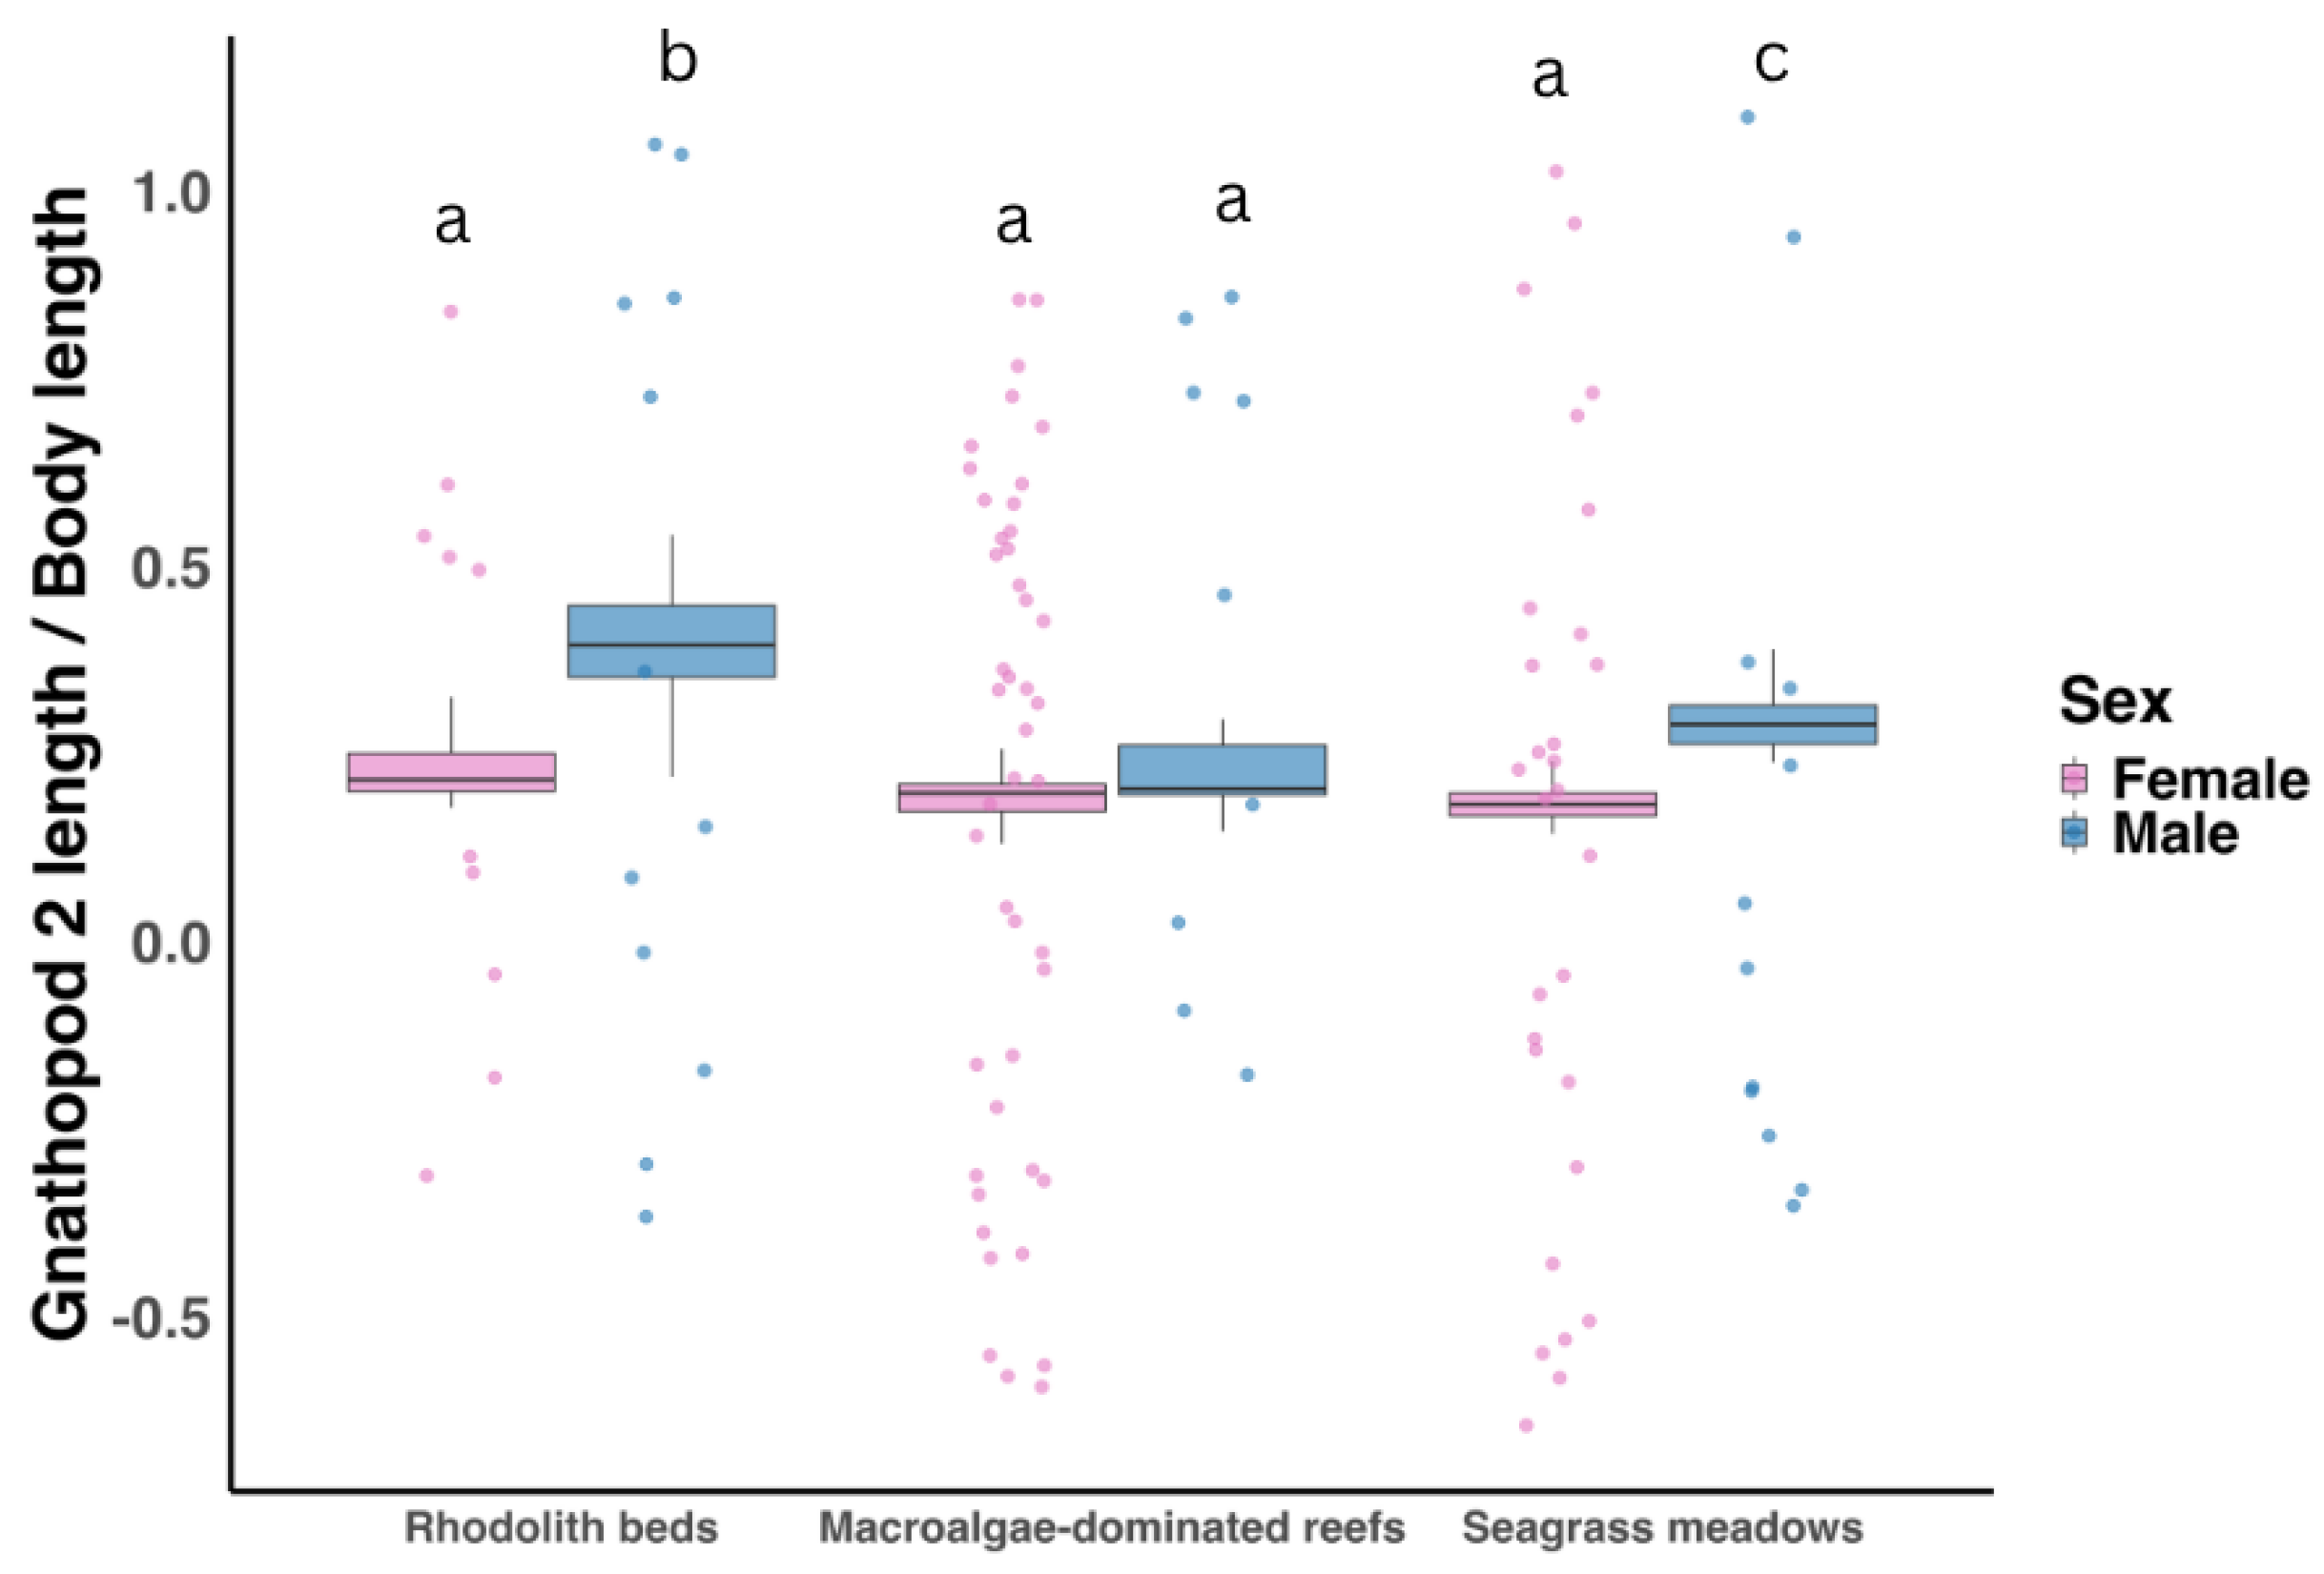
Beta regression analysis revealed significant effects of sex ( p < 0.001 ), habitat (macroalgae-dominated reefs: p = 0.035; seagrass meadows: p = 0.016), and their interaction (male × macroalgae-dominated reefs: p < 0.001) on gnathopod ratio (Figure 5). The difference between males and females was negligible in macroalgae-dominated reefs, but males had higher gnathopod ratios than females in seagrass meadows and rhodolith beds. Male gnathopod ratios were highest relative to females in rhodolith beds (female/male odds ratio = 0.47, 95% CI [0.37, 0.59], p < 0.0001), intermediate in seagrass meadows (0.57, 95% CI [0.47, 0.69], p < 0.0001), and negligible in macroalgae-dominated reefs (0.87, 95% CI [0.71, 1.07], p = 0.196).

3.2.2. Caprella acanthifera

Body length
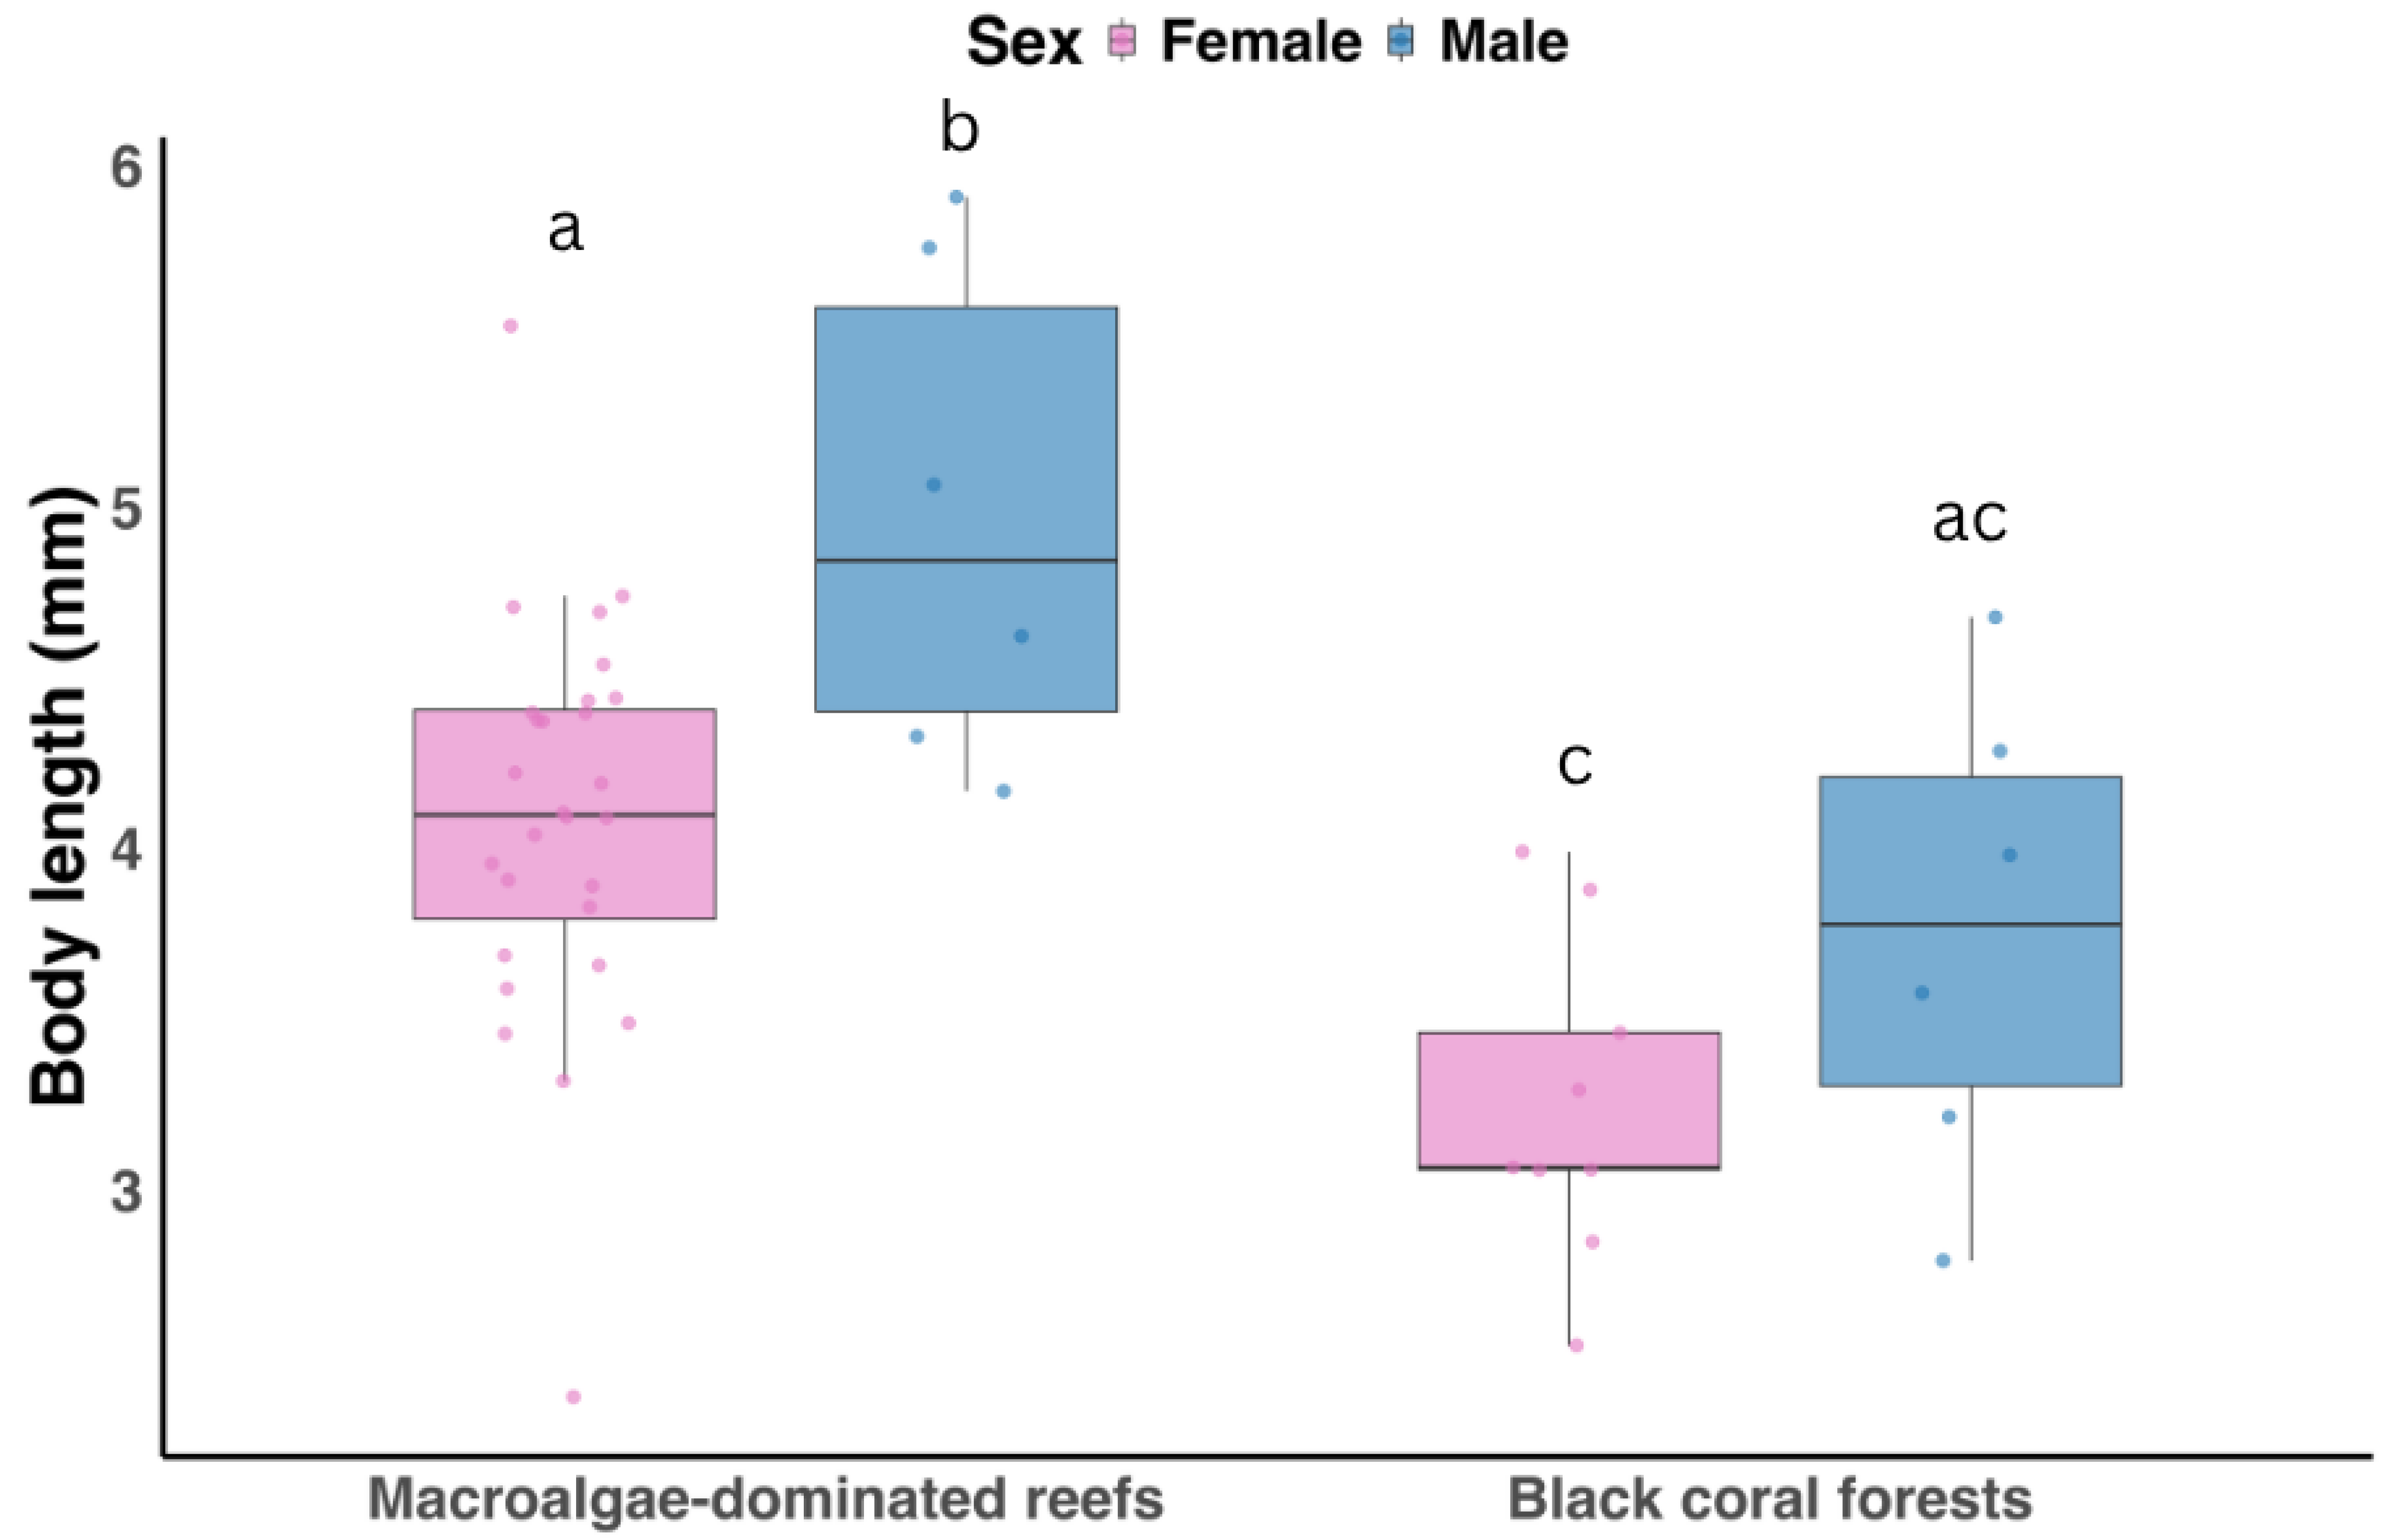
Caprella acanthifera was recorded only in macroalgae-dominated reefs and black coral forests and was not observed in the other sampled habitats. C. acanthifera exhibited moderate SDI for both traits, with gnathopod ratio dimorphism highest in macroalgae-dominated reefs (0.52) and minimal in black coral forests (0.026; see Figure A1). The linear model indicated a significant effect of sex on body length ( p = 0.01 , Figure 6), with males larger than females ( β = 1.54 , p = 0.009 ). Habitat had a significant effect, with individuals in black coral forests being smaller than those in macroalgae-dominated reefs ( β = 0.85 , p = 0.0006 ), but the interaction between sex and habitat was not significant ( β = 0.38 , p = 0.37 ), indicating that the male–female size difference was consistent across habitats.
Gnathopod ratio
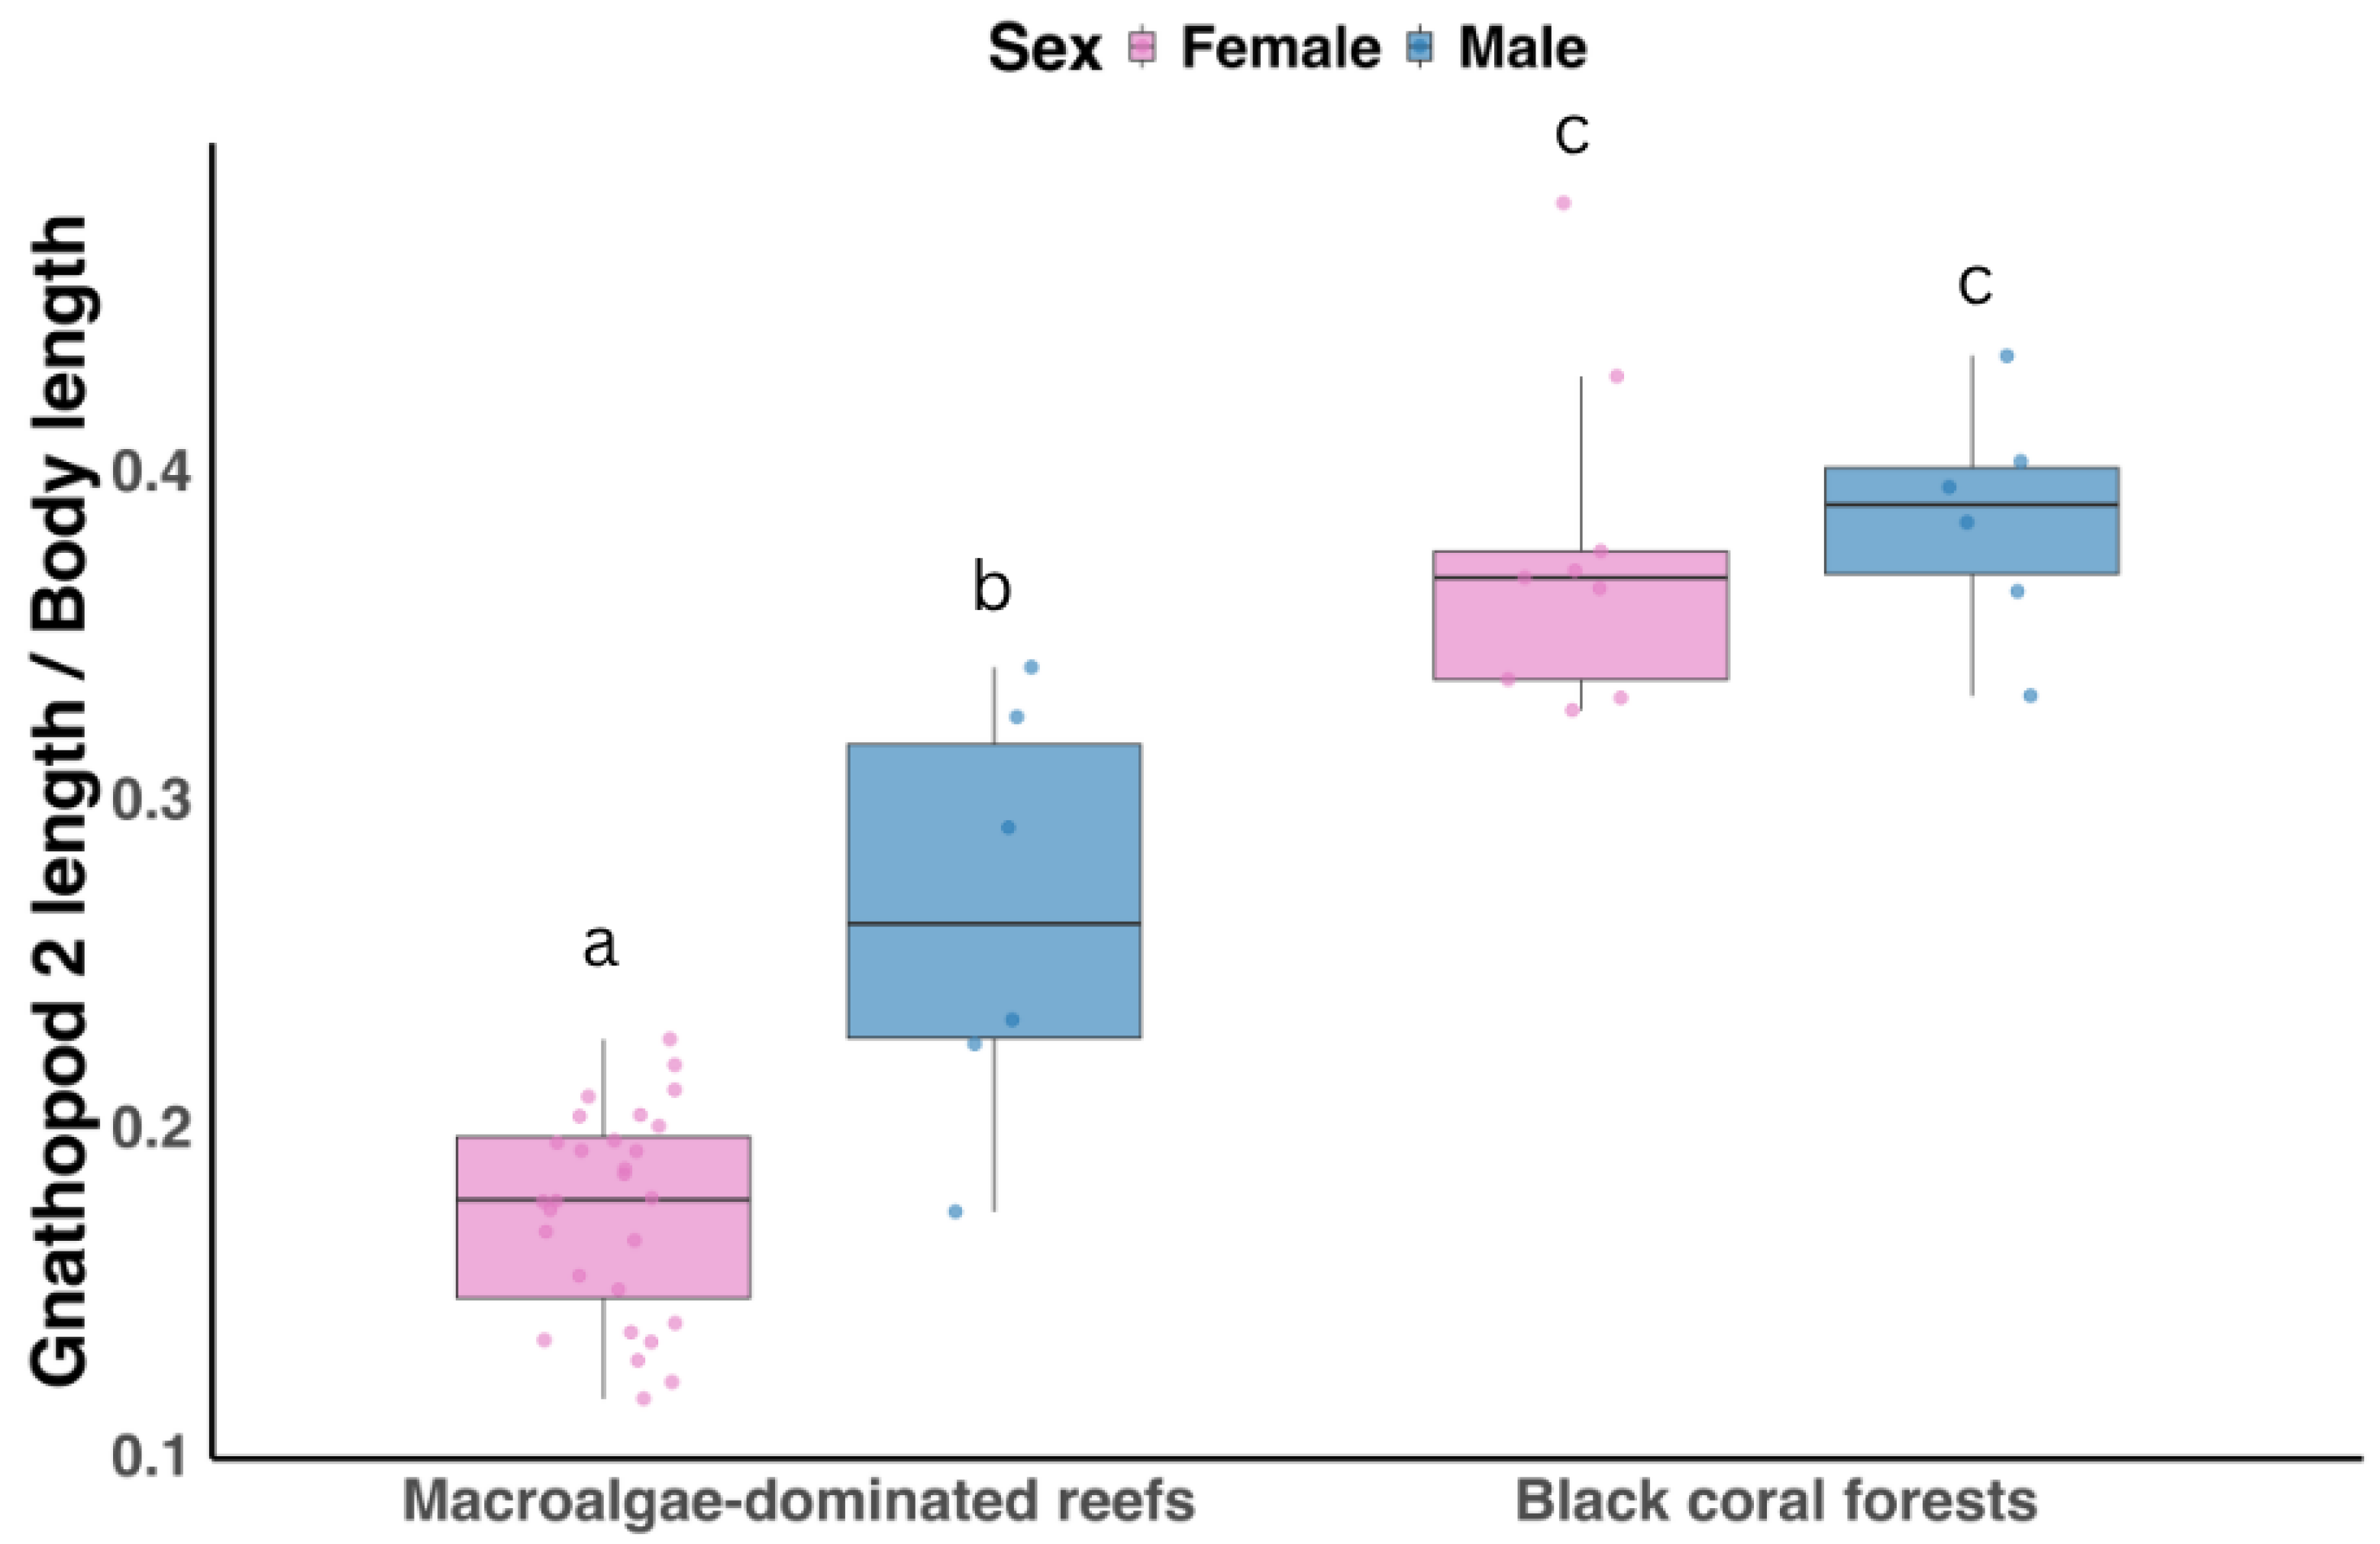
Beta regression analysis revealed significant effects of sex ( p < 0.001 ), habitat ( p < 0.001 ), and their interaction ( p < 0.001 ) on gnathopod ratio in C. acanthifera (Figure 7). Males had higher gnathopod ratios than females in macroalgae-dominated reefs, whereas the male-female difference was reduced in black coral forests.

4. Discussion

Sexual dimorphism in amphipod morphology varied significantly by species and habitat. Ampithoe ramondi exhibited pronounced male-biased dimorphism in body length and gnathopod ratio, particularly in macroalgae-dominated reefs. Similarly, Caprella acanthifera showed male-biased dimorphism in body length in macroalgae-dominated reefs, but gnathopod size was similar between sexes across habitats. Differences in reproductive strategies, mating competition [54,55], and habitat-specific factors such as resource availability or predation [56] likely underlie the observed patterns. However, direct comparisons between A. ramondi and C. acanthifera are constrained by the fact that macroalgae-dominated reefs were the only habitat common to both species.
Habitat plays a central role in modulating trait expression. In A. ramondi, individuals from rhodolith beds were consistently larger than those from macroalgae-dominated reefs or seagrass meadows. This pattern may reflect differences in available colonisable space and niche diversity among benthic habitats, where structurally complex environments can reduce competition for space and resources and support larger body sizes [28]. Bathymetric range may further mediate these patterns through differences in environmental stability and resource availability, including light penetration and epiphytic development, which increase habitat complexity and vary temporally. Shallow habitats are often subject to strong intra-annual variability, such as winter storms and swell, favouring species adapted to fluctuating habitat structure and resource inputs, whereas deeper habitats tend to experience lower but more stable resource availability. Compared to the other habitats considered in this study, rhodolith beds occur at greater depths and are characterised by extensive interstitial spaces [57] that may buffer hydrodynamic stress and provide more stable microhabitats, potentially allowing greater energetic investment in body growth.
The largest degree of sexual dimorphism in body size in A. ramondi occurred in macroalgae-dominated reefs, where males were significantly larger than females. Macroalgae provide both shelter [58] and trophic resources supporting diverse and stable amphipod communities [59]. They are well-established facilitators of amphipod assemblages, with more diverse macroalgae-dominated reefs supporting higher biodiversity richness due to enhanced niche partitioning and habitat complexity [60]. The three-dimensional structure of macroalgae-dominated reefs promotes sediment accumulation and increases prey availability, benefiting both detritivorous and carnivorous species [61]. Amphipods often function as mesoherbivores, consuming macroalgae directly [62], and forming close associations with these habitats [63]. This pattern may reflect higher mating competition or more favourable energetic and ecological conditions for trait exaggeration in macroalgae-dominated reefs, which offer increased food resources, structural complexity, and refuge [60,61].

4.1. Sexual Selection, Trait Scaling, and Ecological Modulation

Allometric scaling of gnathopod 2 length in A. ramondi showed a consistent positive relationship with body size, with males tending toward slightly steeper scaling than females, although this difference was not statistically significant. This pattern suggests that males may invest relatively more in gnathopod 2 as a sexually selected trait, consistent with patterns reported in other amphipods and crustaceans [54]. Investment in gnathopod length relative to body size may be lower in individuals that prioritise overall body size, which can also influence reproductive success [19,64]. In contrast, C. acanthifera showed no significant differences in scaling relationships between sexes, and gnathopod lengths were more conserved across habitats. Limited sexual dimorphism in this species may reflect its generalist diet, including macroalgae, detritus, and epiphytes, potentially reducing the scope for resource monopolisation and male-specific trait exaggeration [65]. Unlike carrier species that grasp females by hooking unenlarged gnathopods under the coxae or anterior pereon segments, caprellid males typically guard mates by attending, i.e., maintaining close proximity, often by positioning themselves over the female or sharing her tube [54]. In these mate-guarding taxa, the enlarged gnathopods are held free and not used for grasping; instead, they are employed in mate takeovers, agonistic interactions, defence, and possibly to assess the female’s reproductive state through contact pheromones [54]. Due to their sedentary and often gregarious habits, attending males are not energetically burdened by physically carrying a mate, but since they remain close to the female and must actively defend her, there is selective pressure for mechanisms that signal dominance or reproductive quality [54]. As a result, some attending species exhibit strong sexual selection on exaggerated traits wherein some males monopolise females [55], and others defend mating clusters [66]. Several species evolve conspicuous weaponry on the gnathopods for use in fights, such as poison spines in Caprella gorgonia [67] or thumb-like projections in Dyopedos porrectus [68]. That both C. acanthifera and A. ramondi belong to mate-attending superfamilies (Caprellidea and Corophioidea, respectively) yet show contrasting levels of dimorphism suggests that even within a shared guarding strategy, habitat use, and competitive context can shape the strength and nature of sexual selection. These findings suggest that sexual dimorphism in Caprelloidea may be less labile or subject to different selective pressures compared to Corophioidea.

4.2. Ecological Complexity and Habitat Structure

A. ramondi and C. acanthifera share broadly similar feeding habits: both species rely heavily on detritus (over 65% of their diets), with A. ramondi supplementing its detritivorous diet with herbivory [69,70], while C. acanthifera consumes algae and exhibits omnivory [71]. Despite this dietary overlap, differences in mobility, microhabitat selection, male–male competition, and mating behaviour can influence the expression of sexually dimorphic traits. For instance, more mobile males may encounter mates more frequently and compete more intensely, selecting for larger gnathopods, whereas species with lower mobility or reduced mate competition may exhibit weaker sexual dimorphism. Thus, ecological and behavioural factors beyond diet are likely to shape the observed patterns of sexual dimorphism in these amphipods.
The four habitats studied—rhodolith beds, macroalgae-dominated reefs, seagrass meadows, and black coral forests—differ markedly in structural complexity, resource availability, and predator presence, all of which can influence amphipod behaviour and the expression of morphological traits. Macroalgae-dominated reefs exhibit fine-scale structural intricacy, providing abundant attachment sites and food resources [58]. This complexity likely increases male–female encounter rates, intensifies male–male competition, and favours the evolution of conspicuous or exaggerated male traits. Rhodolith beds, formed by free-living coralline algae, create three-dimensional matrices whose complexity varies with rhodolith size and aggregation [26]. These beds can support high amphipod densities and moderate encounter rates; however, spatial constraints may limit movement and reduce opportunities for males to monopolise mates. Seagrass meadows are highly productive but generally more homogeneous [33], offering limited refuge from predators and potentially reducing the intensity of sexual selection. Nevertheless, denser or more structurally complex seagrass meadows can support higher amphipod densities and species richness [27], indicating that structural complexity alone does not fully predict selective pressures on trait exaggeration.
Black coral forests are vertically stratified and structurally complex, forming numerous microhabitats atop rocky substrates [72]. Despite this complexity, high predator diversity and reduced light in deeper regions can constrain mate searching, favour cryptic behaviours, and moderate sexual selection intensity [37]. When sufficiently dense, these forests form aggregations known as ‘coral forests’ [73], which provide protection against currents and predation [74]. Overall, the influence of habitat on sexual dimorphism emerges from the interaction between structural complexity, resource distribution, predator presence, and species-specific behaviour. Consequently, habitat effects on trait exaggeration are likely variable across amphipod taxa, with some species expressing strong dimorphism under certain ecological contexts while others maintain more conserved trait patterns.

4.3. Future Directions

While this study demonstrates the influence of habitat and sex on amphipod morphological traits, incorporating adult sex ratio (ASR) would provide deeper insight into the demographic mechanisms driving sexual dimorphism. ASR, defined as the ratio of adult females to males in a population, is often used as a proxy for the strength and direction of sexual selection [75], and its variation across habitats may correlate with shifts in dimorphism intensity. For example, female-biased ASRs, potentially arising in energetically constrained or high-predation habitats, could lead to reduced male-male competition and diminished exaggeration of sexually selected traits [76]. Conversely, male-biased ASRs may amplify selection for competitive traits and accentuate dimorphism [76]. ASR could not be reliably calculated due to sampling limitations, including selective counts (e.g., stopping after obtaining enough males in A. ramondi) and damaged specimens that prevented sex identification and use in analysis.
As habitat structure shifts under ongoing environmental change, these alterations will reshape the ecological context in which sexual traits evolve. Seagrass meadows support diverse epifaunal communities as well as epiphytic macroalgae [77], are experiencing widespread decline at local, regional, and global scales [78]. In this context, tracking future trends in sexual dimorphism, and how such changes influence both population dynamics and life-history traits like mating behaviour and reproductive strategies, will be crucial. Temperature-dependent increases in amphipod metabolic rates can accelerate life-history traits such as growth and reproduction, potentially leading to faster age at sexual maturity and higher local population densities. These changes may influence the timing of male and female maturation, encounter rates, and the intensity of male–male competition or female mate choice, thereby modulating sexual selection and contributing to variation in sexual dimorphism. Future studies should examine how such temperature-driven effects shape sexual selection processes and dimorphism patterns across habitats.
A key limitation of this study is the absence of direct measurements of habitat complexity, which constrains our ability to explicitly link morphological variation to environmental structure. Future research should therefore include quantitative assessments of habitat complexity to better connect habitat heterogeneity with sexually dimorphic trait divergence.

5. Conclusions

Our findings show that sexual dimorphism in amphipod morphology varies between habitats and may be influenced by ecological context and sex-specific selective pressures, although these pressures were not directly measured. Ampithoe ramondi demonstrated clear sexual dimorphism in body length and gnathopod 2 length, with expression varying among habitats. In contrast, Caprella acanthifera showed weaker, more conserved patterns. Due to limited within-species comparisons across all four habitats and mixed patterns across traits, no uniform relationship could be established. The interaction between natural and sexual selection, modulated by habitat structure and possibly adult sex ratios, governs the expression of sexually dimorphic traits.
The inclusion of demographic, behavioural, and genetic variables in future studies will be essential to disentangle the selective pressures driving sexual dimorphism, such as mate competition, resource allocation, and predation risk. While sexual selection may not strongly drive adaptation under changing environmental conditions, it remains relevant. Environmental shifts can alter the costs of sexually selected traits, potentially leading to evolutionary hedging of those traits. Habitats such as seagrass meadows are often structurally simple, but can attain fine-scale complexity through epiphytic communities, including macroalgae, which increase surface area, enhance nutrient-rich food availability, provide habitat for epifauna, and modulate predation pressure [79,80]. Rhodolith beds too gain a secondary structural layer from epiphytic algae, creating a cascade effect that enhances habitat complexity. These epiphytes provide numerous microhabitats, refuge from predators, and a wider range of body sizes, reducing intra- and interspecific competition. Macroalgae-dominated reefs similarly form dense, structurally intricate habitats that trap sediment and detritus, supplying both physical structure and trophic resources. In contrast, black coral forests lack epiphytic layers, resulting in a more uniform and competitive environment. Accounting for these layered habitat components in future studies will be crucial for better understanding how habitat-specific factors influence the intensity and expression of sexual dimorphism.

Author Contributions

Conceptualization, A.D., F.T. and S.N.-M.; Methodology, A.D., S.N.-M., F.O.-F., F.T. and S.D.-V.; Validation, F.T. and S.N.-M.; Formal analysis, A.D.; Investigation, A.D.; Data curation, A.D.; Writing—original draft preparation, A.D.; Writing—review and editing, A.D., F.T., S.N.-M. and F.O.-F.; Visualisation, A.D.; Supervision, F.T. and S.N.-M.; Project administration, F.T. and S.N.-M. All authors have read and agreed to the published version of the manuscript.

Funding

This research received no external funding.

Institutional Review Board Statement

All procedures involving animals in this study were conducted in accordance with the ethical guidelines and regulations of Universidad de Las Palmas de Gran Canaria.

Data Availability Statement

All data and analysis scripts used in this study, including the final processed dataset and R scripts for analyses, are publicly available in the following GitHub repository: https://github.com/amey-danole/Habitat-driven-variation-in-sexual-dimorphism-of-amphipods (accessed on 15 April 2026).

Acknowledgments

We would like to sincerely thank Lucia Castillo and Benjamin Heather-Clark for their guidance, insightful discussions, and encouragement throughout the project, which were instrumental in shaping this study. We also thank the four anonymous reviewers, whose comments significantly improved the quality of this manuscript.

Conflicts of Interest

The authors declare no conflicts of interest. The funders had no role in the design of the study; in the collection, analyses, or interpretation of data; in the writing of the manuscript; or in the decision to publish the results.

Appendix A

Table A1. Sample sizes and functional trait measurements for Ampithoe ramondi and Caprella acanthifera across four benthic habitats around Gran Canaria. M = males, F = females. BL = body length (mm), Gn2 = gnathopod 2 length (mm). Values shown are the median BL, median Gn2, and the geometric mean of Gn2/BL.
HabitatSpeciesTotalMFBLGn2Gn2/BL
Rhodolith bedsAmpithoe ramondi2212106.3672.0400.305
Macroalgae-dominated reefsAmpithoe ramondi549453.2580.6300.196
Seagrass meadowsAmpithoe ramondi4112295.3371.1080.210
Black coral forestsCaprella acanthifera15693.2941.2940.377
Macroalgae-dominated reefsCaprella acanthifera346284.2050.7760.184
Table A2. Linear model results for Ampithoe ramondi body length as a function of sex and habitat. Control = Rhodolith beds, M = Macroalgae-dominated reefs, S = Seagrass meadows. Significance codes: *** p < 0.001, ** p < 0.01. Residual standard error = 2.027, Adjusted R 2 = 0.267, F-statistic = 9.46 on 5 and 111 DF, p = 1.555 × 10⁻⁷.
TermEstimateStd. Errort Valuep-Value
(Intercept)6.1850.6419.650<0.001 ***
Sex_labelMale0.3620.8680.4170.677
HabitatM−2.6360.709−3.7200.0003 ***
HabitatS−0.5650.743−0.7600.449
Sex_labelMale:HabitatM3.2741.1412.8710.0049 **
Sex_labelMale:HabitatS−0.4551.112−0.4090.683
Table A3. Beta regression results for Ampithoe ramondi gnathopod ratio as a function of sex and habitat (logit link). Control = Rhodolith beds, M = Macroalgae-dominated reefs, S = Seagrass meadows. Significance codes: *** p < 0.001, * p < 0.05. Model AIC = −356.5, BIC = −337.1, log-likelihood = 185.2, df.resid = 110.
TermEstimateStd. Errorz Valuep-Value
(Intercept)−1.1870.090−13.202<0.001 ***
Sex_labelMale0.7600.1156.619<0.001 ***
HabitatM−0.2120.100−2.1050.035 *
HabitatS−0.2560.106−2.4080.016 *
Sex_labelMale:HabitatM−0.6220.157−3.974<0.001 ***
Sex_labelMale:HabitatS−0.2010.149−1.3490.177
Table A4. Linear model results for Caprella acanthifera body length as a function of sex and habitat. Control = Macroalgae-dominated reefs, B = Black-coral forests. Significance codes: *** p < 0.001, ** p < 0.01. Residual standard error = 0.595 on 45 DF, R 2 = 0.418, Adjusted R 2 = 0.379, F(3,45) = 10.76, p = 1.875× 10⁻⁵.
TermEstimateStd. Errort Valuep-Value
(Intercept)4.0900.11236.389<0.001 ***
Sex_labelMale0.8850.2683.3060.002 **
HabitatB−0.8450.228−3.7090.001 ***
Sex_labelMale:HabitatB−0.3750.412−0.9100.368
Table A5. Beta regression results for Caprella acanthifera gnathopod ratio as a function of sex and habitat. Control = Macroalgae-dominated reefs, B = Black-coral forests. Significance codes: *** p < 0.001. Family = beta, link = logit, dispersion parameter = 118, AIC = −171.6, BIC = −162.2, logLik = 90.8, df.resid = 44.
TermEstimateStd. Errorz Valuep-Value
(Intercept)−1.5530.045−34.19<0.001 ***
Sex_labelMale0.5170.0965.38<0.001 ***
HabitatB1.0440.07813.45<0.001 ***
Sex_labelMale:HabitatB−0.4750.138−3.440.001 ***
Figure A1. Sexual Dimorphism Index (SDI) for Ampithoe ramondi in Rhodolith beds (R), Macroalgae-dominated reefs (M), and Seagrass meadows (S), and for Caprella acanthifera in Macroalgae-dominated reefs (M) and Black coral forests (B).
Diversity 18 00237 g0a1
Figure A2. Sex-specific allometry of gnathopod ratio versus body length across habitats for Ampithoe ramondi. Points represent individual measurements, with colors indicating sex (female: pink, male: blue). Linear-regression lines (±95% CI) are shown for each sex. Facets represent habitats (R: Rhodolith beds, M: Macroalgae-dominated reefs, S: Seagrass meadows).
Diversity 18 00237 g0a2
Figure A3. Sex-specific allometry of gnathopod ratio versus body length across habitats for Caprella acanthifera. Points represent individual measurements, with colors indicating sex (female: pink, male: blue). Linear-regression lines (±95% CI) are shown for each sex. Facets represent habitats (M: Macroalgae-dominated reefs, B: Black-coral forests).
Diversity 18 00237 g0a3
Figure A4. Spatial distribution of the sampling sites along the eastern coast of Gran Canaria overlaid on the average sea surface temperature (SST, °C) from 2018 to 2022, corresponding to the years of sampling. The SST values were derived from MODIS satellite observations at 4 km resolution. As shown, SST is relatively uniform across the study sites, indicating minimal variation in this key environmental variable.
Diversity 18 00237 g0a4

References

  1. Shine, R. Ecological causes for the evolution of sexual dimorphism: A review of the evidence. Q. Rev. Biol. 1989, 64, 419–461. [Google Scholar] [CrossRef] [Scilit] [PubMed]
  2. Andersson, M. Sexual Selection; Princeton University Press: Princeton, NJ, USA, 1994. [Google Scholar]
  3. Stillwell, R.C.; Blanckenhorn, W.U.; Teder, T.; Davidowitz, G.; Fox, C.W. Sex differences in phenotypic plasticity affect variation in sexual size dimorphism in insects: From physiology to evolution. Annu. Rev. Entomol. 2010, 55, 227–245. [Google Scholar] [CrossRef] [Scilit]
  4. Endler, J.A. Signals, signal conditions, and the direction of evolution. Am. Nat. 1992, 139, S125–S153. [Google Scholar] [CrossRef] [Scilit]
  5. Clutton-Brock, T. Sexual selection in males and females. Science 2007, 318, 1882–1885. [Google Scholar] [CrossRef] [Scilit]
  6. Darwin, C. The Descent of Man, and Selection in Relation to Sex; John Murray: London, UK, 1871; Volume 1. [Google Scholar]
  7. Lande, R. Sexual dimorphism, sexual selection, and adaptation in polygenic characters. Evolution 1980, 34, 292–305. [Google Scholar] [CrossRef] [Scilit]
  8. Ford, S.M. Evolution of sexual dimorphism in body weight in platyrrhines. Am. J. Primatol. 1994, 34, 221–244. [Google Scholar] [CrossRef] [Scilit] [PubMed]
  9. Geist, V.; Bayer, M. Sexual dimorphism in the Cervidae and its relation to habitat. J. Zool. 1988, 214, 45–53. [Google Scholar] [CrossRef] [Scilit]
  10. Cleasby, I.R.; Wakefield, E.D.; Bodey, T.W.; Davies, R.D.; Patrick, S.C.; Newton, J.; Votier, S.C.; Bearhop, S.; Hamer, K.C. Sexual segregation in a wide-ranging marine predator is a consequence of habitat selection. Mar. Ecol. Prog. Ser. 2015, 518, 1–12. [Google Scholar] [CrossRef] [Scilit]
  11. Losos, J.B.; Butler, M. Sexual Dimorphism in Body Size and Shape in Relation to Habitat Use among. In Lizard Social Behavior; JHU Press: Baltimore, MD, USA, 2003; p. 356. [Google Scholar]
  12. Wikelski, M.; Trillmich, F. Body size and sexual size dimorphism in marine iguanas fluctuate as a result of opposing natural and sexual selection: An island comparison. Evolution 1997, 51, 922–936. [Google Scholar] [CrossRef] [Scilit]
  13. Arfianti, T.; Wilson, S.; Costello, M.J. Progress in the discovery of amphipod crustaceans. PeerJ 2018, 6, e5187. [Google Scholar] [CrossRef] [Scilit]
  14. Horton, T.; De Broyer, C.; Bellan-Santini, D.; Coleman, C.O.; Copilaș-Ciocianu, D.; Corbari, L.; Daneliya, M.E.; Dauvin, J.C.; Decock, W.; Fanini, L.; et al. The World Amphipoda Database: History and progress. Aust. Mus. 2023, 75, 329–342. [Google Scholar] [CrossRef] [Scilit]
  15. Lowry, J.K.; Myers, A.A. A phylogeny and classification of the Amphipoda with the establishment of the new order Ingolfiellida (Crustacea: Peracarida). Zootaxa 2017, 4265, 1–89. [Google Scholar] [CrossRef] [Scilit]
  16. Copilaș-Ciocianu, D.; Boros, B.V.; Šidagytė-Copilas, E. Morphology mirrors trophic niche in a freshwater amphipod community. Freshw. Biol. 2021, 66, 1968–1979. [Google Scholar] [CrossRef] [Scilit]
  17. Lolas, A.; Vafidis, D. Population dynamics of two caprellid species (Crustaceae: Amphipoda: Caprellidae) from shallow hard bottom assemblages. Mar. Biodivers. 2013, 43, 227–236. [Google Scholar] [CrossRef] [Scilit]
  18. Hume, K.D.; Elwood, R.W.; Dick, J.T.; Morrison, J. Sexual dimorphism in amphipods: The role of male posterior gnathopods revealed in Gammarus pulex. Behav. Ecol. Sociobiol. 2005, 58, 264–269. [Google Scholar] [CrossRef] [Scilit]
  19. Wellborn, G.A. Selection on a sexually dimorphic trait in ecotypes within the Hyalella azteca species complex (Amphipoda: Hyalellidae). Am. Midl. Nat. 2000, 143, 212–225. [Google Scholar] [CrossRef] [Scilit]
  20. Takeshita, F.; Wada, S. Morphological comparison of the second gnathopod in males of four caprellid species (Amphipoda: Caprellidae). J. Crustac. Biol. 2012, 32, 673–676. [Google Scholar] [CrossRef] [Scilit]
  21. Darwin, T.J.; Krapp-Schickel, T. A new species of leucothoid amphipod, Anamixis bananarama, sp. n., from shallow coral reefs in French Polynesia (Crustacea, Amphipoda, Leucothoidae). ZooKeys 2011, 1–8. [Google Scholar] [CrossRef] [Scilit]
  22. Thomas, J.D.; Klebba, K.N. New species and host associations of commensal leucothoid amphipods from coral reefs in Florida and Belize (Crustacea: Amphipoda). Zootaxa 2007, 1494, 1. [Google Scholar] [CrossRef] [Scilit]
  23. Longo, S.; Ray, W.; Farley, G.; Harrison, J.; Jorge, J.; Kaji, T.; Palmer, A.R.; Patek, S. Snaps of a tiny amphipod push the boundary of ultrafast, repeatable movement. Curr. Biol. 2021, 31, R116–R117. [Google Scholar] [CrossRef] [Scilit] [PubMed]
  24. Wellborn, G.A. Trade-off between competitive ability and antipredator adaptation in a freshwater amphipod species complex. Ecology 2002, 83, 129–136. [Google Scholar] [CrossRef]
  25. Wellborn, G.A.; Bartholf, S.E. Ecological context and the importance of body and gnathopod size for pairing success in two amphipod ecomorphs. Oecologia 2005, 143, 308–316. [Google Scholar] [CrossRef] [Scilit]
  26. Navarro-Mayoral, S.; Fernandez-Gonzalez, V.; Otero-Ferrer, F.; Tuya, F. Spatio-temporal variability of amphipod assemblages associated with rhodolith seabeds. Mar. Freshw. Res. 2020, 72, 76–83. [Google Scholar] [CrossRef] [Scilit]
  27. Navarro-Mayoral, S.; Tuya, F.; Prado, P.; Marco-Méndez, C.; Fernandez-Gonzalez, V.; Fernández-Torquemada, Y.; Espino, F.; de la Ossa, J.A.; Vilella, D.M.; Machado, M.; et al. Drivers of variation in seagrass-associated amphipods across biogeographical areas. Mar. Environ. Res. 2023, 186, 105918. [Google Scholar] [CrossRef] [Scilit]
  28. Navarro-Mayoral, S.; Díaz-Vergara, S.; Bosch, N.E.; Tuya, F.; Bramanti, L.; Fernandez-Gonzalez, V.; Terrana, L.; Espino, F.; Haroun, R.; Otero-Ferrer, F. Inside the mesophotic zone: Taxonomic and trait diversity of epifauna associated with black coral forests across an oceanic archipelago. Coral Reefs 2025, 44, 1683–1701. [Google Scholar] [CrossRef] [Scilit]
  29. Premate, E.; Fišer, Ž.; Biró, A.; Copilaş-Ciocianu, D.; Fromhage, L.; Jennions, M.; Borko, Š.; Herczeg, G.; Balázs, G.; Kralj-Fišer, S.; et al. Sexual dimorphism in subterranean amphipod crustaceans covaries with subterranean habitat type. J. Evol. Biol. 2024, 37, 487–500. [Google Scholar] [CrossRef] [Scilit]
  30. Bosch, N.E.; Espino, F.; Tuya, F.; Haroun, R.; Bramanti, L.; Otero-Ferrer, F. Black coral forests enhance taxonomic and functional distinctiveness of mesophotic fishes in an oceanic island: Implications for biodiversity conservation. Sci. Rep. 2023, 13, 4963. [Google Scholar] [CrossRef] [Scilit]
  31. Pérez-Peris, I.; Navarro-Mayoral, S.; de Esteban, M.C.; Tuya, F.; Peña, V.; Barbara, I.; Neves, P.; Ribeiro, C.; Abreu, A.; Grall, J.; et al. Effect of depth across a latitudinal gradient in the structure of rhodolith seabeds and associated biota across the eastern Atlantic Ocean. Diversity 2023, 15, 103. [Google Scholar] [CrossRef] [Scilit]
  32. Alfonso, B.; Hernández, J.C.; Sangil, C.; Martín, L.; Expósito, F.J.; Díaz, J.P.; Sansón, M. Fast climatic changes place an endemic Canary Island macroalga at extinction risk. Reg. Environ. Change 2021, 21, 113. [Google Scholar] [CrossRef] [Scilit]
  33. Barbera, C.; Tuya, F.; Boyra, A.; Sanchez-Jerez, P.; Blanch, I.; Haroun, R.J. Spatial variation in the structural parameters of Cymodocea nodosa seagrass meadows in the Canary Islands: A multiscaled approach. Bot. Mar. (Print) 2005, 48, 122–126. [Google Scholar] [CrossRef] [Scilit]
  34. Fernandez-Gonzalez, V.; Navarro-Mayoral, S.; Sanchez-Jerez, P. Connectivity patterns for direct developing invertebrates in fragmented marine habitats: Fish farms fouling as source population in the establishment and maintenance of local metapopulations. Front. Mar. Sci. 2021, 8, 785260. [Google Scholar] [CrossRef] [Scilit]
  35. Kabus, J.; Schaub, C.; Fritsche, D.; Cocchiararo, B.; Fišer, C.; Grabowski, M.; Karaouzas, I.; Shumka, S.; Jourdan, J. Morphological crypsis within a crustacean species complex is driven by within-species phenotypic diversification. Sci. Rep. 2025, 15, 43020. [Google Scholar] [CrossRef] [Scilit]
  36. Song, C.; Wang, Y.; Sha, Z. Redescription of the species Caprella algaceus Vassilenko, 1967 (Amphipoda, Caprellidae) based on a new record from the Yellow Sea, PR China, using an integrated approach. Crustaceana 2025, 98, 927–951. [Google Scholar] [CrossRef] [Scilit]
  37. Navarro-Mayoral, S.; Gouillieux, B.; Fernandez-Gonzalez, V.; Tuya, F.; Lecoquierre, N.; Bramanti, L.; Terrana, L.; Espino, F.; Flot, J.F.; Haroun, R.; et al. “Hidden” biodiversity: A new amphipod genus dominates epifauna in association with a mesophotic black coral forest. Coral Reefs 2024, 43, 655–672. [Google Scholar] [CrossRef] [Scilit]
  38. Smith, A.; Jackson, D.W.; Cooper, J.A.G.; Beyers, M.; Breen, C. Whole-island wind bifurcation and localized topographic steering: Impacts on aeolian dune dynamics. Sci. Total Environ. 2021, 763, 144444. [Google Scholar] [CrossRef] [Scilit]
  39. Ortiz, J.; Arístegui, J.; Hernández-Hernández, N.; Fernández-Méndez, M.; Riebesell, U. Oligotrophic phytoplankton community effectively adjusts to artificial upwelling regardless of intensity, but differently among upwelling modes. Front. Mar. Sci. 2022, 9, 880550. [Google Scholar]
  40. Wagner, D.; Luck, D.G.; Toonen, R.J. The biology and ecology of black corals (Cnidaria: Anthozoa: Hexacorallia: Antipatharia). Adv. Mar. Biol. 2012, 63, 67–132. [Google Scholar]
  41. Bellan-Santini, D.; Karaman, G.; Krapp-Schickel, G.; Ledoyer, M.; Myers, A.; Ruffo, S.; Schiecke, U. The Amphipoda of the Mediterranean. Part 1: Gammaridae (Acanthonotozomatidae to Gammaridae); Musee Oceanographique: Monaco, 1982. [Google Scholar]
  42. Bellan-Santini, D.; Diviacco, G.; Krapp-Schickel, G.; Ruffo, S. The Amphipoda of the Mediterranean. Part 2. Gammaridea (Haustoriidae to Lysianassidae); Musee Oceanographique: Monaco, 1989. [Google Scholar]
  43. Bellan-Santini, D.; Karaman, G.; Krapp-Schickel, G.; Ledoyer, M.; Ruffo, S. The Amphipoda of the Mediterranean. Part 3: Gammaridea (Melphidippidae to Talitridae), Ingolfiellidea, Caprellidea; Musee Oceanographique: Monaco, 1993. [Google Scholar]
  44. Bellan-Santini, D.; Karaman, G.; Ledoyer, M.; Myers, A.; Ruffo, S.; Vader, W. The Amphipoda of the Mediterranean. Part 4: Localities and Map, Addenda to Parts 1–3, Key to Families, Ecology, Faunistics and Zoogeography, Bibliography, Index; Musee Oceanographique: Monaco, 1998. [Google Scholar]
  45. Guerra-García, J.; Takeuchi, I. The Caprellidea (Crustacea: Amphipoda) from Ceuta, North Africa, with the description of three species of Caprella, a key to the species of Caprella, and biogeographical discussion. J. Nat. Hist. 2002, 36, 675–713. [Google Scholar] [CrossRef] [Scilit]
  46. Schneider, C.A.; Rasband, W.S.; Eliceiri, K.W. NIH Image to ImageJ: 25 years of image analysis. Nat. Methods 2012, 9, 671–675. [Google Scholar] [CrossRef] [Scilit]
  47. Wilhelm, F.M.; Lasenby, D.C. Seasonal trends in the head capsule length and body length/weight relationships of two amphipod species. Crustaceana 1998, 71, 399–410. [Google Scholar] [CrossRef] [Scilit]
  48. Lovich, J.E.; Gibbons, J.W. A review of techniques for quantifying sexual size dimorphism. Growth Dev. Aging GDA 1992, 56, 269–281. [Google Scholar]
  49. R Core Team. R: A Language and Environment for Statistical Computing; R Foundation for Statistical Computing: Vienna, Austria, 2024. [Google Scholar]
  50. Brooks, M.E.; Kristensen, K.; van Benthem, K.J.; Magnusson, A.; Berg, C.W.; Nielsen, A.; Skaug, H.J.; Maechler, M.; Bolker, B.M. glmmTMB balances speed and flexibility among packages for zero-inflated generalized linear mixed modeling. R J. 2017, 9, 378–400. [Google Scholar] [CrossRef] [Scilit]
  51. Hartig, F. DHARMa: Residual Diagnostics for Hierarchical (Multi-Level/Mixed) Regression Models; R package version 0.4.7; R Foundation for Statistical Computing: Vienna, Austria, 2024. [Google Scholar]
  52. Lenth, R. emmeans: Estimated Marginal Means, Aka Least-Squares Means; R package version 1.11.1; R Foundation for Statistical Computing: Vienna, Austria, 2025. [Google Scholar]
  53. Wickham, H. ggplot2: Elegant Graphics for Data Analysis; Springer: Berlin/Heidelberg, Germany, 2016. [Google Scholar]
  54. Conlan, K.E. Precopulatory mating behavior and sexual dimorphism in the amphipod Crustacea. Hydrobiologia 1991, 223, 255–282. [Google Scholar] [CrossRef] [Scilit]
  55. Borowsky, B.; Borowsky, R. The reproductive behaviors of the amphipod crustacean Gammarus palustris (Bousfield) and some insights into the nature of their stimuli. J. Exp. Mar. Biol. Ecol. 1987, 107, 131–144. [Google Scholar] [CrossRef] [Scilit]
  56. Bazikalova, A.Y. Taxonomy, ecology, and distribution of genera Micruropus Stebbing and Pseudomicruropus nov. gen. (Amphipoda; Gammaridea). Tr. Limnol. Inst. Akad. Nauk SSSR Sib. Otd 1962, 2, 3–140. [Google Scholar]
  57. Cabrito, A.; de Juan, S.; Hinz, H.; Maynou, F. Morphological insights into the three-dimensional complexity of rhodolith beds. Mar. Biol. 2024, 171, 127. [Google Scholar] [CrossRef] [Scilit]
  58. Lippert, H.; Iken, K.; Rachor, E.; Wiencke, C. Macrofauna associated with macroalgae in the Kongsfjord (Spitsbergen). Polar Biol. 2001, 24, 512–522. [Google Scholar] [CrossRef] [Scilit]
  59. Hughes, A.R.; Stachowicz, J.J. Genetic diversity enhances the resistance of a seagrass ecosystem to disturbance. Proc. Natl. Acad. Sci. USA 2004, 101, 8998–9002. [Google Scholar] [CrossRef] [Scilit] [PubMed]
  60. Ferreira, A.P.; Jacobucci, G.B.; Leite, F.P.P. Title TBD. 2025; in press.
  61. Edgar, G.J.; Aoki, M. Resource limitation and fish predation: Their importance to mobile epifauna associated with Japanese Sargassum. Oecologia 1993, 95, 122–133. [Google Scholar] [CrossRef] [Scilit] [PubMed]
  62. Poore, A.G.; Campbell, A.H.; Coleman, R.A.; Edgar, G.J.; Jormalainen, V.; Reynolds, P.L.; Sotka, E.E.; Stachowicz, J.J.; Taylor, R.B.; Vanderklift, M.A.; et al. Global patterns in the impact of marine herbivores on benthic primary producers. Ecol. Lett. 2012, 15, 912–922. [Google Scholar] [CrossRef] [Scilit]
  63. Leite, F.P.P.; Tanaka, M.O.; Gebara, R.S. Structural variation in the brown alga Sargassum cymosum and its effects on associated amphipod assemblages. Braz. J. Biol. 2007, 67, 215–221. [Google Scholar] [CrossRef] [Scilit] [PubMed]
  64. Clutton-Brock, T. The functions of antlers. Behaviour 1982, 79, 108–124. [Google Scholar] [CrossRef] [Scilit]
  65. Cruz-Rivera, E.; Hay, M.E. The effects of diet mixing on consumer fitness: Macroalgae, epiphytes, and animal matter as food for marine amphipods. Oecologia 2000, 123, 252–264. [Google Scholar] [CrossRef] [Scilit]
  66. Emlen, S.T.; Oring, L.W. Ecology, sexual selection, and the evolution of mating systems. Science 1977, 197, 215–223. [Google Scholar] [CrossRef] [Scilit]
  67. Lewbel, G.S. Sexual dimorphism and intraspecific aggression, and their relationship to sex ratios in Caprella gorgonia Laubitz & Lewbel (Crustacea: Amphipoda: Caprellidae). J. Exp. Mar. Biol. Ecol. 1978, 33, 133–151. [Google Scholar] [CrossRef] [Scilit]
  68. Mattson, S.; Cedhagen, T. Aspects of the behaviour and ecology of Dyopedos monacanthus (Metzger) and D. porrectus Bate, with comparative notes on Dulichia tuberculata Boeck (Crustacea: Amphipoda: Podoceridae). J. Exp. Mar. Biol. Ecol. 1989, 127, 253–272. [Google Scholar] [CrossRef] [Scilit]
  69. Castejón-Silvo, I.; Jaume, D.; Terrados, J. Feeding Preferences of Amphipod Crustaceans Ampithoe ramondi and Gammarella fucicola for Posidonia Oceanica Seeds and Leaves; CSIC-Instituto de Ciencias del Mar (ICM): Barcelona, Spain, 2019. [Google Scholar]
  70. Guerra-García, J.M.; Martínez-Pita, I.; Pita, M.L. Fatty acid composition of the Caprellidea (Crustacea: Amphipoda) from the Strait of Gibraltar. Sci. Mar. 2004, 68, 501–510. [Google Scholar] [CrossRef] [Scilit]
  71. Michel, L.N.; Dauby, P.; Gobert, S.; Graeve, M.; Nyssen, F.; Thelen, N.; Lepoint, G. Dominant amphipods of Posidonia oceanica seagrass meadows display considerable trophic diversity. Mar. Ecol. 2015, 36, 969–981. [Google Scholar] [CrossRef] [Scilit]
  72. Czechowska, K.; Feldens, P.; Tuya, F.; Cosme de Esteban, M.; Espino, F.; Haroun, R.; Otero-Ferrer, F. Testing side-scan sonar and multibeam echosounder to study black coral gardens: A case study from Macaronesia. Remote Sens. 2020, 12, 3244. [Google Scholar] [CrossRef] [Scilit]
  73. Rossi, S.; Bramanti, L.; Gori, A.; Orejas, C. An overview of the animal forests of the world. In Marine Animal Forests: The Ecology of Benthic Biodiversity Hotspots; Rossi, S., Bramanti, L., Gori, A., Orejas, C., Eds.; Springer: Berlin/Heidelberg, Germany, 2017; pp. 1–28. [Google Scholar]
  74. Buhl-Mortensen, L.; Buhl-Mortensen, P.; Rungruangsak-Torrissen, K.; Schwach, V.; Hjort, J.; Jakobsen, T.; Toresen, R. Cold temperate coral habitats. In Corals in a Changing World; 2018; Volume 9. [Google Scholar]
  75. Janicke, T.; Morrow, E.H. Operational sex ratio predicts the opportunity and direction of sexual selection across animals. Ecol. Lett. 2018, 21, 384–391. [Google Scholar] [CrossRef] [Scilit]
  76. Kokko, H.; Jennions, M.D. Parental investment, sexual selection and sex ratios. J. Evol. Biol. 2008, 21, 919–948. [Google Scholar] [CrossRef] [Scilit] [PubMed]
  77. Tuya, F.; Png Gonzalez, L.; Riera, R.; Haroun, R.; Espino, F. Ecological structure and function differs between habitats dominated by seagrasses and green seaweeds. Mar. Environ. Res. 2014, 98, 1–13. [Google Scholar] [CrossRef] [Scilit] [PubMed]
  78. Tuya, F.; Ribeiro-Leite, L.; Arto-Cuesta, N.; Coca, J.; Haroun, R.; Espino, F. Decadal changes in the structure of Cymodocea nodosa seagrass meadows: Natural vs. human influences. Estuarine Coast. Shelf Sci. 2014, 137, 41–49. [Google Scholar] [CrossRef] [Scilit]
  79. Leber, K.M. The influence of predatory decapods, refuge, and microhabitat selection on seagrass communities. Ecology 1985, 66, 1951–1964. [Google Scholar] [CrossRef] [Scilit]
  80. Moksnes, P.O.; Gullström, M.; Tryman, K.; Baden, S. Trophic cascades in a temperate seagrass community. Oikos 2008, 117, 763–777. [Google Scholar] [CrossRef] [Scilit]
Figure 1. (a) The Canary Islands Archipelago (28.292° N, 16.629° W) lies in the Atlantic Ocean off northwestern Africa. (b) Gran Canaria (27.9202° N, 15.5474° W) is located approximately 150 km from the Moroccan coast; sampling was focused on the eastern shore (grey inset). (c) Map of sampling sites across four benthic habitats—black coral forests, macroalgae-dominated reefs, rhodolith beds, and seagrass meadows—surveyed at five distinct locations along the eastern coast of Gran Canaria, viz. Jinámar, Tufia, Gando, Risco Verde, and Arinaga (from north to south), with a maximum distance of around 21 km between Jinámar in the north and Arinaga in the southeast. (d) Representative habitat images: (i) black coral forests, (ii) macroalgae-dominated reefs, (iii) seagrass meadows, and (iv) rhodolith beds, photographed at study sites around Gran Canaria (photo credit: Franck Gazzola and Fernando Espino).
Diversity 18 00237 g001
Figure 2. Images illustrating body length (panels (a,c)) and gnathopod 2 length (panels (b,d)) measurements for a male Ampithoe ramondi (a,b) and Caprella acanthifera (c,d) individual. White column-like features visible near the centre of panels (c,d) are instrumental artefacts.
Diversity 18 00237 g002
Figure 3. Relationship between log-transformed body length and log-transformed gnathopod 2 length for Ampithoe ramondi and Caprella acanthifera. Points represent individual measurements and shaded areas represent 95% confidence intervals. Regression statistics are as follows: A. ramondi females (intercept = −1.57, 95% CI [−1.71, −1.43]; slope = 0.95, 95% CI [0.86, 1.04]; r = 0.91, n = 84, p < 0.001); A. ramondi males (intercept = −1.37, 95% CI [−1.98, −0.76]; slope = 1.08, 95% CI [0.74, 1.42]; r = 0.76, n = 33, p < 0.001); C. acanthifera females (intercept = −0.20, 95% CI [−1.06, 0.67]; slope = −0.03, 95% CI [−0.67, 0.61]; r = 0.01, n = 37, p = 0.931); C. acanthifera males (intercept = −0.65, 95% CI [−1.90, 0.60]; slope = 0.65, 95% CI [−0.20, 1.50]; r = 0.48, n = 12, p = 0.119). Data represent all individuals sampled across all habitats.
Diversity 18 00237 g003
Figure 4. Box plot showing body length differences between females (pink) and males (blue) of Ampithoe ramondi across rhodolith beds, macroalgae-dominated reefs, and seagrass meadows. Different letters above boxes indicate significant differences ( p < 0.05 ) based on Tukey’s HSD post hoc tests; groups sharing a letter are not statistically different. Sample sizes (F = female, M = male) for each habitat are as follows: rhodolith beds—F = 10, M = 12; macroalgae-dominated reefs—F = 45, M = 9; seagrass meadows—F = 29, M = 12.
Diversity 18 00237 g004
Figure 5. Box plot showing gnathopod ratio differences between females (pink) and males (blue) of Ampithoe ramondi in rhodolith beds, macroalgae-dominated reefs and seagrass meadows. Different letters above boxes indicate significant differences ( p < 0.05 ) based on Tukey’s HSD post hoc tests; groups sharing a letter are not statistically different. Sample sizes for each species and sex are provided in Figure 4.
Diversity 18 00237 g005
Figure 6. Box plot showing body length differences between females (pink) and males (blue) of Caprella acanthifera in macroalgae-dominated reefs and black coral forests. Different letters above boxes indicate significant differences ( p < 0.05 ) based on Tukey’s HSD post hoc tests; groups sharing a letter are not statistically different. Sample sizes for each habitat are as follows (F = female, M = male): Macroalgae-dominated reefs—F = 28, M = 6; Black coral forest—F = 9, M = 6.
Diversity 18 00237 g006
Figure 7. Box plot showing gnathopod ratio differences between females (pink) and males (blue) of Caprella acanthifera in macroalgae-dominated reefs and black coral forests. Different letters above boxes indicate significant differences ( p < 0.05 ) based on Tukey’s HSD post hoc tests; groups sharing a letter are not statistically different. Sample sizes for each species and sex are provided in Figure 6.
Diversity 18 00237 g007
Disclaimer/Publisher’s Note: The statements, opinions and data contained in all publications are solely those of the individual author(s) and contributor(s) and not of MDPI and/or the editor(s). MDPI and/or the editor(s) disclaim responsibility for any injury to people or property resulting from any ideas, methods, instructions or products referred to in the content.