Article

Bleaching Impacts on the Last Remaining Acropora-dominated Reefs in the United Arab Emirates

by
Jeneen Hadj-Hammou
1,2,
Aaron Bartholomew
3,*,
Rita C. Bento
1,
Fatima A. Mohamed
4,
Geórgenes H. Cavalcante
1,5 and
John A. Burt
1
1
Mubadala Arabian Center for Climate and Environmental Sciences (Mubadala ACCESS), New York University Abu Dhabi, Abu Dhabi P.O. Box 129188, United Arab Emirates
2
The International Institute for Environment and Development, Southampton Buildings, London WC2A 1AP, UK
3
Department of Biology, Chemistry and Environmental Sciences, College of Arts and Sciences, American University of Sharjah, Sharjah P.O. Box 26666, United Arab Emirates
4
Sharjah EPAA, Sharjah Desert Park, Al Dhaid Road, Interchange #9, Sharjah P.O. Box 26661, United Arab Emirates
5
Institute of Atmospheric Science, Universidade Federal de Alagoas, Maceio 57072-970, Alagoas, Brazil
*
Author to whom correspondence should be addressed.
Diversity 2025, 17(9), 610; https://doi.org/10.3390/d17090610
Submission received: 14 June 2025 / Revised: 25 August 2025 / Accepted: 26 August 2025 / Published: 29 August 2025
(This article belongs to the Special Issue Coral Reef Biodiversity Conservation and Ecological Rehabilitation)

Abstract

Coral reefs in Arabian Gulf and Gulf of Oman waters of the United Arab Emirates (UAE) have historically been dominated by Acropora corals. By early 2021, however, extensive Acropora cover remained at only two UAE locations: the fringing reefs of Sir Bu Nair Island (SBN) (Arabian Gulf) and Khor Fakkan (KF) (Gulf of Oman). A summer 2021 marine heatwave impacted these last Acropora refugia and caused the first mass bleaching event on the UAE’s Gulf of Oman coast. Benthic surveys were conducted before, during and eight months after this event. Bleaching severity was high, with 41% of hard corals bleached in KF and 93% in SBN. Total live coral cover declined from 68% to 25% at KF and from 36% to 9% in SBN during bleaching. Acropora cover declined from 23% to 2% in KF and from 19% to 0.02% in SBN during bleaching. There was limited recovery eight months after bleaching. Community composition shifted away from Acropora toward heat-tolerant taxa, particularly Porites and Dipsastraea, with increased homogenization of coral assemblages. These last Acropora refugia could have served as valuable sources of larvae to support coral recovery elsewhere in UAE waters, highlighting the importance of conservation and restoration efforts.

1. Introduction

The United Arab Emirates (UAE) has coastlines bordering the southern Arabian/Persian Gulf (hereafter referred to as the Arabian Gulf) and the Gulf of Oman. Both coastlines have supported extensive coral reefs in the recent past [1,2]. Until the mid-1990s, Arabian Gulf reefs were dominated by structurally complex, branching table corals (Acropora) [3], and Acropora was also abundant on some of the reefs along the Gulf of Oman coast [1]. Since then, coral reefs on the UAE’s Arabian Gulf coast have become increasingly degraded due to a combination of localized coastal development and widespread impacts from bleaching. Early bleaching events were recorded in 1996, 1998 and 2002 [4,5], and there have been moderate-to-severe bleaching events in the summers of 2010, 2011, 2012, 2017 and 2021 [3,6,7]. Currently, the shallow nearshore reefs of the UAE’s Arabian Gulf coast are considered to be in a condition of near-collapse, as coral cover has declined by over 80% on most reefs in the past decade [3].
Bleaching events typically reduce coral community diversity [8,9] and drive community shifts towards more thermotolerant species [10,11,12,13]. This has been observed in the southern Arabian Gulf, where less thermotolerant taxa have declined or been lost, and only the most stress-resistant species, such as those in the families Poritidae and Merulinidae, persist [2,7]. Acropora table corals are particularly vulnerable to environmental stress and bleaching [14,15]; these once-dominant taxa were recently declared to be “functionally extinct” in the region [3]. Their loss is significant, as Acropora are fast-growing, reef-building corals that provide valuable habitat for a variety of reef-associated species due to their complex, branching growth forms [14,16].
Corals in the UAE’s Arabian Gulf experience extreme environmental conditions, including high salinity, high summer temperatures and large annual temperature variations [17]. In contrast, conditions on the UAE’s Gulf of Oman coast are similar to typical tropical oceans [17], supporting considerably higher coral species richness [2]. Until recently, coral bleaching had not been documented on the UAE’s Gulf of Oman coast. However, these reefs experienced severe disturbance from tropical cyclone Gonu in 2007, which caused fragmentation and breakage of branching Pocillopora and Acropora corals [1]. This was followed by a large-scale harmful algal bloom (HAB) in 2008–2009, resulting in further losses of these taxa [1,18]. Surveys conducted in the early 2010’s indicated that isolated coral recovery was occurring [19].
At the beginning of 2021, extensive Acropora cover remained at only two locations in the UAE. The first was Sir Bu Nair Island (SBN), located 70 km offshore from the UAE mainland in the Arabian Gulf [20]. Acropora have persisted here due to the buffering effect of deeper, cooler waters surrounding the island, which mitigate extreme summer temperatures [20,21] and because the island lies within a well-enforced protected area with limited human disturbances, including coastal development [20]. The second location was in Khor Fakkan, on the UAE’s Gulf of Oman coast, where corals were able to recover following cyclone Gonu, and the reefs’ southern location lay beyond the spatial extent of the HAB that affected reefs further north [2].
In the spring of 2021, we surveyed three sites at both SBN and Khor Fakkan as part of a reef biodiversity assessment for the Emirate of Sharjah. In the summer of 2021, a regional-scale marine heat wave caused widespread bleaching at both locations, making it the first ever bleaching event recorded on the UAE’s Gulf of Oman coast. The same sites were resurveyed during the bleaching event and again eight months later to document the impacts of bleaching on the UAE’s last remaining Acropora strongholds. This study describes coral community transitions from their pre-bleaching state in early 2021, through the bleaching event itself, to limited recovery in the spring of 2022. Our findings provide insight into shifts in coral community structure associated with bleaching and inform management interventions aimed at supporting reef recovery in the UAE.

2. Materials and Methods

2.1. Study Sites

Three sites were surveyed at both Sir Bu Nair and Khor Fakkan before (11–18 May 2021), during (4–19 September 2021) and after (4 May–9 June 2022) the 2021 bleaching event. All surveys were conducted on consistently shallow reef communities of 2 to 7 m depth.
SBN has been recognized as a site of high conservation importance, with extensive Acropora that could have served as a source of larvae to support recovery of degraded reefs elsewhere along the southern Arabian Gulf coast [20,22]. Previous work at SBN described Acropora-dominated reefs largely restricted to the northern, western and southern portions of the island, where wind-driven swells created conditions suitable for coral growth [20]. Coral surveys were conducted in each of these locations (Figure 1; SBN-N: N 25.258740, E 054.20809, SBN-W: N 25.24414, E 054.19723, SBN-S: N 25.21504, E 054.22265).
The Khor Fakkan reefs are well known to the recreational diving community for having some of the most diverse and abundant coral communities in the UAE [23] Acropora were dominant or important on many Khor Fakkan reefs but were comparatively limited on other high-cover reefs that were characterized by different coral taxa [2]. Three reef locations on the Gulf of Oman coast were included in this study: Martini Wall (N 25.33904, E 056.37819), Martini Bay (N 25.33492, E 056.37917) and Shark Island (N 25.35151, E 056.37575) (Figure 1).

2.2. Data Collection

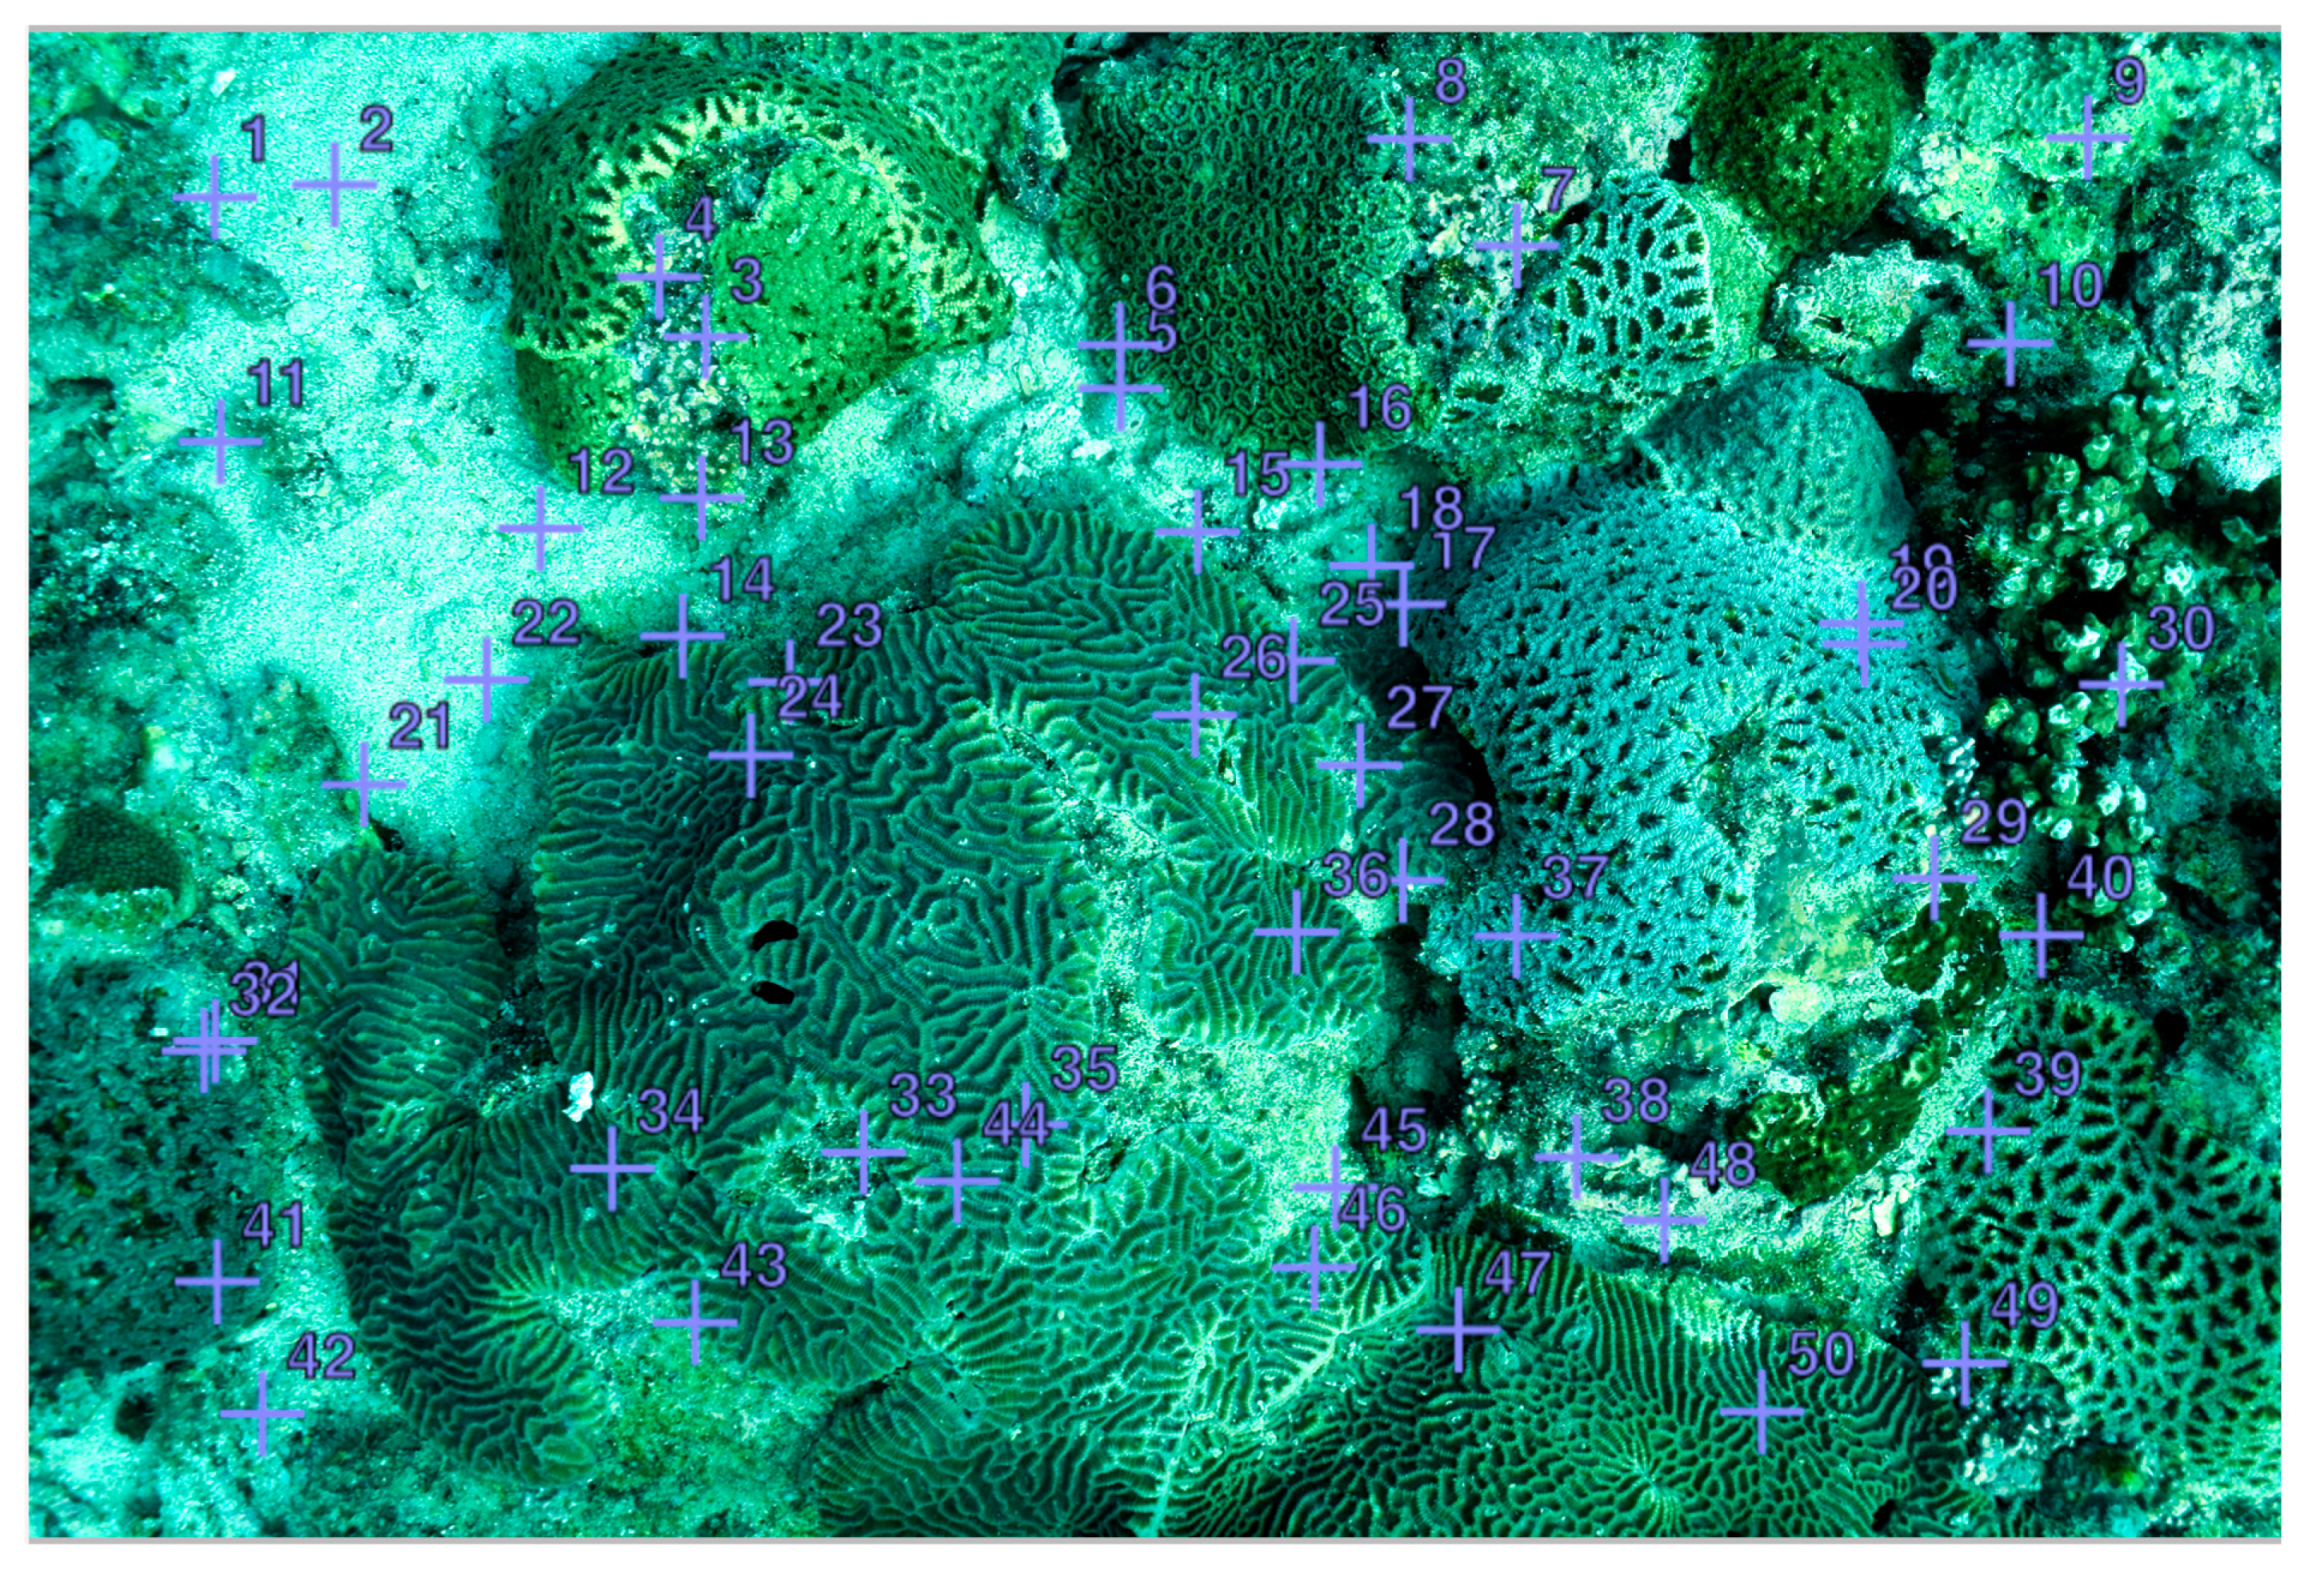
For each survey at a site, six replicate 30 m transects were deployed approximately 5 m apart from one another. On each transect, a 0.25 m2 quadrat was photographed at 3 m intervals along the right side of the transect tape with a Nikon D7200 high-resolution (24 megapixel) digital single-lens reflex (DSLR) camera mounted on a frame enclosing the quadrat area. This resulted in 11 high-resolution images per transect and a total of 66 images per site. Images were processed using the CoralNet image analysis platform [24]. Quadrats were processed based on 50 points placed randomly within each image (see sample image Figure A1). This methodology is consistent with earlier studies conducted in this region [7,25]. The benthic units under each point were classified, with hard corals identified to the species level where possible but reported for this manuscript at the genus level. This process was completed manually by a trained observer and did not utilize CoralNet’s machine learning algorithm. All “bleached coral” and all “dead coral” were grouped across species (i.e., bleached Porites and bleached Pocillopora would both be categorized as “bleached coral”, and similarly, dead Porites and dead Pocillopora would both be categorized as “dead coral”, as examples). All non-Scleractinian corals, other invertebrates and other substrates were identified as rock/pavement, sand, shell, silt, urchin, zoanthid, turf algae, macroalgae, other invertebrate, or other. The relative proportional cover of a benthic category was calculated by dividing the number of points represented by the benthic category by the total number of points (n = 50). Total relative proportional coral cover was calculated by dividing the sum of all points represented by coral genera by the total number of points (n = 50). Where percentage cover is reported, proportional cover was multiplied by 100. For subsequent data analyses, quadrats within a given transect acted as technical replicates, and their data were averaged to obtain transect-level summaries of benthic composition and percentage cover; the six transect data sets served as biological replicates for site-specific cover estimates (e.g., mean percentage coral cover).

2.3. Temperature Data

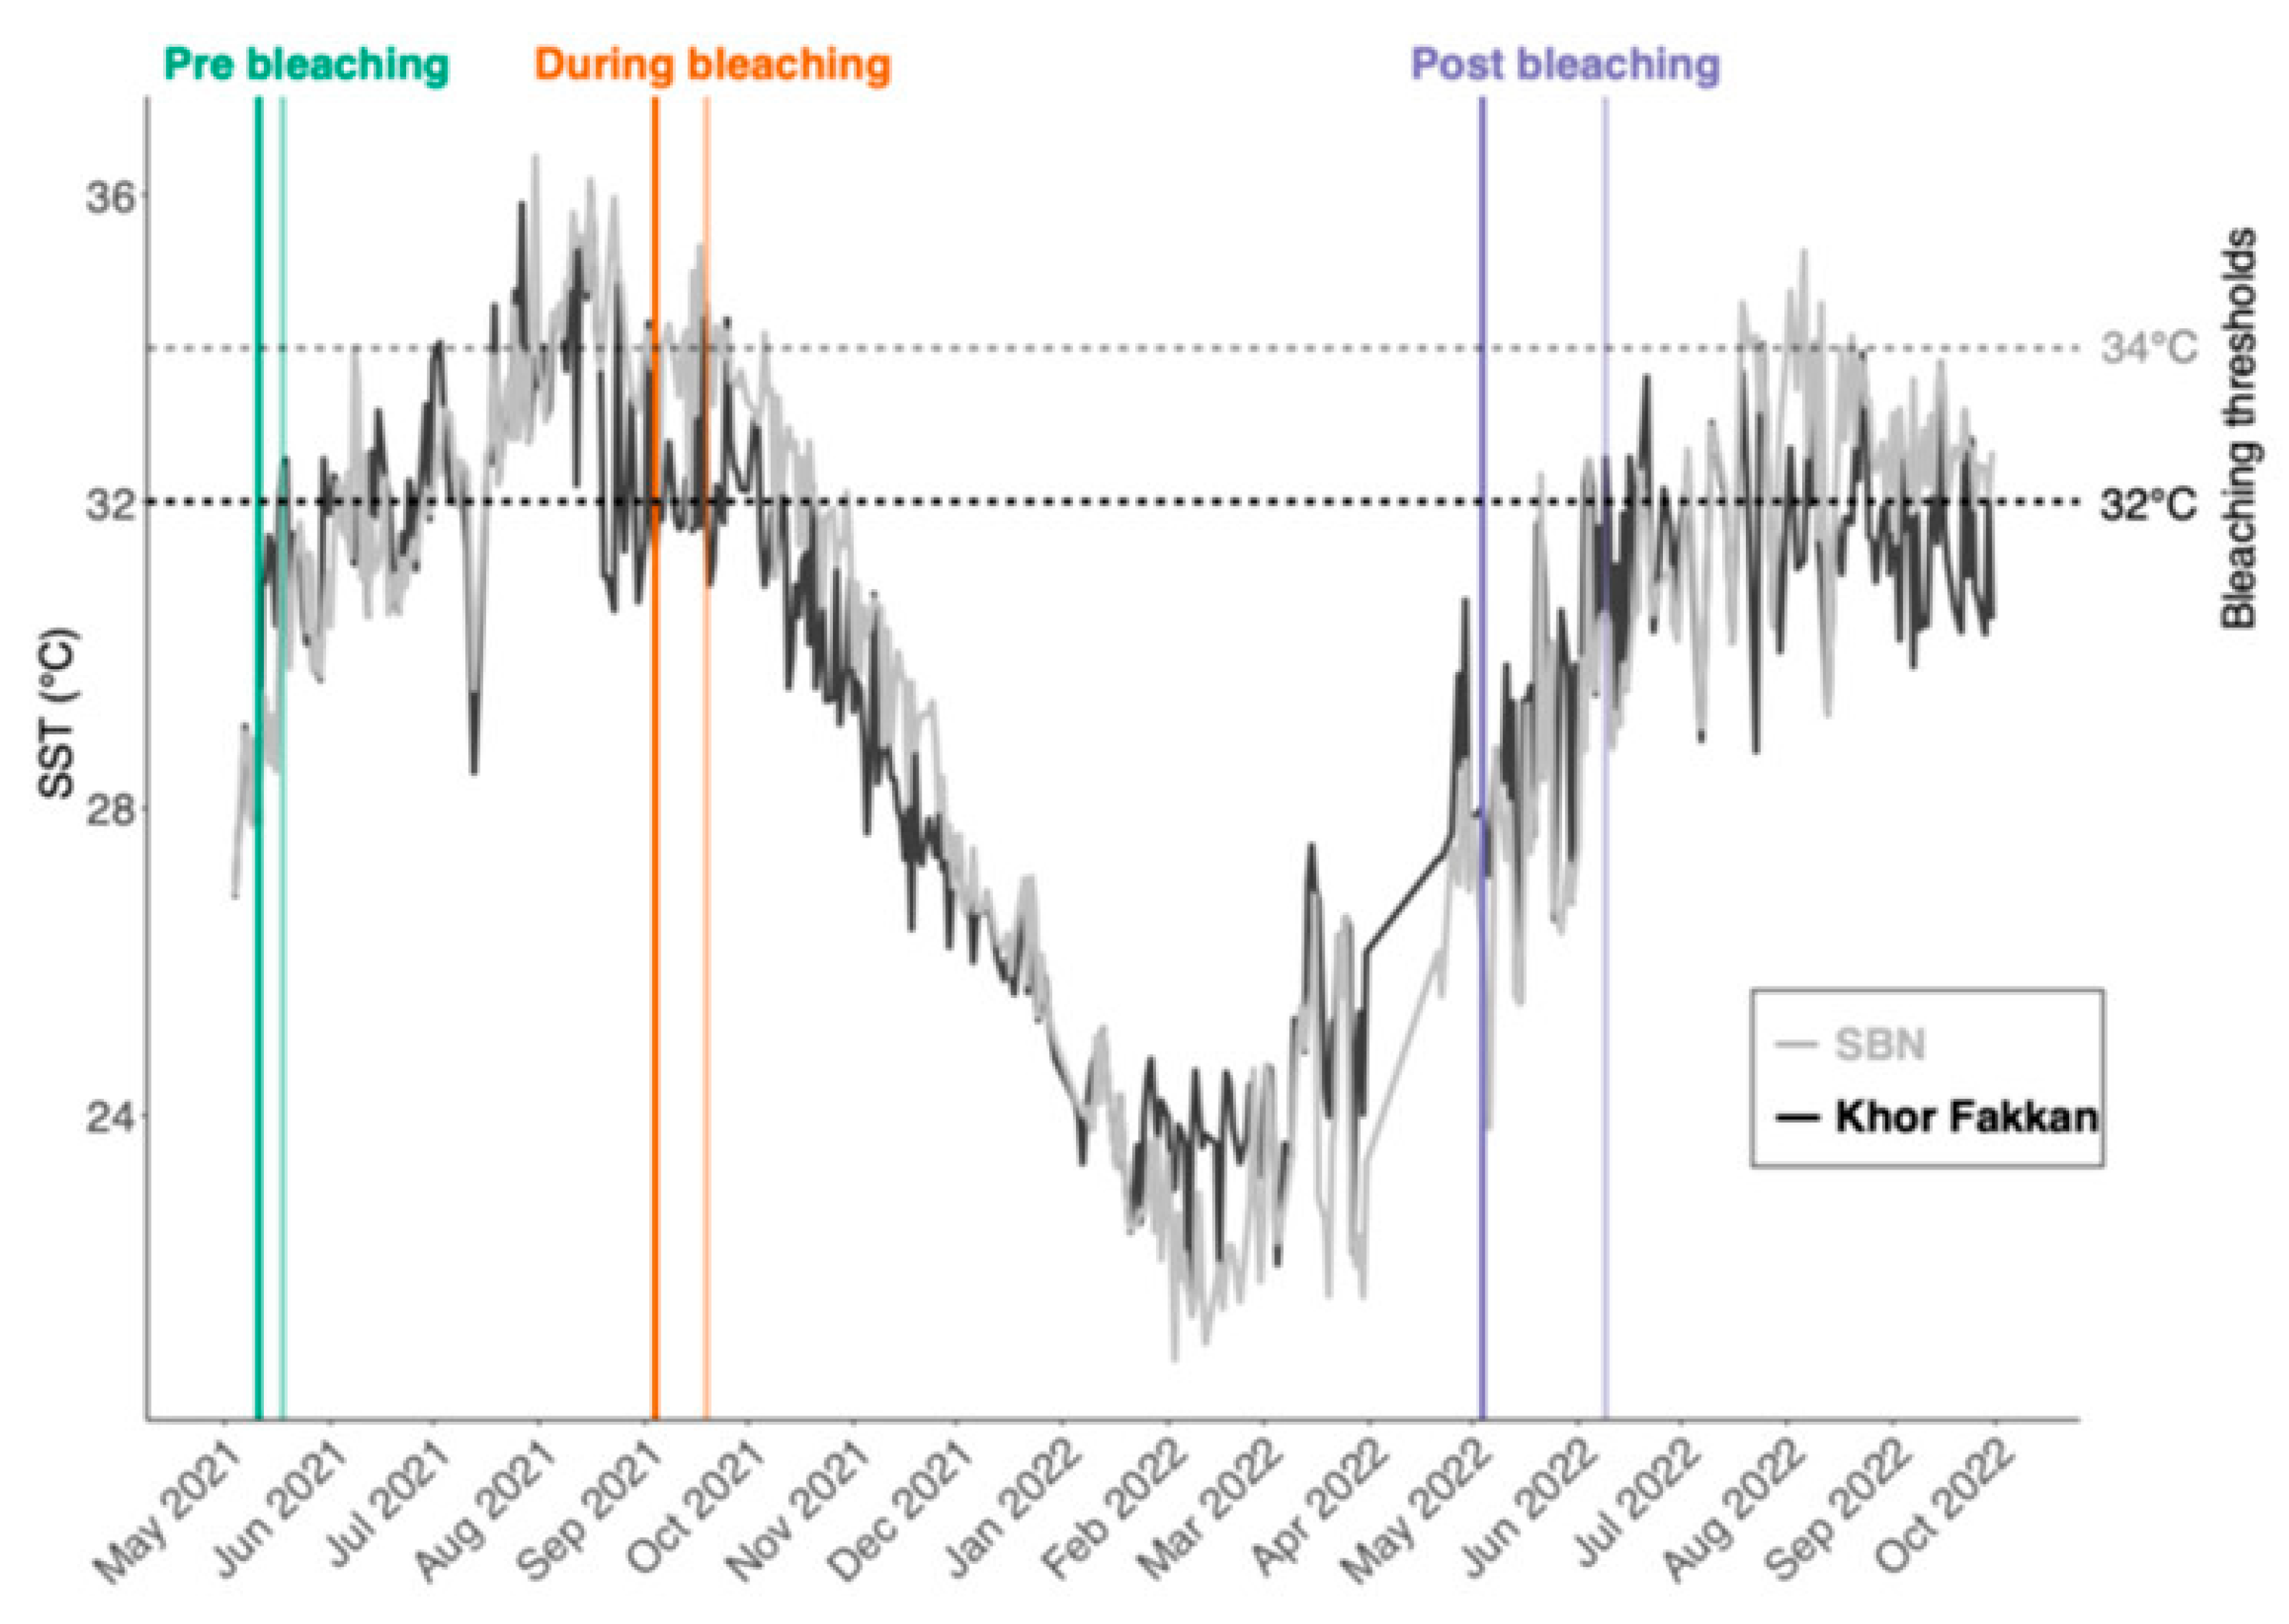
Daily sea surface temperature (SST, in °C) for each site was obtained from Aqua MODIS (https://aqua.nasa.gov/modis, accessed on 17 April 2024). Mean SSTs for the two regions, SBN and Khor Fakkan, were calculated by averaging SSTs across sites within each region. Previous studies suggest that the bleaching threshold for corals in the Gulf of Oman is approximately 32 °C [26], whereas in the Arabian Gulf, bleaching is thought to require either three weeks of daily mean temperatures at or above 35 °C or eight to nine weeks at or above 34 °C [27]. Using these literature-derived thresholds, we calculated the number of days on which the average SST for SBN sites exceeded 34 °C and the number of days on which the average SST for Khor Fakkan sites exceeded 32 °C. We also obtained mean Degree Heating Weeks (DHW) for each region from NOAA Coral Reef Watch (https://coralreefwatch.noaa.gov/product/5km/index_5km_composite.php, accessed on 17 April 2024). This was calculated as the number of weeks 1 °C above the Maximum Monthly Mean (MMM).

2.4. Analyses

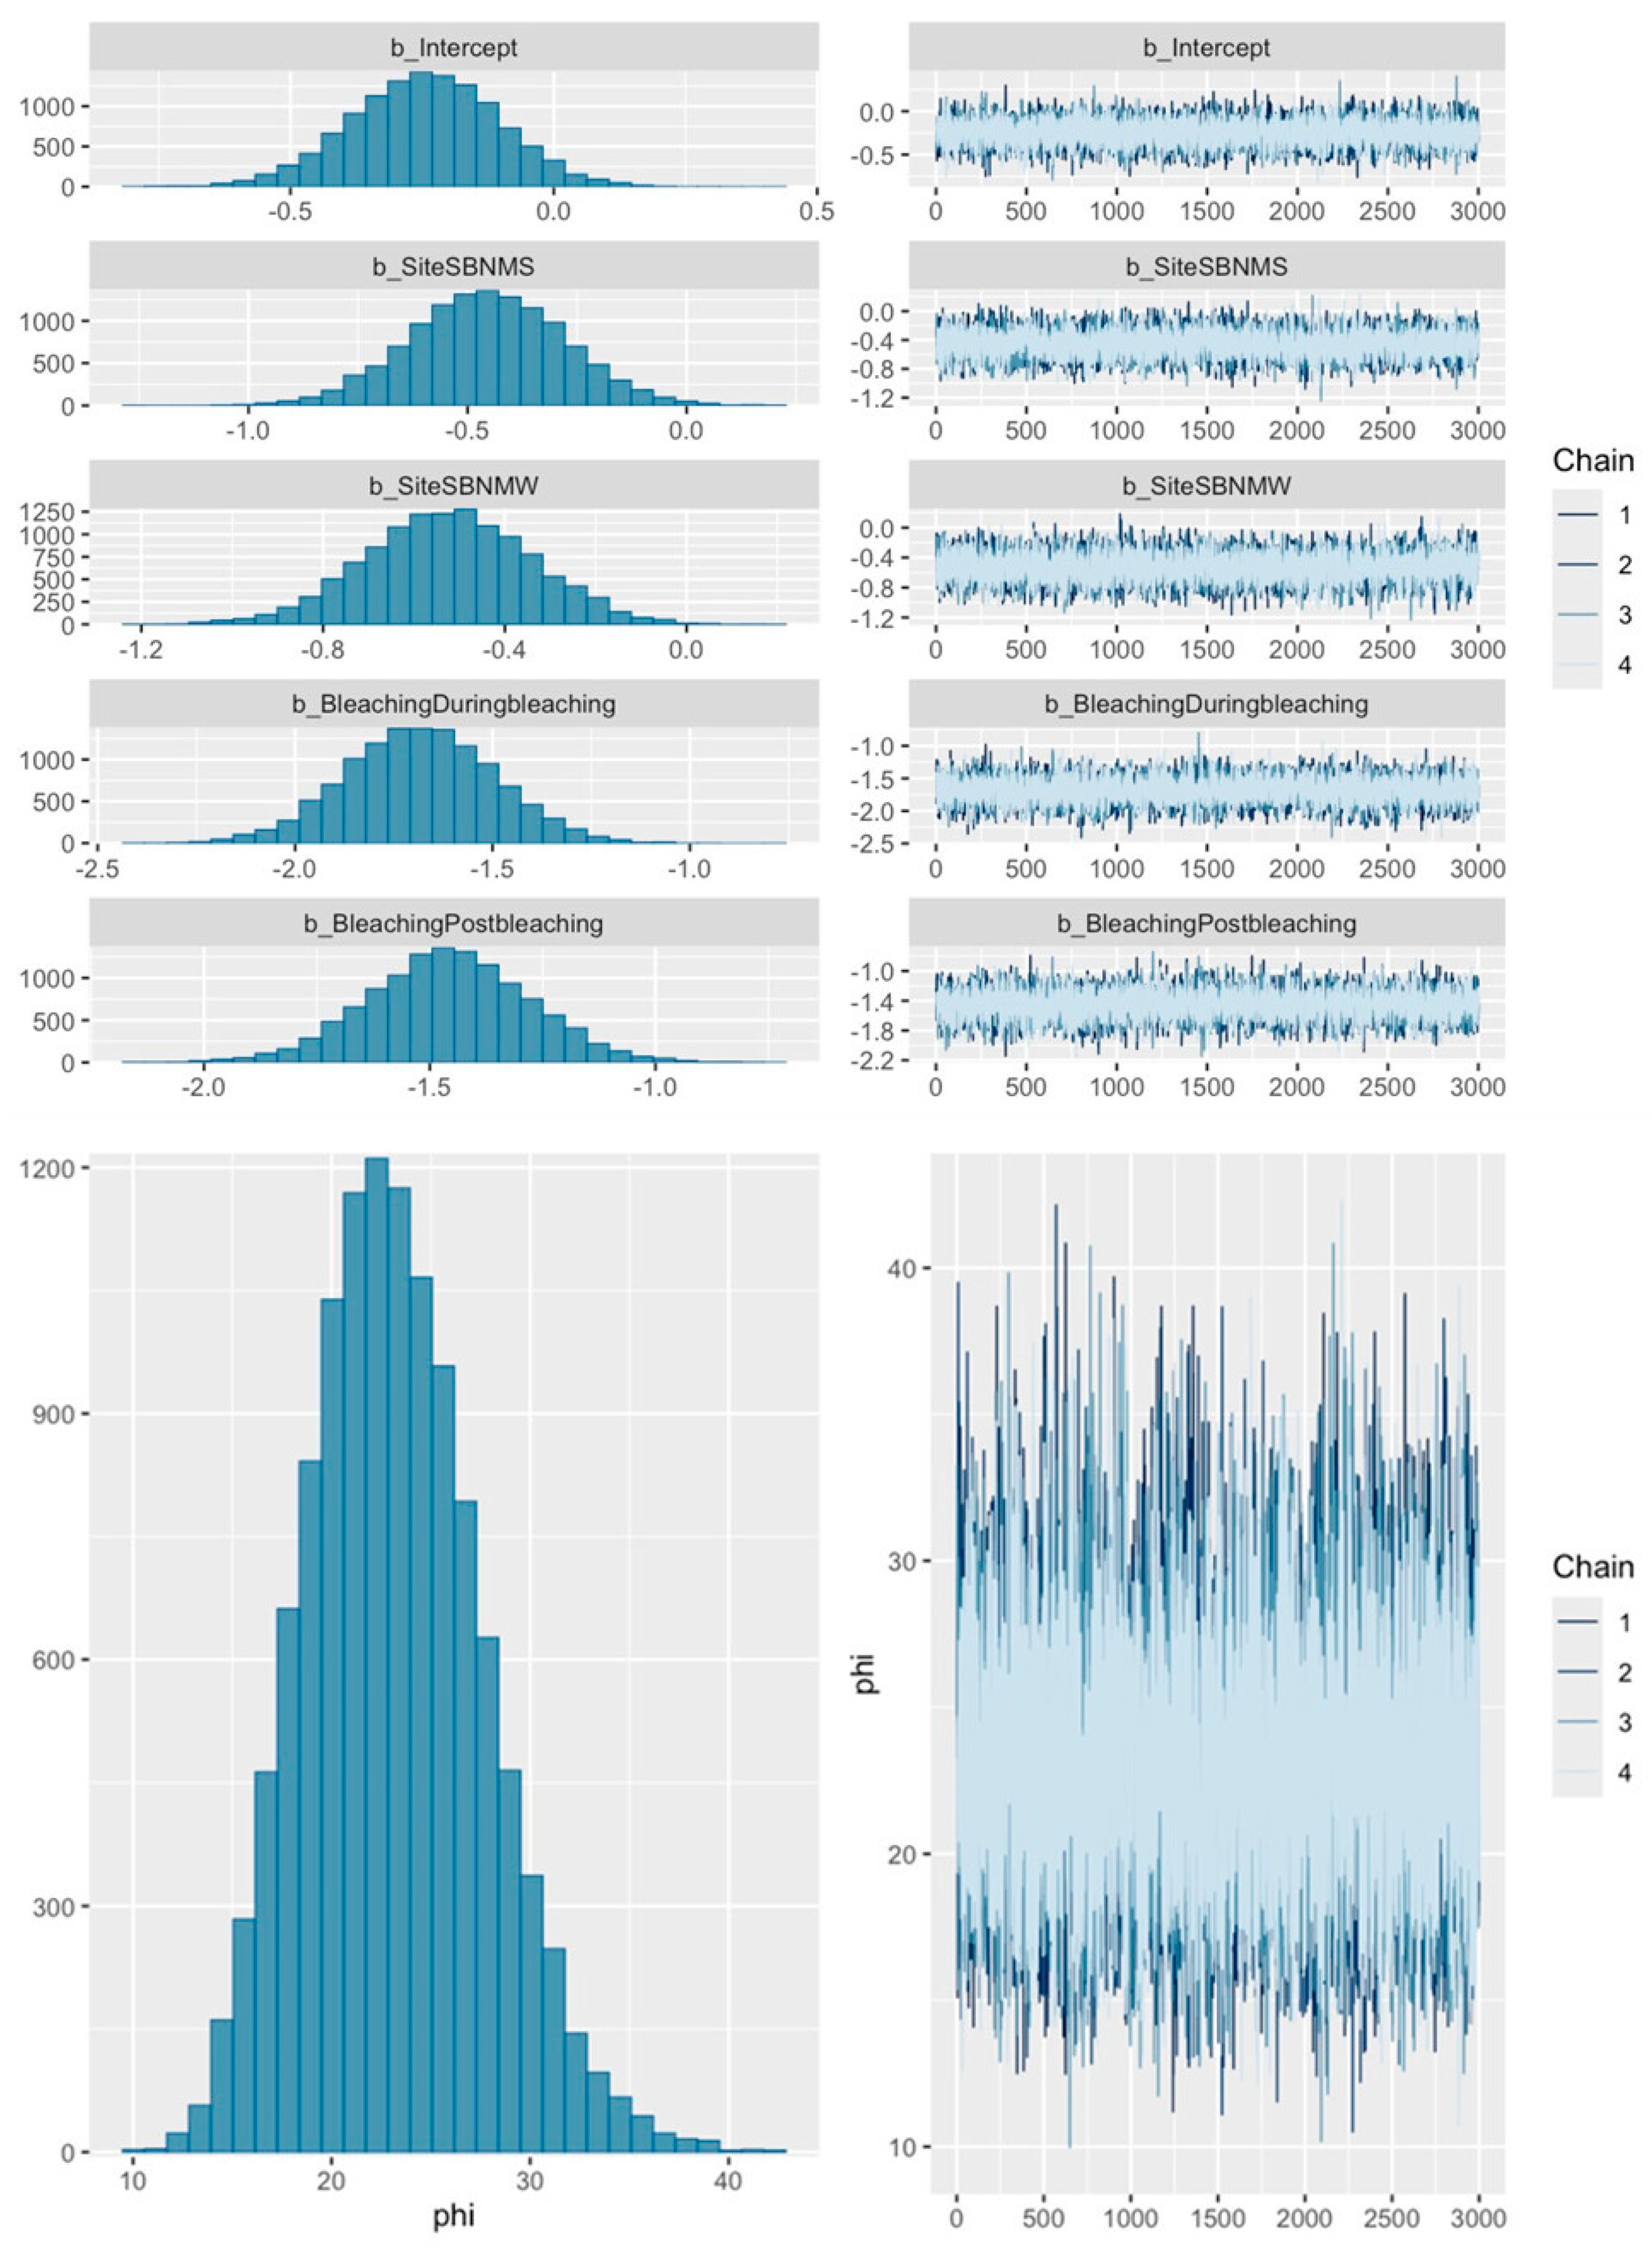
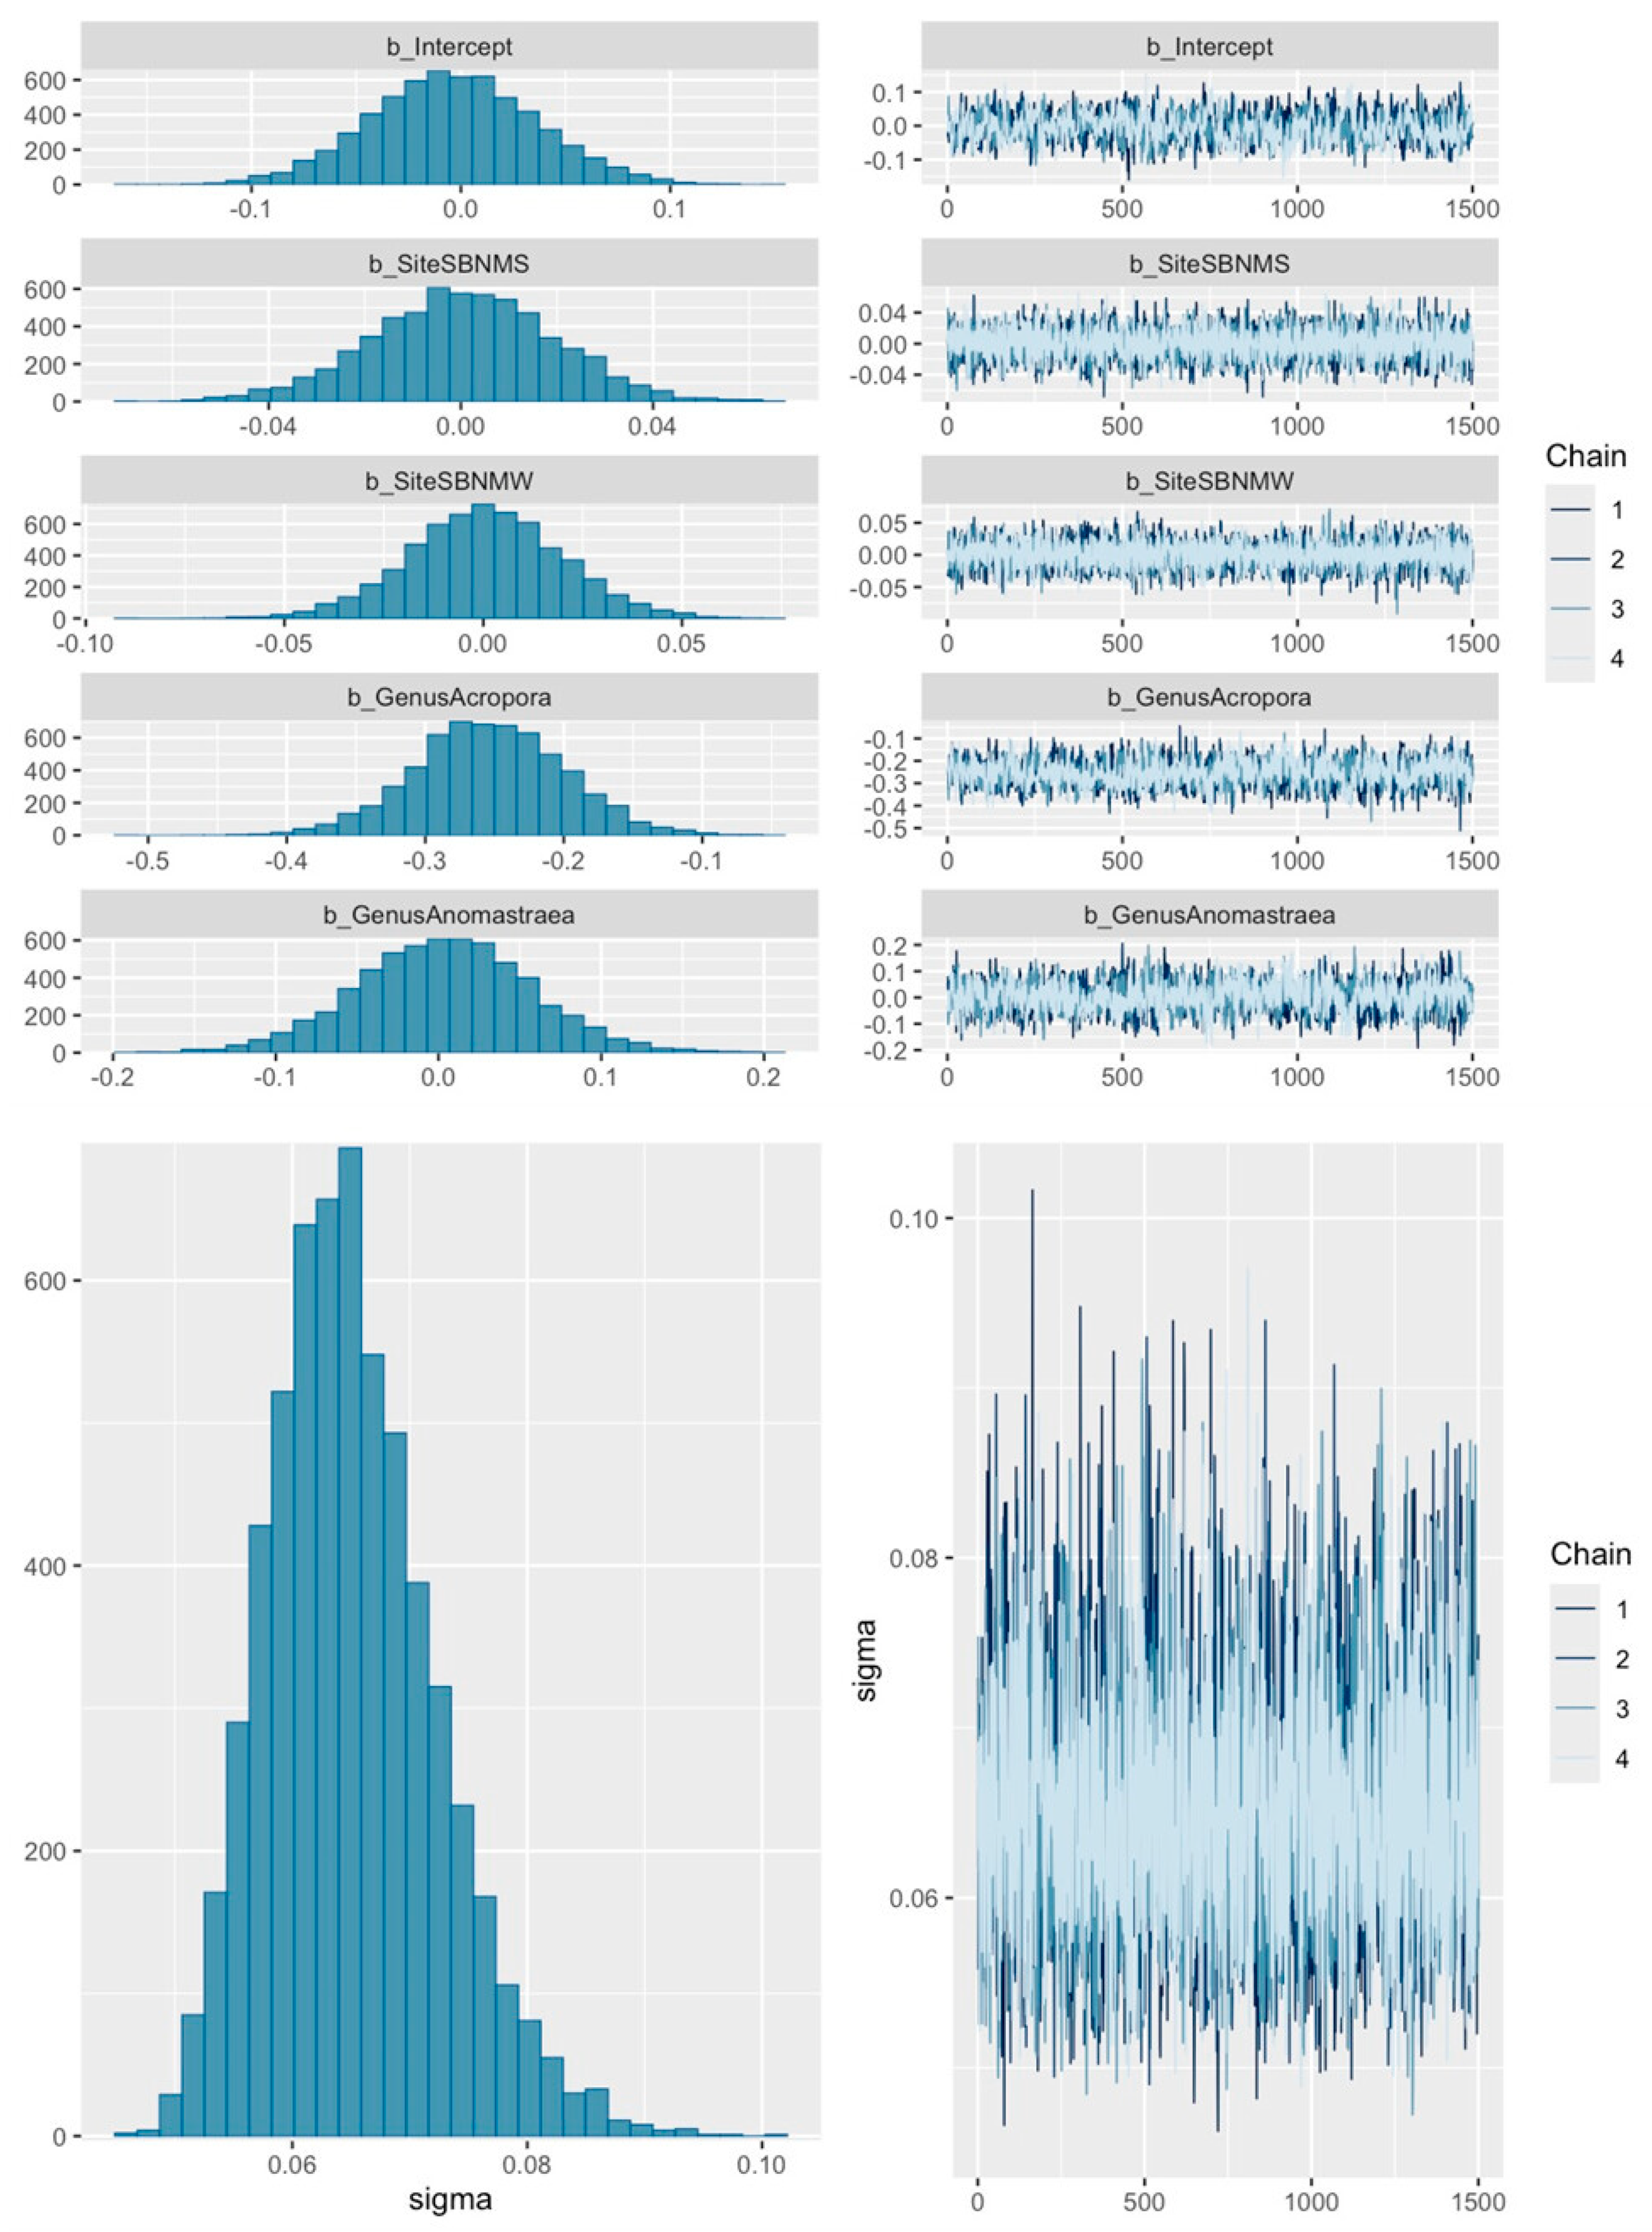
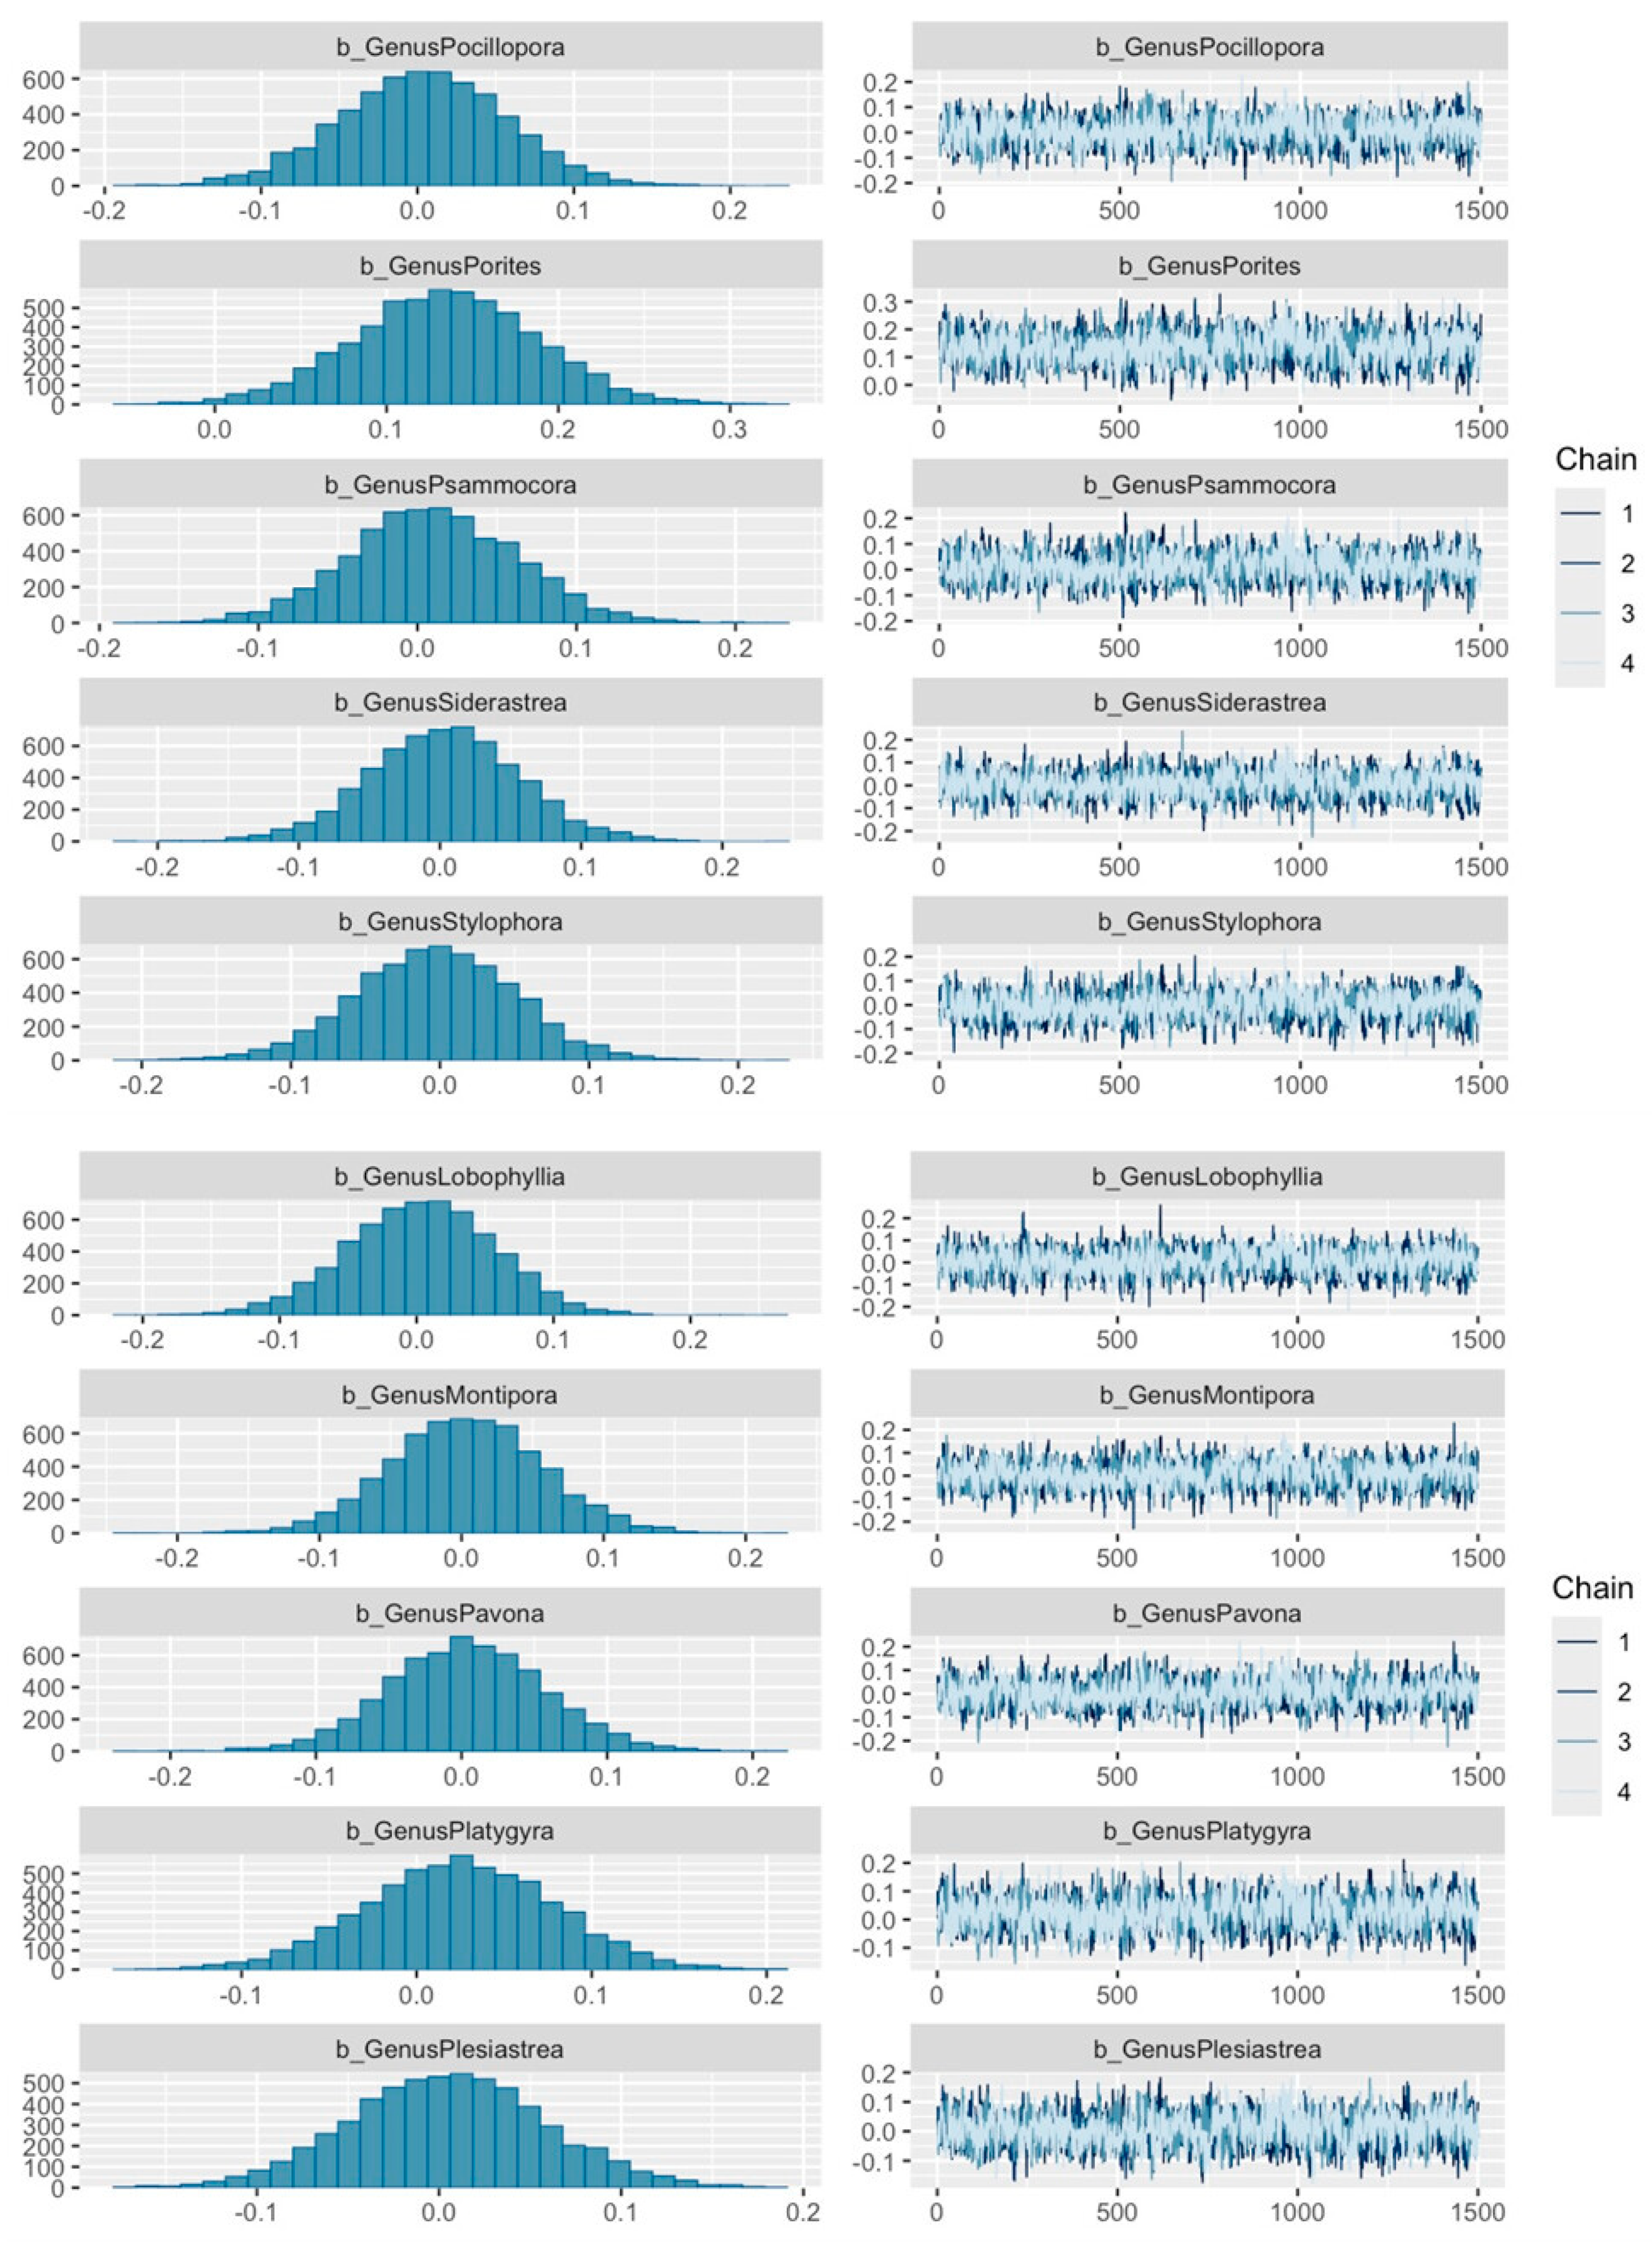
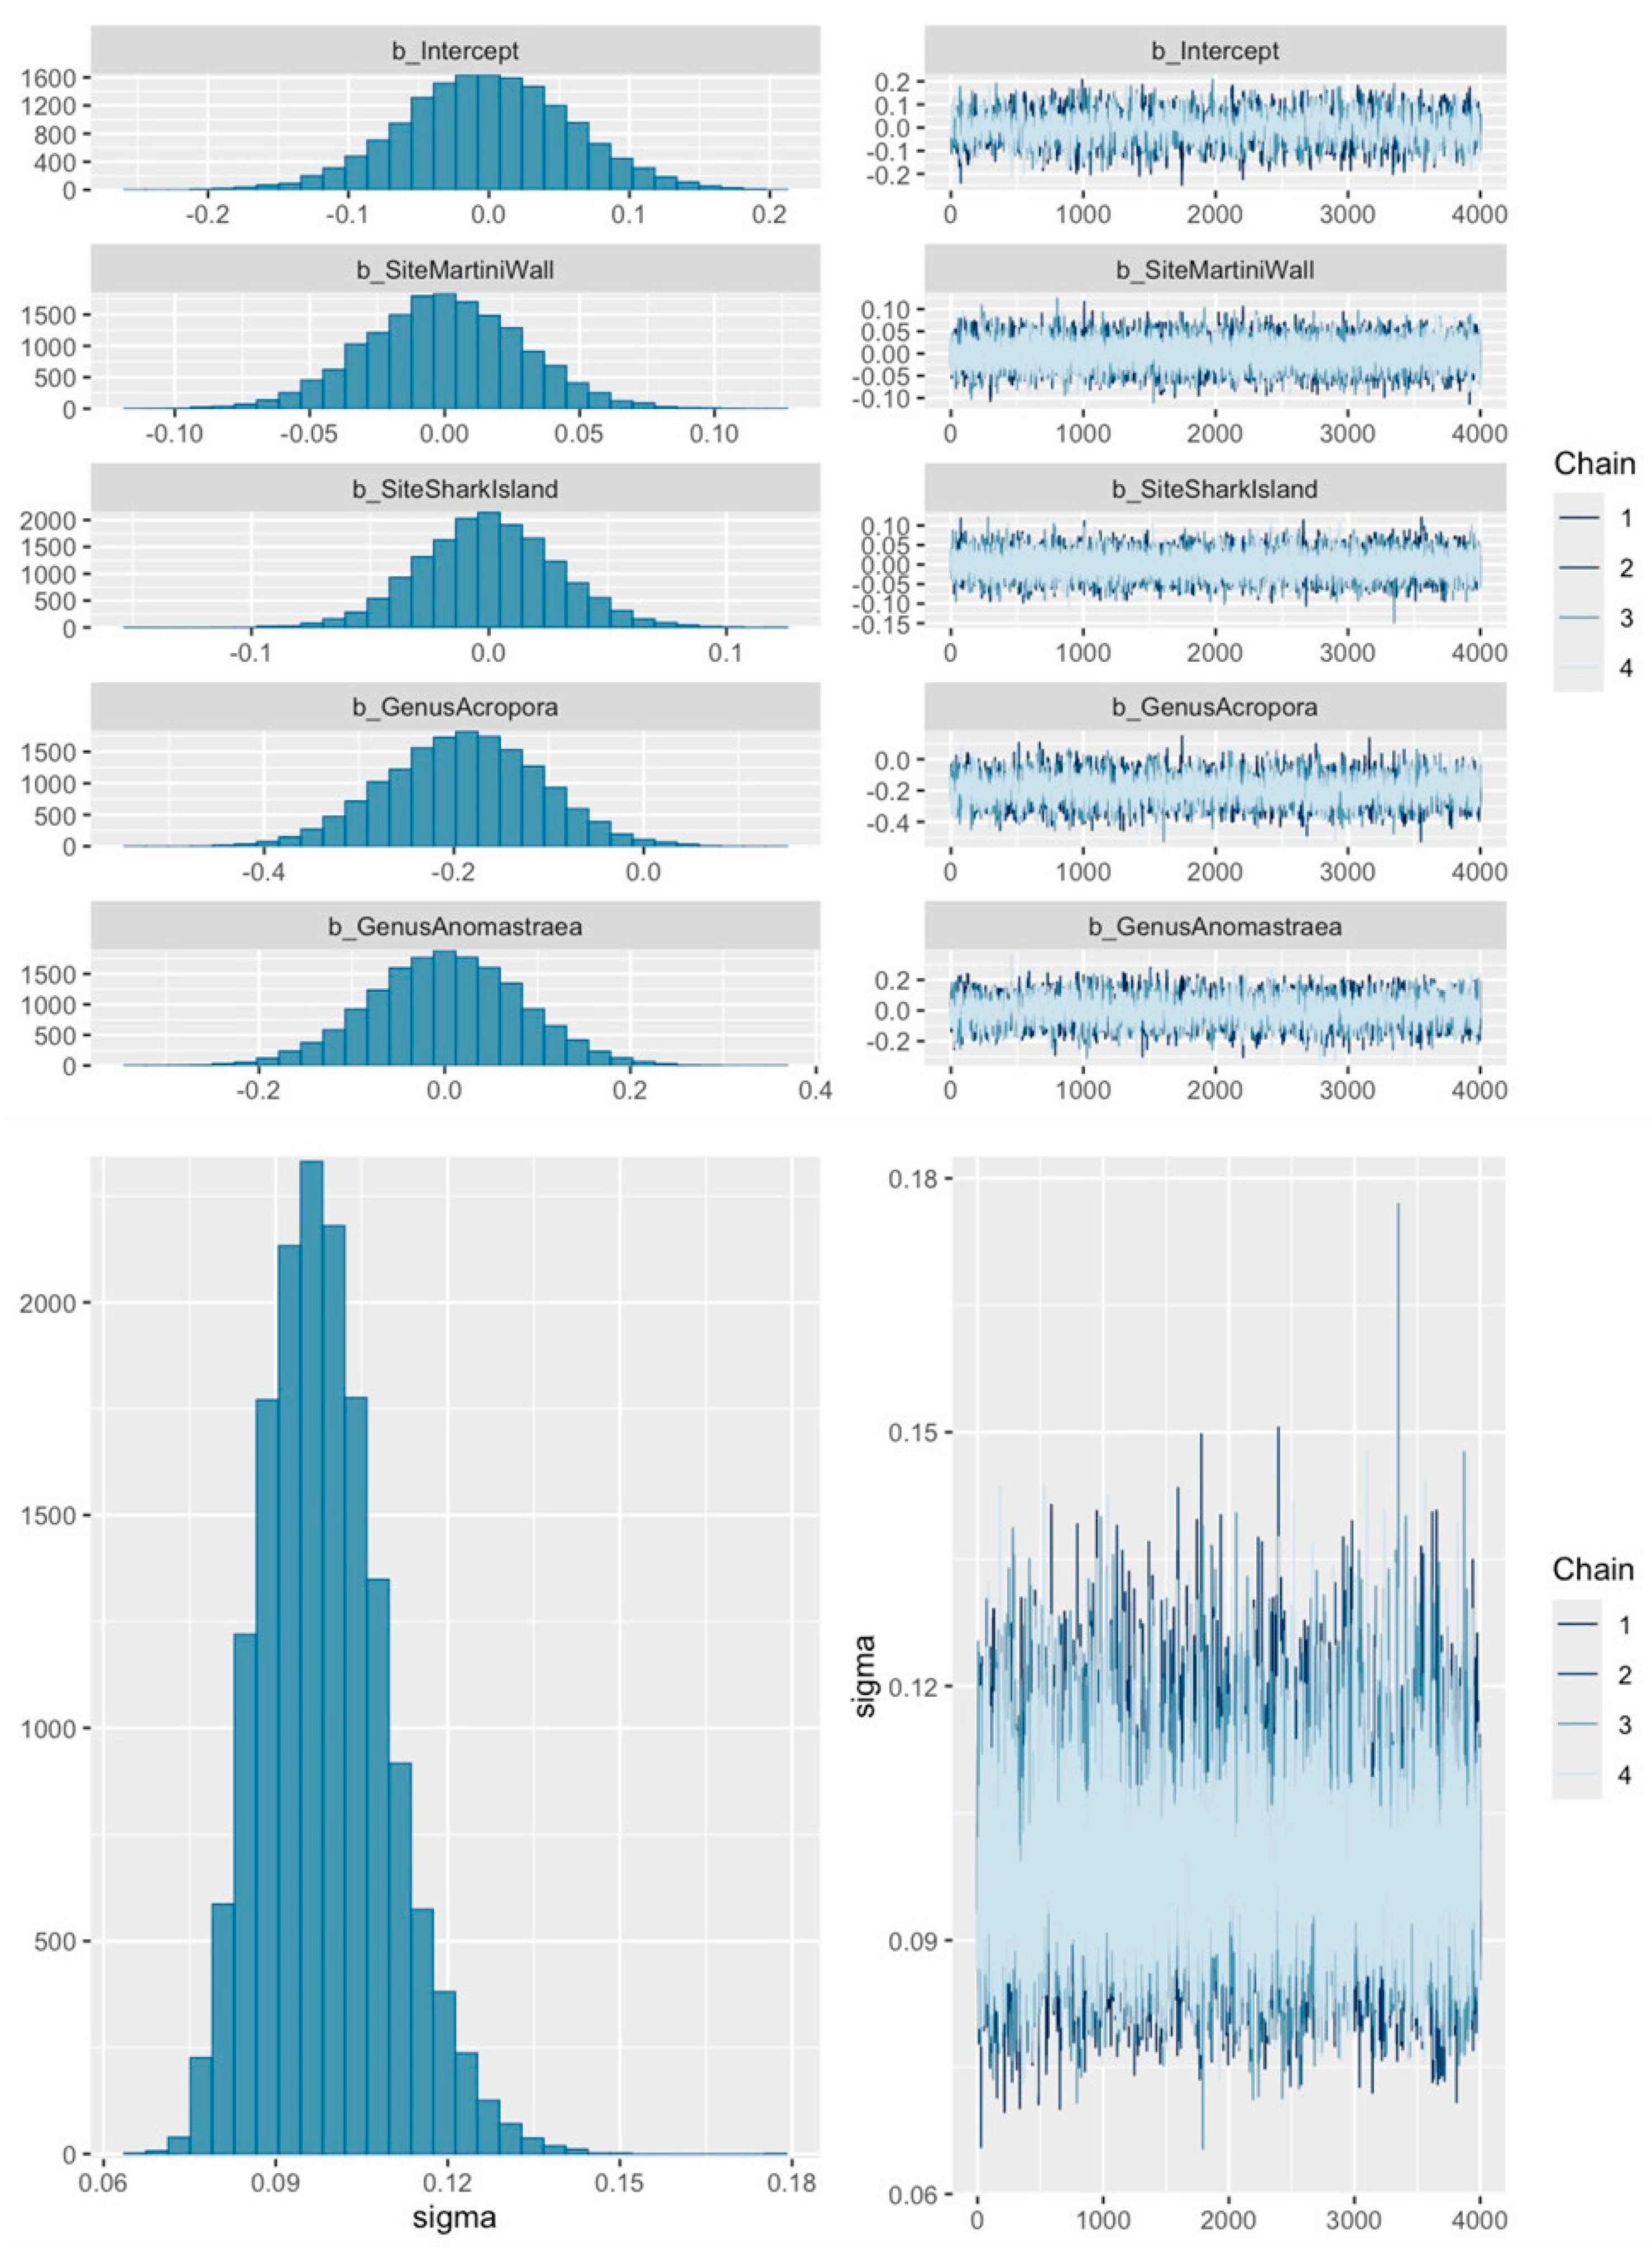
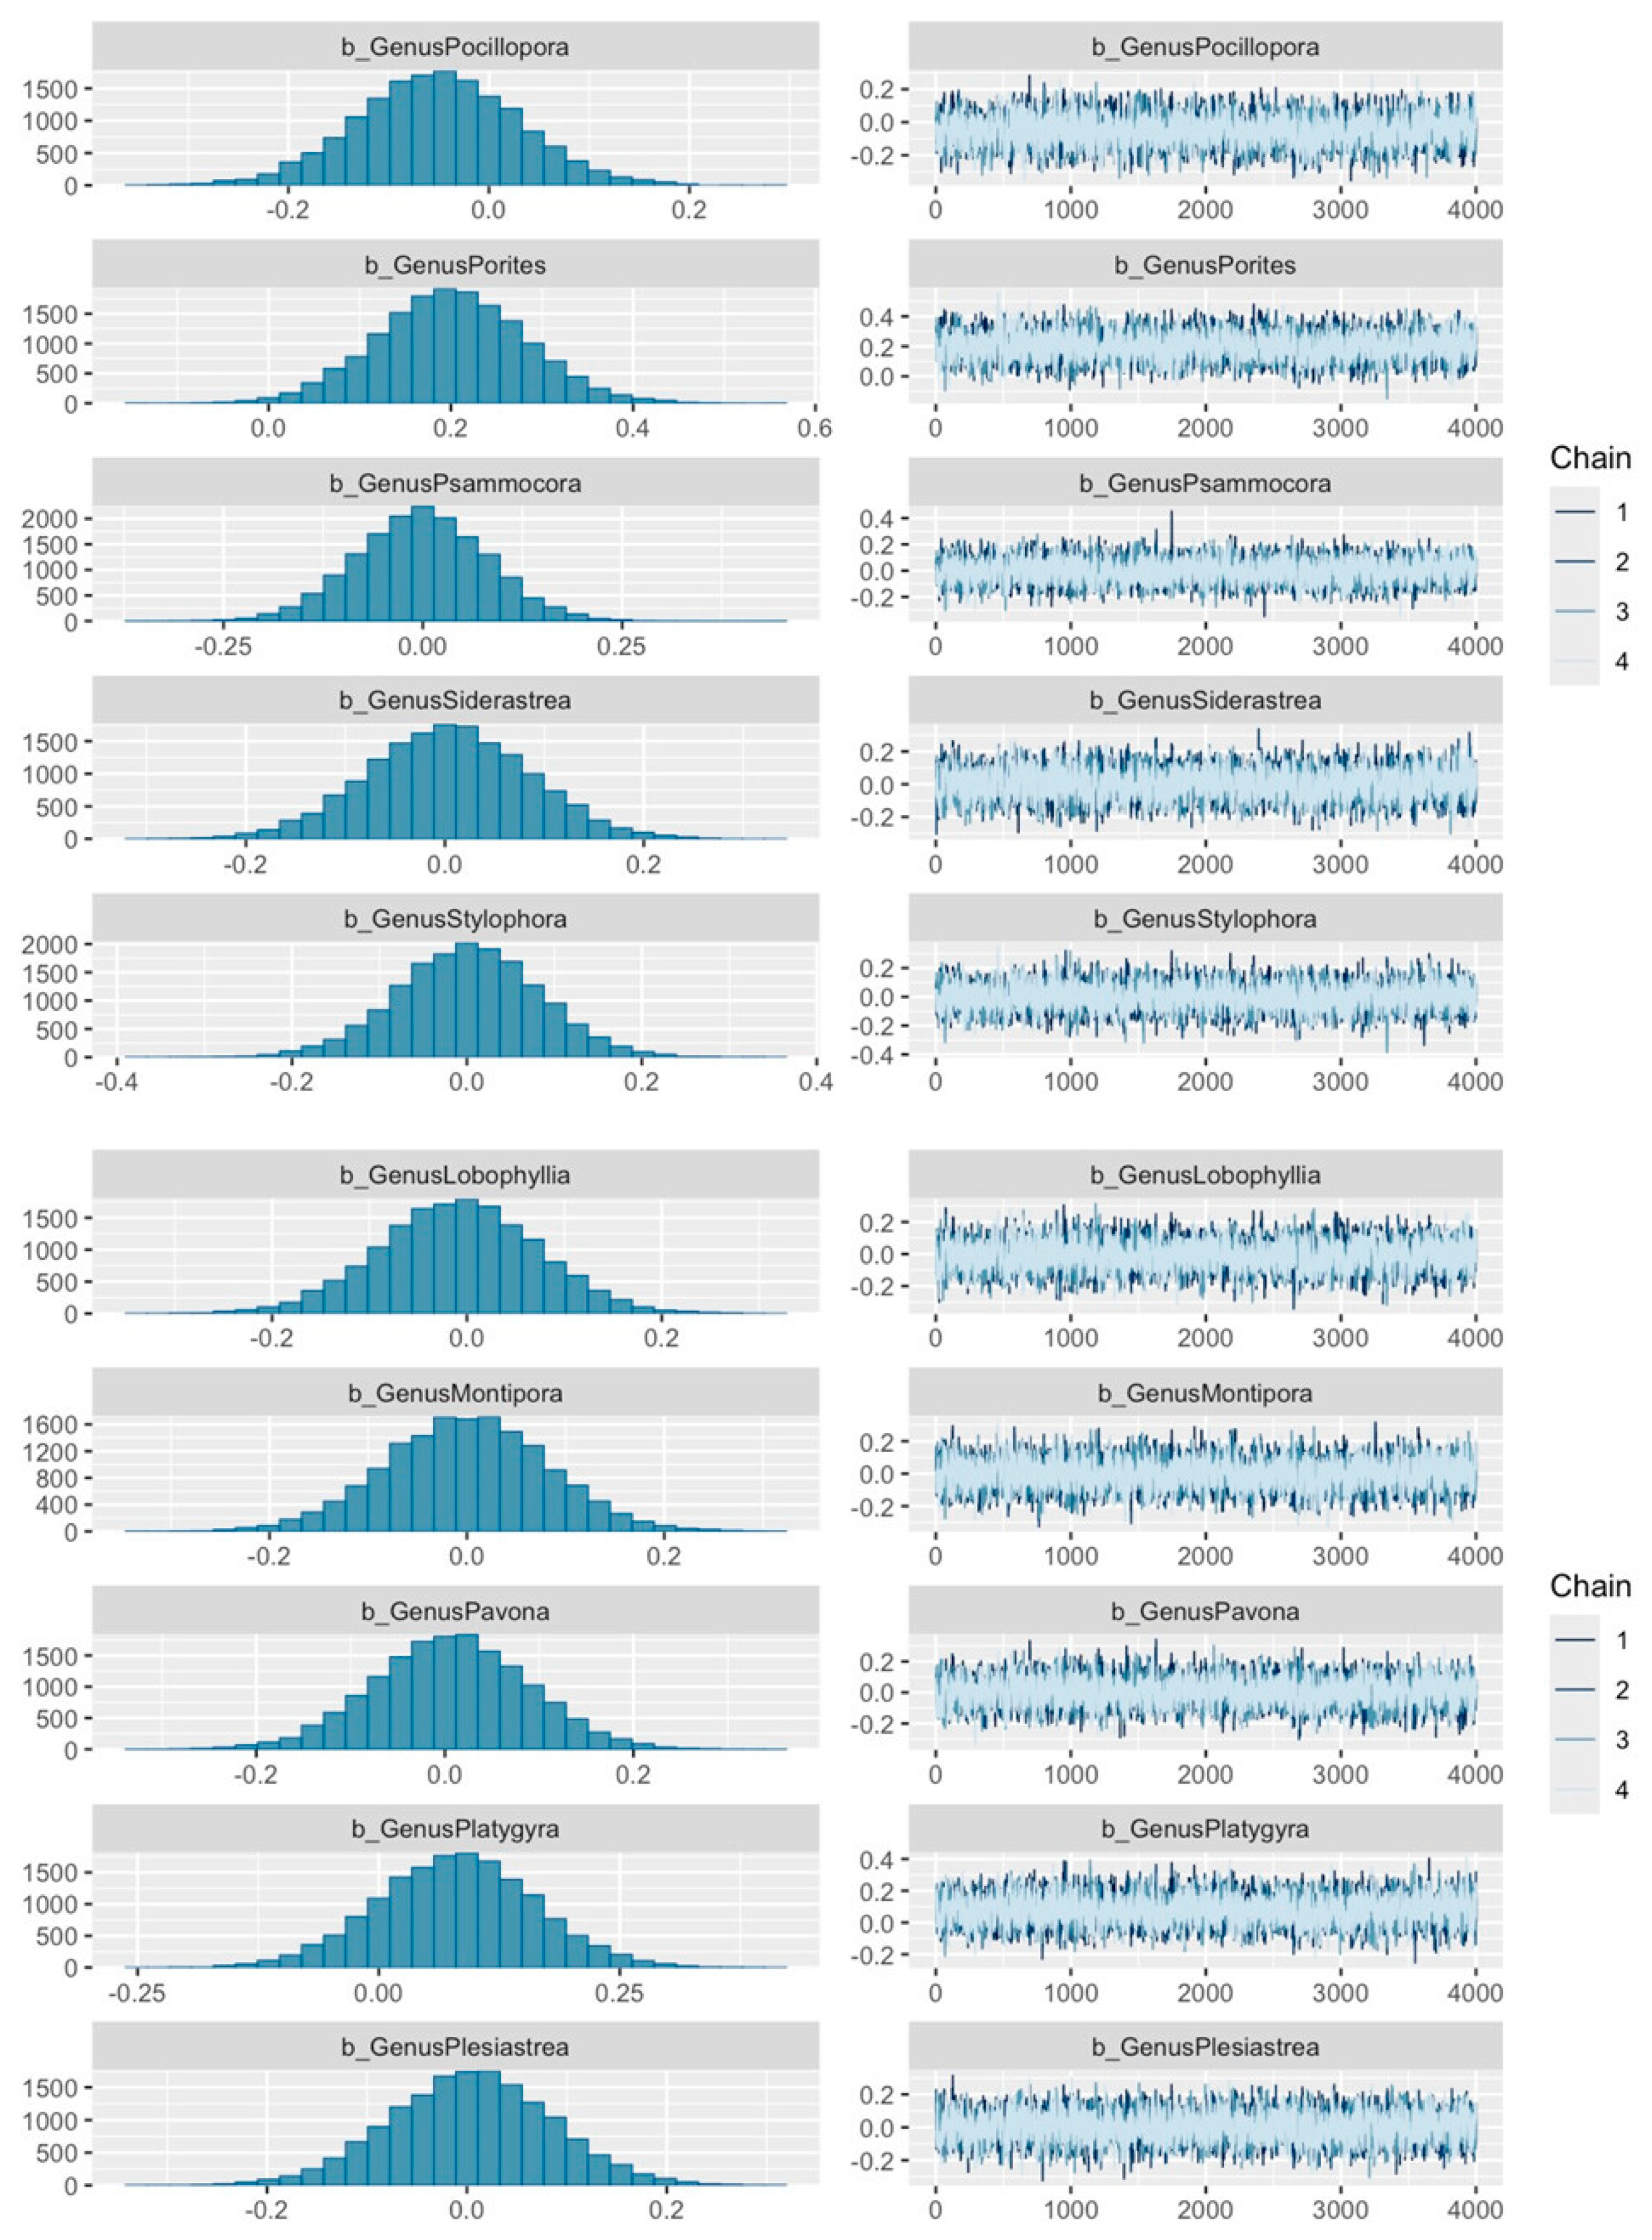
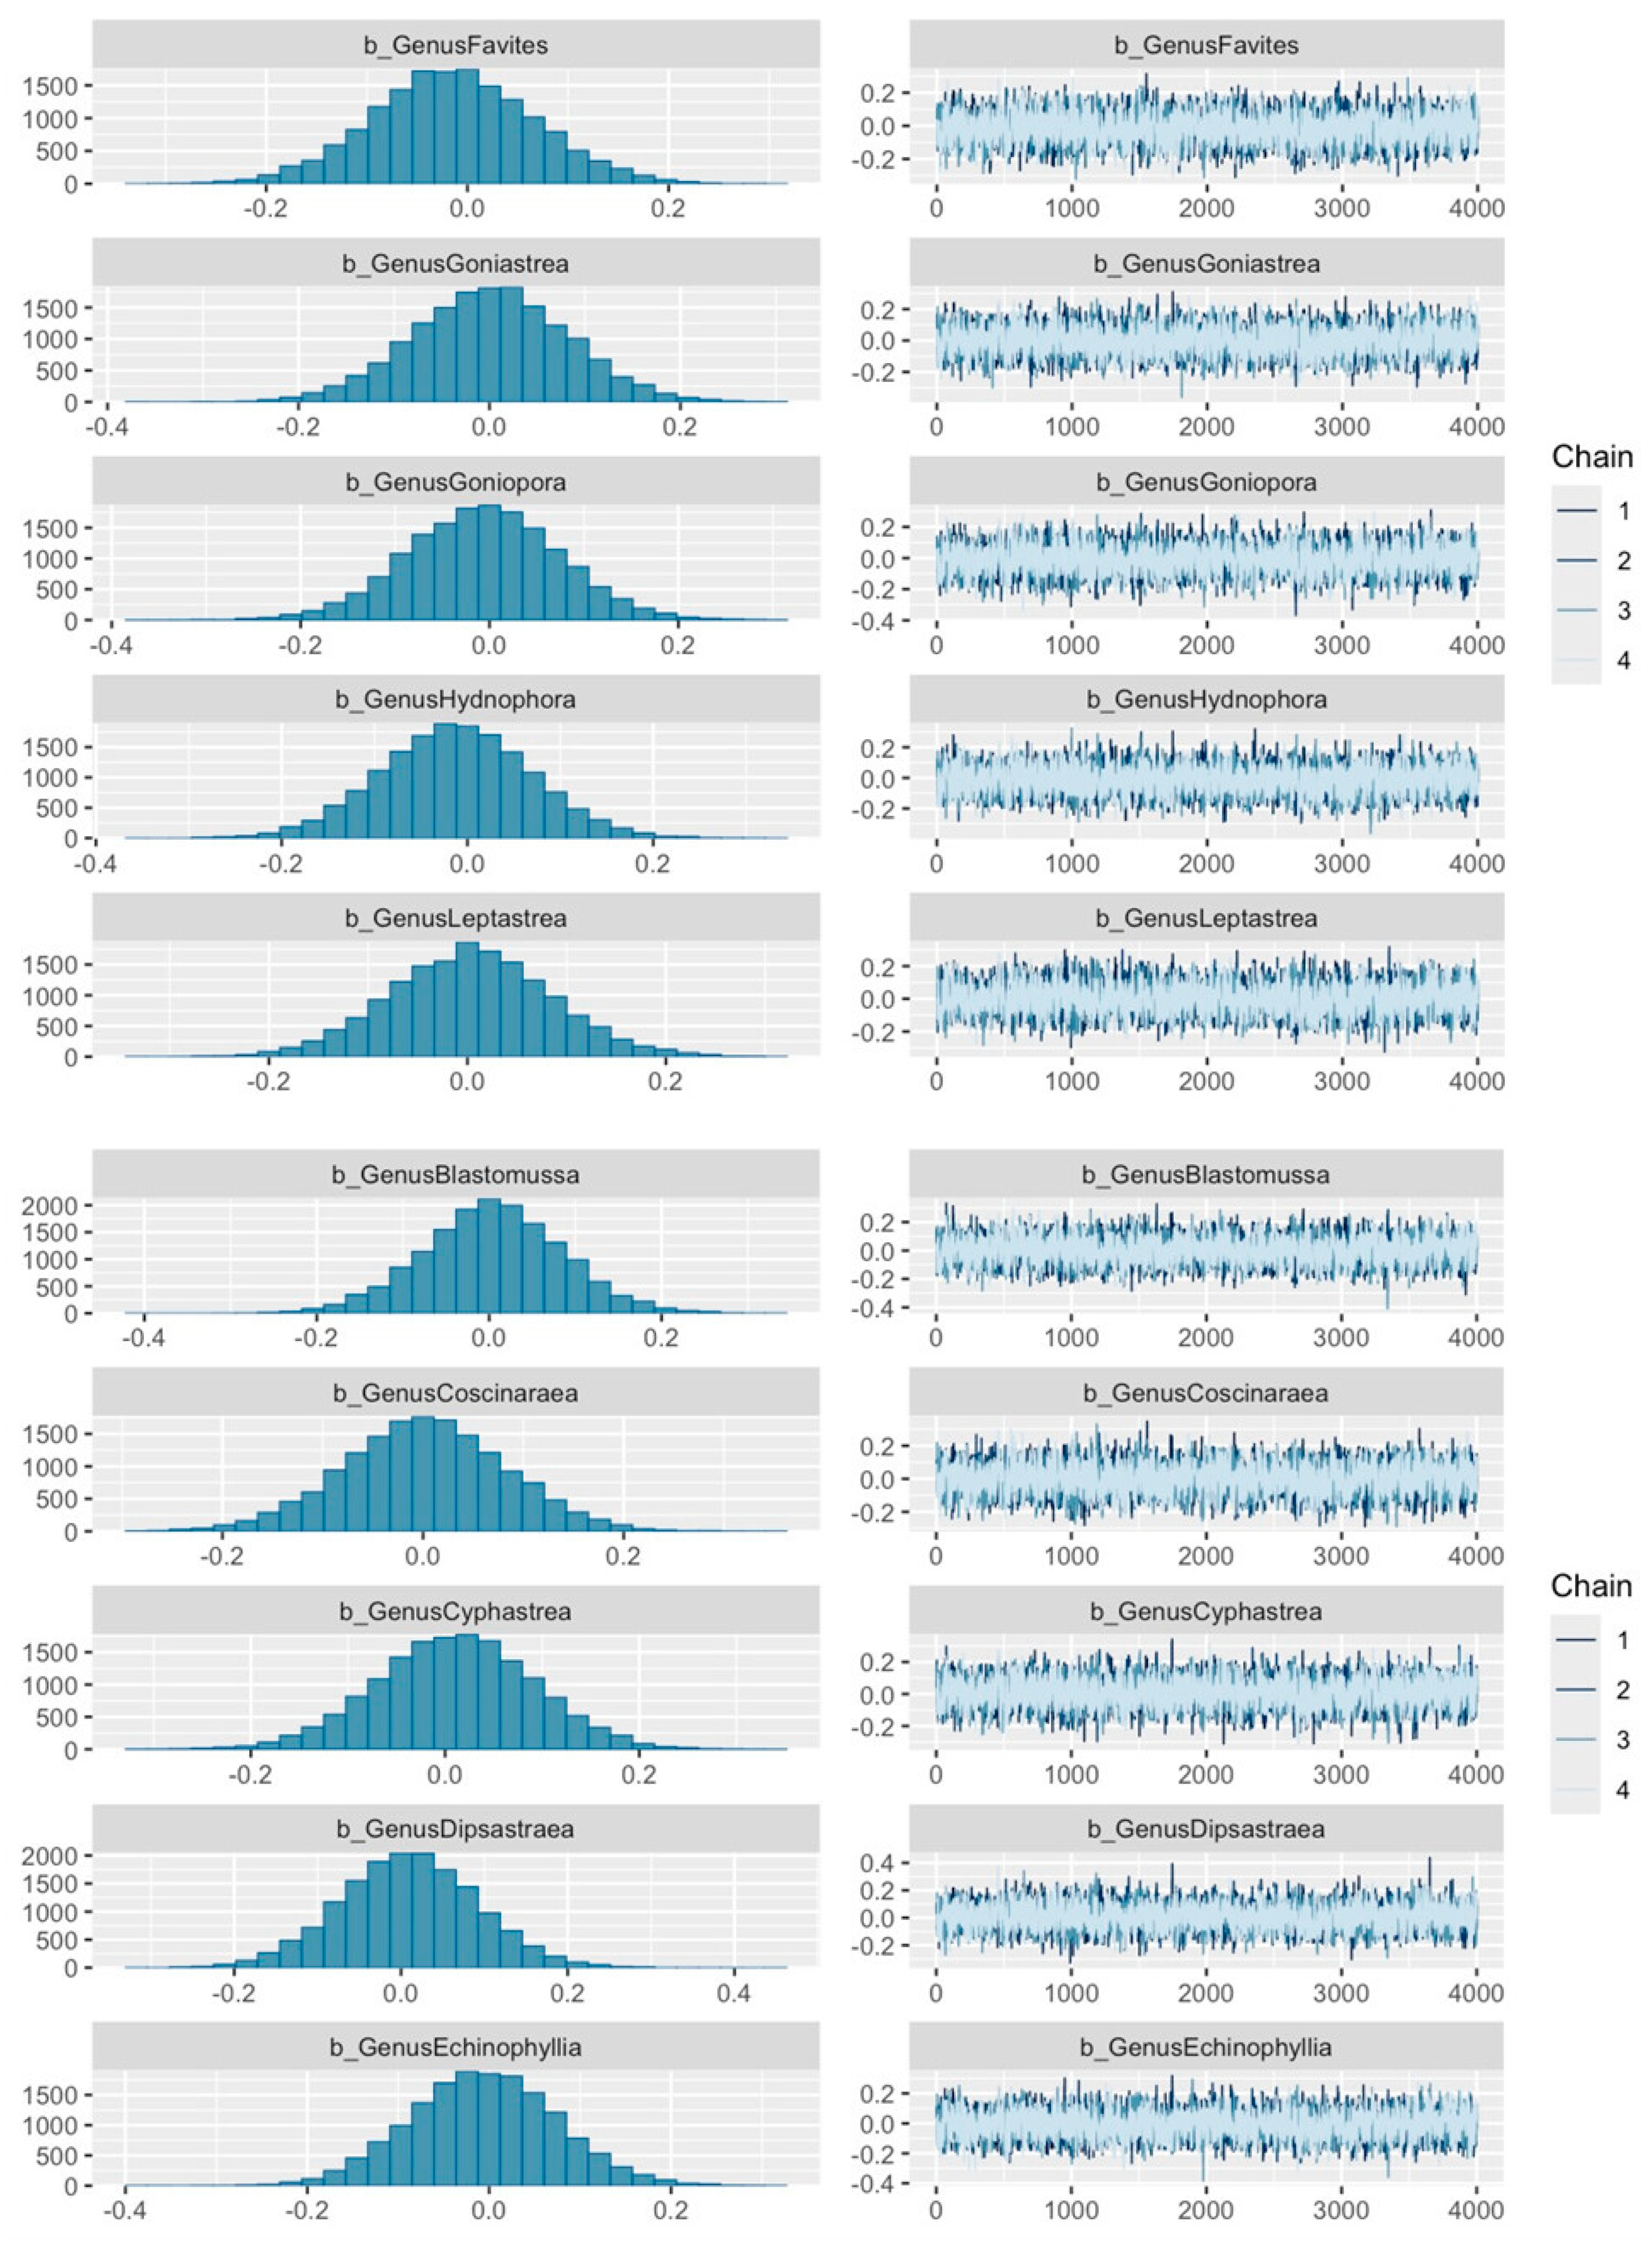
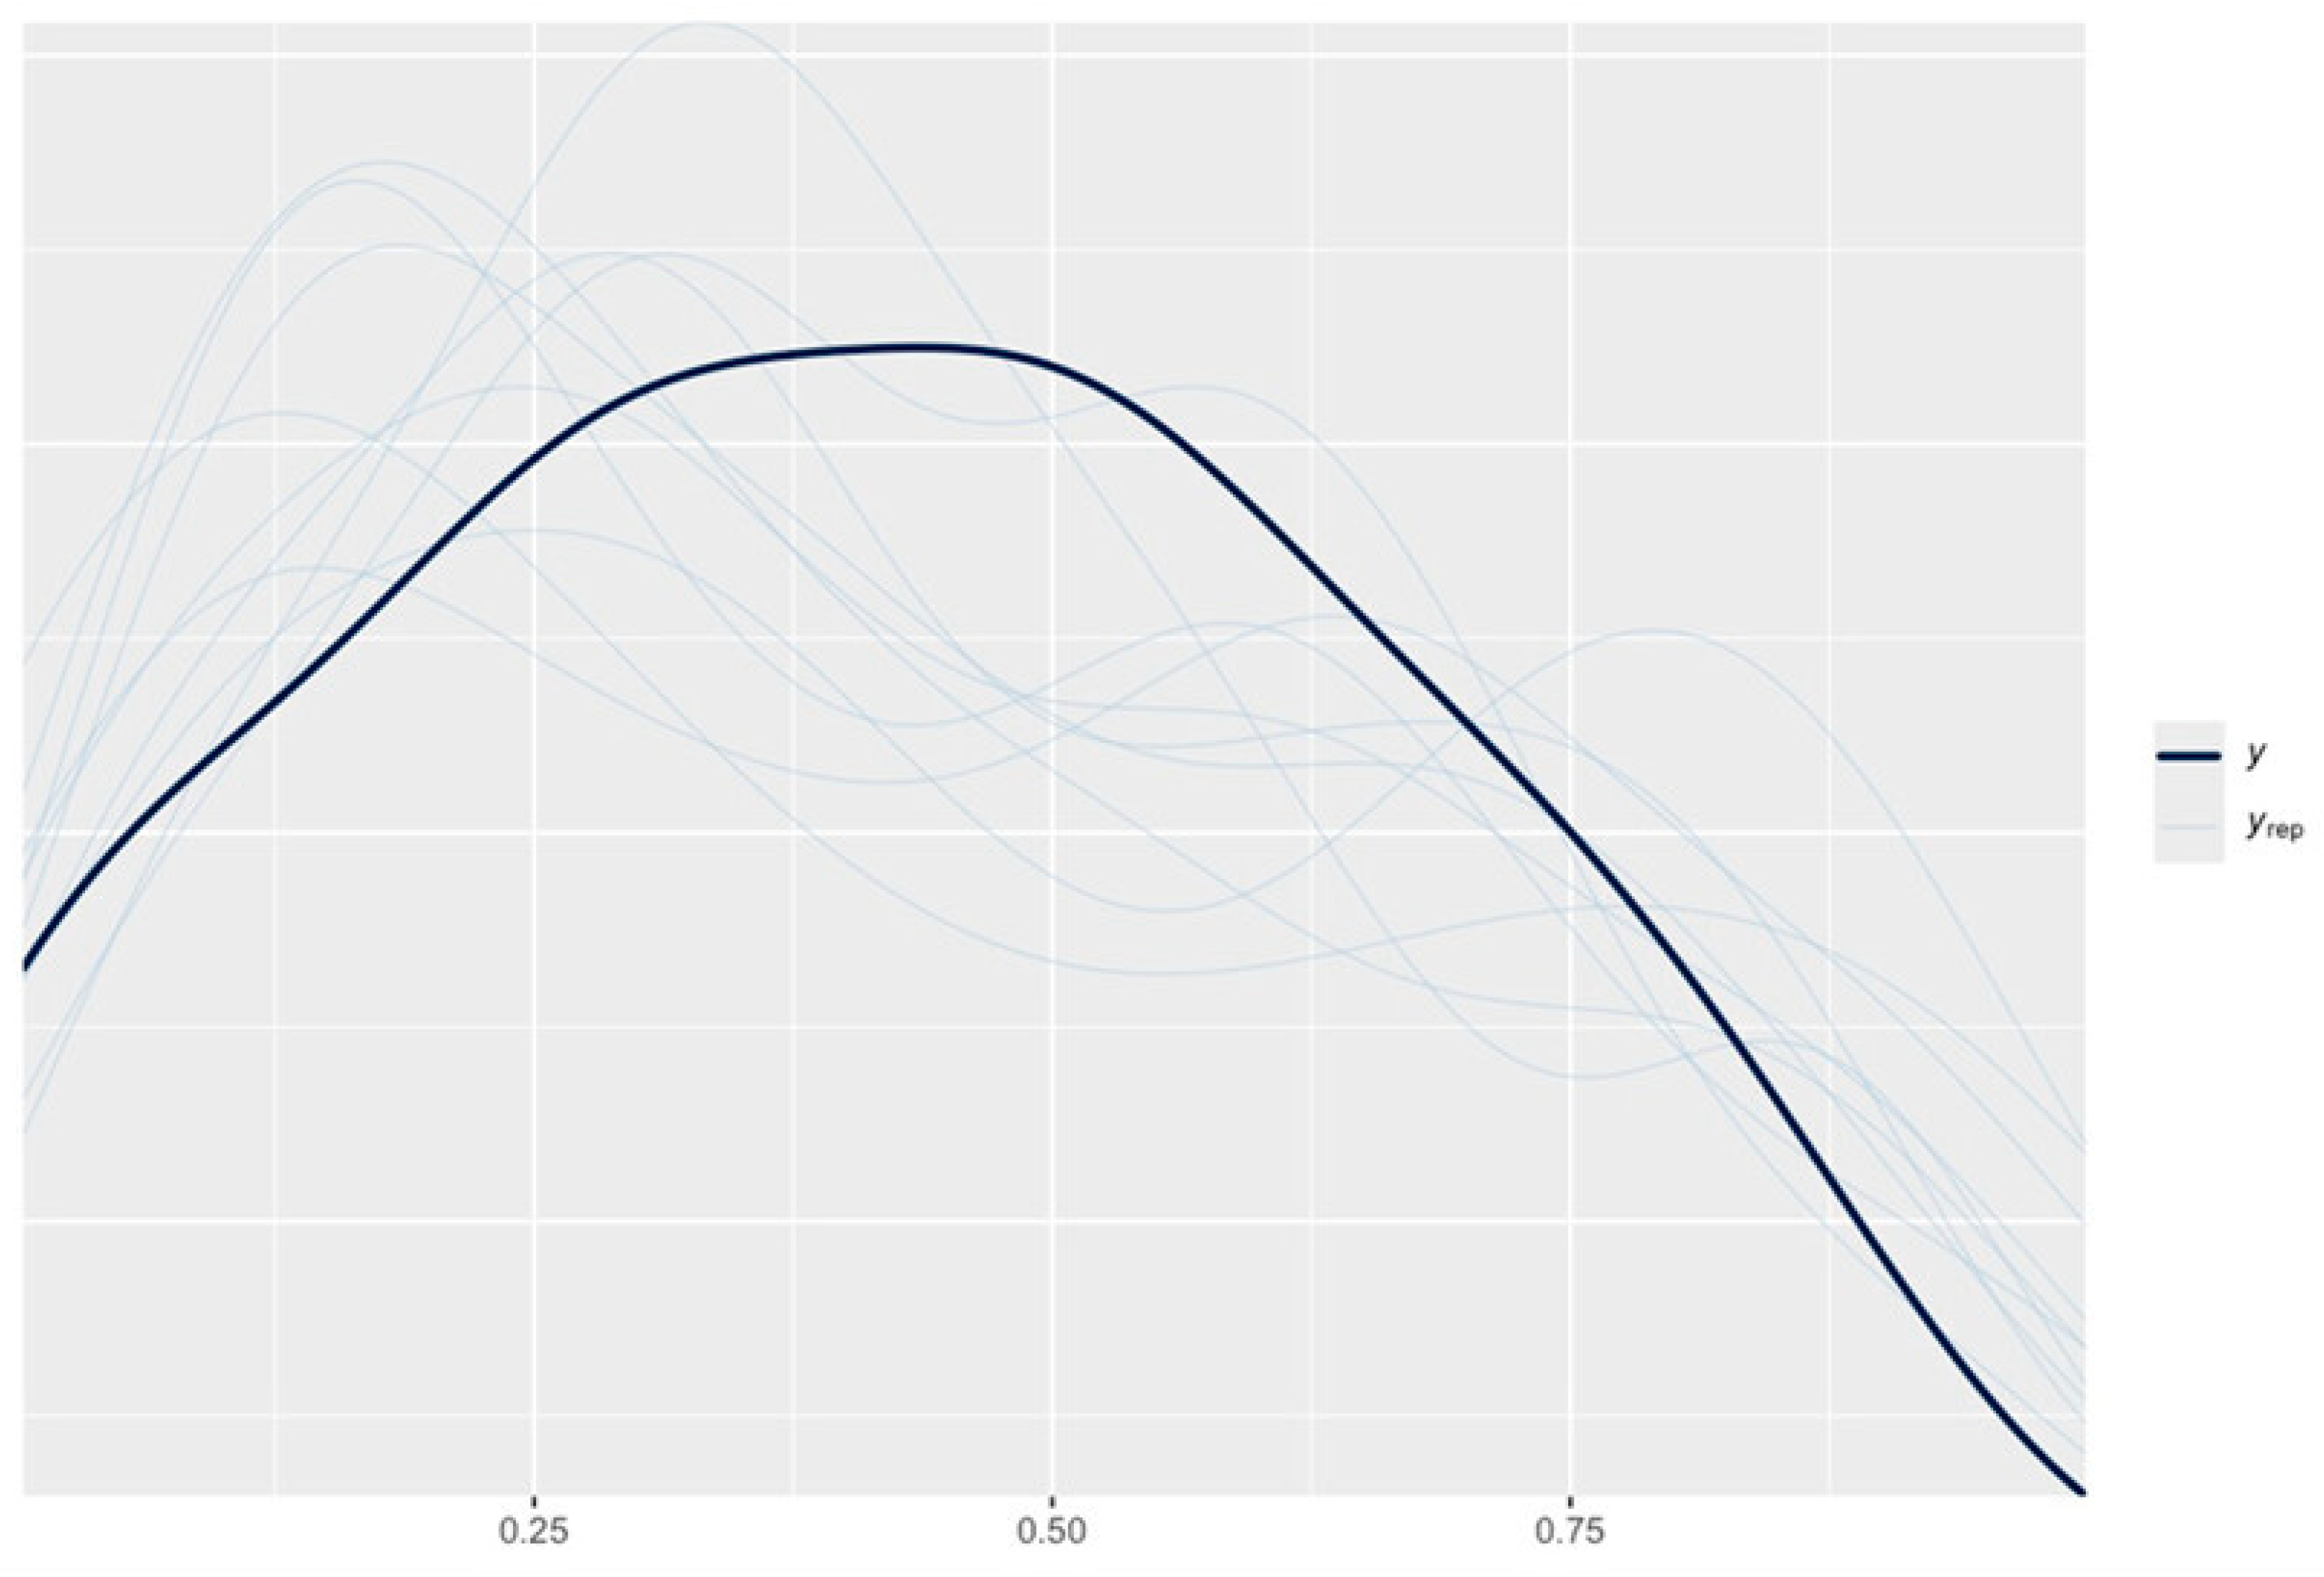
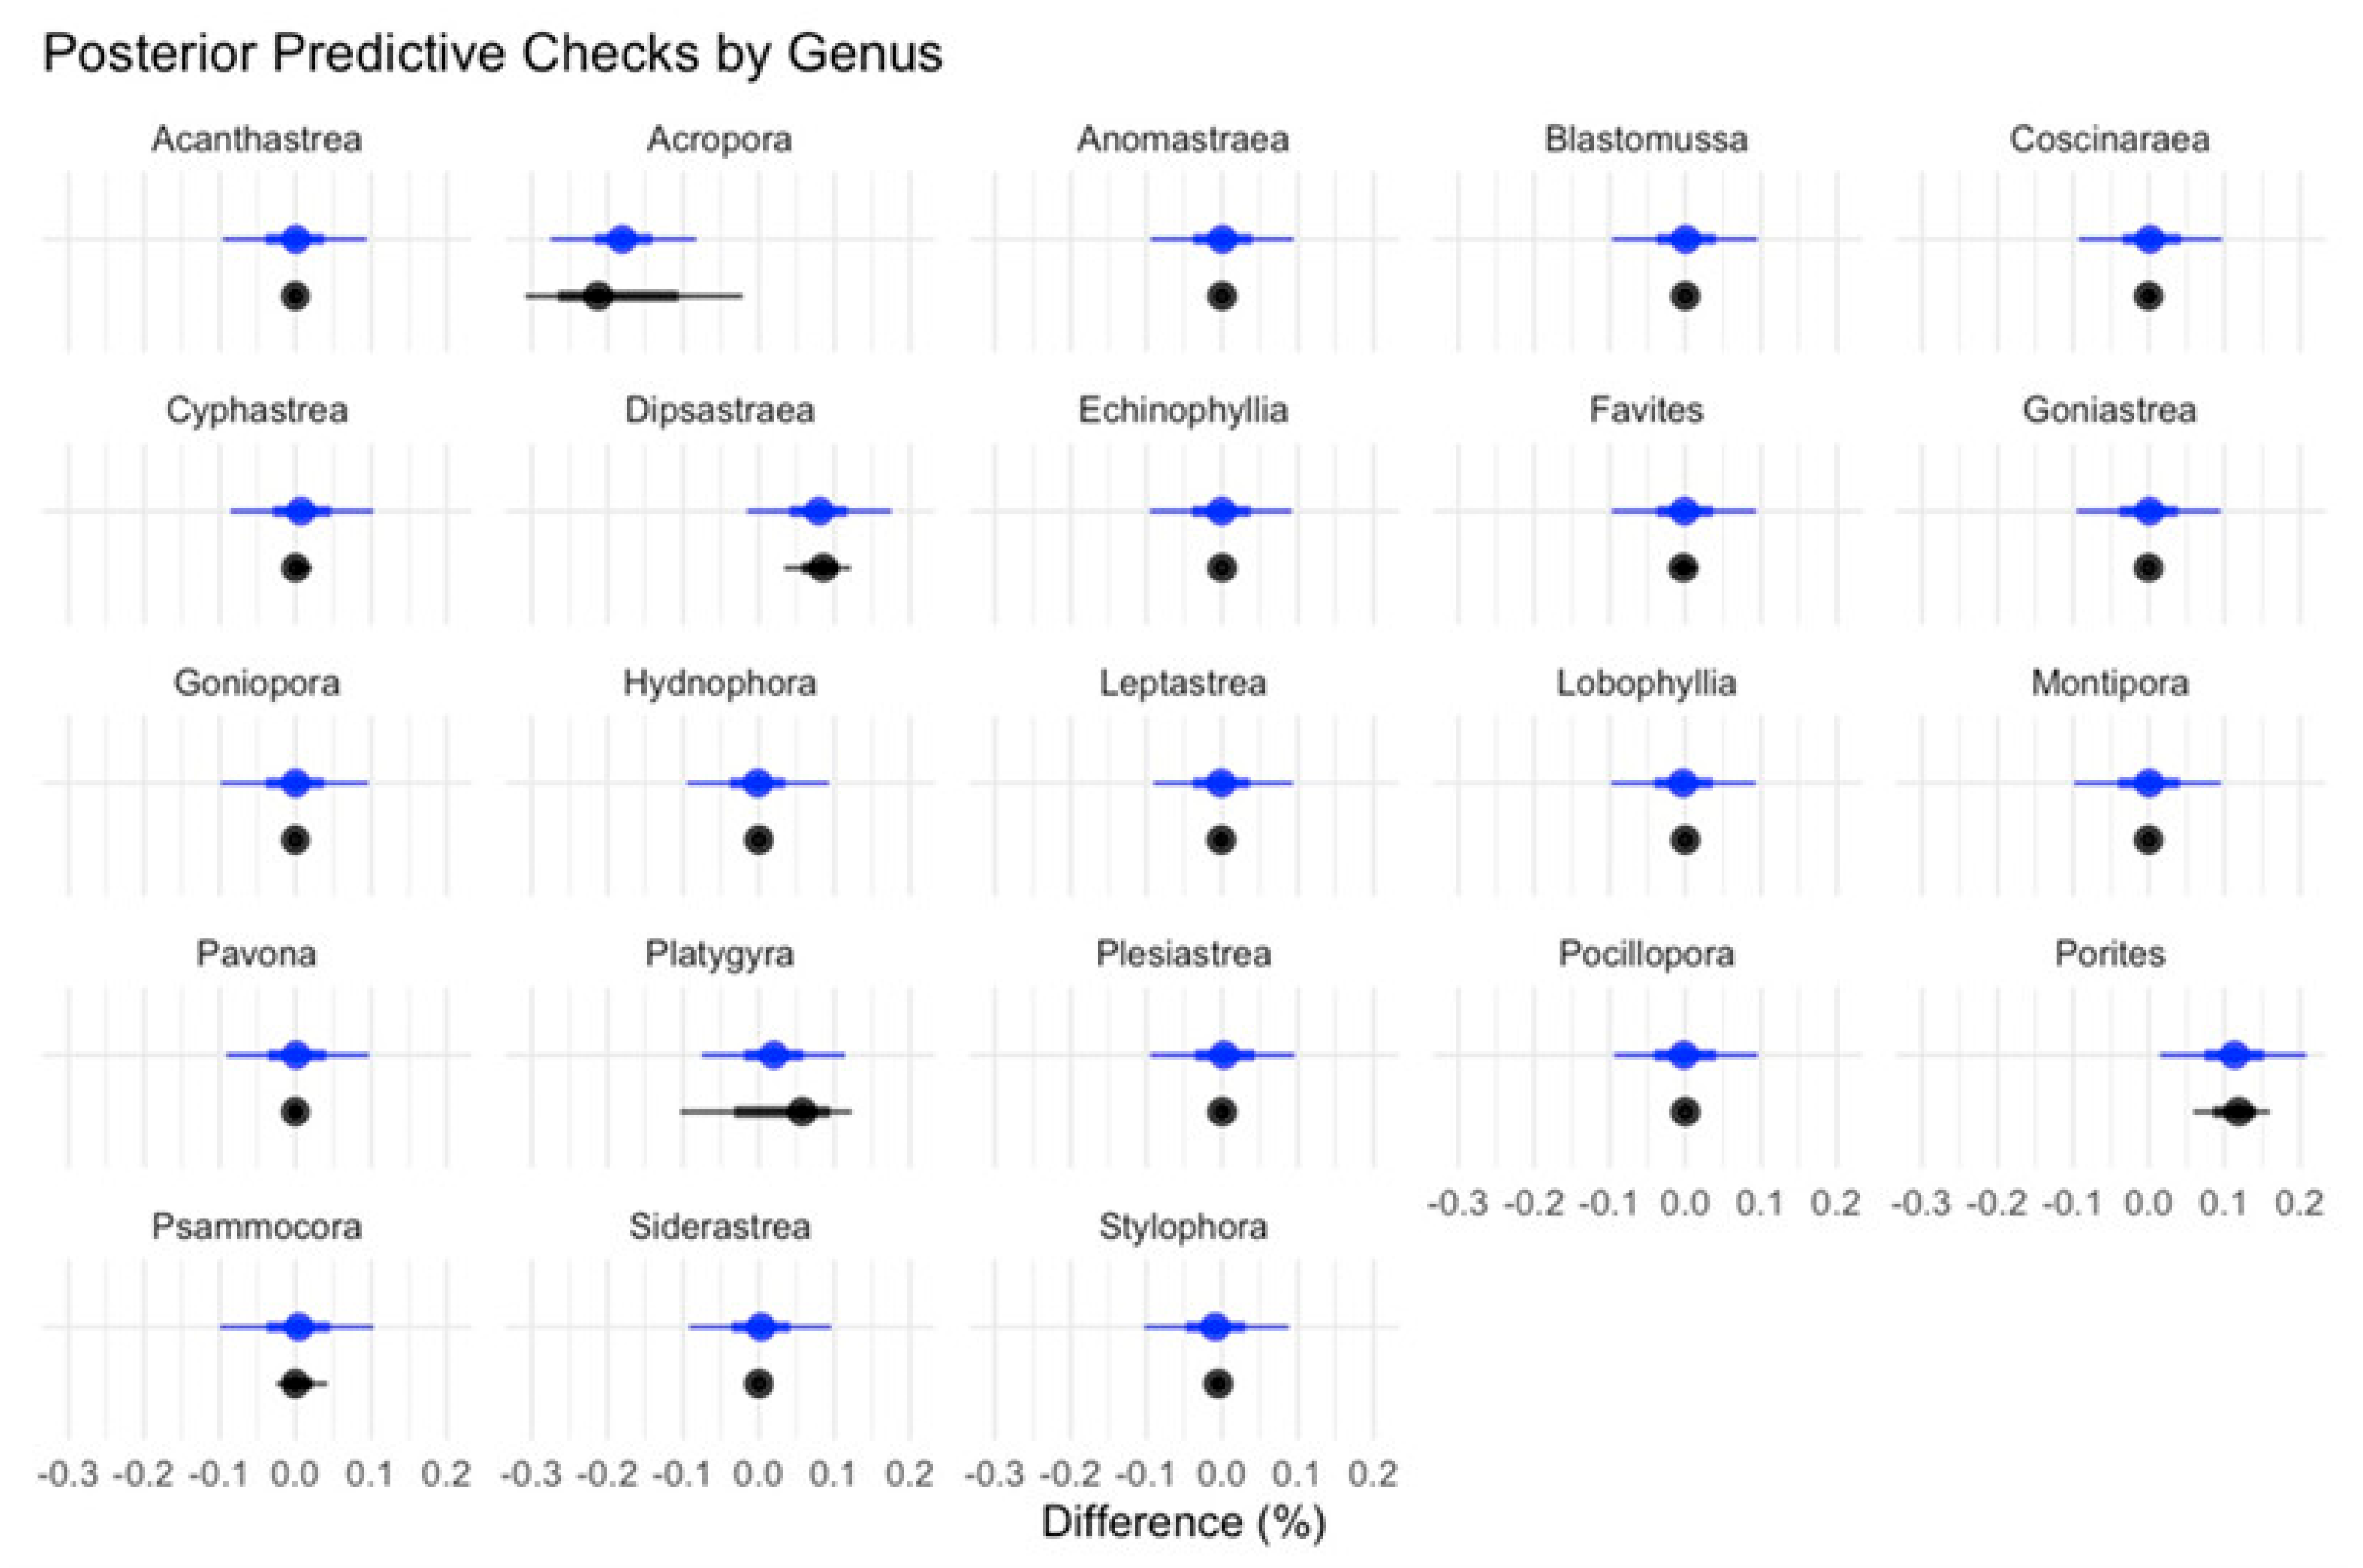
To assess the effect of the bleaching event on percentage live coral cover, we fitted two Bayesian logistic models using the R package “brms” (version 2.21.0) [28], where the response variables were (1) proportion of live coral on Khor Fakkan and (2) proportion of live coral on SBN reefs. Bleaching period was included as a fixed effect term, and site was included as a blocking factor. Models were run with a beta error distribution, as the response variable (proportion of live coral cover) ranged between 0 and 1 [29]. We also fitted two Bayesian linear models to assess the differences in the proportional contribution of coral genera to total coral cover between the pre-bleaching and post-bleaching periods, where the response variables were absolute difference in proportional cover of coral genera between pre-bleaching and post-bleaching periods on (1) Khor Fakkan reefs and (2) SBN reefs. These models were run with a Gaussian error distribution and included genus as a fixed effect term and site as a blocking factor. For each model, there were three site categories (SBN: SBN-N, SBN-W, SBN-S; Khor Fakkan: Martini Bay, Martini Wall, Shark Island) and three bleaching period categories (pre-bleaching, during bleaching, post-bleaching). Each sampling event consisted of six transects (e.g., six transects for SBN-N pre-bleaching, six transects for SBN-N during bleaching, six transects for SBN-N post-bleaching, etc.). All models were run with weakly informative priors [30] (Table A3). The posterior distributions of model parameters were estimated using Hamiltonian Monte Carlo methods by using four chains of 5000 iterations and a warmup of 2000. Model fit and convergence was assessed visually using parameter trace plots and posterior prediction plots as well as assessing Rhat values (all Rhat = 1) [31] (Figure A2, Figure A3, Figure A4, Figure A5, Figure A6, Figure A7, Figure A8 and Figure A9).
We complemented the Bayesian models, which provided insight into changes in coral cover across bleaching periods, with multivariate techniques to better understand broader shifts in benthic composition. These multivariate techniques consisted of (1) visualizing benthic shifts using non-metric multidimensional scaling (nMDS) ordinations based on Bray–Curtis dissimilarity matrices of square-root-transformed, Wisconsin-double-standardized percentage benthic cover data for Khor Fakkan and SBN, (2) testing the effect of bleaching period on benthic composition using permutational multivariate analysis of variances (PERMANOVAs) on each of the dissimilarity matrices, with bleaching period as a fixed effect and site as a blocking factor, (3) assessing the main drivers of the difference between the benthic communities surveyed across bleaching periods using a similarity percentage analysis (SIMPER) analysis and (4) assessing changes in multivariate dispersion between bleaching periods (beta diversity) using the permutational multivariate analysis of dispersion (PERMDISP2) procedure. All multivariate analyses were conducted using the R package “vegan” (version 2.6-4) [32].
Except where otherwise noted, all analyses were conducted using R Version 4.3.0. [33]. Figures were produced using the R package “ggplot2” (version 3.5.0) [34]. The map was produced using the R package “ggmap” (version 4.0.1) [35].

3. Results

During the 2021 bleaching period, water temperatures reached a high of 36.1 °C in Khor Fakkan and 36.7 °C in SBN. Mean temperatures were above the Gulf of Oman bleaching threshold of 32 °C for 76 days across sites in Khor Fakkan, and 38 days were above the Arabian Gulf bleaching threshold of 34 °C in sites across SBN (Figure 2). Mean DHW was 4.1 °C-weeks in Khor Fakkan and 3.0 °C-weeks in SBN.
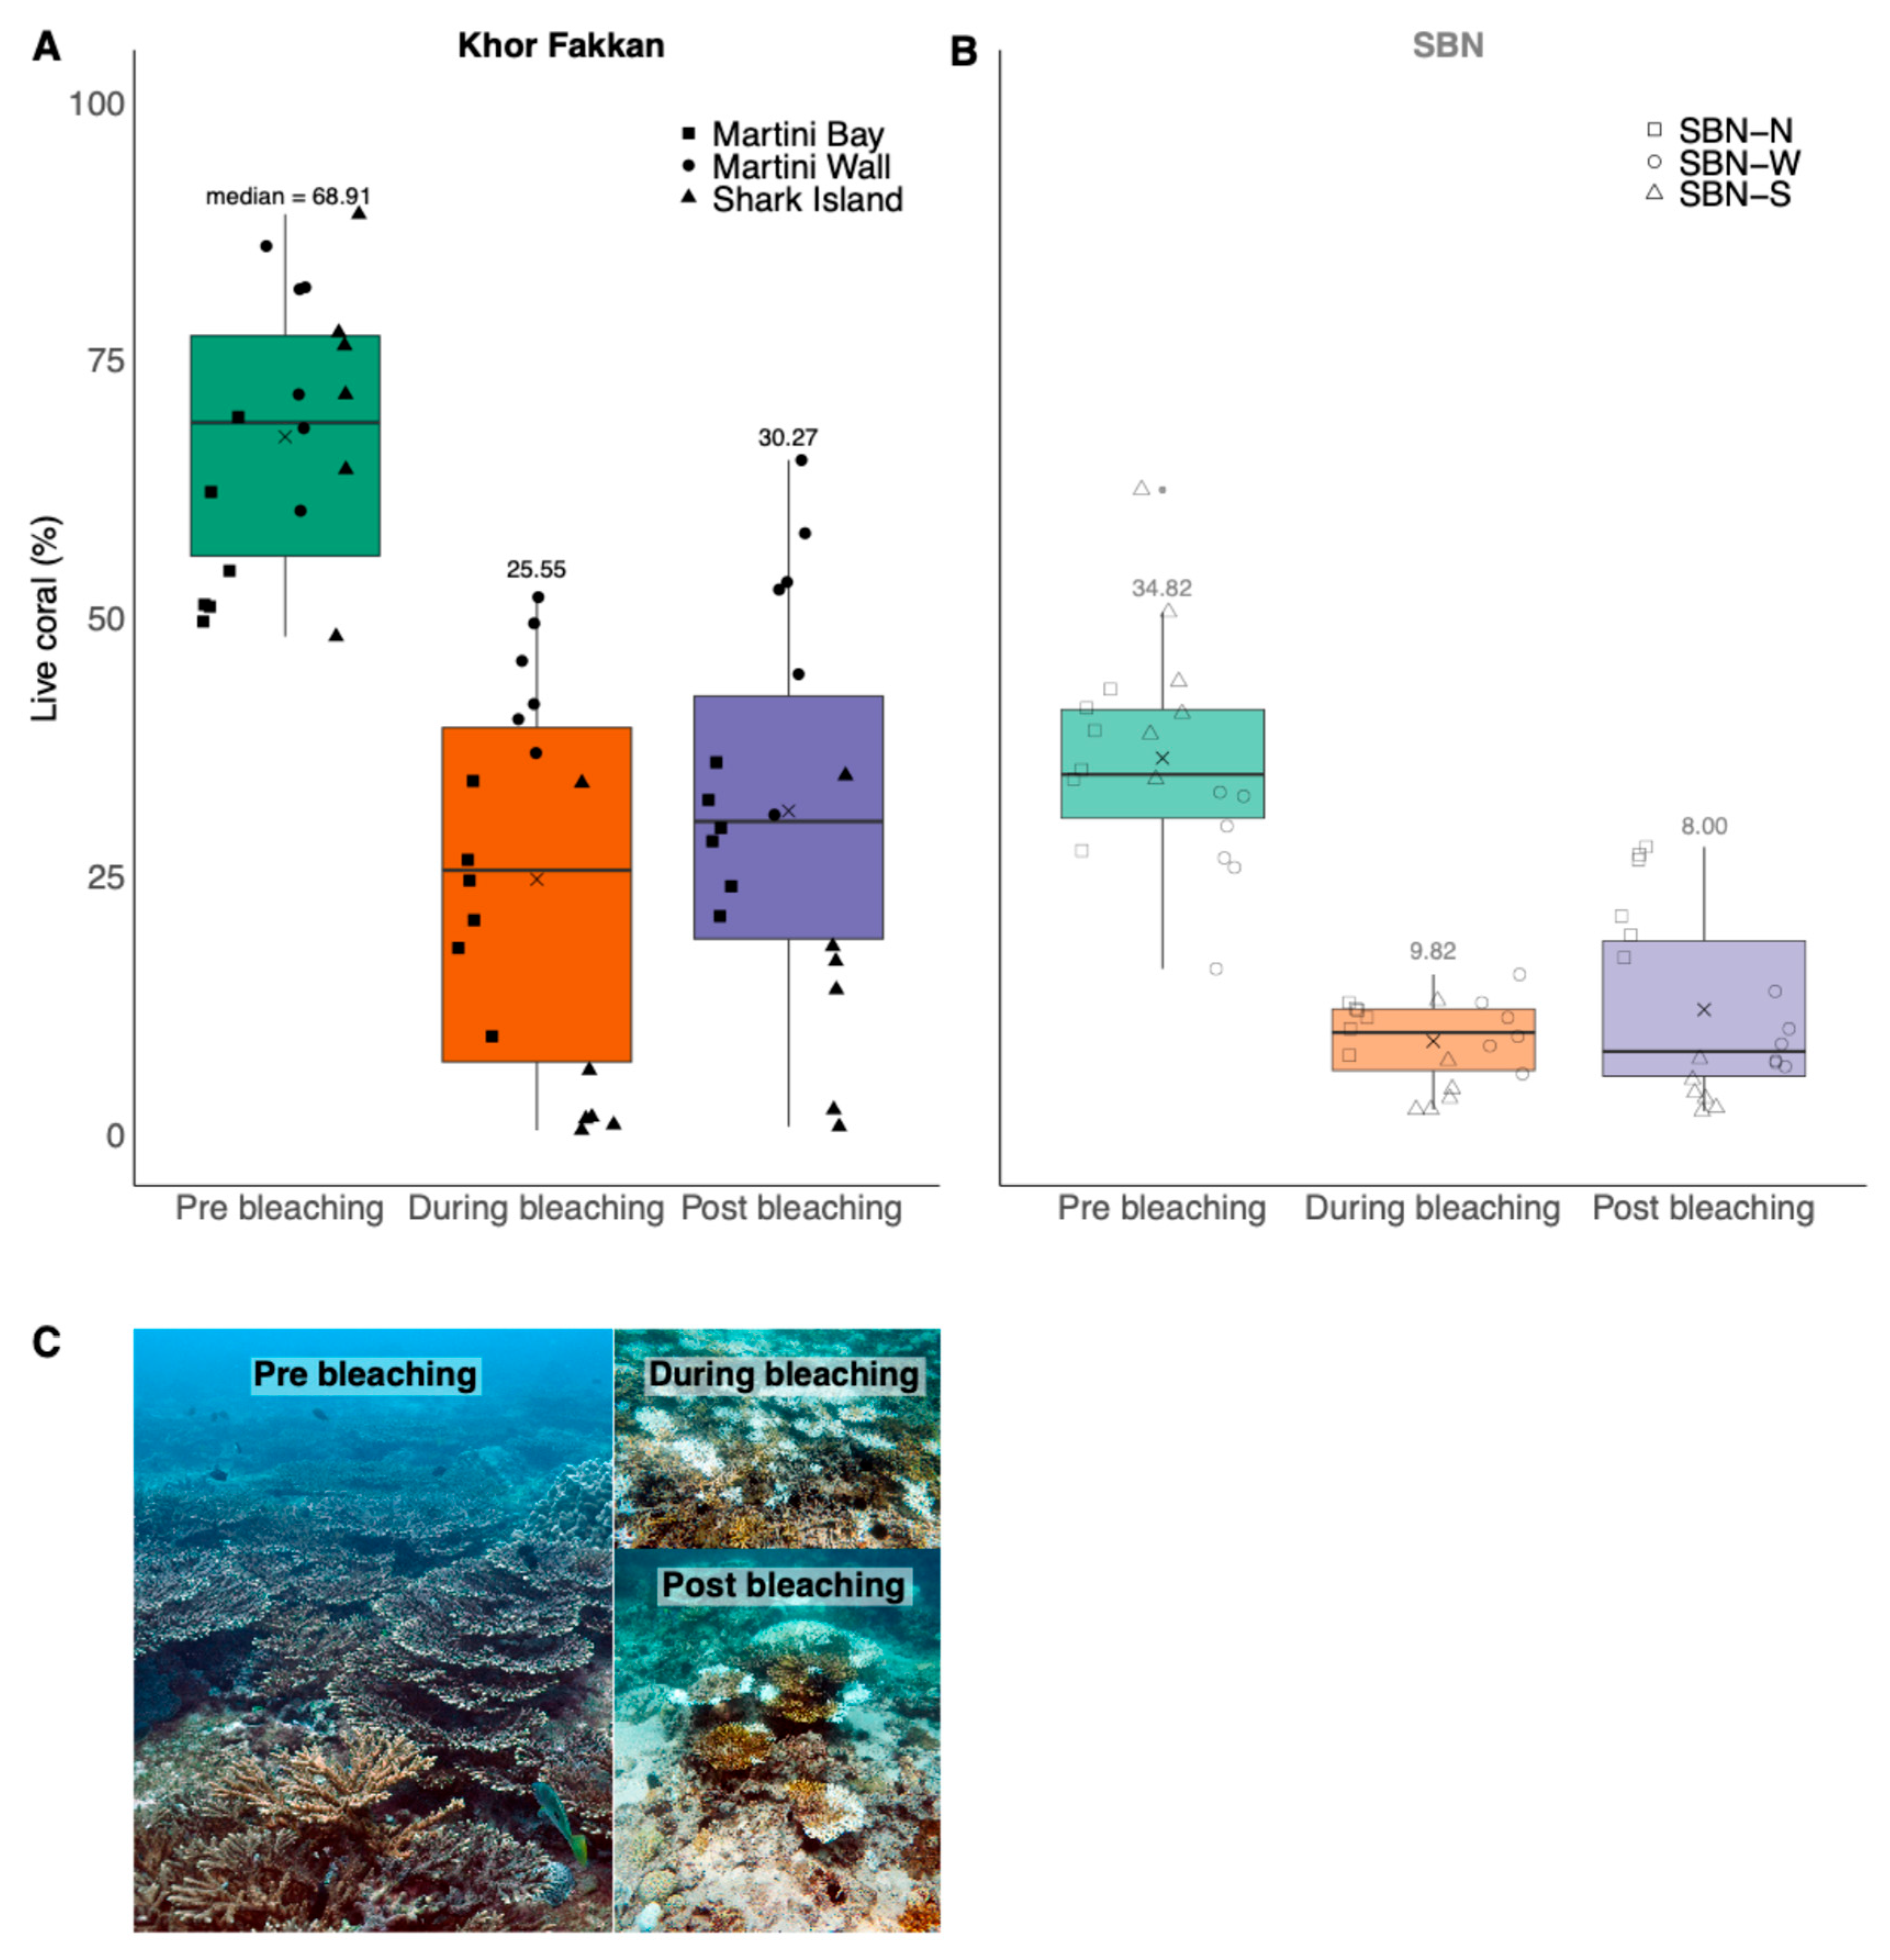
Prior to bleaching, all sites had substantial live coral cover (Figure 3). For the “during-bleaching” surveys, the Khor Fakkan reefs experienced 40.68% (±10.30 SE) bleaching of hard corals (i.e., nearly half of the coral cover was bleached), while SBN experienced 92.75% (±2.36 SE) bleaching of hard corals (i.e., nearly all coral cover was bleached). Bayesian logistic regression models demonstrated that live coral cover on the Khor Fakkan reefs was negatively affected by bleaching (mean effect size during bleaching = −2.12, 95% confidence interval (CI) [−2.62, −1.61]; mean effect size post-bleaching = −1.70, 95% CI [−2.19, −1.21]). Pre-bleaching mean coral cover was significantly reduced at Khor Fakkan (Figure 3A; Table A1 and Table A2), representing a loss of over half of the live coral cover over the monitoring period. Our model assessing the effect of bleaching on live coral cover on the Khor Fakkan reefs had substantial explanatory power (R2 = 0.76, 95% CI [0.68, 0.81]). Similarly, live coral cover on SBN was also negatively affected by bleaching (mean effect size during bleaching = −1.68, 95% CI [−2.05, −1.31]; mean effect size post-bleaching = −1.46, 95% CI [−1.81, −1.11]). Pre-bleaching mean coral cover on SBN was significantly reduced post-bleaching (Figure 3B; Table A1 and Table A2), representing a loss of over two-thirds of the live coral over the monitoring year. Our model assessing the effect of bleaching on live coral cover on SBN also had substantial explanatory power (R2 = 0.71, 95% CI [0.60, 0.78]).
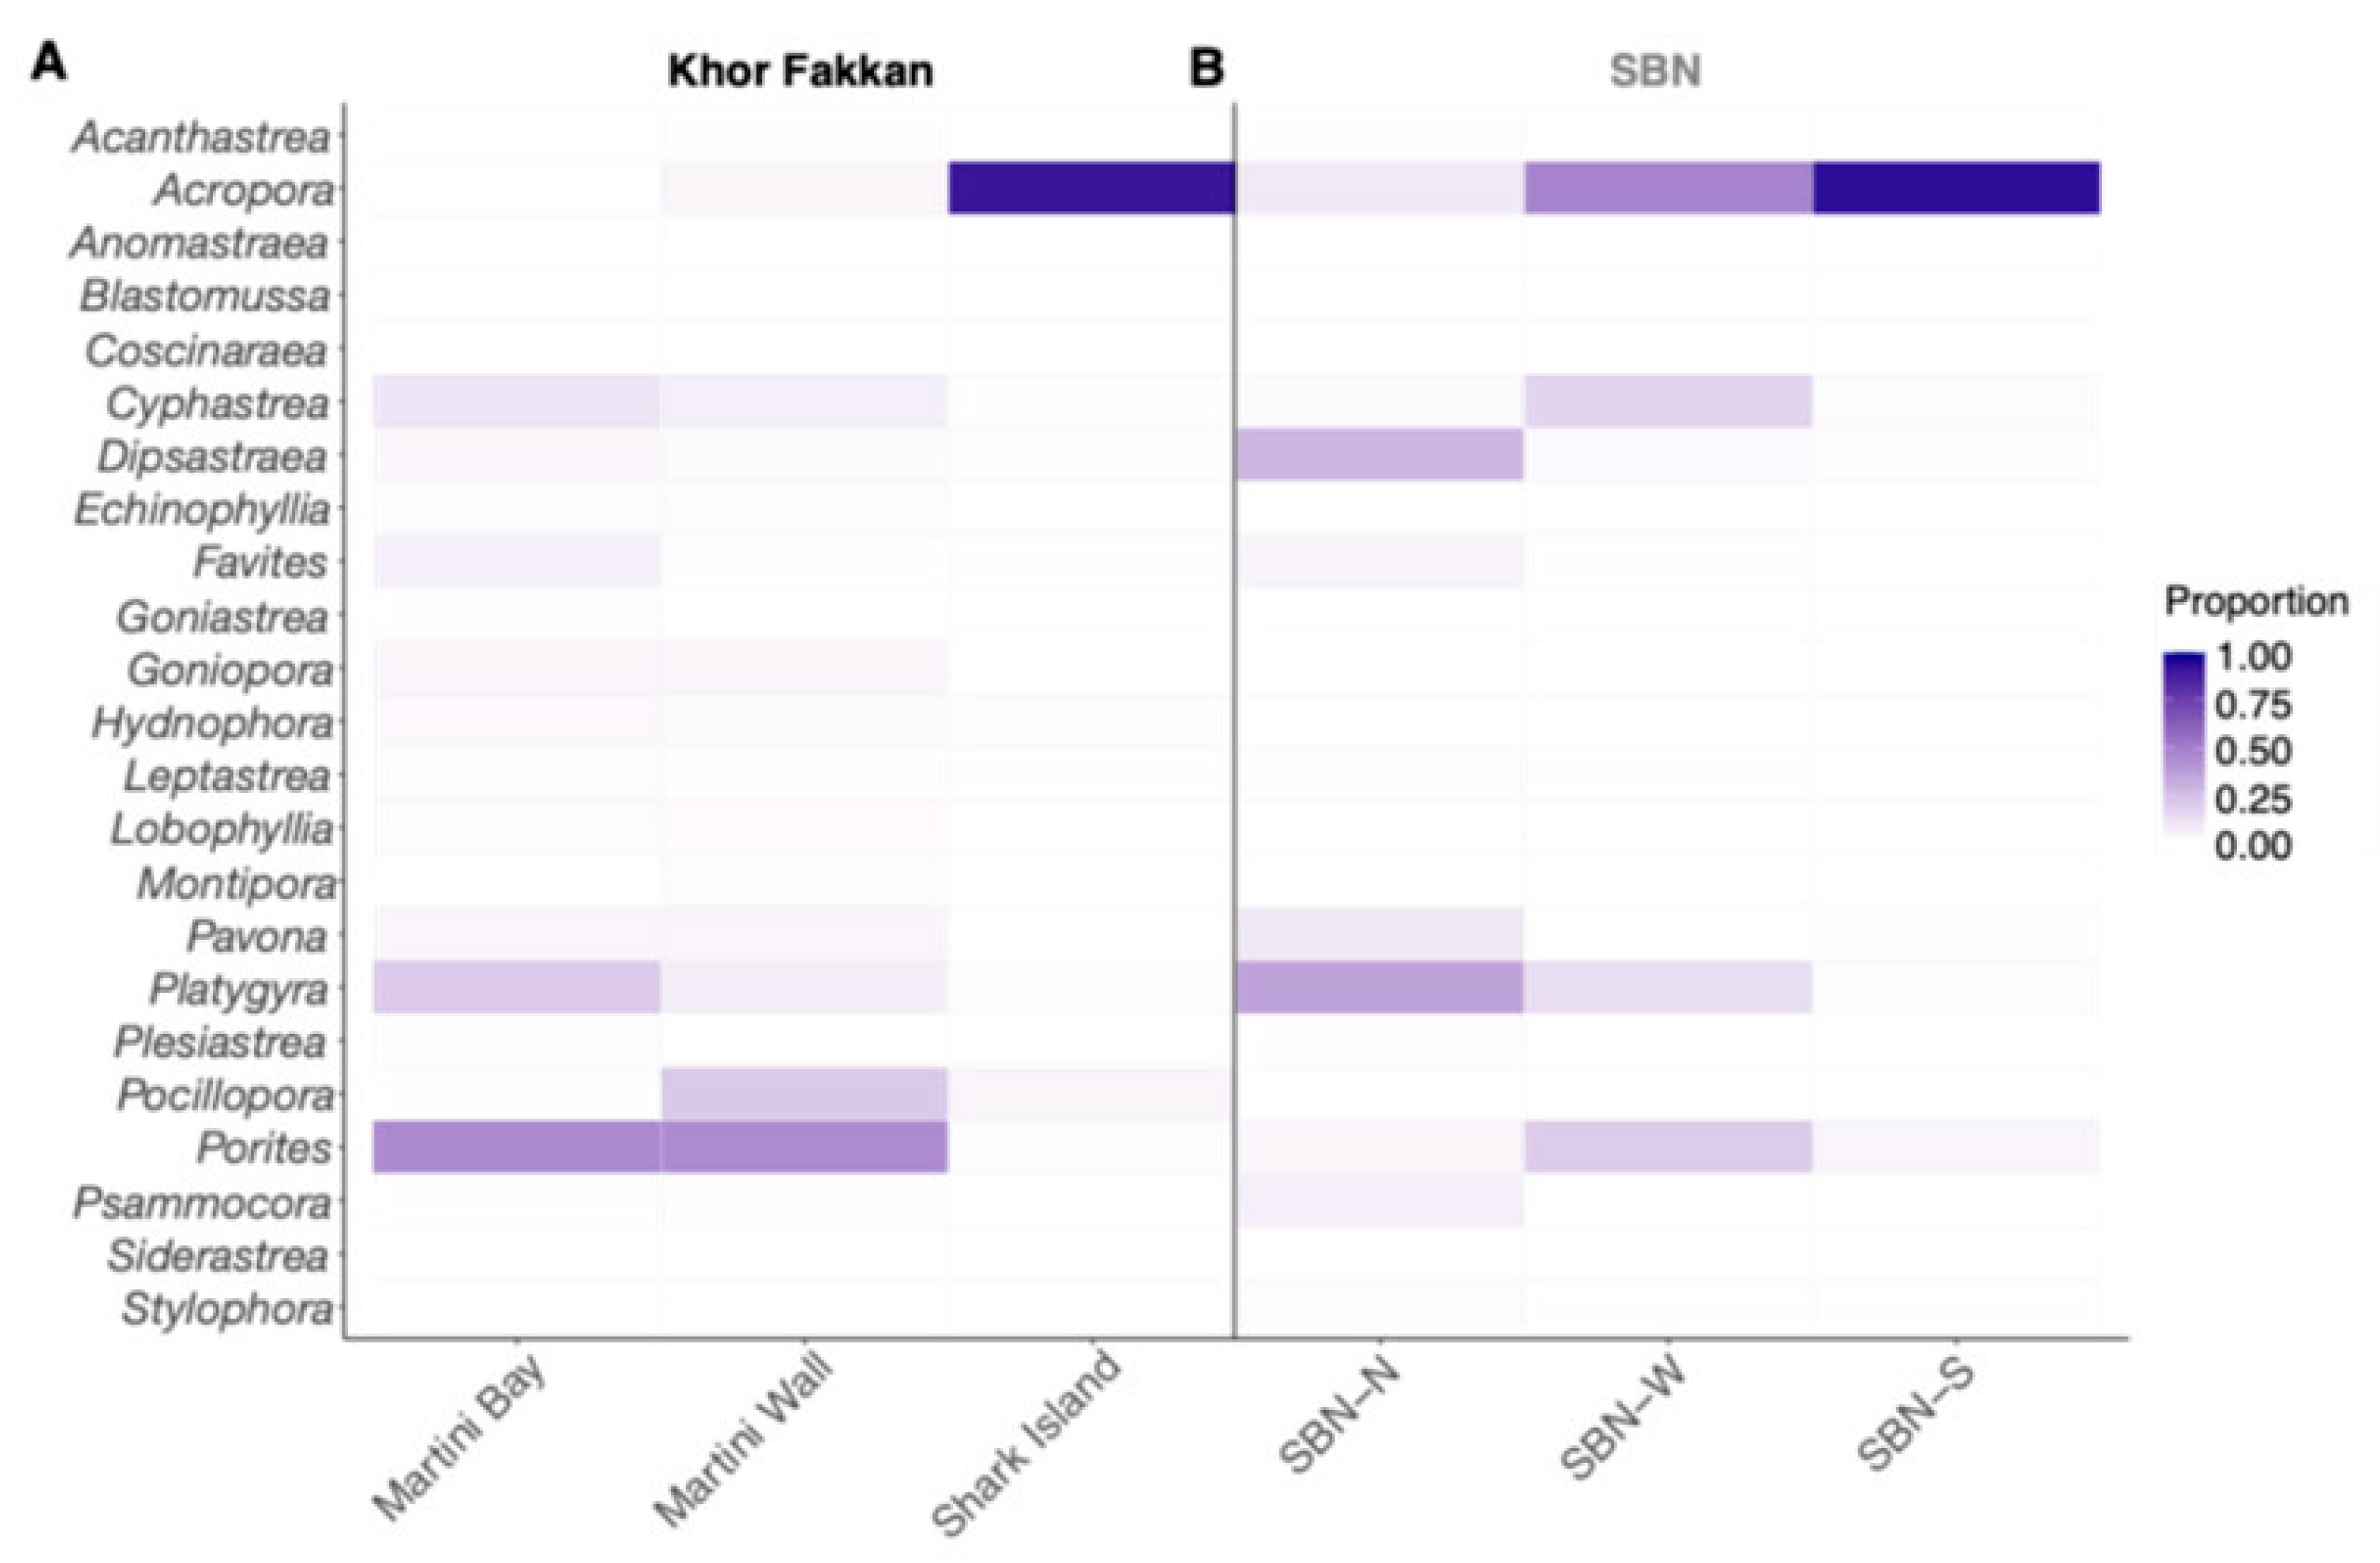
Prior to bleaching, Acropora dominated coral cover at several sites, particularly Shark Island (90 ± 0.03% SE) and SBN-S (93 ± 0.02% SE). Other coral genera also represented large proportions of coral cover, including Porites (Martini Bay = 45 ± 0.03% SE; Martini Wall 45 ± 0.03% SE; SBN-W = 20 ± 0.03% SE), Platygyra (SBN-N = 36 ± 0.06% SE; Martini Bay = 20 ± 0.04% SE)), Dipsastraea (SBN-N = 28 ± 0.04% SE) and Pocillopora (Martini Wall = 21 ± 0.06% SE) (Figure 4).
There were substantial changes in the proportional composition of coral communities before and after bleaching, particularly for Acropora (Figure 5). We found that in Khor Fakkan, the proportion of Acropora decreased between the pre-bleaching and post-bleaching periods (posterior mean difference = −19.01%, mean conditional effect size = −0.19, 95% CI [−0.34, −0.04]), and the proportion of Porites increased (posterior mean difference = 19.88%, mean conditional effect size = 0.20, 95% CI [0.04, 0.36]). Our model explained 42.91% of the variance (R2 = 0.43, 95% CI [0.32, 0.52]). In SBN, the proportion of Acropora decreased between the pre-bleaching and post-bleaching periods (posterior mean difference = −17.60%, mean conditional effect size = −0.18, 95% CI [−0.26, −0.09]), and we observed increases in the proportion of Porites (posterior mean difference = 11.27%, mean conditional effect size = 0.11, 95% CI [0.03, 0.19]) and Dipsastraea (posterior mean difference = 8.11%, mean conditional effect size = 0.08, 95% CI [0.0002, 0.16]). Our model explained 56.47% of the variance (R2 = 0.56, 95% CI [0.46, 0.64]).
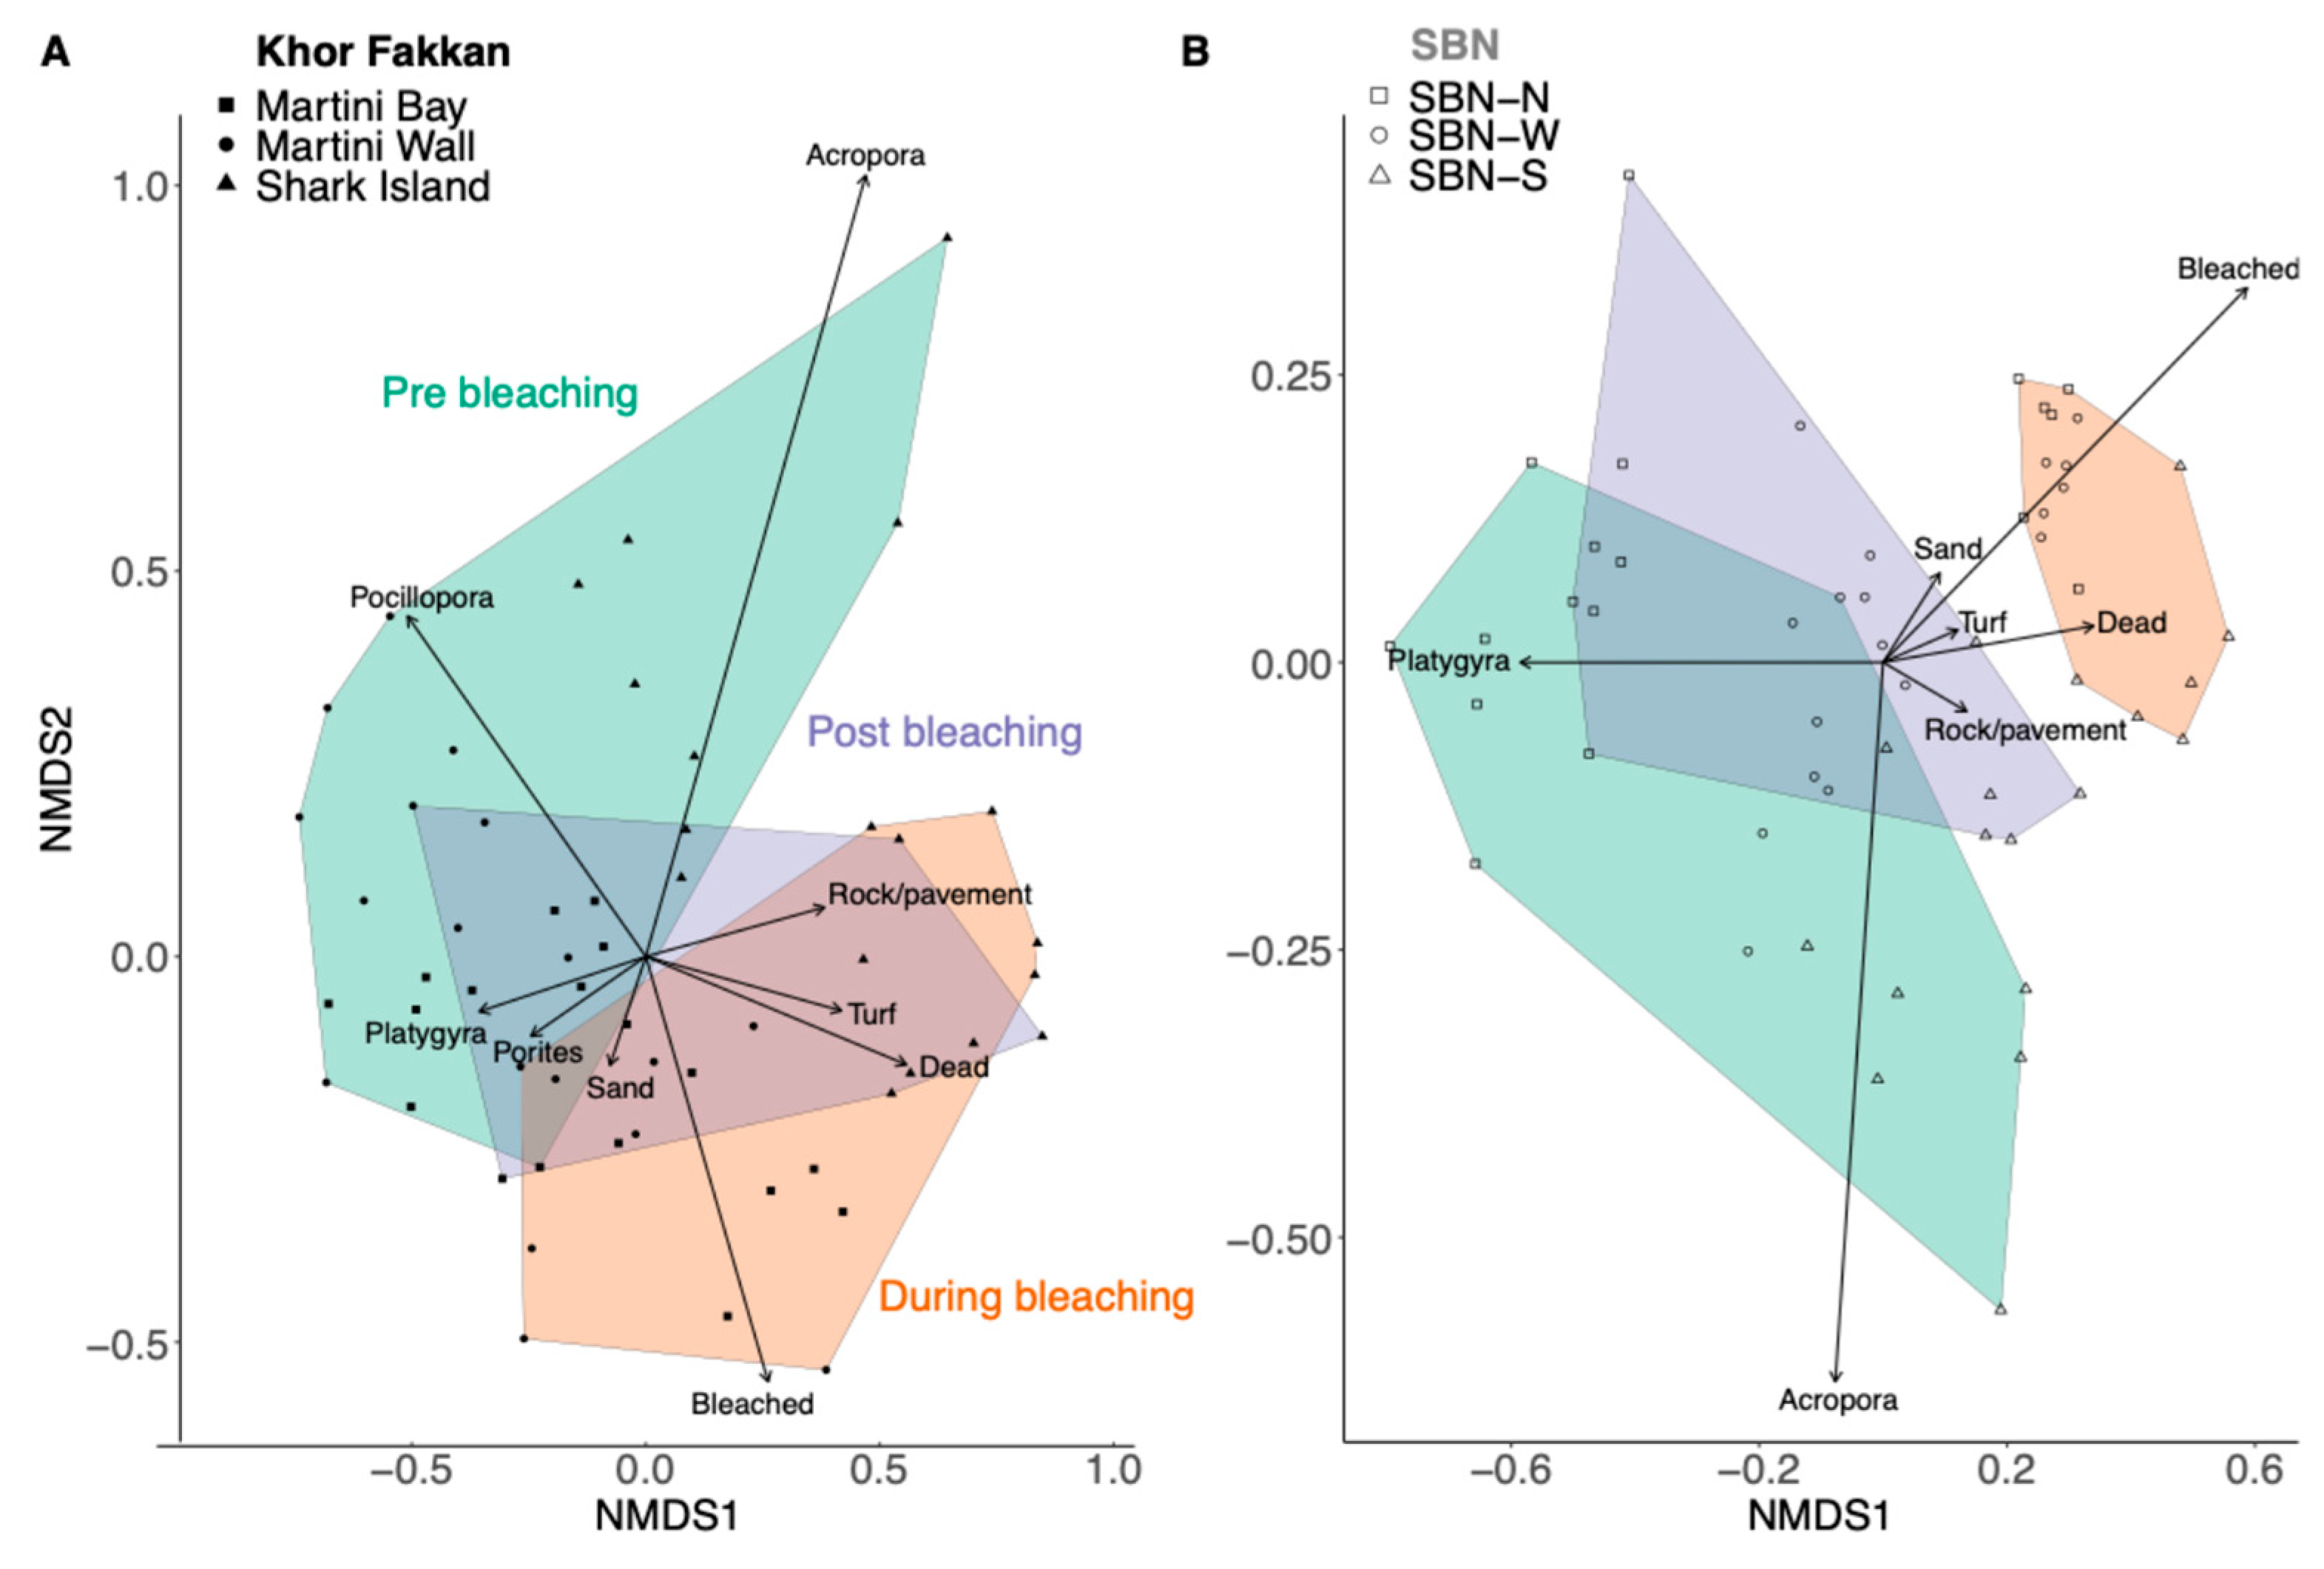
The overall benthic composition (not limited to coral) changed during the three bleaching periods at both locations (Figure 6; Table A6). On the Khor Fakkan reefs, the top three primary drivers of the difference between the pre-bleaching and post-bleaching benthos were decreased Acropora (SIMPER 19.9%, p = 0.002), increased rock/pavement (SIMPER 12.4%, p = 0.002) and decreased Pocillopora (SIMPER 5.9%, p = 0.009; Table A4). At SBN, the top three primary drivers of the difference between the pre-bleaching and post-bleaching benthos were increased turf algae (SIMPER 23.4%, p = 0.001), decreased Acropora (SIMPER 21.8%, p = 0.001) and increased rock/pavement (SIMPER 8.5%, p = 0.024; Table A5).
Statistical dispersion is a way of measuring community heterogeneity and specifically how different individual samples are from the multivariate average [36]. For the Khor Fakkan reefs, the mean community dispersion was significantly different between some survey periods (PERMDISP F2,51 = 4.37, p = 0.02). Specifically, the pre-bleaching period had a higher dispersion (0.40 ± 0.03) than the during-bleaching period (0.30 ± 0.02 SE; p = 0.01), but there was no significant difference between the post-bleaching period (0.32 ± 0.02 SE) and the during-bleaching (p = 0.41) or pre-bleaching periods (p = 0.07). For SBN, the mean community dispersion was significantly different between all survey periods (PERMDISP F2,51 = 14.943, p < 0.0001, all pairwise p < 0.05). The pre-bleaching period had the highest dispersion (0.26 ± 0.02), followed by the post-bleaching period (0.18 ± 0.01 SE), whereas the during-bleaching period had the lowest dispersion (0.14 ± 0.01 SE).

4. Discussion

The frequency and severity of coral reef bleaching events in the UAE has been increasing rapidly [3], mirroring global patterns associated with climate change [37]. We demonstrate the impacts of the 2021 bleaching event on two regions of the UAE that had previously maintained high coral cover, including the nation’s last remaining strongholds of Acropora. The event caused substantial declines in live coral cover and marked shifts in benthic community structure, with only limited recovery eight months after bleaching.
The 2021 bleaching event resulted in a decline of more than half of the live coral cover across sites in both the Arabian Gulf and Gulf of Oman regions of the UAE. Bleaching of corals in the Arabian Gulf is estimated to require three weeks at daily mean temperatures at or above 35 °C or eight to nine weeks at or above 34 °C [27], while the bleaching threshold for corals in the Gulf of Oman is estimated at 32 °C [26]. During the 2021 bleaching event, SST at SBN exceeded 34 °C for 38 days (5.4 weeks) and reached ≥ 35 °C on 9 days, while SST at Khor Fakkan exceeded 32 °C for 76 days (10.9 weeks) (Figure 2). However, these estimates are based on satellite-derived SST data, which are less accurate than in situ bottom measurements. Satellite-derived SST estimates in coastal environments can be compromised due to pixel mixing with land, shallow-water thermal variability and atmospheric effects [38]. While in situ data were not available for our study, satellite data are widely available and provide consistent spatial and temporal coverage across study sites. Documenting bleaching impacts using such data can therefore provide an accessible and locally relevant means of assessing thermal stress across multiple sites, especially where long-term in situ monitoring is not feasible. For example, using NOAA’s Coral Reef Watch DHW product, we found that Khor Fakkan experienced 4.08 °C-weeks and SBN experienced 3.01 °C-weeks of accumulated heat stress. Reef-wide bleaching is typically observed once DHW reaches 4 °C-weeks, and DHW values of 8 °C-weeks or more are often associated with significant mortality in heat-sensitive corals [39]. However, our results show significant bleaching at SBN with the product estimations only at 3.01 °C-weeks, highlighting the need to adjust interpretations of global satellite-derived products for local bleaching monitoring, reflecting earlier findings from this region [7].
The differences in bleaching thresholds between Arabian Gulf and Gulf of Oman corals reflect the different histories of bleaching events in the different regions. Repeated high-temperature bleaching events have selected for high temperature tolerance among Arabian Gulf corals, such that only the most thermotolerant taxa remain. Such stress-tolerant assemblages represent the outcome of “coral species winnowing” associated with bleaching, in which diversity is lost, and the remaining coral communities become more homogeneous and dominated by stress-tolerant species [40,41]. In contrast, widespread bleaching had never previously been reported on the Gulf of Oman coast of the UAE, which has higher coral diversity, including more thermally sensitive taxa, such as members of the families Acroporidae and Pocilloporidae [2,25,42].
Our results showed substantial shifts in benthic community structure across both regions. At both Khor Fakkan and SBN, the prevalence of Acropora declined, while more bleaching-resistant genera such as Porites and Dipsastraea proportionally increased (Figure 5; Table A1 and Table A2). Major shifts in low-abundance genera may also have occurred, but our sampling method and proportional-contribution analysis were less sensitive to detecting possible changes in these groups.
Prior to the 2021 bleaching event, SBN was recognized as a unique refuge for Acropora in the Arabian Gulf [20]. Coral reefs surrounded by cool deeper waters, such as those at SBN, can experience a buffering effect from a build-up in thermal stress, as pulses of locally upwelled colder water mix with, and cool down, the corals in shallower waters [43]. Tidal flushing has been demonstrated to be important for cooling the surface waters at SBN and for moderating summer temperatures [20,21]. This cooling, along with the absence of dredging and other coastal development disturbances, likely contributed to the persistence of healthy Acropora at SBN before the 2021 bleaching event [22].
Although the proportional cover of Acropora in SBN declined sharply following the 2021 bleaching event, some cover remained. Larval recruitment can be important for the rapid recovery of coral, including after mass mortality events [44,45,46]. Acropora populations at SBN are thought to be largely self-seeding, however, so the loss of fecund colonies there poses a risk to future recruitment [22]. Recovery is possible, as Acropora is characterized as having a “competitive” life-history strategy and rapid growth [47]. Previous studies, including studies from the UAE, have documented rapid post-disturbance recovery by Acropora [44,48,49,50], but the increasing frequency of marine heatwaves in the Arabian Gulf means that coral may not have enough time to recover in the future [3].
The loss of relatively healthy Acropora at SBN represents the loss of one of the last potential sources of Acropora larvae that could have contributed to the recovery of the highly impacted reefs in the southern Arabian Gulf. Burt et al. [5] observed recovery of Acropora on Dubai reefs ten years after Riegl [4] reported complete mortality of these corals during the late 1990’s bleaching events. Recovery was suggested to be due to coral larvae that were transported from outside reefs, including SBN, that were less affected by bleaching [27]. Several studies have shown low coral settlement after bleaching events in the southern Arabian Gulf, and more specifically a paucity of Acropora recruitment [19,51].
It is more likely that communities in the Gulf of Oman will recover, as the recruitment pool is larger and reef-level fecundity estimates are higher, and colony survival should be higher since environmental conditions are more benign [19,52]. Juvenile recruitment was observed on Gulf of Oman reefs following the devastating impacts of cyclone Gonu (2007) and the subsequent harmful algal bloom (2008–2009), suggesting capacity for recovery [1,19]. However, this 2021 bleaching event contributes to further reducing coral cover on the UAE’s Gulf of Oman coast [53], and reef-wide fecundity of Acropora could be reduced with decreasing abundance, which may hinder recovery [52]. Monitoring surveys are ongoing to understand the trajectory of these coral communities.
Possible recovery of Acropora in UAE waters will depend upon less frequent bleaching events, but these events are likely to become more frequent with global climate change, and the long-term prospects for bleaching-sensitive taxa, like Acropora, are not positive [7,54]. Innovative selective breeding and assisted migration strategies could be used to help regional corals persist in the face of climate change [3]. Selective breeding of heat-tolerant individuals from the southern Arabian Gulf with Gulf of Oman corals resulted in offspring with enhanced survivorship in the face of high temperatures, compared with pure-bred Gulf of Oman corals [55]. Selectively bred larvae and coral fragments from the most heat-tolerant colonies can be moved to restore areas where coral has declined or to areas where conditions are more favourable for long-term survival [3]. Coral monitoring should be expanded in the UAE and the wider Arabian Gulf region, in part to identify these coral colonies that are particularly resilient [3]. Expanded monitoring can also ensure the efficacy of more conventional management strategies that reduce additional stressors on corals to aid recovery [56].
There are several conventional management strategies that can help the recovery of SBN and KF corals. At SBN, maintaining the existing marine protected area and continuing to limit development and recreational activities around the island would help in coral conservation. The Khor Fakkan reefs are popular recreational dive sites, and we observed numerous instances of “fin-strike” damage to the corals. Managers could limit diving on these reefs and could also encourage local dive operators to become “Green-Fins-certified”. The Green Fins program encourages diver education about avoiding coral contact, which can effectively reduce damage [57,58,59]. Khor Fakkan reefs have also faced recent outbreaks of crown-of-thorns starfish Acanthaster spp. [60], and hand removal is the most effective means of controlling their densities to protect corals [61]. Managers could also implement new marine protected areas around the Khor Fakkan reefs to protect them from coastal development and fishing pressures [62,63,64].
The 2021 bleaching event that affected the last Acropora refugia in the UAE reflects the ongoing trajectory of coral reef degradation in the region. Coral recovery will require targeted restoration and strengthened management to reduce local stressors, alongside broader efforts to slow climate change and limit the frequency of severe bleaching events.

Author Contributions

Conceptualization, J.A.B., G.H.C. and A.B.; methodology, J.A.B., J.H.-H., G.H.C. and R.C.B.; software, J.H.-H.; formal analysis, J.H.-H.; investigation, J.A.B., R.C.B., A.B. and G.H.C.; resources, J.A.B.; data curation, R.C.B. and J.H.-H.; writing—original draft preparation, J.H.-H., A.B. and J.A.B.; writing—review and editing, J.H.-H., A.B. and J.A.B.; visualization, J.H.-H.; supervision, J.A.B.; project administration, J.A.B., A.B. and F.A.M.; funding acquisition, A.B., J.A.B., G.H.C., J.H.-H. and R.C.B. All authors have read and agreed to the published version of the manuscript.

Funding

This research was funded by AMERICAN UNIVERSITY OF SHARJAH, grant number FRG 21-M-S24. JB, JH, RB and GC were funded by TAMKEEN, grant number CG009, and by MUBADALA, grant number XR016.

Data Availability Statement

All data and code required to reproduce the analysis presented in this manuscript are openly available at: https://github.com/Jeneen/SBN_KF.

Acknowledgments

Thanks to Basam Dahy for creating Figure 1. Thank you to the Sharjah Environment and Protected Areas Authority for granting research permits to conduct this study.

Conflicts of Interest

The authors declare no conflicts of interest.

Abbreviations

The following abbreviations are used in this manuscript:
SBNSir Bu Nair
KFKhor Fakkan
UAEUnited Arab Emirates
HABHarmful algal bloom
DHWDegree heating weeks
SSTSea surface temperature
PERMANOVAPermutational multivariate analysis of variance
SIMPERSimilarity percentage analysis
PERMDISPPermutational multivariate analysis of dispersion
CIConfidence interval
SEStandard error
nMDSNon-metric multidimensional scaling

Appendix A

Table A1. Live coral cover (raw data) for all transects.
SiteTransectDate% Live Coral
MartiniBayA11 May 202162.2
MartiniBayB11 May 202169.5
MartiniBayC11 May 202151.3
MartiniBayD11 May 202151.1
MartiniBayE11 May 202154.5
MartiniBayF11 May 202149.6
MartiniBayA4 September 20219.5
MartiniBayB4 September 202118.0
MartiniBayC4 September 202120.7
MartiniBayD4 September 202124.5
MartiniBayE4 September 202126.5
MartiniBayF4 September 202134.2
MartiniBayA4 May 202236.0
MartiniBayB4 May 202229.6
MartiniBayC4 May 202228.4
MartiniBayD4 May 202221.1
MartiniBayE4 May 202232.4
MartiniBayF4 May 202224.0
MartiniWallA11 May 202171.6
MartiniWallB11 May 202186.0
MartiniWallC11 May 202182.0
MartiniWallD11 May 202181.8
MartiniWallE11 May 202168.4
MartiniWallF11 May 202160.4
MartiniWallA4 September 202136.9
MartiniWallB4 September 202145.8
MartiniWallC4 September 202152.0
MartiniWallD4 September 202140.2
MartiniWallE4 September 202149.5
MartiniWallF4 September 202141.6
MartiniWallA4 May 202244.5
MartiniWallB4 May 202265.3
MartiniWallC4 May 202253.5
MartiniWallD4 May 202230.9
MartiniWallE4 May 202252.7
MartiniWallF4 May 202258.2
SBN-NA18 May 202134.4
SBN-NB18 May 202227.5
SBN-NC18 May 202235.3
SBN-ND18 May 202243.1
SBN-NE18 May 202239.1
SBN-NF18 May 202241.3
SBN-NA19 September 202112.0
SBN-NB19 September 202112.2
SBN-NC19 September 202111.3
SBN-ND19 September 202110.2
SBN-NE19 September 20217.6
SBN-NF19 September 202112.7
SBN-NA9 June 202227.1
SBN-NB9 June 202227.8
SBN-NC9 June 202221.1
SBN-ND9 June 202219.3
SBN-NE9 June 202217.1
SBN-NF9 June 202226.5
SBN-SA18 May 202250.5
SBN-SB18 May 202243.8
SBN-SC18 May 202262.4
SBN-SD18 May 202238.7
SBN-SE18 May 202240.7
SBN-SF18 May 202234.4
SBN-SA19 September 20212.4
SBN-SB19 September 20212.4
SBN-SC19 September 20214.4
SBN-SD19 September 20217.1
SBN-SE19 September 202112.9
SBN-SF19 September 20213.5
SBN-SA9 June 20225.3
SBN-SB9 June 20227.23
SBN-SC9 June 20224.0
SBN-SD9 June 20222.5
SBN-SE9 June 20223.5
SBN-SF9 June 20222.2
SBN-WA18 May 202216.0
SBN-WB18 May 202226.7
SBN-WC18 May 202225.8
SBN-WD18 May 202232.7
SBN-WE18 May 202233.1
SBN-WF18 May 202229.8
SBN-WA19 September 202111.3
SBN-WB19 September 20215.8
SBN-WC19 September 202112.7
SBN-WD19 September 20218.5
SBN-WE19 September 20219.5
SBN-WF19 September 202115.5
SBN-WA9 June 20226.9
SBN-WB9 June 20228.7
SBN-WC9 June 202210.2
SBN-WD9 June 20226.5
SBN-WE9 June 20227.1
SBN-WF9 June 202213.8
SharkIslandA11 May 202148.2
SharkIslandB11 May 202176.4
SharkIslandC11 May 202189.1
SharkIslandD11 May 202164.4
SharkIslandE11 May 202171.6
SharkIslandF11 May 202177.6
SharkIslandA4 September 20211.5
SharkIslandB4 September 20210.9
SharkIslandC4 September 20216.2
SharkIslandD4 September 202134.0
SharkIslandE4 September 20211.6
SharkIslandF4 September 20210.4
SharkIslandA4 May 202216.7
SharkIslandB4 May 20222.4
SharkIslandC4 May 20220.7
SharkIslandD4 May 202214.0
SharkIslandE4 May 202234.7
SharkIslandF4 May 202218.2
Table A2. Summary statistics of raw (unmodelled) percentage coral cover (all coral and Acropora alone) for Khor Fakkan and SBN across bleaching periods.
Khor FakkanSBN
Pre-BleachingDuring BleachingPost-BleachingPre-BleachingDuring BleachingPost-Bleaching
All coral
Mean (%)67.5424.6731.2936.418.9912.05
SE3.094.254.302.430.942.09
Median (%)68.9125.5530.2734.829.828.00
IQR21.3232.3623.5010.596.0013.14
Acropora
Mean (%)22.492.012.8219.400.021.74
SE7.491.691.524.330.020.41
Median (%)1.360.000.0011.550.001.27
IQR56.770.140.1427.770.003.00
Table A3. Model prior specifications.
Priors for live coral modelsInterceptstudent_t (3, 0, 2.5)
bnormal (0, 10)
phigamma (2, 0.1)
Priors for proportional contribution of coral genera modelsInterceptstudent_t (3, 0, 2.5)
bnormal (0, 1)
sigmastudent_t (3, 0, 2.5)
Table A4. SIMPER analysis results for Khor Fakkan (taxa with > 0.025 contribution).
Contribution to
Average Between-Group Dissimilarity
SDAverage to SD RatioAverage Post-BleachingAverage Pre-BleachingCumulative Contributionp
Acropora0.120.150.792.8222.490.200.002
Porites0.080.061.4216.4919.800.340.053
Rock/pavement0.070.061.1720.477.920.470.003
Turf0.060.051.2220.3711.510.571.000
Pocillopora0.030.050.741.446.530.620.004
Platygyra0.030.031.166.665.800.680.128
Sand0.030.021.337.376.670.730.973
Dead0.030.030.896.270.620.780.335
Table A5. SIMPER analysis results for SBN (taxa with > 0.025 contribution).
Contribution to
Average Between-Group Dissimilarity
SDAverage to SD RatioAverage Post-BleachingAverage Pre-BleachingCumulative Contributionp
Turf0.100.042.2142.6823.390.230.001
Acropora0.090.091.021.7419.400.450.001
Sand0.040.031.4118.5113.820.560.548
Rock/Pavement0.040.021.4713.4613.920.640.024
Platygyra0.030.030.992.625.840.710.003
Table A6. nMDS scores for all sites across bleaching periods.
RegionSiteTransectDateBleaching PeriodnMDS1nMDS2
KFakkanMartiniBayA4 May 2022Post-bleaching−0.04093−0.08456
KFakkanMartiniBayA4 September 2021During-bleaching0.42163−0.32773
KFakkanMartiniBayA11 May 2021Pre-bleaching−0.22845−0.26787
KFakkanMartiniBayB4 May 2022Post-bleaching−0.109450.07302
KFakkanMartiniBayB4 September 2021During-bleaching0.35967−0.27389
KFakkanMartiniBayB11 May 2021Pre-bleaching−0.50130−0.19517
KFakkanMartiniBayC4 May 2022Post-bleaching−0.13797−0.03872
KFakkanMartiniBayC4 September 2021During-bleaching0.17651−0.46702
KFakkanMartiniBayC11 May 2021Pre-bleaching−0.67839−0.06111
KFakkanMartiniBayD4 May 2022Post-bleaching−0.091120.01320
KFakkanMartiniBayD4 September 2021During-bleaching0.26743−0.30520
KFakkanMartiniBayD11 May 2021Pre-bleaching−0.46953−0.03019
KFakkanMartiniBayE4 May 2022Post-bleaching−0.195840.05966
KFakkanMartiniBayE4 September 2021During-bleaching0.09791−0.15031
KFakkanMartiniBayE11 May 2021Pre-bleaching−0.49088−0.07052
KFakkanMartiniBayF4 May 2022Post-bleaching−0.30456−0.29475
KFakkanMartiniBayF4 September 2021During-bleaching−0.05755−0.24144
KFakkanMartiniBayF11 May 2021Pre-bleaching−0.37077−0.04372
KFakkanMartiniWallA4 May 2022Post-bleaching−0.16605−0.00019
KFakkanMartiniWallA4 September 2021During-bleaching0.38643−0.53470
KFakkanMartiniWallA11 May 2021Pre-bleaching−0.602530.07185
KFakkanMartiniWallB4 May 2022Post-bleaching−0.345830.17246
KFakkanMartiniWallB4 September 2021During-bleaching−0.02103−0.23050
KFakkanMartiniWallB11 May 2021Pre-bleaching−0.681490.32139
KFakkanMartiniWallC4 May 2022Post-bleaching0.01809−0.13257
KFakkanMartiniWallC4 September 2021During-bleaching−0.25751−0.49608
KFakkanMartiniWallC11 May 2021Pre-bleaching−0.742070.17668
KFakkanMartiniWallD4 May 2022Post-bleaching0.23084−0.08640
KFakkanMartiniWallD4 September 2021During-bleaching−0.23995−0.37852
KFakkanMartiniWallD11 May 2021Pre-bleaching−0.410740.26625
KFakkanMartiniWallE4 May 2022Post-bleaching−0.497490.19518
KFakkanMartiniWallE4 September 2021During-bleaching−0.26770−0.14489
KFakkanMartiniWallE11 May 2021Pre-bleaching−0.548420.43880
KFakkanMartiniWallF4 May 2022Post-bleaching−0.401830.03668
KFakkanMartiniWallF4 September 2021During-bleaching−0.19207−0.15954
KFakkanMartiniWallF11 May 2021Pre-bleaching−0.68194−0.16577
KFakkanSharkIslandA4 May 2022Post-bleaching0.52493−0.16985
KFakkanSharkIslandA4 September 2021During-bleaching0.70057−0.10429
KFakkanSharkIslandA11 May 2021Pre-bleaching0.103430.26061
KFakkanSharkIslandB4 May 2022Post-bleaching0.56568−0.14220
KFakkanSharkIslandB4 September 2021During-bleaching0.46473−0.00380
KFakkanSharkIslandB11 May 2021Pre-bleaching−0.023450.35376
KFakkanSharkIslandC4 May 2022Post-bleaching0.85125−0.02916
KFakkanSharkIslandC4 September 2021During-bleaching0.741460.18808
KFakkanSharkIslandC11 May 2021Pre-bleaching0.641360.93526
KFakkanSharkIslandD4 May 2022Post-bleaching0.541460.15496
KFakkanSharkIslandD4 September 2021During-bleaching0.481210.16913
KFakkanSharkIslandD11 May 2021Pre-bleaching0.538950.56185
KFakkanSharkIslandE4 May 2022Post-bleaching0.085670.16556
KFakkanSharkIslandE4 September 2021During-bleaching0.836980.01648
KFakkanSharkIslandE11 May 2021Pre-bleaching−0.038060.54061
KFakkanSharkIslandF4 May 2022Post-bleaching0.075530.10322
KFakkanSharkIslandF4 September 2021During-bleaching0.82919−0.12683
KFakkanSharkIslandF11 May 2021Pre-bleaching−0.146050.48279
SBNSBN-NA9 June 2022Post-bleaching−0.500380.05314
SBNSBN-NA18 May 2022Pre-bleaching−0.65776−0.17509
SBNSBN-NA19 September 2021During-bleaching0.299080.23780
SBNSBN-NB9 June 2022Post-bleaching−0.466890.04453
SBNSBN-NB18 May 2022Pre-bleaching−0.642640.02034
SBNSBN-NB19 September 2021During-bleaching0.272250.21527
SBNSBN-NC9 June 2022Post-bleaching−0.422710.08718
SBNSBN-NC18 May 2022Pre-bleaching−0.567340.17420
SBNSBN-NC19 September 2021During-bleaching0.259730.22167
SBNSBN-ND9 June 2022Post-bleaching−0.420310.17261
SBNSBN-ND18 May 2022Pre-bleaching−0.795800.01437
SBNSBN-ND19 September 2021During-bleaching0.218490.24682
SBNSBN-NE9 June 2022Post-bleaching−0.409660.42363
SBNSBN-NE18 May 2022Pre-bleaching−0.465790.10098
SBNSBN-NE19 September 2021During-bleaching0.314920.06407
SBNSBN-NF9 June 2022Post-bleaching−0.47427−0.07923
SBNSBN-NF18 May 2022Pre-bleaching−0.65548−0.03642
SBNSBN-NF19 September 2021During-bleaching0.227030.12624
SBNSBN-SA9 June 2022Post-bleaching0.150200.01745
SBNSBN-SA18 May 2022Pre-bleaching0.02372−0.28821
SBNSBN-SA19 September 2021During-bleaching0.479320.17071
SBNSBN-SB9 June 2022Post-bleaching0.00528−0.07488
SBNSBN-SB18 May 2022Pre-bleaching−0.12217−0.24707
SBNSBN-SB19 September 2021During-bleaching0.31285−0.01554
SBNSBN-SC9 June 2022Post-bleaching0.20635−0.15444
SBNSBN-SC18 May 2022Pre-bleaching0.19007−0.56324
SBNSBN-SC19 September 2021During-bleaching0.557320.02324
SBNSBN-SD9 June 2022Post-bleaching0.31806−0.11424
SBNSBN-SD18 May 2022Pre-bleaching−0.00867−0.36275
SBNSBN-SD19 September 2021During-bleaching0.41066−0.04732
SBNSBN-SE9 June 2022Post-bleaching0.16554−0.15057
SBNSBN-SE18 May 2022Pre-bleaching0.23022−0.28422
SBNSBN-SE19 September 2021During-bleaching0.49717−0.01786
SBNSBN-SF9 June 2022Post-bleaching0.17292−0.11533
SBNSBN-SF18 May 2022Pre-bleaching0.22206−0.34363
SBNSBN-SF19 September 2021During-bleaching0.48369−0.06708
SBNSBN-WA9 June 2022Post-bleaching−0.001120.01482
SBNSBN-WA18 May 2022Pre-bleaching−0.069420.05576
SBNSBN-WA19 September 2021During-bleaching0.313570.21244
SBNSBN-WB9 June 2022Post-bleaching−0.133620.20535
SBNSBN-WB18 May 2022Pre-bleaching−0.145900.03361
SBNSBN-WB19 September 2021During-bleaching0.290870.15206
SBNSBN-WC9 June 2022Post-bleaching−0.029640.05658
SBNSBN-WC18 May 2022Pre-bleaching−0.10662−0.05202
SBNSBN-WC19 September 2021During-bleaching0.262810.17372
SBNSBN-WD9 June 2022Post-bleaching−0.020820.09284
SBNSBN-WD18 May 2022Pre-bleaching−0.21795−0.25139
SBNSBN-WD19 September 2021During-bleaching0.254820.10872
SBNSBN-WE9 June 2022Post-bleaching0.03573−0.02000
SBNSBN-WE18 May 2022Pre-bleaching−0.08847−0.11159
SBNSBN-WE19 September 2021During-bleaching0.295040.17115
SBNSBN-WF9 June 2022Post-bleaching−0.11111−0.10004
SBNSBN-WF18 May 2022Pre-bleaching−0.19426−0.14889
SBNSBN-WF19 September 2021During-bleaching0.259060.12972
Figure A1. Sample image of a quadrat with numbered randomized points (+) classified on CoralNet. (https://coralnet.ucsd.edu/image/2019160/view/, accessed on 10 June 2025).
Diversity 17 00610 g0a1
Figure A2. Model traceplots for SBN live coral model.
Diversity 17 00610 g0a2
Figure A3. Model traceplots for Khor Fakkan live coral model.
Diversity 17 00610 g0a3
Figure A4. Model traceplots for SBN proportional coral cover model.
Diversity 17 00610 g0a4aDiversity 17 00610 g0a4bDiversity 17 00610 g0a4c
Figure A5. Model traceplots for Khor Fakkan proportional coral cover model.
Diversity 17 00610 g0a5aDiversity 17 00610 g0a5bDiversity 17 00610 g0a5c
Figure A6. Model posterior predictive checks for SBN live coral model.
Diversity 17 00610 g0a6
Figure A7. Model posterior predictive checks for Khor Fakkan live coral model.
Diversity 17 00610 g0a7
Figure A8. Model posterior predictive checks (by genus) for SBN proportional coral cover model. The distribution in blue (median, 90%, and 50% CI) in the top row boxplot represents model predictions (n = 1000 predicted draws), and the distribution in black (median, 90%, and 50% CI) in the bottom row of each panel represents raw data.
Diversity 17 00610 g0a8
Figure A9. Model posterior predictive checks (by genus) for Khor Fakkan proportional coral cover model. The distribution in blue (median, 90%, and 50% CI) in the top row boxplot represents model predictions (n = 1000 predicted draws), and the distribution in black (median, 90%, and 50% CI) in the bottom row of each panel represents raw data.
Diversity 17 00610 g0a9

References

  1. Foster, K.; Foster, G.; Tourenq, C.; Shuriqi, M. Shifts in coral community structures following cyclone and red tide disturbances within the Gulf of Oman (United Arab Emirates). Mar. Biol. 2011, 158, 955–968. [Google Scholar] [CrossRef]
  2. Burt, J. Coral reefs of the Emirates. In A Natural History of the Emirates; Burt, J., Ed.; Springer Nature: Cham, Switzerland, 2023; pp. 325–351. [Google Scholar] [CrossRef]
  3. Burt, J. From Phoenix to Sisyphus: Climate change impacts and intervention strategies for Arabian Gulf coral reefs. J. Coast. Res. 2024, 113, 839–845. [Google Scholar] [CrossRef]
  4. Riegl, B. Effects of the 1996 and 1998 positive sea-surface temperature anomalies on corals, coral diseases and fish in the Arabian Gulf (Dubai, UAE). Mar. Biol. 2002, 140, 29–40. [Google Scholar] [CrossRef]
  5. Burt, J.; Bartholomew, A.; Usseglio, P. Recovery of corals a decade after a bleaching event in Dubai, United Arab Emirates. Mar. Biol. 2008, 154, 27–36. [Google Scholar] [CrossRef]
  6. Riegl, B.; Purkis, S. Coral population dynamics across consecutive mass mortality events. Glob. Change Biol. 2015, 21, 3995–4005. [Google Scholar] [CrossRef]
  7. Burt, J.; Paparella, F.; Al-Mansoori, N.; Al-Mansoori, A.; Al-Jailani, H. Causes and consequences of the 2017 coral bleaching event in the southern Persian/Arabian Gulf. Coral Reefs 2019, 38, 567–589. [Google Scholar] [CrossRef]
  8. Bleuel, J.; Pennino, M.; Longo, G. Coral distribution and bleaching vulnerability areas in Southwestern Atlantic under ocean warming. Sci. Rep. 2021, 11, 12833. [Google Scholar] [CrossRef]
  9. Mellin, C.; Brown, S.; Cantin, N.; Klein-Salas, E.; Mouillot, D.; Heron, S.; Fordham, D. Cumulative risk of future bleaching for the world’s coral reefs. Sci. Adv. 2024, 10, eadn9660. [Google Scholar] [CrossRef]
  10. McClanahan, T.; Darling, E.; Maina, J.; Muthiga, N.; D’Agata, S.; Leblond, J.; Arthur, R.; Jupiter, S.; Wilson, S.; Mangubhai, S.; et al. Highly variable taxa-specific coral bleaching responses to thermal stresses. Mar. Ecol. Prog. Ser. 2020, 648, 135–151. [Google Scholar] [CrossRef]
  11. van Woesik, R.; Shlesinger, T.; Grottoli, A.; Toonen, R.; Vega Thurber, R.; Warner, M.; Marie Hulver, A.; Chapron, L.; McLachlan, R.; Albright, R.; et al. Coral-bleaching responses to climate change across biological scales. Glob. Change Biol. 2022, 28, 4229–4250. [Google Scholar] [CrossRef] [PubMed]
  12. Baum, J.; Claar, D.; Tietjen, K.; Magel, J.; Maucieri, D.; Cobb, K.; McDevitt-Irwin, J. Transformation of coral communities subjected to an unprecedented heatwave is modulated by local disturbance. Sci. Adv. 2023, 9, eabq5615. [Google Scholar] [CrossRef]
  13. Gonzalez, K.; Daraghmeh, N.; Lozano-Cortés, D.; Benzoni, F.; Berumen, M.; Carvalho, S. Differential spatio-temporal responses of Red Sea coral reef benthic communities to a mass bleaching event. Sci. Rep. 2024, 14, 24229. [Google Scholar] [CrossRef]
  14. Carpenter, K.; Abrar, M.; Aeby, G.; Aronson, R.; Banks, S.; Bruckner, A.; Chiribog, A.; Cortes, J.; Delbeek, J.; DeVantier, L.; et al. One-third of reef-building corals face elevated extinction risk from climate change and local impacts. Science 2008, 321, 560–563. [Google Scholar] [CrossRef]
  15. Watt-Pringle, R.; Smith, D.; Ambo-Rappe, R.; Lamont, T.; Jompa, J. Suppressed recovery of functionally important branching Acropora drives coral community composition changes following mass bleaching in Indonesia. Coral Reefs 2022, 41, 1337–1350. [Google Scholar] [CrossRef]
  16. Vytopil, E.; Willis, B. Epifaunal community structure in Acropora spp. (Scleractinia) on the Great Barrier Reef: Implications of coral morphology and habitat complexity. Coral Reefs 2001, 20, 281–288. [Google Scholar] [CrossRef]
  17. Bauman, A.; Feary, D.; Heron, S.; Pratchett, M.; Burt, J. Multiple environmental factors influence the spatial distribution and structure of reef communities in the northeastern Arabian Peninsula. Mar. Pollut. Bull. 2013, 72, 302–312. [Google Scholar] [CrossRef] [PubMed]
  18. Richlen, M.; Morton, S.; Jamali, E.; Rajan, A.; Anderson, D. The catastrophic 2008–2009 red tide in the Arabian Gulf region, with observations on the identification and phylogeny of the fish-killing dinoflagellate Cochlodinium polykrikoides. Harmful Algae 2010, 9, 163–172. [Google Scholar] [CrossRef]
  19. Pratchett, M.; Baird, A.; Bauman, A.; Burt, J. Abundance and composition of juvenile corals reveals divergent trajectories for coral assemblages across the United Arab Emirates. Mar. Pollut. Bull. 2017, 114, 1031–1035. [Google Scholar] [CrossRef]
  20. Bejarano, I.; Orenes-Salazar, V.; Bento, R.; García-Charton, J.; Mateos-Molina, D. Coral reefs at Sir Bu Nair Island: An offshore refuge of Acropora in the southern Arabian Gulf. Mar. Pollut. Bull. 2022, 178, 113570. [Google Scholar] [CrossRef]
  21. Cavalcante, G.; Vieira, F.; Bento, R.; Bartholomew, A.; Burt, J. Oceanographic variability in Sir Bu Nair Island (Arabian/Persian Gulf) based on in situ observations. J. Coast. Res. 2024, 113, 410–414. [Google Scholar] [CrossRef]
  22. Bento, R.; Cavalcante, G.; Mateos-Molina, D.; Riegl, B.; Bejarano, I. Recruitment and larval connectivity of a remnant Acropora community in the Arabian Gulf, United Arab Emirates. Coral Reefs 2021, 40, 1889–1898. [Google Scholar] [CrossRef]
  23. Harris, C.; Schroder, T. UAE Underwater Explorer; Explorer Publishing: Dubai, United Arab Emirates, 2001. [Google Scholar]
  24. Beijbom, O.; Edmunds, P.; Roelfsema, C.; Smith, J.; Kline, D.; Neal, B.; Dunlap, M.; Moriarty, V.; Fan, T.; Tan, C.; et al. Towards automated annotation of benthic survey images: Variability of human experts and operational modes of automation. PLoS ONE 2015, 10, e0130312. [Google Scholar] [CrossRef] [PubMed]
  25. Burt, J.; Al-Harthi, S.; Al-Cibahy, A. Long-term impacts of coral bleaching events on the world’s warmest reefs. Mar. Environ. Res. 2011, 72, 225–229. [Google Scholar] [CrossRef] [PubMed]
  26. Oladi, M.; Rouzbehani, S.; Ahmadzadeh, F.; Ghazilou, A. Dynamics of Dipsastraea pallida-symbiont association following bleaching events across the northern Persian Gulf and Gulf of Oman. Symbiosis 2021, 84, 141–149. [Google Scholar] [CrossRef]
  27. Riegl, B.; Purkis, S. Coral reefs of the Gulf: Adaptation to climatic extremes in the world’s hottest sea. In Coral Reefs of the Gulf: Adaptation to Climatic Extremes; Riegl, B., Purkis, S., Eds.; Springer: Dordrecht, The Netherlands, 2012; pp. 1–4. [Google Scholar] [CrossRef]
  28. Bürkner, P. brms: An R package for Bayesian multilevel models using Stan. J. Stat. Softw. 2017, 80, 1–28. [Google Scholar] [CrossRef]
  29. Douma, J.; Weedon, J. Analysing continuous proportions in ecology and evolution: A practical introduction to beta and Dirichlet regression. Methods Ecol. Evol. 2019, 10, 1412–1430. [Google Scholar] [CrossRef]
  30. Lemoine, N. Moving beyond noninformative priors: Why and how to choose weakly informative priors in Bayesian analyses. Oikos 2019, 128, 912–928. [Google Scholar] [CrossRef]
  31. Conn, P.; Johnson, D.; Williams, P.; Melin, S.; Hooten, M. A guide to Bayesian model checking for ecologists. Ecol. Monogr. 2018, 88, 526–542. [Google Scholar] [CrossRef]
  32. Oksanen, J.; Kindt, R.; Legendre, P.; O’Hara, B.; Simpson, G.; Solymos, P.; Stevens, M.; Wagner, H. The Vegan Package Version 1.15-0. Available online: https://vegan.r-forge.r-project.org (accessed on 6 December 2024).
  33. R Core Team. R: A Language and Environment for Statistical Computing (4.3.0). Available online: https://www.R-project.org (accessed on 4 December 2024).
  34. Wickham, H. ggplot2: Elegant Graphics for Data Analysis; Springer Nature: Cham, Switzerland, 2016. [Google Scholar]
  35. Kahle, D.; Wickham, H. ggmap: Spatial visualization with ggplot2. R J. 2013, 5, 144. [Google Scholar] [CrossRef]
  36. Gerwing, T.; Gerwing, A.; Macdonald, T.; Cox, K.; Juanes, F.; Dudas, S. Assessing the relationship between community dispersion and disturbance in a soft-sediment ecosystem. Mar. Ecol. 2018, 39, 12505. [Google Scholar] [CrossRef]
  37. van Woesik, R.; Kratochwill, C. A global coral-bleaching database, 1980–2020. Sci. Data 2022, 9, 20. [Google Scholar] [CrossRef]
  38. Goebeler, N.; Norkko, A.; Norkko, J. Ninety years of coastal monitoring reveals baseline and extreme ocean temperatures are increasing off the Finnish coast. Commun. Earth Environ. 2022, 3, 215. [Google Scholar] [CrossRef]
  39. NOAA National Environmental Satellite, Data and Information Service. Satellites & Bleaching. Available online: https://coralreefwatch.noaa.gov/product/5km/tutorial/crw10a_dhw_product.php (accessed on 10 August 2025).
  40. Giorgi, A.; Monti, M.; Radawski, J.; Olson, J. Long term benthic survey demonstrates a shift in the composition of benthic reef communities at shallow sites in Roatán, Honduras. Biodivers. Conserv. 2022, 31, 1689–1708. [Google Scholar] [CrossRef]
  41. Jones, N.; Leinbach, S.; Gilliam, D. Interspecific variation in demographics reveals ecological winners and losers in a highly disturbed coral reef system. Coral Reefs 2025, 1–15. [Google Scholar] [CrossRef]
  42. Coles, S. Coral species diversity and environmental factors in the Arabian Gulf and the Gulf of Oman: A comparison to the Indo-Pacific region. Atoll Res. Bull. 2003, 507, 1–19. [Google Scholar] [CrossRef]
  43. Sawall, Y.; Harris, M.; Lebrato, M.; Wall, M.; Feng, E. Discrete pulses of cooler deep water can decelerate coral bleaching during thermal stress: Implications for artificial upwelling during heat stress events. Front. Mar. Sci. 2020, 7, 502381. [Google Scholar] [CrossRef]
  44. Morais, J.; Tebbett, S.; Morais, R.; Bellwood, D. Natural recovery of corals after severe disturbance. Ecol. Lett. 2024, 27, e14332. [Google Scholar] [CrossRef]
  45. Holbrook, S.; Adam, T.; Edmunds, P.; Schmitt, R.; Carpenter, R.; Brooks, A.; Lenihan, H.; Briggs, C. Recruitment drives spatial variation in recovery rates of resilient coral reefs. Sci. Rep. 2018, 8, 7338. [Google Scholar] [CrossRef] [PubMed]
  46. Tebbett, S.; Morais, J.; Bellwood, D. Spatial patchiness in change, recruitment, and recovery on coral reefs at Lizard Island following consecutive bleaching events. Mar. Environ. Res. 2022, 173, 105537. [Google Scholar] [CrossRef] [PubMed]
  47. Darling, E.; Alvarez-Filip, L.; Oliver, T.; Mcclanahan, T.; Côté, I. Evaluating life-history strategies of reef corals from species traits. Ecol. Lett. 2012, 15, 1378–1386. [Google Scholar] [CrossRef]
  48. Riegl, B.; Purkis, S. Model of coral population response to accelerated bleaching and mass mortality in a changing climate. Ecol. Model. 2009, 220, 192–208. [Google Scholar] [CrossRef]
  49. Foster, K.; Foster, G.; Al-Harthi, S. Coral assemblages in the southeastern Arabian Gulf (Qatar and Abu Dhabi, UAE): Various stages of Acropora recovery a decade after recurrent elevated temperature anomalies. Open J. Mar. Sci. 2013, 3, 28–39. [Google Scholar] [CrossRef]
  50. Thomas, L.; Şahin, D.; Adam, A.; Grimaldi, C.; Ryan, N.; Duffy, S.; Underwood, J.; Kennington, W.; Gilmour, J. Resilience to periodic disturbances and the long-term genetic stability in Acropora coral. Commun. Biol. 2024, 7, 410. [Google Scholar] [CrossRef]
  51. Bento, R.; Feary, D.; Hoey, A.; Burt, J. Settlement patterns of corals and other benthos on reefs with divergent environments and disturbances histories around the northeastern Arabian Peninsula. Front. Mar. Sci. 2017, 4, 305. [Google Scholar] [CrossRef]
  52. Howells, E.; Ketchum, R.; Bauman, A.; Mustafa, Y.; Watkins, K.; Burt, J. Species-specific trends in the reproductive output of corals across environmental gradients and bleaching histories. Mar. Pollut. Bull. 2016, 105, 532–539. [Google Scholar] [CrossRef]
  53. Mansour, S. Geospatial modeling of environmental hazards to coral reefs in the Oman Sea. Coral Reefs 2020, 39, 555–575. [Google Scholar] [CrossRef]
  54. Hoegh-Guldberg, O. Climate change, coral bleaching and the future of the world’s coral reefs. Mar. Freshw. Res. 1999, 50, 839–866. [Google Scholar] [CrossRef]
  55. Howells, E.; Abrego, D.; Liew, Y.; Burt, J.; Meyer, E.; Aranda, M. Enhancing the heat tolerance of reef-building corals to future warming. Sci. Adv. 2021, 7, eabg6070. [Google Scholar] [CrossRef]
  56. Darling, E.; McClanahan, T.; Côté, I. Combined effects of two stressors on Kenyan coral reefs are additive or antagonistic, not synergistic. Conserv. Lett. 2010, 3, 122–130. [Google Scholar] [CrossRef]
  57. Hunt, C.; Harvey, J.; Miller, A.; Johnson, V.; Phongsuwan, N. The Green Fins approach for monitoring and promoting environmentally sustainable scuba diving operations in South East Asia. Ocean. Coast. Manag. 2013, 78, 35–44. [Google Scholar] [CrossRef]
  58. Toyoshima, J.; Nadaoka, K. Importance of environmental briefing and buoyancy control on reducing negative impacts of SCUBA diving on coral reefs. Ocean. Coast. Manag. 2015, 116, 20–26. [Google Scholar] [CrossRef]
  59. Roche, R.; Harvey, C.; Harvey, J.; Kavanagh, A.; McDonald, M.; Stein-Rostaing, V.; Turner, J. Recreational diving impacts on coral reefs and the adoption of environmentally responsible practices within the SCUBA diving industry. Environ. Manag. 2016, 58, 107–116. [Google Scholar] [CrossRef]
  60. Seveso, D.; Stahl, J.; Landes, A. An outbreak of Acanthaster spp. in the Gulf of Oman (United Arab Emirates). Mar. Biodivers. 2024, 54, 62. [Google Scholar] [CrossRef]
  61. Westcott, D.; Fletcher, C.; Kroon, F.; Babcock, R.; Plagányi, E.; Pratchett, M.; Bonin, M. Relative efficacy of three approaches to mitigate Crown-of-Thorns Starfish outbreaks on Australia’s Great Barrier Reef. Sci. Rep. 2020, 10, 12594. [Google Scholar] [CrossRef] [PubMed]
  62. Selig, E.; Bruno, J. A global analysis of the effectiveness of marine protected areas in preventing coral loss. PLoS ONE 2010, 5, e9278. [Google Scholar] [CrossRef]
  63. Ban, N.; Adam, V.; Almany, G.; Ban, S.; Cinner, J.; McCook, L.; Mills, M.; Pressey, R.; White, A. Designing, implementing and managing marine protected areas: Emerging trends and opportunities for coral reef nations. J. Exp. Mar. Biol. Ecol. 2011, 408, 21–31. [Google Scholar] [CrossRef]
  64. Van Lavieren, H.; Klaus, R. An effective regional marine protected area network for the ROPME sea area: Unrealistic vision or realistic possibility? Mar. Poll. Bull. 2013, 72, 389–405. [Google Scholar] [CrossRef]
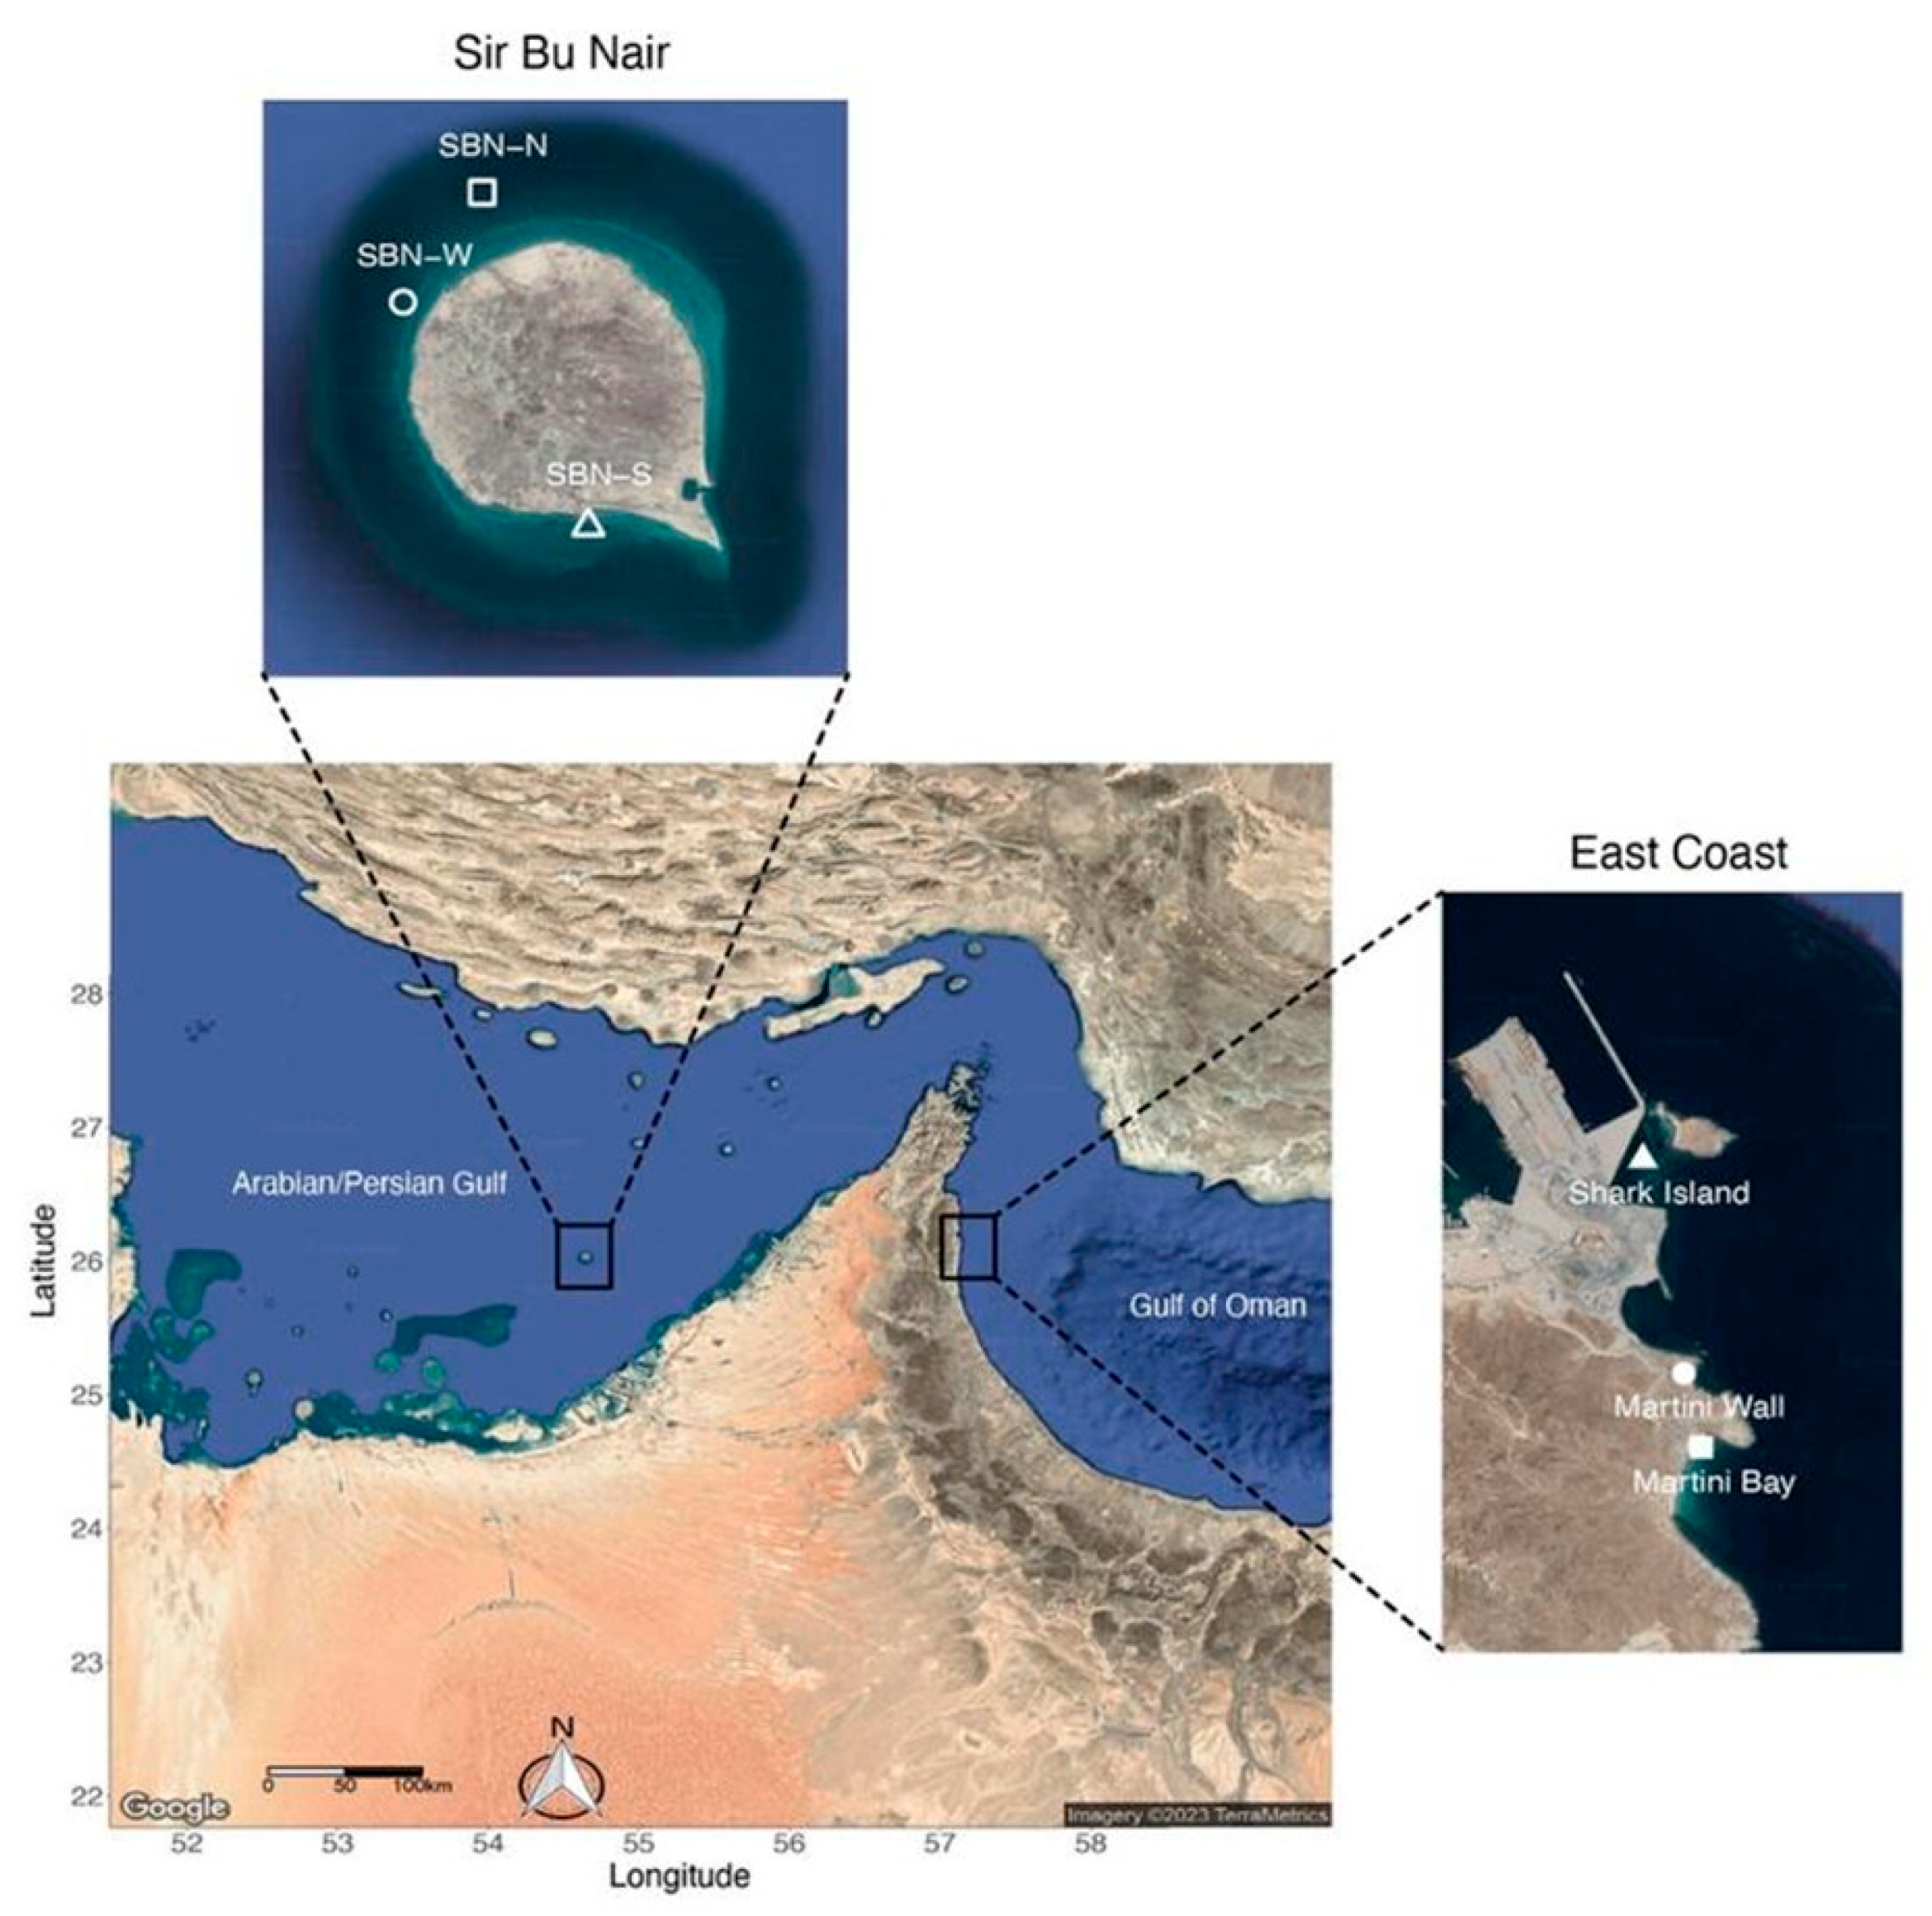
Figure 1. Map of survey sites on Sir Bu Nair (SBN-N, SBN-W, SBN-S) and Khor Fakkan (Shark Island, Martini Wall and Martini Bay).
Diversity 17 00610 g001
Figure 2. Mean sea surface temperatures (SST) (obtained from Aqua MODIS) of sites during the survey months, averaged over regions. The dark and light lines represent Khor Fakkan and SBN temperatures, respectively. Vertical lines mark coral survey dates (dark = Khor Fakkan, light = SBN), colored according to bleaching period, where green is pre-bleaching (11 May 2021 and 18 May 2021 for Khor Fakkan and SBN, respectively), orange is during bleaching (4 September 2021 and 19 September 2021) and purple is post-bleaching (4 May 2022 and 9 June 2022). Bleaching thresholds of 32 °C and 34 °C are indicated with horizontal lines for Khor Fakkan and SBN, respectively.
Diversity 17 00610 g002
Figure 3. Percentage live coral cover for all coral species on the (A) Khor Fakkan and (B) SBN reefs. Boxplots show 25%, 50% and 75% quartiles colored according to bleaching period, where green is pre-bleaching, orange is during bleaching, and purple is post-bleaching. Mean values are marked with an “x”, and median values are written above each boxplot. Point shapes correspond to sampling sites. (C) Sample photos of SBN from pre-bleaching, during-bleaching and post-bleaching periods.
Diversity 17 00610 g003
Figure 4. Proportional contribution of coral genera to total coral cover at different sites during the pre-bleaching period in (A) Khor Fakkan and (B) SBN. Shading represents proportional contribution (white = 0%, dark purple = 100%).
Diversity 17 00610 g004
Figure 5. Effect size (posterior mean ± 95% CI) of difference in proportional contribution of coral genera to total coral cover before bleaching (pre-bleaching period) and after bleaching (post-bleaching period) in (A) Khor Fakkan and (B) SBN. Points are colored green for positive effects (increases in proportional cover) where CI’s do not overlap with 0. Points are colored red for negative effects (decreases in proportional cover) where CI’s do not overlap with 0. Points are colored grey for effects where CI’s overlap with 0.
Diversity 17 00610 g005
Figure 6. Biplot of nMDS showing shifts in benthic community composition from the pre-bleaching period (green polygons), during-bleaching period (orange) and post-bleaching period (purple) for (A) Khor Fakkan (nMDS stress = 0.16) and (B) SBN (nMDS stress = 0.15). Points correspond to sites. Vectors indicate the strength and direction of the most important benthic groups driving community change, as determined by a SIMPER analysis. Changes in benthic composition were significant across bleaching periods (PERMANOVA: Khor Fakkan F2,53 = 14.80, p = 0.001; SBN F2,53 = 25.95, p = 0.001).
Diversity 17 00610 g006
Disclaimer/Publisher’s Note: The statements, opinions and data contained in all publications are solely those of the individual author(s) and contributor(s) and not of MDPI and/or the editor(s). MDPI and/or the editor(s) disclaim responsibility for any injury to people or property resulting from any ideas, methods, instructions or products referred to in the content.