Article

Spatial Patterns and Functional Diversity of Nearshore and Offshore Coral-Reef Fish Communities in the South China Sea

1
State Key Laboratory of Tropical Oceanography, Guangdong Provincial Key Laboratory of Applied Marine Biology, South China Sea Institute of Oceanology, Chinese Academy of Sciences, Guangzhou 510301, China
2
University of Chinese Academy of Sciences, Beijing 100049, China
3
Sanya Joint Laboratory of Marine Science Research, Key Laboratory of Tropical Marine Biotechnology of Hainan Province, Sanya Institute of Ocean Eco-Environmental Engineering, Sanya 572000, China
4
Sanya National Marine Ecosystem Research Station, Tropical Marine Biological Research Station in Hainan, Chinese Academy of Sciences, Sanya 572000, China
*
Authors to whom correspondence should be addressed.
Diversity 2025, 17(6), 432; https://doi.org/10.3390/d17060432
Submission received: 16 April 2025 / Revised: 5 June 2025 / Accepted: 13 June 2025 / Published: 19 June 2025
(This article belongs to the Special Issue Coral Reef Biodiversity Conservation and Ecological Rehabilitation)

Abstract

:
Coral-reef fishes in the South China Sea play a crucial role in sustaining ecosystem stability and delivering essential ecological functions. However, widespread coral degradation has led to habitat loss, intensifying environmental stress on reef-associated fish communities. To better understand their current status and guide conservation efforts, this study conducted a comprehensive, trait-based assessment of coral-reef fish diversity across 19 reef sites in the South China Sea, spanning nearshore (Sanya, Hainan) and offshore (Xisha and Nansha Islands) systems. Significant spatial differences were observed in species composition, functional trait structure, and responses to environmental disturbance. Offshore reefs, particularly in the Nansha Islands, exhibited the highest species richness, trophic complexity, and functional diversity, while nearshore reefs showed simplified community structure dominated by small, sedentary species with high microhabitat dependence. Coral cover was only weakly correlated with fish diversity and failed to reflect functional trait complexity, highlighting the limitation of relying on structural indicators alone. Using community-weighted trait metrics, PCA, and indicator species analysis, this study established a tri-principle framework for identifying priority conservation species based on ecological function, rarity, and vulnerability. Key functional species—including Chlorurus sordidus, Siganus fuscescens, and Cephalopholis urodeta—were identified, along with representative conservation sites such as Meiji Reef, Lingyang Reef, and Luhuitou. These findings underscore the need to integrate species-level and functional diversity into coral reef monitoring and management. The proposed framework provides a science-based foundation for prioritizing species and habitats, enhancing the resilience of reef ecosystems under the dual threats of climate change and anthropogenic pressure.

1. Introduction

Coral reef ecosystems are among the most biodiverse marine environments on Earth, playing vital ecological and economic roles [1]. The South China Sea (SCS) is one of the world’s most important coral reef regions and harbors China’s largest reef systems, including the Beibu Gulf and the Dongsha, Xisha, Zhongsha, and Nansha Islands [2]. Shaped by complex ocean currents, diverse habitat types, and tropical climatic conditions, the reefs of the SCS support exceptionally rich fish communities and are a critical component of regional marine fisheries [3,4,5]. However, increasing pressure from climate change, ocean acidification, coral bleaching, overfishing, and coastal pollution has led to widespread reef degradation and declines in fish diversity [6,7,8,9,10]. In this context, scientifically assessing coral-reef fish community structure is essential for understanding ecosystem processes, evaluating reef health, and informing effective conservation and management strategies.
Although reef fish studies in the SCS have expanded in recent years, most have focused on specific regions such as the Xisha, Nansha, and Dongsha Islands [11,12,13,14]. The reef fish fauna in these areas is dominated by families such as Pomacentridae, Labridae, Serranidae, Lutjanidae, and Sparidae [2,15]. However, comprehensive analyses of fish community functional diversity—particularly comparisons between nearshore and offshore reef systems—remain limited. Existing studies have primarily explored the ecological roles of specific guilds, such as herbivores and omnivores [5,16,17], but broader evaluations of spatial patterns in community structure, functional traits, and ecological niches are still lacking.
Biodiversity assessments increasingly integrate both taxonomic and functional dimensions [18,19]. Traditional species-level indices such as species richness, the Shannon diversity index, and Pielou’s evenness provide important insights into community composition and structure [20]. However, trait-based approaches—which quantify species characteristics related to physiology, behavior, and ecological strategies—offer a more nuanced understanding of ecosystem function, stability, and resilience [21,22,23]. Functional diversity indices, including Functional Richness (FRic), Functional Dispersion (FDis), Functional Evenness (FEve), and Community-Weighted Means (CWMs), have proven effective in assessing ecological complementarity, redundancy, and functional differentiation in various ecosystems, including coral reefs, grasslands, and forests [24,25,26]. Coupling trait-based metrics with spatial analysis allows researchers to examine community responses to environmental gradients and anthropogenic pressures, providing an important foundation for conservation planning and ecosystem restoration.
This study aimed to systematically assess the spatial variation in the taxonomic and functional composition of representative coral-reef fish communities in the South China Sea. It was hypothesized that (1) nearshore and offshore reef systems exhibit significant differences in both taxonomic and functional diversity of fish communities; (2) these differences are closely associated with coral cover and habitat characteristics; and (3) certain species and functional groups dominate specific regions, reflecting distinct ecological functions and adaptive strategies. By integrating taxonomic and trait-based diversity indices with spatial comparisons, this study seeks to provide new insights into the patterns of fish biodiversity in the South China Sea and offer a scientific foundation for coral reef conservation and sustainable fishery management.

2. Materials and Methods
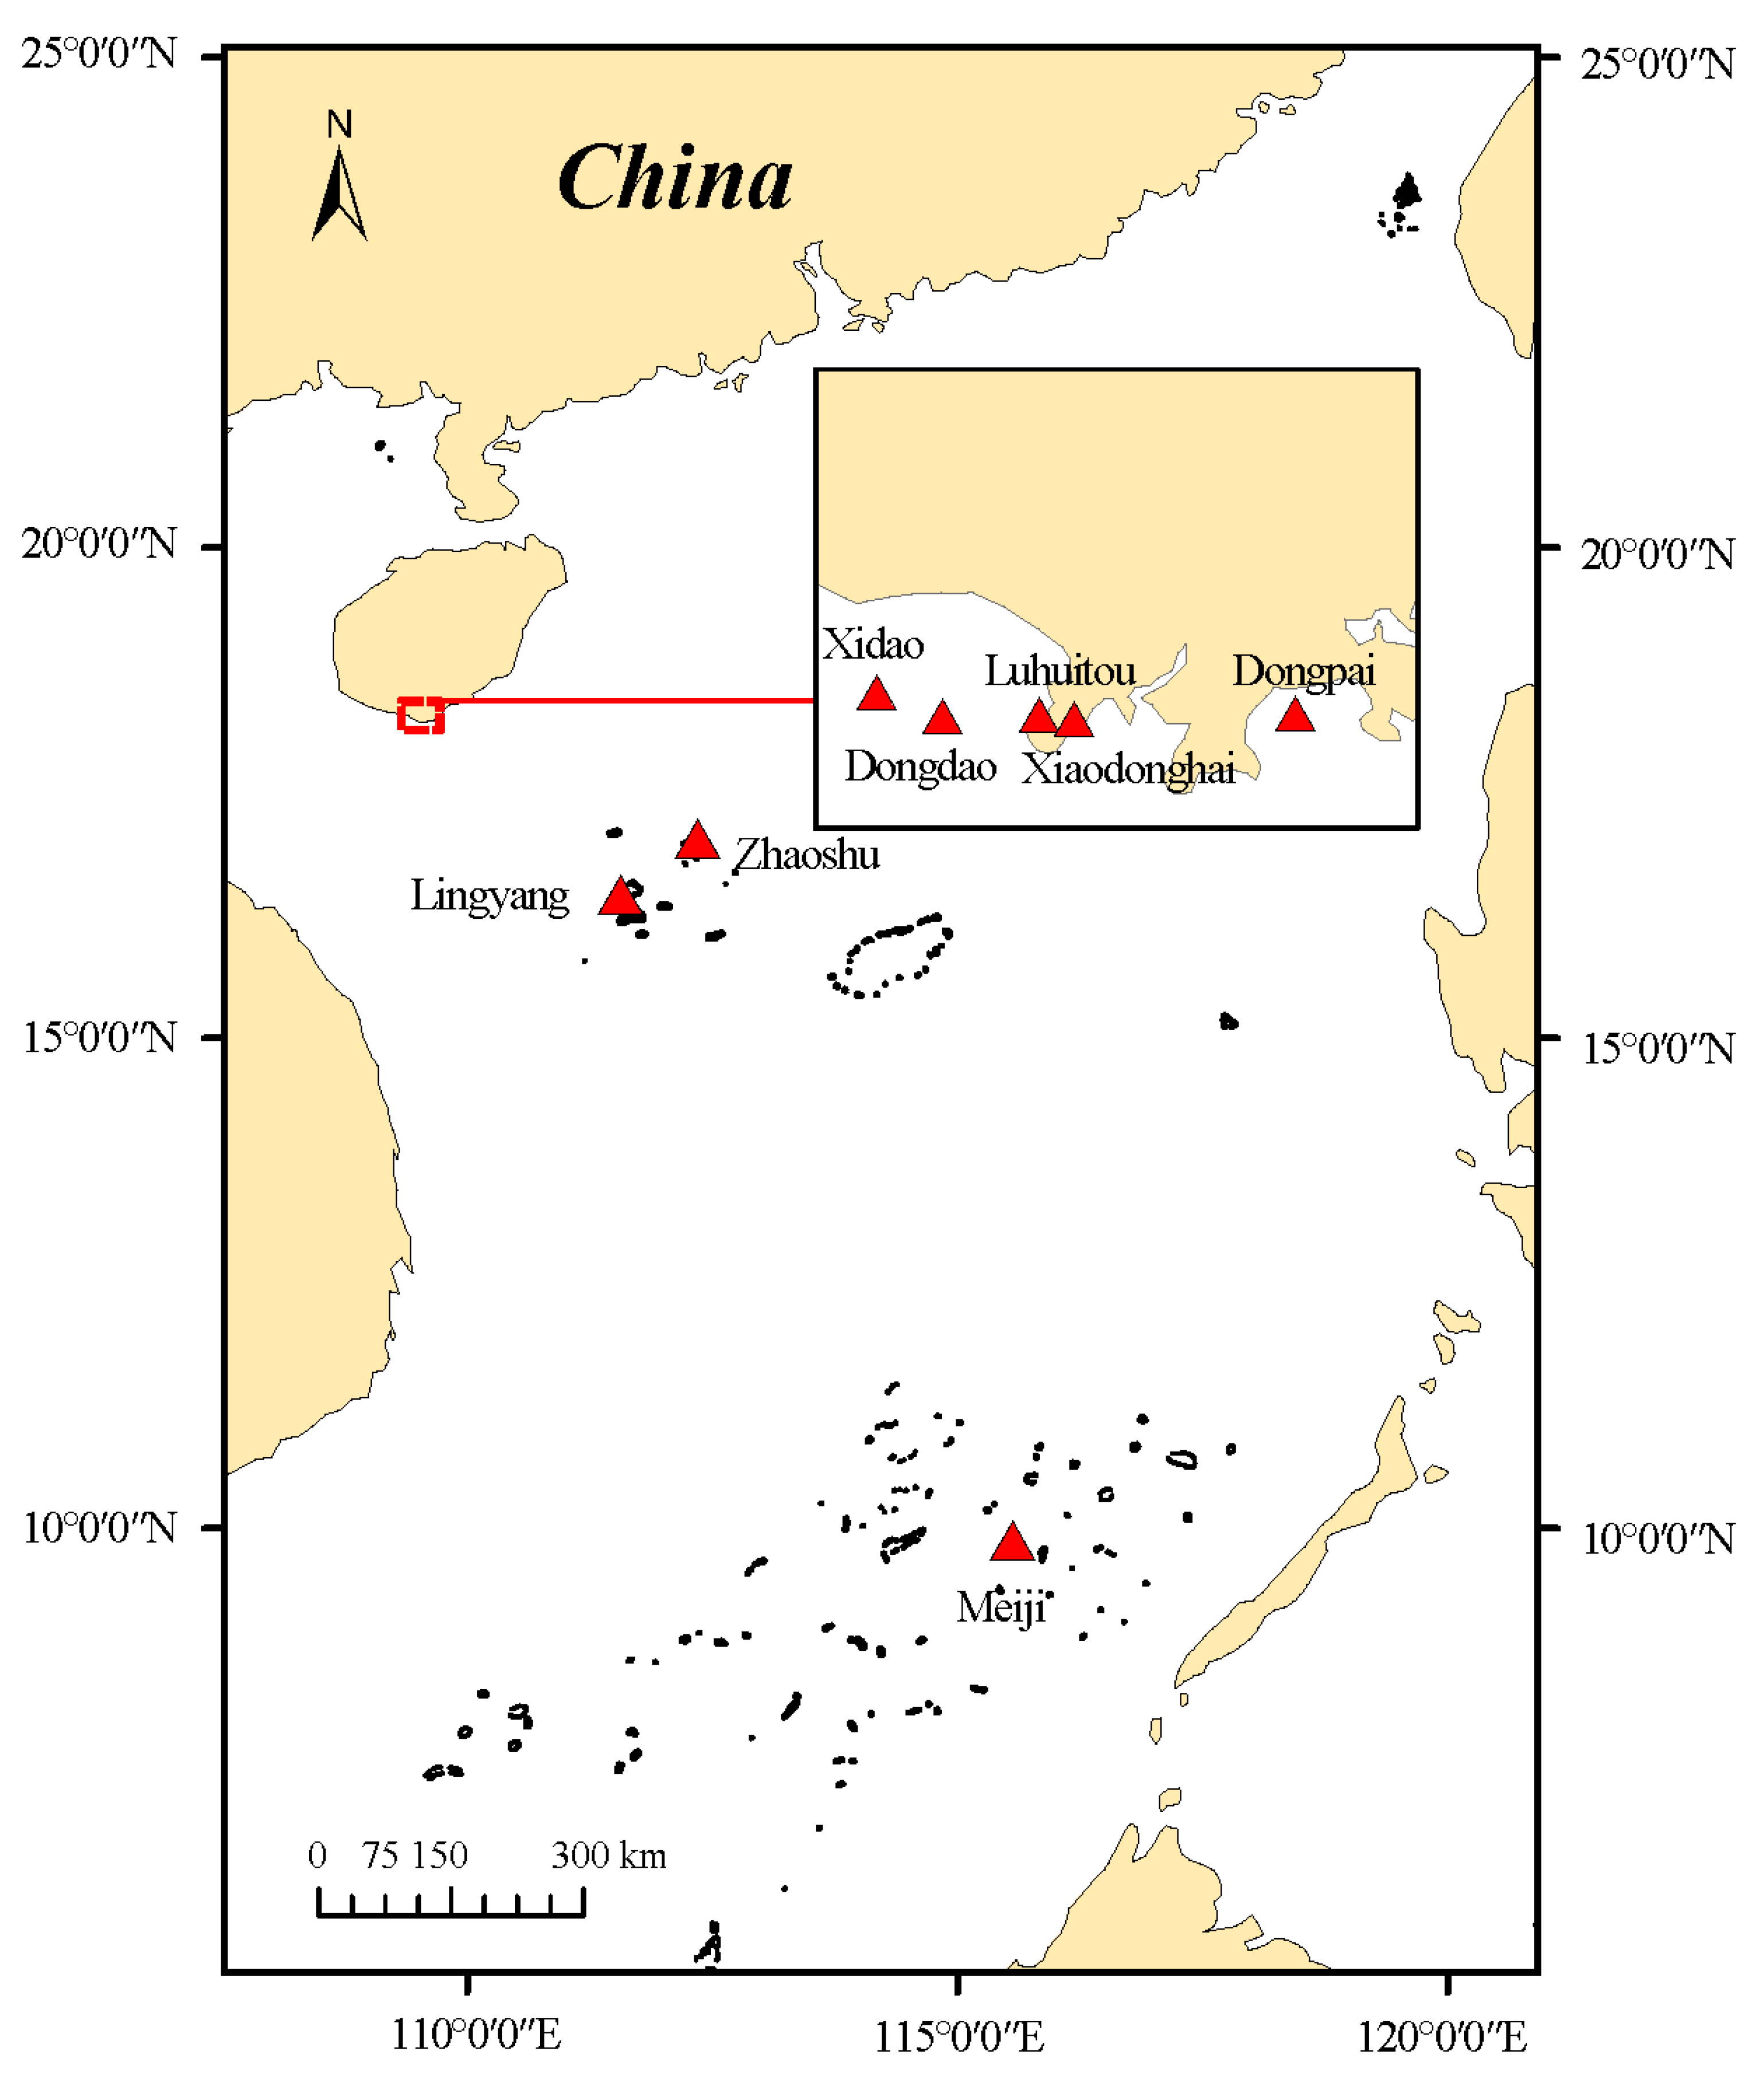
2.1. Study Area

This study selected coral reef areas in the South China Sea as the research region, focusing on 19 coral reef communities in Sanya (Hainan), the Xisha Islands, and the Nansha Islands. The study area is shown in Figure 1 and Table 1. Sanya represents a typical nearshore reef system, characterized by shallow, fragmented reefs under strong anthropogenic pressure, including fishing and coastal runoff. The Xisha Islands lie farther offshore and represent a transitional system with moderate disturbance. The Nansha Islands, located in remote oceanic waters, represent a typical offshore system with high habitat complexity and lower direct human impact [6].

2.2. Fish Community Survey and Trait Data Collection

The surveys were conducted using the Underwater Visual Census [27,28,29] and the Line Intercept Transect method [30], with trained divers holding underwater cameras (GoPro10 (GoPro, Inc., San Mateo, CA, USA)) to record video along predefined transects or areas in 2023 and 2024. In the laboratory, videos were analyzed to document fish species, abundance, and estimated body lengths within a 60 m× 5 m area per transect, as well as coral species and coverage. Species identification was based on high-resolution video footage from GoPro 10 cameras, supported by expert knowledge and regional field guides. Fish size was visually estimated by trained observers using reference scales and calibrated field experience. The depth of survey sites was determined based on the depth range of coral distribution, with at least six replicate transects established at each site and depth, each transect measuring 10 m in length. Coral cover and species richness data were statistically analyzed based on the number of taxonomic units recorded in each transect.
Each fish species was classified into six categorical traits based on its potential function in the ecosystem: size, diet, mobility, gregariousness, period of activity, and position water column [31]. These traits and their respective levels are detailed in Table S1. Previously, Mouillot et al. (2014) [31] conducted an initial evaluation of the relevance of these traits in describing the functionality of reef fish. The application of these six traits depends on how well they truly reflect functional attributes [32]. Species trait information was sourced from databases (www.fishbase.org (accessed on 28 March 2025)) and relevant literature [33,34]. Since trait values may vary across different sources, priority was given to FishBase, followed by the Taiwan FishBase (http://fishdb.sinica.edu.tw (accessed on 28 March 2025)), and then other references. Missing trait values for certain species were estimated either from specific literature for the species or by using related species with similar ecological niches and behaviors. The final dataset provided a species list, regional distribution, and selected traits.

2.3. Biodiversity and Functional Diversity Indices

Species richness is used to describe the number of species within a specific area [35]. The Shannon–Wiener diversity index (H’) was used to assess species diversity at the sampling sites [36]. The Pielou evenness index is used to measure the evenness of species distribution in terms of individual abundance [37]. A value closer to 1 indicates that the individuals in the community are more evenly distributed among the species, while a value closer to 0 indicates a less even distribution, where a few species dominate the community.
Sample coverage, according to Chao & Jost (2012) [38], can be calculated using the following formula:
C ( n ) = 1 F 1 n × n 1 F 1 n 1 F 1 + 2 F 2
where n is the total number of individuals in the sample, F1 is the number of singletons (species each represented by exactly one individual in the reference sample), F2 is the number of doubletons in the sample. This formula estimates the proportion of species that have not been sampled, providing a measure of the completeness of the current sampling effort. A higher coverage value indicates that the sample is more representative of the total species composition in the area being studied.
Length frequency distribution is a commonly used data presentation and analysis method in ecology and fisheries biology [28]. In this study, the fish body lengths from the obtained transect data were calculated by taking the mean of the length range for each transect.
The FEve, FDis, and FRic are widely used indices in functional diversity research, each capturing distinct aspects of species distribution within functional trait space [39,40,41].
The FEve quantifies the evenness of species distribution along functional axes; higher values indicate a more balanced representation of functional types and suggest reduced redundancy and more efficient resource use, contributing to ecosystem stability.
The FDis measures the average distance of species from the community centroid in functional space; greater values reflect higher functional heterogeneity, which may enhance the ecosystem’s capacity to respond to environmental variability.
The FRic represents the volume of functional space occupied by the community; higher values imply a broader range of functional traits, indicating a more complete array of ecological roles and stronger potential for ecosystem functioning.
Collectively, these indices offer valuable insights into the functional structure and resilience of ecological communities.
To characterize the overall functional trait changes in fish communities, the community-weighted mean (CWM) index was calculated for each sampling site. CWM represents the weighted average value of a specific functional trait in the community, with the weights determined by the relative abundance of each species at the site [42]. For each functional trait, CWM is calculated by multiplying the trait value of each species by its relative abundance and then summing the results. This value reflects the dominant characteristics of the community in that trait dimension. The calculation of CWM is based on the functcomp function and implemented in the FD package [43], using a standardized abundance matrix and a species trait matrix as inputs. The formula is as follows:
CWM = i = 1 s P i j × trait i
where S is the total number of species at the sampling site, Pij is the relative abundance of species i at site j, traiti is the trait value of species i along the specific trait dimension.

2.4. Statistical Analyses

The differences in the Shannon–Wiener diversity index, species richness, and evenness index among groups were tested using Welch’s ANOVA by GraphPad Prism 10.0. Prior to conducting Welch’s ANOVA, data normality was assessed using the Shapiro–Wilk test. As variance heterogeneity was detected, Welch’s ANOVA was applied to test for differences in diversity indices among groups. Post hoc pairwise comparisons were performed using the Dunnett T3 test. Statistical significance was set at p < 0.05.
To assess differences in fish body length distributions among regions, individual-level data were reconstructed from size-class abundance using class midpoints as approximate lengths. Empirical cumulative distribution functions (ECDFs) were computed for each region. Pairwise two-sample Kolmogorov–Smirnov (K-S) tests were conducted to compare body length distributions between regions. Bonferroni correction was applied to adjust for multiple comparisons. All statistical analyses and visualizations were performed in R using the stats, dplyr, and ggplot2 packages (R vision 4.4.3).
To examine the relationships between species richness, coral cover, and functional diversity indices, simple linear regression analyses were performed. Scatter plots were constructed to visualize correlations, and regression models were fitted using GraphPad Prism 10.0. Each regression was evaluated based on the coefficient of determination (R2) and the significance level (p-value). Confidence intervals (95%) for the regression lines were also displayed to indicate the variability of the estimates. All variables were tested for linearity prior to model fitting.
To examine functional trait differentiation among reef fish communities across regions, we conducted a Principal Component Analysis (PCA) based on community-level trait composition. The input matrix consisted of site-level mean proportions of categorical trait modalities, including body size, mobility, diet, period of activity, gregariousness and position water column. Prior to analysis, all variables were standardized using Z-score transformation (i.e., mean-centered and scaled to unit variance) to ensure comparability across traits. The PCA was performed in R using the vegan and ggord packages. Trait loadings were visualized as vectors to indicate the relative contribution of each trait to the principal components. Sampling sites were categorized by region (HN, XS, NS), and 95% confidence ellipses were added to illustrate regional clustering patterns.
To compare the differences in fish community structure between different regions, this study used Principal Coordinates Analysis (PCoA) based on Bray–Curtis dissimilarity to ordain the fish species abundance data. To reduce the dominance of abundant species on community structure, the abundance data were square root transformed prior to ordination. A 95% confidence ellipse was overlaid on the plot to show the dispersion of community distributions and the clustering trends for each region.
The LEfSe (LDA Effect Size) method was used to identify key representative functional groups in each region. This method not only compares differences between multiple groups but also allows for subgroup-level exploration within each group, thereby identifying indicator species (biomarkers) with significantly different abundances. The data for analysis were sourced from the fish species abundance of each sampling site, and the analysis was conducted using an online cloud platform (http://cloudtutu.com.cn/ (accessed on 28 March 2025)). The LEfSe method combines the Kruskal–Wallis rank sum test, the Wilcoxon rank sum test, and linear discriminant analysis (LDA) to select species that are both statistically significant and biologically interpretable. The criteria for selection were a p-value of less than 0.05 and an LDA score greater than 2. To visually present the distribution of major dominant species across different regions, relative abundance comparison plots for key species in each region were created. Species were ranked by total abundance, highlighting the differences in species contributing predominantly to each region, thus supporting the results of the PCoA ordination.

3. Results

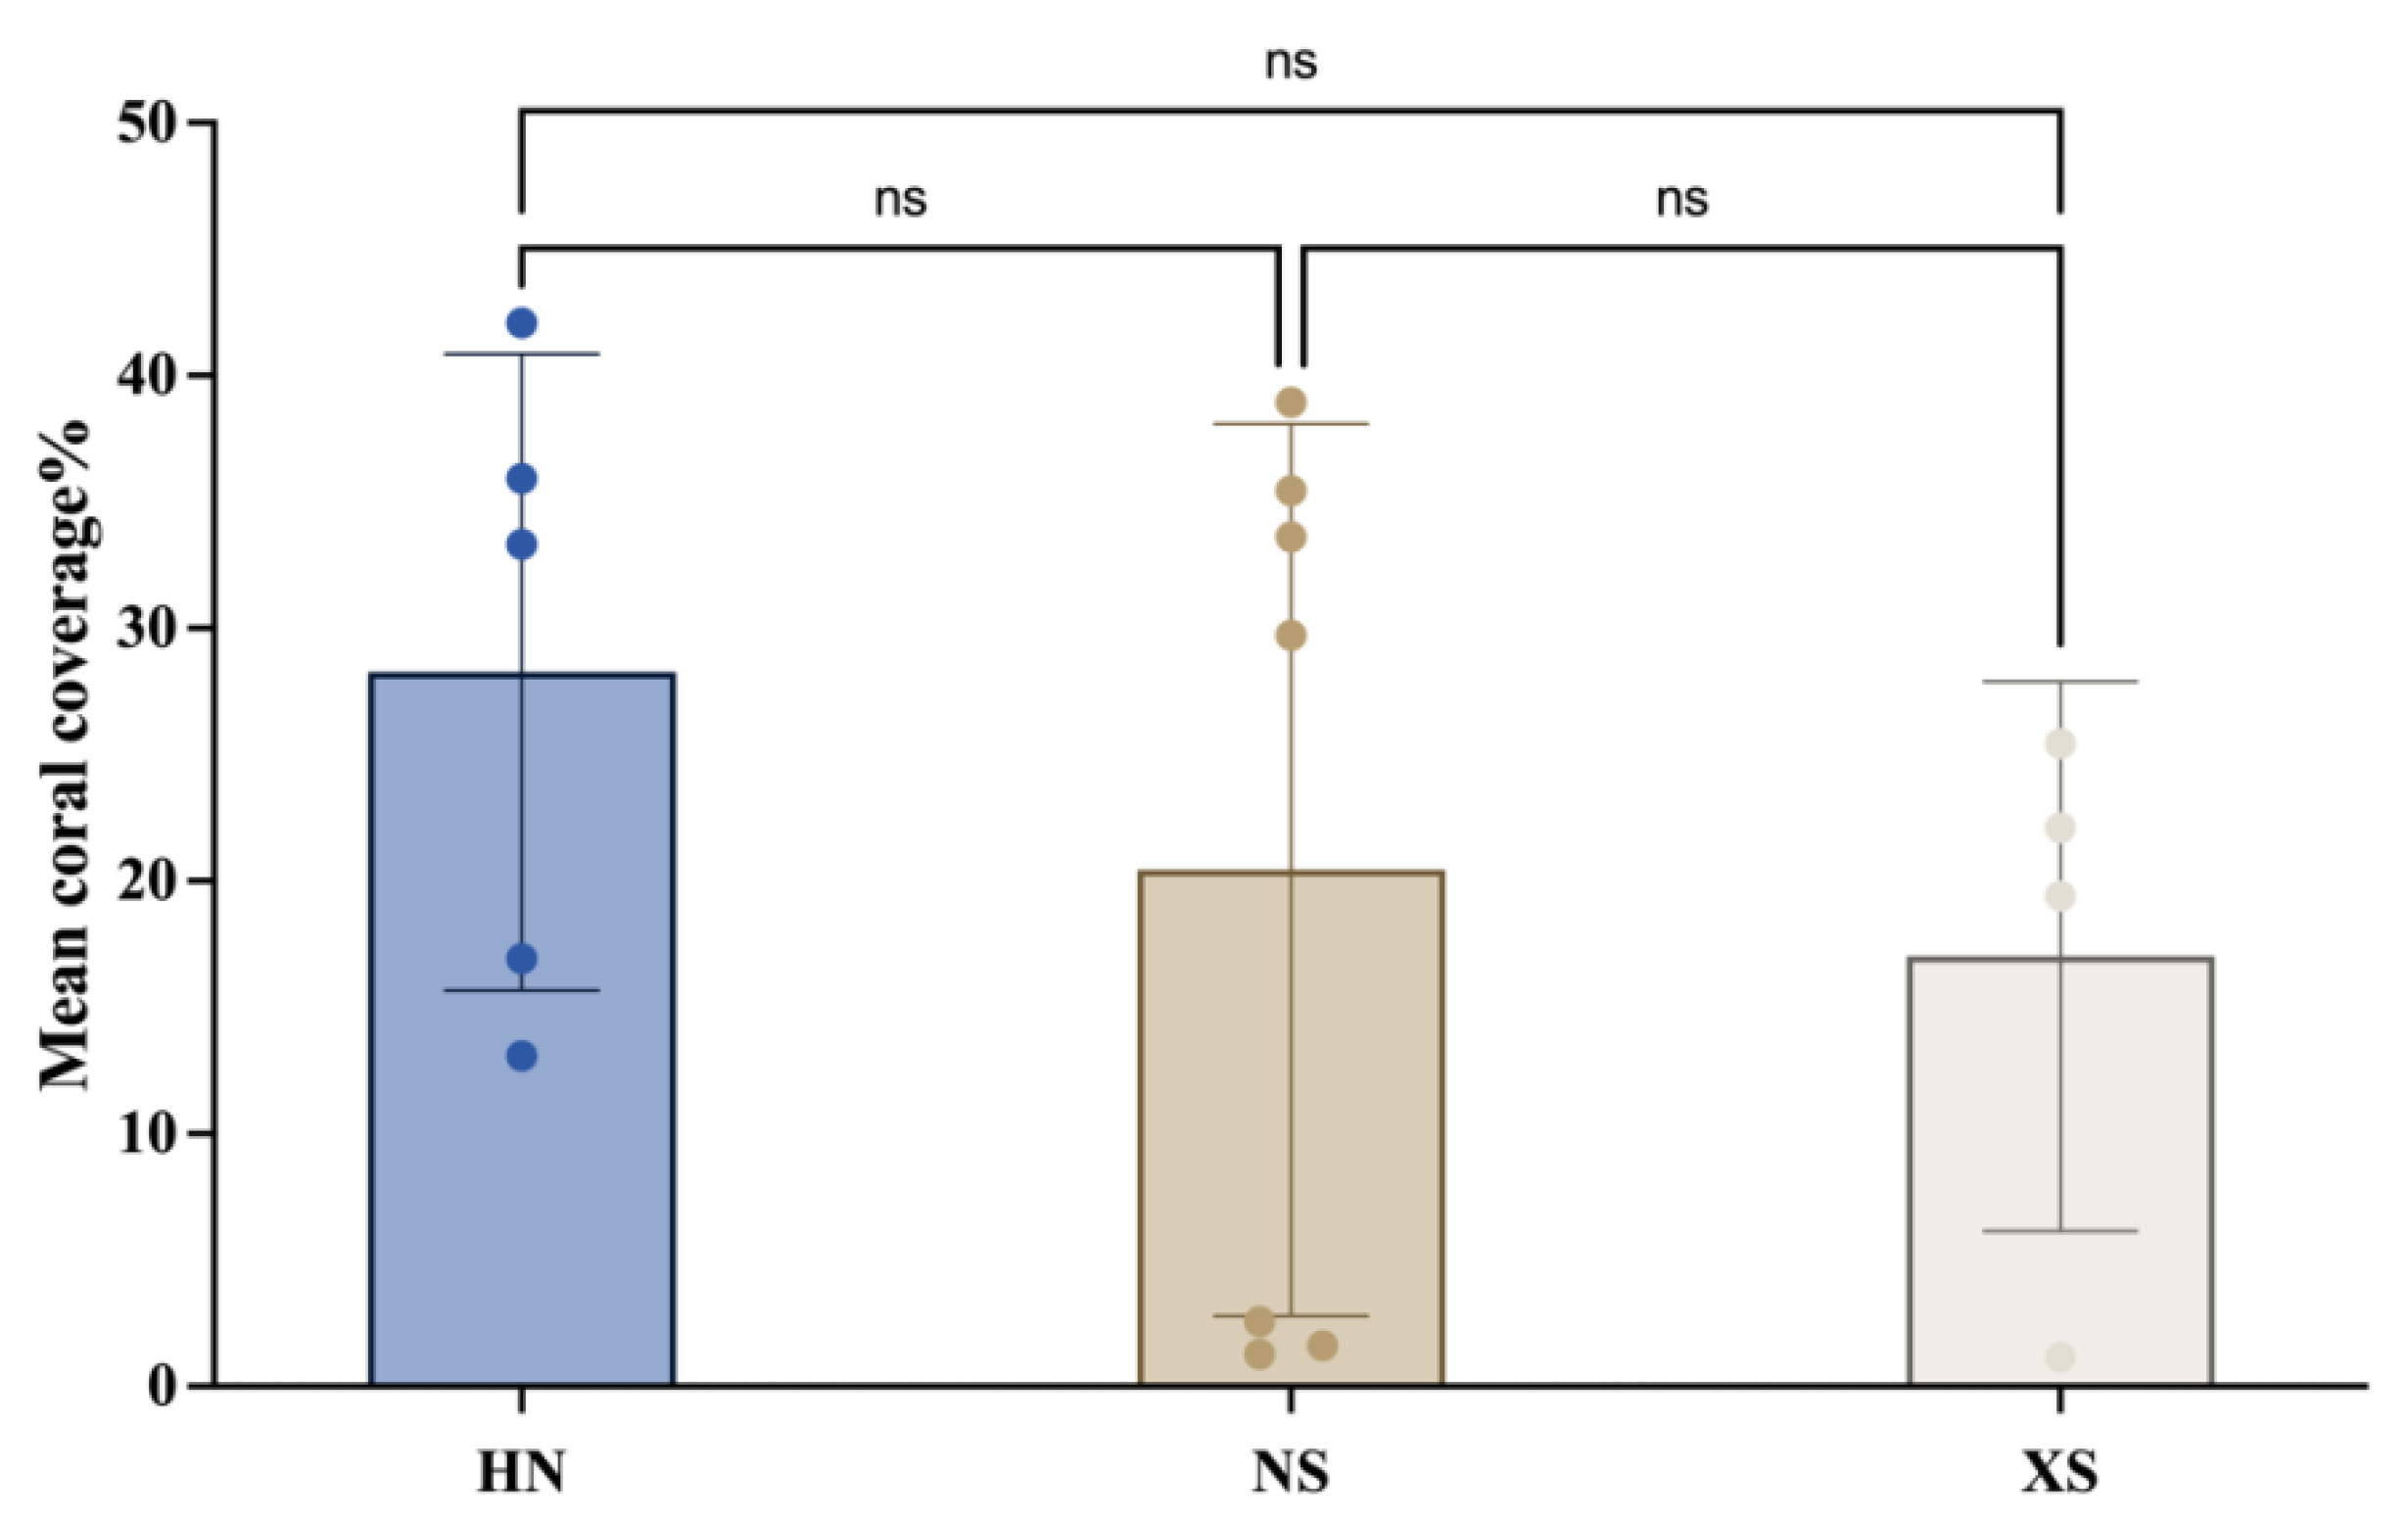
3.1. Sample and Coral Coverage

As shown in Table 2, the sample coverage calculation results indicated that 16 of the 19 sample sites had a coverage rate greater than 97%, with the remaining 3 sites having coverage rates greater than 90%, suggesting that the survey results for the different coral reef areas adequately represent the local reef fish biodiversity.
The results showed that although the average coral cover in the HN region was slightly higher than that in the NS and XS regions, the differences between the groups were not statistically significant (Figure 2). However, the distribution of data points within each region also suggests that there is considerable variability in coral cover (Table 1).

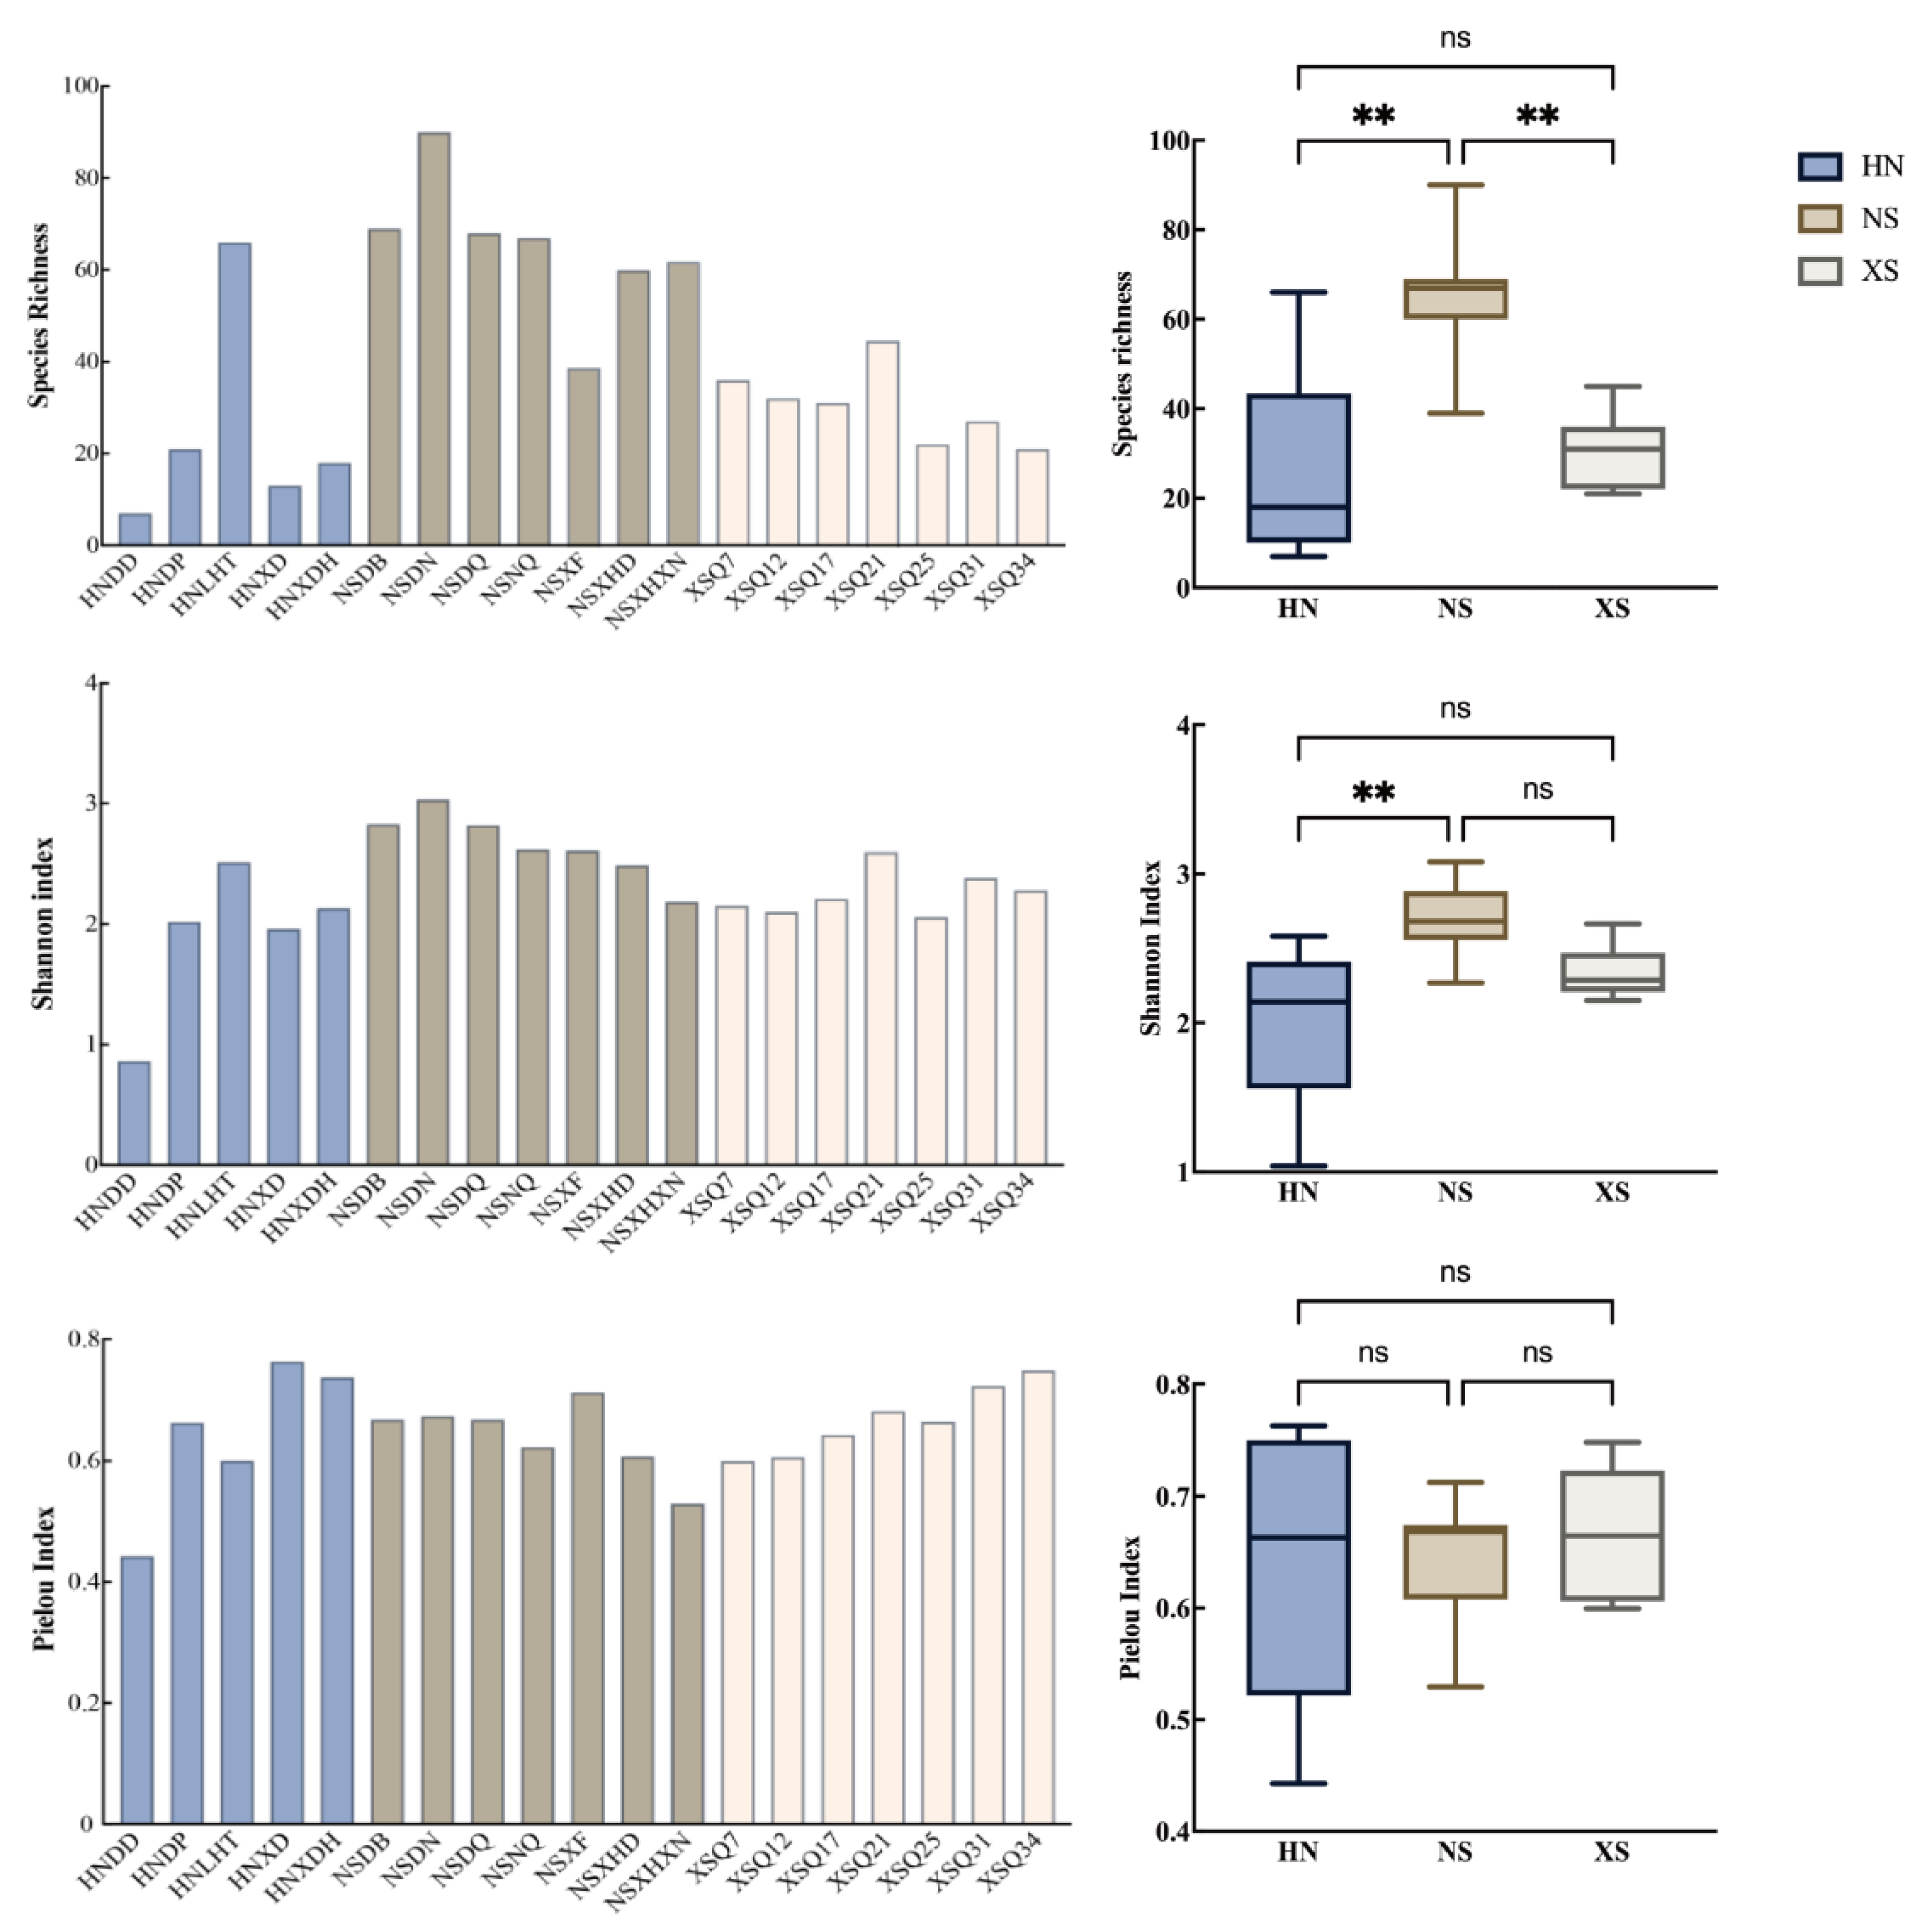
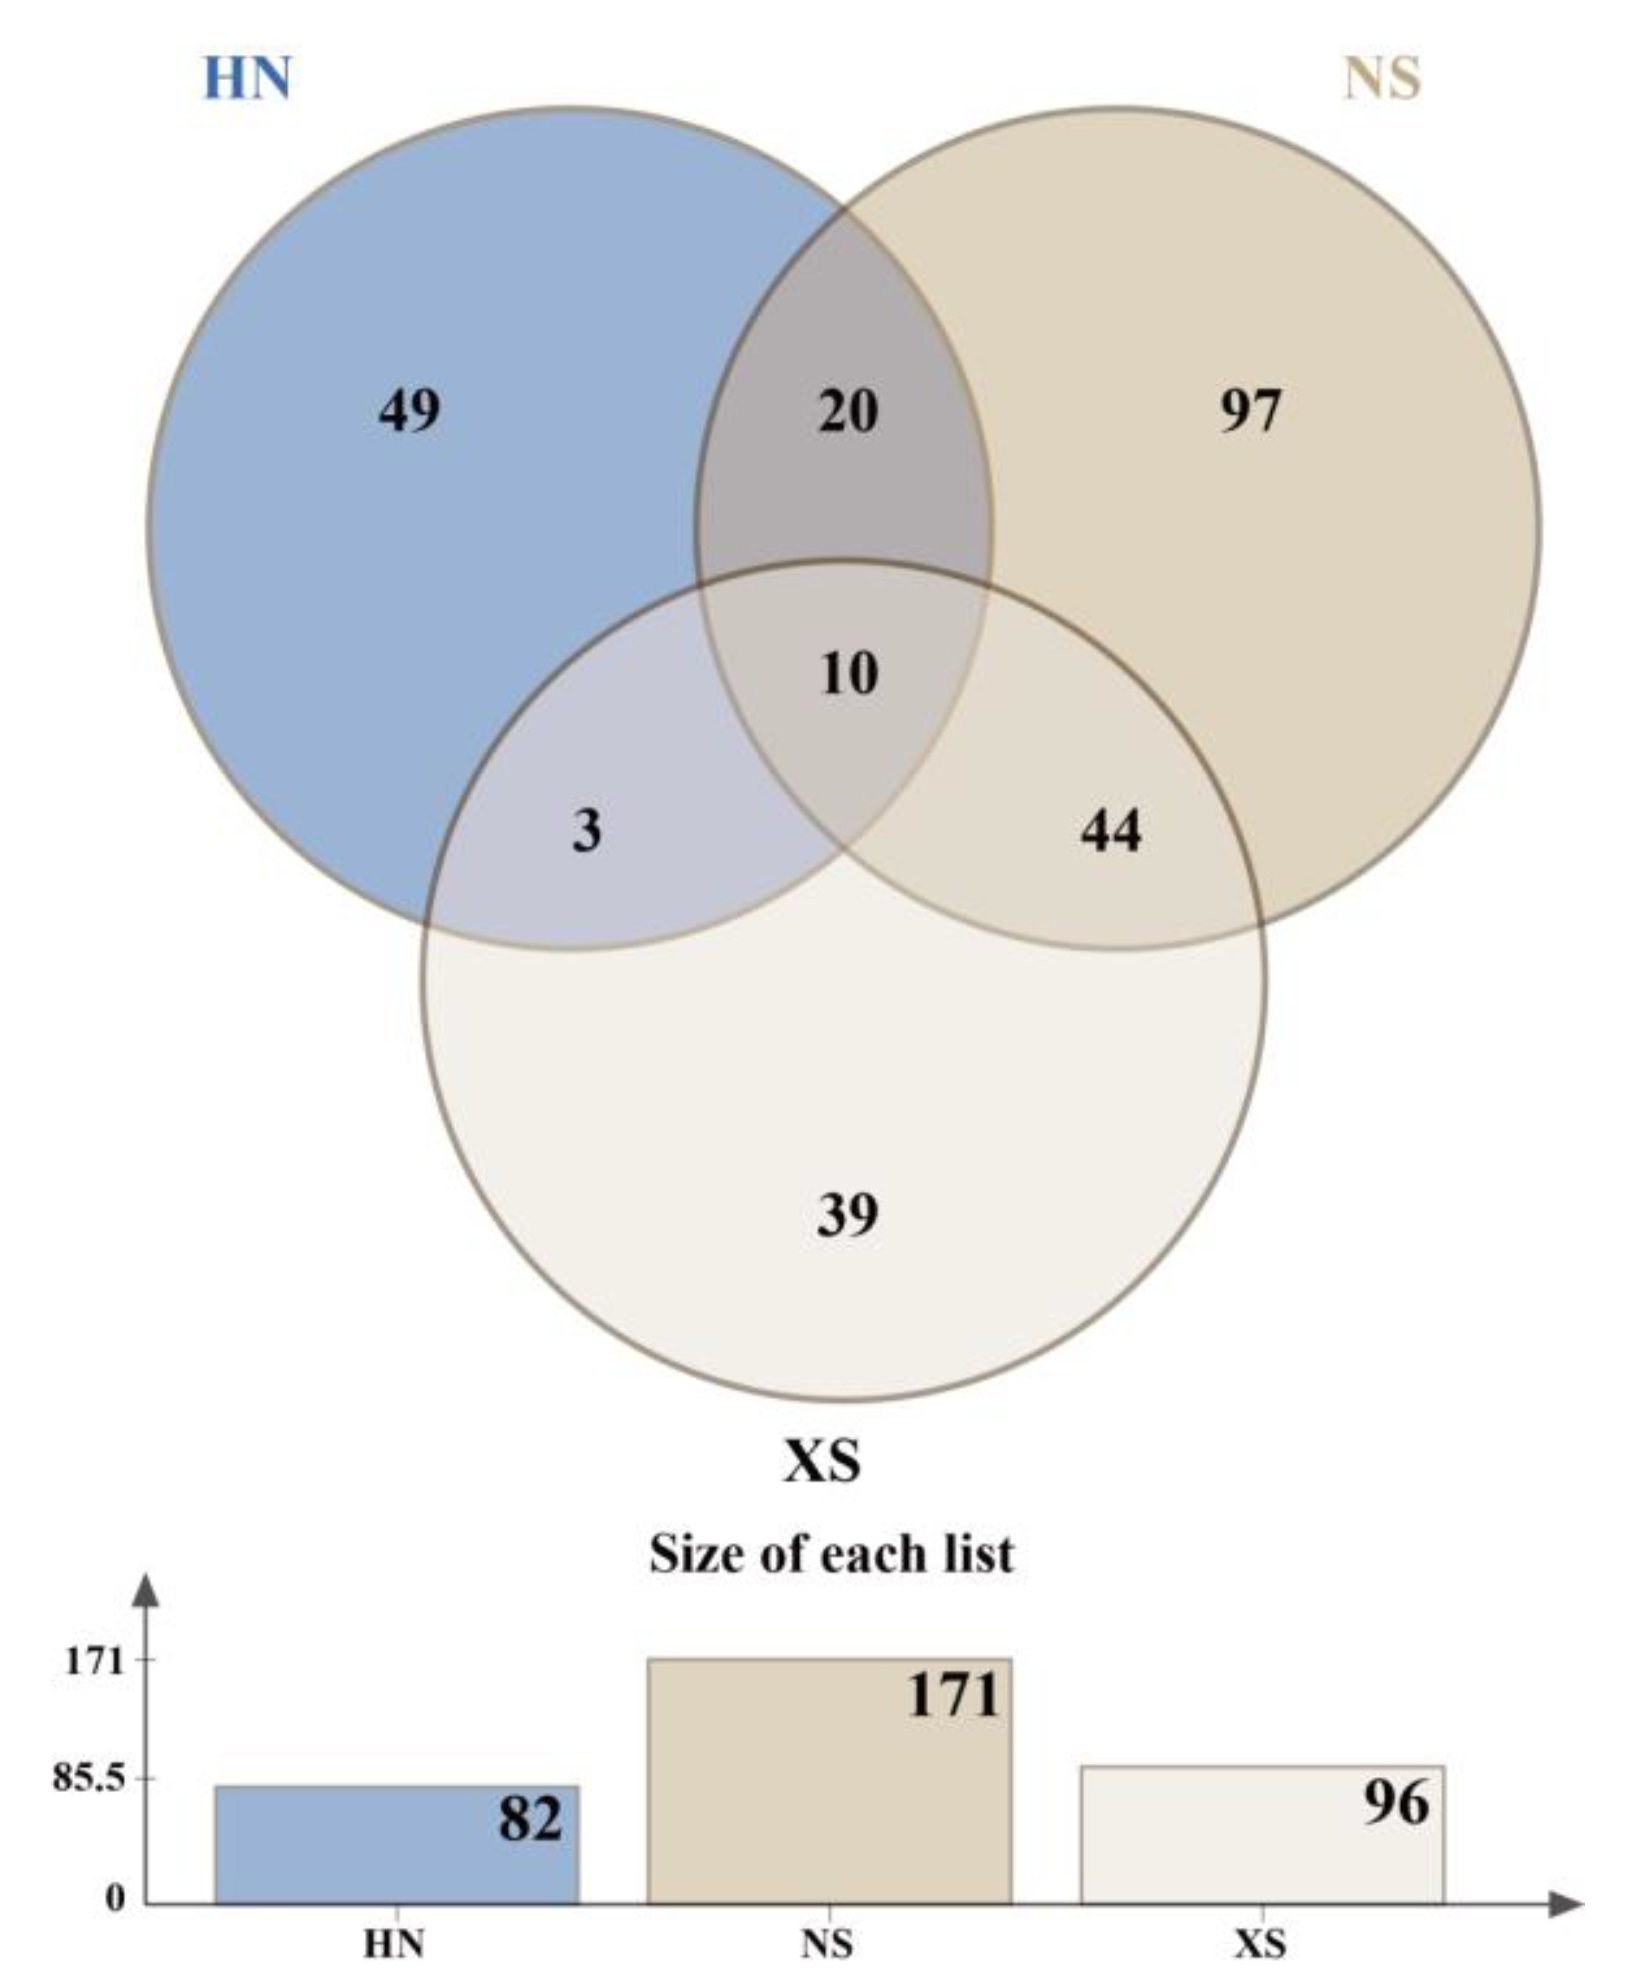
3.2. Taxonomic Diversity Patterns of Fish Communities

A total of 240 species of reef fish from 55 families and 156 genera were recorded in this study. Highest species richness (90 fish species) was found at Meiji Island. This site also had the highest Shannon–Wiener index, indicating a high level of biodiversity. In contrast, the Dong Island in Sanya, Hainan, had the lowest species richness, with only 7 species of reef fish recorded. The Shannon–Wiener index and evenness index were also low, indicating poor biodiversity at this site. The West Island of Sanya and the northwest outer reef slope of Lingyang Reef in the Xisha Islands exhibited the highest Pielou evenness index, with more even distribution of species, although the species number was relatively low. Sites in the Nansha Islands, such as NSDB, NSDN, and NSDQ, performed well in all three indices, indicating relatively higher biodiversity on the eastern side of Meiji Reef. Significant differences in taxonomic diversity indices were observed between different regions (HN, NS, XS) (Figure 3). Species richness was significantly higher in NS compared to both HN and XS (p < 0.01), while no significant difference was observed between HN and XS. For the Shannon index, NS showed significantly higher values than HN (p < 0.01), whereas the differences between NS and XS, and between HN and XS, were not statistically significant. No significant differences were detected in the Pielou evenness index among the three regions, suggesting that despite differences in species richness and diversity, the evenness of species distribution within communities remained relatively stable.
The results of the VN plot (Figure 4) show that the reef fish community of the Nansha Islands has the highest species richness (171 species) and the greatest uniqueness (97 species). The Nansha and Xisha Islands share 44 species. In contrast, the fish communities of Sanya, Hainan, and Xisha Islands have similar species numbers, but the number of shared species is relatively low (only three species). The completely shared species (10 species) include Cephalopholis urodeta, Chlorurus sordidus, Pycnochromis margaritifer, Chromis weberi, Epinephelus merra, Gomphosus varius, Halichoeres nebulosus, Labroides dimidiatus, Oxycheilinus unifasciatus, and Pomacentrus coelestis.

3.3. Fish Length Structure Analysis

The fish body length distributions varied significantly across regions. ECDF analysis (Figure 5) revealed that the NS region exhibited a left-skewed distribution dominated by small-bodied individuals (5–10 cm), while the XS region had a relatively higher proportion of larger-bodied individuals. The HN region showed an intermediate pattern. Kolmogorov–Smirnov tests confirmed significant differences between all regional pairs (HN vs. NS, HN vs. XS, NS vs. XS), with Bonferroni-adjusted p-values all <0.001.

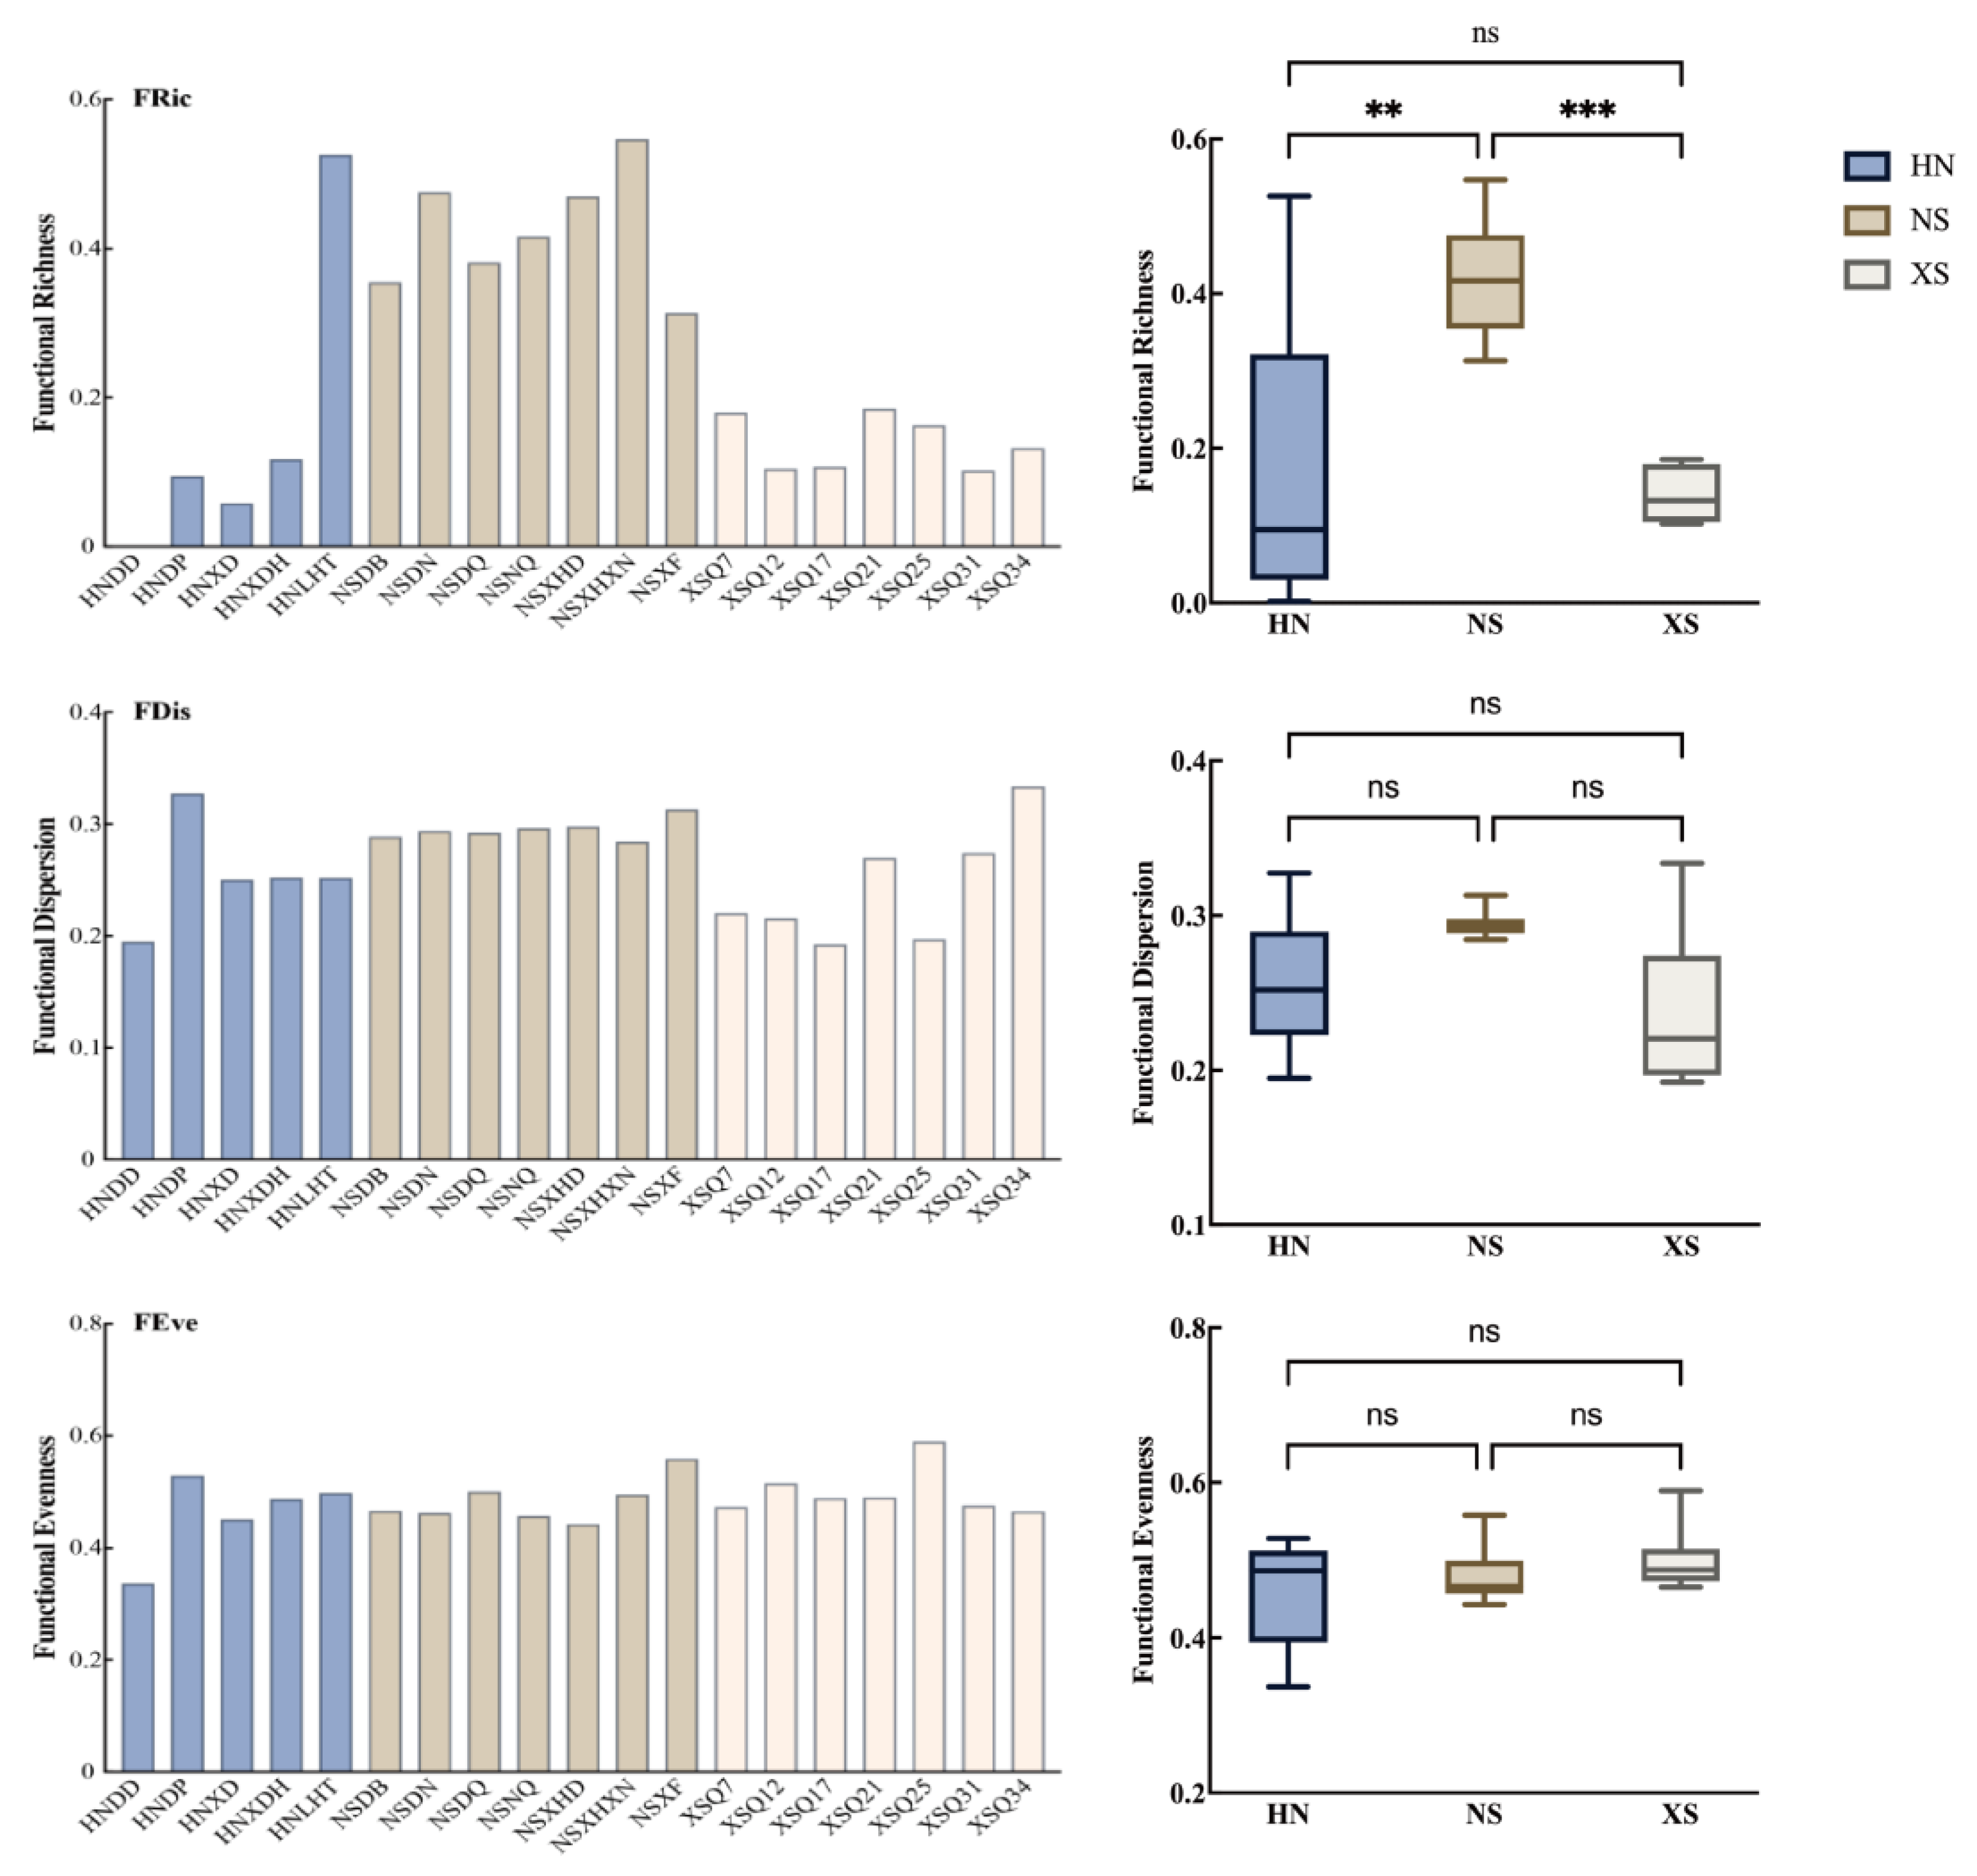
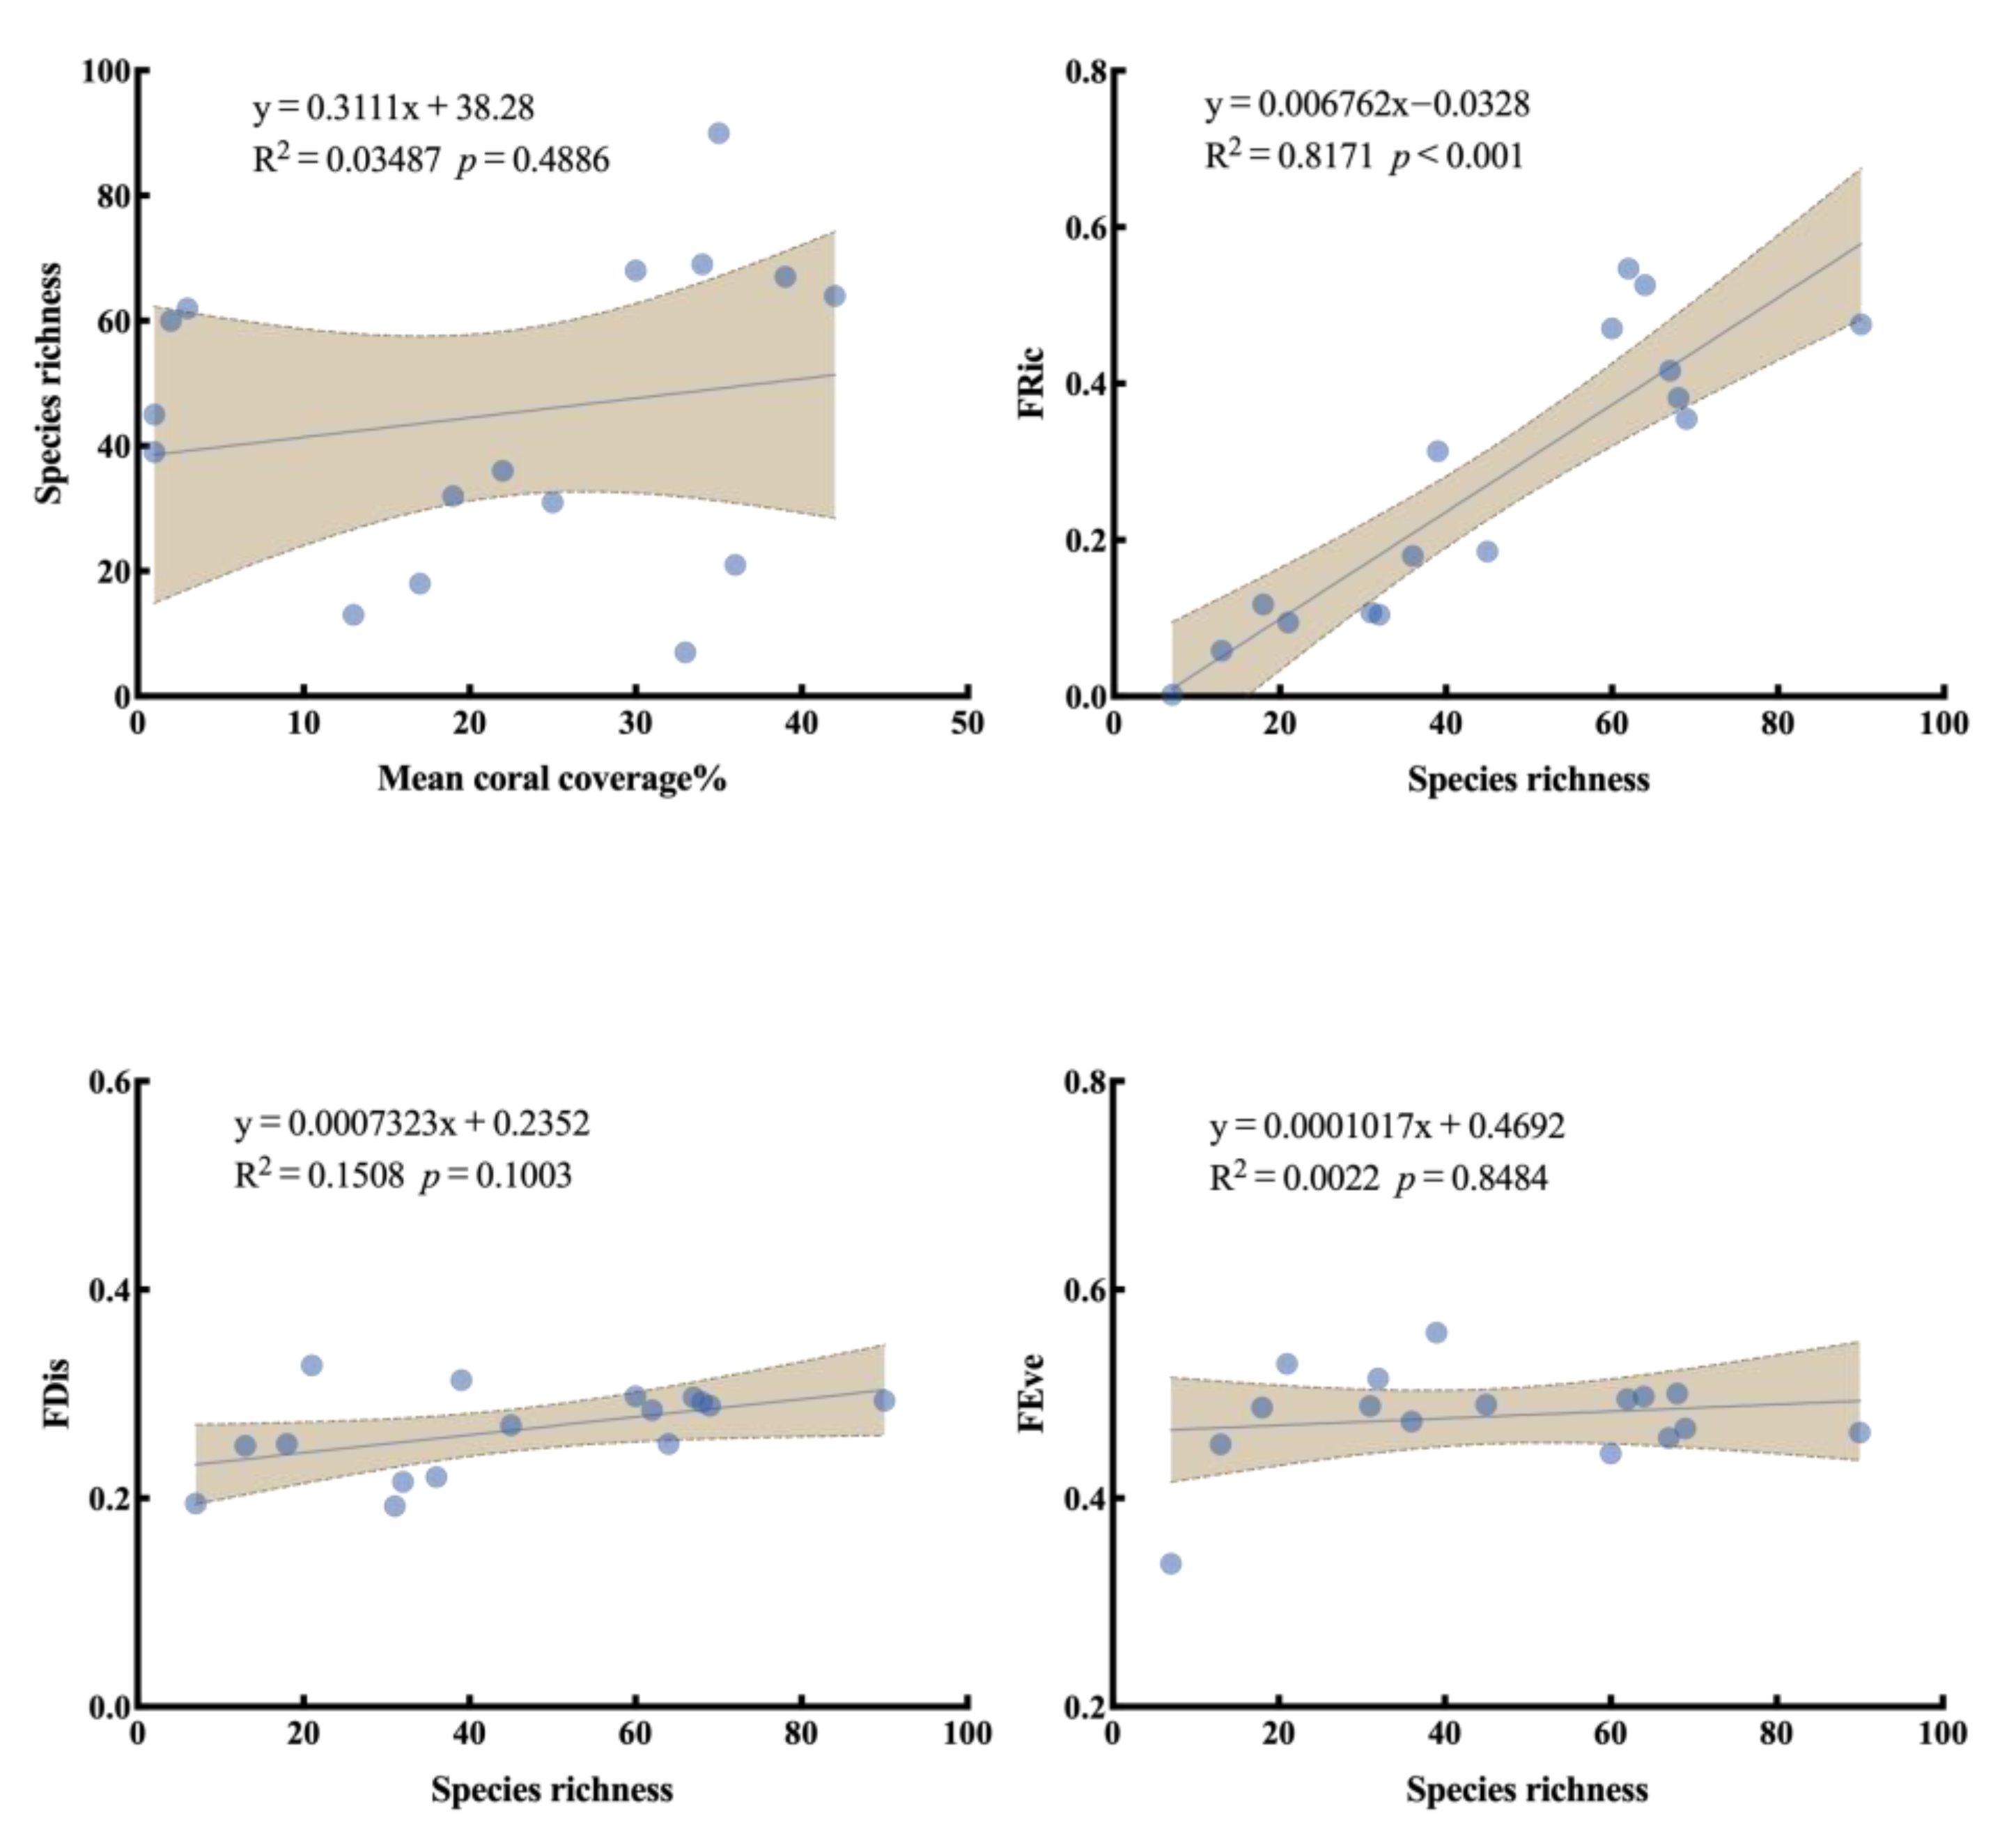
3.4. Functional Diversity and Trait Composition

The differences in functional structure of reef fish communities across regions is shown in Figure 6, the majority of sampling sites in the NS region exhibited relatively high functional richness, particularly at the NSXHXN and NSDN sites. In contrast, only one site in the HN region (HNLHT) showed high functional richness, while the remaining sites displayed consistently low values. The XS region had the lowest overall functional richness among all sampling locations, revealing a pronounced regional difference. Statistical analysis presented in Figure 6 further supports this pattern, indicating that functional richness in the NS region was significantly higher than in the XS region, whereas the differences between HN and NS, and between HN and XS, were not statistically significant. In contrast, differences in functional dispersion across regions were minimal, with most site values ranging between 0.25 and 0.32, and no clear regional patterns observed. The results in Figure 6 confirm that there were no statistically significant differences in FDis among the three regions. Functional evenness values across all sampling sites were moderate, with some sites in the HN region (e.g., HNDP and HNLHT) showing slightly higher FEve values. Statistical comparisons also revealed no significant differences in functional evenness among the three regions.
A weak but non-significant positive correlation was found between average coral cover and species richness (Figure 7). This suggests that increased coral cover does not necessarily lead to a significant increase in fish species richness. In contrast, a strong and significant positive correlation was observed between species richness and functional richness (R2 ≈ 0.82, p < 0.001), indicating that as species number increases, the community occupies a broader range in functional trait space, thereby filling more functional positions within the ecological niche framework. With respect to FDis, species richness showed a moderate but non-significant positive trend with FDis (R2 ≈ 0.15), suggesting that changes in species number have limited influence on the dispersion of traits within functional space. Furthermore, there was virtually no correlation between species richness and functional evenness (R2 = 0.0022).
Linear regression analyses (Table 3) revealed significant correlations between species richness and the community-weighted means (CWMs) of several key functional traits (p < 0.05). Traits positively correlated with species richness included small body size (size_0–7 cm; R2 ≈ 0.60, p < 0.001), mobility within a reef (mob_mobile within a reef; R2 ≈ 0.40, p < 0.01), and solitary behavior (gre_solitary; R2 ≈ 0.37, p < 0.01). Additionally, the CWMs of species feeding on sessile invertebrates (diet_sessile invertebrates), herbivorous-detritivorous species (diet_herbivorous-detritivorous), and sedentary fish with low mobility (mob_sedentary) were all significantly positively correlated with species richness (R2 ≈ 0.25, p < 0.05).
Cluster heatmap analysis of the CWMs across different regional sites revealed clear differentiation in functional trait composition among reef fish communities (Figure 8a). Principal Component Analysis (PCA) of the CWMs (Figure 8b) further illustrated the patterns of functional variation. The first two principal components, PC1 and PC2, explained 38.8% and 24.4% of the total variation in functional traits, respectively, with a cumulative explanatory power of 63.2%. Sampling sites from the three regions displayed distinct clustering patterns in the PCA space, each forming a corresponding 95% confidence ellipse. Both clustering analyses revealed three major site groupings, corresponding to HN (Sanya, Hainan), XS (Xisha Islands), and NS (Nansha Islands), suggesting a consistent spatial pattern in functional structure across regions.
In terms of body size structure, all three regions were dominated by small-bodied fish (7.1–15 cm). However, a higher proportion of medium-bodied fish (15.1–30 cm) was observed in the NS region and at the XS site of Lingyang Reef compared to HN. Regarding mobility, species exhibiting inter-reef movement were more common in XS and NS, while intra-reef mobile species were more prevalent in HN and parts of NS. Sedentary species were most dominant in HN.
For behavioral traits, diurnal species were dominant across all three regions. In terms of social structure, small-group schooling species were predominant in all areas, though solitary species were more frequent at Dongdao and Dongpai in HN, as well as the northern part of Lingyang Reef in XS. In contrast, large-group schooling species were most abundant within the lagoon of Meiji Reef in NS.
At the trophic level, bentho-pelagic species contributed the most across all regions. In terms of feeding types, planktivorous species were dominant in NS and XS, while omnivorous and herbivorous-detritivorous species were more common in HN and XS. Both HN and NS had a greater proportion of species feeding on mobile invertebrates compared to XS.
As indicated by the trait loading vectors in the PCA plot, the primary contributors to PC1 were omnivorous (diet_O), sedentary mobility (mob_S), solitary behavior (gre_O), and small body size (size_B, 7.1–15 cm), all traits that were more heavily represented in the HN communities. XS sites were more strongly associated with inter-reef mobility (mob_B) and planktivory (diet_PL), showing a negative shift along PC1. PC2 was primarily driven by large-group schooling behavior (gre_L) and intra-reef mobility (mob_A). NS sites were largely concentrated in the positive direction of PC2, forming a relatively compact cluster in the principal component space.

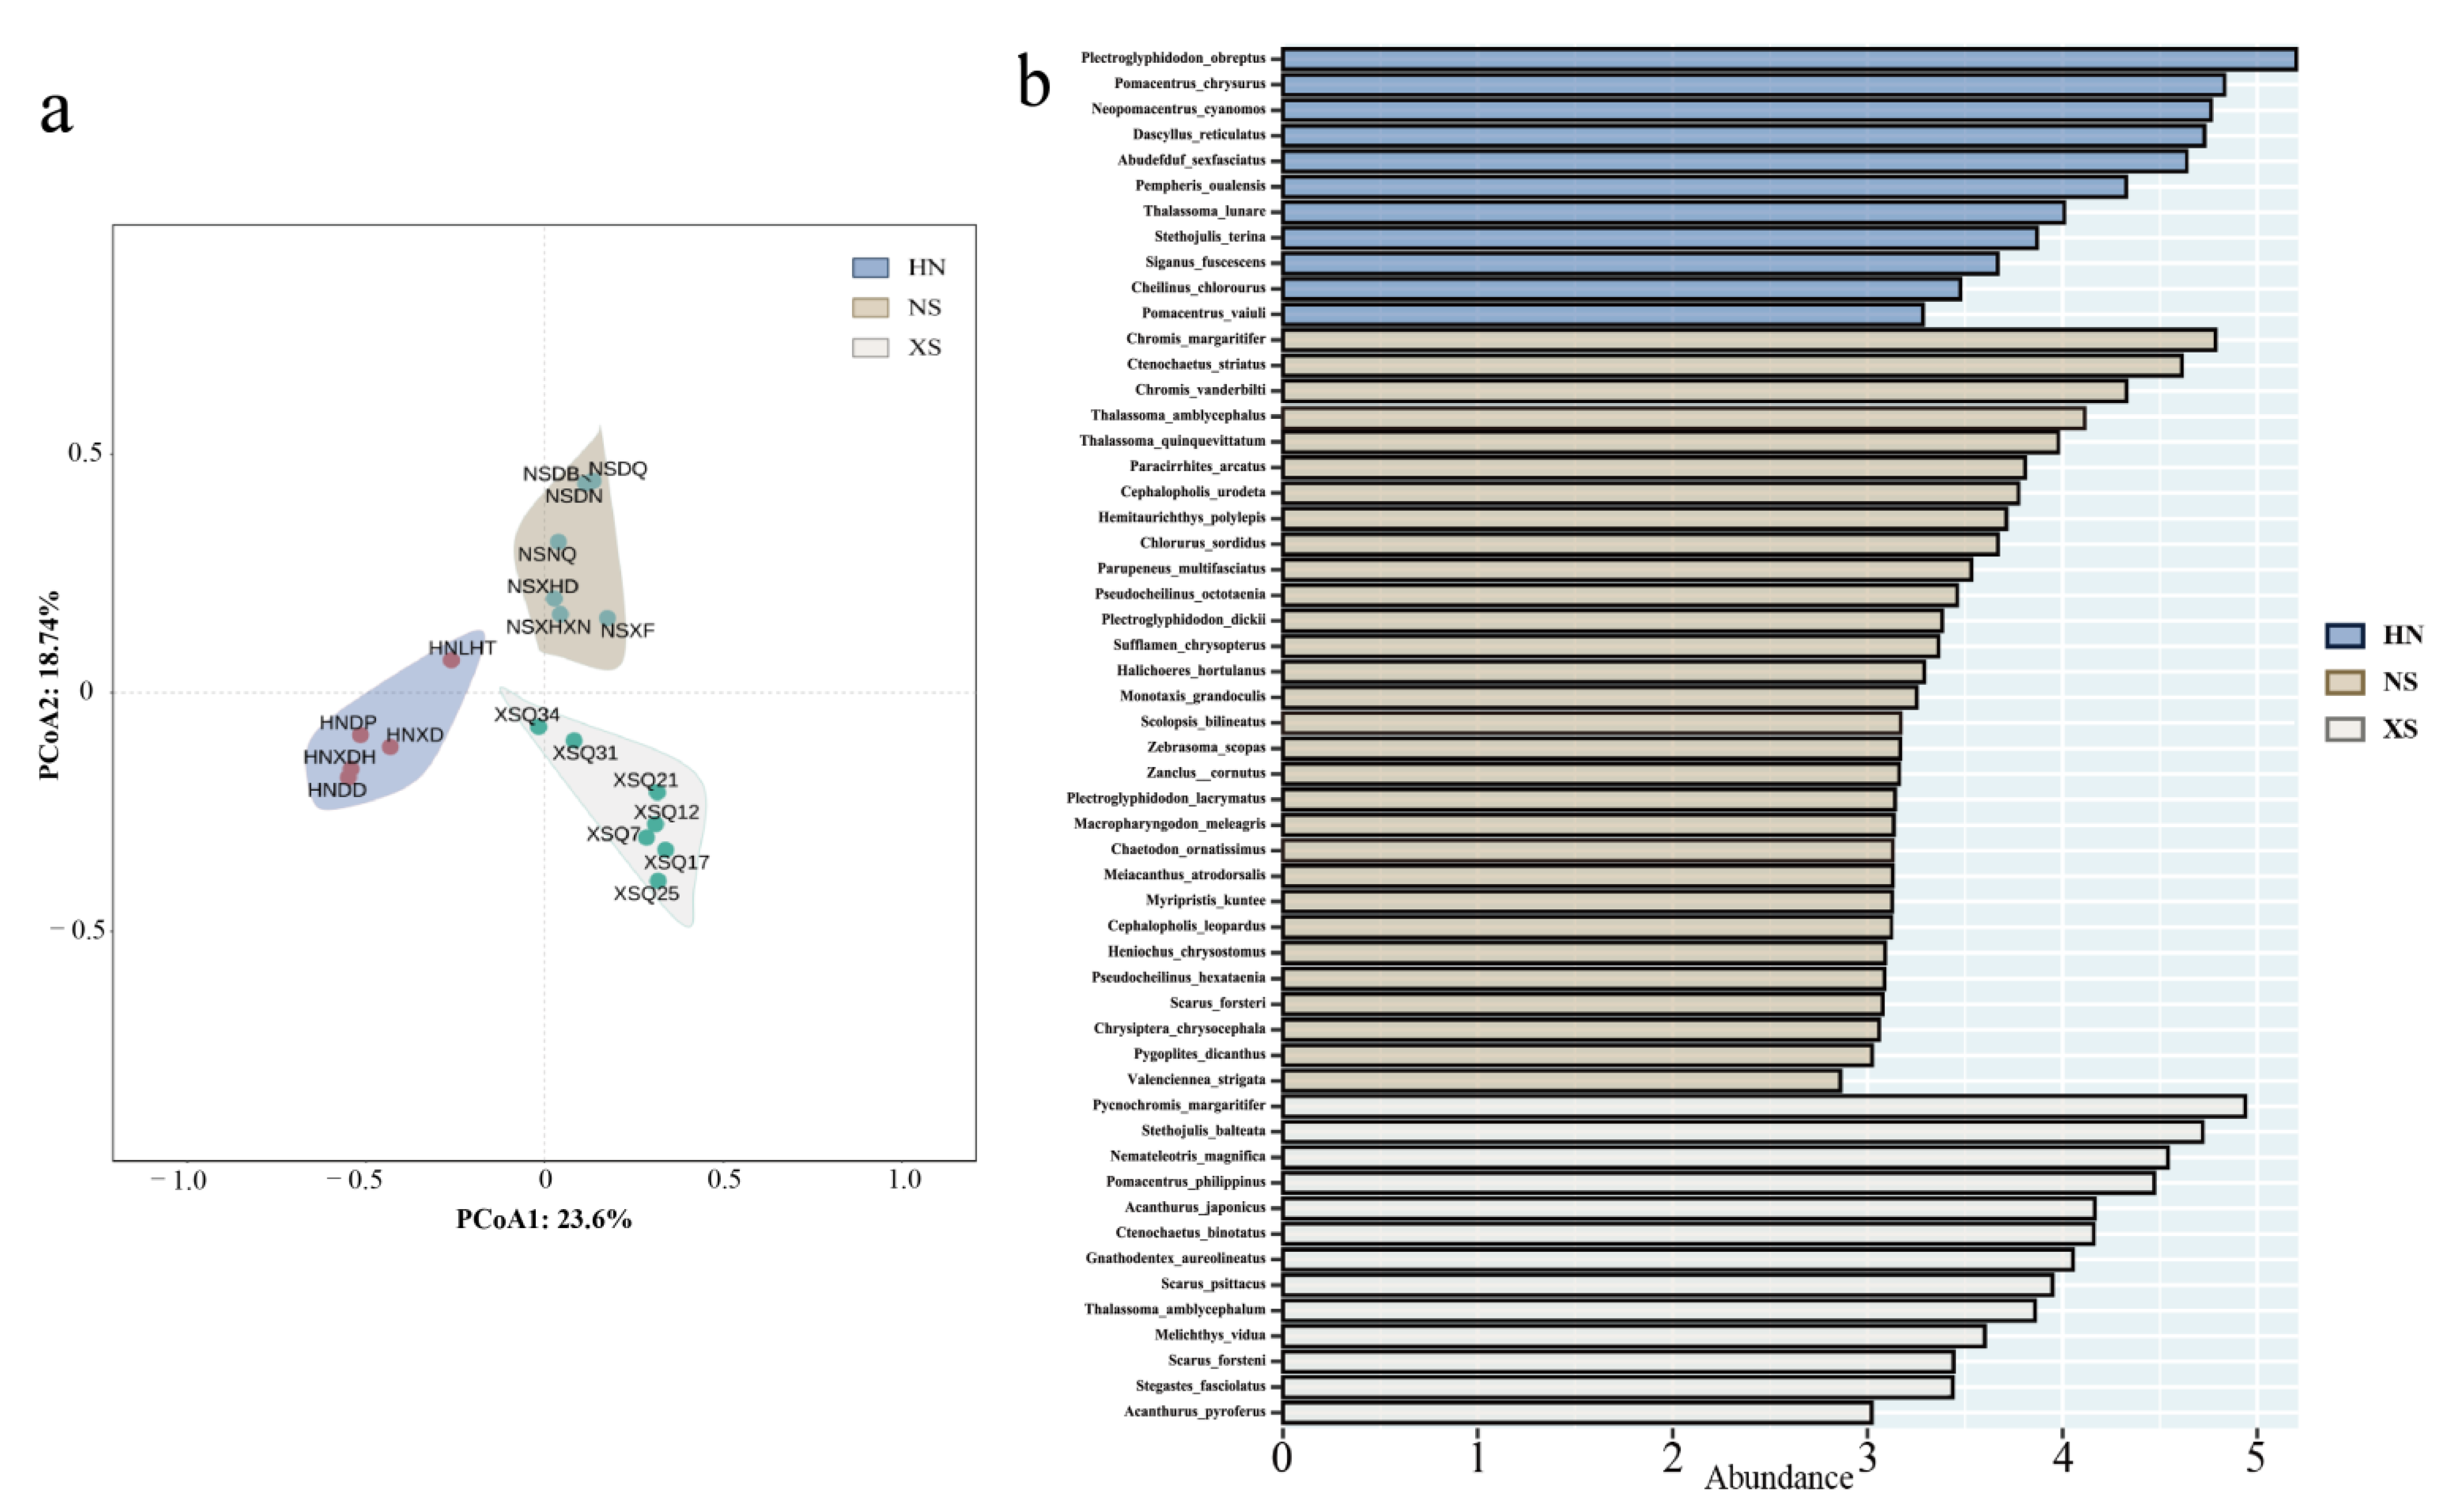
3.5. Community Structure and Indicator Species

Based on species abundance data, cluster analysis of the fish communities revealed that the 19 sampling sites were clearly grouped into three distinct clusters according to their geographic locations (Figure 9a). These included: the Nansha Islands group (NSXF, NSDN, NSNQ, NSDB, NSDQ, NSXHD, NSXHXN), the Xisha Islands group (XSQ31, XSQ34, XSQ12, XSQ21, XSQ17, XSQ25, XSQ7), and the Sanya, Hainan group (HNLTH, HNXD, HNXDH, HNDD, HNDP).
Using the LEfSe method, biomarker species analysis was conducted for the three reef fish communities (HN, NS, XS) (Figure 9b), revealing significant differences in species composition and ecological function across regions. Based on both the number of indicator species and their LDA scores, the NS region exhibited the most diverse and complex community structure, possessing the highest number of biomarker species. These included Siganus fuscescens, Thalassoma quinquevittatum, Cephalopholis urodeta, and Chlorurus sordidus. These species span across herbivorous, carnivorous, and omnivorous functional groups, reflecting a high degree of niche differentiation and a well-structured trophic architecture.
In contrast, the XS region was dominated by herbivorous and omnivorous species, with significant indicators including Plectroglyphidodon fasciolatus, Scarus psittacus, and Thalassoma amblycephalum, most of which are small to medium-sized reef-associated fishes with territorial behaviors or algal-feeding habits. In the HN region, damselfishes (family Pomacentridae) constituted the main characteristic group, including species such as Plectroglyphidodon obreptus, Pomacentrus chrysurus, and Neopomacentrus cyanomos.

4. Discussion

4.1. What Drives the Differences Between Nearshore and Offshore Coral-Reef Fish Communities?

This study conducted a comprehensive multidimensional assessment of 19 coral reef communities across three distinct geographic regions—Sanya (Hainan), the Xisha Islands, and the Nansha Islands. The results highlight significant taxonomic and functional differences between nearshore and offshore reef fish communities in the South China Sea. What accounts for these disparities? The evidence suggests that distinct ecological histories and disturbance regimes are key drivers.
Over the past decade, offshore reef ecosystems—particularly those in the Nansha Islands—have experienced extensive disturbances, including repeated outbreaks of crown-of-thorns starfish (Acanthaster spp.) and large-scale coral bleaching events [6,44,45,46,47]. These pressures have caused substantial declines in coral cover at many offshore sites. In contrast, nearshore reefs, such as those around Sanya, Hainan, have long been exposed to chronic anthropogenic stressors including overfishing, sedimentation, and nutrient enrichment from coastal runoff [6,48]. While recent conservation and restoration efforts in nearshore China have led to signs of ecological stabilization and increased coral cover [49], the long-standing impacts of human activity may have resulted in fragmented reef structures and simplified fish communities, often dominated by small-bodied, habitat-specialist taxa such as pomacentrids.
The Nansha Islands exhibited the highest species richness and Shannon diversity, along with the greatest number of LDA-identified indicator species, reflecting a structurally complex and ecologically differentiated fish community. Representative species in this region span a broad range of functional groups—including herbivores (e.g., C. sordidus), carnivores (e.g., C. urodeta), and omnivores (e.g., T. quinquevittatum)—suggesting the presence of a complete trophic hierarchy [50,51,52]. In contrast, fish communities in the Xisha Islands were more strongly dominated by herbivorous and omnivorous species concentrated at lower trophic levels (e.g., S. psittacus, P. fasciolatus), which may reflect a phase of post-disturbance succession or algal-dominated benthic conditions [53,54]. The fish communities of Sanya, Hainan, were compositionally narrow and structurally conservative, dominated by small, territorial species such as P. obreptus and P. chrysurus, with high microhabitat dependence and low functional variability [55,56].
Trait-based analyses further supported these patterns. For example, regions with greater species richness also had higher proportions of inter-reef mobile, planktivorous, and schooling species, all of which contribute to broader functional trait space and potentially enhance ecosystem resilience. Meanwhile, the prevalence of solitary, benthic species in nearshore reefs likely reflects habitat fragmentation and niche compression under environmental stress.

4.2. Are Current Conservation Priorities Aligned with Functional Importance?

In the context of global coral reef systems facing dual pressures from climate change and anthropogenic disturbances, identifying and prioritizing species that play key roles in maintaining ecosystem functions is of critical importance. This study developed a trait-based and indicator-driven framework for identifying priority conservation species among reef fishes, grounded in community-level functional trait analysis and species indicator evaluation.
The framework integrates three core principles: (1) ecological functional importance, referring to species that perform essential roles in the community, such as maintaining coral–algae balance or regulating trophic structure; (2) rarity and functional uniqueness, targeting species that occupy distinct positions in functional trait space and are ecologically irreplaceable; and (3) vulnerability, emphasizing species that are highly sensitive to environmental changes or habitat loss and exhibit low resilience.
Based on this framework—integrating community weighted mean (CWM) values, PCA loadings, LDA-identified indicator species, and species abundance patterns—a set of priority species was identified within the coral reef systems of the South China Sea. Notably, C. sordidus and S. fuscescens are medium to large herbivorous fishes widely distributed in the Nansha and Xisha regions. These species play critical ecological roles in controlling macroalgal overgrowth and maintaining open substrate for coral recruitment [57,58]. C. urodeta, a medium-sized carnivorous predator, contributes to the stability of food web dynamics by regulating trophic structure [33]. S. psittacus, which showed strong indicator value in the Xisha region, is an important benthic grazer contributing to substrate maintenance and reef structural integrity [53,57,58]. In addition, small territorial species such as P. obreptus and P. chrysurus are highly dependent on branching or crevice-rich coral microhabitats and are extremely sensitive to habitat disturbances [33,59], making them early indicators of ecosystem degradation.
These species span herbivorous, omnivorous, and carnivorous trophic levels, forming a multifunctional community structure that reflects the complementarity and diversity of ecosystem functions. Their loss could lead not only to the collapse of key ecological functions but also to reduced ecosystem resilience and service capacity [60].

4.3. Where Should Conservation Efforts Be Spatially Focused?

Building on species-level prioritization, this study also identified a set of representative priority conservation sites at the spatial level. By integrating species richness, functional trait divergence, PCA clustering patterns, and the distribution of LDA indicator species, several key areas were proposed.
The eastern to southeastern section of Meiji Reef in the Nansha Islands (NSDQ, NSDN, and NSDB) was identified as a biodiversity and functional core zone, characterized by a complete suite of functional groups and compact community structure, representing typical features of healthy coral reef ecosystems. The northern section of Lingyang Reef in the Xisha Islands (XSQ34 and XSQ21) displayed high functional uniqueness, particularly in planktivory and solitary behavior dimensions, suggesting its role as a critical zone for maintaining functional heterogeneity and ecological succession. In contrast, although species richness was relatively low in Sanya’s Luhuitou and Yalong Bay (HNLHT and HNDP), these sites were dominated by small, sedentary species with concentrated functional traits and strong sensitivity to microhabitat variation [61], thus representing ecologically vulnerable habitats.

4.4. How Can Conservation Strategies Be Refined to Enhance Reef Resilience?

In summary, conservation efforts in the South China Sea coral reef systems should adopt a dual focus on functionally important species and representative sites. Constructing a protection framework based on functional diversity and ecological sensitivity will help enhance the overall stability and resilience of reef ecosystems and provide a scientific basis for mitigating coral reef degradation under the pressures of global change.

4.5. Limitations and Future Research Directions

While this study provides important insights into the taxonomic and functional structure of reef fish communities in the South China Sea, several limitations should be acknowledged. First, the data represent a single temporal snapshot, limiting the ability to capture seasonal or interannual variability in community structure. Future studies incorporating long-term monitoring would help assess temporal dynamics and improve the generalizability of findings. Second, the trait dataset used in this study was limited to categorical variables. Including continuous traits such as body mass, growth rate, or fecundity could enhance the resolution of functional analyses and better reflect ecological processes. Third, the analysis focused solely on reef-associated fish species. Expanding the scope to include other faunal groups, such as mobile invertebrates or cryptic taxa, would provide a more comprehensive view of reef biodiversity and ecosystem functioning.
Despite these limitations, the trait-based framework developed here offers a promising foundation for future studies and conservation strategies in coral reef systems under increasing environmental pressure.

5. Conclusions

This study revealed clear community structure and functional distinctions among reef fish communities across nearshore and offshore systems in the South China Sea, shaped by differing disturbance histories, habitat conditions, and ecological dynamics. Offshore reefs, particularly in the Nansha Islands, support higher species richness, functional diversity, and trophic complexity, while nearshore reefs exhibit simplified, microhabitat-dependent communities. Coral cover alone proved insufficient to reflect ecological integrity, reinforcing the need for multidimensional biodiversity assessments. Building on trait-based analyses, this study proposed a strategic framework for identifying priority species and conservation sites, integrating ecological function, uniqueness, and vulnerability. Key species such as C. sordidus and S. fuscescens, and core sites like Meiji Reef and Lingyang Reef, were highlighted for targeted management. These findings underscore the importance of combining species-level and functional indicators to support adaptive conservation strategies, enhance ecosystem resilience, and guide sustainable coral reef management in the face of accelerating environmental change.

Supplementary Materials

The following supporting information can be downloaded at: https://www.mdpi.com/article/10.3390/d17060432/s1, Table S1: Classification of functional traits of coral reef fish; Table S2: Classification of functional traits of coral reef fish.

Author Contributions

S.L., S.H., H.H., X.L. and C.Z. conceived the research ideas and designed the methodology; X.L., C.Z., L.H. and S.L. were responsible for data collection and fieldwork; C.Z., L.H., X.L., S.H. and S.L. conducted data analysis; C.Z., S.H., L.H., X.L., S.L. and H.H. led the writing of the manuscript. All authors have read and agreed to the published version of the manuscript.

Funding

This research was funded by National Science and Technology Fundamental Resources Investigation Program of China (No. 2022FY100602), National Natural Science Foundation of China (No. 42176118), Special Fund of South China Sea Institute of Oceanology of the Chinese Academy of Sciences (No. SCSIO2023QY04), Science and Technology Planning Project of Guangdong Province, China (No. 2023B1212060047).

Institutional Review Board Statement

Ethical review and approval were waived for this study due to the fact that all data were obtained through non-invasive ecological field surveys, which did not involve any experimentation on humans or animals.

Data Availability Statement

The data associated with the article has been archived in the South China Sea Marine Data Center (https://data.scsio.ac.cn/metaData-detail/1907697807565189120, accessed on 28 March 2025).

Conflicts of Interest

The authors declare no conflicts of interest.

References

  1. Fisher, R.; O’Leary, R.A.; Low-Choy, S.; Mengersen, K.; Knowlton, N.; Brainard, R.E.; Caley, M.J. Species richness on coral reefs and the pursuit of convergent global estimates. Curr. Biol. 2015, 25, 500–505. [Google Scholar] [CrossRef] [PubMed]
  2. Huang, D.; Hoeksema, B.W.; Affendi, Y.A.; Ang, P.O.; Chen, C.A.; Huang, H.; Lane, D.J.W.; Licuanan, W.Y.; Vibol, O.; Vo, S.T.; et al. Conservation of reef corals in the South China Sea based on species and evolutionary diversity. Biodivers. Conserv. 2016, 25, 331–344. [Google Scholar] [CrossRef]
  3. Dai, X.; Li, Y.; Cai, Y.; Gong, Y.; Zhang, J.; Chen, Z. Variations in fish community structure at the lagoon of yongshu reef, south China Sea between 1999 and 2016–2019. Diversity 2019, 14, 763. [Google Scholar] [CrossRef]
  4. Zhang, K.; Guo, J.; Xu, Y.; Jiang, Y.E.; Fan, J.; Xu, S.; Chen, Z. Long-term variations in fish community structure under multiple stressors in a semi-closed marine ecosystem in the South China Sea. Sci. Total Environ. 2020, 745, 140892. [Google Scholar] [CrossRef] [PubMed]
  5. Zhang, J.; Zhang, K.; Jiang, Y.E.; Li, Y.J.; Fan, J.T.; Yu, W.M.; Chen, Z.Z. Diversity and structure of demersal fish community over the northern slope in the South China Sea. Front. Mar. Sci. 2022, 9, 809636. [Google Scholar] [CrossRef]
  6. Huang, H.; Chen, Z.; Huang, L. Status of Coral Reefs in China (2010—2019); Ocean Press: Beijing, China, 2021. [Google Scholar]
  7. Duprey, N.N.; Yasuhara, M.; Baker, D.M. Reefs of tomorrow: Eutrophication reduces coral biodiversity in an urbanized seascape. Glob. Change Biol. 2016, 22, 3550–3565. [Google Scholar] [CrossRef]
  8. Guest, J.R.; Tun, K.; Low, J.; Vergés, A.; Marzinelli, E.M.; Campbell, A.H.; Bauman, A.G.; Feary, D.A.; Chou, L.M.; Steinberg, P.D. 27 years of benthic and coral community dynamics on turbid, highly urbanised reefs off Singapore. Sci. Rep. 2016, 6, 36260. [Google Scholar] [CrossRef]
  9. Heery, E.C.; Hoeksema, B.W.; Browne, N.K.; Reimer, J.D.; Ang, P.O.; Huang, D.; Friess, D.A.; Chou, L.M.; Loke, L.H.; Saksena-Taylor, P.; et al. Urban coral reefs: Degradation and resilience of hard coral assemblages in coastal cities of East and Southeast Asia. Mar. Pollut. Bull. 2018, 135, 654–681. [Google Scholar] [CrossRef]
  10. Luo, Y.; Huang, L.; Lei, X.; Yu, X.; Liu, C.; Jiang, L.; Huang, H. Light availability regulated by particulate organic matter affects coral assemblages on a turbid fringing reef. Mar. Environ. Res. 2022, 177, 105613. [Google Scholar] [CrossRef]
  11. Shi, Y.; Li, Y.; Lu, W.; Sun, D. Taxonomic diversity of fish species in coral reef area from Dongsha Islands. South China Fish. Sci. 2009, 5, 10–16. [Google Scholar]
  12. Li, Y.; Zhang, J.; Chen, Z.; Jiang, Y.; Gong, Y.; Cai, Y.; Yang, Y. Study on taxonomic diversity of fish in Zhubi Reef of Nansha Islands. South China Fish. Sci. 2020, 16, 36–41. [Google Scholar]
  13. Xie, H.; Liu, Y.; Zhao, J.; Li, C.; Shi, J.; Xiao, Y.; Wang, T. Species composition and succession of coral reef fish in Yuzhuo Reef, Xisha Islands. South China Fish. Sci. 2024, 20, 46–55. [Google Scholar]
  14. Wang, T.; Li, C.; Wang, G.; Zhao, J.; Shi, J.; Xie, H.; Liu, Y. Species composition and succession of coral reef fishes on Qilianyu Island, Xisha Islands. Biodivers. Sci. 2024, 32, 23481. [Google Scholar] [CrossRef]
  15. Li, Y.Z.; Shi, Y.R.; Ai, H.; Dong, L.N.; Li, N.N.; Li, X.; Gao, T.X. Large scale distribution patterns of taxonomic diversity of fish in coral reef waters, South China Sea. J. Fish. Sci. China 2011, 18, 619–628. [Google Scholar] [CrossRef]
  16. Lin, X.; Hu, S.; Liu, Y.; Zhang, L.; Huang, H.; Liu, S. Disturbance-mediated changes in coral reef habitat provoke a positive feeding response in a major coral reef detritivore, Ctenochaetus striatus. Front. Mar. Sci. 2021, 8, 682697. [Google Scholar] [CrossRef]
  17. Lin, X.; Hu, S.; Zhou, Y.; Huang, H.; Zhang, L.; Liu, S. A multiple-methods approach to investigate dietary differences among nominally herbivorous fishes. Mar. Biol. 2023, 170, 134. [Google Scholar] [CrossRef]
  18. Halpern, B.S.; Floeter, S.R. Functional diversity responses to changing species richness in reef fish communities. Mar. Ecol. Prog. Ser. 2008, 364, 147–156. [Google Scholar] [CrossRef]
  19. Diamond, J.; Roy, D. Patterns of functional diversity along latitudinal gradients of species richness in eleven fish families. Glob. Ecol. Biogeogr. 2023, 32, 450–465. [Google Scholar] [CrossRef]
  20. Mouillot, D.; Lepretre, A. A comparison of species diversity estimators. Res. Popul. Ecol. 1999, 41, 203–215. [Google Scholar] [CrossRef]
  21. Vallina, S.M.; Cermeno, P.; Dutkiewicz, S.; Loreau, M.; Montoya, J.M. Phytoplankton functional diversity increases ecosystem productivity and stability. Ecol. Model. 2017, 361, 184–196. [Google Scholar] [CrossRef]
  22. Hallett, L.M.; Stein, C.; Suding, K.N. Functional diversity increases ecological stability in a grazed grassland. Oecologia 2017, 183, 831–840. [Google Scholar] [CrossRef] [PubMed]
  23. Song, Y.; Wang, P.; Li, G.; Zhou, D. Relationships between functional diversity and ecosystem functioning: A review. Acta Ecol. Sin. 2014, 34, 85–91. [Google Scholar] [CrossRef]
  24. Wen, Z.; Zheng, H.; Smith, J.R.; Zhao, H.; Liu, L.; Ouyang, Z. Functional diversity overrides community-weighted mean traits in linking land-use intensity to hydrological ecosystem services. Sci. Total Environ. 2019, 682, 583–590. [Google Scholar] [CrossRef]
  25. Yeager, L.A.; Deith, M.C.; McPherson, J.M.; Williams, I.D.; Baum, J.K. Scale dependence of environmental controls on the functional diversity of coral reef fish communities. Glob. Ecol. Biogeogr. 2017, 26, 1177–1189. [Google Scholar] [CrossRef]
  26. Ruiz-Benito, P.; Ratcliffe, S.; Jump, A.S.; Gómez-Aparicio, L.; Madrigal-González, J.; Wirth, C.; Kändler, G.; Lehtonen, A.; Dahlgren, J.; Kattge, J.; et al. Functional diversity underlies demographic responses to environmental variation in European forests. Glob. Ecol. Biogeogr. 2017, 26, 128–141. [Google Scholar] [CrossRef]
  27. Brock, V.E. A preliminary report on a method of estimating reef fish populations. J. Wildl. Manag. 1954, 18, 297–308. [Google Scholar] [CrossRef]
  28. Bell, J.D.; Craik, G.J.S.; Pollard, D.A.; Russell, B.C. Estimating length frequency distributions of large reef fish underwater. Coral Reefs 1985, 4, 41–44. [Google Scholar] [CrossRef]
  29. Bohnsack, J.A.; Bannerot, S.P. A Stationary Visual Census Technique for Quantitatively Assessing Community Structure of Coral Reef Fishes; NOAA Technical Report NFWS 41; NOAA: Silver Spring, MD, USA, 1986; pp. 1–15.
  30. English, S.; Wilkinson, C.; Baker, V. Survey Manual for Tropical Marine Resources; Australian Institute of Marine Science: Townsville, Australia, 1997.
  31. Mouillot, D.; Villéger, S.; Parravicini, V.; Kulbicki, M.; Arias-González, J.E.; Bender, M.; Chabanet, P.; Floeter, S.R.; Friedlander, A.; Vigliola, L.; et al. Functional over-redundancy and high functional vulnerability in global fish faunas on tropical reefs. Proc. Natl. Acad. Sci. USA 2014, 111, 13757–13762. [Google Scholar] [CrossRef]
  32. Mouillot, D.; Graham, N.A.; Villéger, S.; Mason, N.W.; Bellwood, D.R. A functional approach reveals community responses to disturbances. Trends Ecol. Evol. 2013, 28, 167–177. [Google Scholar] [CrossRef]
  33. Froese, R.; Pauly, D. (Eds.) FishBase; World Wide Web Electronic Publication: Boston, MA, USA, 2025; Version (02/2025); Available online: www.fishbase.org (accessed on 28 March 2025).
  34. Shao, K.T. Taiwan Fish Database. WWW Web Electronic Publication. 2025. Available online: http://fishdb.sinica.edu.tw (accessed on 28 March 2025).
  35. Waide, R.B.; Willig, M.R.; Steiner, C.F.; Mittelbach, G.; Gough, L.; Dodson, S.I.; Juday, G.P.; Parmenter, R. The relationship between productivity and species richness. Annu. Rev. Ecol. Syst. 1999, 30, 257–300. [Google Scholar] [CrossRef]
  36. Keylock, C. Simpson diversity and the Shannon–Wiener index as special cases of a generalized entropy. Oikos 2005, 109, 203–207. [Google Scholar] [CrossRef]
  37. Jost, L. The relation between evenness and diversity. Diversity 2010, 2, 207–232. [Google Scholar] [CrossRef]
  38. Chao, A.; Jost, L. Coverage-based rarefaction and extrapolation: Standardizing samples by completeness rather than size. Ecology 2012, 93, 2533–2547. [Google Scholar] [CrossRef] [PubMed]
  39. Tilman, D. Functional diversity. In Encyclopedia of Biodiversity, 2nd ed.; Elsevier Inc.: Amsterdam, The Netherlands, 2001; pp. 587–596. [Google Scholar]
  40. Mammola, S.; Carmona, C.P.; Guillerme, T.; Cardoso, P. Concepts and applications in functional diversity. Funct. Ecol. 2021, 35, 1869–1885. [Google Scholar] [CrossRef]
  41. Laureto, L.M.O.; Cianciaruso, M.V.; Samia, D.S.M. Functional diversity: An overview of its history and applicability. Nat. Conserv. 2015, 13, 112–116. [Google Scholar] [CrossRef]
  42. Lavorel, S.; Grigulis, K.; McIntyre, S.; Williams, N.S.; Garden, D.; Dorrough, J.; Berman, S.; Quétier, F.; Thébault, A.; Bonis, A. Assessing functional diversity in the field–methodology matters! Funct. Ecol. 2008, 22, 134–147. [Google Scholar] [CrossRef]
  43. Laliberté, E.; Legendre, P. A distance-based framework for measuring functional diversity from multiple traits. Ecology 2010, 91, 299–305. [Google Scholar] [CrossRef]
  44. Li, S.; Yu, K.; Chen, T.; Shi, Q.; Zhang, H. Assessment of coral bleaching using symbiotic zooxanthellae density and satellite remote sensing data in the Nansha Islands, South China Sea. Chin. Sci. Bull. 2011, 56, 1031–1037. [Google Scholar] [CrossRef]
  45. Li, Y.; Wu, Z.; Liang, J.; Chen, S.Q.; Zhao, J.M. Analysis on the outbreak period and cause of Acanthaster planci in Xisha Islands in recent 15 years. Chin. Sci. Bull. 2019, 64, 3478–3484. [Google Scholar]
  46. Reimer, J.D.; Kise, H.; Wee, H.B.; Lee, C.L.; Soong, K. Crown-of-thorns starfish outbreak at oceanic Dongsha Atoll in the northern South China Sea. Mar. Biodivers. 2019, 49, 2495–2497. [Google Scholar] [CrossRef]
  47. Heng, W.K.; Ho, M.J.; Kuo, C.Y.; Huang, Y.Y.; Ko, C.Y.; Jeng, M.S.; Chen, C.A. Crown-of-thorns starfish outbreak at Taiping island (Itu aba), spratlys, south China Sea. Bull. Mar. Sci. 2022, 98, 101–102. [Google Scholar] [CrossRef]
  48. Hughes, T.P.; Huang, H.U.I.; Young, M.A. The wicked problem of China’s disappearing coral reefs. Conserv. Biol. 2013, 27, 261–269. [Google Scholar] [CrossRef] [PubMed]
  49. Sun, Y.; Huang, L.; McCook, L.J.; Huang, H. Joint protection of a crucial reef ecosystem. Science 2022, 377, 1163. [Google Scholar] [CrossRef] [PubMed]
  50. Chen, L.S. Post-settlement diet shift of Chlorurus sordidus and Scarus schlegeli (Pisces: Scardiae). Zool. Stud.-Taipei- 2002, 41, 47–58. [Google Scholar]
  51. Nakai, T.; Sano, M.; Kurokura, H. Feeding habits of the darkfin hind Cephalopholis urodeta (Serranidae) at Iriomote Island, southern Japan. Fish. Sci. 2001, 67, 640–643. [Google Scholar] [CrossRef]
  52. Yaakub, S.M.; Bellwood, D.R.; van Herwerden, L.; Walsh, F.M. Hybridization in coral reef fishes: Introgression and bi-directional gene exchange in Thalassoma (family Labridae). Mol. Phylogenetics Evol. 2006, 40, 84–100. [Google Scholar] [CrossRef]
  53. Arai, T.; Amalina, R.; Bachok, Z. Similarity in the feeding ecology of parrotfish (Scaridae) in coral reef habitats of the Malaysian South China Sea, as revealed by fatty acid signatures. Biochem. Syst. Ecol. 2015, 59, 85–90. [Google Scholar] [CrossRef]
  54. Ho, C.T.; Fu, Y.C.; Sun, C.L.; Kao, S.J.; Jan, R.Q. Plasticity of feeding habits of two Plectroglyphidodon damselfishes on coral reefs in southern Taiwan: Evidence from stomach content and stable isotope analyses. Zool. Stud. 2009, 48, 649–656. [Google Scholar]
  55. Hata, H.; Ceccarelli, D.M. Farming behaviour of territorial damselfishes. In Biology of Damselfishes; CRC Press: Boca Raton, FL, USA, 2016; pp. 122–152. [Google Scholar]
  56. Frédérich, B.; Fabri, G.; Lepoint, G.; Vandewalle, P.; Parmentier, E. Trophic niches of thirteen damselfishes (Pomacentridae) at the Grand Récif of Toliara, Madagascar. Ichthyol. Res. 2009, 56, 10–17. [Google Scholar] [CrossRef]
  57. Clements, K.D.; Choat, J.H. Nutritional ecology of parrotfishes (Scarinae, Labridae). In Biology of Parrotfishes; CRC Press: Boca Raton, FL, USA, 2018; pp. 42–68. [Google Scholar]
  58. El Rahimi, S.A.; Hendra, E.; Isdianto, A.; Luthfi, O.M. Feeding preference of herbivorous fish: Family Scaridae. In IOP Conference Series: Earth and Environmental Science; IOP Publishing: Bristol, UK, 2021; Volume 869, p. 012004. [Google Scholar]
  59. Wilson, S.K.; Fisher, R.; Pratchett, M.S.; Graham, N.A.J.; Dulvy, N.K.; Turner, R.A.; Cakacaka, A.; Polunin, N.V. Habitat degradation and fishing effects on the size structure of coral reef fish communities. Ecol. Appl. 2010, 20, 442–451. [Google Scholar] [CrossRef]
  60. Oliver, T.H.; Isaac, N.J.; August, T.A.; Woodcock, B.A.; Roy, D.B.; Bullock, J.M. Declining resilience of ecosystem functions under biodiversity loss. Nat. Commun. 2015, 6, 10122. [Google Scholar] [CrossRef] [PubMed]
  61. Pratchett, M.S.; Munday, P.L.; Wilson, S.K.; Graham, N.A.; Cinner, J.E.; Bellwood, D.R.; Jones, G.P.; Polunin, N.V.C.; Mcclanahan, T.R. Effects of climate-induced coral bleaching on coral-reef fishes—Ecological and economic consequences. In Oceanography and Marine Biology; CRC Press: Boca Raton, FL, USA, 2008; pp. 257–302. [Google Scholar]
Figure 1. Study area of the current status assessment of reef fish communities in the South China Sea. (The map shows the distribution of the sampling sites included in this study, located across three regions in the South China Sea. Red triangles indicate specific survey sites: Xidao, Luhuitou, Dongpai, Dongdao, and Xiaodonghai in the northern South China Sea (HN region); Zhaoshu and Lingyang in the central South China Sea (XS region); and Meiji in the southern South China Sea (NS region). Detailed site names and corresponding region classifications are provided in Table 1).
Diversity 17 00432 g001
Figure 2. Coral coverage in different coral reef areas of the South China Sea (note: different colors represent different regions; “ns” indicates no significant difference between regions).
Diversity 17 00432 g002
Figure 3. Biodiversity indices of fish in different coral reefs of the south China sea (note: different colors represent different regions; ** indicates a significant difference with p < 0.01, while “ns” denotes no significant difference between regions).
Diversity 17 00432 g003
Figure 4. The Venn diagram illustrating the shared and unique species of different regions. (The Venn diagram illustrates the number of reef fish species shared among the northern (HN), central (XS), and southern (NS) regions. The bar plot below the diagram displays the total species richness recorded in each region).
Diversity 17 00432 g004
Figure 5. Length-frequency distribution of reef fish. (Empirical cumulative distribution functions (ECDFs) of fish body lengths across three reef regions: Hainan (HN), Xisha (XS), and Nansha (NS). Curves represent the cumulative proportion of individuals in each region at or below a given body length. The maximum vertical distance between curves corresponds to the Kolmogorov–Smirnov (K-S) statistic. All pairwise comparisons were statistically significant after Bonferroni correction, p < 0.001).
Diversity 17 00432 g005
Figure 6. Functional diversity indices of each study site (note: different colors represent different regions; *** indicates a highly significant difference with p < 0.001, ** indicates a significant difference with p < 0.01, while “ns” denotes no significant difference between regions).
Diversity 17 00432 g006
Figure 7. Relationship between functional diversity index and species richness. (Shaded areas indicate 95% confidence intervals of the regression lines. Equations, R2, and p-values are shown in each panel).
Diversity 17 00432 g007
Figure 8. Heatmap of functional trait distribution (a) and principal component analysis (PCA) (b) of reef fish communities in the South China Sea. (Note: (a) hierarchical clustering of coral reef sites based on functional trait composition using percentage similarity. The dendrogram reflects the resemblance relationships among sites, where shorter branch lengths indicate higher similarity. The heatmap displays the proportional occurrence of functional traits across sites (values from 0 to 1). Color bars above the heatmap indicate regional grouping: HN (blue), XS (grey), and NS (beige). (b). Color bars above the heatmap indicate regional grouping: HN (green), XS (blue), and NS (red). Functional trait abbreviations are defined in Table S1).
Diversity 17 00432 g008
Figure 9. (a) Principal Coordinate Analysis (PCoA) plot based on Bray–Curtis dissimilarity of species abundance, illustrating clustering of the 19 reef fish communities across the three regions (HN, NS, XS). Convex hulls enclose the sites within each region, highlighting regional grouping patterns. (b) Linear discriminant analysis Effect Size (LEfSe) results showing region-specific indicator species contributing to differences in community composition. Bar length represents the relative abundance of each species. Color shading corresponds to the region (blue: HN; brown: NS; gray: XS).
Diversity 17 00432 g009
Table 1. Sample coverage index of each station. (Due to the extremely low coral cover at Lingyang Reef in the Xisha Islands, the data lacked statistical significance. The symbol “–” in the table indicates that values were not calculated).
RegionSitesCodeLon/ELat/NDepthCoral Coverage
Sanya, Hainan
(HN)
Dongdao IslandDD109.4218.223 m~6 m33%
DongpaiDP109.318.153 m~9 m36%
LuhuitouLHT109.4818.23 m~6 m42%
Xidao IslandXD109.3718.233 m~9 m13%
XiaodonghaiXDH109.518.23 m~9 m17%
Nansha Islands
(NS)
Meiji IslandDB115.569.863 m~15 m34%
DN3 m~15 m35%
DQ3 m~15 m30%
NQ3 m~15 m39%
XF3 m~15 m1%
XHD3 m~15 m2%
XHXN3 m~15 m3%
Xisha Island (XS)Zhaoshu IslandQ07112.2716.973 m~15 m22%
Q123 m~15 m19%
Q173 m~15 m25%
Lingyang IslandQ21111.616.473 m~15 m1%
Q253 m~15 m-
Q313 m~15 m-
Q343 m~15 m-
Table 2. Sample coverage index of each station (F1 is the number of singletons (species each represented by exactly one individual in the reference sample), F2 is the number of doubletons in the sample).
SitesTotal Individuals (n)F1F2Sample Coverage
HNDD107400.96
HNDP156740.96
HNLHT16421870.99
HNXD63630.91
HNXDH215620.97
NSDB99225100.97
NSDN181326120.99
NSDQ96622140.98
NSNQ199215160.99
NSXF5311060.98
NSXHD136019110.99
NSXHXN13432360.98
XSQ075961240.98
XSQ124281260.97
XSQ177511450.98
XSQ2152015100.97
XSQ25420450.99
XSQ31261780.97
XSQ34605420.99
Table 3. Relationship between species richness and community functional traits. (Note: p-value significance codes: *** p < 0.001, ** p < 0.01, * p < 0.05, ns = not significant. Abbreviations of functional traits in the figure correspond to those listed in Table S1).
TraitSlopeInterceptR2p_Value
size_0–7 cm0.001−0.02530.6063***
mob_mobile within a reef0.0051−0.03630.3945**
gre_solitary−0.00450.45140.3739**
diet_sessile invertebrates0.0001−0.00130.311*
diet_herbivorous-detritivorous−0.00230.20980.2485*
mob_sedentary−0.0040.26390.2481*
act_diurnal-noctural0.0001−0.00090.1694ns
gre_large group0.00270.03790.0934ns
size_15.1–30 cm0.00160.18420.0774ns
size_7.1–15 cm−0.00210.74830.0707ns
lev_pelagic0.0001−0.00120.0683ns
size_50.1–80 cm0.00020.00310.0627ns
diet_planktivorous0.00260.24530.0626ns
diet_piscivorous0.00080.04170.0622ns
size_30.1–50 cm−0.00070.08860.0595ns
gre_medium group0.00070.02560.0525ns
lev_bentho-pelagic−0.00040.99040.0323ns
act_nocturnal−0.00050.06750.032ns
diet_omnivorous−0.00120.40760.0257ns
act_diurnal0.00040.93340.0231ns
lev_benthic0.00030.01080.0204ns
gre_small group0.00110.43990.0181ns
mob_mobile among reefs−0.00110.77240.0108ns
diet_macroalgal herbivorous00.00430.0094ns
gre_pairing0.00010.04520.001ns
diet_mobile invertebrates00.09240.0003ns
size_ > 80 cm00.00110.0002ns
Disclaimer/Publisher’s Note: The statements, opinions and data contained in all publications are solely those of the individual author(s) and contributor(s) and not of MDPI and/or the editor(s). MDPI and/or the editor(s) disclaim responsibility for any injury to people or property resulting from any ideas, methods, instructions or products referred to in the content.

