Article

Threatened Raptor Species Distribution in Nigeria: Influence of Socio-Cultural Factors and Human–Wildlife Conflicts

Department of Zoology, A. P. Leventis Ornithological Research Institute, University of Jos, Laminga, Jos-East P. O. Box 13404, Plateau State, Nigeria
*
Authors to whom correspondence should be addressed.
Diversity 2025, 17(9), 602; https://doi.org/10.3390/d17090602
Submission received: 30 April 2025 / Revised: 25 July 2025 / Accepted: 26 July 2025 / Published: 27 August 2025
(This article belongs to the Special Issue Conservation and Ecology of Raptors—2nd Edition)

Abstract

Understanding the spatial distribution and socio-cultural perceptions of threatened raptors is essential for evidence-based conservation in biodiverse yet understudied regions such as Nigeria. This study combines species distribution modelling with community-based surveys to explore the ecological and human dimensions influencing raptor conservation. To investigate the influence of anthropogenic pressures on threatened raptors’ reporting rates, we modelled the relationship between the reporting rate (RR) and two key predictors: the Human Footprint Index and population density. Concurrently, 318 questionnaires were administered across multiple sites to assess public perceptions and attitudes toward raptors. Results indicate that there was a notable reduction in the RR of threatened raptor species with an increase in population density (Estimate = −0.085, SE = 0.028, t = −3.056, p = 0.002). In socio-cultural analyses, sentiment analysis revealed that more than 60% of respondents with higher knowledge of raptors often held more negative perceptions, typically associated with poultry predation and cultural beliefs. In contrast, individuals with limited knowledge frequently exhibited more positive (50%) attitudes. Interestingly, areas with high raptor abundance were associated with more negative community perceptions, suggesting that human–wildlife conflict plays a significant role in shaping attitudes. These findings highlight the complexity of human–raptor interactions and the need for conservation strategies that extend beyond formal protected areas. We advocate for an integrated approach that combines ecological modelling with culturally sensitive education and community-based interventions to foster coexistence and support raptor conservation in Nigeria and similar socio-ecological landscapes.

1. Introduction

Raptors, as apex predators, are critical indicators of ecosystem health [1,2]. Raptors or birds of prey primarily hunt and feed on other birds and animals, except for vultures and condors, which mainly feed on carrion [3]. Raptors are built with very keen eyesight, highly sensitive sensory organs, strong beaks, and talons that are very useful when hunting and feeding on prey [4,5,6]. They are found worldwide within various ecosystems providing different functions, one of which is suppression of the population of other species, thus promoting ecosystem stability [2,7].
Raptors occupy the top of the food chain, serving as indicators of ecosystem health, habitat loss, or habitat degradation [2,7]. Sadly, their populations have plummeted by 52%, with 18% facing global extinction [6,7]. Their continuous population decline warrants more research to study their populations and understand their changes in distribution in response to environmental change and anthropogenic factors [8,9]. Raptor population and distribution are based primarily on prey availability and abundance, climate, and vegetation cover. However, anthropogenic factors can also serve as significant drivers of raptor population decline [6,10,11].
In many African cultures, birds, including raptors, play significant roles in traditional practices. Some birds, especially raptors (vultures, eagles, hawks, and kites), are believed to be used for traditional medicine and dark magic, leading to different perceptions and beliefs about these birds [12,13,14,15]. In West Africa, Nigeria is ranked first in the trade of bird species of conservation concern, driven mainly by cultural practices [12,16].
Nigeria hosts 13 globally threatened raptor species, including the Rüppell’s Vulture (Gyps rueppelli), White-backed Vulture (Gyps africanus), Egyptian Vulture (Neophron percnopterus), Lappet-faced Vulture (Torgos tracheliotos), Bateleur (Terathopius ecaudatus), Secretary Bird (Sagittarius serpentarius), Martial Eagle (Polemaetus bellicosus), Beaudouin’s Snake Eagle (Circaetus beaudouini), Red-footed Falcon (Falco vespertinus), and Scissor-tailed Kite (Chelictinia riocourii) (see Table S1 in Supplementary Materials) [17]. Many of these threatened raptors are exploited for traditional medicine, with their body parts frequently found in local markets [12,13,14]. This exploitation exacerbates population declines, emphasising the urgent need to understand their population dynamics and responses to anthropogenic pressures [9,17]. Also, an ethno-scientific approach that incorporates local community perceptions is essential for developing effective conservation strategies [14,15]. Thus, understanding community knowledge and the perception of their environment becomes vital to foster inclusivity and enhance conservation outcomes. It is, therefore, essential to understand the factors that influence people’s perceptions of raptors, as this knowledge will aid in comprehending the intricate relationship between human footprint, socio-economic dynamics, and perceptions regarding the persistence or decline of raptors [13,15]. This will help establish a more targeted approach to human behaviour that will not only help in the conservation of these threatened raptors but also foster inclusivity and coexistence with local communities [13,15].
Several studies have examined raptor distribution across Nigeria [3,6,18]. However, research on the influence of anthropogenic factors such as the Human Footprint Index, human attitudes, and perceptions on the distribution of threatened raptors remains limited. Nigeria, as a multicultural society with diverse perceptions of wildlife and areas comprising highly degraded habitats, is a suitable area to investigate these impacts. In this study, we aimed to evaluate the various anthropogenic factors influencing the distribution of threatened raptor species in Nigeria. Specifically, the objectives were to: (1) map the occurrence of threatened raptor species in Nigeria and identify pentads with high and low abundance; (2) visit selected pentads with high and low abundance to investigate human attitudes and perceptions towards threatened raptor species; (3) quantify the relative contribution of anthropogenic factors (Human Footprint Index (HFI), Human Population Index) to the distribution of threatened raptor species in Nigeria; and (4) investigate the importance of protected areas in conserving threatened raptor species. By addressing these objectives, the study contributes to the scientific understanding of attitudes and perceptions on the distribution of threatened raptors and provides critical insights to influence conservation efforts.

2. Materials and Methods

2.1. Study Area Description

The study was conducted in Nigeria based on the coverage of the Nigerian Bird Atlas Project (NiBAP) (Figure 1). Nigeria lies on latitude 9.0820° N and longitude 8.6753° E, covering 923,768 km2 of land with four distinct vegetation zones: rainforest, savanna (Guinea, Sahel, Sudan), mangrove, and desert [19,20]. About 25% of land in Nigeria is under cultivation and mining activities contributing to unquantified land degradation, while 40% of Nigeria’s forest landscape is still standing [21,22,23]. As of 2020, the Nigerian population was estimated at 200 million and projected to reach 440 million by 2050 [24,25]. Nigeria is a multicultural country with various ethnic groups and languages. The most dominant ethnic groups in the northeastern parts are the Hausa and Fulani.

2.2. Data Sources

2.2.1. Raptor Occurrence Data

This study used raptor occurrence records from all pentads retrieved from the Nigerian Bird Atlas Project (NiBAP) (https://nigeria.birdmap.africa/, accessed on 28 September 2024) dataset to map the variations in the distribution of threatened raptors in Nigeria. The NiBAP is a citizen science project where members of the public and nature enthusiasts (atlasers) collect data on the distribution and relative abundance of birds in an area following an established protocol using the mobile app BirdLasser [26]. The set protocol for atlasing is that an atlaser records birds seen or heard in a pentad (a grid cell covering 5’ × 5’ of latitude and longitude, which translates to a c. 9 km × 9 km area) and submits the records to the database [26]. To ensure data viability, all data entered in the database is vetted by the Regional Atlas Committee, and additional processes of contacting the atlaser are performed if further clarification is required [26]. The citizen science project provides valuable data and helps mitigate the lack of distributional data on Nigerian birds [26]. This data was used to map the occurrence of threatened raptors in Nigeria and identify pentads with high (hotspots) and low (cold spots) raptor abundance where questionnaires were administered.

2.2.2. Remote Sensing, Anthropogenic Layers, and Protected Areas

The Human Footprint Index (HFI) and Human Population Index (HPI) were obtained from NASA’s Socio-Economic Data and Applications Centre (https://www.earthdata.nasa.gov/centers/sedac-daac, accessed on 28 September 2024). The HFI combines 13 distinct stressors aligned with the IUCN Conservation Measures Partnership (CMP) Unified Classification of Direct Threats [27,28,29] (Supplementary S2 in Supplementary Materials). The HFI ranges from 0 to 1, with 0 meaning no disturbance and 1 meaning intense disturbance [30]. These indices were selected as relevant indicators of anthropogenic pressure based on their theoretical and empirical support in modelling species’ responses to human disturbance. The HFI captures cumulative impacts such as built infrastructure, agriculture, and accessibility, while the HPI serves as a proxy for direct human presence and associated threats such as persecution, habitat encroachment, and land-use change [31,32]. Raptors, particularly threatened or large-bodied species, are known to decline along gradients of increasing human impact, making these metrics ecologically meaningful predictors of reporting rates [33,34]. Protected areas within Nigeria were sourced from the World Database on Protected Areas (WDPA) [35]. Although we obtained the original HFI and population density dataset at a 1 km spatial resolution, we resampled to a pentad scale (9 km × 9 km resolution) across Nigeria to match the bird data resolution.

2.2.3. Survey Data: Socio-cultural Questionnaires

A semi-structured questionnaire was used to interview individuals of hunting age (14–60+) [12,36]. The baseline age of 14 was selected based on local socio-cultural norms where individuals typically begin hunting in their early teens, ensuring ethical and contextually appropriate engagement. The questionnaire was divided into section one, focused on the respondent’s demographic information, such as their age, religion, occupation, gender, and income, and section two sought to get the respondents’ knowledge, attitudes, and perceptions toward raptors. Respondents were asked to identify any familiar raptors from the 13 endangered species found in Nigeria, provided in the pictures (see Sample Questionnaire in Supplementary Materials S1 for details of the questionnaire).
A total of 318 respondents were interviewed. The surveys were conducted face-to-face between December 2024 and January 2025 at varying times of the day (morning and evening), helping to cover broad segments of society with different demographic characteristics [37]. This period coincides with the dry season in Nigeria, when field access is logistically feasible and community members are generally more available for interviews. While we acknowledge that seasonal factors may influence raptor visibility and local perceptions, the dry season also enhances detectability and recollection of raptor presence due to reduced vegetation cover and increased raptor activity. This timing is consistent with other ecological and socio-environmental studies conducted during the dry season across Nigeria and West Africa, where conditions facilitate both wildlife surveys and community engagement [36,38], and allowed for robust, contextually relevant data collection.
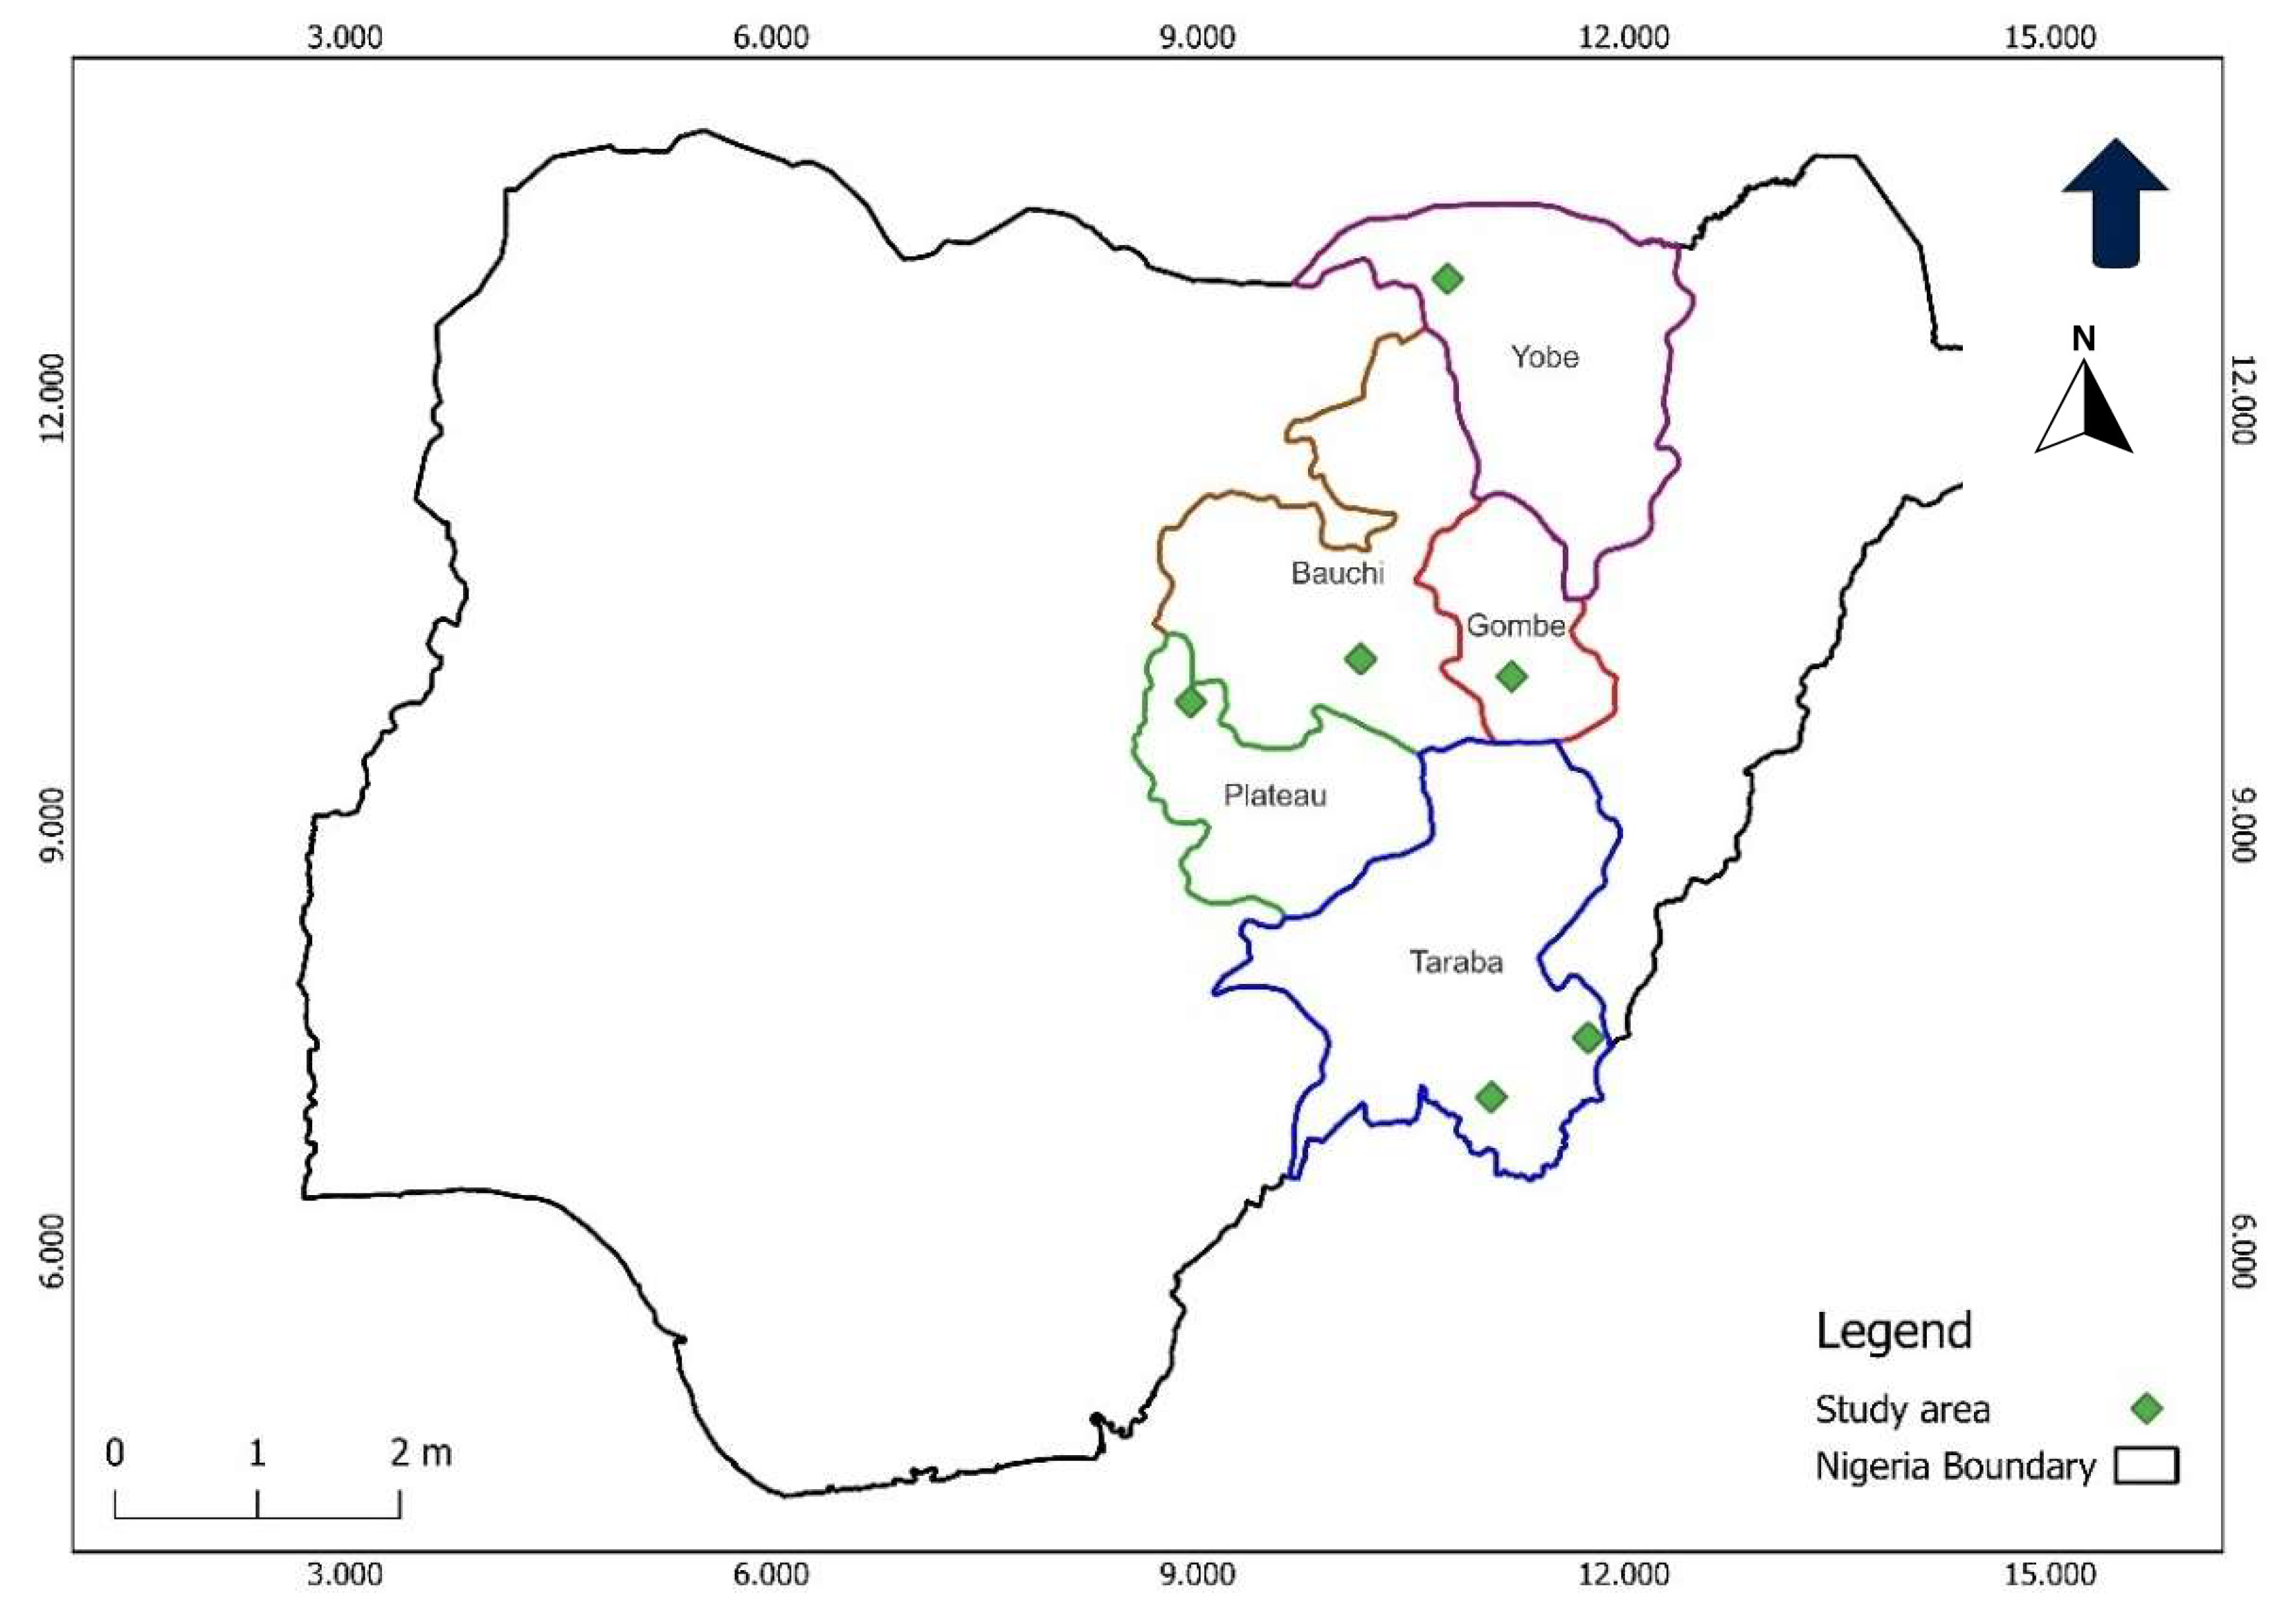
The choice of study areas was based on the distribution of threatened raptors in Nigeria, an output from a hotspot analysis carried out using the raptor occurrence data retrieved from NiBAP. Areas with high raptor abundance were classified as hotspots, and those with low raptor abundance as cold spots. The distributions of threatened raptors in Nigeria mainly fall in the northeastern parts of the country and share a similar vegetation zone. Therefore, field surveys were carried out in five states in the northeast of Nigeria: Yobe, Plateau, Bauchi, Taraba, and Gombe (Figure 2).
Participants were approached and asked if they consented to being interviewed. Local community field guides were utilised during the questionnaire survey to translate the questionnaire into the respondents’ local dialects for those who did not understand English. They were also useful in gaining community trust and advising on safe places to administer the questionnaire. The KoboCollect toolbox (https://ee.kobotoolbox.org/x/f7xaB8U6, 1 November 2024) was used to enter all questionnaire responses during the survey period, allowing for standardised and comparable data and reducing the time spent on data entry [39].

2.3. Model Fitting and Performance

Hotspot Analysis of Threatened Raptors

From the raptor occurrence data, the number of individual species was counted to give the species abundance of each pentad per year. Reporting rates were used as a proxy for abundance, that is, the number of times a species was recorded in a pentad (abundance) divided by the number of submitted cards in that pentad [40]. In addition, to account for effort, all pentads with fewer than 4 cards submitted were excluded from the analysis [40]. While RR is widely used in atlas-based studies as an index of relative abundance, we acknowledge that it is influenced by detection probability, species-specific visibility, and observer activity, which may introduce discrepancies between RR and true abundance [41,42]. However, our application of effort thresholds, standardised spatial units (pentads), and extensive geographic coverage help mitigate potential biases associated with using reporting rates (RR), thereby enabling RR to serve as a practical and ecologically meaningful proxy for spatial distribution patterns in raptors [40].
Abundance was used to produce a distribution map using spatial hotspot analysis in ArcGIS Pro (Version 3.4). Getis–Ord Gi* statistics were applied to identify threatened raptor hotspot areas with high clustering and cold spots areas with low clustering, with calculated statistical significance of clusters relative to a random distribution [43]. This method calculates z-scores and p-values to determine whether features with high or low values cluster spatially [44]. A fixed distance band method was applied to define the spatial weight matrix, using a threshold distance of 10 km. This threshold was determined based on the spatial resolution of our analysis grid (9 km), following the methodological guidance of Kwan (2012) [45].

2.4. Statistical Analysis

2.4.1. Anthropogenic Pressures and Protected Areas

To investigate the influence of anthropogenic pressures on threatened raptors’ reporting rates, we modelled the relationship between the reporting rate (RR) and two key predictors: the Human Footprint Index and population density. We fitted a generalised linear model (GLM) with a quasi-Poisson distribution to account for overdispersion in the count data [46,47]. To correct for variation in observer effort, the logarithm of the number of cards submitted (log(card_count)) was included as an offset in the model [48]. We standardised all variables to aid model convergence and interpretation. Prior to analysis, we tested for multicollinearity between the HFI and HPI using variance inflation factors (VIFs), and no problematic collinearity was detected (VIF < 2).
To further evaluate the importance of the protected area network on the occurrence of threatened raptors, we compiled a spatial dataset of the threatened raptor records within each pentad. Pentads were georeferenced within 9 km × 9 km. We used the st_intersection function within the sf package in R [46] to establish an overlap between pentads and protected areas. Pentads that had over 70% of their area (approximately 60 Km2) within a protected area were classified as inside protected areas (IPAs). To address the limitation that a pentad could be between a PA and outside a protected area, potentially weakening the ecological protection conferred, we classified pentads within this category as partial (PPAs) and those without any intersection were categorized as outside (OPAs). This approach aligns with edge effects and partial protection as significant modifiers of biodiversity outcomes [49,50]. Consequently, to account for overdispersion in the count data, we fitted a quasi-Poisson GLM to model the relationship between threatened raptor species reporting rates and the level of PA coverage [47]. We used log(card_count) as an offset in the model to account for differences in observation effort across points [48].

2.4.2. Socio-cultural Data Analysis

Sentiment analysis (natural language processing approach)
Perceptions and attitudes were quantified from the questionnaire data using sentiment analysis. In the study, we defined perception as a view, feeling, opinion, or consciousness of something based on past experiences or knowledge [15,51]. In contrast, attitude is a behaviour based on a feeling or opinion [51]. For this study, a negative perception is defined as negative ideas or misconceptions about raptors (evil, scary, not important, chicken thieves), and a negative attitude is undesirable action against raptors like persecution, destruction of nests, or consumption.
Sentiment analysis is a language processing tool used to assess people’s emotions. It involves identifying subjective information in their responses, such as opinions and emotions, using methods like lexicon-based models [52,53]. Questions used to determine perception include “how they view raptors”, “if they believe raptors are mystical and suited for black magic”, and “whether they think raptors are scary or wise birds”. For attitudes, questions that were used were whether respondents “think raptors should be conserved” and if they know “the importance of raptors and any threats towards raptors”.
In this analysis, a customised lexicon of negative, positive, and neutral phrases was generated using the responses from the questionnaire. Respondents agreeing that raptors are scary, a symbol of death, mystical, and suitable for black magic were regarded as having a negative perception. The use of raptors in traditional medicine or consuming them was also regarded as a negative attitude. All matches were counted and used to calculate overall perception and attitude sentiment scores for each respondent. Each negative match contributed a value of −1, whereas each positive match contributed a value of +1. To get an overall sentiment score for each respondent, if the number of positive matches was greater than the number of negative matches, then the overall sentiment score will be positive and vice versa for negative matches. In the case when the numbers of negative matches and positive matches were equal, the sentiment score was 0 and was recorded as ambivalent.
Latent Class Analysis (LCA)
To improve the understanding of patterns surrounding human perceptions and attitudes toward raptors, a latent class analysis (LCA) was used to aggregate respondents into 2 clusters based on socio-demographic and raptor-knowledge-related variables using the “MixAll” package in R [37,46,54,55]. Socio-demographic-related (gender, religion, income, education, age, occupation, tribe, pentad) questions and threatened raptor knowledge questions (which raptor do you know, how often do you see it) were used as indicator variables incorporated in the LCA to identify different clusters. The “MixAll” package can only run for 2 or more classes, therefore, models of up to 6 classes were run. The best model was chosen based on the Bayesian information criterion (BIC) value (Table 1) [37]. The LCA produces a categorical variable called a cluster, which was used in further analysis. The distribution of respondents and their characteristics was explored in each cluster to determine how this can potentially explain people’s perceptions and attitudes towards raptors.
To investigate the relationship between perception, attitudes, and clusters from the LCA, an ordered probit analysis was performed using the “ordinal” package and probit link in R [46] because these variables are ordered categories [37]. A full model with interaction terms with the clusters was introduced to the model to check for potential interactions between perceptions, attitudes, and clusters.

3. Results

A total of 11 threatened raptor species out of 13 threatened raptor species found in Nigeria were recorded across the various protected status categories. Four of the species are listed as Vulnerable (Aquila rapax, Chelictinia riocourii, Circaetus beaudouini, and Falco vespertinus); another 4 as Endangered (Neophron percnopterus, Polemaetus bellicosus, Sagittarius serpentarius, and Terathopius ecaudatus); and 3 as Critically Endangered (Gyps rueppelli, Necrosyrtes monachus, and Trigonoceps occipitalis).
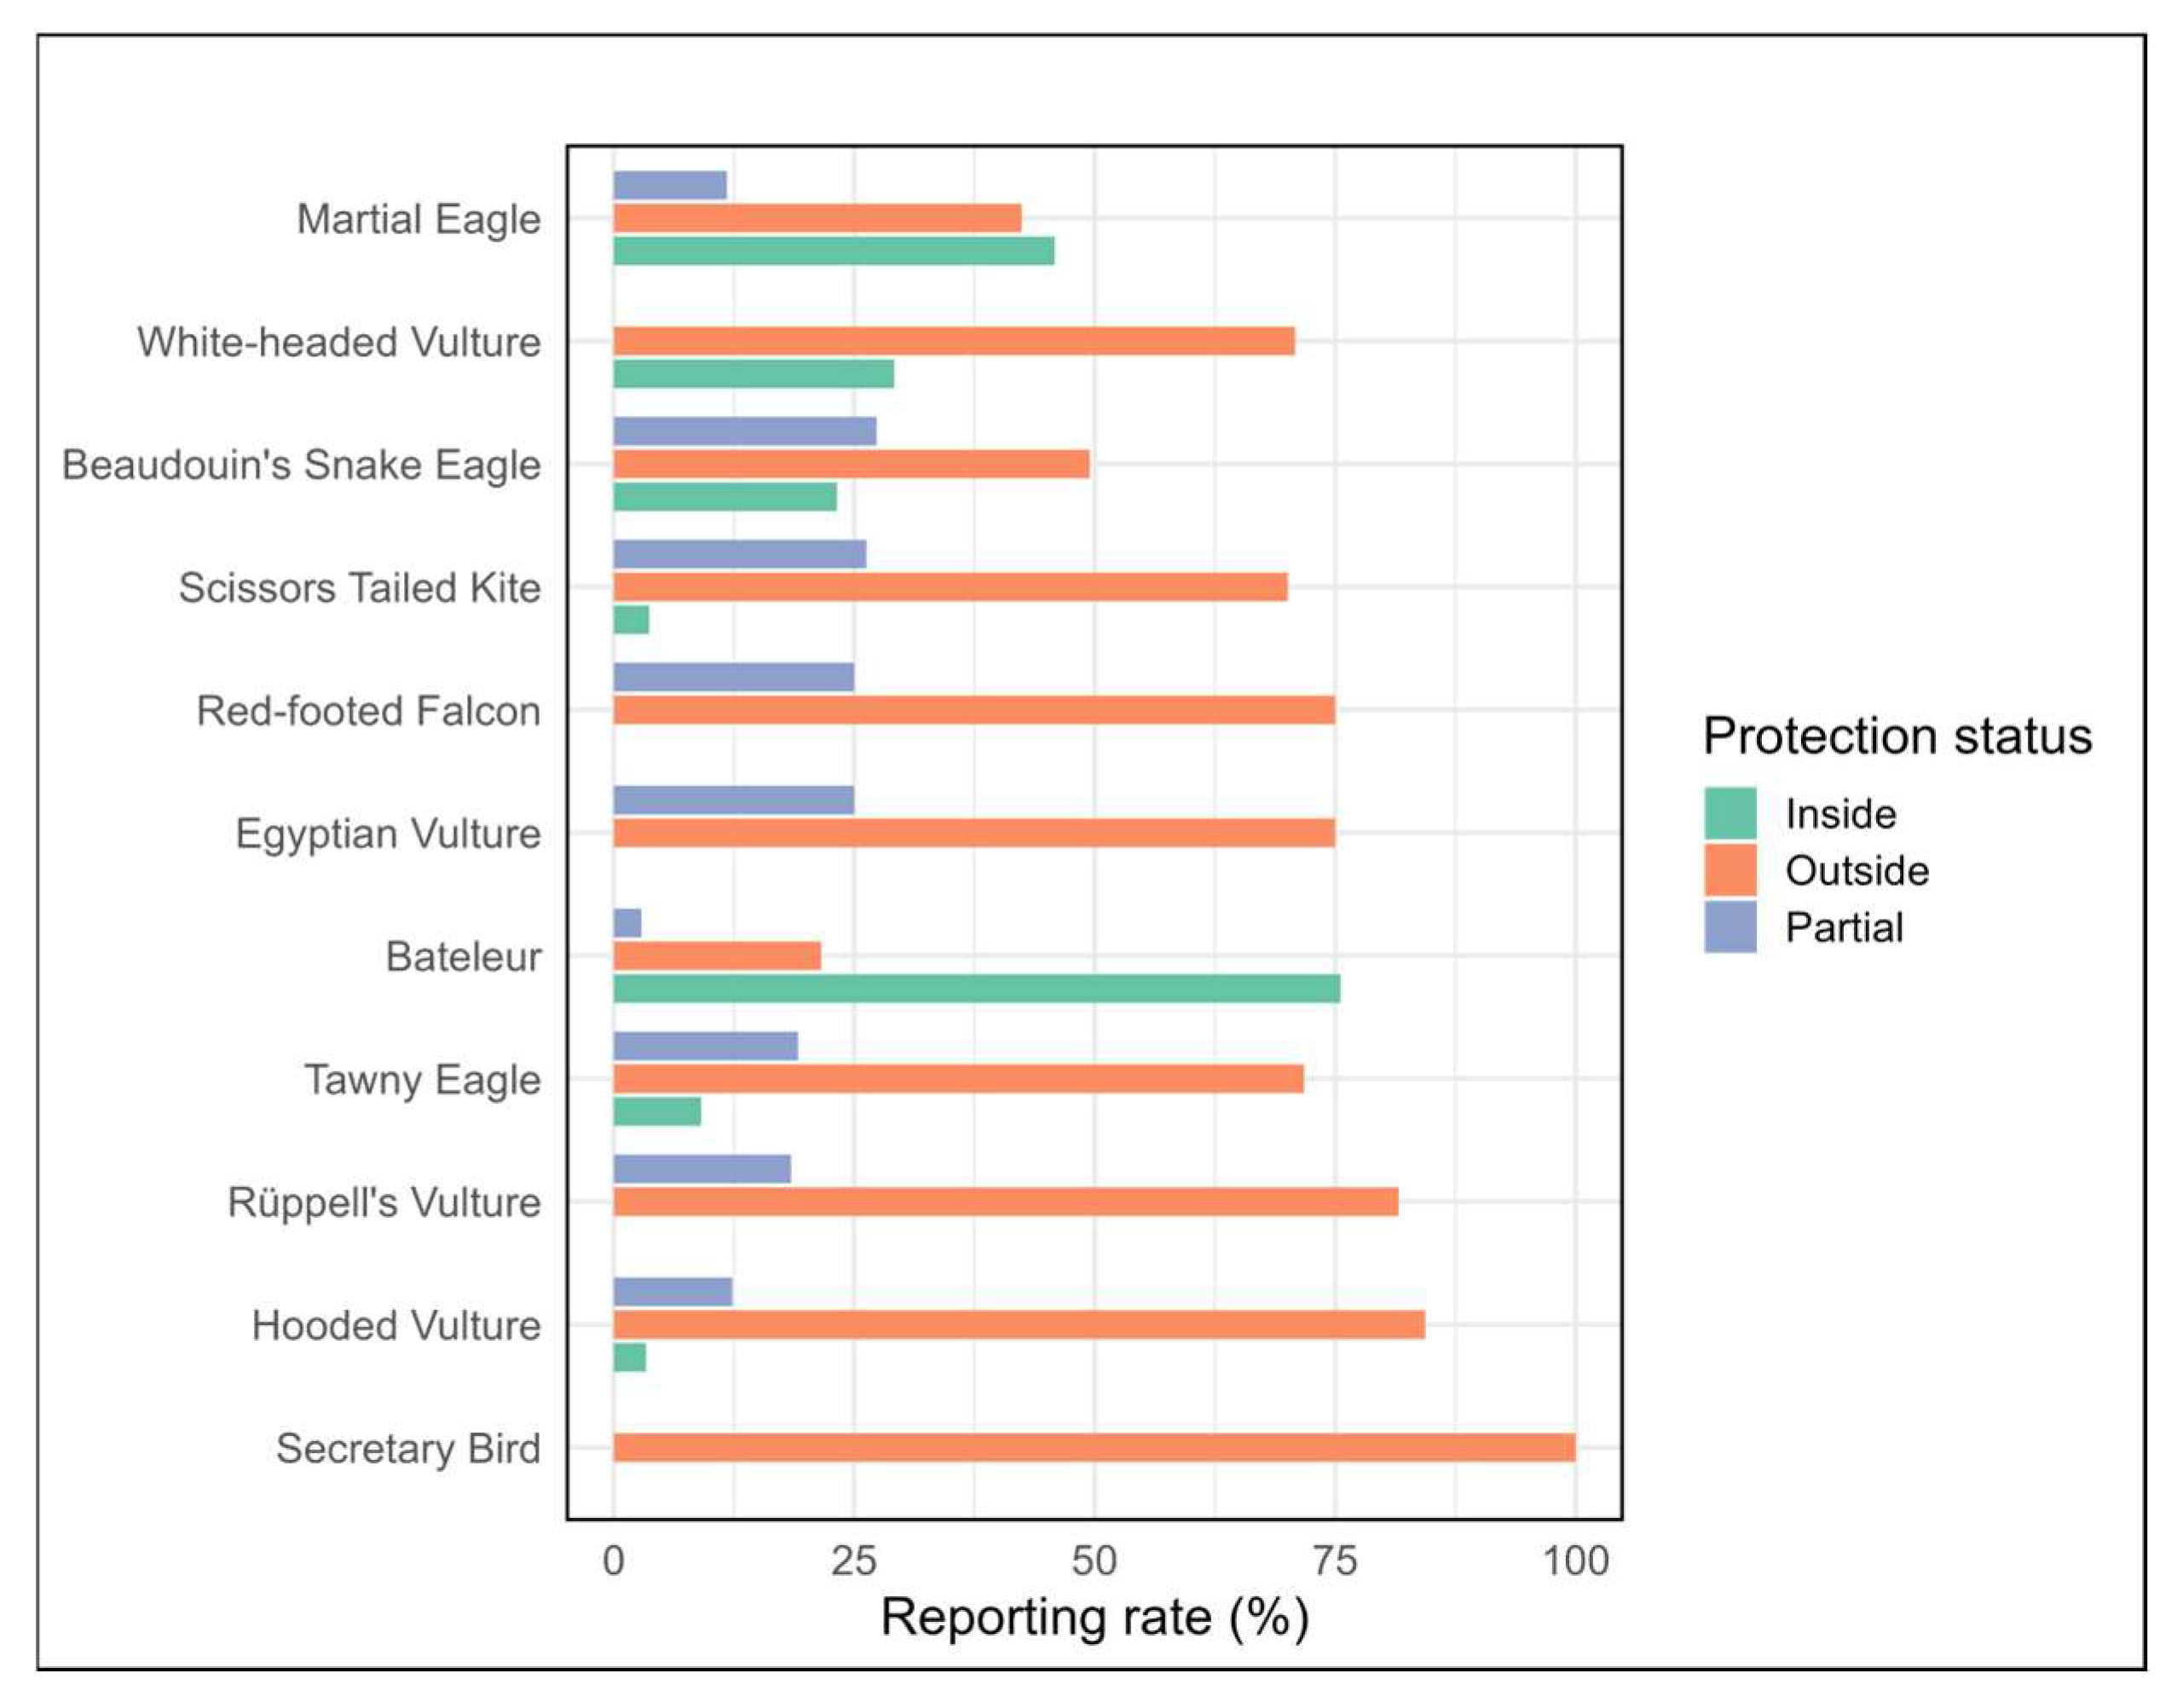
Notable variation was observed in relative percentage reporting rates among protected area categories, classified as inside, outside, and partially inside protected areas (Figure 3). Overall, the majority of detections for most species occurred outside protected areas. For instance, the Hooded Vulture (Necrosyrtes monachus), Secretary Bird (Sagittarius serpentarius), and Rüppell’s Vulture (Gyps rueppelli) had over 80% of detections recorded outside protected boundaries. In contrast, only a few species showed higher proportions of activity within protected zones; notably, the Bateleur (Terathopius ecaudatus) had the highest proportion inside PAs (75.6%), followed by the Martial Eagle (Polemaetus bellicosus) (45.8%) and White-headed Vulture (Trigonoceps occipitalis) (29.2%). See Figure 3 and Supplementary S3 in Supplementary Materials.

3.1. Distribution of Threatened Raptors

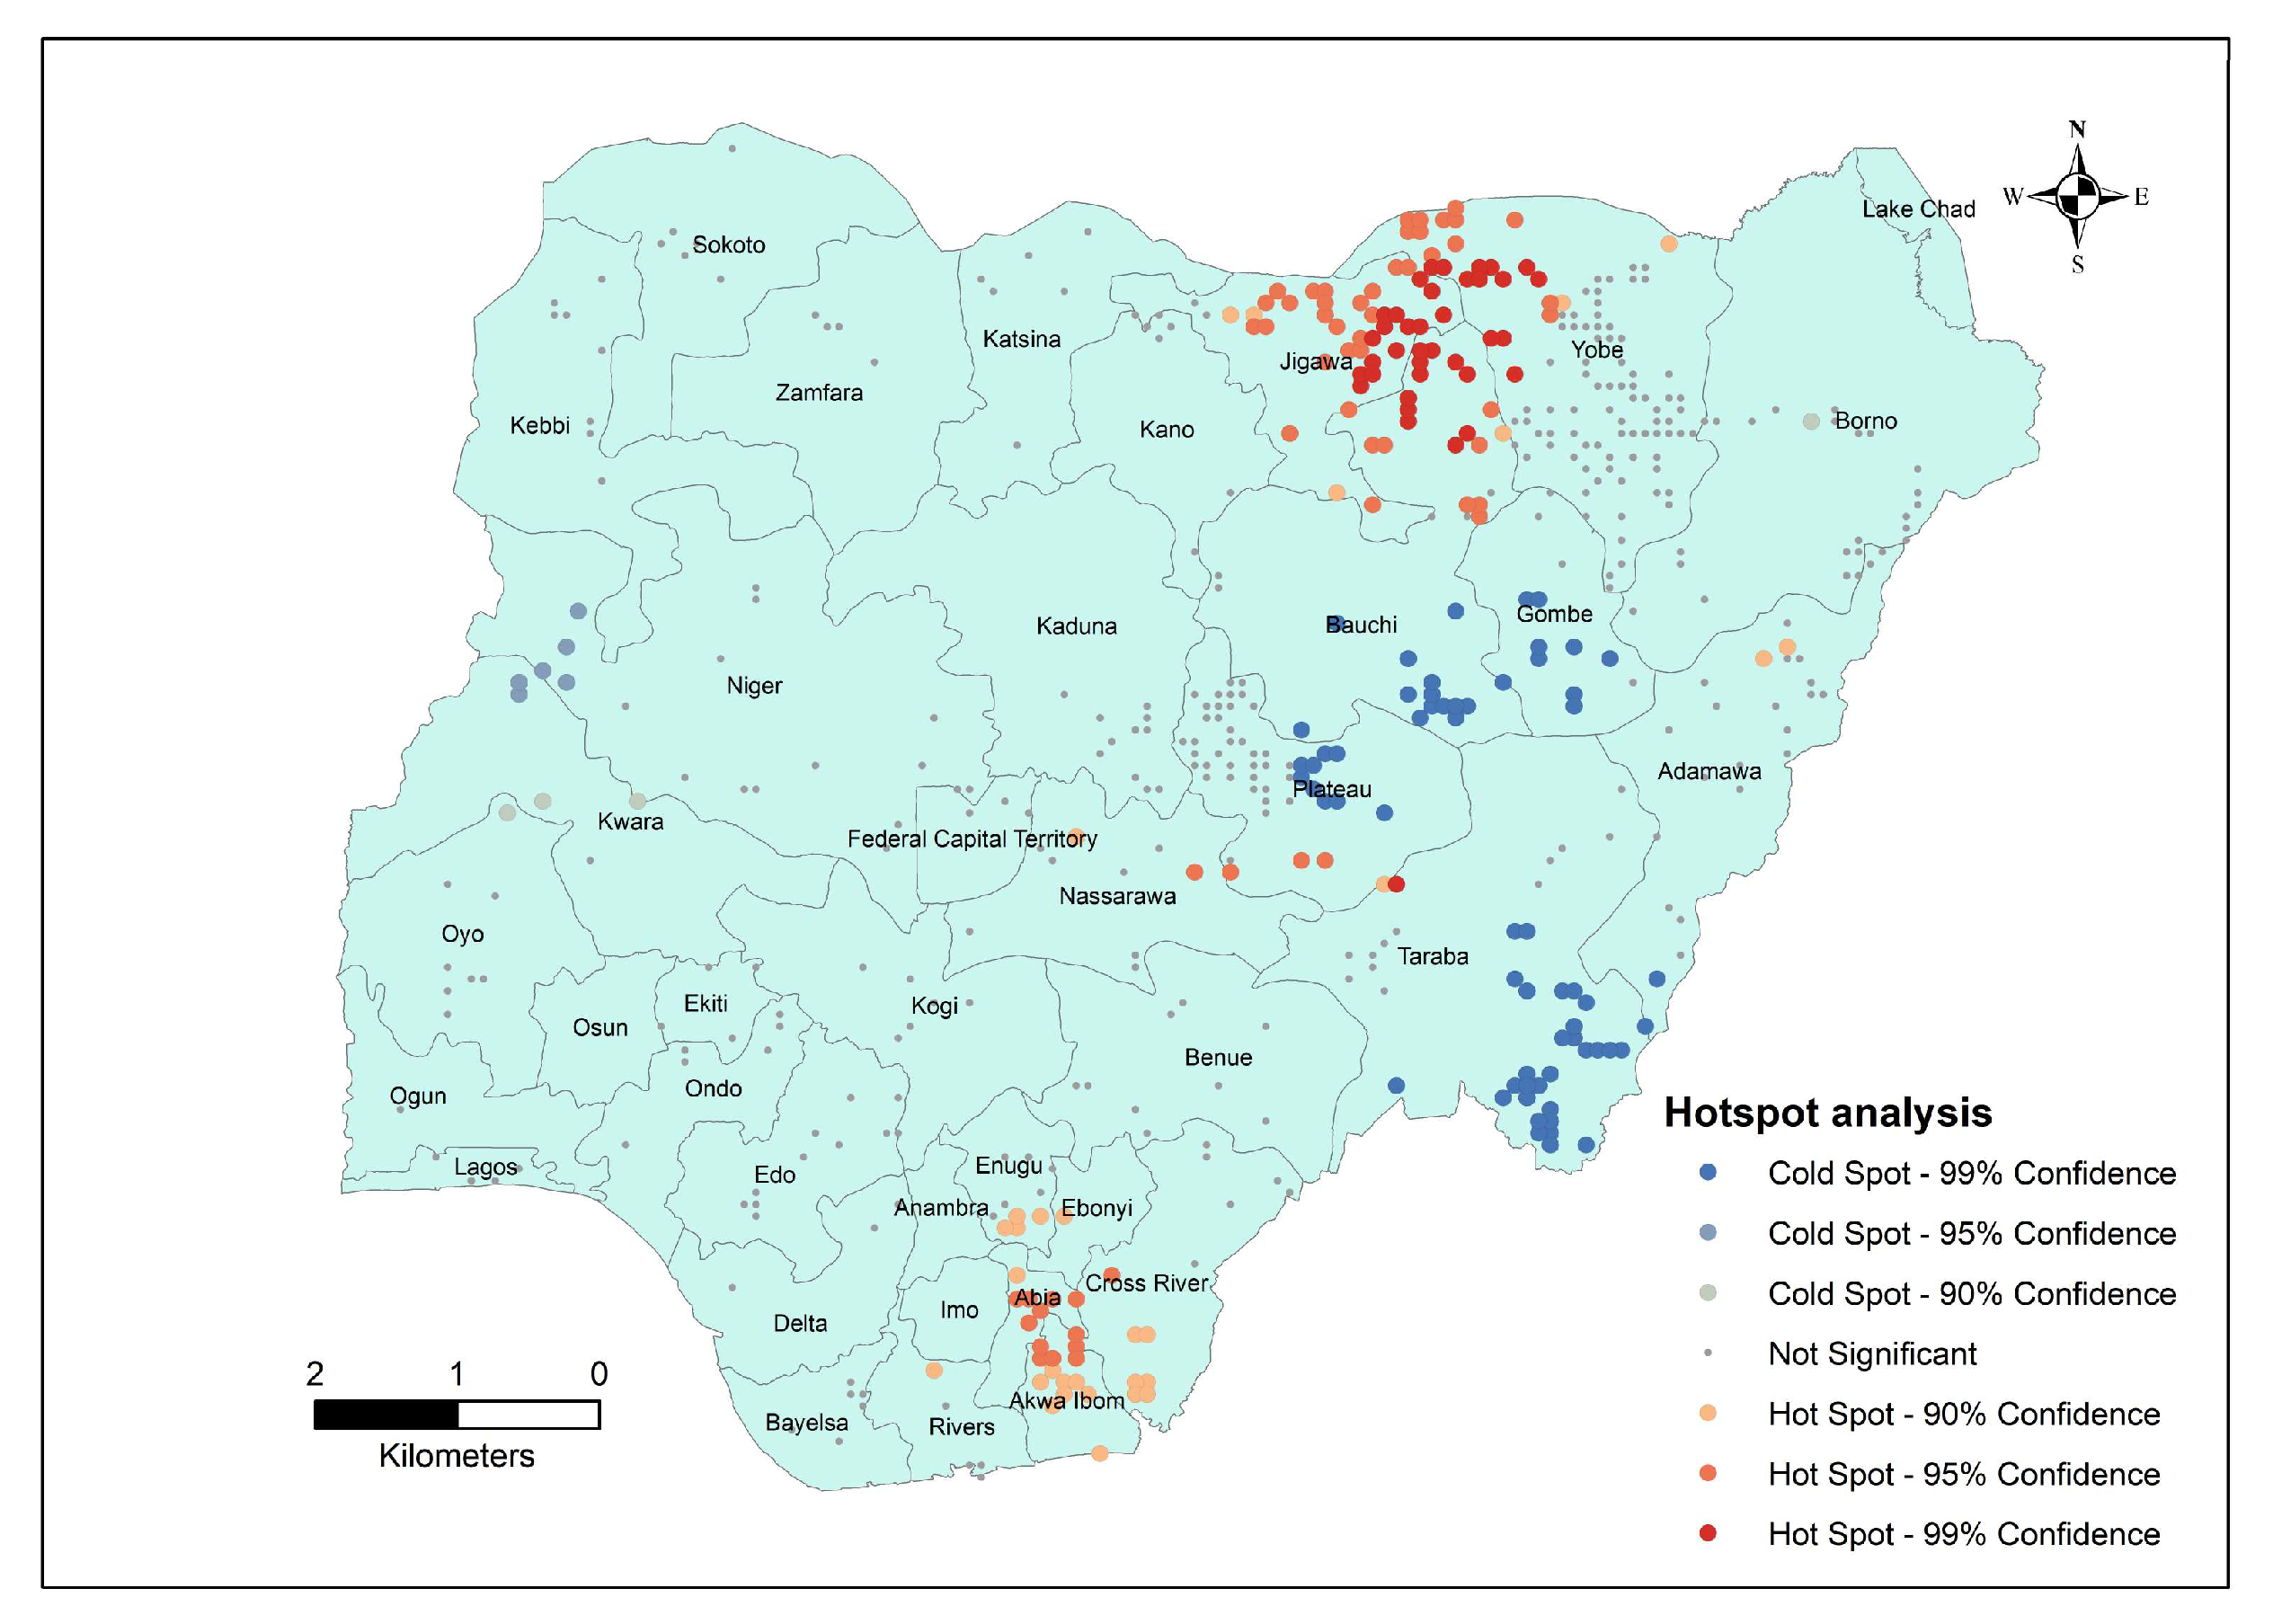
The Getis–Ord Gi* analysis revealed significant spatial clustering of raptors across Nigeria (Figure 4). Hotspots, areas with statistically high values, were predominantly located in Jigawa, northern Bauchi, and Yobe states. Cold spots, areas with statistically low values, were concentrated in southern Bauchi, Gombe, Plateau, and Taraba states (Figure 4).

3.2. Impact of Anthropogenic Variables

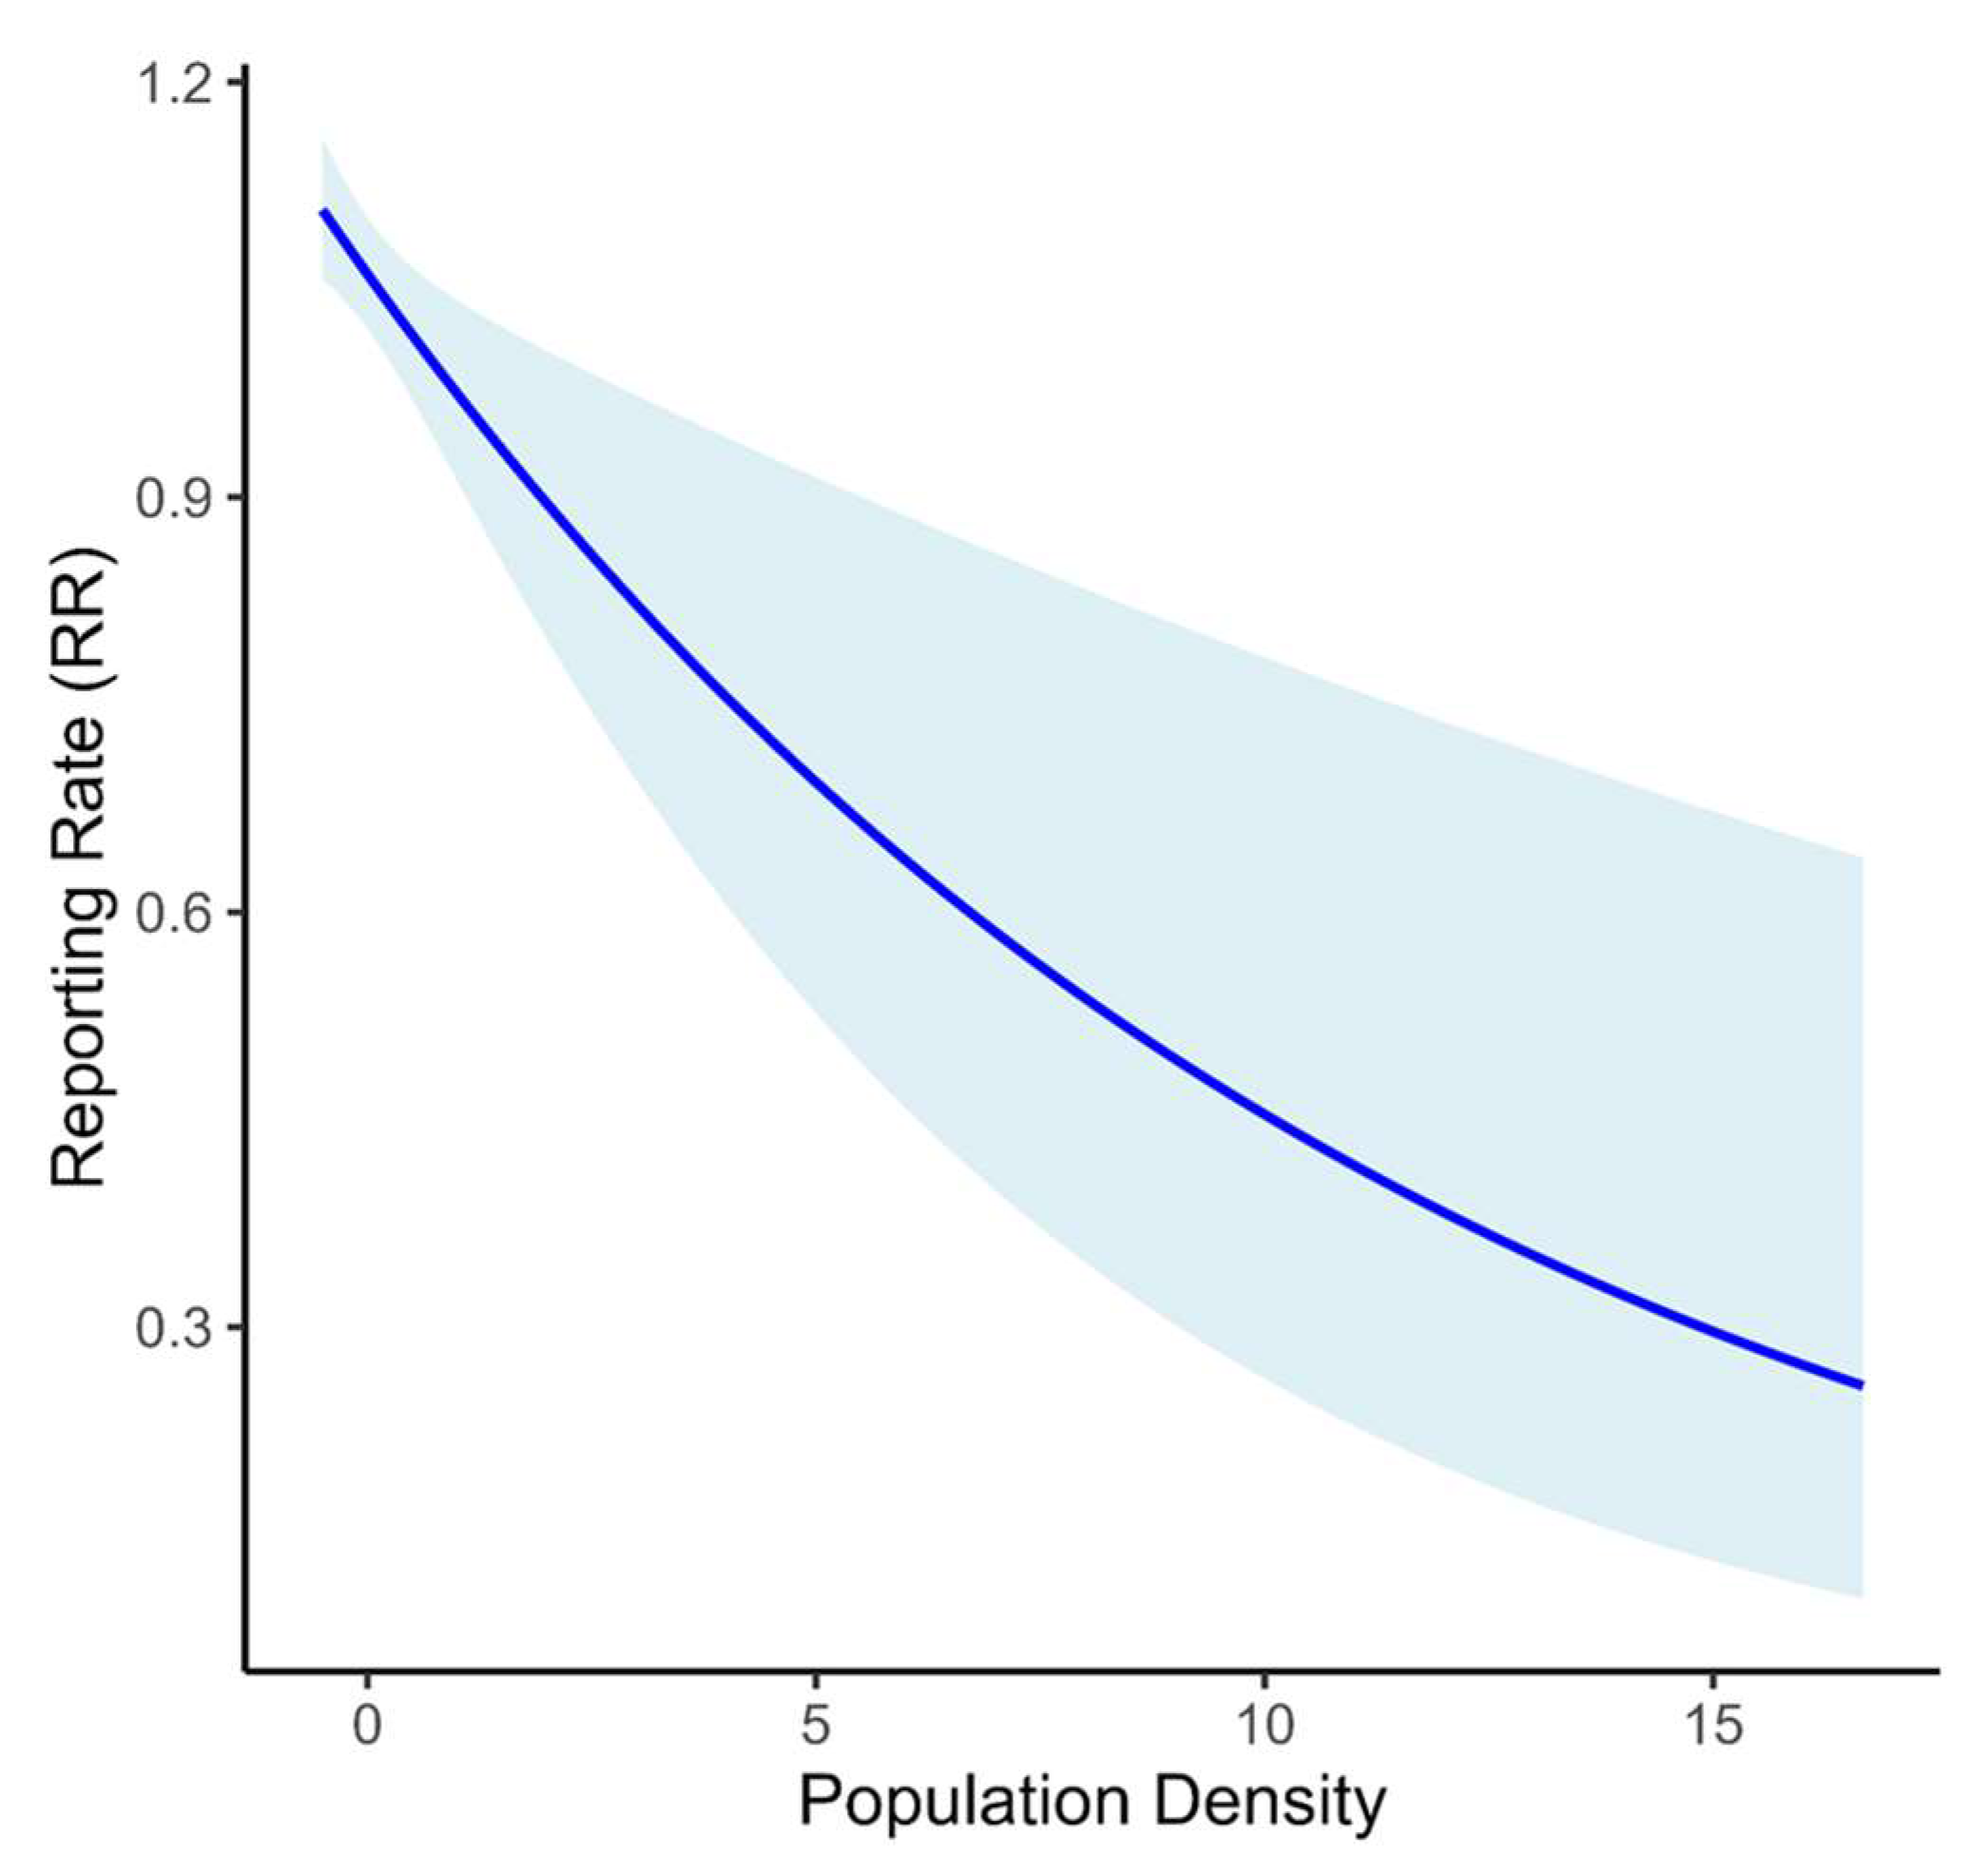
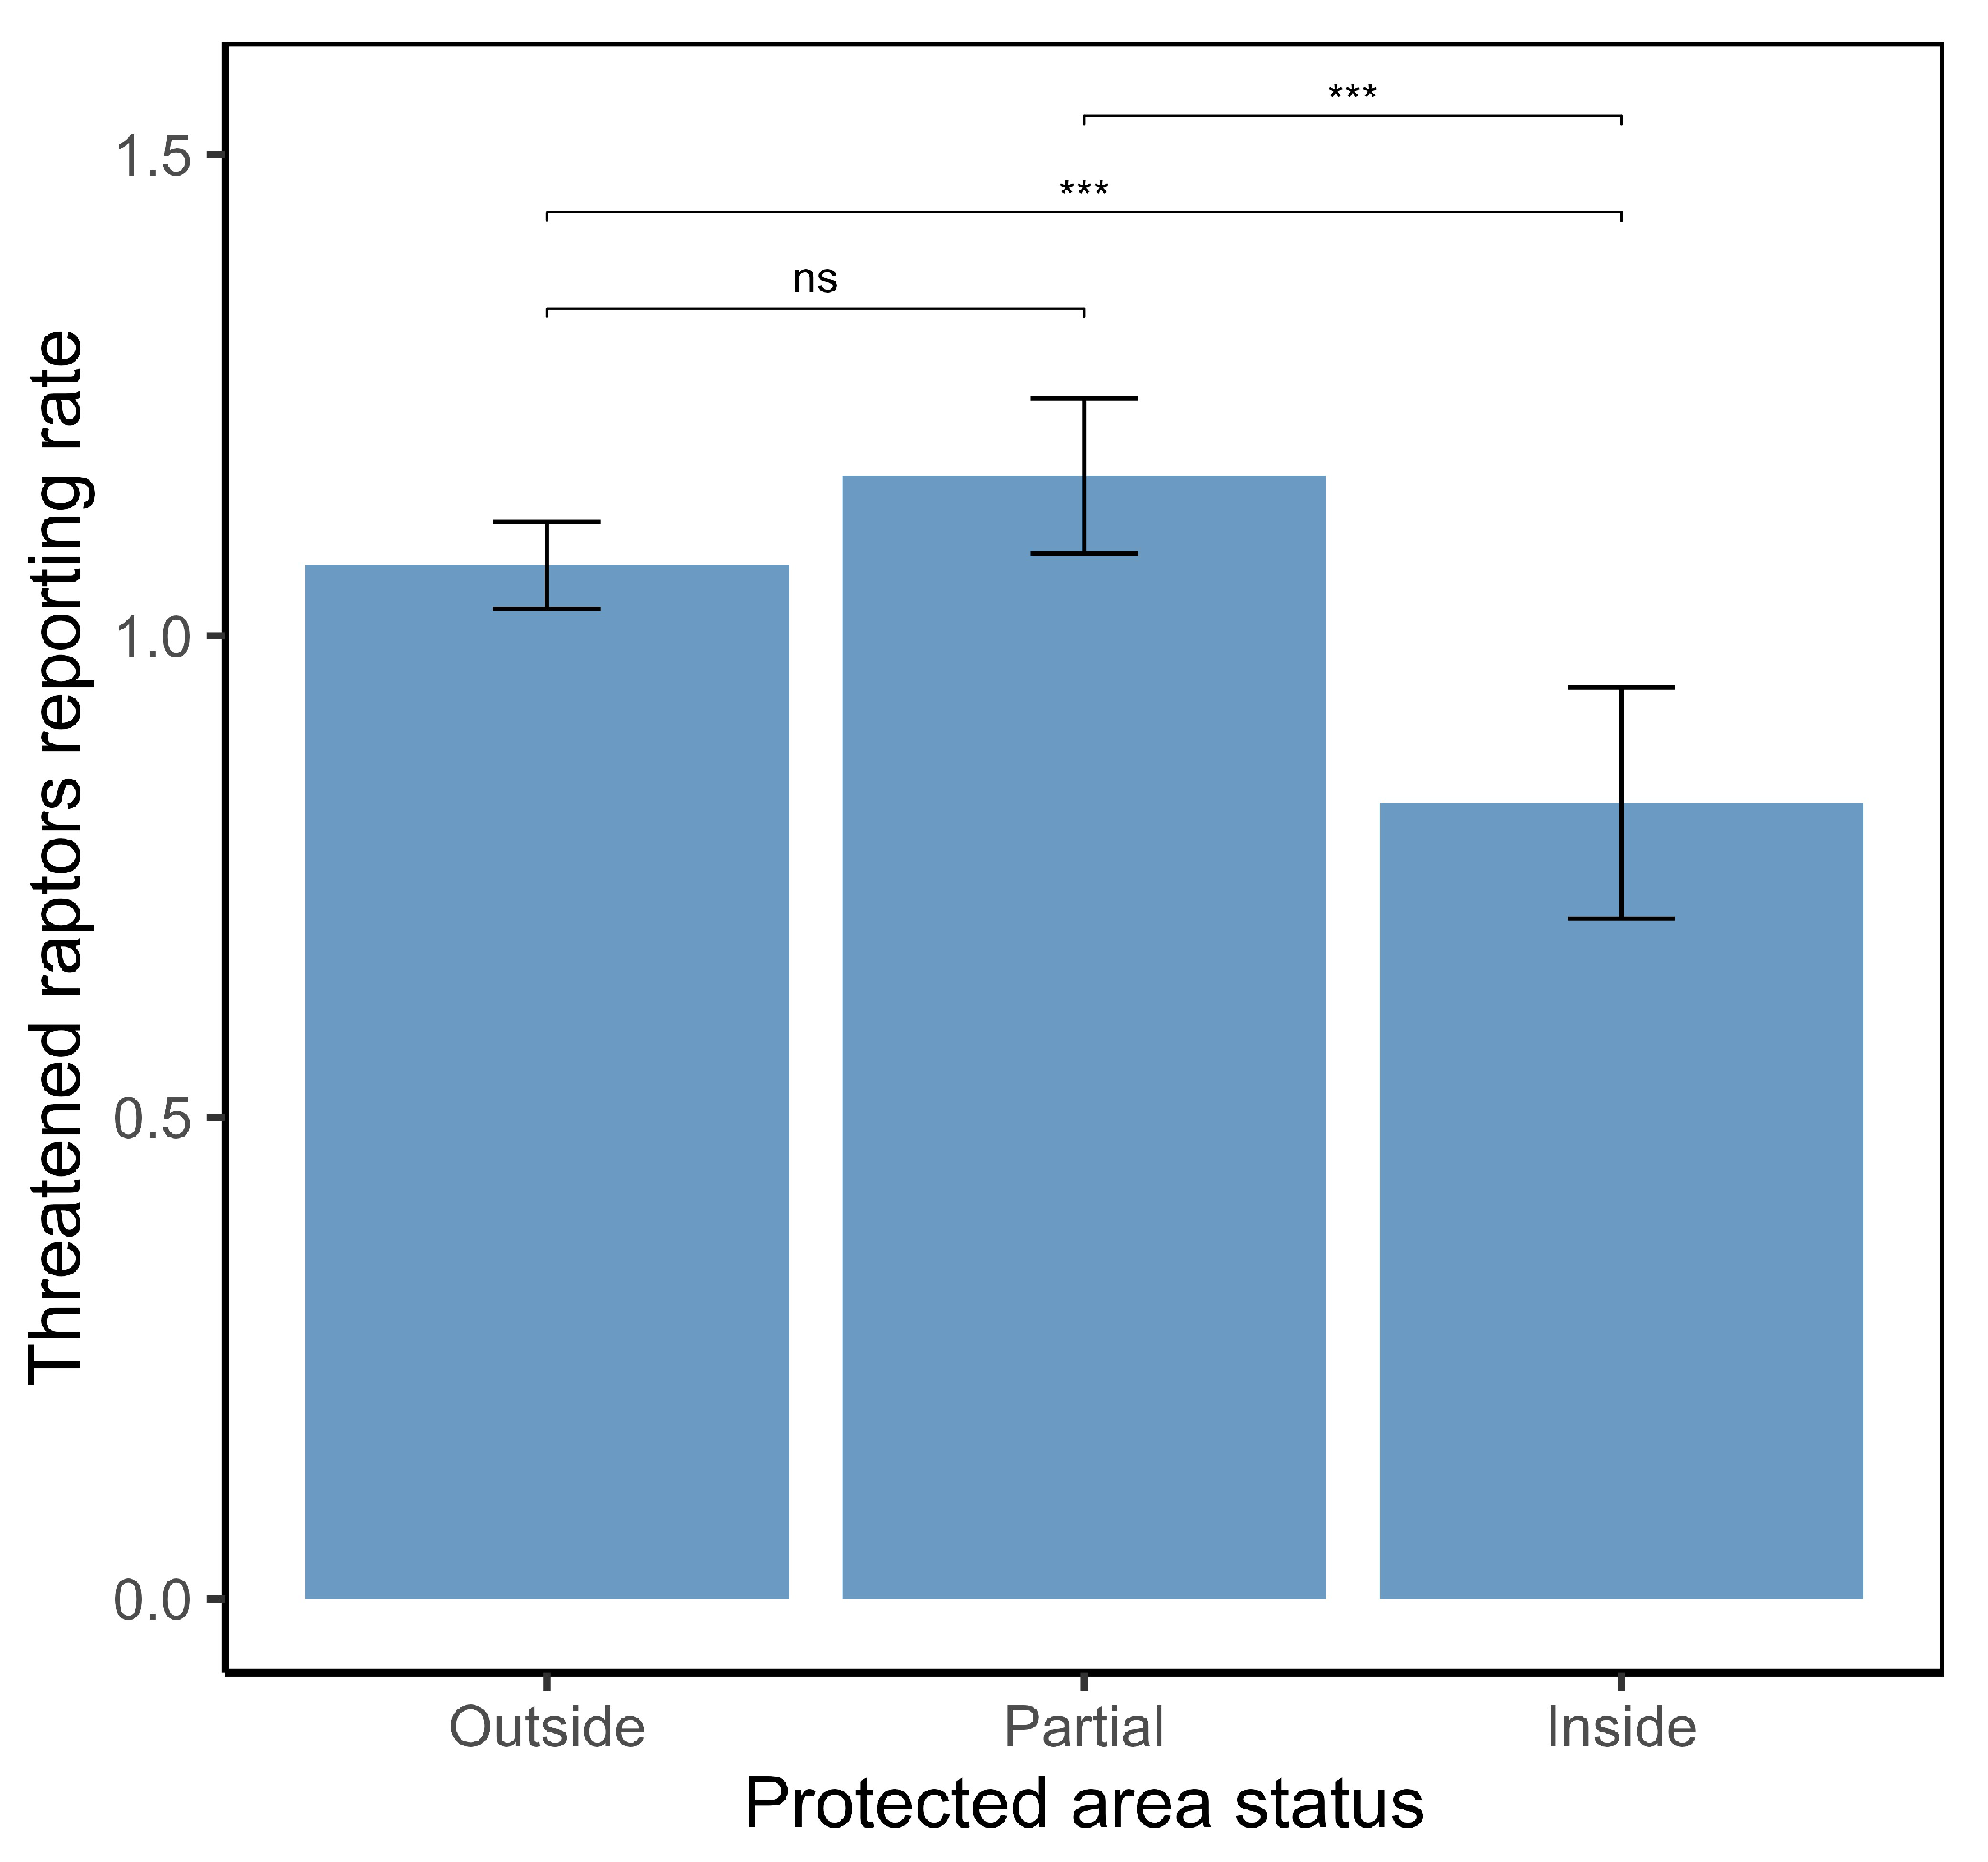
The model revealed a significant negative relationship between population density and reporting rates of threatened raptors (Estimate = −0.085, SE = 0.028, t = −3.056, p = 0.002), indicating that, as human population density increases, species are less frequently reported (Figure 5). Also, reporting rates varied significantly across protection area status (χ2 = 23.56, df = 2, p < 0.001). The Tukey HSD post hoc analysis revealed significant differences between IPAs and PPAs (z = 4.68, p < 0.001) and OPAs and IPAs (z = 3.99, p < 0.001) but no significant difference in the reporting rates of threatened raptors between OPAs and PPAs (z = −1.77, p = 0.18) (Figure 6). Notably, the reporting rate in IPAs was 0.74 (mean, 95% CI: 0.65–0.83), that of OPAs was 0.96 (mean, 95% CI: 0.91–1.00), and that of PPAs was 1.04 (mean, 95% CI: 0.96–1.13) (Figure 6).

3.3. Description of the Respondents

A total of 318 questionnaires were administered to respondents from the ages of 14 to 60 and above, with 83% males and 17% females. In terms of education levels, 37% finished secondary school whereas about 15% had no education background. Respondents with an income of NGN 60,001–100,000 per month constituted 35% of the sample. Regarding occupation, 46% of the respondents were farmers, and other occupations accounted for about 23% (Table 2).

3.3.1. Sentiment Analysis: Perceptions and Attitudes Towards Raptors

Sentiment analysis revealed that the majority of respondents (n = 178) held negative perceptions of raptors, while 107 expressed positive perceptions and 33 were ambivalent. Similarly, attitudes toward raptors were predominantly negative (n = 141), followed by positive attitudes (n = 122) and ambivalent attitudes (n = 55). Overall, the findings indicate that negative perceptions and attitudes toward raptors were more prevalent among respondents (Figure 7A,B).

3.3.2. Latent Class Analysis: Perception Classes

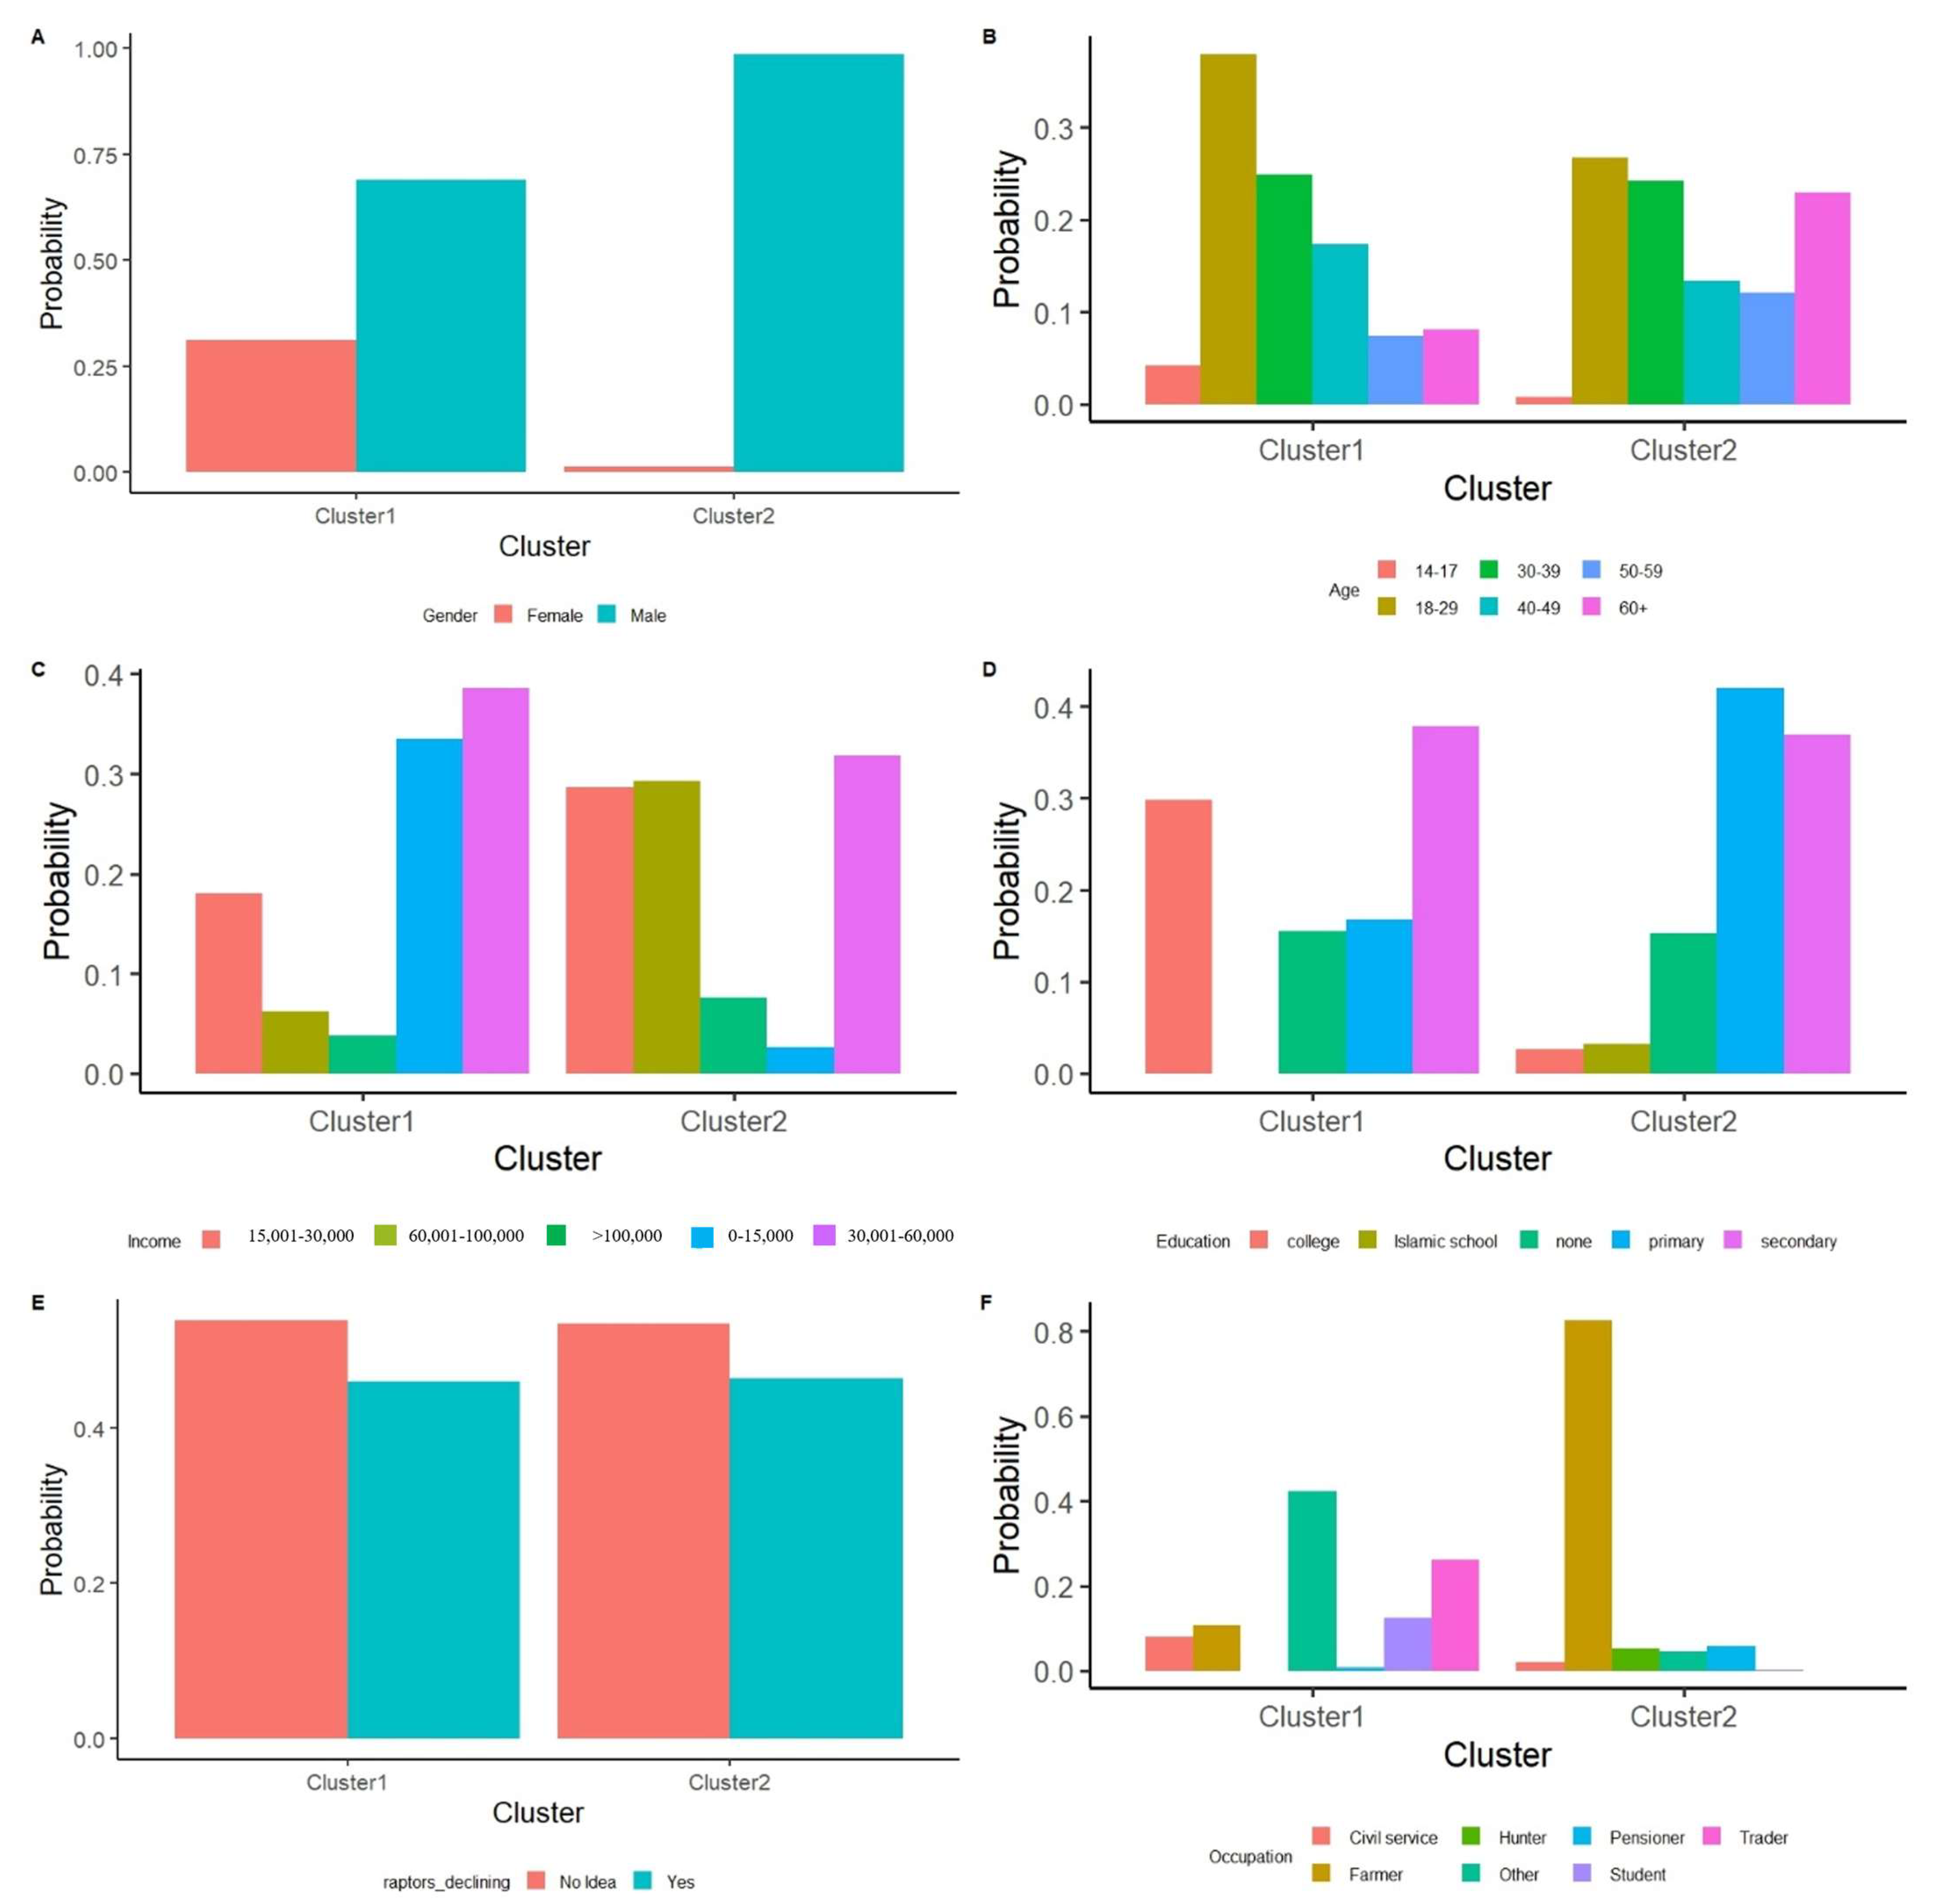
The latent class analysis (LCA) grouped respondents into two distinct clusters based on their knowledge of raptors: Cluster 1 (n = 156) and Cluster 2 (n = 162). Cluster 1 comprised a mixed group of males and females, whereas Cluster 2 was predominantly male (Figure 8A). Age distribution varied between clusters, with Cluster 1 primarily consisting of younger respondents (18–29 years), while Cluster 2 included a broader age range, including older individuals (Figure 8B). Socio-economic differences were also evident, as lower-income respondents dominated Cluster 1, whereas higher-income respondents were more prevalent in Cluster 2 (Figure 8C). Education levels also varied between clusters. Cluster 1 was largely composed of individuals with college and secondary school education, while Cluster 2 was dominated by respondents with primary and secondary education (Figure 8D). Occupational differences were notable, with Cluster 1 comprising a mix of professions, whereas Cluster 2 was primarily made up of farmers (Figure 8F).
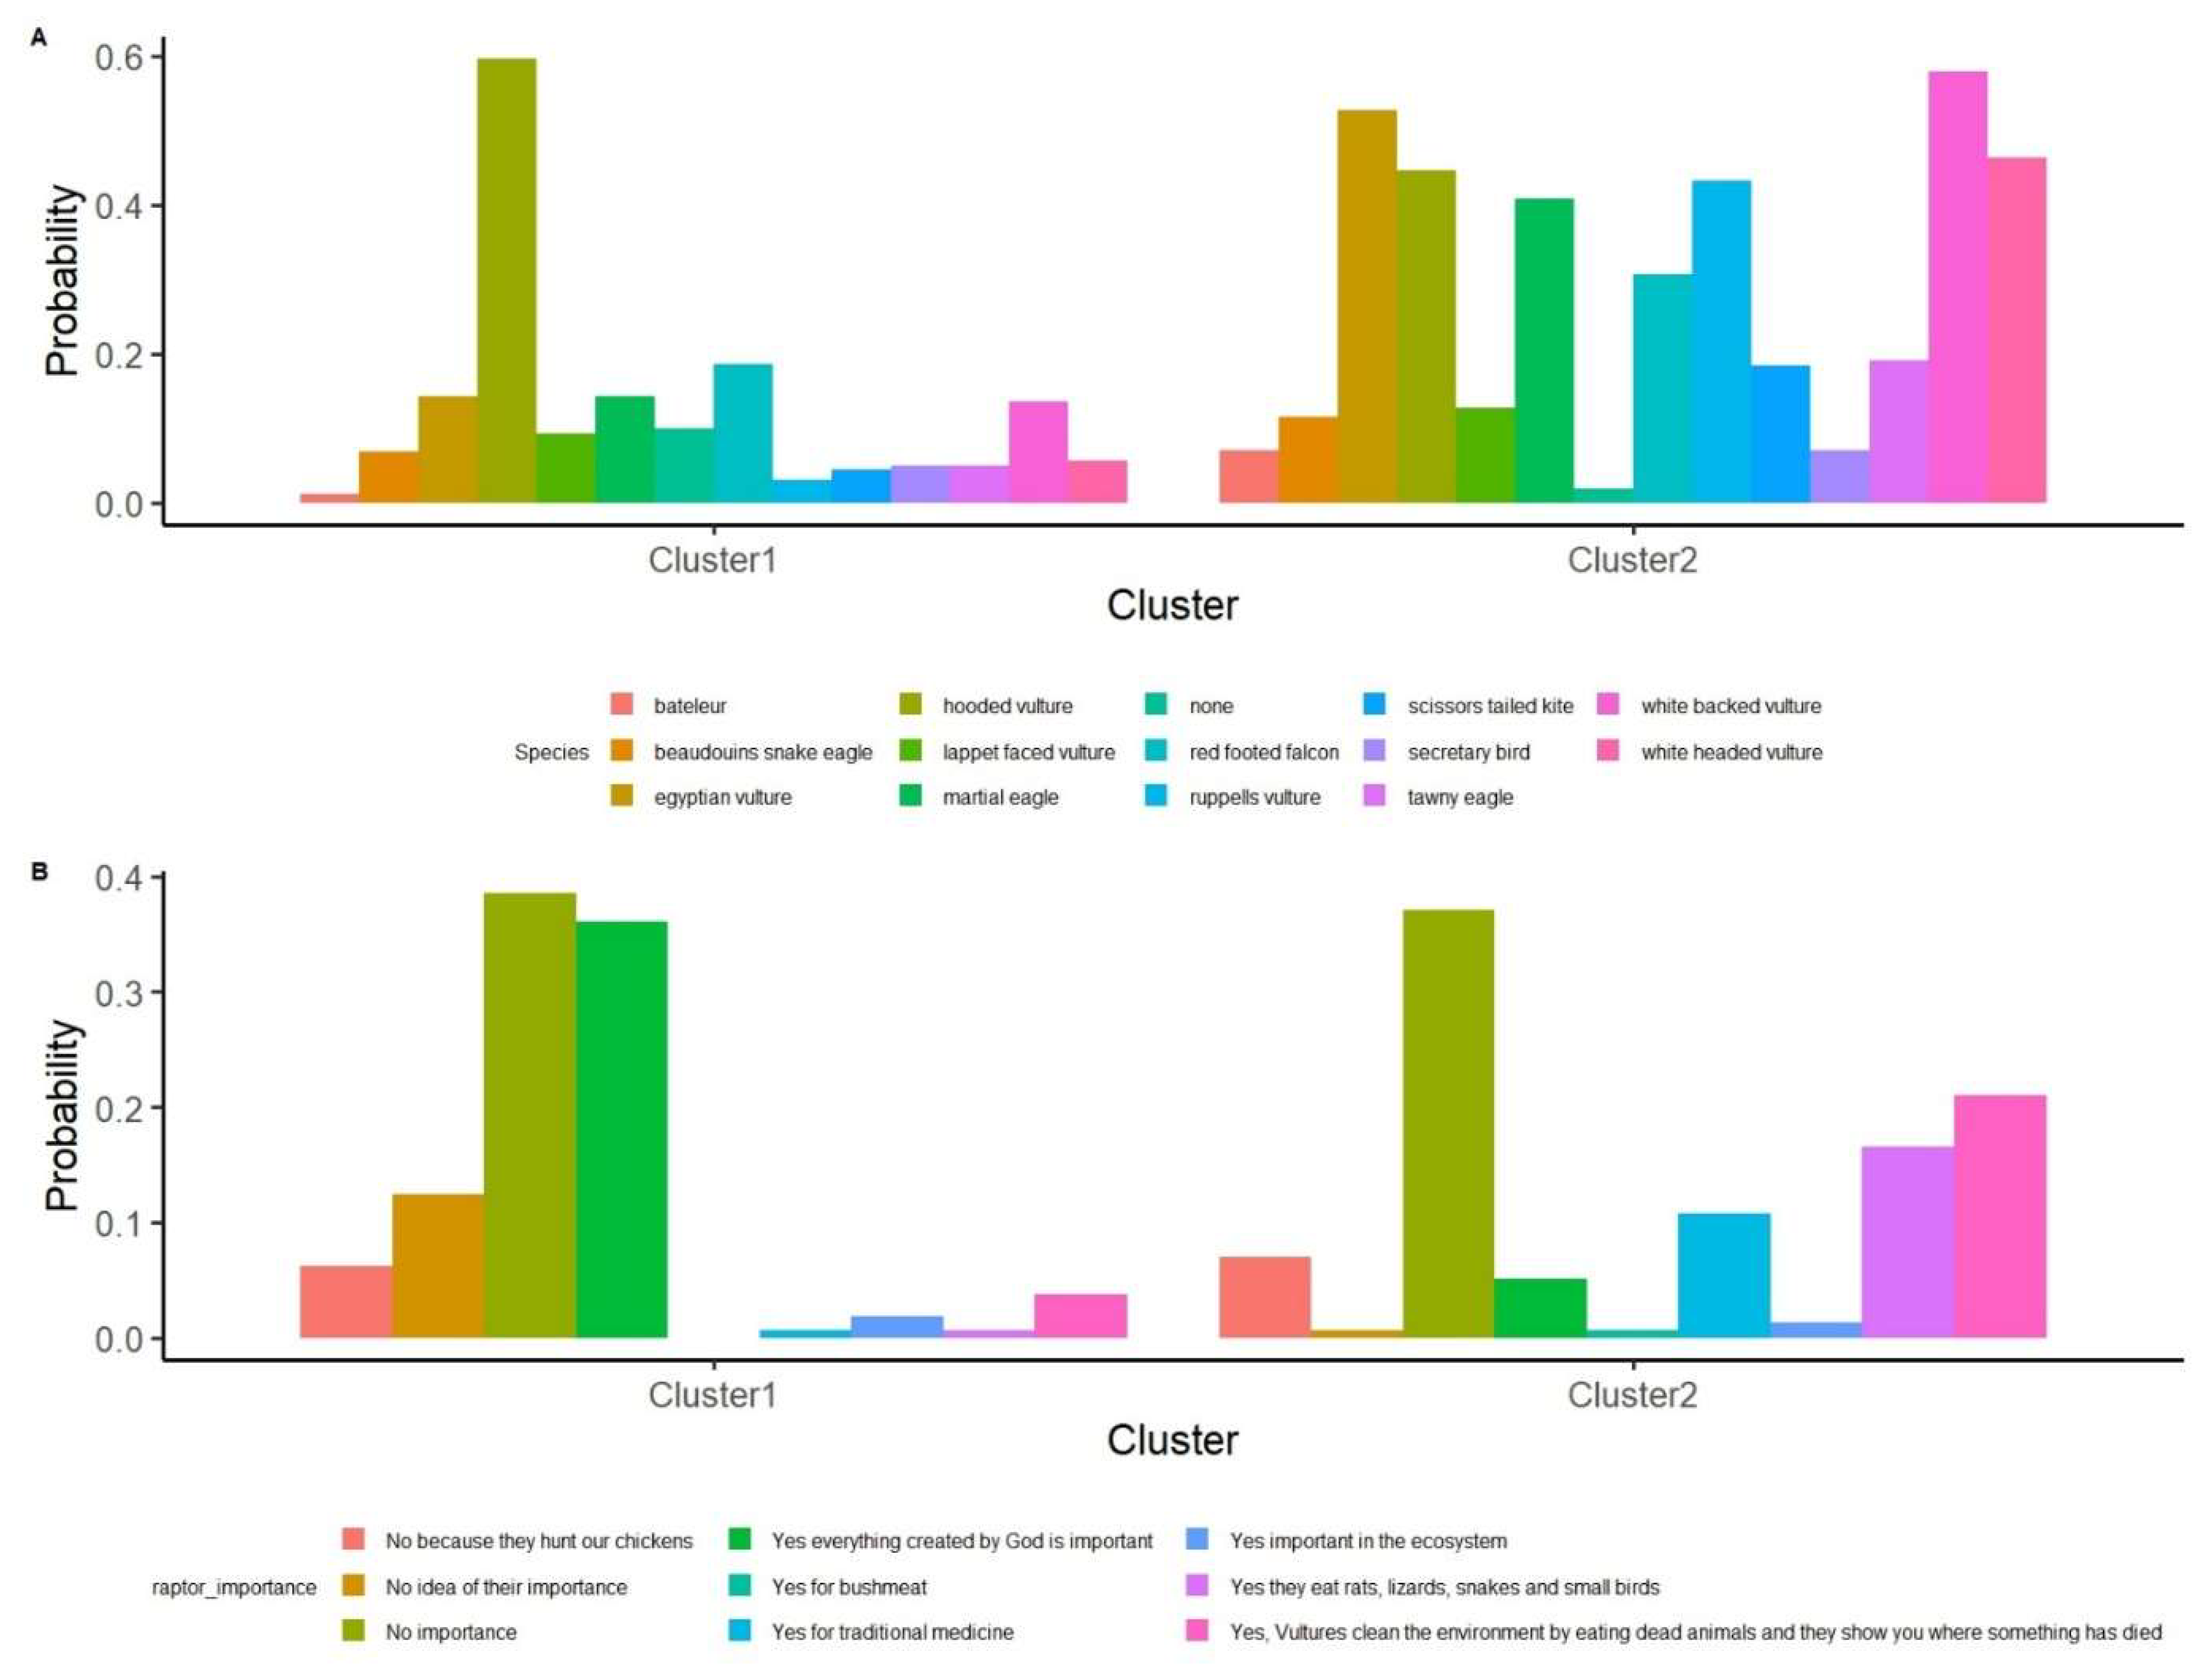
In terms of raptor knowledge, the majority of respondents in both clusters were unaware of the decline of threatened raptor species (Figure 8E). Perception of raptor importance also differed: most respondents in Cluster 1 believed raptors had no importance, followed by those who considered all creatures important because they were created by God. In contrast, while some individuals in Cluster 2 recognised specific ecological roles of raptors, a larger proportion believed raptors had no value beyond preying on their chickens (Figure 9A). Regarding species identification, respondents in Cluster 1 predominantly recognised the Hooded Vulture, whereas Cluster 2 exhibited a more evenly distributed knowledge of species such as the Egyptian Vulture, White-backed Vulture, Hooded Vulture, and White-headed Vulture (Figure 9B). Based on these distinctions, Cluster 1 was classified as “low raptor knowledge”, while Cluster 2 was identified as “high raptor knowledge”.

3.3.3. Relationship Between Knowledge, Perceptions, and Raptor Abundance

There was a significant difference between the two clusters regarding people’s perception of raptors (t(299.79) = 4.11, p < 0.001). Cluster 1, which consisted of people with low raptor knowledge, exhibited a positive perception of raptors (mean ± SE; 0.24 ± 0.28), whereas Cluster 2, characterised by individuals with higher raptor knowledge, had a predominantly negative perception (mean ± SE; −1.22 ± 0.22) (Figure 10A).
Similarly, attitudes toward raptors differed significantly between the clusters (t(312.21) = 4.93, p < 0.001). Respondents in Cluster 1, who had limited raptor knowledge, demonstrated a positive attitude (mean ± SE; 0.40 ± 0.19), while those in Cluster 2, with higher raptor knowledge, exhibited a negative attitude (mean ± SE; −0.90 ± 0.18) (Figure 10B).

3.3.4. Influence of Perceptions, Cluster, and Pentad on Attitudes

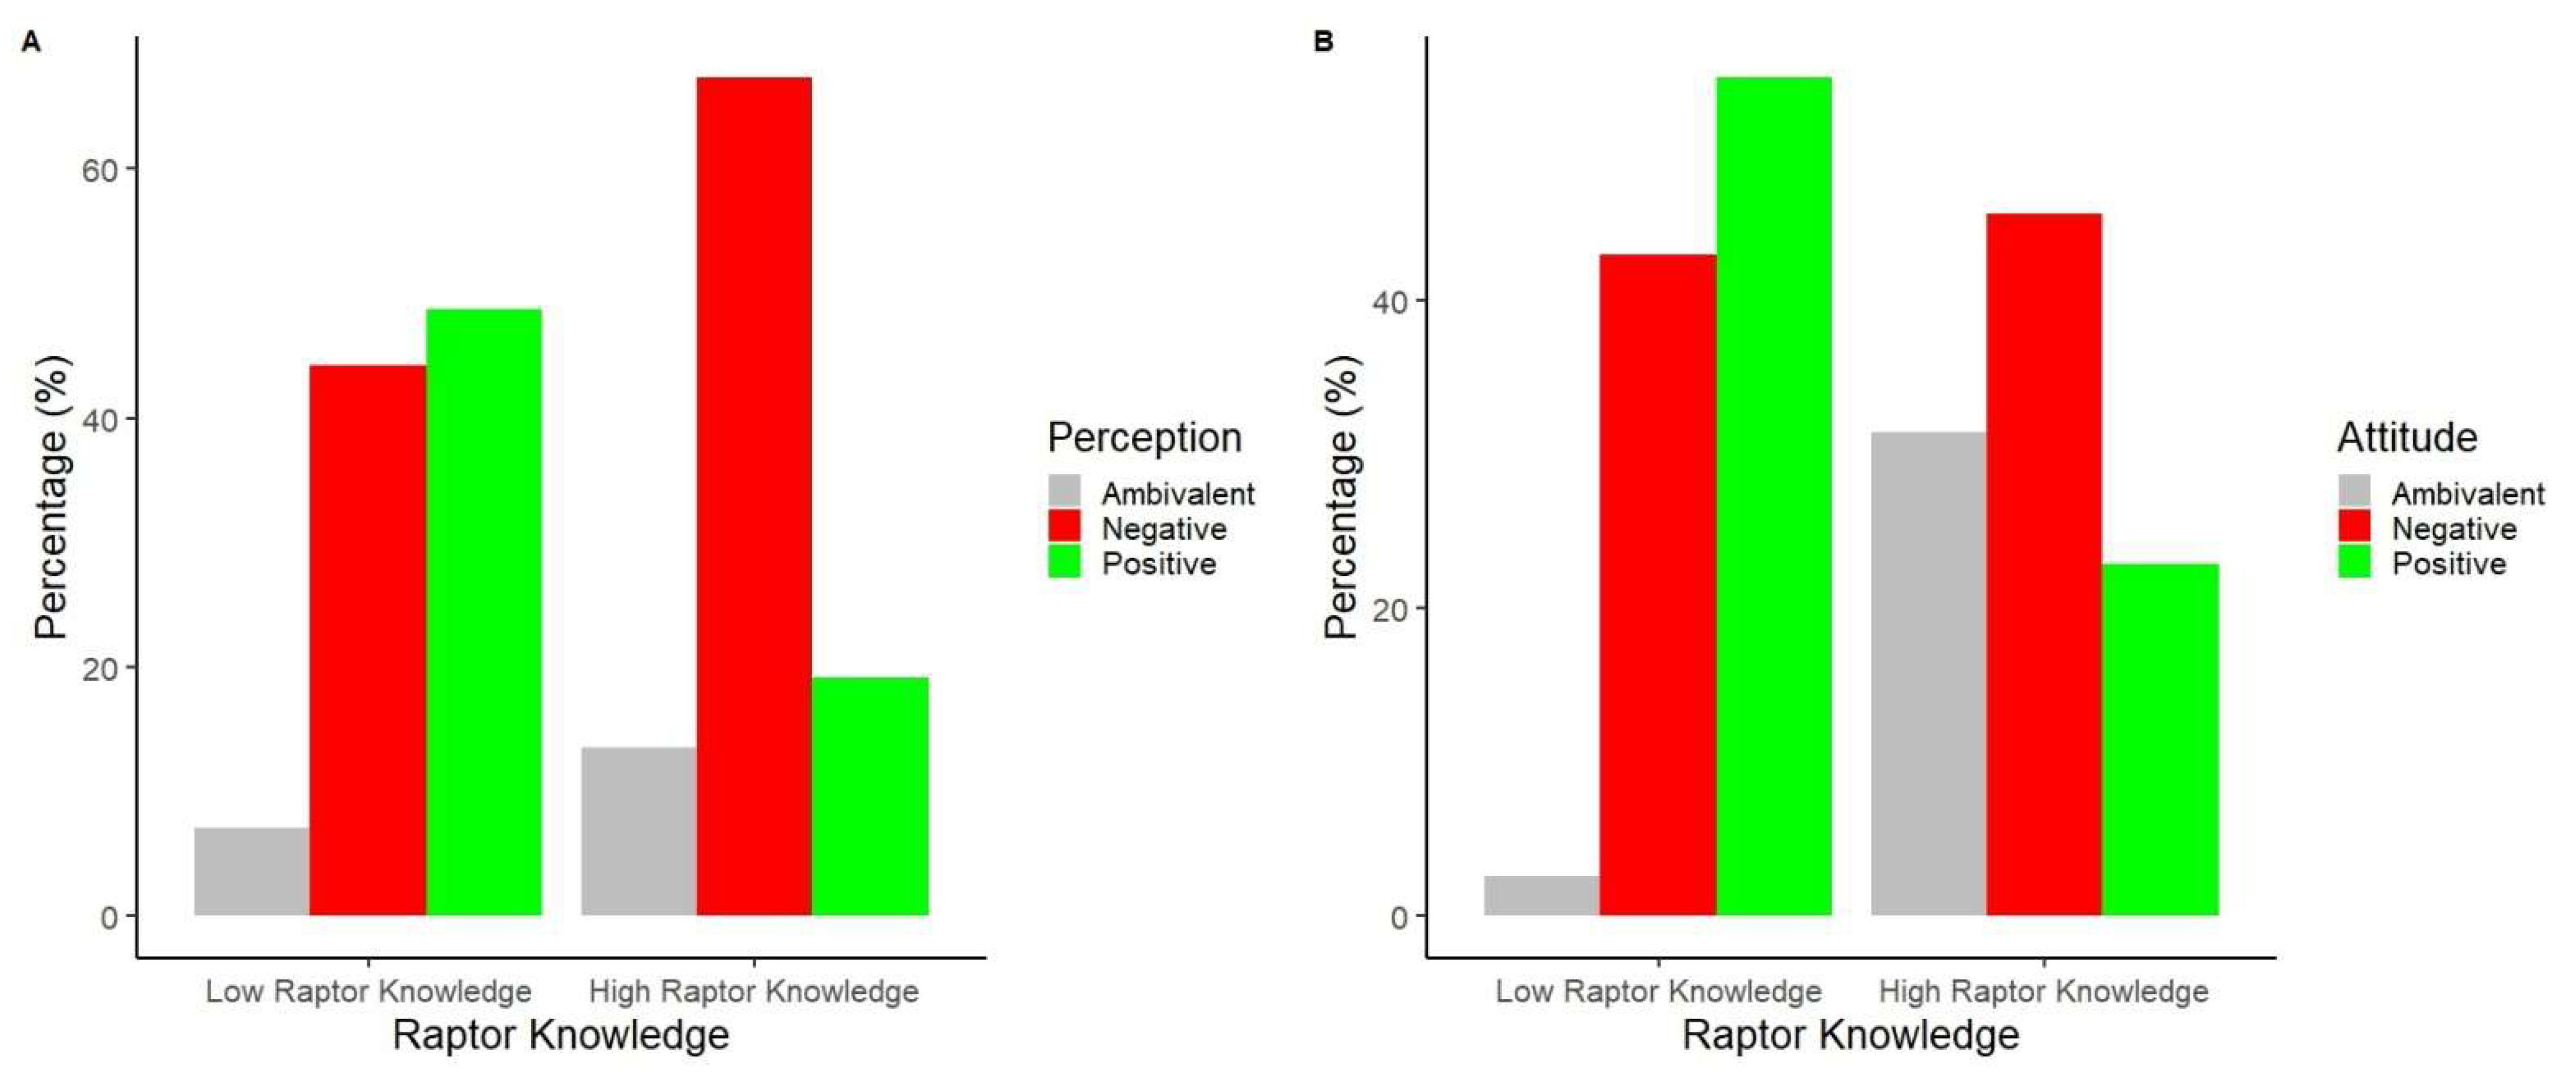
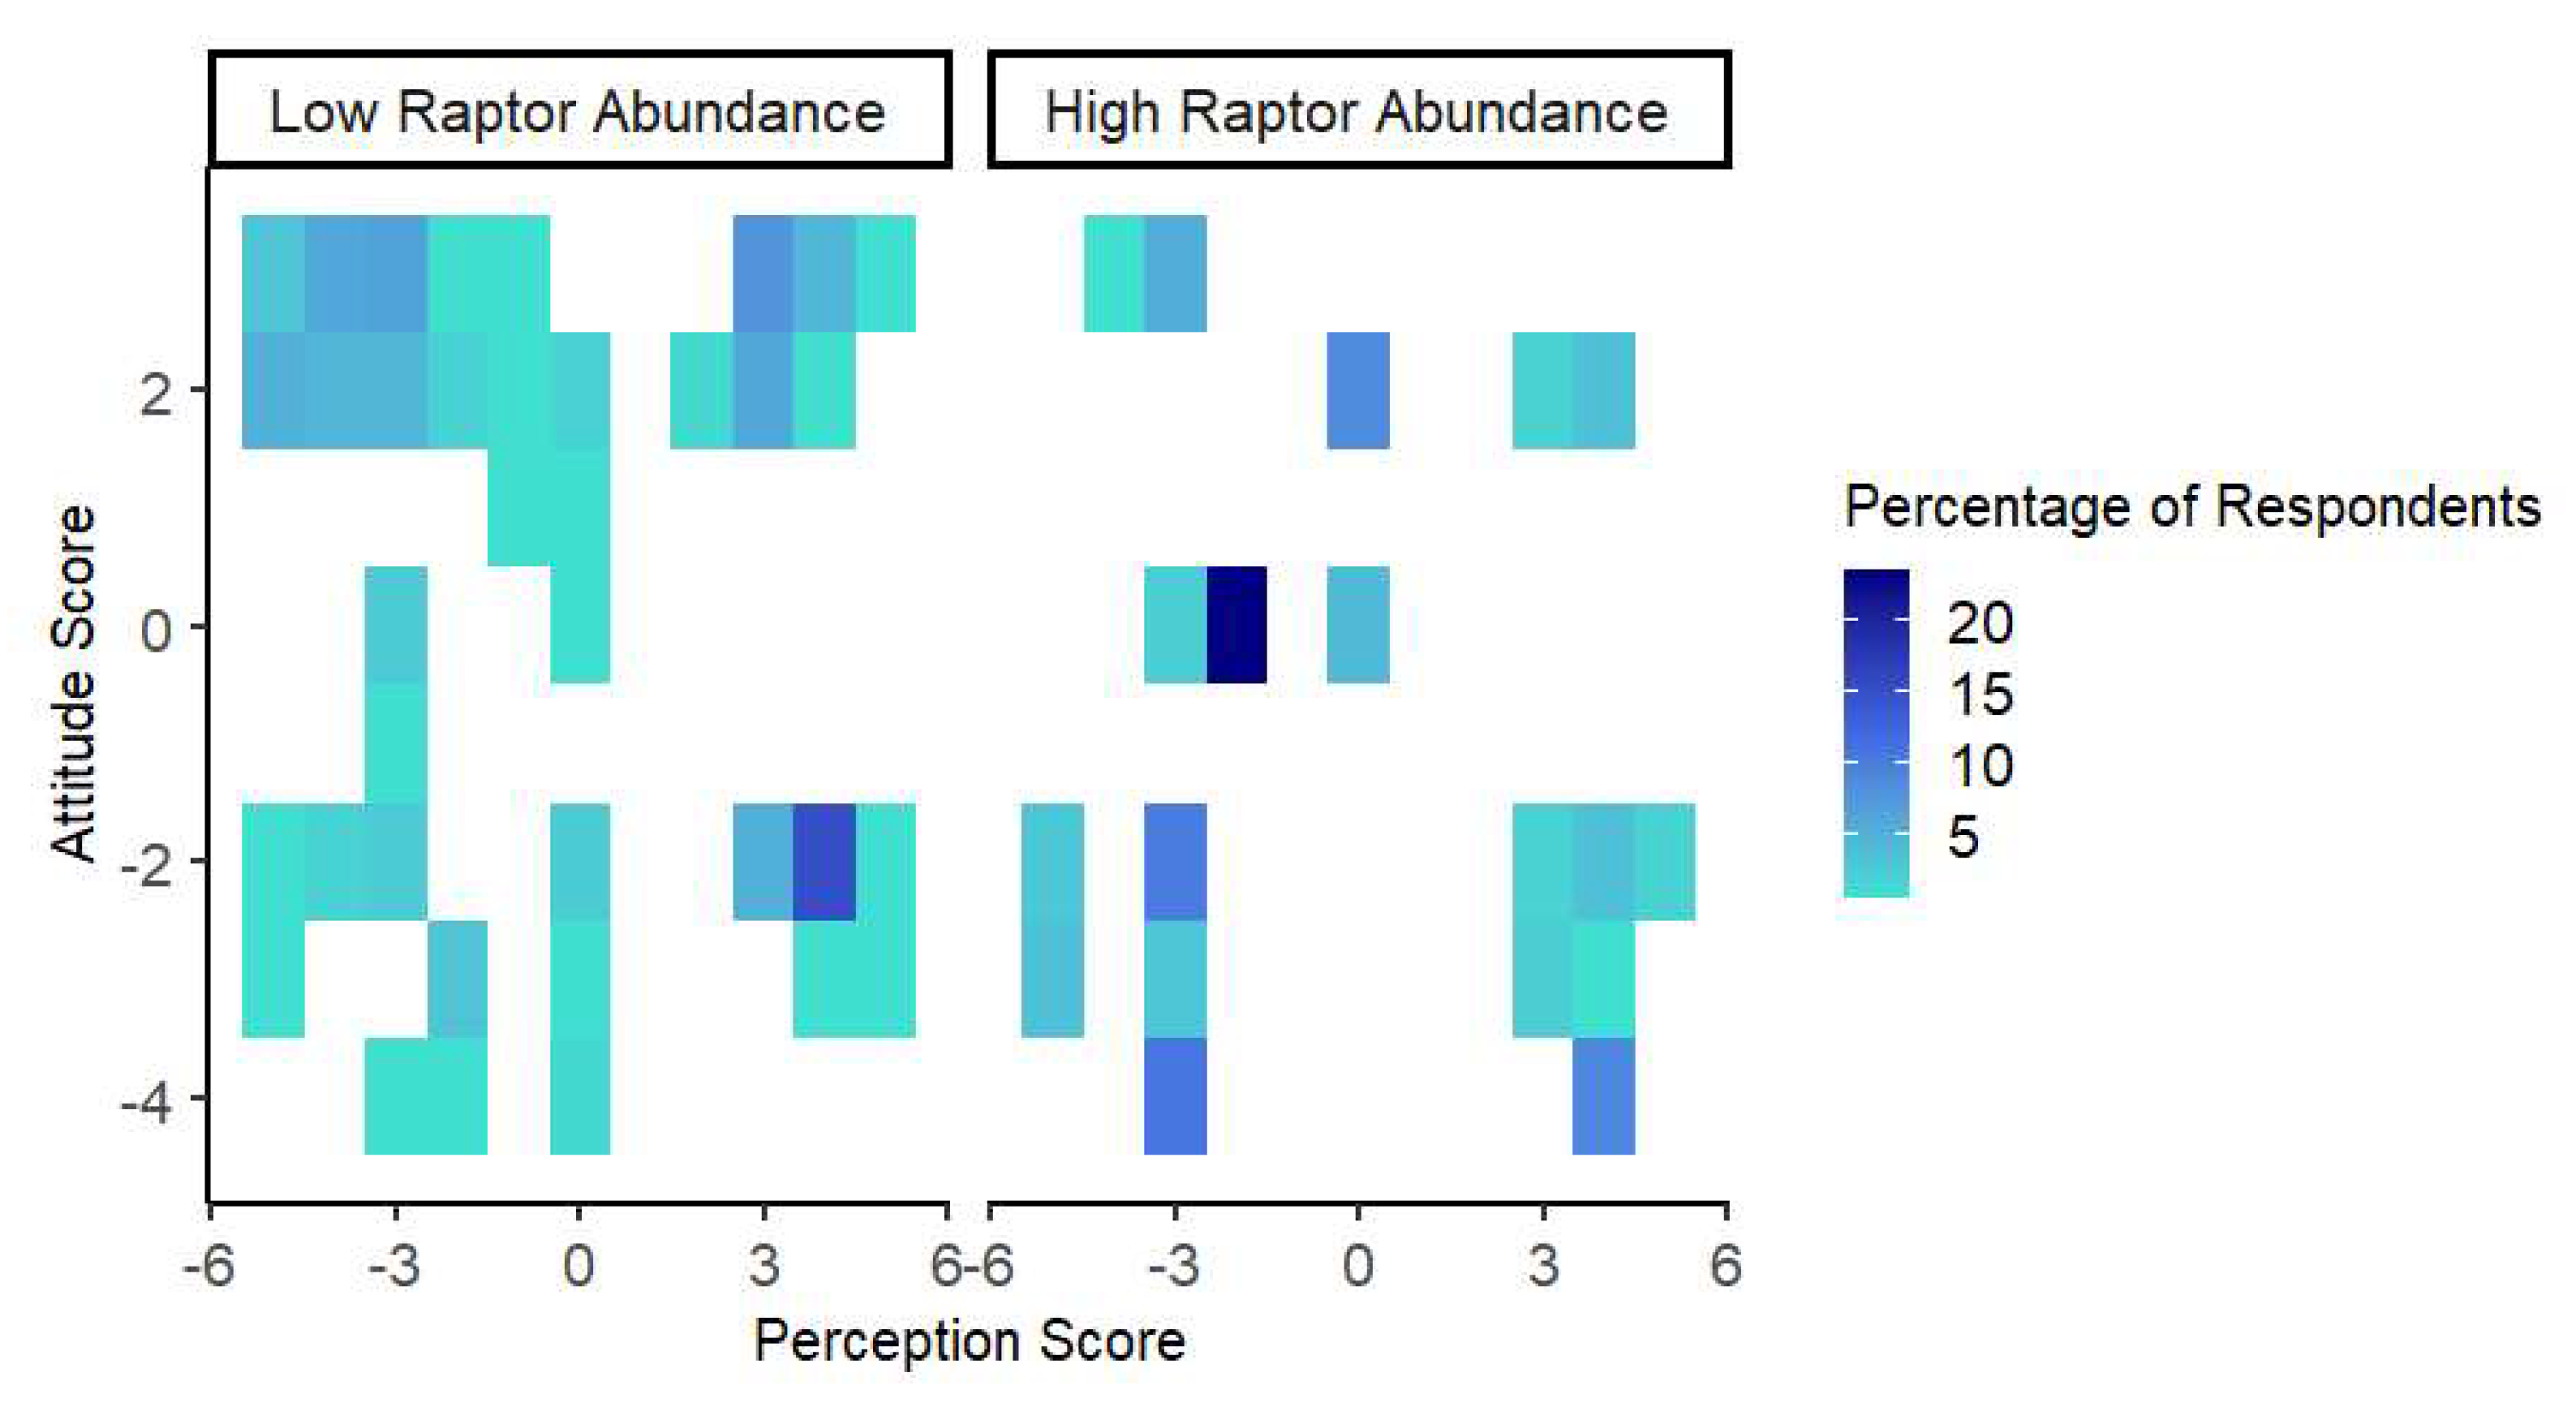
There was a significant difference in attitudes between individuals with low and high raptor knowledge (z = 2.627, p < 0.01) (Figure 11A,B). Additionally, a significant difference was found between negative and ambivalent perceptions (z = 0.979, p < 0.01). Additionally, the difference in people’s perceptions and attitudes between high raptor abundance pentads and low raptor abundance pentads was significant (p < 0.001, Figure 12). Also, the perception of respondents with high raptor knowledge significantly resulted in a significant negative attitude towards raptors (estimate = −2.1363, z = −4.563, p < 0.001; Table 3).

4. Discussion

Anthropogenic disturbances ranging from human population growth to people’s perception continue to play a crucial role in the distribution of species and particularly raptor species globally [1,11,56]. Our results confirmed the influence of human population and people’s perception on threatened raptor communities in Nigeria.

4.1. Influence of Population Density and Spatial Gaps

Our findings indicate that the distribution of threatened raptors is skewed toward the northeastern parts of Nigeria, which aligns with the presence of suitable ecological conditions, particularly savanna ecosystems [10,57]. These ecosystems support diverse raptor communities due to their open landscapes, which facilitate efficient hunting and sparse trees for nesting and roosting [10], and strong thermals that aid soaring and mid-day hunting [58]. Additionally, the savanna’s vegetation structure allows raptors to locate prey such as rodents and snakes more easily [59], 1990).
This is consistent with studies conducted in Cameroon, which has a similar ecological zone, where the Guinea savanna was found to support greater raptor assemblages than other vegetation zones [10]. Furthermore, data from the Birdlife Data Zone (2024) indicates that the 13 threatened raptor species have a similar habitat requirement, particularly open savannas and climatic conditions, which are likely to influence their distribution in the region.
However, while northeastern Nigeria provides favourable conditions for raptors, the presence of both hotspots and cold spots may suggest that additional factors are influencing their distribution and abundance. Our results support findings by Babura et al. (2022) [3], who observed that raptor diversity declined in areas with high levels of logging and human disturbance. Habitat loss due to agricultural expansion, deforestation, and infrastructure development may be contributing to variations in raptor abundance in some areas [7,60]. Raptors also face threats from persecution and prey depletion, which could further impact their populations [1,11].
This study reveals a significant negative relationship between human population density and threatened raptors’ reporting rate (RR). As apex or mesopredators, raptors are highly sensitive to disturbance due to their large home ranges, low reproductive rates, and dependence on complex habitats [32]. High population densities often correlate with habitat loss, infrastructure development, and conflict, all of which reduce suitable habitat and prey [61,62].
Interestingly, the Human Footprint Index did not emerge as a significant predictor. Its composite nature may obscure localised pressures like agriculture or urban sprawl, whereas population density may better capture immediate human impacts in tropical settings [63,64].
Although protected areas (PAs) aim to conserve biodiversity, RR was often higher in nearby low-density non-PA landscapes. This may be due to easier observer access, higher sampling effort, or the presence of key habitat features outside formal PAs which support the ecology and behaviour of these threatened raptors. In contrast, some PAs may lack optimal nesting or foraging habitats, especially for wide-ranging species like Polemaetus bellicosus or Aquila rapax whose territories exceed PA boundaries [65,66].
These findings suggest that low human pressure, rather than PA status alone, may be a stronger determinant of raptor presence. The detection of species such as Falco vespertinus and Neophron percnopterus entirely outside PAs further highlights a conservation gap. Others like Circaetus beaudouini and Chelictinia riocourii showed a broader spread but still underline the importance of unprotected landscapes. However, raptor persistence outside PAs may be temporary. These areas pose risks, including habitat conversion, persecution, and poisoning [56], and current presence may reflect delayed declines or “extinction debt” [67]. Conservation strategies must therefore extend beyond PA boundaries and engage broader landscapes and local communities [49,68].

4.2. Influence of Human Perceptions on Raptor Conservation

A key finding from our study is the general lack of awareness about raptors. Most respondents were unfamiliar with the term “raptor” but, when shown an image of the Yellow-billed Kite (Milvus aegyptius), they recognised it as “the thief” or “the bird that picks chicken”. This highlights limited awareness and a lack of distinction between the different raptor species. Moreover, the majority of respondents exhibited negative perceptions and attitudes toward raptors, aligning with previous studies that have linked such perceptions to poultry predation, cultural beliefs, and practices [15,69].
Vultures, in particular, were viewed negatively due to their scavenging behaviour. Similar perceptions have been documented in South America, where respondents associated vultures with aggressive feeding behaviour and the potential to harm people [70]. However, some respondents acknowledged the ecological role of vultures in cleaning up carcasses, as well as the pest control benefits provided by other raptors. Previous studies have shown that recognising ecosystem services can improve public attitudes toward wildlife [15,70,71]. Interestingly, respondents with higher knowledge of raptors viewed them as valuable for traditional medicine and consumption, which may contribute to their population decline. Similar trends have been observed in Cameroon and South Africa, where raptors face hunting pressures due to their perceived medicinal and conomic values [72,73].

4.3. Cultural or Historical Factors Influencing Attitudes

Our findings indicate that socio-demographic factors significantly shape people’s perceptions of raptors, corroborating patterns observed in other studies [15,37]. Farmers, in particular, exhibited more negative perceptions and attitudes toward raptors, likely due to their experiences with poultry predation. Similar findings have been reported, where peasant farmers expressed hostility toward raptors due to livestock losses [15,69,74,75]. In response, local farmers frequently threw stones at raptors to deter them from attacking their chickens. Respondents in the high raptor knowledge cluster included hunters who actively hunted raptors for food and monetary gains, further reinforcing negative perceptions and attitudes. This aligns with findings by Montenegro-Pazmiño and Muñoz (2024) [15], who reported that raptors provide ecosystem services to local communities, and their perceived negative impacts fuel negative attitudes toward their conservation.
Interestingly, our study reveals a negative relationship between perception and attitude. A negative perception of raptors does not necessarily translate into a negative attitude toward them. For instance, some respondents viewed raptors as “scary” or “mystical” but did not use them for traditional medicine and were supportive of their conservation. Additionally, a substantial proportion of respondents exhibited ambivalence, holding both negative and positive views. This highlights the need for targeted conservation education that addresses misconceptions while emphasising the ecological importance of raptors.
Age also played a role in shaping perceptions. Elderly respondents, who had more interaction with threatened raptors in the past, exhibited higher knowledge but more negative attitudes, possibly due to long-term experiences with raptor-related conflicts [15]. In contrast, younger respondents, with limited exposure to raptors, displayed more positive attitudes, potentially influenced by conservation education and increased environmental awareness [37]. However, it is also possible that their lack of direct interaction with raptors due to population declines has shaped their more neutral or positive perceptions.
Furthermore, perceptions and attitudes varied across pentads, with raptor hotspots (good pentads) having more negative perceptions, whereas cold spots (bad pentads) had more positive perceptions. This aligns with Montenegro-Pazmiño and Muñoz (2024) [15], who found that lower population density resulted in reduced poultry predation, leading to more favourable attitudes toward raptors. The positive perceptions in low-abundance areas may be due to reduced human–wildlife conflict, as respondents noted that encountering these threatened raptors had become increasingly rare.

4.4. Recommendations for Policy and Conservation

This study highlights the urgent need for targeted conservation strategies that integrate both ecological and socio-cultural dimensions of raptor conservation in Nigeria [76,77]. The findings highlight that a significant proportion of suitable raptor habitats fall outside designated protected areas, emphasising the necessity of expanding conservation efforts beyond these boundaries [7]. Implementing community-based conservation initiatives in these unprotected yet ecologically important areas can enhance habitat protection and mitigate threats such as habitat loss and direct persecution. Additionally, conservation policies should prioritise habitat protection in both protected and unprotected landscapes, integrating raptor conservation into broader land-use planning and sustainable development initiatives [78]. Strengthening legal frameworks to regulate hunting, habitat destruction, and trade in raptor species will also be essential in ensuring their long-term survival.
The study further reveals the influence of traditional beliefs and cultural practices on raptor populations, particularly their use in traditional medicine and belief-based rituals. Conservation interventions should incorporate culturally sensitive approaches that acknowledge these socio-cultural factors while promoting alternative livelihood options to reduce hunting pressure on raptors [15,69]. Local communities should be actively involved in raptor conservation through participatory approaches that align with their socio-economic and cultural contexts [79]. Additionally, engagement with local communities, particularly in areas with high poultry predation, is crucial in fostering coexistence strategies that reduce human–wildlife conflicts. The negative perceptions and attitudes toward raptors, particularly among local farmers, suggest that human–wildlife conflict remains a key conservation challenge. Addressing this requires structured conservation education programs that raise awareness about the ecological roles of raptors, such as controlling rodent populations and scavenging carrion, while also correcting misconceptions that fuel persecution [80,81].
It is critical to conduct more species-specific studies to understand which species are at a higher risk of exploitation for traditional medicine, cultural use, and human consumption. Also, our visits to wildlife markets suggest that, though most species are threatened and are rare to encounter in the wild, their body parts still exist in these markets, highlighting that market surveys may be a potential tool in understanding the distribution of threatened wildlife.

5. Conclusions

This study provides critical insights into the distribution of threatened raptors in Nigeria, emphasising the ecological significance of savanna ecosystems and the impact of anthropogenic pressures on raptor populations. While suitable habitats for raptors exist both within and outside protected areas, population growth, direct persecution, and socio-cultural factors pose significant threats to their survival. This study highlights that the conservation of threatened raptor species cannot rely solely on the network of formally designated protected areas (PAs). While PAs are important, they often fall short in effectively safeguarding wide-ranging raptors, particularly in landscapes marked by high human density or suboptimal habitat conditions. The higher reporting rates of many threatened species in low-density, non-protected areas emphasise the ecological value of the surrounding landscape matrix.
Negative perceptions and attitudes toward raptors, largely driven by poultry predation and traditional beliefs, contribute to human–raptor conflicts. These findings call for a shift toward integrative, landscape-scale conservation strategies that extend beyond PA boundaries to include community-managed lands, traditional landscapes, and ecological corridors. Such strategies must account for species-specific habitat needs, human pressures, and detection dynamics. To ensure the long-term persistence of these species, it is essential to improve PA effectiveness, reduce anthropogenic threats in the wider landscape, and promote inclusive conservation practices that engage local communities and stakeholders. Addressing these challenges will also require targeted conservation education programs to raise awareness about the ecological roles of raptors and to counter misconceptions. Ultimately, safeguarding Africa’s threatened raptors will require conservation action that is spatially extensive, socially inclusive, and ecologically informed.

Supplementary Materials

The following supporting information can be downloaded at: https://www.mdpi.com/article/10.3390/d17090602/s1, Table S1. List of threatened raptors that occur in Nigeria according to the IUCN red list (https://datazone.birdlife.org/country/nigeria 30 January 2025). Supplementary S1: Raptors Knowledge, Attitudes and Perceptions Questionnaire; Supplementary S2. Data Inputs for Human Footprint Indicators of Anthropogenic Modification and corresponding IUCN-CMP Threat Category [28]. Source: https://sedac.ciesin.columbia.edu/data/set/lulc-human-modification-terrestrial-systems accessed on 30 January 2025 [30]; Supplementary S3. Threatened species distribution across the various protection area category.

Author Contributions

The following is the summary of the contribution of the authors listed: Conceptualization, B.A., I.A.I., T.T. and A.A.C.; methodology, B.A., I.A.I., T.T. and A.A.C., software validation, B.A. and I.A.I.; formal analysis, B.A. and I.A.I.; investigation, B.A. and I.A.I.; resources, B.A., I.A.I., T.T. and A.A.C., data curation, B.A. and I.A.I.; writing—original draft preparation, B.A., I.A.I., T.T. and A.A.C., writing—review and editing, B.A., I.A.I., T.T. and A.A.C., visualization, B.A. and I.A.I.; supervision, T.T. and A.A.C.; project administration, B.A. and A.A.C.; funding acquisition, B.A. All authors have read and agreed to the published version of the manuscript.

Funding

This research was funded by Raptor Research Foundation and the A. P. Leventis Ornithological Research Institute (APLORI).

Informed Consent Statement

Verbal informed consent was obtained from the participants.

Data Availability Statement

The original data presented in the study are openly available on FigShare at DOI:10.6084/m9.figshare.28945151.

Acknowledgments

We are grateful to the A. P. Leventis Ornithological Research Institute, Nigeria, and the Raptor Research Foundation, which both provided funding and research equipment for the study. We also appreciate Bello Danmallam for helping us gain access to the data. We also thank Nathaniel Owolawi, Fatai Oyindamola Suliat, Jemima Amos, Samuel Nti, Barnabas Sani, Ugome Othniel, Ilyas Ibrahim, Bitrus Afan, as well as the Nigerian Montane Forest Project, for serving as field assistants across various field locations. We are also grateful to all the citizen scientists across the country who tirelessly collect and submit bird data. This contribution by the Nocturnal Avian Ecology lab is contribution number 233 from the A. P. Leventis Ornithological Research Institute. The article processing charge was covered by the A. P. Leventis Ornithological Research Institute.

Conflicts of Interest

The authors declare no conflicts of interest.

References

  1. McClure, C.J.; Westrip, J.R.; Johnson, J.A.; Schulwitz, S.E.; Virani, M.Z.; Davies, R.; Symes, A.; Wheatley, H.; Thorstrom, R.; Amar, A.; et al. State of the world’s raptors: Distributions, threats, and conservation recommendations. Biol. Conserv. 2018, 227, 390–402. [Google Scholar] [CrossRef]
  2. Smits, J.E.; Fernie, K.J. Avian wildlife as sentinels of ecosystem health. Comp. Immunol. Microbiol. Infect. Dis. 2013, 36, 333–342. [Google Scholar] [CrossRef]
  3. Babura Sabo, B.; Mohammed, S.; Zakariya Karkama, M. Raptors In Baturiya Birds Sanctuary Northwestern, Nigeria. J. Agric. Econ. Environ. Soc. Sci. 2022, 8, 34–37. [Google Scholar] [CrossRef]
  4. Fowler, D.W.; Freedman, E.A.; Scannella, J.B. Predatory functional morphology in raptors: Interdigital variation in talon size is related to prey restraint and immobilisation technique. PLoS ONE 2009, 4, e7999. [Google Scholar] [CrossRef]
  5. Potier, S. Visual adaptations in predatory and scavenging diurnal raptors. Diversity 2020, 12, 400. [Google Scholar] [CrossRef]
  6. Sabo, B.B.; Mohammed, S.; Danladi, S.I. Assessment of raptor species relative abundance in Hadejia Nguru Wetlands, Nigeria. Gadau J. Pure Allied Sci. 2022, 1, 189–199. [Google Scholar] [CrossRef]
  7. Shaw, P.; Ogada, D.; Dunn, L.; Buij, R.; Amar, A.; Garbett, R.; Herremans, M.; Virani, M.Z.; Kendall, C.J.; Croes, B.M.; et al. African savanna raptors show evidence of widespread population collapse and a growing dependence on protected areas. Nat. Ecol. Evol. 2024, 8, 45–56. [Google Scholar] [CrossRef]
  8. Barbar, F.; Werenkraut, V.; Morales, J.M.; Lambertucci, S.A. Emerging ecosystems change the spatial distribution of top carnivores even in poorly populated areas. PLoS ONE 2015, 10, e0118851. [Google Scholar] [CrossRef]
  9. Buij, R.; Croes, B.M. Raptor habitat use in the Lake Chad Basin: Insights into the effect of flood-plain transformation on Afrotropical and Palearctic raptors. Bird Conserv. Int. 2013, 23, 199–213. [Google Scholar] [CrossRef]
  10. Buij, R.; Croes, B.M.; Komdeur, J. Biogeographical and anthropogenic determinants of landscape-scale patterns of raptors in West African savannas. Biodivers. Conserv. 2013, 22, 1623–1646. [Google Scholar] [CrossRef]
  11. Ngila, P.M.; Chiawo, D.O.; Owuor, M.A.; Wasonga, V.O.; Mugo, J.W. Mapping suitable habitats for globally endangered raptors in Kenya: Integrating climate factors and conservation planning. Ecol. Evol. 2023, 13, e10443. [Google Scholar] [CrossRef]
  12. Atuo, F.A.; O’Connell, T.J.; Abanyam, P.U. An assessment of socio-economic drivers of avian body parts trade in West African rainforests. Biol. Conserv. 2015, 191, 614–622. [Google Scholar] [CrossRef]
  13. Bennett, N.J. Using perceptions as evidence to improve conservation and environmental management. Conserv. Biol. 2016, 30, 582–592. [Google Scholar] [CrossRef] [PubMed]
  14. Ingold, T. The Perception of the Environment: Essays on Livelihood, Dwelling and Skill; Routledge: Abingdon, UK, 2021. [Google Scholar] [CrossRef]
  15. Montenegro-Pazmiño, E.; Muñoz, G. Unveiling Social Dynamics in People’s Perception of Raptors to Guide Effective Conservation Strategies. J. Ethnobiol. 2024, 44, 112–128. [Google Scholar] [CrossRef]
  16. Buij, R.; Nikolaus, G.; Whytock, R.; Ingram, D.J.; Ogada, D. Trade of threatened vultures and other raptors for fetish and bushmeat in West and Central Africa. Oryx 2016, 50, 606–616. [Google Scholar] [CrossRef]
  17. BirdLife International. Country Profile: Nigeria. 2024. Available online: https://datazone.birdlife.org/country/nigeria (accessed on 30 January 2025).
  18. Onoja, J.D.; Tende, T.; Omotoriogun, T.C.; Ottosson, U.; Manu, S.A.; Mwansat, G.S. Raptors in Yankari Game Reserve and surrounding unprotected area, Nigeria. Malimbus 2014, 36, 67–75. [Google Scholar]
  19. Ogunsote, O.O.; Prucnal-Ogunsote, B. Defining climatic zones for architectural design in Nigeria: A systematic delineation. J. Environ. Technol. 2002, 1, 1–14. [Google Scholar]
  20. Osinowo, A.A.; Okogbue, E.C. Investigation of the sky optical conditions over selected stations in the major vegetation zones of Nigeria. Int. J. Sustain. Energy 2014, 33, 357–366. [Google Scholar] [CrossRef]
  21. Fasona, M.; Omojola, A.; Onyeahialam, A. Mapping land degradation and forest resource loss from fused landsat tm and nigeriasat-1 images in some parts of the southwest coast of Nigeria. IAHS Publ. 2007, 316, 110. [Google Scholar] [CrossRef]
  22. Liman, H.M.; Obaje, N.G.; Sidi, A.A.; Nwaerema, P. Impact evaluation of artisanal and small-scale mining on land use land cover: Implication for sustainable mining environment in Niger State, Nigeria. J. Earth Sci. Geotech. Eng. 2021, 11, 33–45. [Google Scholar] [CrossRef] [PubMed]
  23. Merem, E.C.; Twumasi, Y.; Wesley, J.; Isokpehi, P.; Shenge, M.; Fageir, S.; Crisler, M.; Romorno, C.; Hines, A.; Hirse, G.; et al. Assessing the ecological effects of mining in West Africa: The case of Nigeria. Int. J. Min. Eng. Miner. Process. 2017, 6, 1–19. [Google Scholar] [CrossRef]
  24. Ekoh, P.C.; George, E.; Ejimkaraonye, C. Nigeria demographic report: The effect of overpopulation on life expectancy. Etude Popul. Afr. 2020, 34, 5106–5114. [Google Scholar]
  25. Pontianus, V.J.; Oruonye, E.D. The Nigerian population: A treasure for national development or an unsurmountable national challenge. Int. J. Sci. Res. Arch. 2021, 2, 136–142. [Google Scholar] [CrossRef]
  26. Tende, T.; Iniunam, I.A.; Ivande, S.T.; Awoyemi, A.G.; Danmallam, B.A.; Ringim, A.S.; Bako, L.A.; Ramzy, F.J.; Kazeh, N.W.; Izang, A.I.; et al. Citizen science mitigates the lack of distributional data on Nigerian birds. Ecol. Evol. 2024, 14, e11280. [Google Scholar] [CrossRef]
  27. Rosas, Y.M.; Peri, P.L.; Pidgeon, A.M.; Politi, N.; Pedrana, J.; Díaz-Delgado, R.; Pastur, G.M. Human footprint defining conservation strategies in Patagonian landscapes: Where we are and where we want to go? J. Nat. Conserv. 2021, 59, 125946. [Google Scholar] [CrossRef]
  28. Salafsky, N.; Relton, C.; Young, B.E.; Lamarre, P.; Böhm, M.; Chénier, M.; Cochrane, E.; Dionne, M.; He, K.K.; Suresh, V.; et al. Classification of direct threats to the conservation of ecosystems and species 4.0. Conserv. Biol. 2025, 39, e14434. [Google Scholar] [CrossRef]
  29. Venter, O.; Sanderson, E.W.; Magrach, A.; Allan, J.R.; Beher, J.; Jones, K.R.; Possingham, H.P.; Laurance, W.F.; Wood, P.; Fekete, B.M.; et al. Global terrestrial Human Footprint maps for 1993 and 2009. Sci. Data 2016, 3, 160067. [Google Scholar] [CrossRef] [PubMed]
  30. Kennedy, C.M.; Oakleaf, J.R.; Theobald, D.M.; Baruch-Mordo, S.; Kiesecker, J. Managing the middle: A shift in conservation priorities based on the global human modification gradient. Glob. Change Biol. 2019, 25, 811–826. [Google Scholar] [CrossRef]
  31. Carrete, M.; Tella, J.L. Individual consistency in flight initiation distances in burrowing owls: A new hypothesis on disturbance-induced habitat selection. Biol. Lett. 2010, 6, 167–170. [Google Scholar] [CrossRef] [PubMed]
  32. Thiollay, J.M. Severe decline of large birds in the northern Sahel of West Africa: A long-term assessment. Bird Conserv. Int. 2006, 16, 353–365. [Google Scholar] [CrossRef]
  33. O’Bryan, C.J.; Allan, J.R.; Suarez-Castro, A.F.; Delsen, D.M.; Buij, R.; McClure, C.J.; Rehbein, J.A.; Virani, M.Z.; McCabe, J.D.; Tyrrell, P.; et al. Human impacts on the world’s raptors. Front. Ecol. Evol. 2022, 10, 624896. [Google Scholar] [CrossRef]
  34. Rodríguez-Estrella, R.; Donázar, J.A.; Hiraldo, F. Raptors as indicators of environmental change in the scrub habitat of Baja California Sur, Mexico. Conserv. Biol. 1998, 12, 921–925. [Google Scholar] [CrossRef]
  35. UNEP-WCMC. Protected Area Profile for Nigeria from the World Database on Protected Areas, February 2025. Available online: www.protectedplanet.net (accessed on 20 January 2025).
  36. Friant, S.; Paige, S.B.; Goldberg, T.L. Drivers of bushmeat hunting and perceptions of zoonoses in Nigerian hunting communities. PLoS Neglected Trop. Dis. 2015, 9, e0003792. [Google Scholar] [CrossRef]
  37. Awoyemi, A.G.; Ibáñez-Rueda, N.; Guardiola, J.; Ibáñez-Álamo, J.D. Human-nature interactions in the Afrotropics: Experiential and cognitive connections among urban residents in southern Nigeria. Ecol. Econ. 2024, 218, 108105. [Google Scholar] [CrossRef]
  38. Fa, J.E.; Seymour, S.; Dupain, J.E.F.; Amin, R.; Albrechtsen, L.; Macdonald, D. Getting to grips with the magnitude of exploitation: Bushmeat in the Cross–Sanaga rivers region, Nigeria and Cameroon. Biol. Conserv. 2006, 129, 497–510. [Google Scholar] [CrossRef]
  39. Amusa, T.O.; Azeez, K.K.; Olabode, E.A. Use of Geotracker and Kobocollect in monitoring patrol effort and illegal activities in Omo Forest reserve, Nigeria. PARKS 2021, 27, 37. [Google Scholar] [CrossRef]
  40. Lee, A.T.K.; Ottosson, U.; Jackson, C.; Shema, S.; Reynolds, C. Urban areas have lower species richness, but maintain functional diversity: Insights from the African Bird Atlas Project. Ostrich 2021, 92, 1–15. [Google Scholar] [CrossRef]
  41. MacKenzie, D.I.; Nichols, J.D.; Lachman, G.B.; Droege, S.; Andrew Royle, J.; Langtimm, C.A. Estimating site occupancy rates when detection probabilities are less than one. Ecology 2002, 83, 2248–2255. [Google Scholar] [CrossRef]
  42. Sauer, J.R.; Peterjohn, B.G.; Link, W.A. Observer differences in the North American breeding bird survey. Auk 1994, 111, 50–62. [Google Scholar] [CrossRef]
  43. Cleasby, I.R.; Owen, E.; Wilson, L.; Wakefield, E.D.; O’Connell, P.; Bolton, M. Identifying important at-sea areas for seabirds using species distribution models and hotspot mapping. Biol. Conserv. 2020, 241, 108375. [Google Scholar] [CrossRef]
  44. Getis, A.; Ord, J.K. The analysis of spatial association by use of distance statistics. Geogr. Anal. 1992, 24, 189–206. [Google Scholar] [CrossRef]
  45. Kwan, M.P. The uncertain geographic context problem. Ann. Assoc. Am. Geogr. 2012, 102, 958–968. [Google Scholar] [CrossRef]
  46. R Core Team. A Language and Environment for Statistical Computing; R Foundation for Statistical Computing: Vienna, Austria, 2024. Available online: https://www.R-project.org/ (accessed on 20 January 2025).
  47. Zuur, A.F.; Ieno, E.N.; Walker, N.J.; Saveliev, A.A.; Smith, G.M. Mixed Effects Models and Extensions in Ecology with R; Springer: New York, NY, USA, 2009; Volume 574, p. 574. [Google Scholar] [CrossRef]
  48. Kelling, S.; Johnston, A.; Bonn, A.; Fink, D.; Ruiz-Gutierrez, V.; Bonney, R.; Fernandez, M.; Hochachka, W.M.; Julliard, R.; Kraemer, R.; et al. Using semistructured surveys to improve citizen science data for monitoring biodiversity. BioScience 2019, 69, 170–179. [Google Scholar] [CrossRef] [PubMed]
  49. DeFries, R.; Hansen, A.; Turner, B.L.; Reid, R.; Liu, J. Land use change around protected areas: Management to balance human needs and ecological function. Ecol. Appl. 2007, 17, 1031–1038. [Google Scholar] [CrossRef] [PubMed]
  50. Geldmann, J.; Barnes, M.; Coad, L.; Craigie, I.D.; Hockings, M.; Burgess, N.D. Effectiveness of terrestrial protected areas in reducing habitat loss and population declines. Biol. Conserv. 2013, 161, 230–238. [Google Scholar] [CrossRef]
  51. Oxford University Press. Oxford English Dictionary; Oxford University Press: Oxford, UK, 2025. Available online: https://www.oed.com/ (accessed on 28 February 2025).
  52. Jayanthi, M.A.; Shanthi, E. Quest_SA: Preprocessing Method for Closed-Ended Questionnaires Using Sentiment Analysis through Polarity. Mob. Inf. Syst. 2022, 2022, 4733550. [Google Scholar] [CrossRef]
  53. Tejwani, R. Sentiment analysis: A survey. arXiv 2014, arXiv:1405.2584. [Google Scholar]
  54. Scheier, L.M.; Komarc, M. Are e-cigarette users a unique group of smokers? latent class analysis of the National youth tobacco survey. J. Drug Educ. 2020, 49, 87–114. [Google Scholar] [CrossRef]
  55. Walsh, K.; Mehta, A.H.; Buehler, Z.; Wall, M.; Santelli, J.; Hirsch, J.S.; Mellins, C.A. The socio-ecological context of US college student drinking: A latent class analysis. Addict. Behav. 2023, 141, 107666. [Google Scholar] [CrossRef]
  56. Ogada, D.; Shaw, P.; Beyers, R.L.; Buij, R.; Murn, C.; Thiollay, J.M.; Beale, C.M.; Holdo, R.M.; Pomeroy, D.; Sinclair, A.R.; et al. Another continental vulture crisis: Africa’s vultures collapsing toward extinction. Conserv. Lett. 2016, 9, 89–97. [Google Scholar] [CrossRef]
  57. Sabo, B.B.; Salisu, M. Assessment of Species Diversity and Relative Abundance of Raptors in North Western Region of Nigeria. Direct Res. J. Agric. Food Sci. 2023, 11, 18. [Google Scholar]
  58. Leyhe, J.E.; Ritchison, G. Perch sites and hunting behavior of Red-tailed Hawks (Buteo jamaicensis). J. Raptor Res. 2004, 38, 3. [Google Scholar]
  59. Thiollay, J.M.; Clobert, J. Comparative foraging adaptations of small raptors in a dense African savanna. Ibis 1990, 132, 42–57. [Google Scholar] [CrossRef]
  60. Amar, A.; Buij, R.; Suri, J.; Sumasgutner, P.; Virani, M.Z. Conservation and ecology of African raptors. In Birds of Prey: Biology and Conservation in the XXI Century; Springer International Publishing: Cham, Switzerland, 2018; pp. 419–455. [Google Scholar] [CrossRef]
  61. Herremans, M.; Herremans-Tonnoeyr, D. Land use and the conservation status of raptors in Botswana. Biol. Conserv. 2000, 94, 31–41. [Google Scholar] [CrossRef]
  62. Wittemyer, G.; Elsen, P.; Bean, W.T.; Burton, A.C.O.; Brashares, J.S. Accelerated human population growth at protected area edges. Science 2008, 321, 123–126. [Google Scholar] [CrossRef]
  63. Buechley, E.R.; Oppel, S.; Beatty, W.S.; Nikolov, S.C.; Dobrev, V.; Arkumarev, V.; Saravia, V.; Bougain, C.; Bounas, A.; Kret, E.; et al. Identifying critical migratory bottlenecks and high-use areas for an endangered soaring bird across three continents. J. Avian Biol. 2019, 49, e01629. [Google Scholar] [CrossRef]
  64. Wich, S.A.; Garcia-Ulloa, J.; Kühl, H.S.; Humle, T.; Lee, J.S.; Koh, L.P. Will oil palm’s homecoming spell doom for Africa’s great apes? Curr. Biol. 2014, 24, 1659–1663. [Google Scholar] [CrossRef]
  65. Amar, A.; Cloete, D. Quantifying the decline of the Martial Eagle Polemaetus bellicosus in South Africa. Bird Conserv. Int. 2018, 28, 363–374. [Google Scholar] [CrossRef]
  66. Brown, C.J. Declining Martial Polemaetus bellicosus and Tawny Aquila rapax Eagle populations and causes of mortality on farmlands in central Namibia. Biol. Conserv. 1991, 56, 49–62. [Google Scholar] [CrossRef]
  67. Tilman, D.; May, R.M.; Lehman, C.L.; Nowak, M.A. Habitat destruction and the extinction debt. Nature 1994, 371, 65–66. [Google Scholar] [CrossRef]
  68. Coetzee, B.W.; Gaston, K.J.; Chown, S.L. Local scale comparisons of biodiversity as a test for global protected area ecological performance: A meta-analysis. PLoS ONE 2014, 9, e105824. [Google Scholar] [CrossRef]
  69. Nyirenda, V.R.; Musonda, F.; Kambole, S.; Tembo, S. Peasant farmer–raptor conflicts around Chembe Bird Sanctuary, Zambia, Central Africa poultry predation, ethnobiology, land use practices and conservation. Anim. Biodivers. Conserv. 2017, 40, 121–132. [Google Scholar] [CrossRef]
  70. Ballejo, F.; Grilli, M.G.; Lambertucci, S.A. A long and troublesome journey: People’s perceptions and attitudes along the migratory path of a scavenger bird. Ethnobiol. Conserv. 2019, 8, 13. [Google Scholar] [CrossRef]
  71. Ogada, D.L.; Torchin, M.E.; Kinnaird, M.F.; Ezenwa, V.O. Effects of vulture declines on facultative scavengers and potential implications for mammalian disease transmission. Conserv. Biol. 2012, 26, 453–460. [Google Scholar] [CrossRef]
  72. Manqele, N.S.; Selier, S.J.; Taylor, J.; Downs, C.T. Vulture perceptions in a socio-ecological system: A case study of three protected areas in KwaZulu-Natal, South Africa. J. Ornithol. 2023, 164, 789–801. [Google Scholar] [CrossRef]
  73. Whytock, R.C.; Buij, R.; Virani, M.Z.; Morgan, B.J. Do large birds experience previously undetected levels of hunting pressure in the forests of Central and West Africa. Oryx 2016, 50, 76–83. [Google Scholar] [CrossRef]
  74. Karlsson, C.; Williams, M.M.; Ibrahim, J.; Tende, T.; Ottosson, U. Free-ranging poultry owners’ opinion towards raptors in Plateau State, Nigeria. Ostrich 2025, 96, 74–79. [Google Scholar] [CrossRef]
  75. Tiwari, G.; Pandey, P.; Kaul, R.; Singh, R. Farmers’ perception of the ecosystem services provided by diurnal raptors in arid Rajasthan. PeerJ 2023, 11, e15996. [Google Scholar] [CrossRef] [PubMed]
  76. Williams, M.M.; Yilgwan, P.L.; Junior, M.F.; Adendem, M.N.; Pam, E.D.; Yiljika, J.D. Roadside Reflection of Nigeria’s Declining Vultures: A study across Five Contiguous States (Plateau, Kaduna, Nasarawa, Benue, and Enugu). Eur. J. Ecol. Biol. Agric. 2024, 1, 15–22. [Google Scholar] [CrossRef] [PubMed]
  77. Ukpoju, E.A.; Abatan, A.; Obaedo, B.O.; Balogun, O.D.; Adegbite, A. Assessing the effectiveness of biodiversity conservation strategies in Nigeria: A comprehensive review. Int. J. Appl. Res. Soc. Sci. 2023, 5, 577–598. [Google Scholar] [CrossRef]
  78. Beresford, A.E.; Buchanan, G.M.; Donald, P.F.; Butchart, S.H.M.; Fishpool, L.D.C.; Rondinini, C. Poor overlap between the distribution of protected areas and globally threatened birds in Africa. Anim. Conserv. 2011, 14, 99–107. [Google Scholar] [CrossRef]
  79. Newing, H.; Brittain, S.; Buchadas, A.; del Giorgio, O.; Grasham, C.F.; Ferritto, R.; Marquez, J.R.G.; Khanyari, M.; König, B.; Kulkarni, A.; et al. ‘Participatory’ conservation research involving indigenous peoples and local communities: Fourteen principles for good practice. Biol. Conserv. 2024, 296, 110708. [Google Scholar] [CrossRef]
  80. Alba-Quilo, J.; González-Zambrano, R. Percepciones biológicas y culturales en la conservación de las aves rapaces centrada en la UEF Domingo Faustino Sarmiento, Quito-Ecuador. Rev. Cienc. Agropecu. ALLPA 2022, 5, 14–25. [Google Scholar] [CrossRef]
  81. Cailly Arnulphi, V.B.; Lambertucci, S.A.; Borghi, C.E. Education can improve the negative perception of a threatened long-lived scavenging bird, the Andean condor. PLoS ONE 2017, 12, e0185278. [Google Scholar] [CrossRef] [PubMed]
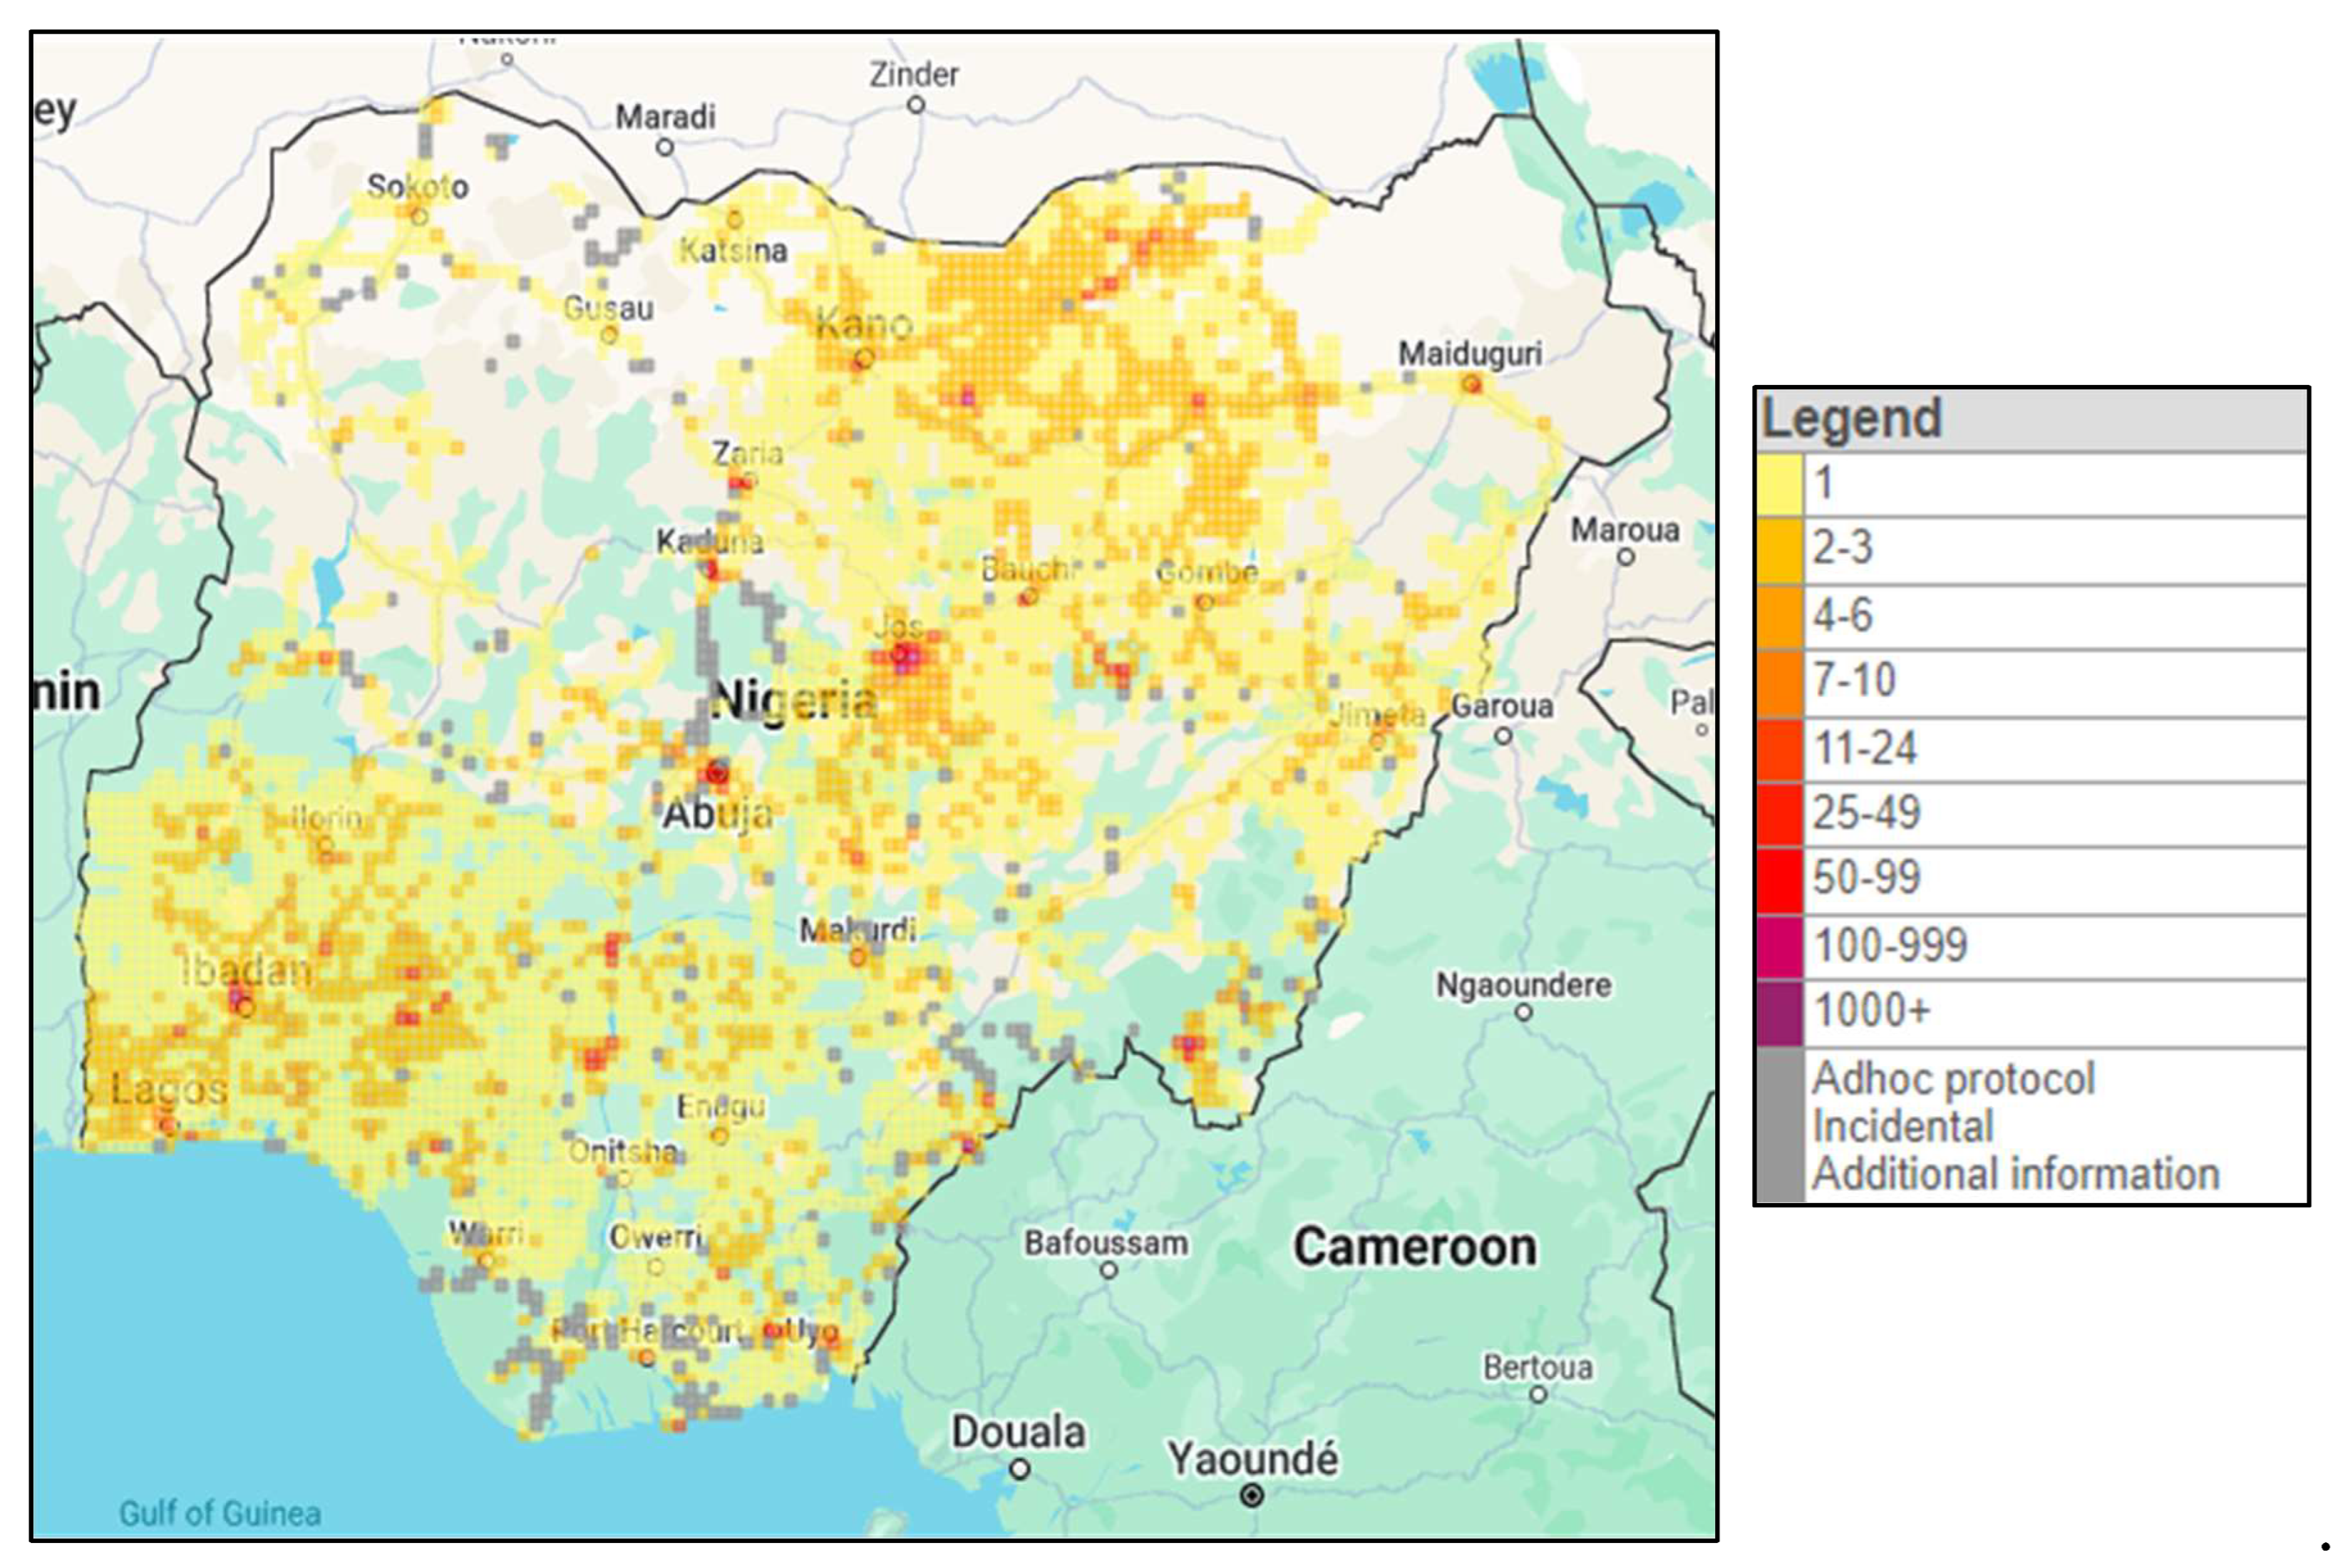
Figure 1. Map of Nigeria showing the current coverage of the Nigerian Bird Atlas Project (NiBAP).
Diversity 17 00602 g001
Figure 2. Map of surveyed sites in Nigeria after the hotspot analysis was conducted.
Diversity 17 00602 g002
Figure 3. Percentage reporting rate of eleven threatened raptor species across the various protected areas.
Diversity 17 00602 g003
Figure 4. Spatial distribution of significant clusters. Hotspots (red dots) indicate regions with significantly high values, while cold spots (blue dots) represent regions with significantly low values.
Diversity 17 00602 g004
Figure 5. Effect of population density on the reporting rate of threatened raptors. The solid blue line shows predicted reporting rates, and the shaded region represents 95% confidence interval.
Diversity 17 00602 g005
Figure 6. Effects of Protected Area status on the reporting rates of threatened raptors. Error bars and whiskers represent standard errors. *** represents the level of significance (p < 0.001) while ns represents non-significant difference.
Diversity 17 00602 g006
Figure 7. (A) Respondents’ perception across all survey sites. (B) Respondents’ attitudes across all survey sites.
Diversity 17 00602 g007
Figure 8. Latent Class Membership based on Gender (A), Age (B), monthly income (C), Education (D), Knowledge of raptor decline (E), and Occupation (F).
Diversity 17 00602 g008
Figure 9. Latent Class Membership in terms of raptor species identification (A) and knowledge of raptor importance (B).
Diversity 17 00602 g009
Figure 10. Violin Plot of the distribution of perception scores (A) and attitude score (B) between the two clusters with the black dots representing individual points while the boxplot within the violins indicates the median, interquartile range, and overall spread of the data. The violin shape represents the density of the data distribution; wider sections represent high data concentration. The asterisks (****) means the relationship was significant.
Diversity 17 00602 g010
Figure 11. Differences in perceptions (A) and attitude (B) between people with low raptor knowledge and those with high raptor knowledge.
Diversity 17 00602 g011
Figure 12. Heatmap showing the relationship between perception scores and attitude scores toward raptors in both cold and hotspots. Each cell represents the percentage of respondents falling within a given combination of perception (x-axis) and attitude (y-axis) scores. Colour intensity indicates the percentage of respondents, with light blue representing lower percentages and dark blue representing higher percentages. In areas with low raptor abundance (left panel), responses are more dispersed across a range of perception and attitude scores. In contrast, in areas with high raptor abundance (right panel), there is a stronger concentration of negative attitudes among respondents with negative perceptions.
Diversity 17 00602 g012
Table 1. LCA models of up to 6 classes were run and the best model was chosen based on the Bayesian Information Criterion (BIC) value, highlighted in bold.
ClusterLog LikelihoodBICFree Parameter
2-class−4783.07211,185.28281
3-class−4533.51211,498.61422
4-class−4488.67612,221.39563
5-class−4309.16612,674.82704
6-class−4201.96413,272.86845
Table 2. Descriptive statistics of main socio-demographic information of respondents.
VariableCategory CountPercentage
GenderFemale5216
Male26684
Age14–1783
18–2910332
30–397825
40–494915
50–593110
60+4915
EducationIslamic school52
College5216
None4915
Primary9329
Secondary11937
Monthly income0–15,0005823
15,001–30,0007418
30,001–60,00011218
60,001–100,000 5635
>100,000186
Table 3. Results of an Ordered Probit Model exploring the effects of perception, pentad, and cluster on attitude.
EstimateStd. Errorz ValuePr(>|z|)
Ambivalent|Negative−1.09780.3473−3.1615<0.01 **
Negative|Positive0.47560.34211.39040.1644
High Raptor Knowledge1.28670.48982.6273<0.01 **
Negative Perception0.97920.37362.6209<0.01 **
Positive Perception0.63060.36811.71340.0866
Pentad with High Raptor Abundance −0.97510.2541−3.8381<0.001 ***
High Raptor Knowledge: Negative Perception −2.13630.4682−4.5630<0.001 ***
High Raptor Knowledge: Positive Perception −0.89320.4897−1.82400.0682
Significant values in bold represent significant p-values and asterisks signify the strength of the significance. The asterisks (**,***) represents the level of significance with *** being more significant than **.
Disclaimer/Publisher’s Note: The statements, opinions and data contained in all publications are solely those of the individual author(s) and contributor(s) and not of MDPI and/or the editor(s). MDPI and/or the editor(s) disclaim responsibility for any injury to people or property resulting from any ideas, methods, instructions or products referred to in the content.