Article

Urban Forest Fragmentation Reshapes Soil Microbiome–Carbon Dynamics

by
Melinda Haydee Kovacs
1,
Nguyen Khoi Nghia
2 and
Emoke Dalma Kovacs
1,*
1
Research Institute for Analytical Instrumentation, National Institute for Research and Development in Optoelectronics, INCDO-INOE 2000, Donath 67, 400293 Cluj Napoca, Romania
2
Faculty of Soil Science, College of Agriculture, Can Tho University, Campus II, 3/2 Street, Ninh Kieu District, Can Tho City 900100, Vietnam
*
Author to whom correspondence should be addressed.
Diversity 2025, 17(8), 545; https://doi.org/10.3390/d17080545
Submission received: 26 June 2025 / Revised: 26 July 2025 / Accepted: 30 July 2025 / Published: 1 August 2025

Abstract

Urban expansion fragments once-contiguous forest patches, generating pronounced edge gradients that modulate soil physicochemical properties and biodiversity. We quantified how fragmentation reshaped the soil microbiome continuum and its implications for soil carbon storage in a temperate urban mixed deciduous forest. A total of 18 plots were considered in this study, with six plots for each fragment type. Intact interior forest (F), internal forest path fragment (IF), and external forest path fragment (EF) soils were sampled at 0–15, 15–30, and 30–45 cm depths and profiled through phospholipid-derived fatty acid (PLFA) chemotyping and amino sugar proxies for living microbiome and microbial-derived necromass assessment, respectively. Carbon fractionation was performed through the chemical oxidation method. Diversity indices (Shannon–Wiener, Pielou evenness, Margalef richness, and Simpson dominance) were calculated based on the determined fatty acids derived from the phospholipid fraction. The microbial biomass ranged from 85.1 to 214.6 nmol g−1 dry soil, with the surface layers of F exhibiting the highest values (p < 0.01). Shannon diversity declined systematically from F > IF > EF. The microbial necromass varied from 11.3 to 23.2 g⋅kg−1. Fragmentation intensified the stratification of carbon pools, with organic carbon decreasing by approximately 14% from F to EF. Our results show that EFs possess a declining microbiome continuum that weakens their carbon sequestration capacity in urban forests.

1. Introduction

Urban forest fragmentation occurs when forested areas are subdivided into smaller fragments through urban development and expansion. This process, driven by road infrastructure and building construction, significantly alters the spatial configuration and ecological integrity of forest ecosystems [1]. The fragmentation process generates cascading consequences, including edge effects [2], altered microclimatic regimes [3], and disruption of both plant and animal communities [4]. These impacts collectively propagate through the ecosystem, ultimately undermining biodiversity across the entire ecosystem [5]. These structural changes extend belowground, where the soil microbiome plays a pivotal role in ecosystem functioning. The soil microbiome continuum represents the dynamic equilibrium between living microbial biomass and accumulated necromass within the soil matrix, encompassing the bidirectional fluxes between metabolically active microbial communities and their post-mortem residues. This equilibrium exhibits high sensitivity to fragmentation-induced disturbance, including habitat connectivity loss and environmental instability [6], which alter community composition, turnover rates, and necromass accumulation patterns. Such perturbations induce shifts in microbial diversity, reduce functional capacity, and impair key ecosystem processes essential for soil health and resilience [5].
Recent research has highlighted the particular vulnerability of the soil microbiome continuum to urban forest fragmentation. Compared with non-fragmented ones, urban forest fragments often experience greater disturbance regimes, including greater pollution exposure, altered hydrology, and modified vegetation structure [7]. These factors collectively drive shifts in microbial diversity and community assembly with profound functional implications, as soil microbiomes mediate nutrient cycling, organic matter decomposition, and soil carbon storage [8]. Feng et al. [9] reported that fragmentation reduces beneficial microbial taxa abundance while promoting community adaptation to disturbed or nutrient-altered environments, potentially diminishing carbon sequestration efficiency. Kiesewetter and Afkhami [10] noted that connectivity loss between forest patches prevents dispersal of key microbial taxa, exacerbating declines in soil health and ecosystem resilience. Despite these advances, significant knowledge gaps persist regarding the mechanism by which urban forest fragmentation shapes the soil microbiome continuum and its implications for carbon storage. Understanding how fragmentation influences the soil microbiome continuum and carbon cycling is crucial for developing strategies to enhance urban forest sustainability and maximize their contribution to climate change mitigation.
Although there is increasing recognition of the leading role of the soil microbiome in carbon cycling [11], substantial knowledge gaps exist concerning the microbiome continuum and its implications for carbon storage, particularly in fragmented urban forests. Most studies to date have focused on isolated snapshots of microbial diversity and function [12], often neglecting the spatial gradients and connectivity that define the continuum [13]. For example, Anthony et al. [14] focused on the relationship between fungal community composition and forest carbon storage across European forests, highlighting the role of fungal diversity in tree growth and carbon accumulation. Manson-Jones et al. [15] reported that microbial carbon storage through triacylglycerides (TAGs) and polyhydroxybutyrate (PHB) in soil could be correlated with biomass growth and resilience to environmental changes. These findings encourage the recognition of microbial storage synthesis as a key pathway of biomass growth. Furthermore, the mechanistic links between changes in the microbiome continuum and shifts in soil carbon pools are not well established, with few studies integrating life cycle microbial data with direct measurements of carbon storage and turnover [16]. There is also a lack of research exploring how specific microbial taxa or functional groups contribute to carbon stabilization or loss under varying degrees of habitat connectivity [17]. Additionally, the feedback mechanism between altered microbiome structure, soil physicochemical properties, and aboveground vegetation dynamics in fragmented landscapes is poorly understood. Given these gaps, a comprehensive understanding of how urban forest fragmentation influences the soil microbiome continuum and its subsequent effects on carbon sequestration is urgently needed in the context of ongoing global changes. The soil microbiome continuum drives biogeochemical processes that regulate soil carbon dynamics [18]. The living microbiome, through its metabolic activities [19], mediates the decomposition of organic matter [20] and the transformation of plant-derived inputs into stable soil organic carbon [21]. Microbial necromass, formed from the turnover of microbial cells, constitutes a substantial and persistent fraction of soil organic matter, contributing significantly to long-term carbon storage [22]. Fragmentation-induced disruption of the microbiome continuum may alter the balance between these components, affecting both the rate and stability of carbon sequestration in urban soils.
This study addresses these critical gaps by investigating how urban forest fragmentation shapes soil microbial diversity patterns and their consequent influences on soil carbon sequestration potential. Specifically, this study aims to (1) characterize the soil microbial diversity continuum across urban forest fragments; (2) assess relationships between microbial diversity continuum metrics and soil carbon fractions across the fragmentation gradient; and (3) establish predictive relationships between microbial indices and carbon sequestration potential in fragmented urban forests. Fragmentation-induced disruption of the soil microbiome continuum affects long-term carbon sequestration capacity by altering the balance between microbial biomass production, mortality, and necromass stabilization processes that govern soil organic carbon accumulation and stability. By advancing our understanding of the soil microbiome continuum and its response to fragmentation, this study contributes to evidence-based strategies for urban forest management, with implications for climate change mitigation and urban ecosystem sustainability.

2. Materials and Methods

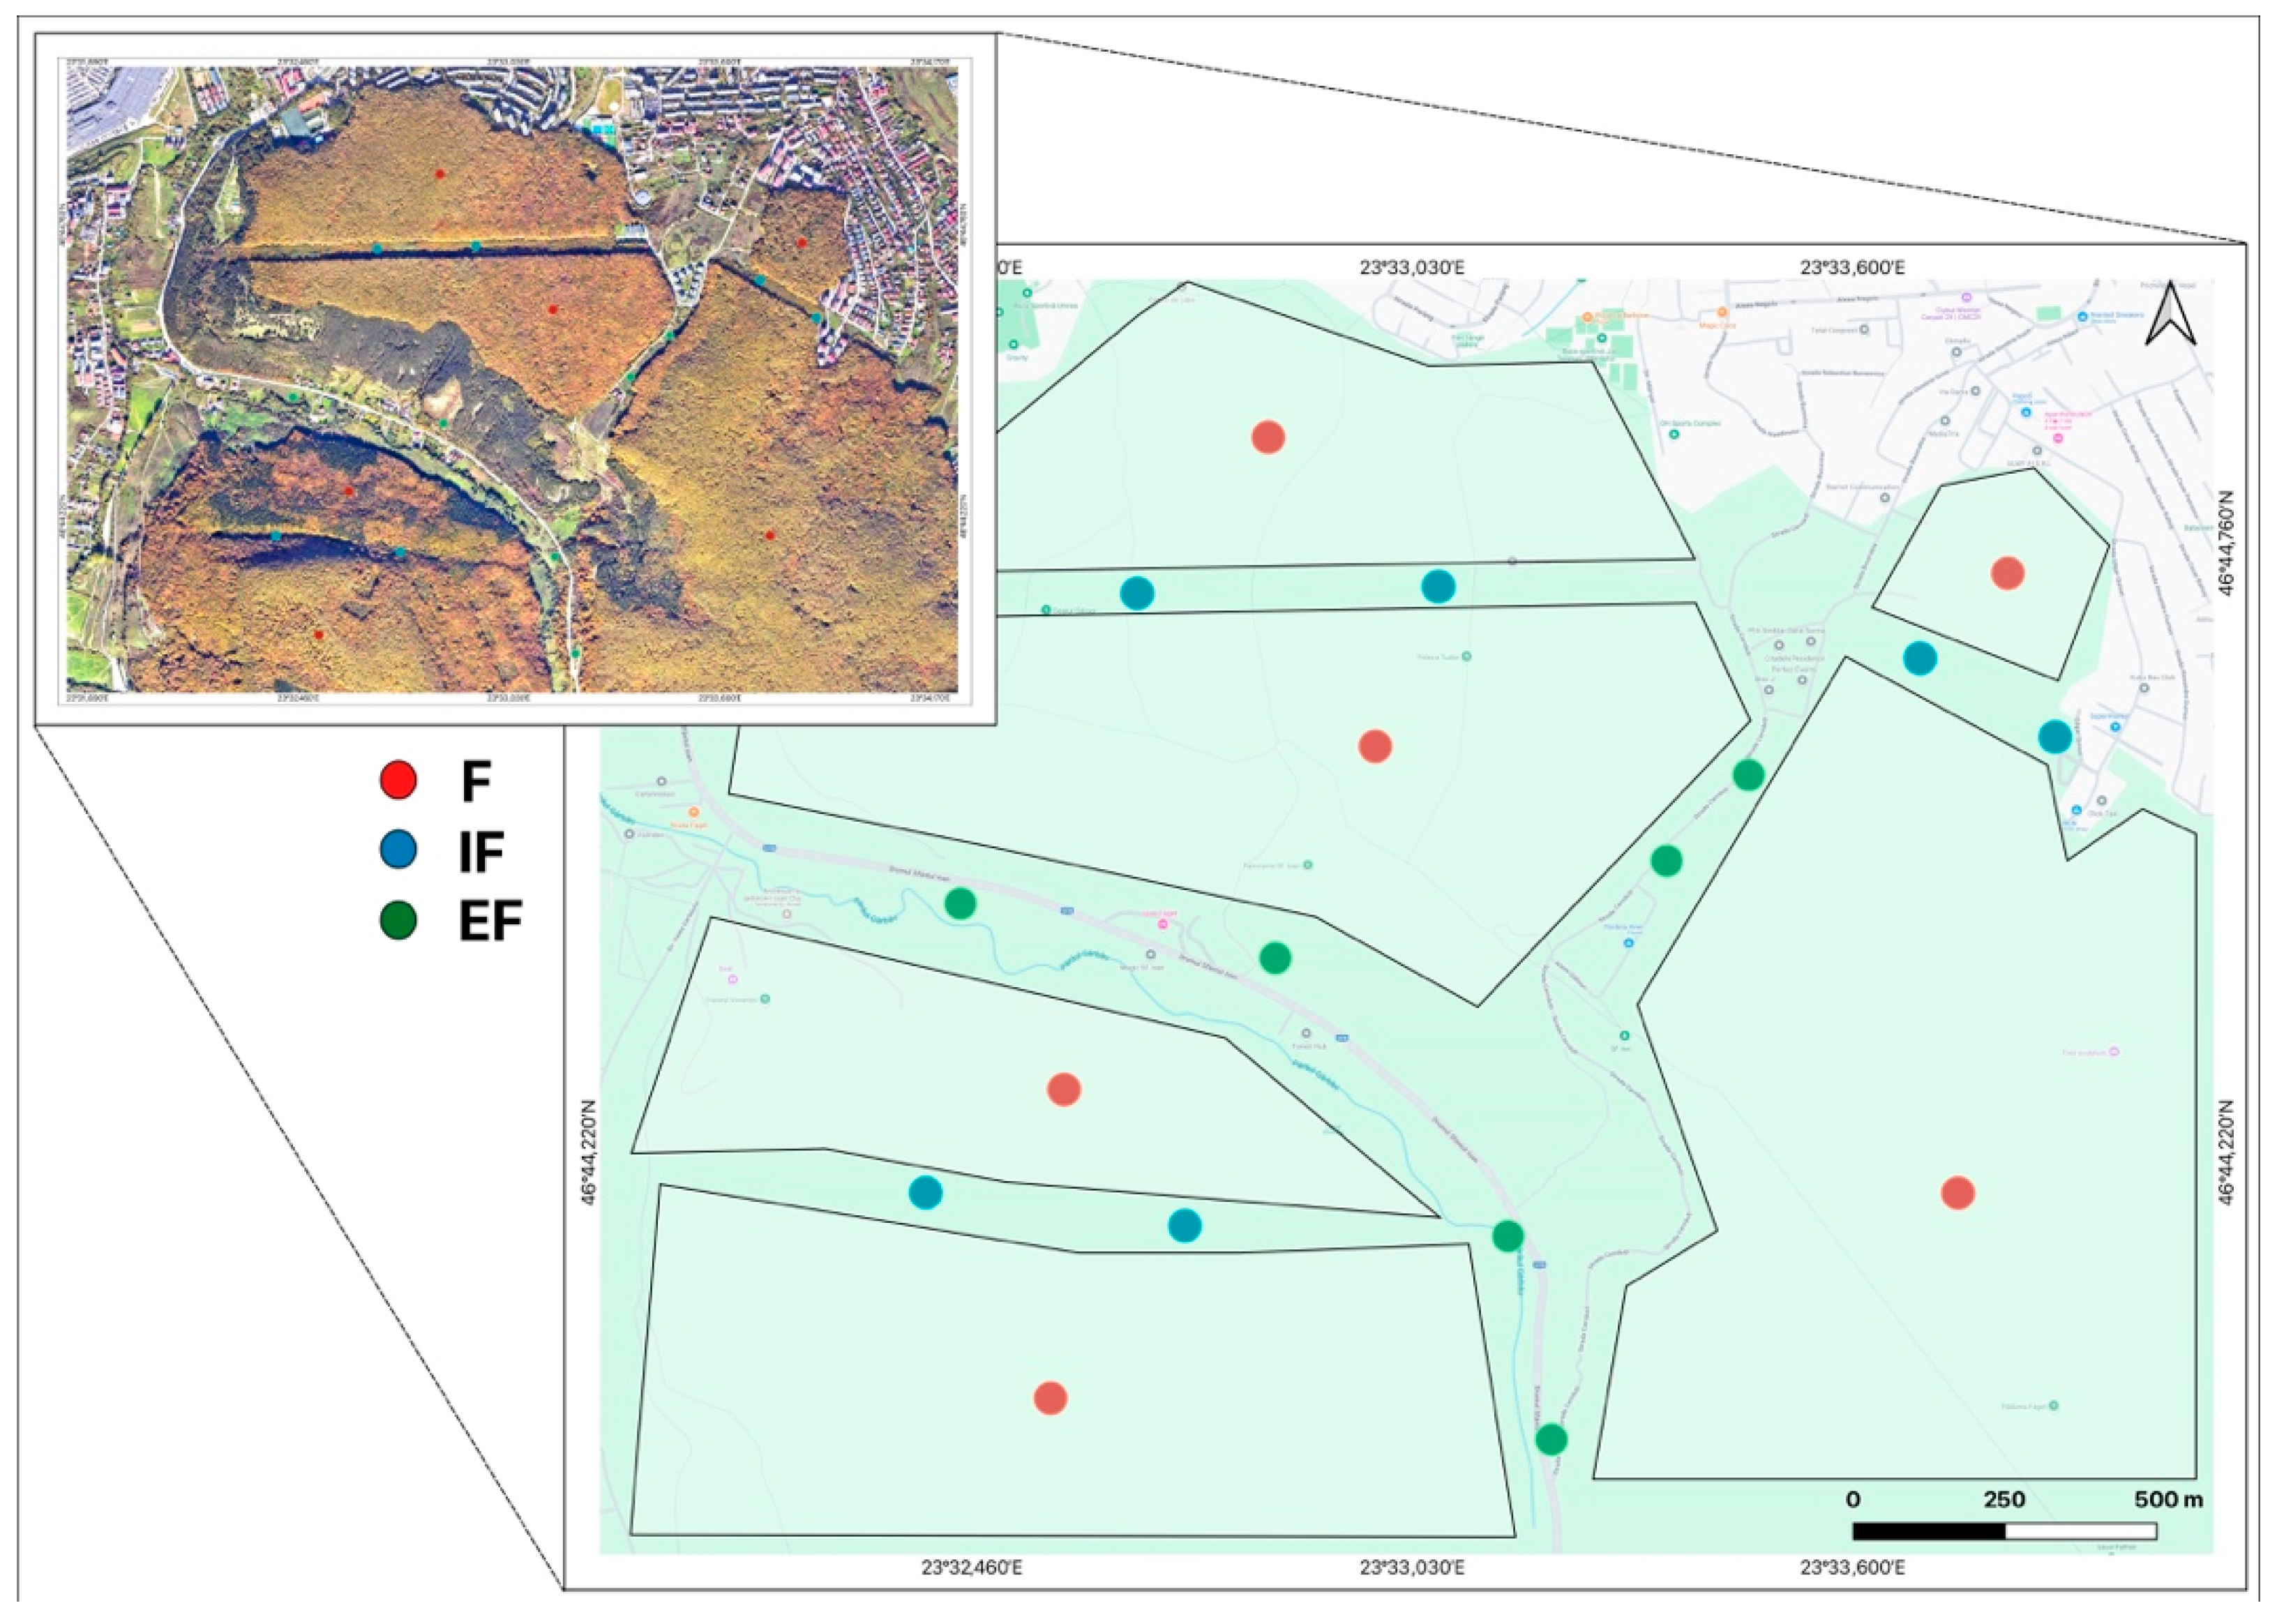
2.1. Sampling Site Description and Sampling Strategy

This study was conducted in Faget Forest (46°44′15″ N, 23°33′09″ E), which is located in the southern part of Cluj-Napoca in the northwestern part of Romania. Over the past few decades, Cluj-Napoca has experienced rapid demographic growth and an unprecedented outwards expansion of its urban boundary. Accelerated residential and infrastructure development has progressively intruded upon the forest margin; new roads and bypass corridors now intersect previously continuous woodlands (Figure 1).
The soil is classified as a calcaric leptosol according to the World Reference Base (WRB). The climate is continental, with an average temperature of 8.2 °C and moderate rainfall, with an annual average of 600–700 mm. The forest contains stands of beech (Fagus sylvatica) and sessile oak (Quercus petraea) mixed with oak (Quercus robur) and hornbeam (Carpinus betulus). Soil sampling was conducted in the early-autumn rewetting period after the main litterfall occurred in 2024. This period, after the first rains that followed peak litterfall, allowed us to obtain a snapshot of (a) microbial communities that were still metabolically active, yielding robust PLFA data, and (b) fresh plant residues and root exudates fueling a surge of necromass production, allowing us to trace how the chemistry of these products feeds directly into soil organic carbon stabilization. In total, 18 plots (10 m × 10 m) were selected from three different fragment types: forest (F), internal forest path (IF), and external forest path (EF). For each plot, five composite samples were collected according to the Lucas methodology. At each sampling point, the samples were collected from three layers at depths of 0–10 cm, 10–20 cm, and 20–30 cm. The samples were stored at 4 °C until arriving at the laboratory, after which they were divided into two parts: one part was maintained at 4 °C until physicochemical analysis, and the second part was maintained at −80 °C until microbiological analysis.

2.2. Assessment of Soil Physicochemical Properties

The soil physicochemical properties in terms of texture, bulk density, pH, and water-extractable ions were determined according to the methods of Kovacs et al. [23]. The soil organic carbon fractions, such as total soil organic carbon (SOC), readily oxidizable organic carbon (ROC), non-readily oxidizable organic carbon (NROC), and labile C, were also assessed. We used the KMnO4 chemical oxidation method on 10 g of air-dried ground soil samples as described by Zhang et al. [24]. According to this method, the difference between the SOC and ROC concentrations was calculated as the soil NROC concentration, while the ratio of ROC to NROC indicated the C lability.

2.3. Microbial Diversity and Phenotypic Approach

The microbial phenotypic structure abundance was determined according to the phospholipid-derived fatty acid (PLFA) approach detailed by Kovacs et al. [25] and Kovacs et al. [26]. The following microbial diversity indices were considered in this work: the Shannon–Wiener diversity index, Pielou evenness index, Margalef richness index, and Simpson dominance index. They were determined on the basis of the PLFA profile as described by Zhao et al. [27], who applied the following Equations (1)–(5):
Shannon–Wiener diversity index:
H =   i = 1 S P i   · ln P i
Pielou evenness index:
J =   H / H m a x
H max = ln S
Margalef richness index:
S R =   S 1 ln N
Simpson dominance index:
λ =   P i 2
where Pi is the proportion of individuals in group i in the community; S is the total number of microbial PLFAs in the community; and N is the number of microbial PLFAs in the community.

2.4. Microbial Necromass Assessment

The soil microbial necromass content was determined through gas chromatography with a flame ionization detector following the entire protocol described by Liang and Balser [28]. The bacterial and fungal necromass C contents were calculated using the measured muramic acid (MurN) and glucosamine (GluN) contents according to Equations (6) and (7):
B a c t e r i a l   n e c r o m a s s   C   m g · g 1 s o i l = M u r N   m g · g 1 s o i l · 45
F u n g a l   n e c r o m a s s   C   m g · g 1 s o i l = F G l u N   m g · g 1 s o i l · 9
where F G l u N m g · g 1 s o i l = G l u N m g · g 1 s o i l 2 · M u r N m g · g 1 s o i l 179.2 251.2 . The numbers 179.2 and 251.2 represent the molecular weights for GluN and MurN, respectively, whereas 45 and 9 are conversion factors according to He et al. [29]. Next, the total microbial necromass C was estimated by summing the fungal and bacterial necromass C values.

2.5. Statistical Analysis

Statistical computations were performed in R 4.3.2 (R Core Team, 2024). Graphs were generated with ggplot2. Microbial diversity indices were visualized with violin plots overlaid with median ± interquartile bars using the ggpubr package. Pre-analysis screening was used for normality of residuals using the Shapiro–Wilk test and for homogeneity of variance through the Levene test. For one-way NOVA and repeated-measures ANOVA, the stats::aov function was used. Post hoc pairwise comparisons were conducted using Tukey’s HSD with Benjamini–Hochberg FDR correction. Results with p < 0.05 were considered significant. Community-wide compositional shifts towards abiotic properties were examined through Mantel tests. Bray–Curtis distance matrices of PLFA profiles and necromass signatures were compared with Euclidean distance matrices of abiotic variables (vegan::mantel, 9999 permutations). The Mantel correlation coefficient rM with permutation-based 95% confidence intervals and Mantel p values are reported. The associations between microbial necromass carbon (fungal, bacterial) and microbial biomass (total, bacterial, and fungal) pools were first modelled with ordinary least squares regression (stats::lm). Potential nonlinear responses were examined with a GAM (mgcv::gam, method = “REML”, thin-plate regression splines, basis dimension k = 5). Causal pathways linking abiotic factors, microbial traits, and carbon pools were quantified by applying piecewise structural equation modelling analyses (piecewise SEM v 2.1.2). Individual component models were fitted with lme4::lmer (when random site effects were required) or lm. Shipley’s test of directed separation (Fischer’s C) was used to evaluate the global model fit; additional indices (AIC, RMSEA, CFI, and SRMR) were obtained with the compiled path model. Standardized path coefficients (direct, indirect, and total effects) and their bootstrap 95% CIs (5000 resamples) are reported.

3. Results

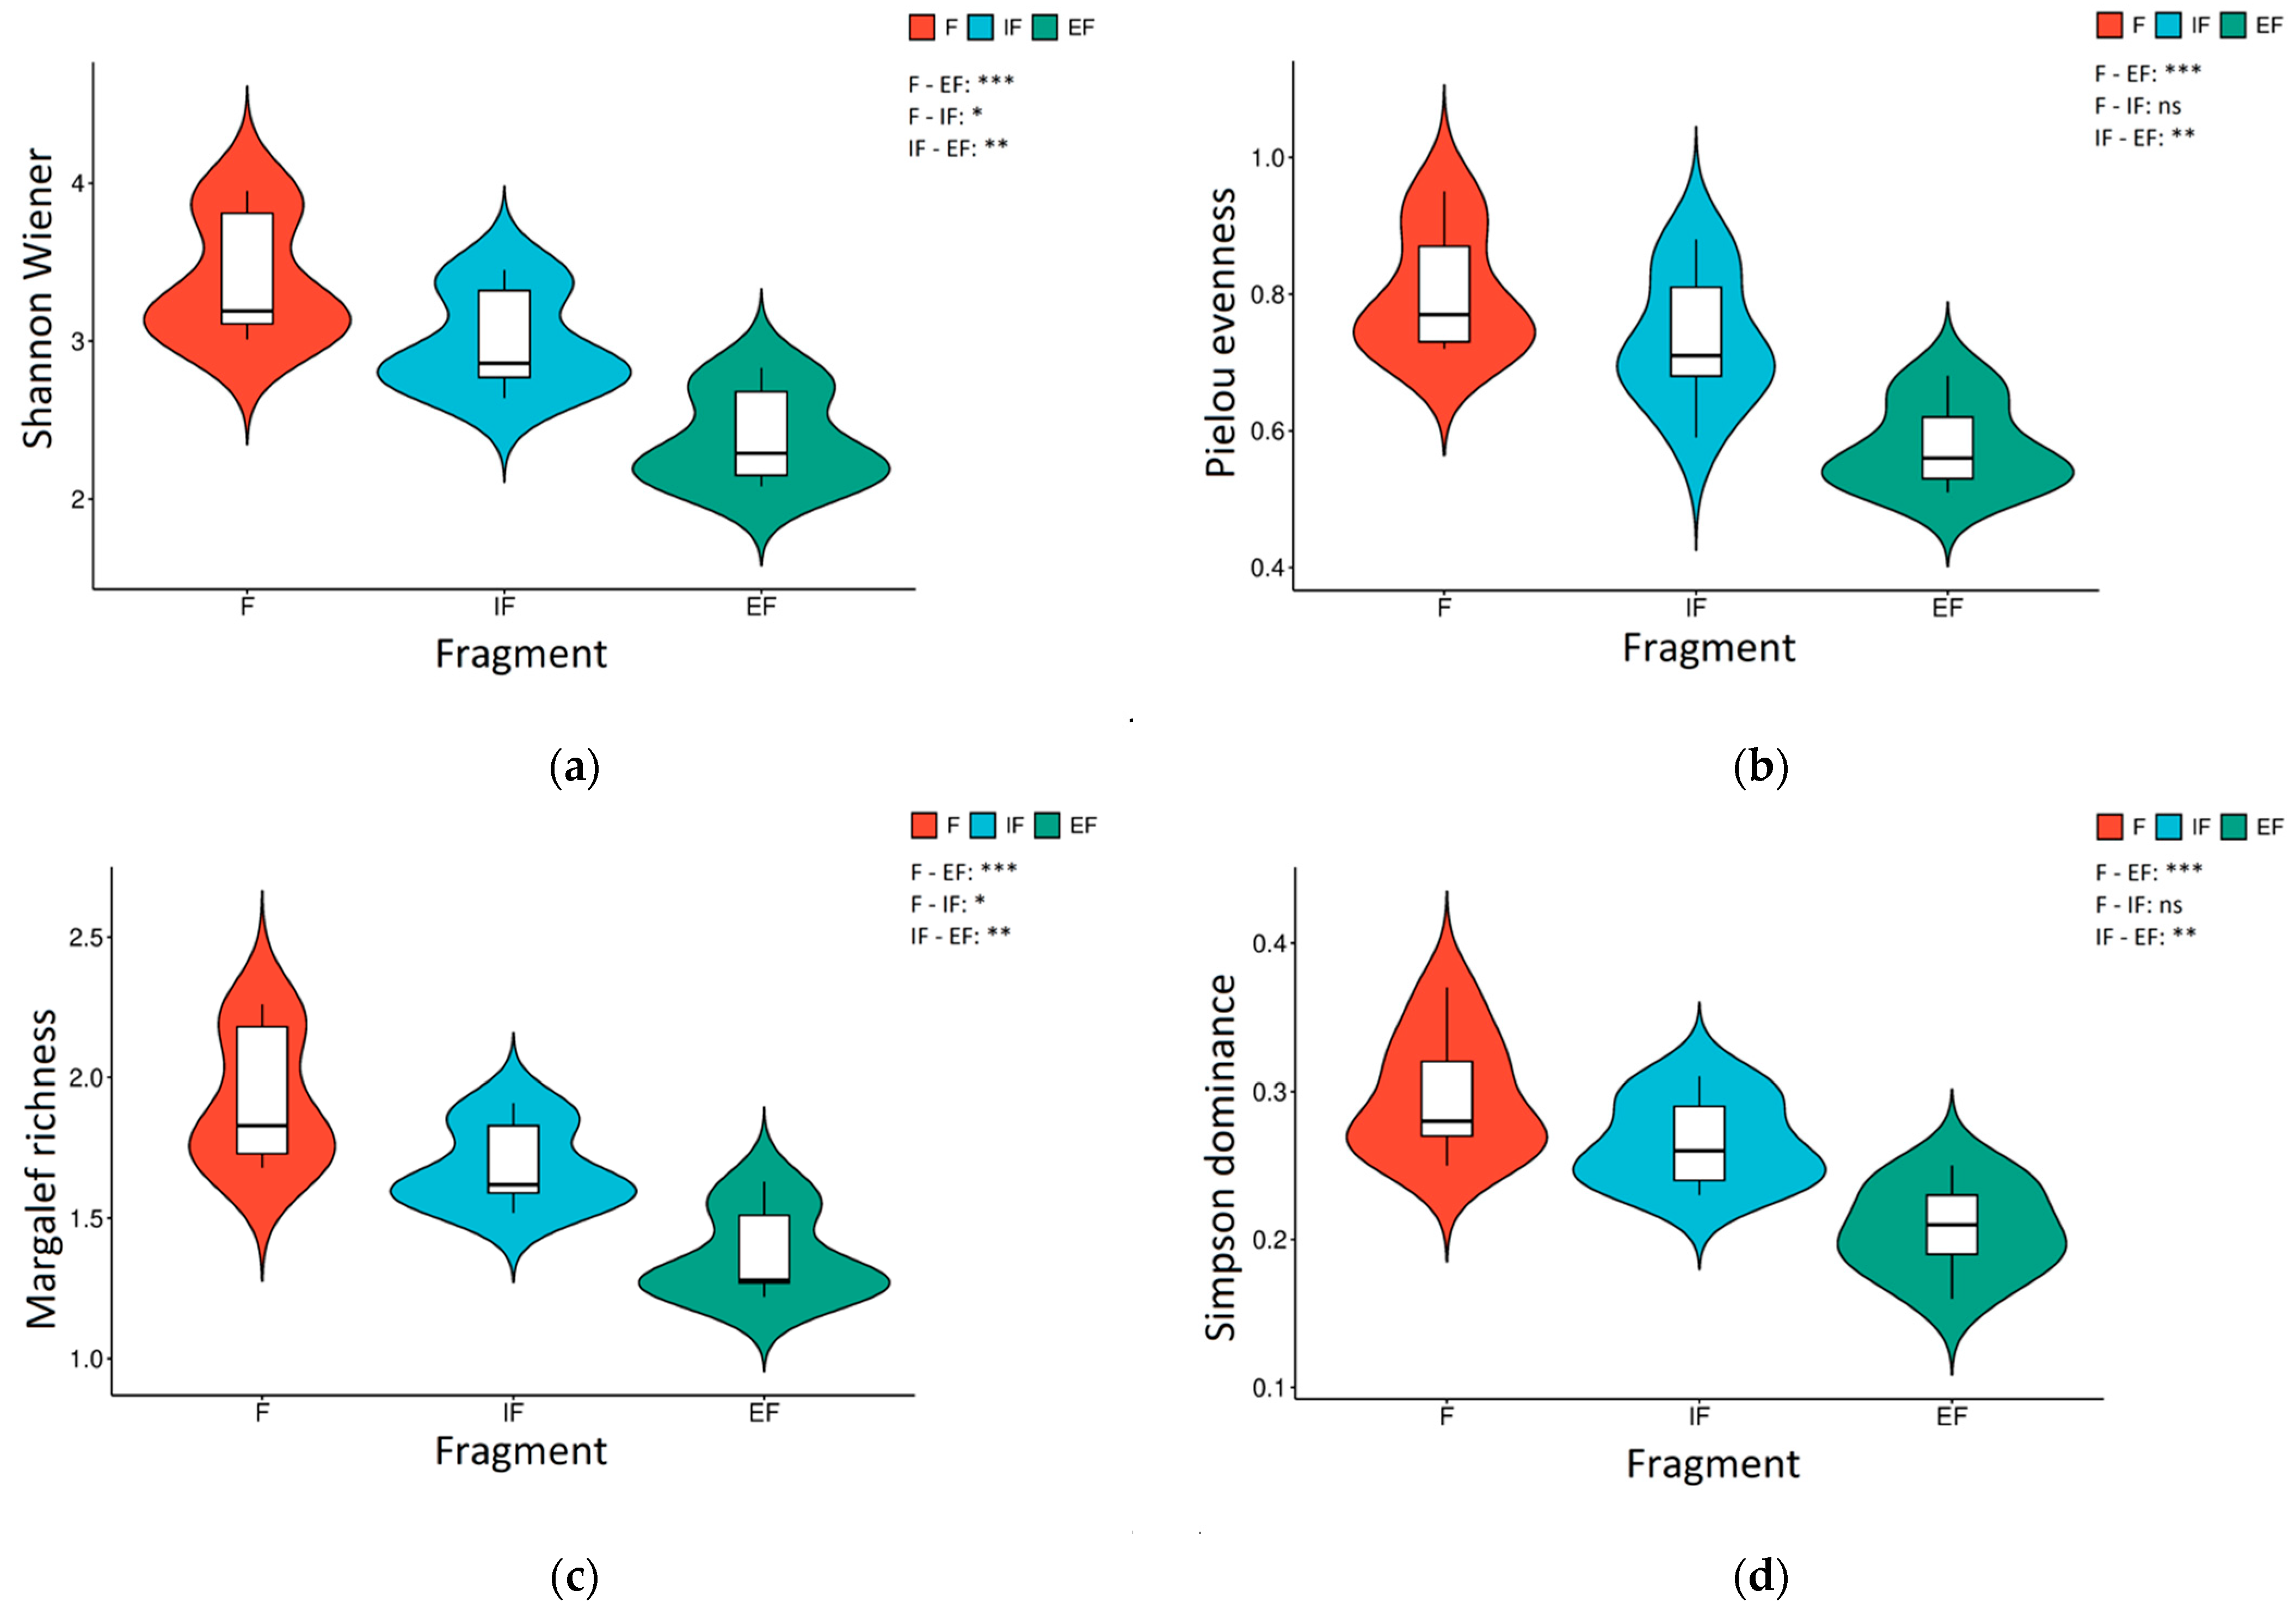
3.1. Microbial PLFA Diversity in Urban Forest Fragment Soil

The violin–boxplot composites (Figure 2) compile phospholipid-derived fatty acid diversity metrics. For each metric, the violin envelope visualizes the kernel-density probability function, whereas the superimposed boxplot identifies the median and interquartile range. One-way ANOVA followed by pairwise contrast between fragments (F vs. IF; F vs. EF; and IF vs. EF) was applied to each index to test fragment-dependent differences. The Shannon–Wiener index (Figure 2a) revealed a clear gradient, with the highest diversity observed in the forest interior (F) and the lowest diversity in the forest external path (EF). Statistical significance is indicated between all pairs, with the most pronounced difference between F and EF (p < 0.001). In Figure 2b, the Pielou evenness index was compared across the same fragments. The forest (F) and internal path (IF) fragments support greater evenness, whereas the external path shows a marked reduction. Pairwise comparisons revealed significant differences between F and EF (p < 0.001) and between IF and EF (p < 0.01) but not between F and IF (p = 0.216). In the case of the Margalef richness index (Figure 2c), the forest fragment had the highest richness, with a stepwise decline through the IF and EF fragments. All pairwise comparisons are statistically significant, highlighting a clear loss of species richness as one moves from the forest interior to the edge. The violin and boxplot combination illustrates both the distribution and central tendency, reinforcing this. The forest interior (F) and internal path (IF) had higher dominance values than the external path (EF), with the lowest dominance observed in the EF (Figure 2d). The statistical analysis revealed significant differences between F and EF (p < 0.001) and between IF and EF (p < 0.01) but not between F and IF (p = 0.14).

3.2. Microbial Continuum Characteristics in Urban Forest Fragment Soil

The soil microbiome abundance in forest fragments ranged from 85.1 to 214.6 nmol⋅g−1 dry weight soil, as determined by phospholipid-derived fatty acid (PLFA) analysis. Table 1 shows significant quantitative variation in microbial phyla across forest fragments and soil depth gradients. Repeated-measures ANOVA demonstrated that depth-dependent variations (p < 0.05) were particularly pronounced for bacterial phylum abundance, whereas other phenotypic groups presented vertical homogeneity. Forest fragmentation effects were evaluated by one-way ANOVA, which revealed the strongest statistical significance in the surface layers for the microbial abundance, bacterial phyla, and fungal phyla PLFA biomarkers (p < 0.01), with decreasing significance at greater depths. Compared with the external forest path (EF), the forest fragment (F) soil sample microbiome presented greater variability. The microbial abundance variability was approximately seven times greater in the F treatment than in the EF treatment. Fungal abundance variability was five times greater in F than in EF, whereas bacterial abundance variability was three times greater in F than in EF. The median microbial abundance values revealed spatial heterogeneity, with an F > IF > EF spatial gradient pattern. Bacterial dominance was observed in all the forest fragments, and the F/B ratio averaged over each fragment varied in the range of 0.17–0.12. Table S1 shows that, in the bacterial phyla, the abundance of Gram-negative bacteria represented approximately 35%, followed by aerobic (17%) and Gram-positive (16%) bacteria. The Gram-positiveGram-negative bacteria ratio ranged between 0.44 and 0.52, with an average of 0.5, whereas the ratio of Aerobe–Anaerobe bacteria was between 1.7 and 2.7, with an average value of 2.2. Statistically significant differences in bacterial community abundances were observed both with forest fragment type (p < 0.05) and with soil depth (p < 0.05, Table 1). The abundances of Gram-positive bacteria (p < 0.001), aerobic bacteria (p < 0.001), sulfate-reducing bacteria (p < 0.01), and nitrate-reducing bacteria (p < 0.01) differed significantly between forest fragments, especially in the top layers (0–15 cm). The abundance of Gram-negative and anaerobic bacteria did not significantly differ between the studied forest fragments, although the abundance decreased with depth (Table S1, Supplementary Materials). In the case of Gram-negative bacteria, a significant decrease in abundance with depth was observed in the case of the EF path (p < 0.05), whereas in the case of anaerobic bacteria, the abundance decreased significantly (p < 0.05) with layer depth in the cases of F and IF. The abundance of methanotrophs was not significantly different between the studied biomes or with depth (Table S1, Supplementary Materials).
As with bacteria, fungal phyla display significant fragmentation effects, with F maintaining consistently elevated abundance across all depth levels (Table 1). Although fungal phyla were determined to be less abundant than bacterial phyla, their abundance varied significantly across the studied fragments in all the soil layers (p < 0.05) and not significantly with depth in the case of all the fragments (p > 0.05). The average abundance of ectomycorrhizal fungi accounted for 31% of the total fungal abundance, followed by the abundances of arbuscular mycorrhizal fungi (26%) and saprotrophic fungi (19%) (Table S1, Supplementary Materials). The abundance of arbuscular mycorrhizal and ectomycorrhizal fungi significantly differed between forest fragments (p < 0.05), but no statistically significant differences were detected with depth. Saprotrophic fungal abundance was not significantly different between the forest fragments and the soil layers. Considering other PLFA biomarkers, such as microeukaryotes and aerobic prokaryotes, significant differences between fragments (p < 0.001) and depth (p < 0.05) were identified in the case of microeukaryotes, in contrast to aerobic prokaryotes, where no statistically significant difference in detected abundance among samples was observed (Table S1, Supplementary Materials).
The total microbial necromass varied from 11.3 to 23.2 g⋅kg−1; 55% represented fungal necromass, whereas 45% represented bacterial necromass. Instead of living microbial biomass, the microbial necromass was more heterogeneous in EF and more homogenous in F (Table 2). Repeated-measures ANOVA revealed depth-dependent variations in total microbial necromass from F (p < 0.05) and EF (p < 0.01) fragments, whereas significant depth-dependent variations in fungal necromass (p < 0.001) were observed only in the case of F fragments. The influence of forest fragmentation on necromass was observed only in the case of bacterial necromass (p < 0.05) in the first layer of soil (0–15 cm).

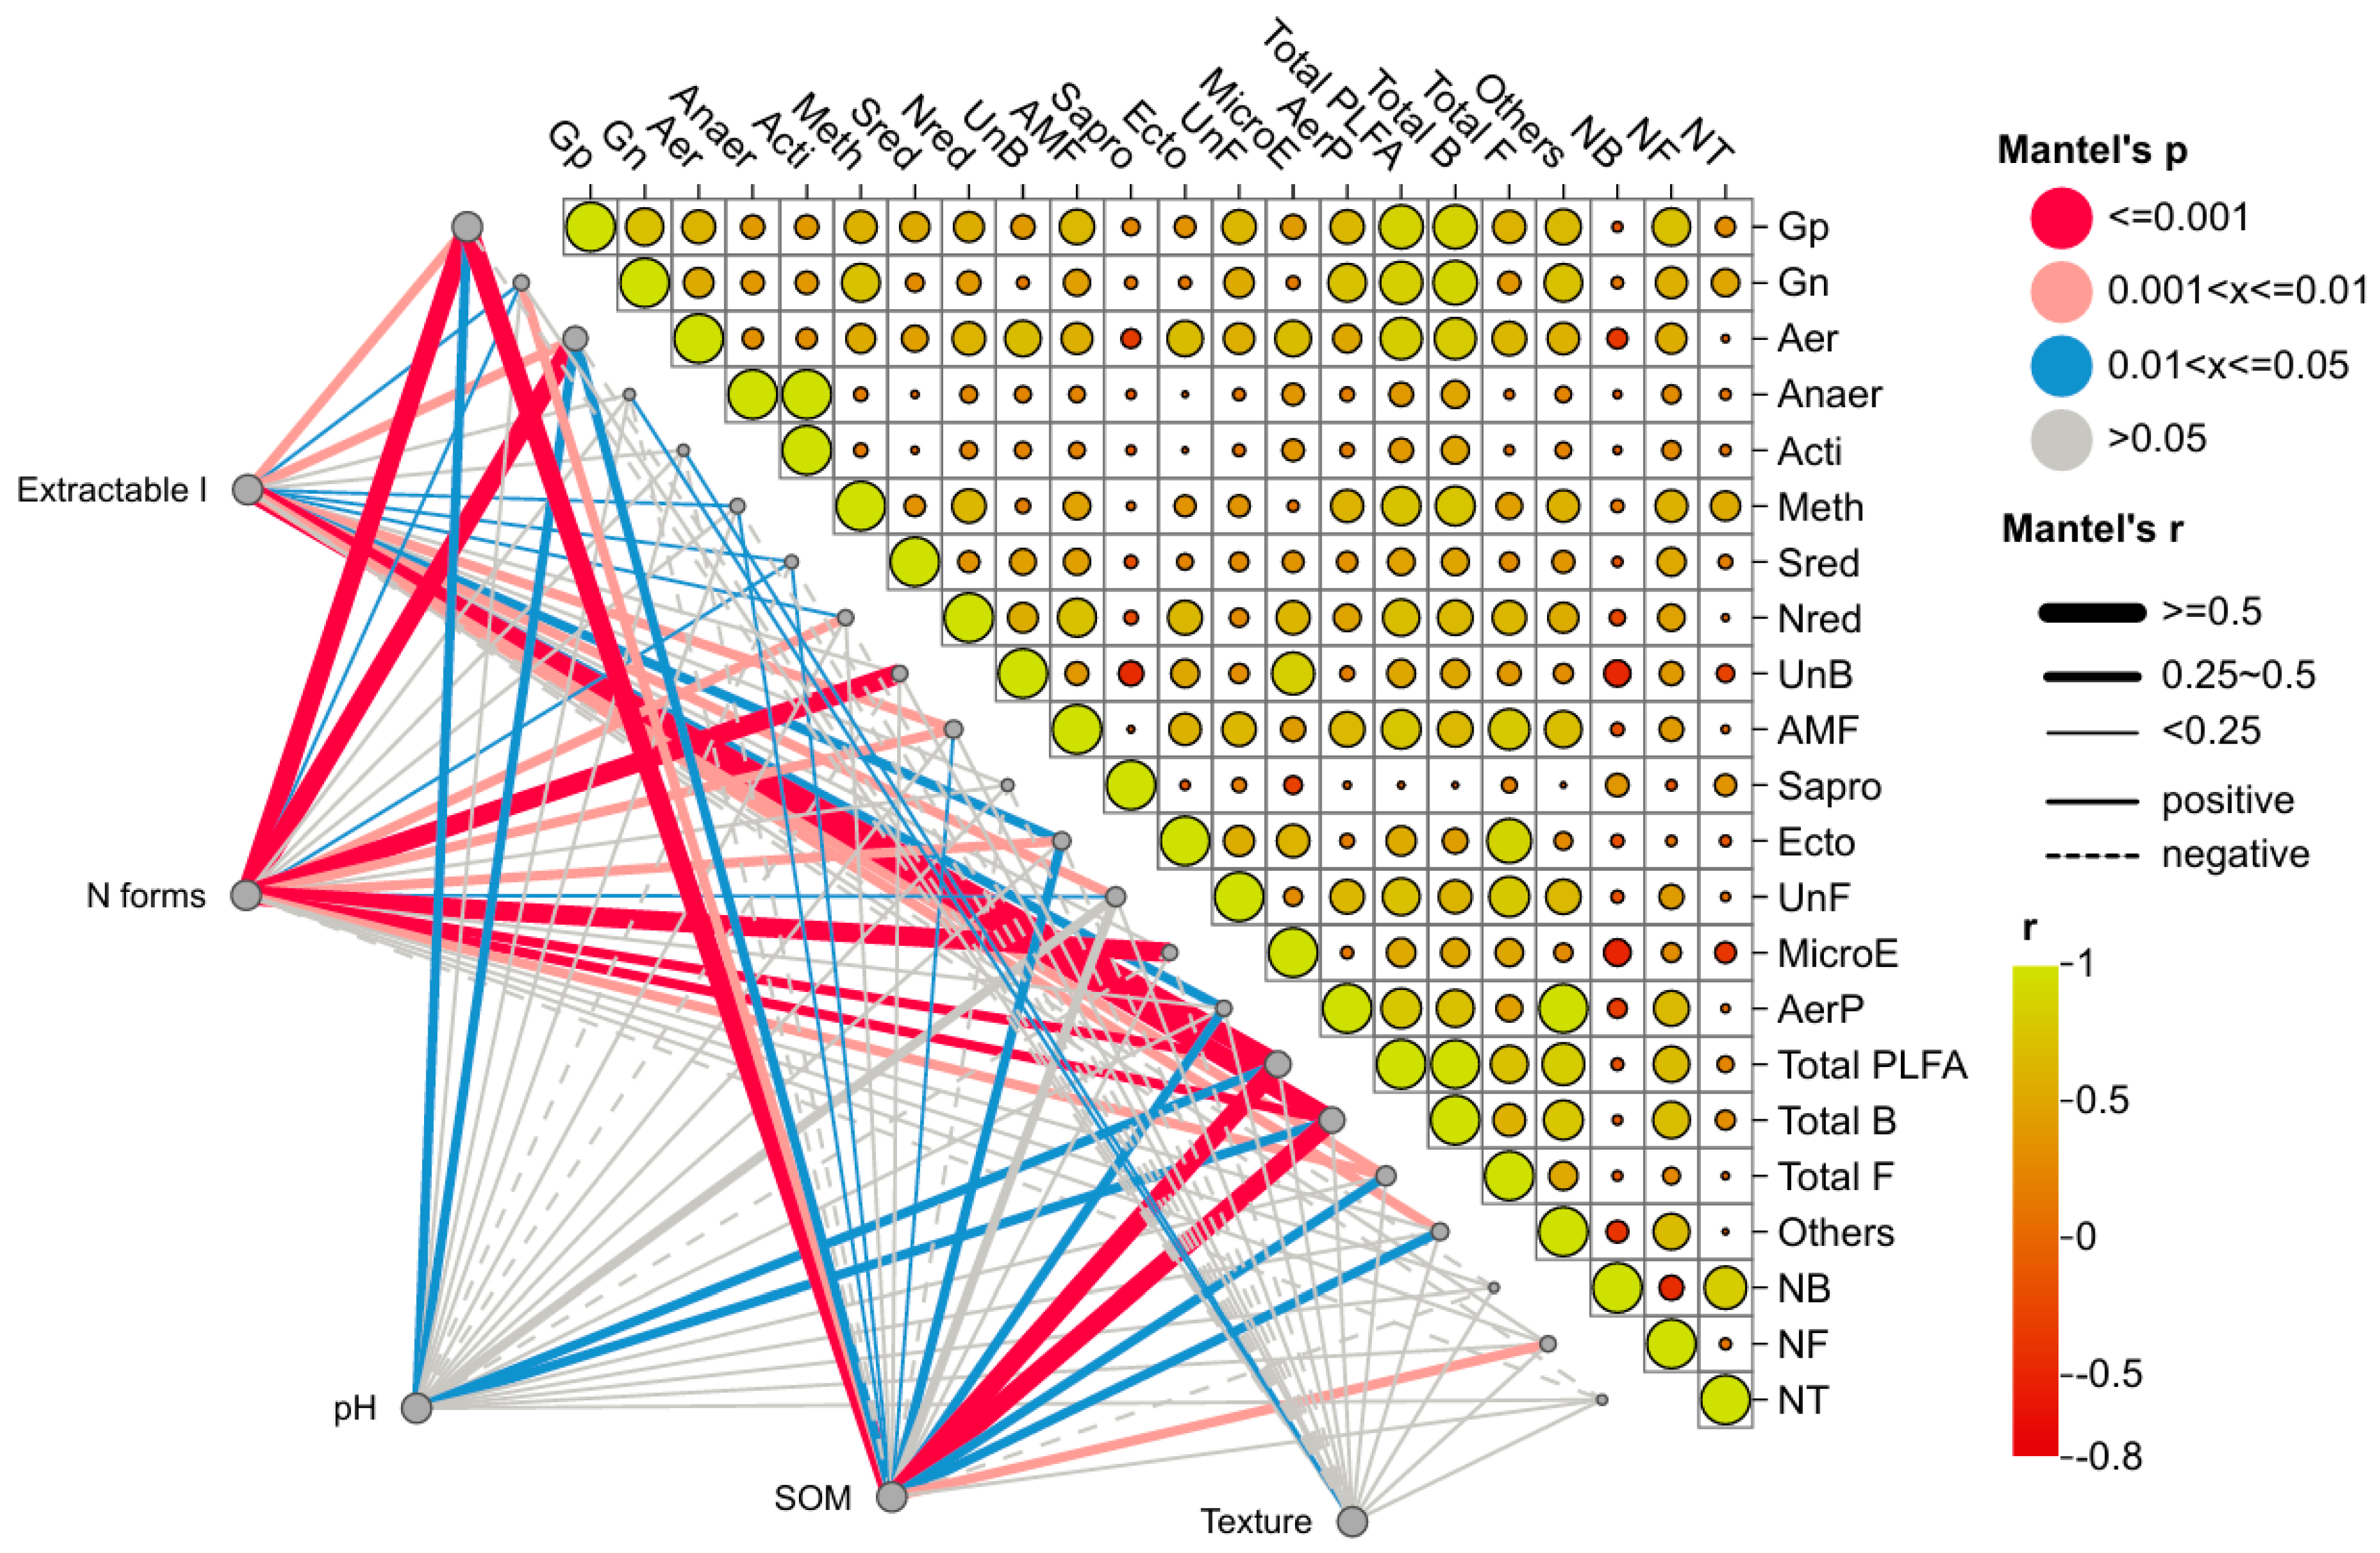
3.3. Abiotic Properties of Forest Fragments Affect the Soil Microbial Continuum

The Mantel correlation network analysis between the soil biotic and abiotic properties is presented in Figure 3. This reveals distinct patterns of association, with correlation coefficients (r) ranging from −0.03 to 0.975 (p < 0.001). The abiotic properties were positively correlated with the living microbiome, whereas the microbial necromass was negatively correlated with the living microbiome. Soil organic matter emerged as a significant predictor of microbial community abundance, showing a positive correlation with total microbial abundance (0.59, p < 0.001), especially for bacterial phyla (0.61, p < 0.001).
The soil microbiome phenotypic structure is shaped by the soil organic matter content, with a significant positive correlation in the case of Gram-positive bacteria (0.98, p < 0.001) and a negative correlation in the cases of anaerobic bacteria, actinomycetes, and saprotrophic fungi. Minimal influence was identified between the soil organic matter content and the sulfate- and nitrate-reducing bacterial phenotypes. Nitrogen forms (NH4+, NO3-, and N) demonstrated the second strongest correlations within the microbial continuum. The analysis revealed that the microbial community, mainly the bacterial phyla, was positively correlated (0.48, p < 0.001), whereas a negative correlation was observed with the microbial necromass. A significant positive correlation was observed between N forms and aerobic (0.63, p < 0.001) and Gram-positive bacteria (0.54, p < 0.001), as well as with microeukaryotes (0.6, p < 0.001). The quantitative presence of various nitrogen forms did not influence the abundance of anaerobic bacteria, actinomycetes, or saprotrophic fungi. The levels of extractable ions, such as calcium, potassium, magnesium, chlorine, and sodium, were significantly positively correlated with microbial abundance (0.55, p < 0.001) and negatively correlated with the microbial necromass. Among the bacterial phyla, a slightly positive correlation was detected for the aerobic (0.5, p < 0.01) and Gram-positive (0.39, p < 0.01) bacterial groups. Arbuscular mycorrhizal fungal abundance presented a significant correlation with extractable ions (0.43, p < 0.01), followed by ectomycorrhizal fungal abundance, with a moderate correlation (0.3, p < 0.05). The soil pH was slightly positively correlated with the microbial biomass (0.33, p < 0.05), especially with the bacterial phyla (0.3, p < 0.05). In contrast, the soil texture, such as the clay, silt, and loam contents, did not significantly impact the total abundance of the soil microbiome. The Mantel correlation matrix revealed negative correlations between soil texture and bacterial phenotypic groups, such as Gram-positive, aerobic, methanotrophic, and sulfate- and nitrogen-reducing bacteria. Among the fungal phyla, saprotrophic and ectomycorrhizal fungal abundances were negatively correlated with soil texture, whereas arbuscular mycorrhizal fungal abundance was not influenced.

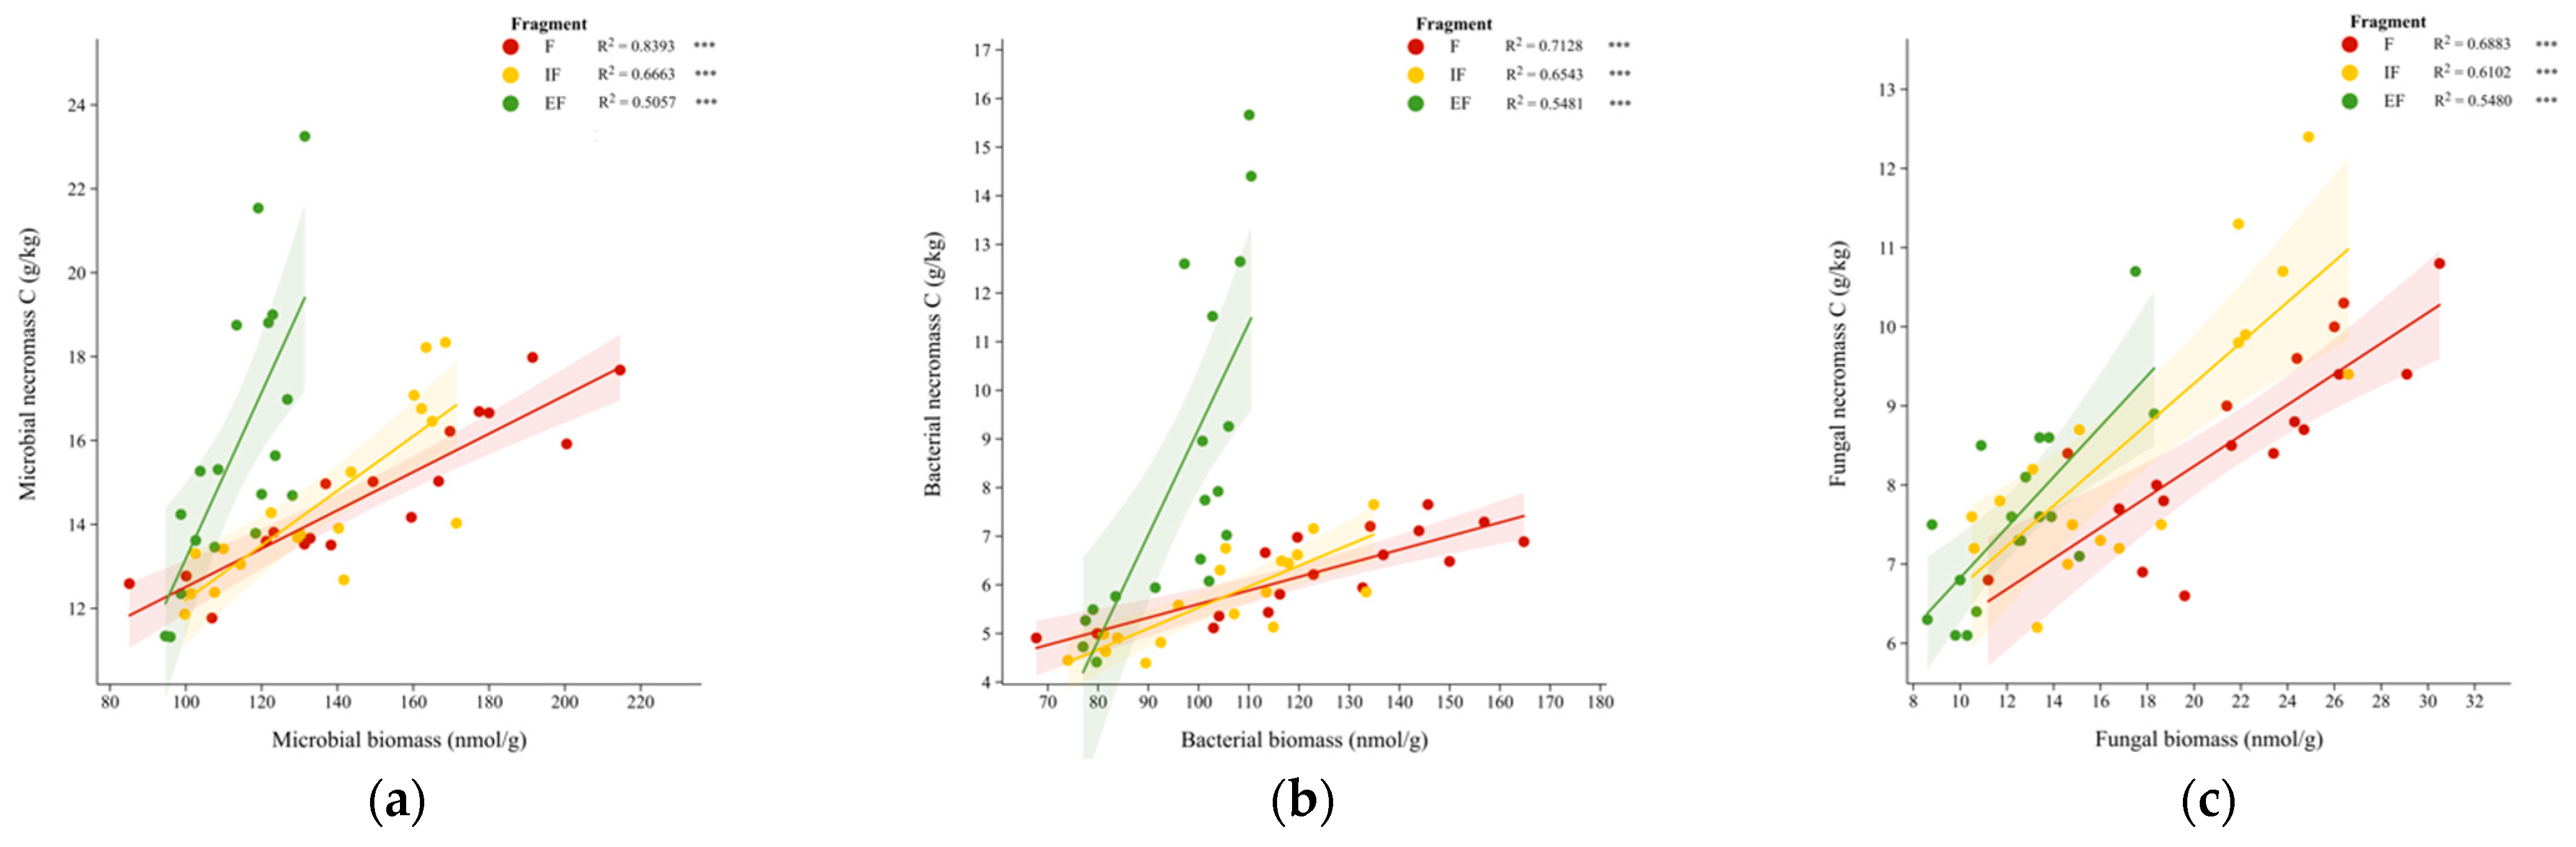
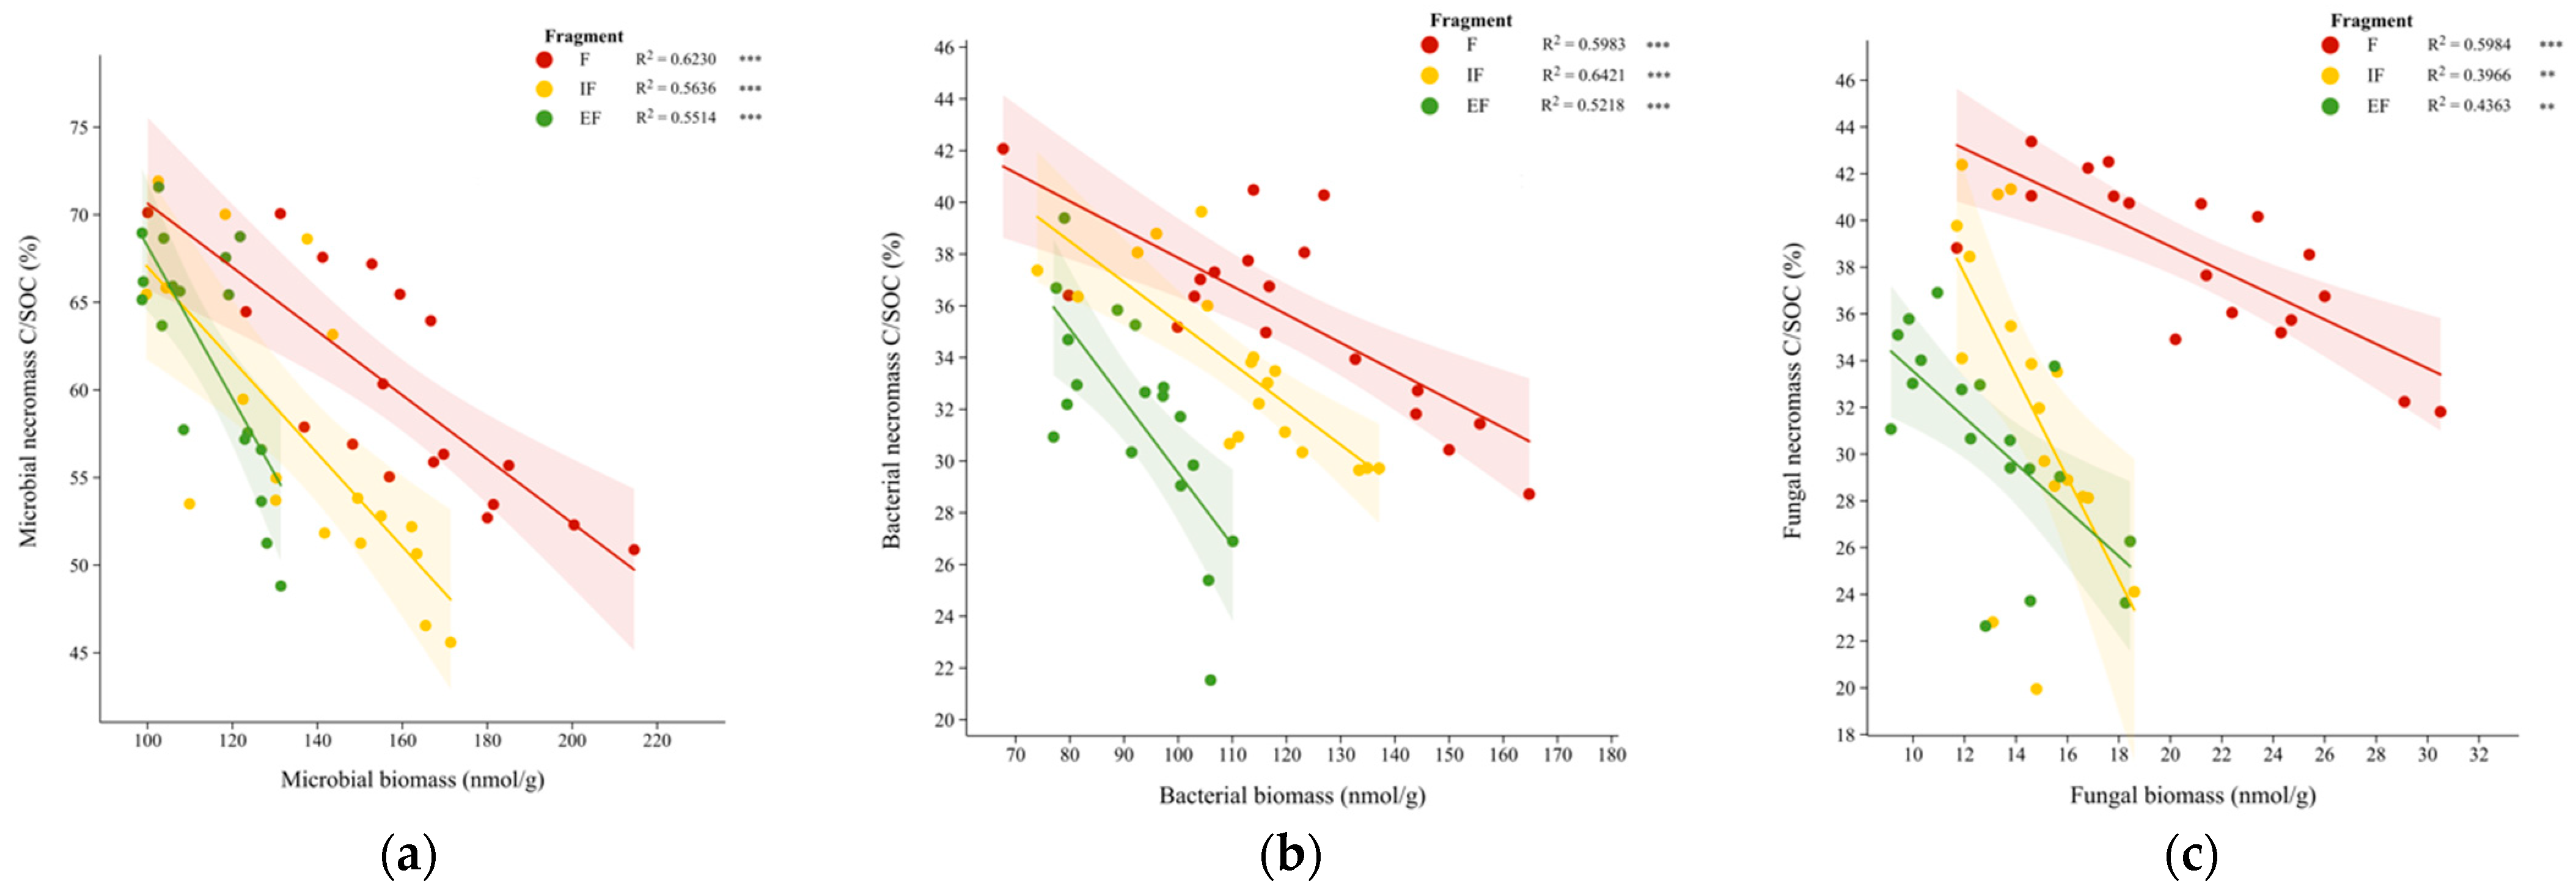
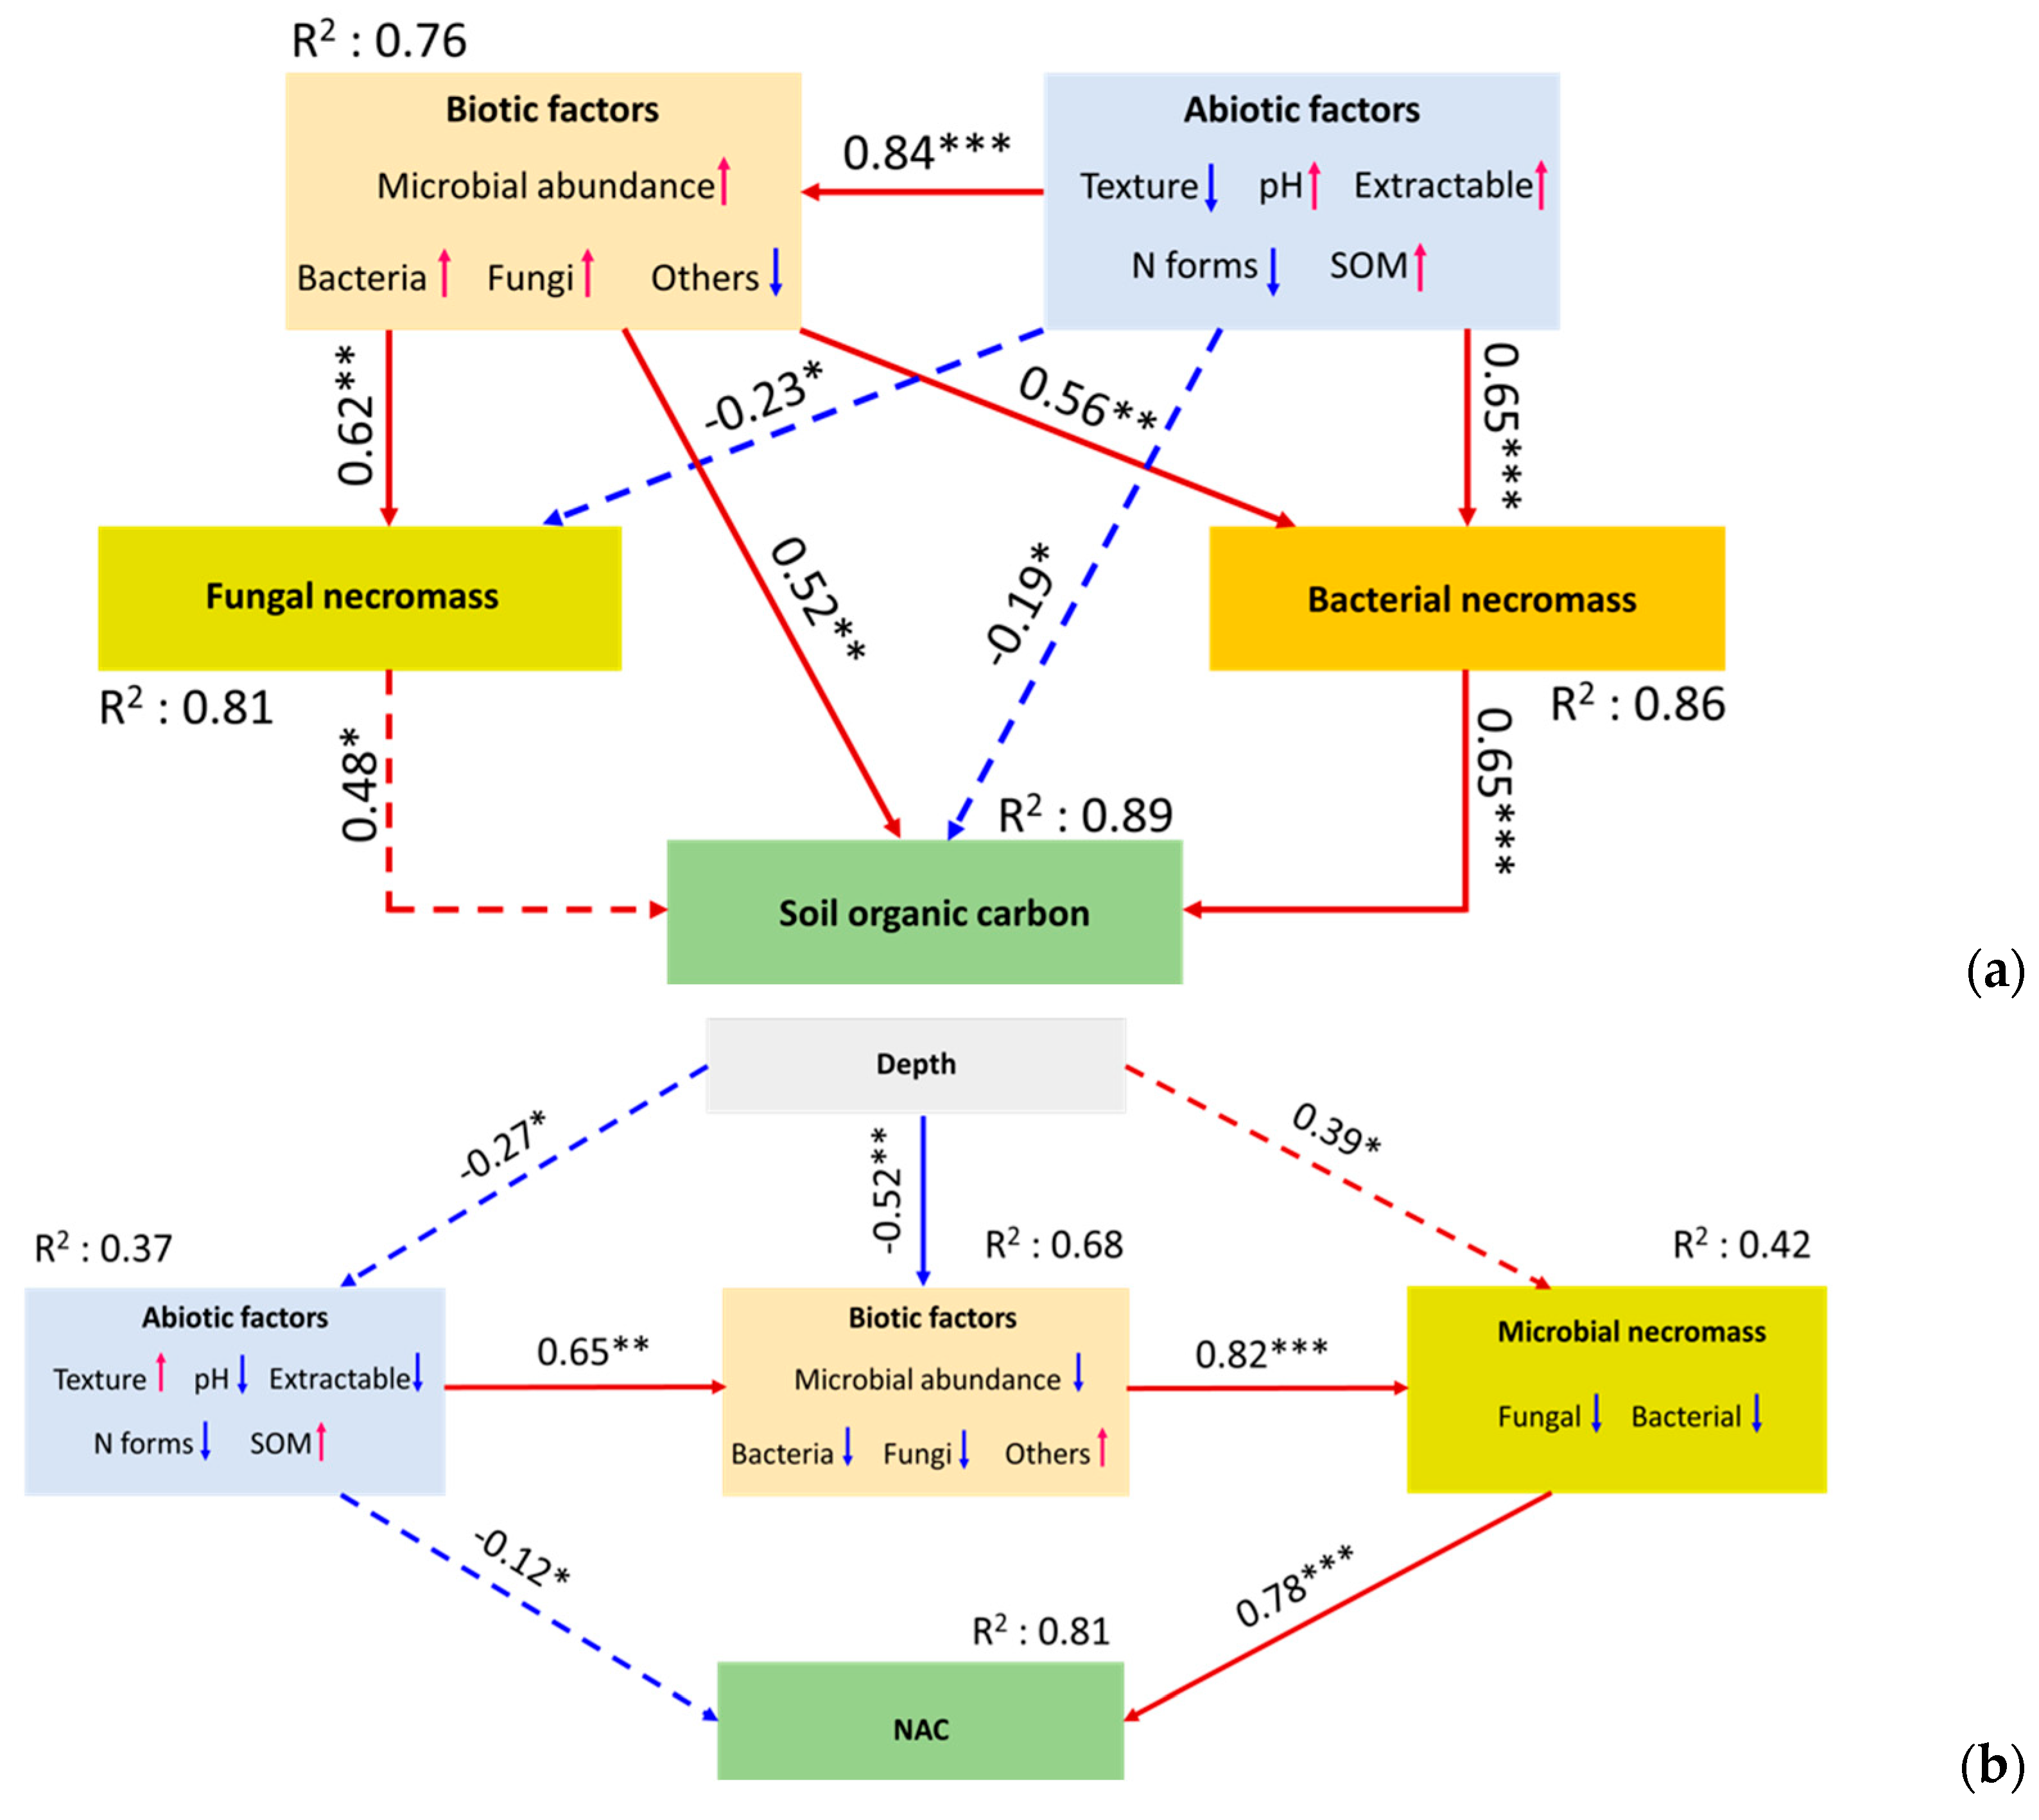
3.4. Microbial Continuum Control over Soil Organic Carbon in Forest Fragments

The carbon pool datasets, including the SOC, ROC, NROC, and labile C samples along forest fragment gradients, such as F, IF, and EF, are detailed in Table S2, Supplementary Materials. Within each carbon fraction, the amount reveals progressive depletion from F > IF > EF. Figure 4 shows statistically significant, fragment-specific positive linear relationships between living microbial abundance and microbial necromass carbon. In all the cases, the F fragments demonstrated the highest degree of regression stability, as indicated by the most significant R2 values (total microbial: R2—0.839; bacterial: R2—0.713; and fungal: R2—0.688; p < 0.001). The tight clustering was reflected in the narrowest 95% confidence intervals (CIs), suggesting a highly consistent and predictable relationship between living biomass and necromass carbon within these fragments. The IF fragments displayed moderate R2 values (0.61–0.67) and a corresponding increase in data dispersion, as seen in the broader CI bands. EF is characterized by the lowest R2 values (0.51–0.55), steepest regression slopes, and widest 95% CI. Figure 4a shows that the microbial necromass carbon content is strongly associated with elevated microbial abundance. The correlation between bacterial necromass carbon and bacterial abundance in Figure 4b shows a greater increase in necromass carbon per unit bacterial biomass in EF than in F and IF. The 95% confidence intervals were wider at lower biomass values, especially for EF. For the relationship between fungal necromass carbon and fungal abundance (Figure 4c), the correlation coefficient followed the same pattern, F > IF > EF, as in previous cases.
The relationship between living microbial abundance and the microbial necromass carbon-to-soil organic carbon (SOC) ratio across forest fragments revealed a robust and statistically significant negative correlation, as shown in Figure 5. In Figure 5a, the scatterplot and fitted regression lines indicate that the proportion of necromass C relative to SOC (%) consistently declines across all fragment types as the total microbial biomass increases. The F fragment persistently presented the highest necromass C/SOC ratios throughout the observed biomass gradient, followed sequentially by the IF and EF. The regression models for each fragment are characterized by high coefficients of determination (R2 > 0.55, p < 0.001). Figure 5b shows a pronounced inverse relationship (p < 0.001) between the bacterial necromass C/SOC ratio and bacterial community abundance. The IF fragment has the highest R2 values, whereas the EF fragment has the steepest negative slope and the most significant vertical dispersion, particularly at lower abundance levels. Despite this increased scatter, almost all the data points remained within the 95% confidence intervals, indicating fewer extreme outliers and the reliability of the regression fit. As shown in Figure 5c, the analysis of fungal communities revealed a significant (p < 0.01) negative association between fungal abundance and the fungal necromass C/SOC ratio. The F fragment presented the highest intercept and the lowest slope. In contrast, IF exhibited the most pronounced decrease, whereas EF followed an intermediate trajectory with increased variance at lower biomasses. In all the cases, the residual variance is moderate.
The structural equation model (SEM, Figure 6) shows the multivariate effects of the abiotic and biotic factors on soil organic carbon (Figure 6a) and necromass accumulated carbon (Figure 6b). Red represents a positive correlation, whereas blue represents a negative correlation. The numbers near the arrows represent the standardized path coefficients. R2 denotes the proportion of the variance explained by fixed factors. The “*”, “**”, and “***” labels represent variables that are significant at the <0.05, <0.01, and <0.001 levels, respectively. According to Figure 6a, the contents of soil organic carbon and bacterial and fungal necromass were directly controlled by the soil microbiome and indirectly affected by abiotic factors. Necromass-accumulated carbon (Figure 6b) was directly dependent on microbial biomass and indirectly controlled by abiotic factors and depth. Depth had significant negative effects on abiotic factors and microbial biomass and had indirect negative effects on NAC. The structural equation framework yielded an adequate global fit for both response constructs. In the case of Figure 6a, the comparison between fitted and saturated covariance matrices yielded Fischer statistics of C = 3.3018 with df = 2, producing a nonsignificant probability of misfit (p = 0.191). Consequently, the null hypothesis that the model reproduces of the observed variance–covariance structure cannot be rejected, implying satisfactory specification. The Akaike information criterion (AIC = 668.24) provides the baseline for parsimony-weighted comparisons with alternative soil organic carbon formulations. In the case of SEM for microbial necromass-accumulated carbon (Figure 6b), Fisher’s test produced C = 10.247 with df = 5, bordering the conventional threshold of misfit (p = 0.069) yet still statistically acceptable (p > 0.05). The corresponding Akaike weight (AIC = 1035.28) indicated a greater complexity-adjusted discrepancy than the soil organic carbon counterpart and should be interpreted relative to competing necromass-accumulated carbon candidates. Both models adequately replicate the observed covariance structure, and the soil organic carbon model displays greater parsimony, as evidenced by the AIC, and yields a modestly superior absolute fit.

4. Discussion

4.1. Impact of Forest Fragmentation on the Soil Microbial Continuum

Our results showed that forest fragmentation impacts belowground microbial communities. The conversion of contiguous forests into isolated patches separated by non-forest matrices significantly reshaped the microbial community according to PLFA profiles and microbial necromass-derived amino sugar proxies.
The results show that forest soils (F) harbor the most diverse and functional microbial communities, with external forest paths (EFs) exhibiting the lowest Shannon–Wiener diversity and Pielou evenness (Figure 2). These findings align partly with Ding et al. [30], who observed partial alterations in microbiome diversity post-land fragmentation. In our case, a 28% decrease in PLFA abundance along the F-EF gradient was observed (Table 1), consistent with Gomez et al. [6], who reported bacterial community shifts in transition zones between the Andes and Amazon. Microbial interaction networks tend to become more modular after land conversion [31], aiming to mitigate diversity loss but often disrupting cross-trophic interaction and predation dynamics [30,32]. Ecological pressures from microclimatic shifts, resource input alteration, and disturbance impose consistent selective pressures across patches, favoring certain functional guilds, such as saprotrophs, mycorrhizal mutualists, methanotrophs, and nitrogen cyclers, while constraining others (Table S1, Supplementary Materials). The ratio of Gram-negative bacteria to Gram-positive bacteria decreased by approximately 10% from F to EF, indicating a decline in oligotrophic bacteria and a proliferation of copiotrophic Gram-negative bacteria [33,34]. This pattern was also documented in boreal spruce fragments by Choma et al. [35]. Fungal PLFA biomarkers declined more steeply than bacterial ones, aligning with studies across Mediterranean pine edges [36] and the experimental data obtained by Ruijten et al. [37], where surface drying was associated with hyphal growth suppression. This shift reflects the competitor–stress tolerant–ruderal paradigm, where fragmentation favors ruderal communities over competitive or stress-tolerant assemblages [38,39]. The intermediate zone (IF) displayed stable metrics, suggesting a transitional stage with eroding functional redundancy despite high richness (Figure 2).
Amino sugar-derived necromass carbon followed the EF > F > IF gradient (Table 2), suggesting that EF soils receive dual carbon subsidies and experience disturbance that accelerates microbial turnover. According to Xuan et al. [40], disturbance simultaneously exposes mineral sites that adsorb amino sugars, locking necromass into organomineral complexes. The forest interior (F) has steadier inputs and less disturbance, producing moderate necromass, while the compacted IF experiences reduced aeration and carbon influx, limiting microbial activity and stabilization capacity (Figure 3). The apparent decoupling between living fungal biomass and fungal necromass proportions across fragments could reflect differential stabilization mechanisms rather than decomposition rates alone. In EF soils, accelerated growth–death cycles generate substantial fungal residues, which can become locked into organomineral complexes through disturbance-exposed mineral surfaces [40], while bacterial necromass undergoes rapid consumption [38]. This process results in elevated fungal necromass proportions despite reduced living fungal biomass, demonstrating that necromass accumulation depends on stabilization capacity rather than biomass production rates. The fungal to bacterial necromass ratio exhibited a different gradient: IF > EF > F. Higher necromass ratios in IF could be attributed to chronic compaction from tourism trampling [41], restricted oxygen [42], and episodic lignin-rich litter [43]. He et al. [17] and Min et al. [44] reported that these constraints favor stress-tolerant hyphal fungi while destabilizing bacterial biofilms. Fungal residues accumulate due to slower decomposition, whereas bacterial necromass is rapidly consumed or leached. EF soils, with moderate disturbance and mixed substrates, support a sizable bacterial component but also exhibit fungal necromass due to disturbance-induced hyphal fragmentation, resulting in an intermediate necromass ratio. In undisturbed forest cores, stable moisture, high aeration, and continuous labile root exudates sustain rapid bacterial turnover [45,46], with fungal necromass decomposing efficiently due to intact detrital webs and oxidative enzymes [47]. This results in a minimal microbial necromass ratio compared to more disturbed sites. Overall, increasing mechanical stress along urban forest fragments systematically enhances fungal dominance within necromass pools, highlighting how microscale disturbance regimes regulate belowground residue composition in urban forests.

4.2. Biogeochemical Variables Controlling SOC Accumulation in Urban Forest Fragments

Our findings reveal that fragmentation gradients remodel key abiotic soil properties, which subsequently affect microbial processes responsible for soil organic carbon (SOC) stabilization. Through structural equation modelling (Figure 6), we showed that these abiotic shifts (Figure 3) exert a direct modulatory effect on SOC pools by constraining microbial activity and the potential for sorptive stabilization onto mineral surfaces. Specifically, drier, more compacted soils at forest pathways (IF, EF) limit microbial turnover of fresh plant inputs yet also reduce the formation of organomineral complexes, thereby shifting the balance toward particulate, less stable carbon fractions according to Cortufo et al. [48].
The microbial community phenotypic structure responded sensitively to these abiotic constraints (Table S1, Supplementary Materials). EF soils support a greater relative abundance of stress-tolerant organisms capable of catabolizing more recalcitrant substrates under low-moisture and high-pH conditions. In particular, the fungal–bacterial (F:B) ratio increased toward EFs (Table 1), driven largely by the proliferation of ectomycorrhizal and saprotrophic fungi (Table S1, Supplementary Materials) adapted to nutrient-poor, desiccated microhabitats [30]. Fungi, by virtue of their ligninolytic exoenzymes and higher carbon-use efficiency (CUE), as stated by Dashora et al. [49], tend to convert fresh plant inputs into chemically complex necromass enriched in chitin, melanin, and other thermostable polymers according to Rosso et al. [50]. These compounds exhibit low enzymatic accessibility and strong affinity for fine mineral surfaces, enhancing long-term SOC stabilization through organomineral associations. Conversely, Zheng et al. [51] reported that bacterial residues (principally peptidoglycan) decompose more rapidly under fluctuating moisture and pH, contributing primarily to labile particulate organic matter pools that are more vulnerable to mineralization. Our SEM framework partitioned the effects of community structure on SOC into direct and indirect pathways. Changes in necromass composition indicate that microbial residue chemistry, which is directly shaped by the living microbiome (Figure 6b), serves as a potential contributor to carbon persistence. In EF soils, high F:B ratios translate into necromass enriched in fungal polymers, strengthening mineral stabilization even as the total microbial biomass and turnover rates decline. In contrast, in F soils, lower F:B ratios and higher overall microbial activity could support a dynamic equilibrium between aggregate formation and organic matter turnover, yielding moderate but sustained SOC accrual, as demonstrated by Wu et al. [52] and Luan et al. [53].
In addition to microbial composition, abiotic variables such as soil texture and mineralogy further modulate SOC stabilization. Urban forest fragments often exhibit altered mineral assemblages due to soil disturbance and anthropogenic inputs [54]. We detected increased proportions of coarse silt and fine sand near edges, likely reflecting both sediment deposition from impervious surfaces and the selective erosion of finer clay particles (Figure 3). Scholier et al. [55] reported that clay minerals with high specific surface areas, such as smectites and vermiculites, are critical for organomineral binding and that shifts toward a coarser texture may limit sorptive stabilization pathways, particularly where the fungal necromass is insufficient to compensate. Indeed, in our dataset, the positive effect of fungal necromass on SOC was strongest in F soils, whereas in coarser EF soils, this pathway weakened, leading to lower total SOC despite high fungal dominance (Table S2, Supplementary Materials). The hydrological regime also exerts an influence, as episodic rainfall events can produce rapid pulses of infiltration followed by swift drainage in compacted profiles. Such “wet–dry” cycles can increase the liberation of mineral-associated SOC through aggregate disruption and microbial physiochemical stress, accelerating carbon loss in the absence of continuous inputs. Compared with EF soils, IF soils can buffer these fluctuations through increased porosity and water-holding capacity, increasing microbial turnover and aggregate persistence [56].
The interplay between biotic and abiotic factors defines a continuum of SOC stabilization mechanisms across fragment gradients. In the forest interior, physical protection within aggregates and chemical sorption onto clay–mineral surfaces cooperate with a balanced microbial community to gradually build SOC stocks. Urban forest fragmentation imposes a cascade of biogeochemical alterations that modulate SOC accumulation through tightly coupled abiotic gating of microbial activity and necromass-mediated stabilization [55]. Recognizing the relative contributions of aggregate formation, mineral sorption, and microbial residue chemistry across forest fragments is essential for designing interventions to increase carbon storage in urban biomes.

4.3. Biodiversity Implications and Environmental Considerations

The dataset demonstrated that urban-induced forest fragmentation propagates a cascade of abiotic and biotic shifts that ultimately reshape local biodiversity patterns and the ecological functions they underpin. Forest path soils, which are characterized by elevated bulk density, reduced gravimetric water content, and depletion of total SOC relative to interior interiors, present a selective environment that favors stress-tolerant, copiotrophic bacterial taxa at the expense of slow-growing, mycelial fungi [35]. Such compositional filtering reduces phylogenetic breadth and erodes functional redundancy within the soil microbiome, thereby constraining the repertoire of enzymatic pathways available for litter depolymerization and nutrient regeneration, according to Wang et al. [47]. Concomitantly, necromass chemistry shifts toward bacterial peptidoglycan rather than recalcitrant fungal chitin–melanin complexes, lowering the mean residence time of organic residues and accelerating carbon turnover [51].
Yi et al. [57] reported that diminished fungal hyphal networks limit mycorrhizal symbioses and impair seedling recruitment of late-successional tree species, reinforcing a vegetation trajectory dominated by disturbance-adapted pioneers with poorer litter quality (higher C:N ratios and lower lignin contents). This feedback exacerbates edge desiccation and thermal stress, further discouraging mesic forest specialists and narrowing both plant guild diversity and invertebrate guild diversity [49]. The decline in macroaggregate formation at forest paths additionally curtails microhabitat availability for soil mesofauna, weakening detritivore channels that normally buffer fluctuations in microbial activity [58]. At the landscape scale, the fragment-wide reduction in SOC stocks translates into a measurable loss of carbon sequestration capacity, diminishing the climate-mitigation value of urban green spaces [59]. Furthermore, the weakened aggregate- and mineral-associated carbon pools erode soil structural stability, increasing erosion risk and particulate runoff to adjacent waterways, thereby transferring biodiversity pressure downstream.
Collectively, the data highlight a shift from a diverse, functionally resilient interior microbiome toward a simplified, forest path-skewed consortium that, according to Feng et al. [41], could drive faster but less efficient biogeochemical cycling. Management prescriptions should therefore prioritize the mitigation of edge effects, either through buffer plantings, organic mulching to restore moisture regimes, or targeted fungal inoculation, to re-establish the aggregate continuum and re-diversify microbial communities. Doing so would safeguard not only belowground biodiversity but also the aboveground floristic and faunal assemblages that depend on stable soil processes, thereby preserving the integrative ecological and climatic services that fragmented urban forests are still capable of delivering.

4.4. Limitations of Current Research

However, there are limitations that could temper the generality of our conclusions. First, spatial replication was restricted to nine forest fragments within a single metropolitan matrix; consequently, the observed F-IF-EF gradients may not capture the full heterogeneity of urban soils formed on contrasting parent materials or under divergent pollution regimes. Second, this study adopted a chronosectional design, with sampling once in early autumn of 2024. Although in this period, the moisture has rebounded from summer drought, enhancing the forest path-to-forest interior gradient in forest microbial processes while the soil temperatures remain positive, ensuring biological relevance for linking the microbiome, necromass, and soil organic carbon, this snapshot approach cannot resolve the seasonal or interannual variability in microbial turnover, moisture dynamics, or carbon accrual rates, thereby limiting inference on long-term trajectories. Finally, carbon balances were calculated from static concentration profiles without concurrent flux measurements (e.g., CO2 efflux, litterfall inputs), introducing uncertainty into sequestration estimates. Addressing these limitations will require multi-season monitoring, broader biogeographic coverage, and integrative omics–flux frameworks.
Despite these constraints, this study provides a robust first-order synthesis of how urban forest fragmentation restructures soil microbial assemblages and carbon stabilization pathways. By combining detailed soil analysis with comprehensive microbial community assessment across well-defined urban fragmentation gradients, we established an empirical formulation. This baseline data will support future multi-scale experimental research aimed at optimizing urban green infrastructure for both biodiversity conservation and climate regulation services.

5. Conclusions

Urban forest fragmentation reorganizes the soil microbiome along both horizontal (F-IF-EF) and vertical (0–45 cm) axes. EF soils support less diverse communities with reduced microbial biomass and altered bacterial-to-fungal ratios. These compositional shifts coincide with losses of labile and particulate organic carbon and a concomitant enrichment of recalcitrant pools, implying lower microbial carbon-use efficiency and slower turnover. Interior fragments preserve microbial diversity and carbon stocks but remain susceptible to depth-dependent depletion. Collectively, our data emphasize that fragment types—not merely total forest area—regulate belowground biodiversity and carbon storage in urban landscapes. Management strategies that minimize fragment creation, widen core forest zones, and ameliorate microclimatic extremes are essential for safeguarding the biogeochemical resilience of remnant urban forests.

Supplementary Materials

The following supporting information can be downloaded at https://www.mdpi.com/article/10.3390/d17080545/s1: Table S1: Soil microbial phenotypic structure abundance variation in forest fragments; Table S2: Soil organic carbon fraction variation in forest fragments.

Author Contributions

Conceptualization, E.D.K. and N.K.N.; Writing—original draft preparation, M.H.K.; Methodology, E.D.K.; Formal analysis, N.K.N.; Writing—review and editing, E.D.K., N.K.N. and M.H.K. All authors have read and agreed to the published version of the manuscript.

Funding

This research was funded by the European Union NextGeneration EU through the National Recovery and Resilience Plan, Component 9. I8., grant number 760104/23 May 2023, code CF 245/29, November 2022. This work was supported by the project “Sensing, Mapping, Interconnecting: Tools for soil functions and services evaluation” supported by the Romanian Government, Ministry of the Innovation and Digitization through the National Recovery and Resilience Plan (PNRR) PNRR-III-C9-2022-I8, contract no. CF245/29.11.2022.

Data Availability Statement

Data is contained within the article and Supplementary Materials.

Conflicts of Interest

The authors declare no conflicts of interest.

References

  1. Joy, M.S.; Jha, P.; Yadav, P.K.; Bansal, T.; Rawat, P.; Begam, S. Forest fragmentation and forest cover dynamics: Mining induced changes in the West Singhbhum District of Jharkhand. Remote Sens. Appl. Soc. Environ. 2024, 36, 101350. [Google Scholar] [CrossRef]
  2. Dutt, S.; Kumar Batar, A.; Sulik, S.; Kunz, M. Forest ecosystem on the edge: Mapping forest fragmentation susceptibility in Tuchola Forest, Poland. Ecol. Indic. 2024, 161, 111980. [Google Scholar] [CrossRef]
  3. De Pauw, K.; Depauw, L.; Calders, K.; Caluwaerts, S.; Cousins, S.A.O.; De Lombaerde, E.; Diekmann, M.; Frey, D.; Lenoir, J.; Meeussen, C.; et al. Urban forest microclimates across temperate Europe are shaped by deep edge effects and forest structure. Agric. For. Meteorol. 2023, 341, 109632. [Google Scholar] [CrossRef]
  4. Wu, L.M.; Quan, R.C.; Wang, B. Forest fragmentation effects on plant-animal interaction do not always show consistent patterns—Evidence from a seed removal experiment of 31 woody species. Bio. Conserv. 2024, 299, 110803. [Google Scholar] [CrossRef]
  5. Yasuda, K.; Kato, D.; Naoe, S.; Amano, T.; Yoshikawa, T.; Tochigi, K.; Koike, S. Does forest loss and fragmentation reduce woodpecker-associated ecosystem functions? Glob. Ecol. Conserv. 2025, 57, e03366. [Google Scholar] [CrossRef]
  6. Gómez, A.I.P.; Núñez-Rodríguez, L.X.; Mora-Motta, D.A.; Suárez, J.C.; Silva-Olaya, A.M.; de Araujo Pereira, A.P.; Ortiz-Morea, F.A. Unveiling soil bacterial diversity in the Andes-Amazon transition zone: Impacts of forest conversion to pasture. Appl. Soil Ecol. 2024, 201, 105486. [Google Scholar] [CrossRef]
  7. Wan, M.; Han, Y.; Song, Y.; Hashimoto, S. Estimating and projecting the effects of urbanization on the forest habitat quality in a highly urbanized area. Urban For Urban Green 2024, 94, 128270. [Google Scholar] [CrossRef]
  8. Koukianaki, E.A.; Lilli, M.A.; Efstathiou, D.; Matthews, B.; Knaebel, K.; Pröll, G.; Kobler, J.; Dirnböck, T.; Bäck, J.; Mirtl, M.; et al. Modelling soil functions of forested ecosystems. J. Environ. Manag. 2025, 386, 125636. [Google Scholar] [CrossRef] [PubMed]
  9. Feng, R.; Wang, F.; Liu, S.; Qi, W.; Zhengchen, R.; Wang, D. Synergistic effects of urban forest on urban heat island-air pollution-carbon stock in mega-urban agglomeration. Urban For. Urban Green 2025, 103, 128590. [Google Scholar] [CrossRef]
  10. Kiesewetter, K.N.; Afkhami, M.E. Microbiome-mediated effects of habitat fragmentation on native plant performance. New Phytol. 2021, 232, 1823–1838. [Google Scholar] [CrossRef] [PubMed]
  11. Wu, H.; Cui, H.; Fu, C.; Li, R.; Qi, F.; Liu, Z.; Yang, G.; Xiao, K.; Qiao, M. Unveiling the crucial role of soil microorganisms in carbon cycling: A review. Sci. Total Environ. 2024, 909, 168627. [Google Scholar] [CrossRef]
  12. Bai, Y.; Zhou, Y.; Du, J.; Zhang, X.; Feng, J.; Feng, J. Tree species influence microbiome-mediated nutrient sequestration in soil aggregates of subtropical plantations in China. Appl. Soil Ecol. 2025, 209, 106034. [Google Scholar] [CrossRef]
  13. Wang, C.; Kuzyakov, Y. Rhizosphere engineering for soil carbon sequestration. Trends Plant Sci. 2024, 29, 447–468. [Google Scholar] [CrossRef]
  14. Anthony, M.A.; Tedersoo, L.; De Vos, B.; Croisé, L.; Meesenburg, H.; Wagner, M.; Andreae, H.; Jacob, F.; Lech, P.; Kowalska, A.; et al. Fungal community composition predicts forest carbon storage at a continental scale. Nat. Commun. 2024, 15, 2385. [Google Scholar] [CrossRef]
  15. Mason-Jones, K.; Breidenbach, A.; Dyckmans, J.; Banfield, C.C.; Dippold, M.A. Intracellular carbon storage by microorganisms is an overlooked pathway of biomass growth. Nat. Commun. 2023, 14, 2240. [Google Scholar] [CrossRef]
  16. Tao, F.; Huang, Y.; Hungate, B.A.; Manzoni, S.; Frey, S.D.; Schmidt, M.W.I.; Reichstein, M.; Carvalhais, N.; Ciais, P.; Jiang, L.; et al. Microbial carbon use efficiency promotes global soil carbon storage. Nature 2023, 618, 981–985. [Google Scholar] [CrossRef]
  17. He, X.; Abs, E.; Allison, S.D.; Tao, F.; Huang, Y.; Manzoni, S.; Abramoff, R.; Bruni, E.; Bowring, S.P.K.; Chakrawal, A.; et al. Emerging multiscale insights on microbial carbon use efficiency in the land carbon cycle. Nat. Commun. 2024, 15, 8010. [Google Scholar] [CrossRef]
  18. Pagel, H.; Kriesche, B.; Uksa, M.; Poll, C.; Kandeler, E.; Schmidt, V.; Streck, T. Spatial Control of Carbon Dynamics in Soil by Microbial Decomposer Communities. Front. Environ. Sci. 2020, 8, 2. [Google Scholar] [CrossRef]
  19. Ferreira, V.; Elosegi, A.; Tiegs, S.D.; von Schiller, D.; Young, R. Organic matter decomposition and ecosystem metabolism as tools to assess the functional integrity of streams and rivers—A systematic review. Water 2020, 12, 3523. [Google Scholar] [CrossRef]
  20. Condron, L.; Stark, C.; O’Callaghan, M.; Clinton, P.; Huang, Z. The role of microbial communities in the formation and decomposition of soil organic matter. In Soil Microbiology and Sustainable Crop Production; Dixon, G., Tilson, E., Eds.; Springer: Dordrecht, The Netherlands, 2010. [Google Scholar] [CrossRef]
  21. Zaman, W.; Ayaz, A.; Puppe, D. Biogeochemical Cycles in Plant–Soil Systems: Significance for Agriculture, Interconnections, and Anthropogenic Disruptions. Biology 2025, 14, 433. [Google Scholar] [CrossRef] [PubMed]
  22. Takele, L.; Yang, S.; Chen, Z.; Yan, J.; Ding, W. Contribution of microbial necromass to soil organic carbon in profile depths exhibited opposite patterns across ecosystems: A global meta-analysis. Soil Biol. Biochem. 2025, 207, 109842. [Google Scholar] [CrossRef]
  23. Kovacs, E.D.; Rusu, T.; Kovacs, M.H. Sustainable soil volatilome: Discrimination of land uses through GC-MS-identified volatile organic compounds. Separations 2025, 12, 92. [Google Scholar] [CrossRef]
  24. Zhang, X.; Chen, X.; Liu, M.; Xu, Z.; Wei, H. Coupled changes in soil organic carbon fractions and microbial community composition in urban and suburban forests. Sci. Rep. 2020, 10, 15933. [Google Scholar] [CrossRef] [PubMed]
  25. Kovacs, E.D.; Kovacs, M.H.; Barcelo, D.; Pereira, P. Nonsteroidal anti-inflammatory drugs impact the microbial community in three different soil types—A laboratory experiment. Case Stud. Chem. Environ. Eng. 2024, 10, 100833. [Google Scholar] [CrossRef]
  26. Kovacs, E.D.; Silaghi-Dumitrescu, L.; Roman, C.; Tian, D. Structural and metabolic profiling of Lycopersicon esculentum rhizosphere microbiota artificially exposed at commonly used non-steroidal anti-inflammatory drugs. Microorganisms 2022, 10, 254. [Google Scholar] [CrossRef]
  27. Zhao, J.; Wan, S.; Zhang, C.; Liu, Z.; Zhou, L.; Fu, S. Contributions of understorey and/or overstory vegetations to soil microbial PLFA and nematode diversities in Eucalyptus monocultures. PLoS ONE 2014, 9, e85513. [Google Scholar] [CrossRef]
  28. Liang, C.; Balser, T.C. Warming and nitrogen deposition lessen microbial residue contribution to soil carbon pool. Nat. Commun. 2012, 3, 1222. [Google Scholar] [CrossRef] [PubMed]
  29. He, J.; Nie, Y.; Tan, X.; Hu, A.; Li, Z.; Dai, S.; Ye, Q.; Zhang, G.; Shen, W. Latitudinal patterns and drivers of plant lignin and microbial necromass accumulation in forest soils: Disentangling microbial and abiotic controls. Soil Biol. Biochem. 2024, 194, 109438. [Google Scholar] [CrossRef]
  30. Ding, L.J.; Ren, X.Y.; Zhou, Z.Z.; Zhu, D.; Zhu, Y.G. Forest-to-cropland conversion reshapes microbial hierarchical interactions and degrades ecosystem multifunctionality at a national scale. Environ. Sci. Technol. 2024, 58, 11027–11040. [Google Scholar] [CrossRef]
  31. Xiao, H.; Sheng, H.; Zhang, L.; Zhang, L.; Pan, B.; Zhou, P. How does land-use change alter soil microbial diversity, composition, and network in subtropical China? Catena 2023, 231, 107335. [Google Scholar] [CrossRef]
  32. Benalcazar, P.; Seuradge, B.; Diochon, A.C.; Kolka, R.K.; Phillips, L.A. Conversion of boreal forests to agricultural systems: Soil microbial responses along a land-conversion chronosequence. Environ. Microbiome 2024, 19, 32. [Google Scholar] [CrossRef]
  33. Hellenbrand, J.P.; Kelly-Voicu, P.; Bowers, J.T.; Reinmann, A.B. Edge and the city: Evaluating the role of edge effects on urban forest structure and tree species composition. Urban For Urban Green 2025, 107, 128745. [Google Scholar] [CrossRef]
  34. Liu, Z.; Shan, X.; Wei, H.; Zhang, J.; Saleem, M.; Li, D.; Zhang, Y.; Ma, R.; He, Y.; Zhong, J.; et al. Idiosyncratic responses of microbial communities and carbon utilization to acid rain frequency in the agricultural and forest soils. Glob. Ecol. Conserv. 2021, 26, e01429. [Google Scholar] [CrossRef]
  35. Choma, M.; Šamonil, P.; Kaštovská, E.; Bárta, J.; Tahovská, K.; Valtera, M.; Šantrůčková, H. Soil microbiome composition along the natural norway spruce forest life cycle. Forests 2021, 12, 410. [Google Scholar] [CrossRef]
  36. Lasa, A.V.; López-Hinojosa, M.; Villadas, P.J.; Fernández-González, A.J.; Cervera, M.T.; Fernández-López, M. Unravelling the shifts in the belowground microbiota and metabolome of Pinus pinaster trees affected by forest decline. Sci. Total Environ. 2025, 963, 178486. [Google Scholar] [CrossRef] [PubMed]
  37. Ruijten, P.; Huinink, H.P.; Adan, O.C.G. Hyphal growth of Penicillium rubens in changing relative humidity. Appl. Microb. Cell Physiol. 2021, 105, 5159–5171. [Google Scholar] [CrossRef] [PubMed]
  38. Mogîldea, D.; Biță-Nicolae, C. Ruderal Plant Diversity as a Driver for Urban Green Space Sustainability. J. Urban Sci. 2024, 8, 159. [Google Scholar] [CrossRef]
  39. Heděnec, P.; Nilsson, L.O.; Zheng, H.; Gundersen, P.; Schmidt, I.K.; Rousk, J.; Vesterdal, L. Mycorrhizal association of common European tree species shapes biomass and metabolic activity of bacterial and fungal communities in soil. Soil Bio. Biochem. 2020, 149, 107933. [Google Scholar] [CrossRef]
  40. Xuan, M.; Ai, L.; Wu, F.; Zhang, X.; Ni, X. Biomarkers evidence shows a preferential occlusion of microbial necromass in mineral-associated and not particle organic matter. Geoderma 2024, 450, 117030. [Google Scholar] [CrossRef]
  41. Feng, J.; He, K.; Zhang, Q.; Han, M.; Zhu, B. Changes in plant inputs alter soil carbon and microbial communities in forest ecosystems. Glob. Change Bio. 2022, 28, 3426–3440. [Google Scholar] [CrossRef]
  42. Mattila, T.J.; Vihanto, N. Agricultural limitations to soil carbon sequestration: Plant growth, microbial activity, and carbon stabilization. Agric. Ecosyst. Environ. 2024, 367, 108986. [Google Scholar] [CrossRef]
  43. Shang, Q.; Li, C.; Liu, Y. The Negative Effects of Tourist Trampling on the Soil Physical Properties and Microbial Community Composition in a Natural Oak Forest. Forests 2024, 15, 1419. [Google Scholar] [CrossRef]
  44. Min, K.; Lynch, L.; Zheng, T.; Chen, F.; Liang, C. Factors driving microbial biomass and necromass relationships display ecosystem-dependent responses. Eur. J. Soil Sci. 2024, 75, e13555. [Google Scholar] [CrossRef]
  45. Li, H.; Liu, G.; Luo, H.; Zhang, R. Labile carbon-induced soil organic matter turnover in a subtropical forest under different redox conditions. J. Environ. Manag. 2023, 348, 119387. [Google Scholar] [CrossRef] [PubMed]
  46. Liu, R.; He, Y.; Du, Z.; Zhou, G.; Zhou, L.; Wang, X.; Li, N.; Yan, E.; Feng, X.; Liang, C.; et al. Root Production and Microbe-Derived Carbon Inputs Jointly Drive Rapid Soil Carbon Accumulation at the Early Stages of Forest Succession. Forests 2022, 13, 2130. [Google Scholar] [CrossRef]
  47. Wang, B.; An, S.; Liang, C.; Liu, Y.; Kuzyakov, Y. Microbial necromass as the source of soil organic carbon in global ecosystems. Soil Biol. Biochem. 2021, 162, 108422. [Google Scholar] [CrossRef]
  48. Cotrufo, M.F.; Haddix, M.L.; Kroeger, M.E.; Steward, C.E. The role of plant input physical-chemical properties, and microbial and soil chemical diversity on the formation of particulate and mineral-associated organic matter. Soil Biol. Biochem. 2022, 168, 108648. [Google Scholar] [CrossRef]
  49. Dashora, K.; Gattupalli, M.; Tripathi, G.D.; Javed, Z.; Singh, S.; Tuohy, M.; Sarangi, P.K.; Diwan, D.; Singh, H.B.; Gupta, V.K. Fungal Assisted Valorization of Polymeric Lignin: Mechanism, Enzymes and Perspectives. Catalysts 2023, 13, 149. [Google Scholar] [CrossRef]
  50. Rosso, M.N.; Berrin, J.G.; Lomascolo, A. Plant wastes and sustainable refineries: What can we learn from fungi? Curr. Opin. Green Sustain. Chem. 2022, 34, 100602. [Google Scholar] [CrossRef]
  51. Zheng, T.; Miltner, A.; Liang, C.; Nowak, K.M.; Kastner, M. Turnover of bacterial biomass to soil organic matter via fungal biomass and its metabolic implications. Soil Biol. Biochem. 2023, 180, 108995. [Google Scholar] [CrossRef]
  52. Wu, M.; Chen, L.; Ma, J.; Zhang, Y.; Li, X.; Pang, D. Aggregate-associated carbon contributes to soil organic carbon accumulation along the elevation gradient of Helan Mountains. Soil Biol. Biochem. 2023, 178, 108926. [Google Scholar] [CrossRef]
  53. Luan, H.; Zhang, X.; Liu, Y.; Huang, S.; Chen, J.; Guo, T.; Liu, Y.; Guo, S.; Qi, G. The microbial-driven C dynamics within soil aggregates in walnut orchards of different ages based on microbial biomarkers analysis. Catena 2022, 211, 105999. [Google Scholar] [CrossRef]
  54. Yesilonis, I.; Giorgio, V.; Hu, Y.; Pouyat, R.; Szlavecz, K. Changes in Soil Chemistry After 17 Years in Urban and Rural Forest Patches. Front. Ecol. Evol. 2022, 10, 786809. [Google Scholar] [CrossRef]
  55. Scholier, T.; Lavrinienko, A.; Brila, I.; Tukalenko, E.; Hindstrom, R.; Vasylenko, A.; Cayol, C.; Ecke, F.; Singh, N.J.; Forsman, J.T.; et al. Urban forest soils harbour distinct and more diverse communities of bacteria and fungi compared to less disturbed forest soils. Mol. Ecol. 2022, 32, 504–517. [Google Scholar] [CrossRef]
  56. Zech, S.; Schweizer, S.A.; Bucka, F.B.; Ray, N.; Kögel-Knabner, I.; Prechtel, A. Explicit spatial modelling at the pore scale unravels the interplay of soil organic carbon storage and structure dynamics. Glob. Change Biol. 2022, 28, 4589–4604. [Google Scholar] [CrossRef]
  57. Yi, R.; Liu, Q.; Yang, F.; Dai, X.; Meng, S.; Fu, X.; Li, S.; Kou, L.; Wang, H. Complementary belowground strategies underlie species coexistence in an early successional forest. New Phytol. 2023, 238, 612–623. [Google Scholar] [CrossRef] [PubMed]
  58. Kudereti, A.; Zhao, S.; Tian, C. Responses of soil fauna community under changing environmental conditions. J. Arid Land 2023, 15, 620–636. [Google Scholar] [CrossRef]
  59. Koster, G.; Jazwa, M.; Przemieniecki, S.W.; Musielok, L.; Azarbad, H.; Klimek, B. Size matters: Larger fragments of riparian forest in urban areas support functional diversity of soil bacteria more than smaller ones. Front. Microbiol. 2025, 16, 1517545. [Google Scholar] [CrossRef] [PubMed]
Figure 1. Map of the urban forest fragments studied. F, IF, and EF represent forest, internal forest path, and external forest path fragments, respectively. The points on the map represent the locations of the plots selected for study.
Diversity 17 00545 g001
Figure 2. Microbial phospholipid-derived fatty acid diversity indexes variation among urban forest fragments. (a) Shannon-Wiener diversity index; (b) Pielou evenness index; (c) Margalef richness index; (d) Simpson dominance index. * means p < 0.05; ** means p < 0.01; and *** means p < 0.001.
Diversity 17 00545 g002
Figure 3. Mantel test of the influence of soil abiotic properties on the soil microbiome continuum (microbial phenotypic structure and microbial necromass content).
Diversity 17 00545 g003
Figure 4. Relationship between necromass carbon and microbial abundance. (a) Microbial biomass correlation with microbial necromass derived carbon; (b) Bacterial biomass correlation with bacterial necromass derived carbon; (c) Fungal biomass correlation with fungal necromass derived carbon; *** means p < 0.001.
Diversity 17 00545 g004
Figure 5. Relationships between necromass carbon contributions to soil organic carbon and microbial abundance. (a) Microbial biomass correlation with microbial necromass derived carbon to SOC ratio; (b) Bacterial biomass correlation with bacterial necromass derived carbon to SOC ratio; (c) Fungal biomass correlation with fungal necromass derived carbon to SOC ratio; ** means p < 0.01; and *** means p < 0.001.
Diversity 17 00545 g005
Figure 6. Structural equation modelling (SEM) reveals how abiotic factors and the microbial community influence (a) soil organic carbon (SOC) and (b) microbial necromass accumulated carbon (NAC). In figure * means p < 0.05; ** means p < 0.01; and *** means p < 0.001; the red color means positive correlation while blue color means negative correlation.
Diversity 17 00545 g006
Table 1. Soil microbiome abundance variation in forest fragments.
Phenotypic
Group
Fragment 1Abundance (nmol⋅g−1)Repeated-Measures ANOVA
0–15
(cm)
15–30
(cm)
30–45
(cm)
Total PLFAF175.6
(154.5; 195.7)
B|a
147.2
(126.6; 164.4)
B|a
142.1
(120.5; 154.8)
A|a
ns
IP153.5
(133.6; 165.0)
AB|a
132.3
(113.0; 147.7)
AB|a
127.9
(104.3; 140.6)
A|a
ns
EF125.2
(123.0; 127.7)
A|b
105.5
(102.8; 108.3)
A|a
101.4
(98.7; 105.4)
A|a
***
One-way
ANOVA
***ns
Total bacteriaF140.0
(126.4; 148.9)
B|a
114.8
(104.7; 125.9)
B|a
109.7
(100.7; 122.0)
A|a
*
IP123.5
(107.4; 134.5)
AB|a
106.3
(91.1; 117.6)
AB|a
103.2
(84.3; 114.6)
A|a
ns
EF103.9
(100.9; 105.9)
A|b
84.3
(80.0; 90.4)
A|a
81.8
(78.1; 87.6)
A|a
**
One-way
ANOVA
***ns
Total fungiF21.9
(16.9; 27.4)
B|a
19.3
(13.4; 23.3)
B|a
18.7
(12.9; 22.4)
A|a
ns
IP15.7
(14.1; 16.7)
A|a
12.4
(12.4; 14.9)
AB|a
12.6
(11.7; 14.4)
A|a
ns
EF13.0
(11.7; 13.9)
A|a
11.8
(10.5; 12.8)
A|a
11.1
(9.9; 12.4)
A|a
ns
One-way
ANOVA
****
Other PLFAF13.7
(11.3; 18.1)
A|a
11.0
(9.0; 15.8)
A|a
9.8
(7.2; 12.9)
A|a
ns
IP14.3
(9.4; 16.4)
A|a
12.6
(7.2; 14.8)
A|a
11.6
(6.5; 13.1)
A|a
ns
EF8.9
(7.7; 9.8)
A|a
7.8
(6.6; 8.6)
A|a
6.8
(5.7; 7.8)
A|a
ns
One-way
ANOVA
nsnsns
1 F—forest; IF—internal forest path; and EF—external forest path; * means p < 0.05; ** means p < 0.01; and *** means p < 0.001
Table 2. Soil microbial necromass variation in forest fragments.
Microbial
Necromass Group
Fragment 1Amount (g⋅kg−1)Repeated-Measures ANOVA
0–15
(cm)
15–30
(cm)
30–45
(cm)
Total microbial necromassF16.1
(15.2; 17.3)
A|b
15.0
(14.1; 16.3)
A|ab
13.6
(12.8; 13.7)
A|a
*
IF14.6
(13.9; 17.5)
A|a
14.0
(13.5; 16.1)
A|a
12.5
(12.4; 13.0)
A|a
ns
EF18.0
(16.0; 20.9)
A|b
14.8
(13.8; 17.9)
A|ab
13.1
(11.6; 14.5)
A|a
**
One-way
ANOVA
nsnsns
Total bacterial necromassF6.7
(5.7; 7.1)
AB|a
6.4
(5.6; 6.9)
A|a
5.9
(5.2; 6.5)
A|a
ns
IF6.1
(5.9; 6.6)
A|a
5.8
(5.5; 6.3)
A|a
5.3
(5.0; 5.6)
A|a
ns
EF9.8
(6.4; 14.0)
B|a
6.8
(5.8; 10.6)
A|a
5.9
(4.9; 7.6)
A|a
ns
One-way
ANOVA
*nsns
Total fungal necromassF9.5
(9.1; 10.1)
A|a
8.6
(8.1; 9.3)
A|a
7.3
(6.8; 7.7)
A|b
***
IF9.0
(7.8; 10.4)
A|a
8.5
(7.6; 9.6)
A|a
7.6
(7.3; 7.7)
A|a
ns
EF8.1
(7.3; 8.6)
A|a
7.5
(7.3; 8.0)
A|a
6.9
(6.4; 7.2)
A|a
ns
One-way
ANOVA
nsnsns
1 F—forest; IF—internal forest path; and EF—external forest path; * means p < 0.05; ** means p < 0.01; and *** means p < 0.001.
Disclaimer/Publisher’s Note: The statements, opinions and data contained in all publications are solely those of the individual author(s) and contributor(s) and not of MDPI and/or the editor(s). MDPI and/or the editor(s) disclaim responsibility for any injury to people or property resulting from any ideas, methods, instructions or products referred to in the content.

