Article

Temporal Niche Partitioning as a Coexistence Mechanism Between China’s Endemic Elliot’s Pheasant (Syrmaticus ellioti) and Its Predator, the Leopard Cat (Prionailurus bengalensis)

1
Vertebrate Zoology Laboratory, Hunan Normal University, Changsha 410081, China
2
School of Biology and Food Engineering, Huaihua University, Huaihua 418000, China
3
Hunan Jiemuxi National Nature Reserve, Huaihua 419600, China
*
Authors to whom correspondence should be addressed.
Diversity 2025, 17(7), 460; https://doi.org/10.3390/d17070460
Submission received: 5 June 2025 / Revised: 26 June 2025 / Accepted: 26 June 2025 / Published: 28 June 2025
(This article belongs to the Special Issue Ecology, Distribution, and Conservation of Endangered Birds)

Abstract

Understanding predator-prey coexistence mechanisms is essential for conserving endemic species in montane ecosystems. Galliformes serve as critical ecological indicator species, yet their populations are declining globally due to habitat fragmentation and anthropogenic pressures. Elliot’s pheasant (Syrmaticus ellioti, Swinhoe, 1872), a Galliformes species endemic to China, is primarily distributed south of the Yangtze River. However, its coexistence mechanisms with sympatric predators remain undocumented. Here, using six years (2019–2024) of camera-trap data from 90 stations in Jiemuxi National Nature Reserve, Hunan Province, Southwest China, we employed a MaxEnt model and kernel density estimation to investigate spatiotemporal coexistence mechanisms between Elliot’s pheasant and its primary predator, the leopard cat (Prionailurus bengalensis, Kerr, 1792). Across 36,946 camera-days, we obtained 227 independent detections of Elliot’s pheasant and 82 of the leopard cat. Spatial niche analysis revealed high overlap (Schoener’s D = 0.769; Hellinger’s I = 0.952). Both species exhibit similar preferences for main environmental variables. Conversely, significant temporal niche segregation occurred: Elliot’s pheasant displayed diurnal bimodal activity, whereas the leopard cat was strictly nocturnal, resulting in low overlap (Δ4 = 0.379, p < 0.01). Critically, during Elliot’s pheasant’s breeding season, increased temporal overlap with the leopard cat (Δ1 = 0.479, p < 0.01) suggested that reproductive behaviors elevate predation risk. Our findings demonstrate that temporal niche partitioning serves as the primary coexistence mechanism, while spatial niche overlap and behavioral adaptations under predation pressure drive dynamic predator-prey interactions. This provides a scientific foundation for targeted conservation strategies and predator management of these threatened Galliformes.

1. Introduction

The mechanisms underlying species coexistence in ecological communities represent a central focus in community ecology and biodiversity research [1,2]. Since Hutchinson introduced the concept of the n-dimensional hypervolume niche, niche theory has served as the foundational framework for understanding species coexistence mechanisms. Classical niche theory posits that stable coexistence is achieved through multidimensional niche partitioning along resource, spatial, and temporal axes, thus reducing competitive exclusion [3,4]. Modern coexistence theory further refines this perspective, demonstrating that long-term coexistence arises from the interplay between stabilizing mechanisms (mediated by niche differentiation) and equalizing mechanisms, where niche-driven stabilization plays a crucial role in biodiversity maintenance [5].
In predator-prey systems, their relationships exhibit greater complexity. Predator-prey interactions serve as a fundamental driver in shaping community structure [6]. Through both lethal (direct mortality) and non-lethal effects, predators can alter prey physiology, behavioral patterns, population dynamics, and habitat use, thereby indirectly influencing prey niche dimensions [7,8]. In response to predation pressure, prey species often adjust their niches by modifying activity rhythms and optimizing habitat selection strategies to reduce predation risk [9]. However, predators may also evolve counter-adaptive strategies to overcome prey avoidance mechanisms [8].
These dynamic interactions lead to tightly coupled spatiotemporal niche relationships. Recent accelerating habitat fragmentation and loss driven by anthropogenic activities not only cause dramatic population declines and weaken ecological interaction networks but may also compromise ecosystem stability by increasing interspecific niche overlap [10,11]. This underscores the urgency of investigating the spatio-temporal niche dynamics of keystone species.
As characteristic ground-dwelling birds, Galliformes exhibit large body sizes coupled with limited flight capacity, dispersal ability, and predator avoidance strategies [12]. Given their high environmental dependency and sensitivity, Galliformes serve as reliable indicators of local ecosystem health [13]. Elliot’s pheasant (Syrmaticus ellioti, Swinhoe, 1872) is a critically threatened pheasant endemic to China (Table S1). It is listed as a first-grade nationally protected wildlife in China and is confined to nine provinces, including Hunan, Anhui, and Zhejiang. Since the early 20th century, Elliot’s pheasant populations have experienced dramatic declines, designating it a global conservation priority [14]. Existing research on Elliot’s pheasant has concentrated on habitat selection, diet composition, reproductive ecology, population genetics, activity patterns, energetics, and climate change impacts [15,16,17,18,19,20,21,22,23,24,25,26], while predator-prey dynamics have received limited attention.
The leopard cat (Prionailurus bengalensis, Kerr, 1792) is the most widely distributed wild felid in Asia [14]. Leopards exhibit broad dietary plasticity, including Rodentia, Lagomorpha, Artiodactyla, and other mammals, as well as avian species (e.g., Passeriformes and Galliformes) and various plants [27,28,29,30]. To adapt to interspecific competition, the leopard cat exhibits significant dietary plasticity, adjusting its trophic niche to coexist with sympatric predators [31]. Consistent with optimal foraging theory in felids, the leopard cat preferentially selects larger prey to maximize energy intake while minimizing predation risk [32]. This behavioral adaptation results in significant spatial heterogeneity in its dietary composition across different habitats. For instance, in Saihanwula National Nature Reserve (Inner Mongolia), medium-sized birds accounted for 67.6% of their fecal weight, whereas in the Kathmandu Valley in Nepal, the occurrence of rodents in the leopard diet was as high as 76.3% [33,34]. Notably, in Hunan Province, where top predators (e.g., South China tiger (Panthera tigris ssp. amoyensis, Hilzheimer, 1905)) have become regionally extinct, the leopard cat has undergone significant trophic niche expansion, assuming a functional role as an apex predator and consequently playing a crucial role in maintaining ecosystem structure and functional stability [35,36].
The mesopredator release effect, as a significant ecological consequence of the decline of top predators, negatively impacts the population dynamics of terrestrial birds [37]. Long-term field observations demonstrate that Elliot’s pheasant experiences significant predation pressure from multiple predators, including the leopard cat, the masked palm civet (Paguma larvata, C. E. H. Smith, 1827), and various snake species, with the leopard cat exhibiting significantly greater predation rates [26]. This finding was further validated in an Elliot’s pheasant rewilding initiative at Guangxi Maoershan National Nature Reserve, where post-release mortality monitoring revealed that 60% of fatalities resulted from predation, with leopard cat scats found near mortality sites [25]. Molecular analysis of leopard cat scats employing fecal DNA and metabarcoding have identified multiple pheasant species in their diet, including Temminck’s tragopan (Tragopan temminckii, J. E. Gray, 1831), the blood pheasant (Ithaginis cruentus, Hardwicke, 1821), the golden pheasant (Chrysolophus pictus, Linnaeus, 1758), the common pheasant (Phasianus colchicus, Linnaeus, 1758), the Koklass pheasant (Pucrasia macrolopha, R. Lesson, 1829), and the Kalij pheasant (Lophura leucomelanos, Latham, 1790). Although the distribution of Elliot’s pheasant has not been monitored in the above study area, the cumulative evidence strongly suggests that the leopard cat represents a major potential predator of Elliot’s pheasant [38,39,40,41,42].
Situated in southern China, Jiemuxi National Nature Reserve represents the initial discovery site of Elliot’s pheasant in Hunan Province and serves as a core distribution area for this species [23,24,43]. The reserve’s topographic complexity and undisturbed subtropical evergreen broadleaved forests provide a critical habitat for Elliot’s pheasant’s survival and reproduction. Designated as a flagship species in the reserve, Elliot’s pheasant receives prioritized conservation attention. Notably, during a rewilding and reintroduction program implemented in the reserve in November 2024, 30 Reeves’s pheasants (Syrmaticus reevesii, J. E. Gray, 1829), a congener of Elliot’s pheasant, were released, potentially exposing these vulnerable pheasants to predation pressure from the leopard cat.
To this end, this study employs the MaxEnt model and kernel density estimation (KDE) to explore the ecological interactions between Elliot’s pheasant and the leopard cat across temporal and spatial scales within the reserve. The aim is to enhance our understanding of the spatio-temporal distribution patterns of terrestrial birds in the context of predation risk, thereby increasing our understanding of the regional coexistence between pheasants and their predators. This research will provide support for the refined management and conservation of key protected pheasant populations and their sympatric predator in the reserve. The study aims to address the following scientific questions: 1. whether environmental factors differentially shape habitat utilization by Elliot’s pheasant and the leopard cat; 2. if Elliot’s pheasant demonstrates predator-avoidance through spatial segregation; 3. whether temporal partitioning complements spatial avoidance in reducing predation risk; and 4. the adequacy of the reserve’s current area division for conserving priority species like Elliot’s pheasant.

2. Materials and Methods
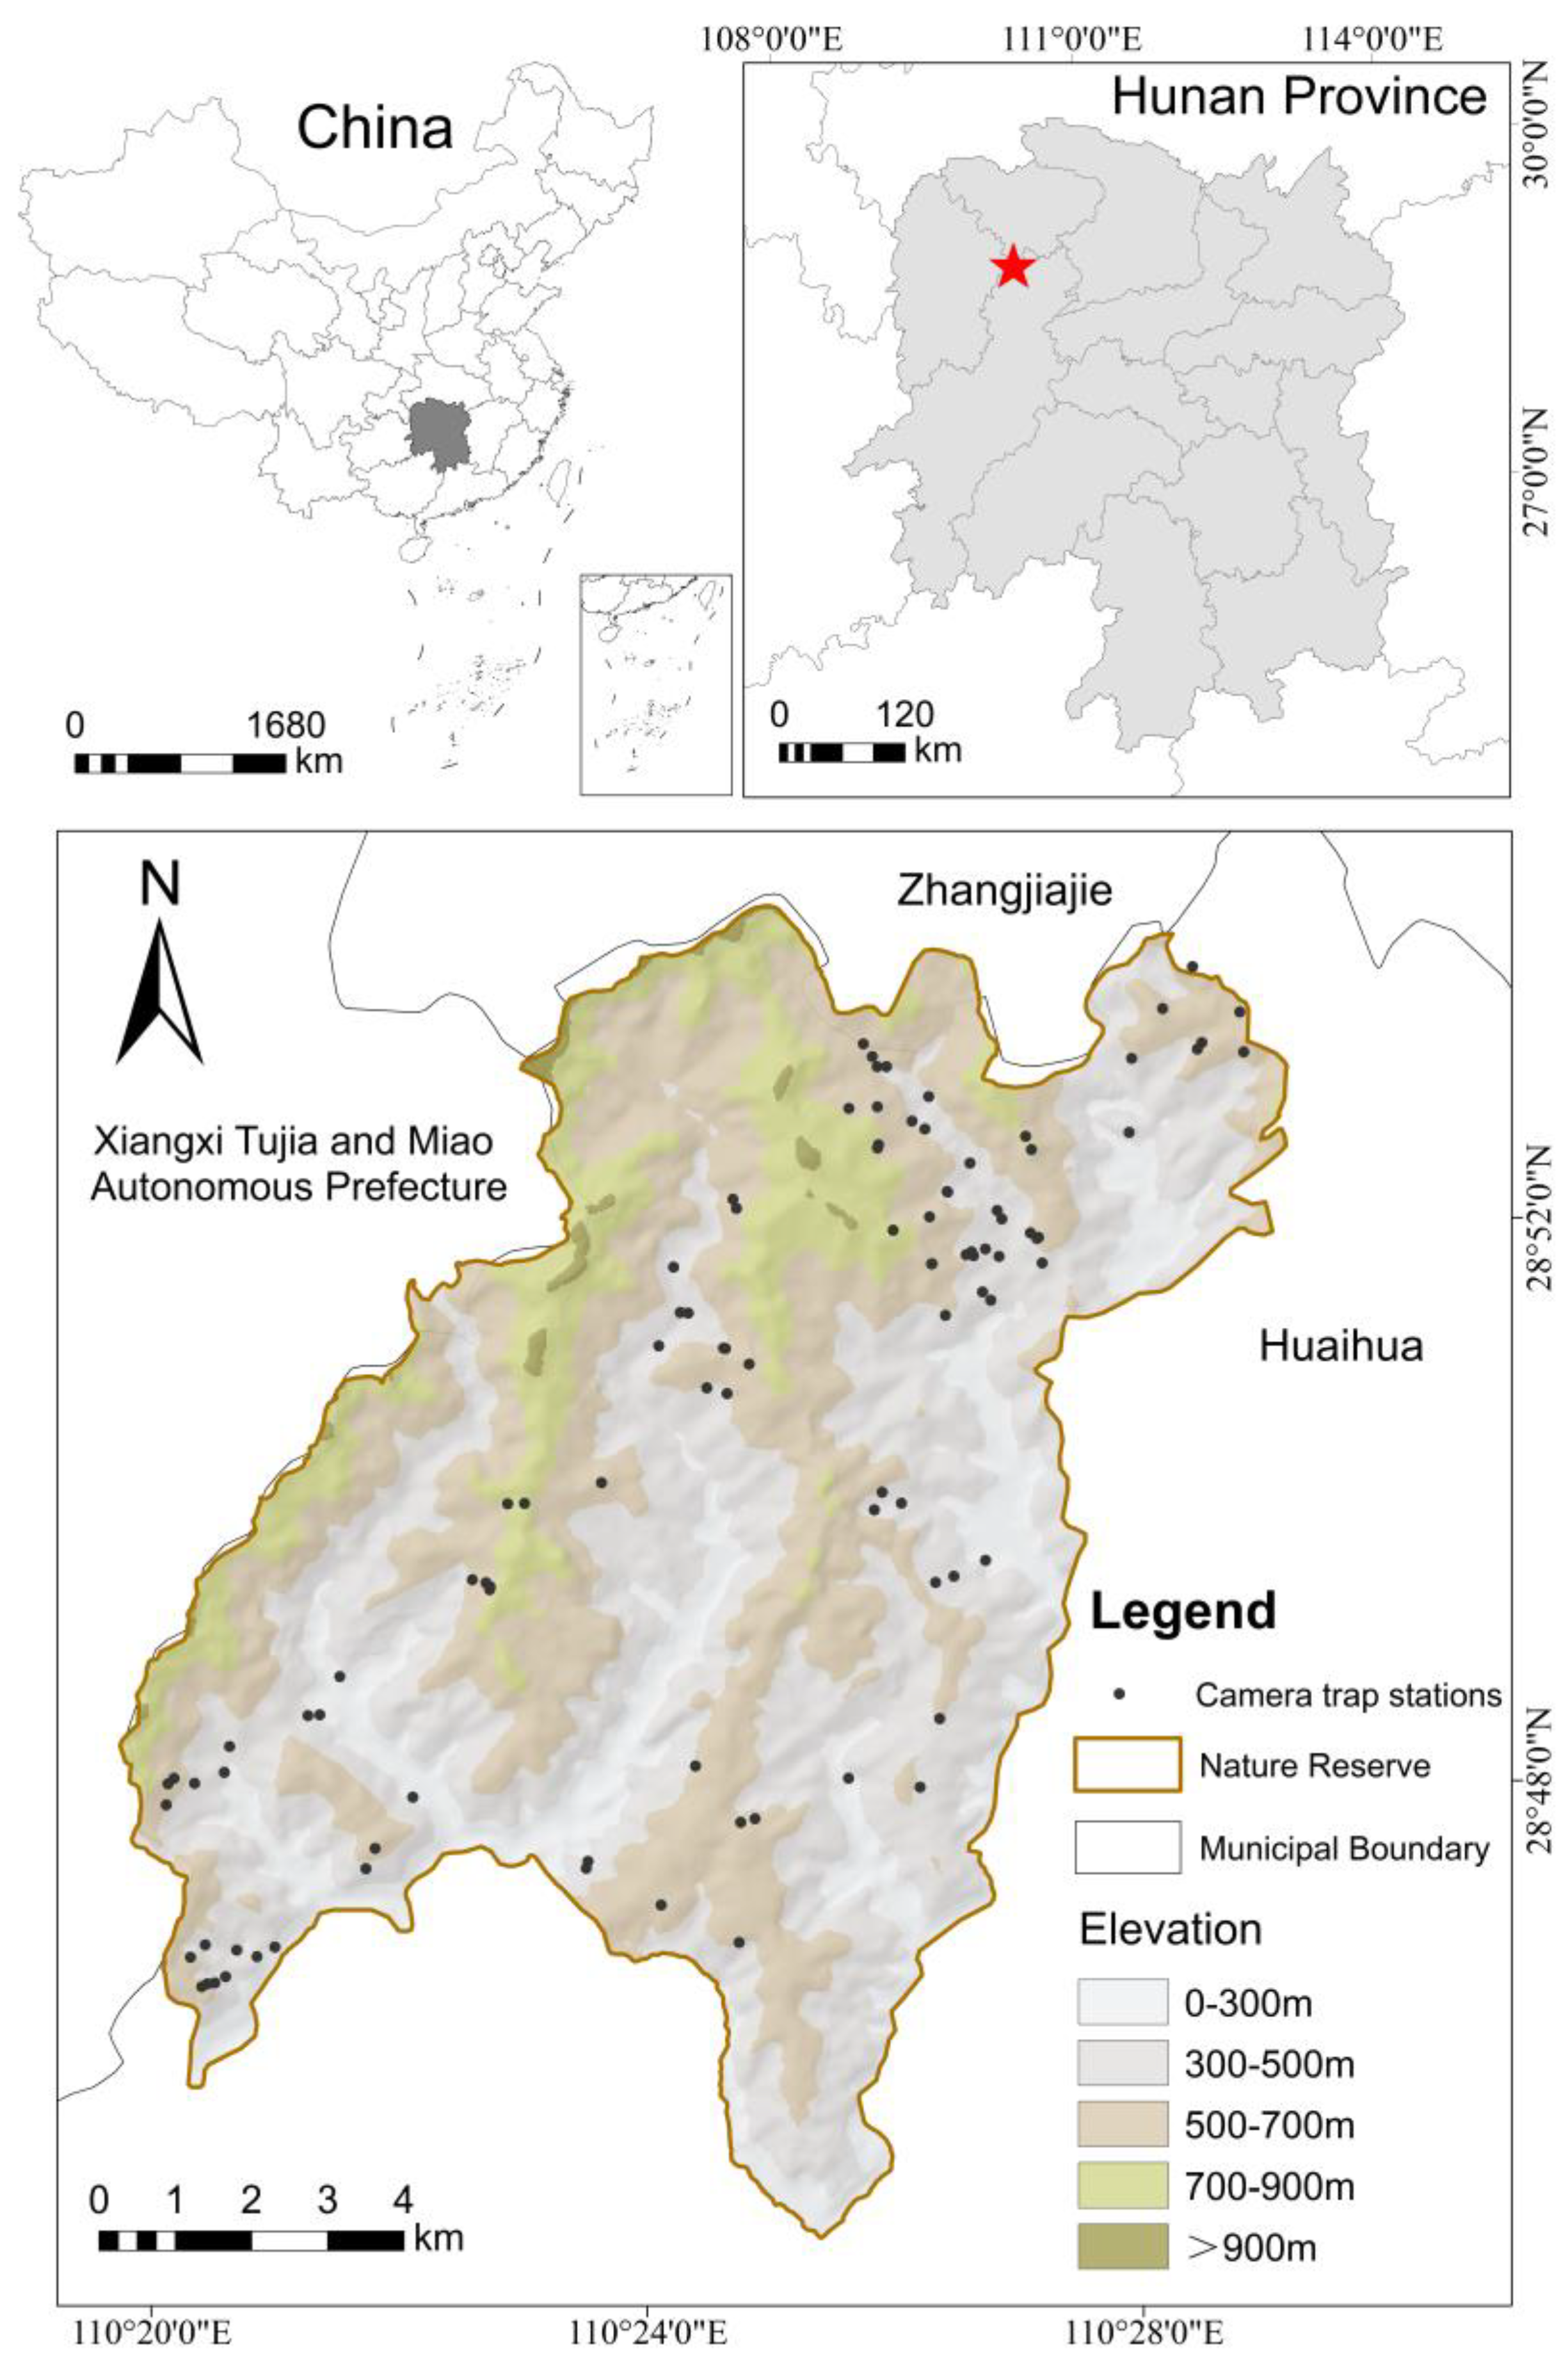
2.1. Study Area

Jiemuxi National Nature Reserve (110°19′45″ to 110°29′16″ E, 28°45′51″ to 28°54′04″ N) is situated in the northwest of Hunan Province, China, with a total area of 130.41 km2, falling within the boundaries of the Wuling Mountain System and Xuefeng Mountain Range, which are among the 200 ecologically significant regions of international significance worldwide [44]. The reserve borders two adjacent nature reserves: Xiaoxi National Nature Reserve (Yongshun County) and Zhangjiajie Chinese Giant Salamander National Nature Reserve (Zhangjiajie City) (Figure 1). The reserve is located in a central subtropical humid monsoon climate zone, with a mean annual temperature of 14.7 °C and mean annual precipitation of 1613.8 mm. Its complex topography features prominent valley and karst landforms, which have experienced minimal anthropogenic disturbance. The reserve supports extensive natural secondary forests with high diversity, where evergreen broad-leaved forests dominate as the zonal vegetation type [45]. In the reserve, 242 species of terrestrial vertebrates have been discovered, accounting for 38.29% of the terrestrial vertebrates in Hunan Province. There are a large number of rare species such as Elliot’s pheasant, the golden pheasant, the red-billed leiothrix (Leiothrix lutea, Scopoli, 1786), the small Indian civet (Viverricula indica, É. Geoffroy Saint-Hilaire, 1803), the forest musk deer (Moschus berezovskii, Flerov, 1929), the leopard cat, and the Chinese serow (Capricornis sumatraensis, Bechstein, 1799).

2.2. Data Collection

2.2.1. Camera Traps Survey

As an effective tool for wildlife monitoring, infrared camera technology provides distinct advantages in detecting elusive and low-density animal populations due to its non-invasive nature and continuous operational capability. Consequently, this method has become a standard approach in ecological research and conservation practices globally [46,47]. From January 2019 to August 2024, we deployed 90 infrared cameras across the protected area for wildlife monitoring (Figure 1). Camera locations were strategically selected based on four key factors: (1) topography, (2) vegetation types, (3) wildlife activity frequency, and (4) human disturbance. The study utilized two infrared camera models (UVL4 and UVL5), positioned 40–100 cm above ground level following standardized protocols. To minimize solar interference and optimize detection efficiency, all cameras were oriented along the north-south axis [48]. Camera parameters were configured as follows: medium sensitivity, and the shooting mode consists of taking 3 consecutive photos and a 15 s video. After camera installation, the information of each camera was meticulously recorded. Camera data were retrieved every 3–4 months, during which we verified camera functionality and replaced batteries and memory cards as needed.
All photos or videos of the same species captured at the same camera site within an interval of less than 30 min were considered as one independent valid photo, and the timestamp of each independent valid photo was recorded [49]. The Relative Abundance Index (RAI) was calculated using the following standardized formula:
R A I = A i N × 100
In the formula, Ai represents the number of independent detections of a species, and N represents the total number of independent and valid photos across all species [50].

2.2.2. Environment Variables
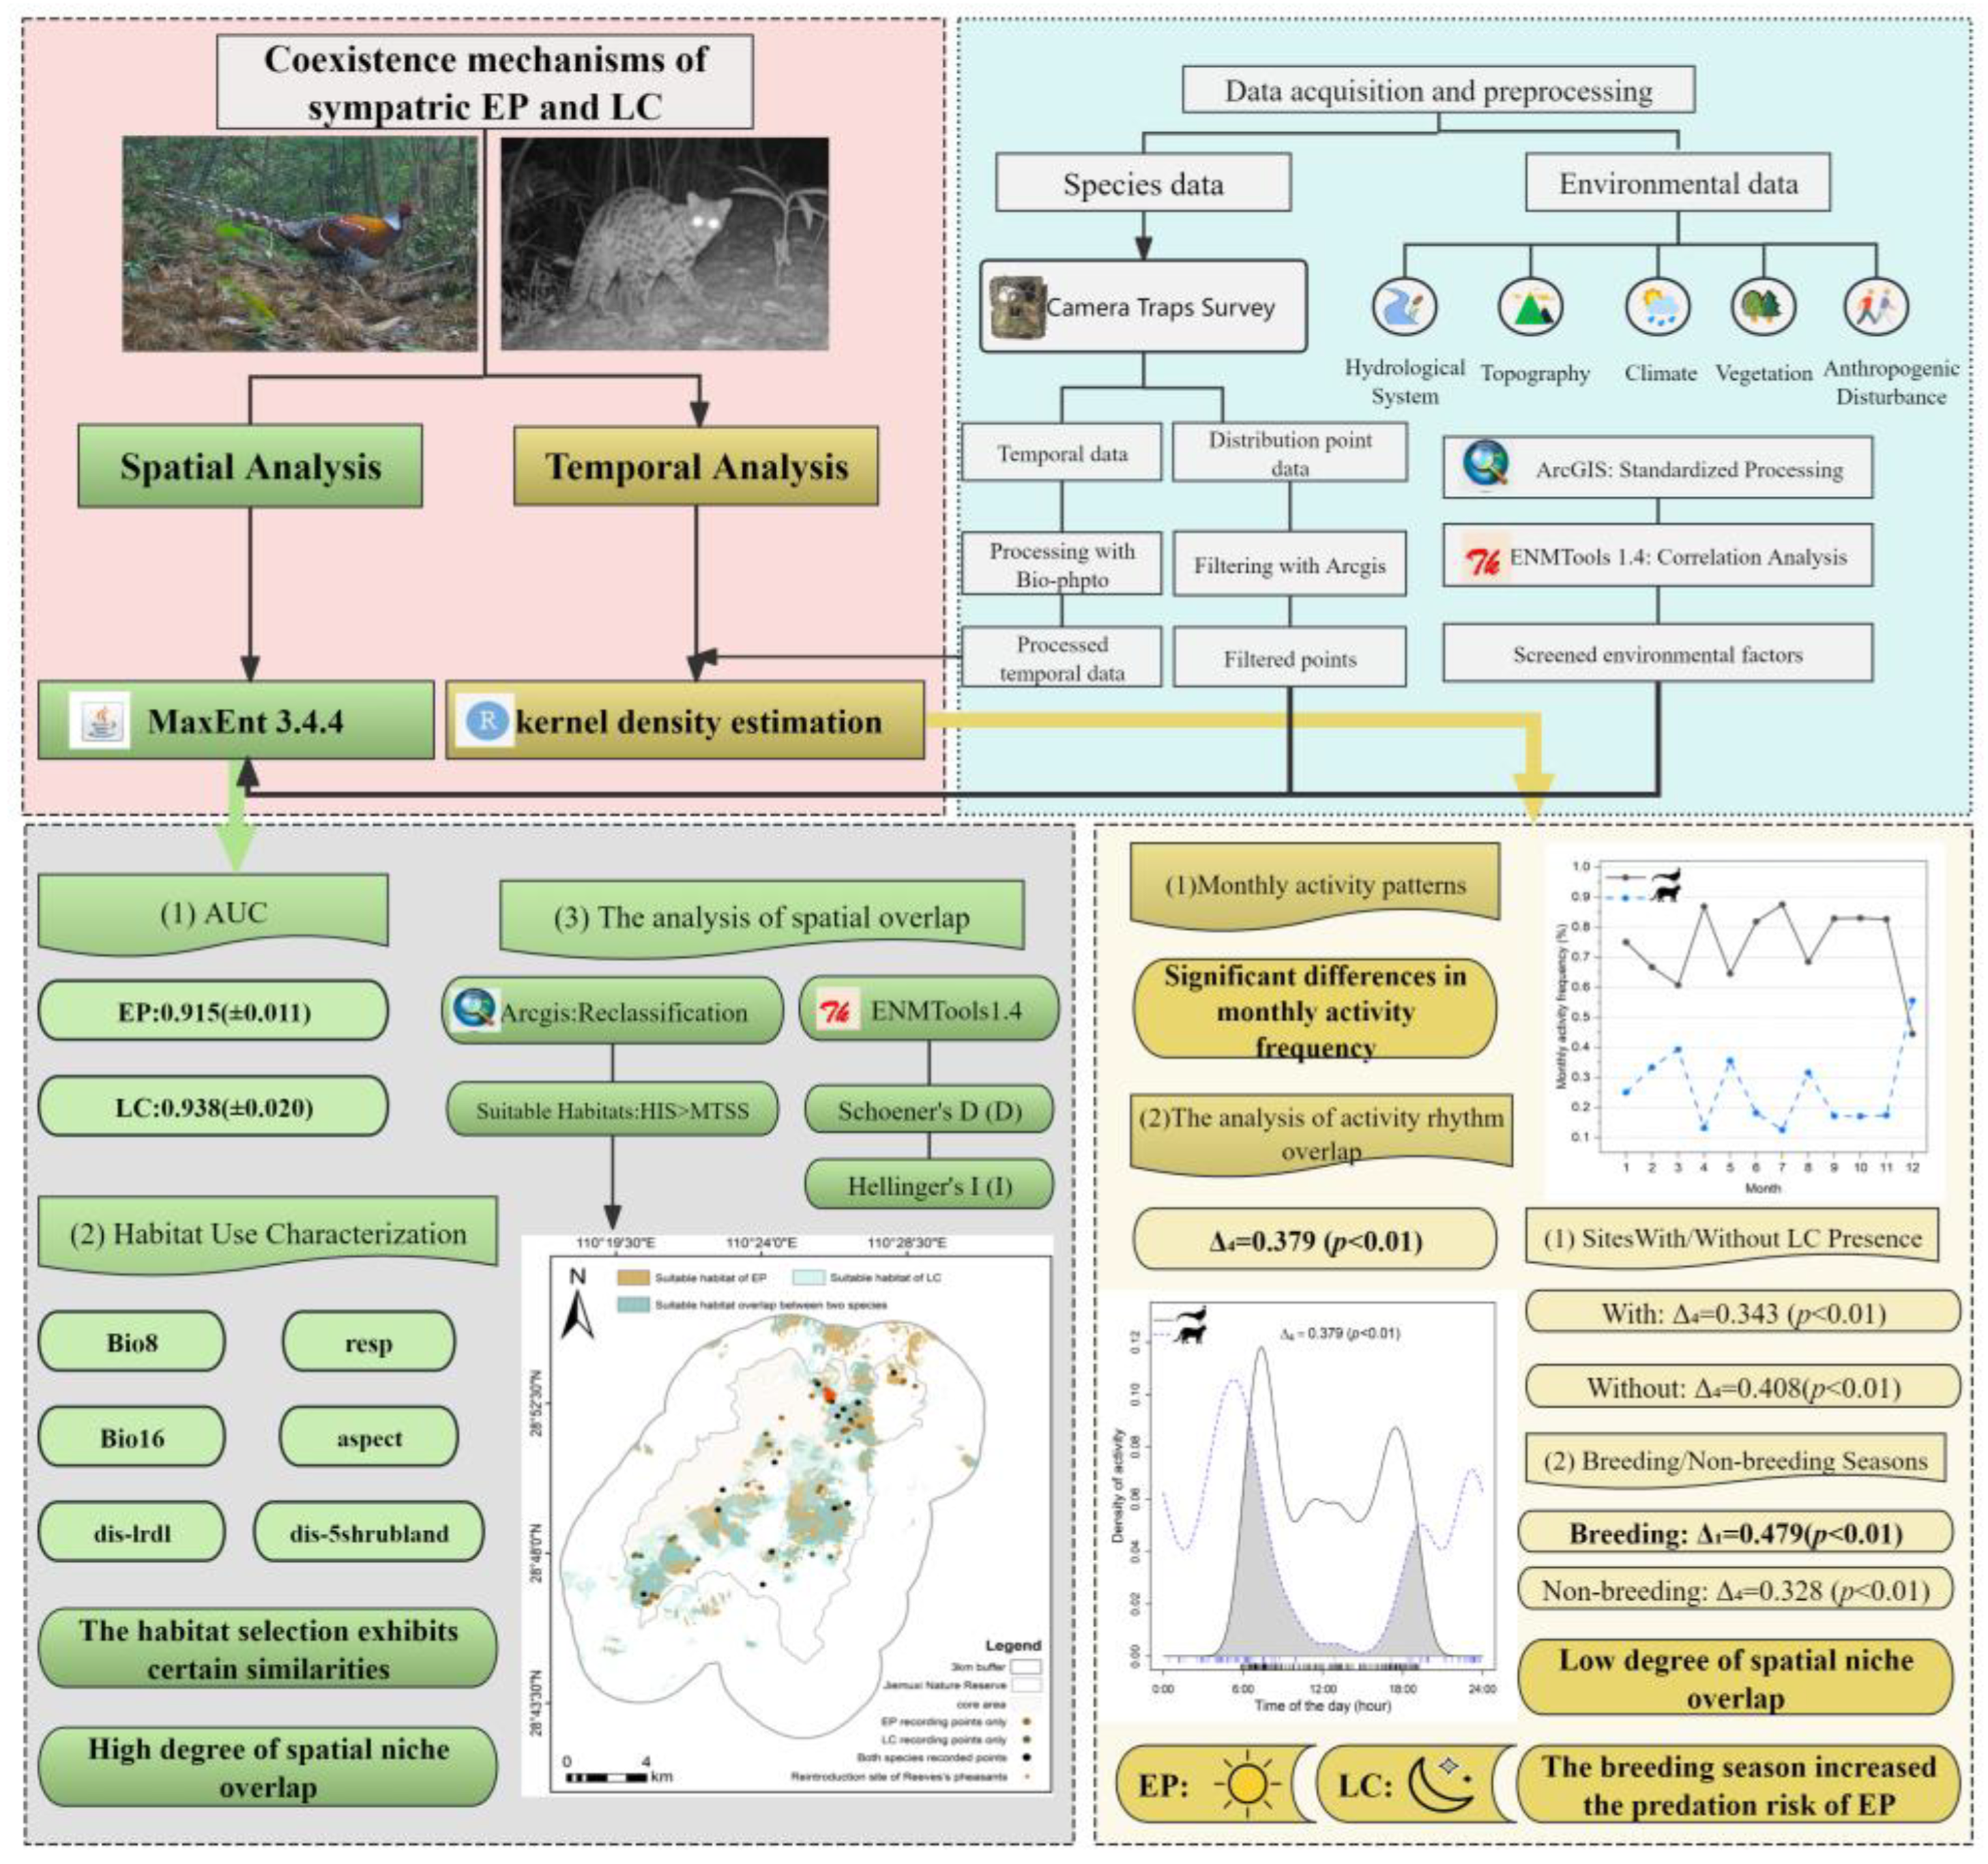
Following similar studies, we selected four environmental factors, including bioclimate, topography, vegetation, and disturbance factors, to construct the pertinent model [51,52,53]. Bioclimatic variables were obtained from WorldClim (version 2.0; http://www.worldclim.org, accessed on 23 November 2024), and data from 1970–2000 were selected as the 19 bioclimatic factors for the current period, with a data accuracy of 30 arc-seconds (~1 km). Hydrological and human disturbance data were sourced from the National Catalogue Service for Geographic Information (https://www.webmap.cn, accessed on 24 November 2024). Topographic variables were derived from 30 m resolution ASTER GDEM elevation data (Geospatial Data Cloud; https://www.gscloud.cn/search, accessed on 24 November 2024). Vegetation variables were obtained from the GLC_FCS30 global 30 m resolution land cover product developed by Zhang et al. [54]. Normalized Difference Vegetation Index (NDVI) data were obtained from the China 30 m resolution annual maximum NDVI dataset, provided by the National Ecosystem Science Data Center, National Science & Technology Infrastructure of China [55]. In total, 31 environmental variables were initially included in the model framework (Table 1).
In ArcGIS 10.8, all environmental variables were standardized through a three-step preprocessing procedure. First, the spatial extent of all environmental data layers was clipped to align precisely with the study area boundaries. Second, we standardized the spatial resolution to 30 m × 30 m using resampling to maintain data consistency. Finally, all raster data were converted to the WGS 1984 UTM Zone 49 N coordinate system and exported in ASCII format for subsequent analysis. Environmental variable selection critically influences niche model and distribution predictions. Excessive variables will increase the dimension of ecological space, potentially compromising model reliability. Therefore, scientific variable selection is essential to enhance model accuracy [56]. Firstly, we excluded variables contributing less than 1% to the initial model. Secondly, we conducted Pearson correlation analysis using ENMTools 1.4. For highly correlated variable pairs (|r| ≥ 0.8), we retained only the variable with higher contribution rates [57,58]. Finally, a total of 17 and 14 environmental variables were used to generate two model results, for Elliot’s pheasant and the leopard cat, respectively.

2.3. Data Analysis

2.3.1. Spatial Scale

The MaxEnt model predicts species habitat suitability by estimating probability distributions based on maximum entropy theory, utilizing species occurrence records and environmental variables. Compared with other models, the MaxEnt model demonstrates superior predictive accuracy, enhanced model stability, and reduced estimation errors, making it particularly valuable for the habitat suitability assessment of rare and endangered animals and plants [52,59,60]. In this study, we conducted the analysis using MaxEnt version 3.4.4 (https://biodiversityinformatics.amnh.org/open_source/maxent/, accessed on 23 September 2023). To minimize edge effects, we established a 3 km buffer zone extending outward from the Jiemuxi Nature Reserve boundary. This buffered area served as the study extent for all model predictions and analyses in MaxEnt [61]. To mitigate spatial autocorrelation bias, we retained only one occurrence point per 30 m × 30 m environmental grid cell [62]. In the end, 46 Elliot’s pheasant sites and 32 leopard cat sites were retained for subsequent analysis.
During the model construction process, 75% of the data were used for model training, and the remaining 25% were reserved for model validation [52]. We assessed variable importance using jackknife resampling and performed model validation through 10 bootstrap iterations per species. The average prediction values across these 10 iterations were adopted as the final output. The accuracy of the MaxEnt model was evaluated using the area under curve (AUC) of ROC to evaluate the model performance. Model performance was classified as follows: poor (AUC ≤ 0.7), moderate (0.7 < AUC < 0.9), or excellent (AUC ≥ 0.9) [59].
Based on the Habitat Suitability Index (HSI) derived from the MaxEnt model, a threshold method was used to classify habitat classes: The Maximum Training Sensitivity plus Specificity (MTSS) threshold was employed to distinguish suitable habitats, with areas exceeding this threshold (HSI > MTSS) classified as suitable. Finally, the study area was categorized into two classes: suitable and non-suitable [63,64]. The raster data were reclassified by ArcGIS 10.8 to quantify the area of each class and visualize the spatial distribution.
We quantified the spatial niche overlap between Elliot’s pheasant and the leopard cat using ENMTools1.4. Niche overlap was quantified using Schoener’s D (D) and Hellinger’s I (I) indices. Schoener’s D measures spatial distribution overlap between niches, while Hellinger’s I assesses the similarity of ecological niches in environmental variables. D and I were in the range of [0, 1], with values approaching 1 indicating greater niche similarity between species [65,66].

2.3.2. Temporal Scale

To investigate the temporal niche relationship between Elliot’s pheasant and the leopard cat, we analysed their diel activity patterns using kernel density estimation [67,68]. Based on the camera-trap data, systematic sampling was conducted on the independent and valid detection photos of the two species. The KDE curves were constructed through the ‘activity’ package in R, and the ‘overlap’ package was applied to generate overlapping maps of daily activity at different time scales [69,70].
For temporal niche analysis, we quantified species overlap using the Δ coefficient (Δ4 for sample sizes ≥75; otherwise Δ1), which ranges from 0 to 1. According to the determination criteria established by Allen et al,: Δ ≤ 0.5 indicates low overlap, 0.5 < Δ < 0.8 indicates moderate overlap, and Δ ≥ 0.8 indicates high overlap [71,72,73]. To verify the statistical differences between the daily activity patterns of the two species, we applied the compareCkern function in the ‘activity’ package to test for differences, setting the significance threshold at p < 0.05 [67,74]. All analyses were conducted in R Studio (v2024.12.1) (https://posit.co/downloads/, accessed on 17 February 2025) (Figure 2).
To evaluate seasonal activity variations between Elliot’s pheasant and the leopard cat, we computed each species’ monthly detection proportion (individual species’ detections relative to combined monthly records), generating a percentage-based activity index. This standardized approach controls for absolute detection variations and confounding factors, with consistent camera-trap deployment (identical units/duration) ensuring comparable data across sampling periods [75].

3. Results

3.1. Camera-Trapping Results

From January 2019 to August 2024, the infrared cameras monitored a cumulative total of 36,946 efficient camera days, obtaining 7935 independent records of wildlife species and 309 records of the target species, including 227 independent and effective photos of Elliot’s pheasant (Figure 3c) and 82 independent and effective photos of the leopard cat (Figure 3b) (Table S2). A total of 51 cameras captured Elliot’s pheasant, while 35 cameras captured the leopard cat, accounting for 58.89% and 38.89% of all cameras, respectively (Figure 3a). The RAI of Elliot’s pheasant was 2.86, and that of the leopard cat was 1.03. Besides Elliot’s pheasant, three other Galliformes species were recorded within the reserve: the golden pheasant, the Koklass pheasant, and the Chinese bamboo partridge (Bambusicola thoracicus, Temminck, 1815).

3.2. Spatial Analysis

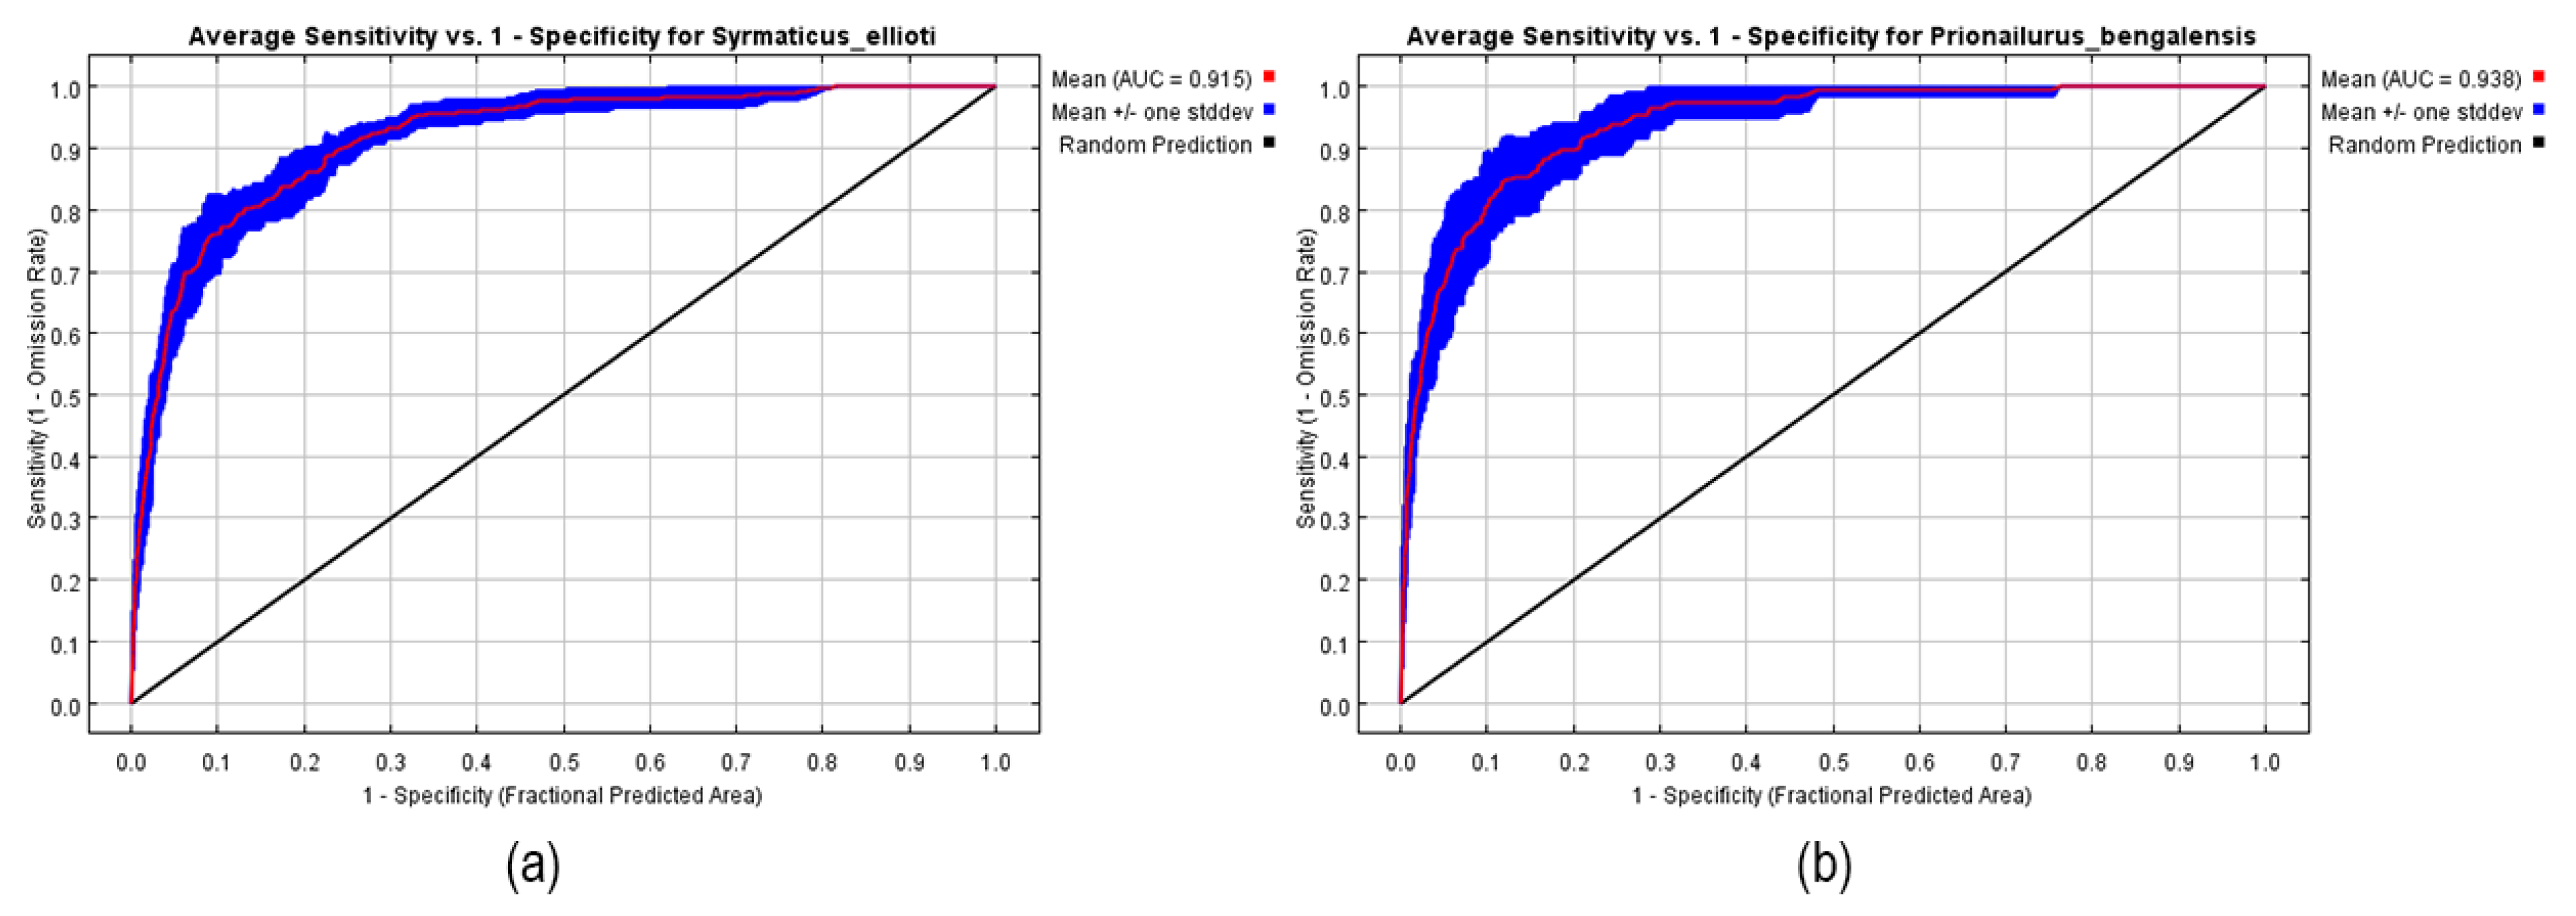
3.2.1. Model Performance

The average AUC value across 10 runs was 0.915 (±0.011) and 0.938 (±0.020) for Elliot’s pheasant and the leopard cat. This shows that the MaxEnt model has achieved an excellent level in predicting the potential suitable habitats of both Elliot’s pheasant and the leopard cat within the study extent and can accurately predict the spatial suitability of the two species. It can be used for subsequent analysis (Figure 4).

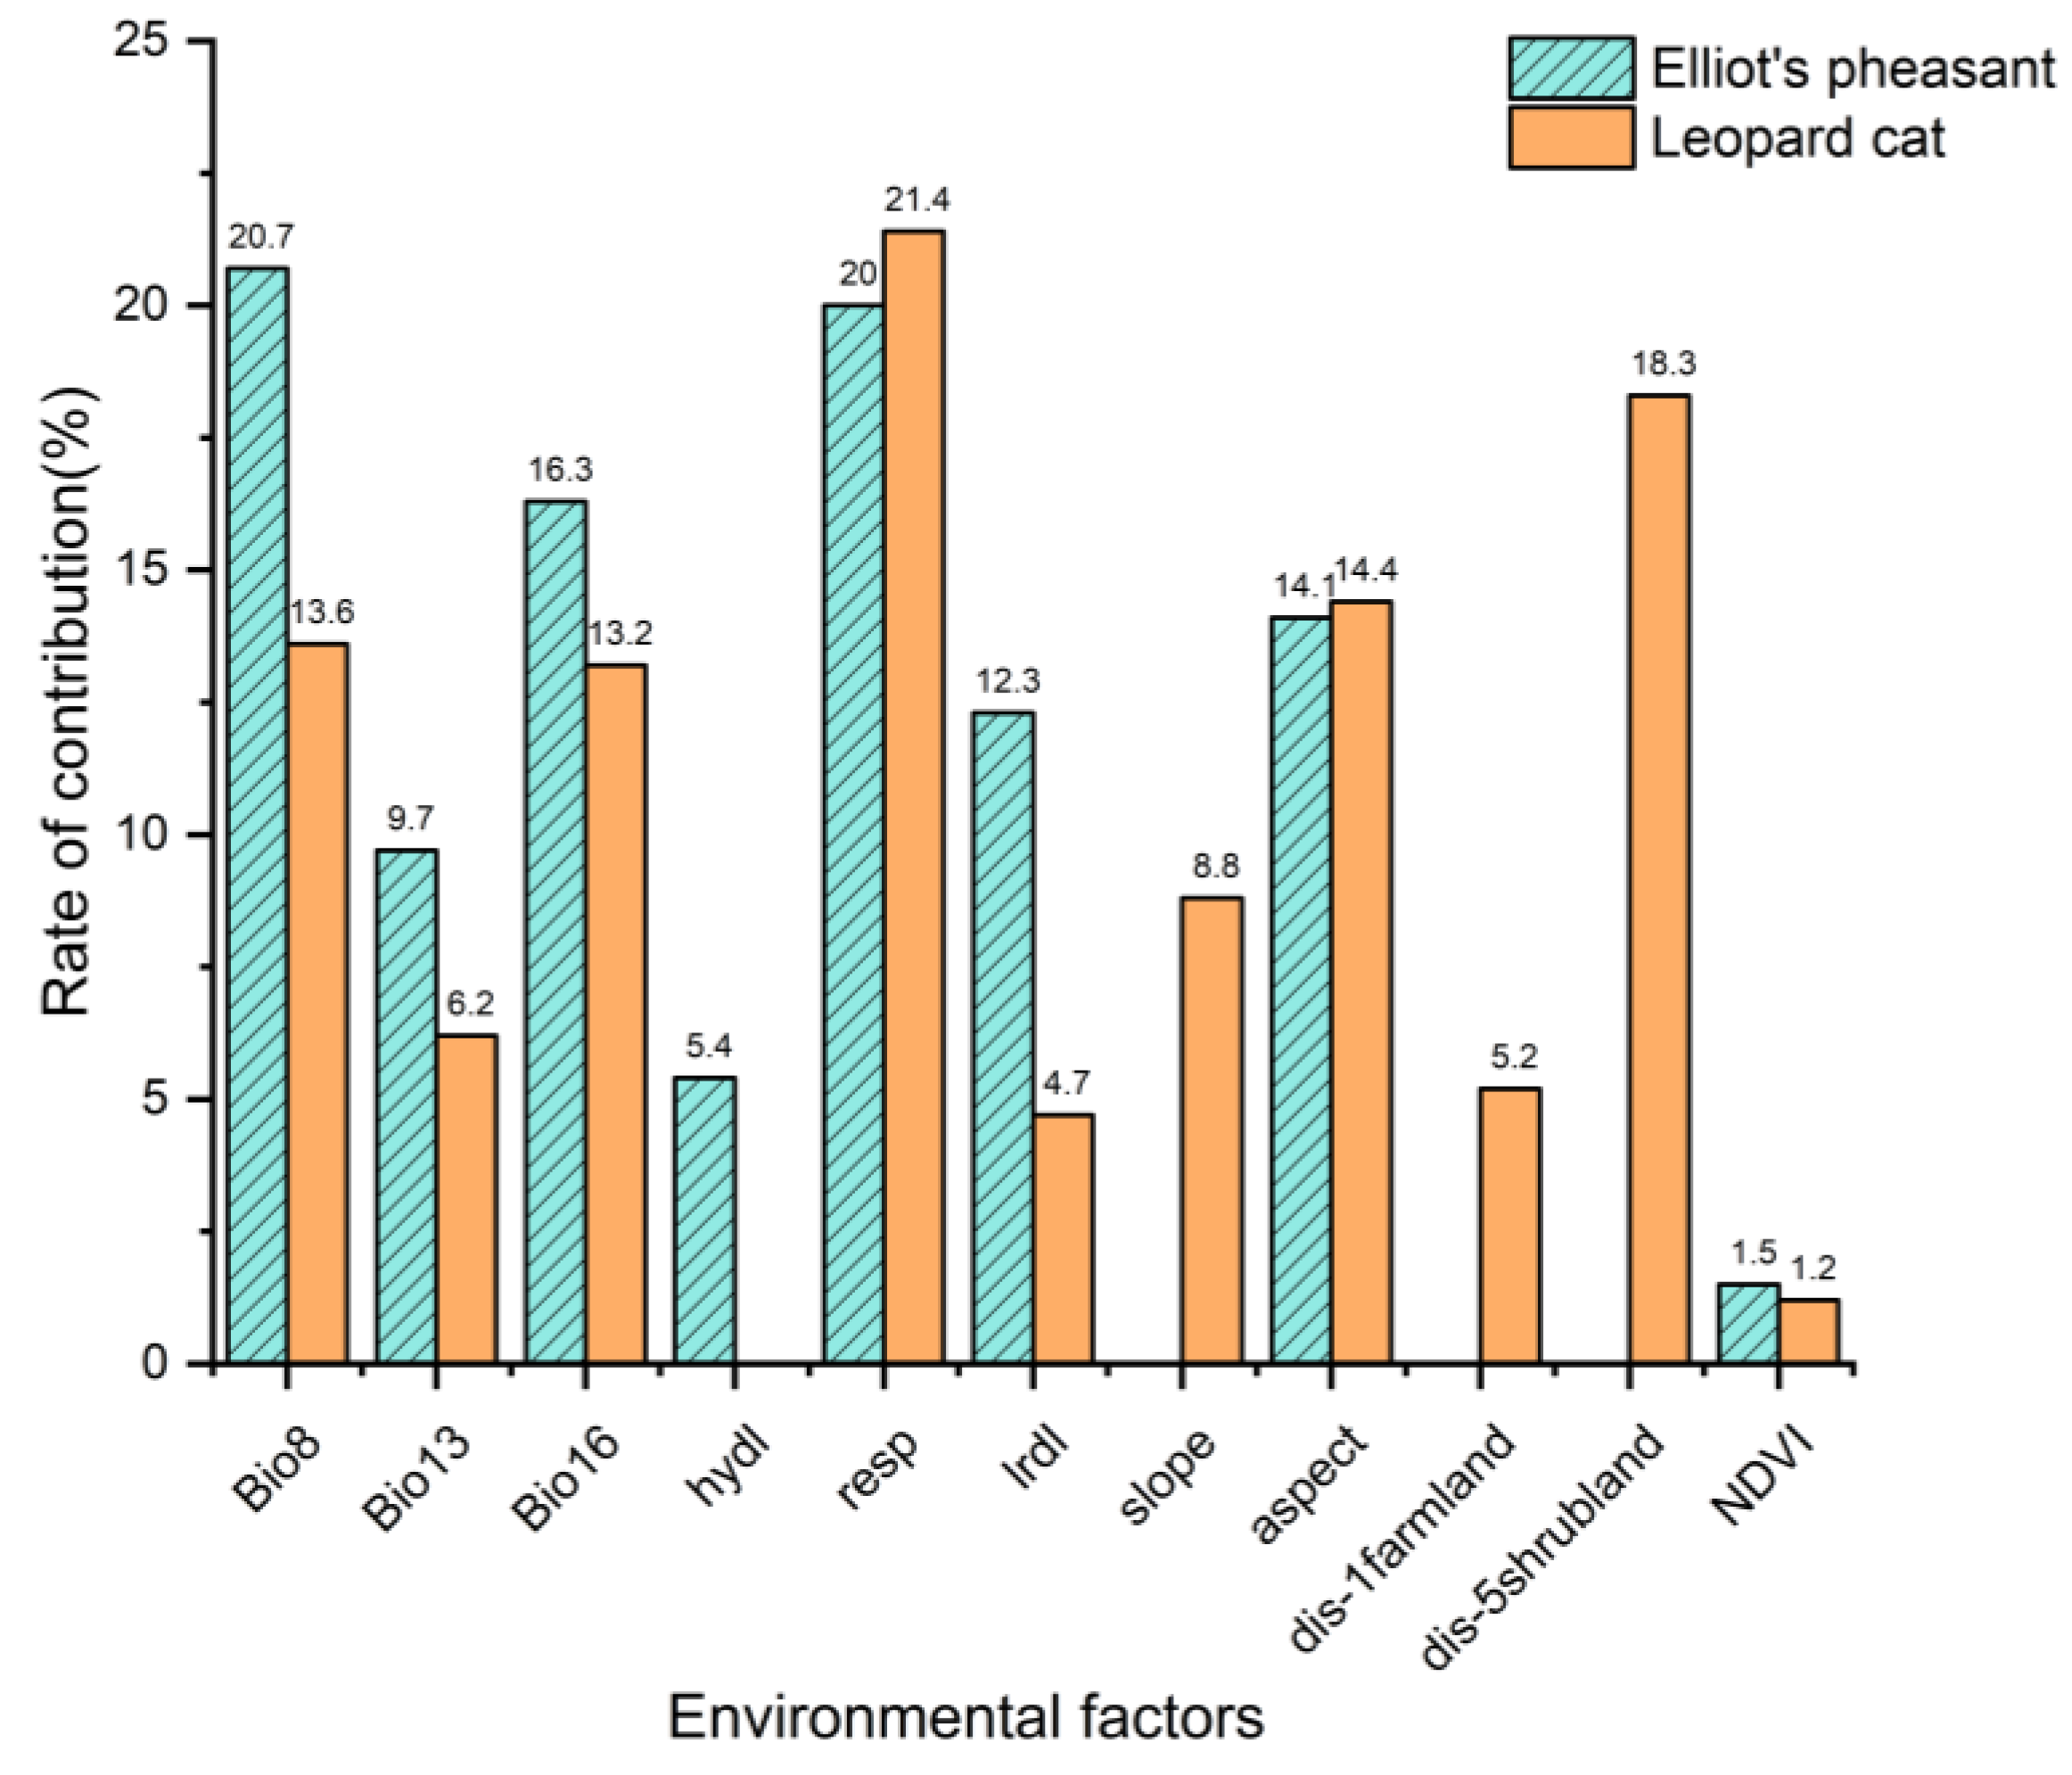
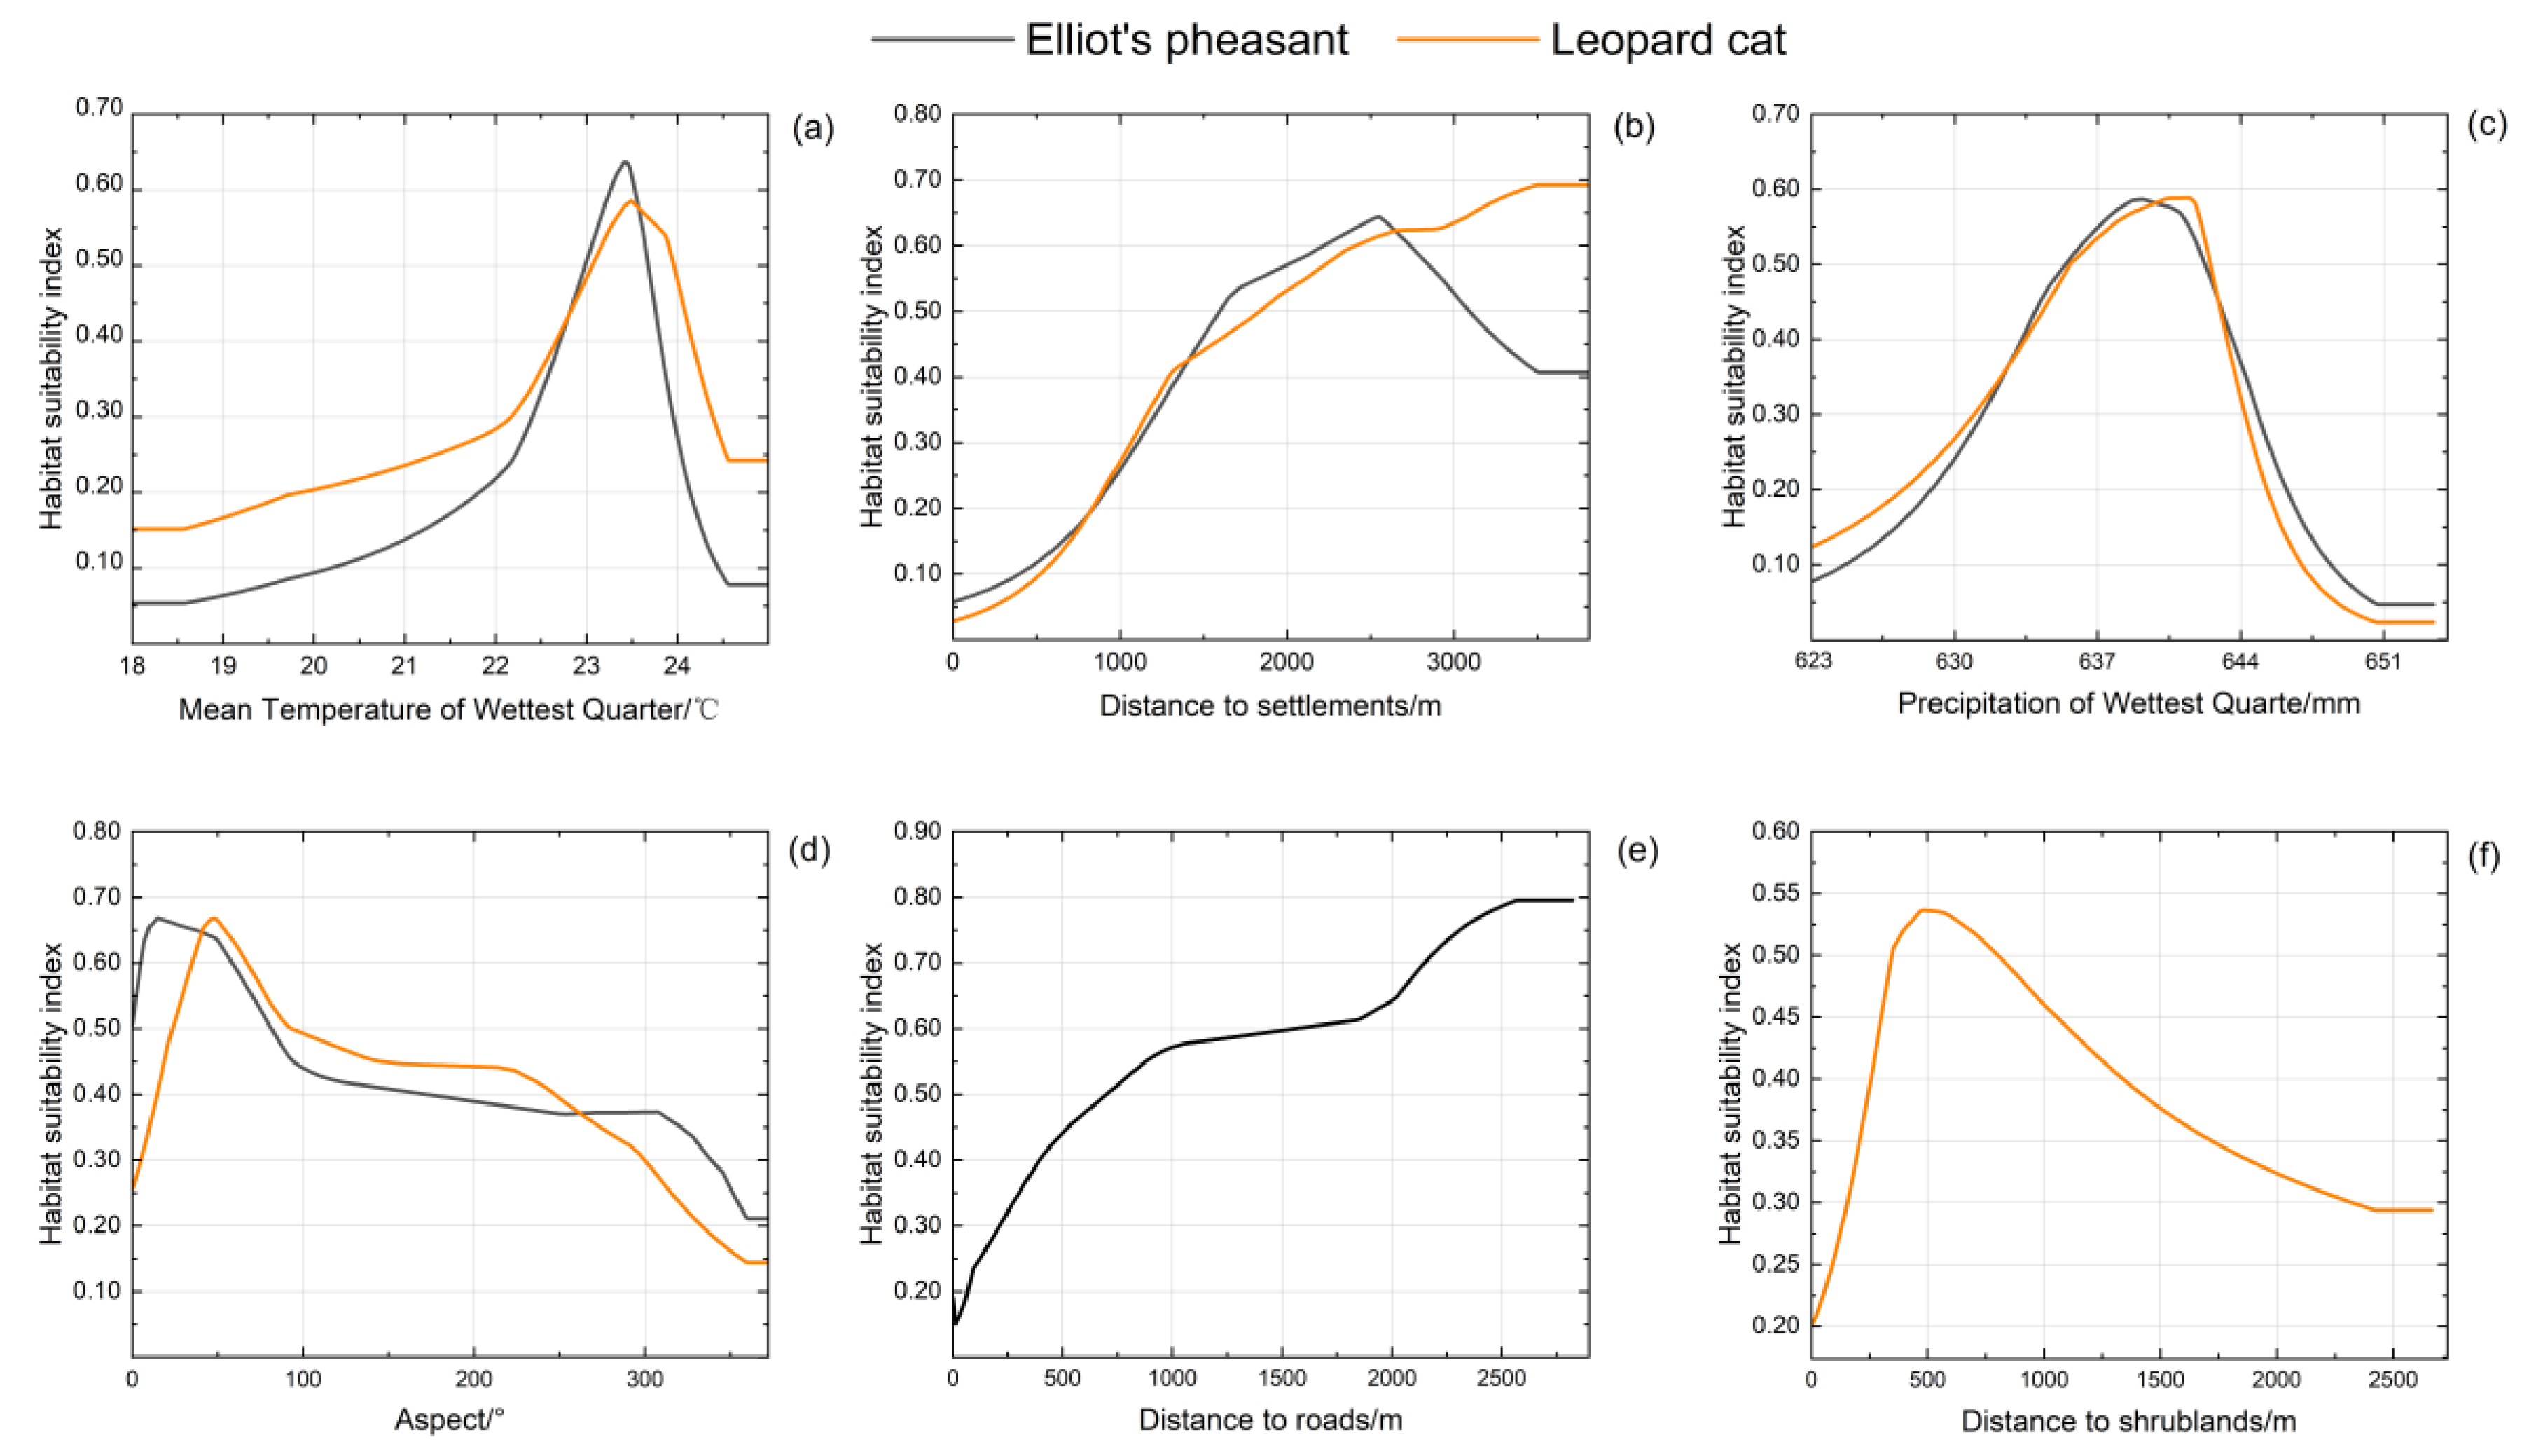
3.2.2. Habitat Use Characterization

The Jackknife testing indicates that the environmental variables influencing the distribution of Elliot’s pheasant and the leopard cat are similar. The main environmental variables affecting the distribution of Elliot’s pheasant are Bio8 (20.7%), resp (20.0%), Bio16 (16.3%), aspect (14.1%), and dis-lrdl (12.3%), with a cumulative contribution rate of 83.4%. The main environmental variables affecting the distribution of the leopard cat were different, including resp (21.4%), aspect (14.4%), Bio8 (13.6%), Bio16 (13.2%), and dis-5shrubland (11.2%), with a cumulative contribution rate of 73.8% (Figure 5).
Response curves of main environmental variables were analyzed to assess habitat selection preferences and interspecific differences between the two species (Figure 6). Elliot’s pheasant exhibited a preference for habitats with shaded slopes (aspect), greater distances from roads (dis-lrdl) and settlements (resp), a mean temperature of 22.9–23.4 °C in the wettest quarter (Bio8), and precipitation of 635.54–647.22 mm in the wettest quarter (Bio16). In contrast, the leopard cat showed a preference for shrubland edges (dis-5shrubland), greater distances from settlements (resp), and shaded slopes (aspect), while its optimal ranges for mean temperature (Bio8, 23.0–23.4 °C) and precipitation (Bio16, 635.43–642.37 mm) of the wettest quarter closely overlapped with those of Elliot’s pheasant.

3.2.3. Spatial Overlaps and Habitat Suitability Assessment

According to the result of MaxEnt operation, the MTSS values for Elliot’s pheasant and the leopard cat were 0.4113 and 0.3445, respectively. Using the habitat suitability reclassification method described above (2.3.1), we obtained the following results: within the Jiemuxi Nature Reserve, Elliot’s pheasant occupied 32.44 km2 of suitable habitat (24.88% of the reserve), while the leopard cat occupied 36.62 km2 of suitable habitat (28.08% of the reserve) (Table 2).
The results of ENMTools showed that the spatial ecological niche overlap between Elliot’s pheasant and the leopard cat was high, with overlap indexes of I = 0.948 and D = 0.757. The overlapping area of suitable habitats for Elliot’s pheasant and the leopard cat was 21.38 km2, accounting for 16.40% of the total area of the reserve. Notably, those areas accounted for 65.91% of Elliot’s pheasant’s total suitable habitat and 58.39% of the leopard cat’s suitable range (Figure 3a).

3.3. Temporal Analysis

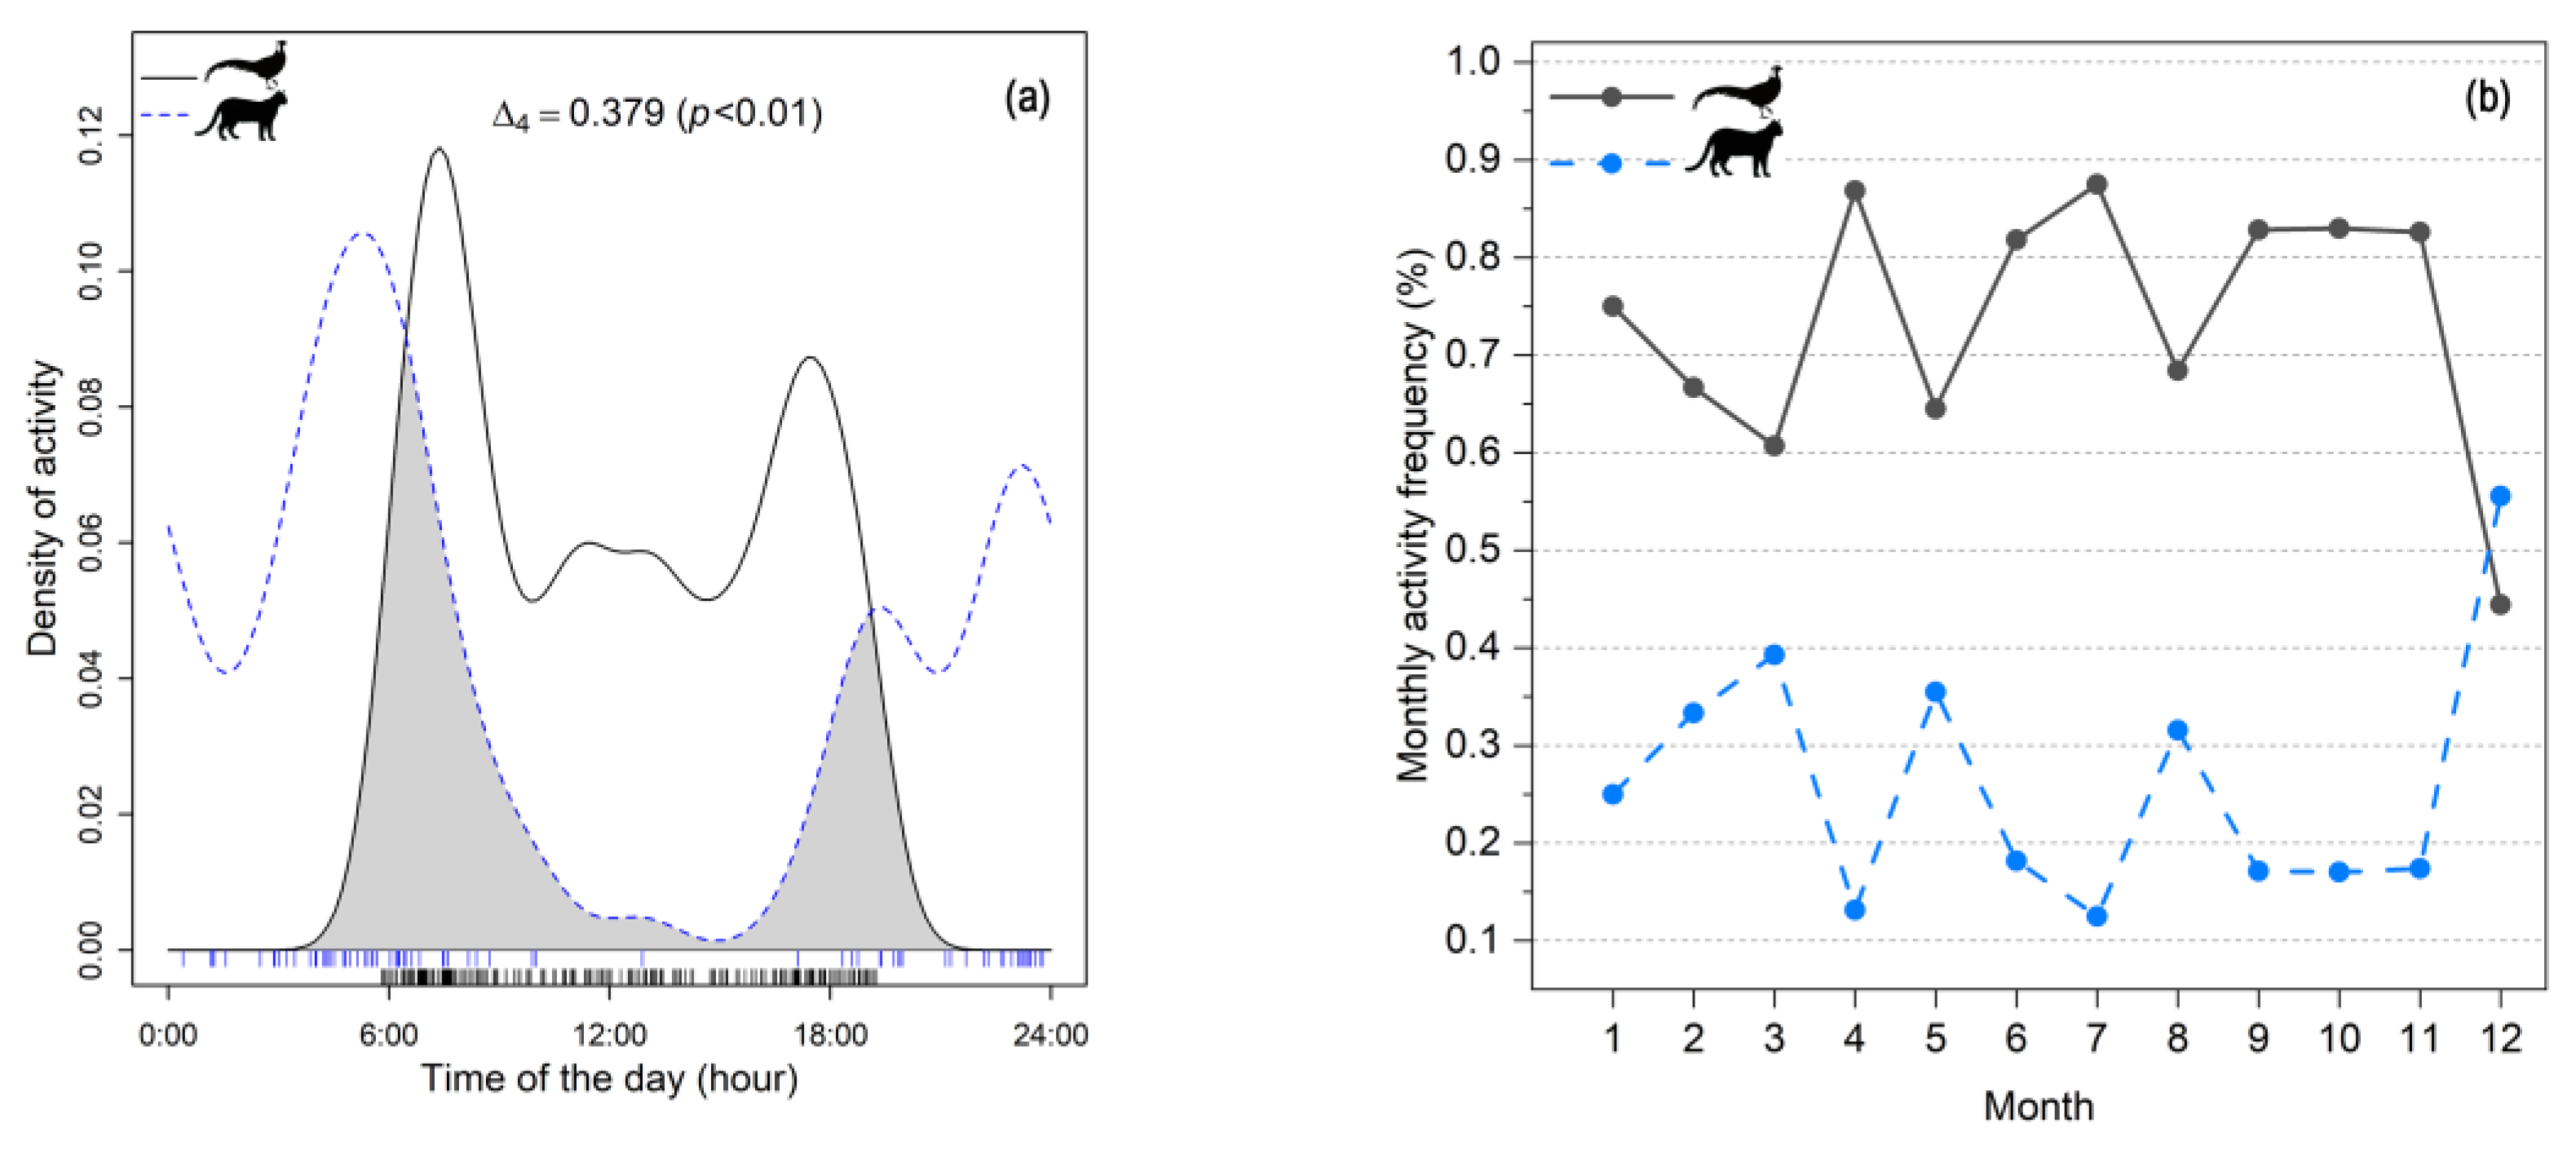
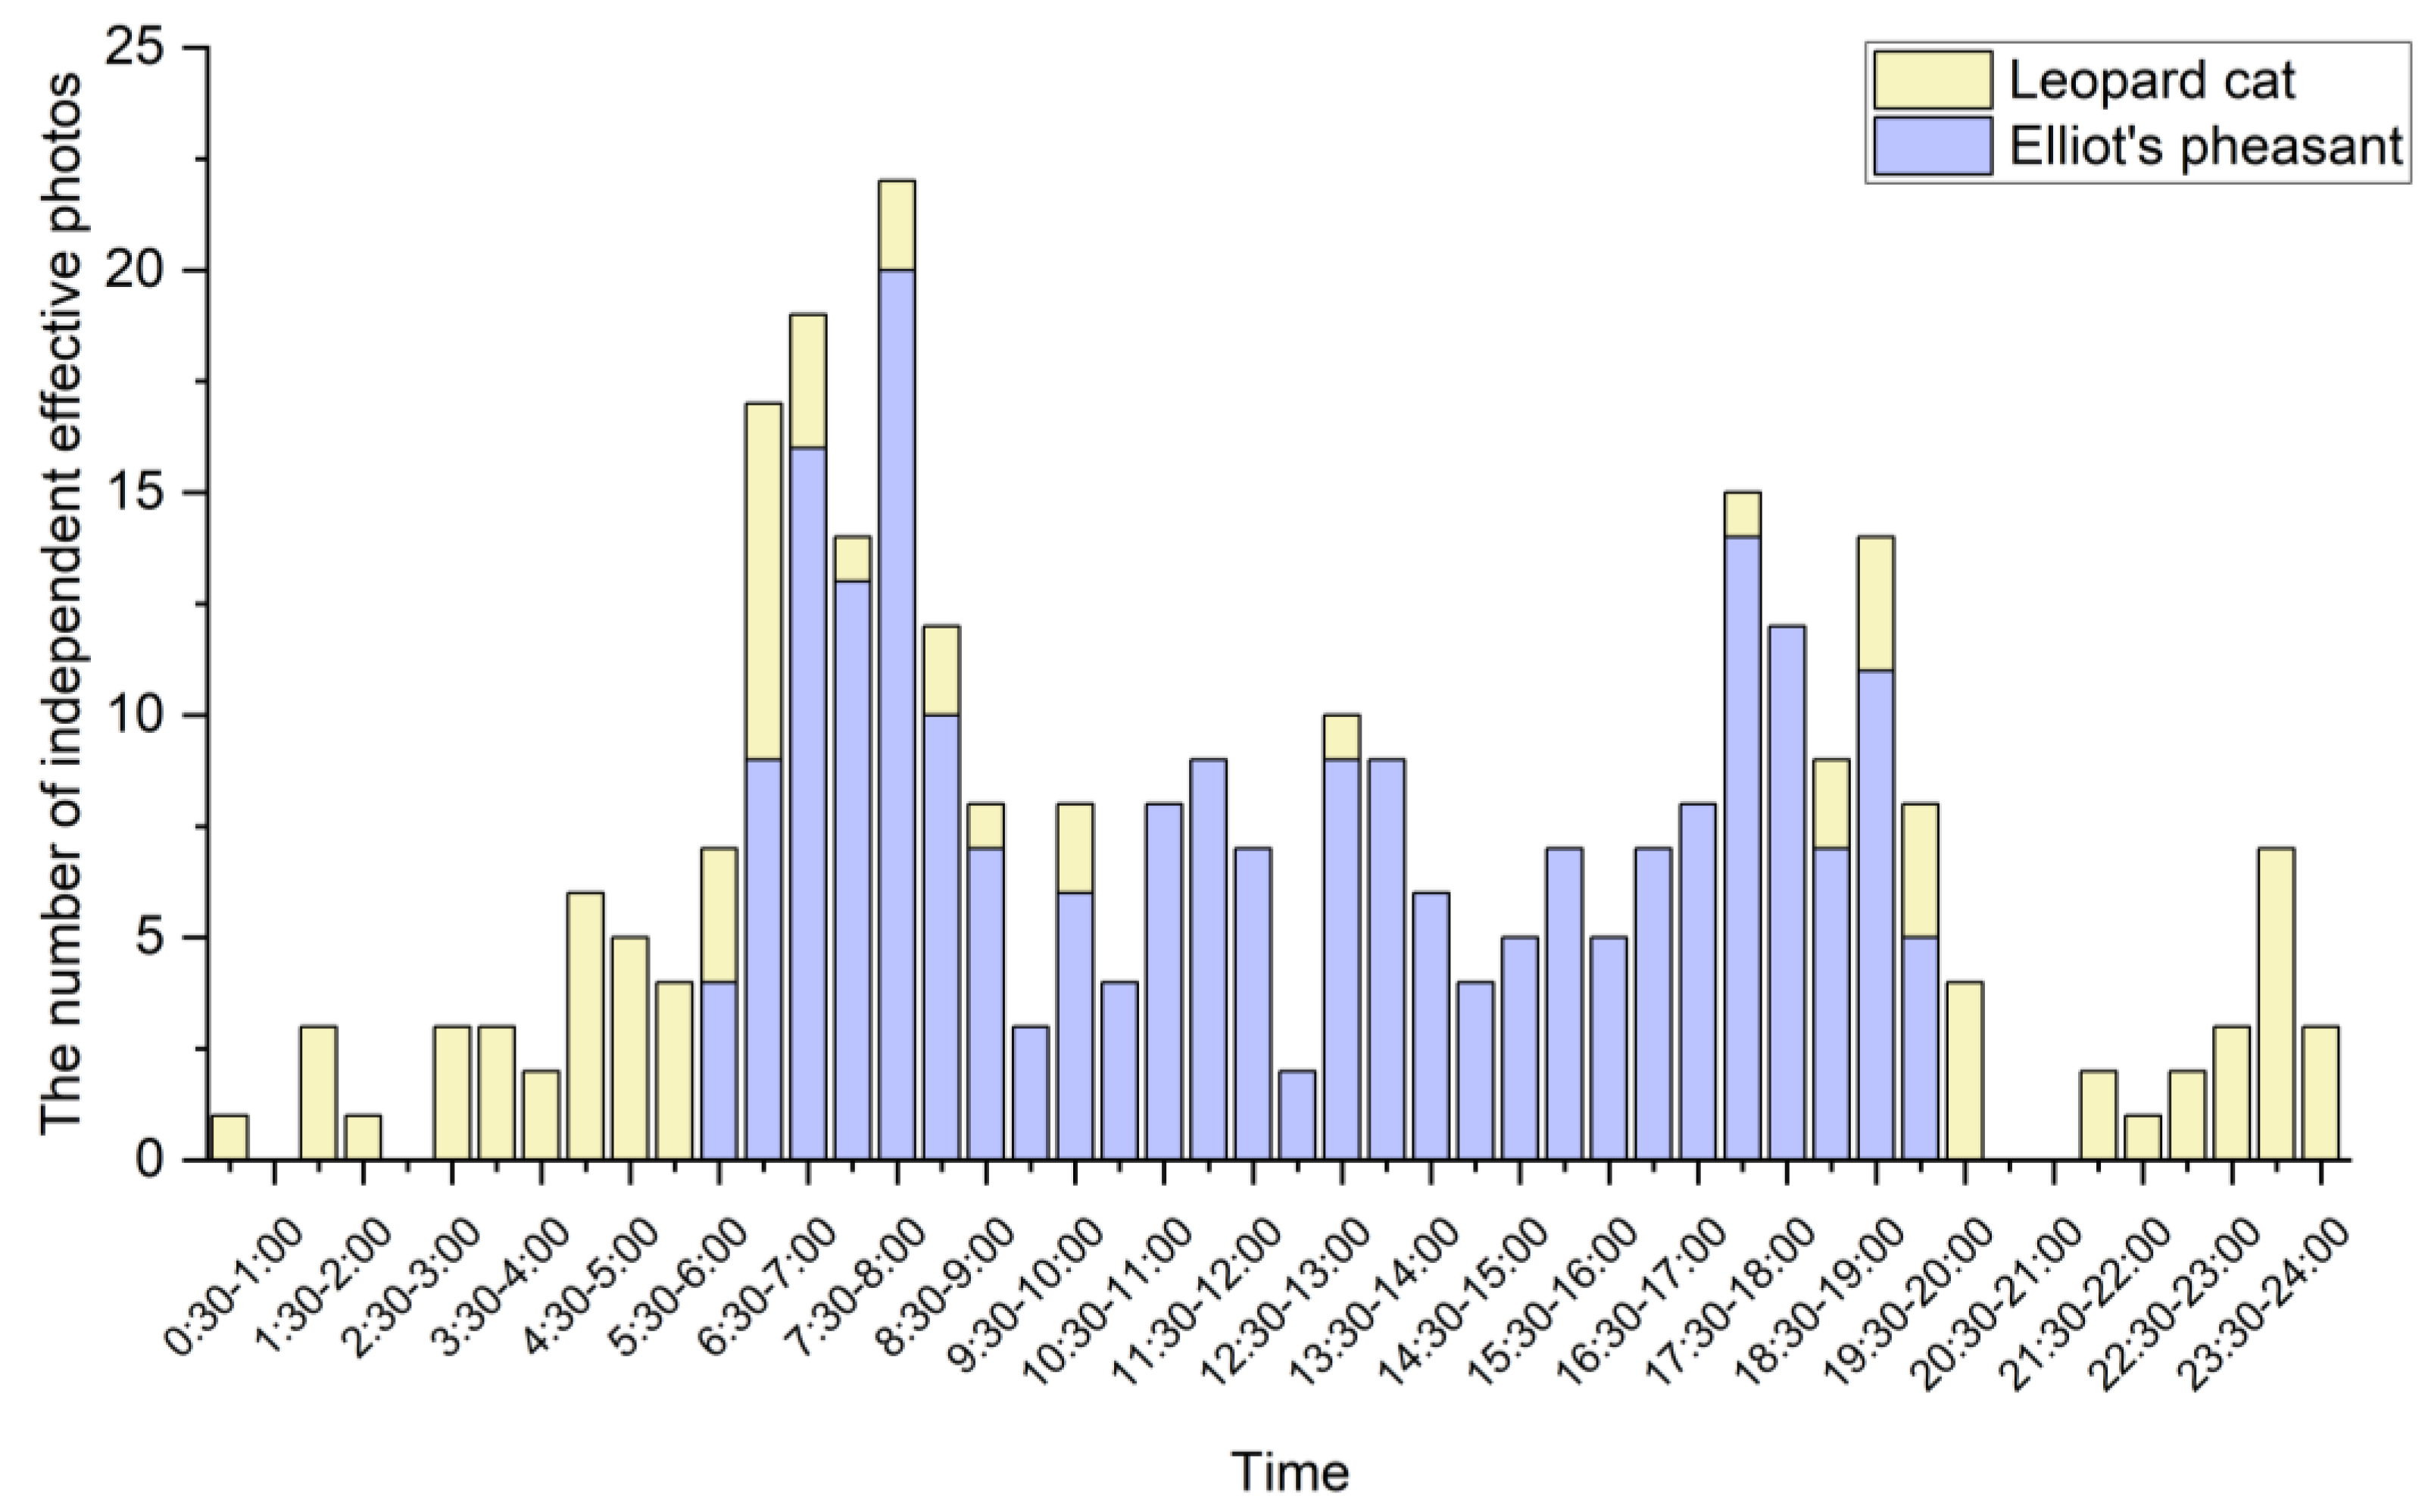
3.3.1. General Pattern of Activities

The daily activity rhythm curves showed that Elliot’s pheasant exhibited two distinct activity peaks at 7:00–8:00 and 16:00–18:00 (24 h format), with a minor peak at 11:00–13:00. No activity was recorded from 22:00 to 04:00 (next day), indicating clear diurnal behavior. The difference is that the leopard cat displayed a typical nocturnal pattern, with primary activity peaks at 04:00–06:00 and 22:00–24:00, along with a minor peak at 18:00–20:00. Its activity was lowest during 10:00–16:00. Δ4 was chosen as the estimated parameter to analyze the overlap of their activities (Elliot’s pheasant d = 227, leopard cat d = 82). The analysis revealed a low degree of diel overlap between Elliot’s pheasant and the leopard cat, the overlap index was Δ4 = 0.379 (p < 0.01), indicating significant temporal differentiation between the two species (Figure 7a) (Figure 8).
Monthly activity patterns of Elliot’s pheasant and the leopard cat showed significant variability. Elliot’s pheasant presented a higher activity frequency than the leopard cat in all months except December (Figure 7b). Elliot’s pheasant showed peak activity from April to July (breeding season).

3.3.2. Activity Rhythm of Elliot’s Pheasant in Sites with and Without Leopard Cat Presence

At camera sites where leopard cats were present (n = 22, Elliot’s pheasant d = 78), the activity pattern overlap between the two species (Δ4 = 0.343, p < 0.01) decreased by 0.036 compared to the overall activity pattern overlap (Figure 9a). In contrast, at sites where leopard cats were absent (n = 29, Elliot’s pheasant d = 149), the activity pattern overlap (Δ4 = 0.408, p < 0.01) increased by 0.029 relative to the overall overlap and was 0.065 higher than that at sites with the leopard cat (Figure 9b). In contrast to the overall activity pattern, Elliot’s pheasant showed a minor activity peak during 13:00–15:00 and a slight trough at 11:00–13:00 at sites with the leopard cat. At leopard cat-absent sites, Elliot’s pheasant exhibited a minor peak at 11:00–13:00, with higher activity intensity during this period compared to the overall pattern.

3.3.3. Seasonal Variations in the Activity Rhythm of Elliot’s Pheasant During Breeding and Non-Breeding Seasons

During the breeding season (April to June) (Elliot’s pheasant d = 71), the activity pattern overlaps between the two species (Δ1 = 0.479, p < 0.01) increased by 0.10 compared to the annual average (Figure 9c). In contrast, in the non-breeding season (Elliot’s pheasant d = 156), the activity pattern overlaps between the two species (Δ4 = 0.328, p < 0.01) decreased by 0.051 to the annual average (Figure 9d). Specifically, during the breeding season, Elliot’s pheasant exhibited significantly earlier morning activity initiation (05:00–06:00) compared to the non-breeding season, followed by a gradual decline in activity intensity after 07:00, reaching its daily minimum at 09:00–11:00 and remaining consistently low throughout midday hours. In contrast, non-breeding individuals exhibited significantly higher activity intensity during 06:00–07:00 than breeding-phase birds, with a secondary peak observed at 11:00–12:00, followed by a rapid decline after 18:00. Notably, the temporal niche overlap between the two species peaked during the breeding season (Table 3).

4. Discussion

Predation risk is a critical factor influencing animal survival and reproduction [76]. Mammals and birds exhibit complex predator-prey dynamics and anti-predator adaptations [77]. In this study, based on the 6-year camera-trap data in the Jiemuxi National Nature Reserve, we explored the spatio-temporal niche relationship between Elliot’s pheasant and its predator the leopard cat (Figure 10). The results revealed high spatial niche overlap between the two species, while temporal niche segregation served as the primary mechanism for Elliot’s pheasant to mitigate predation risk and achieve sympatric coexistence with the leopard cat. This finding aligns with existing related research [78].
In terms of spatial niche, Elliot’s pheasant and the leopard cat exhibit similar patterns of space utilization. Food availability serves as a key factor influencing habitat selection in wildlife [79,80]. Within the Jiemuxi Nature Reserve, both species frequent shady slopes, likely because Elliot’s pheasant’s preferred food resources—such as fern shoots and invertebrates (e.g., earthworms)—are more abundant in these areas, while leopard cats’ main prey (rodents) also predominantly inhabit shady slopes [15,81]. Additionally, the leopard cat shows a preference for shrubland edges, likely because these areas provide an optimal balance between vegetation cover and open visibility. This habitat feature not only enhances hunting efficiency by facilitating stealthy approaches but also minimizes movement restrictions while enabling rapid ambushes. [82,83].
The mean temperature of the wettest quarter (Bio8) and precipitation of the wettest quarter (Bio16) exerted significant influences on habitat suitability for both Elliot’s pheasant and the leopard cat. These climatic factors likely operate indirectly by modulating vegetation growth, which subsequently determines habitat availability and quality for these species [84]. As it is located in southern China, Jiemuxi Nature Reserve experiences its wettest quarter during summer, when optimal temperature and precipitation conditions stimulate vegetation growth, thereby sustaining the food resources required by both Elliot’s pheasant and the leopard cat. Additionally, the wettest quarter coincides with the breeding season of Elliot’s pheasant. Areas with suitable precipitation support higher vegetation density, which is more conducive for Elliot’s pheasant to avoid predators and build nests for breeding [85,86]. For Galliformes, vegetation canopy closure represents a key determinant of nesting site selection, as highly concealed nests experience lower predation rates[87,88]. These findings are consistent with previous studies [24,89].
In terms of anthropogenic disturbance, both Elliot’s pheasant and the leopard cat demonstrated avoidance behavior toward human settlements, though the level of response varied. The leopard cat exhibited a positive correlation between activity frequency and distance from settlements, possibly due to a higher risk of human-wildlife conflict near settlements [90,91]. It has been shown that retaliatory killing by farmers due to poultry depredation is one of the main causes of direct mortality of the leopard cat at present [92]. In contrast, the activity intensity of Elliot’s pheasant began to decrease after the distance from settlements reached 2.5 km and the distance from roads was 950 m. This is consistent with the results of previous studies, and it is speculated that Elliot’s pheasant may have a certain dependence on human activities for its survival (Figure 6) [23,93,94].
Since time itself is rigid and difficult to modify, the temporal relationship between predators and prey is often regarded as the last remaining mechanism to avoid predation when spatial activity is constrained or disturbed [95]. Temporal niche analysis based on KDE revealed low temporal niche overlap between Elliot’s pheasant and the leopard cat. Elliot’s pheasant exhibits strictly diurnal activity patterns, while felids adjust their activity patterns in response to prey availability, predation risk, and environmental factors [96]. This divergence is further accentuated by the nocturnal tendencies of leopard cats’ preferred rodent prey, which has likely driven leopard cats’ evolutionary shift toward nighttime activity. Such temporal niche partitioning optimizes predator-prey encounter rates during nocturnal periods (Figure 7a). Moreover, Elliot’s pheasant and the leopard cat exhibited significantly divergent monthly activity patterns (Figure 7b), suggesting a potential mechanism of temporal niche partitioning. Consistent with prey-predator population equilibrium in food chains, the relative activity frequency of Elliot’s pheasant consistently exceeded that of the leopard cat across all months except December. This differential activity pattern likely contributes to the maintenance of their coexistence.
Avian species can perceive predation risk through both auditory cues and olfactory signals, enabling behavioral adjustments to actively avoid predators [97,98,99]. Our findings indicate that Elliot’s pheasant exhibits a certain degree of predator avoidance behaviours. In areas with leopard cat activity, the movement intensity of Elliot’s pheasant decreased, likely because they detected the scent left by leopard cats and deliberately avoided these areas to reduce encounter probability [98,100].
Furthermore, temporal overlap between Elliot’s pheasant and the leopard cat significantly increased during the breeding season, potentially attributable to sex-specific behavioral shifts in Elliot’s pheasant during this reproductive period. During the breeding season, female Elliot’s pheasants exhibit increased energy demands due to nest-building and chick-rearing activities. This results in elevated foraging frequency and expanded home ranges, consequently heightening their predation risk. This is similar to the findings of related studies [101]. In contrast, male individuals frequently engage in conspicuous courtship behaviors, including vocal displays and plumage exhibitions [19]. These behaviors are prone to exposing their positions and may be affected by the Allee effect, increasing the probability of being discovered by predators [102]. In addition, Elliot’s pheasant is a social bird, usually operating in groups of five to eight individuals. When moving in groups, birds can increase their alertness to predators through flocking behavior and reduce the cost of individual vigilance time [103]. However, during the breeding season, when male and female Elliot’s pheasants pair up, they will move alone away from the group. This behavior weakens those anti-predator mechanisms and similarly increases predation risk.
In contrast, the lowest temporal overlap between Elliot’s pheasant and the leopard cat occurred during the non-breeding period (Table 3). In this period, the pheasants exhibited higher activity intensity during post-dawn and midday hours compared to the breeding season. Meanwhile, as shown in Figure 7b, the monitoring frequency of the leopard cat was higher than that of Elliot’s pheasant in December. This behavioral shift likely stems from the reduced energy requirements of Elliot’s pheasant during the non-breeding period. Specifically in autumn and winter, lower temperatures cause Elliot’s pheasant to concentrate their activity periods, minimizing movement after foraging during warmer daylight hours to conserve energy. Furthermore, the resurgence of flocking behavior during this period enhances collective vigilance. Consequently, the non-breeding survival strategy of Elliot’s pheasant appears to prioritize both energetic efficiency and predator avoidance, thereby reducing predator encounter rates.
Moreover, our MaxEnt analysis reveals persistent habitat fragmentation for both Elliot’s pheasant and the leopard cat (Figure 3), potentially amplifying anthropogenic pressures on their niche dynamics. Future studies should conduct in-depth analyses of demographic and land-use changes within this nature reserve. Beyond natural partitioning mechanisms, habitat degradation may compress their spatial distributions, while invasive species and genetic introgression risks—particularly concerning leopard cat hybridization with domestic cats (Felis catus, Linnaeus, 1758) (Bengal cats) in human-dominated landscapes—threaten population integrity. These synergistic factors could exacerbate niche overlap and compromise long-term coexistence, necessitating integrated conservation strategies: prioritizing habitat connectivity through ecological corridors to mitigate fragmentation; implementing genetic monitoring for introgression in populations near human settlements; and optimizing protected area zoning based on identified spatio-temporal niche patterns (e.g., breeding-season hotspots).

5. Conclusions

Our study showed that the sympatric Elliot’s pheasant and the leopard cat exhibited no significant spatial niche differentiation, but showed low temporal niche overlap. At the spatial scale, both species demonstrated similar habitat preferences, while the abundant vegetation and diverse prey resources within the reserve provided sufficient food availability for their coexistence. At the temporal scale, Elliot’s pheasant exhibited avoidance behavior toward the leopard cat. However, during the breeding season, the Elliot’s pheasant’s reproductive activities led to increased temporal overlap with the leopard cat, elevating its predation risk. Therefore, their long-term stable coexistence is facilitated by temporal niche partitioning and sufficient food availability within the habitat. This finding provides a scientific reference for the conservation management of reintroduced Reeves’s pheasants in the nature reserve.
This study still has the following limitations. First, future work should employ fecal DNA metabarcoding techniques to analyze leopard cat scat samples for Elliot’s pheasant DNA detection, while controlling for confounding factors such as cannibalism of a dead animal or predation targeting vulnerable individuals. Concurrently, radio-tagging of Elliot’s pheasant could enable more precise monitoring of predation events. Second, due to objective constraints, we were unable to directly quantify how leopard cat population density fluctuations influence Elliot’s pheasant distribution and behavior. Future studies should integrate more accurate population density estimation methods (e.g., random encounter models) with long-term monitoring data by establishing a high-frequency infrared camera network. This approach would significantly advance our understanding of population dynamics in shaping their coexistence mechanisms and provide more precise decision-making support for conservation management.

Supplementary Materials

The following supporting information can be downloaded at: https://www.mdpi.com/article/10.3390/d17070460/s1, Table S1: List of Scientific Names and Authors for Species Referenced in the Study; Table S2: The number of independent effective photos of EP and LC in each time period.

Author Contributions

Conceptualization, B.W., X.M. and P.Z.; methodology, P.Z., Y.X. and X.C.; software, P.Z.; validation, all authors; investigation, all authors; data curation, P.Z., Y.X. and C.H.; writing—original draft preparation, P.Z.; writing—review and editing, P.Z. and H.L.; project administration, Y.F.; funding acquisition, B.W. and X.M. All authors have read and agreed to the published version of the manuscript.

Funding

This research was funded by Comprehensive Scientific Investigation Project of Jiemuxi National Nature Reserve (0531220-1865), County Biodiversity Resource Survey Project in Yuanling County, Hunan, China (2021-326-43222).

Institutional Review Board Statement

Not applicable. No ethical approval was required for the non-invasive camera trapping method.

Informed Consent Statement

Not applicable.

Data Availability Statement

The data used in the analysis can be obtained from the authors on reasonable request.

Acknowledgments

The authors thankfully acknowledge editors and reviewers for their comments in the manuscript processing in the proof. We are also thankful to Jiemuxi National Nature Reserve for their support in the field survey.

Conflicts of Interest

The authors declare no conflicts of interest.

References

  1. Kalirad, A.; Sommer, R.J. The role of plasticity and stochasticity in coexistence. Ecol. Lett. 2024, 27, e14370. [Google Scholar] [CrossRef] [PubMed]
  2. Chu, C.; Wang, Y.; Liu, Y.; Jiang, L.; He, F. Advances in species coexistence theory. Biodivers. Sci. 2017, 25, 345–354, (In Chinese with English Abstract). [Google Scholar] [CrossRef]
  3. Hutchinson, G.E. Concluding remarks. Cold Spring Harb. Symp. Quant. Biol. 1957, 22, 415–427. [Google Scholar] [CrossRef]
  4. Schoener, T.W. Resource partitioning in ecological communities. Science 1974, 185, 27–39. [Google Scholar] [CrossRef]
  5. Chesson, P. Mechanisms of maintenance of species diversity. Annu. Rev. Ecol. Syst. 2000, 31, 343–366. [Google Scholar] [CrossRef]
  6. Cresswell, W. Non-lethal effects of predation in birds. Ibis 2008, 150, 3–17. [Google Scholar] [CrossRef]
  7. Lima, S. Stress and decision making under the risk of predation: Recent developments from behavioral, reproductive, and ecological perspectives. Adv. Study Behav. 1998, 27, 215–290. [Google Scholar] [CrossRef]
  8. Moll, R.J.; Redilla, K.M.; Mudumba, T.; Muneza, A.B.; Gray, S.M.; Abade, L.; Hayward, M.W.; Millspaugh, J.J.; Montgomery, R.A.; Prugh, L. The many faces of fear: A synthesis of the methodological variation in characterizing predation risk. J. Anim. Ecol. 2017, 86, 749–765. [Google Scholar] [CrossRef]
  9. Creel, S.; Winnie, J.; Maxwell, B.; Hamlin, K.; Creel, M. Elk alter habitat selection as an antipredator response to wolves. Ecology 2005, 86, 3387–3397. [Google Scholar] [CrossRef]
  10. Resende, P.S.; Viana-Junior, A.B.; Bovendorp, R.S. A meta-analysis of the effects of anthropogenic disturbances on tropical mammal functional diversity. Mammal Rev. 2025, 55, e12356. [Google Scholar] [CrossRef]
  11. Tilman, D. Competition and biodiversity in spatially structured habitats. Ecology 1994, 75, 2–16. [Google Scholar] [CrossRef]
  12. Guan, X.; Rao, X.; Song, G.; Wang, D. The evolution of courtship displays in Galliformes. Avian Res. 2022, 13, 11–16. [Google Scholar] [CrossRef]
  13. Lu, X. Summer-Autumn Habitat Use by Galliformes in a Primary Forest, Southeastern Tibet. Avian Res. 2012, 3, 113–117. [Google Scholar] [CrossRef]
  14. IUCN. The IUCN Red List of Threatened Species. Version 2025-1. 2025. Available online: https://www.iucnredlist.org (accessed on 22 April 2025).
  15. Li, H.; Wang, D.; Tian, Y. Habitat analysis of Syrmaticus Reevesil in Xiaoxi National Nature Reserve. Zhongnan Linye Keji Daxue Xuebao 2012, 32, 166–169, (In Chinese with English Abstract). [Google Scholar] [CrossRef]
  16. Ping, D.; Shi-ren, J.; Yang, Z. The study on fragmentation of habitat used by Elliot’s pheasant in western Zhejiang. Zool. Res. 2000, 21, 65–69, (In Chinese with English Abstract). [Google Scholar] [CrossRef]
  17. Ren, P.; Yu, J.; Chen, X.; Shen, X.; Song, X.; Zhang, T.; Yu, Y.; Ding, P. Seasonal variation in the distribution of Elliot’s pheasant (Syrmaticus ellioti) in gutianshan national nature reserve. Biodivers. Sci. 2019, 27, 13–23, (In Chinese with English Abstract). [Google Scholar] [CrossRef]
  18. Liu, P.; Liu, M.; Zhang, Y.; Huang, M.; Shu, H. Progress and perspective of Elliot’s pheasant in biology. Ecol. Sci. 2017, 36, 220–225, (In Chinese with an English Abstract). [Google Scholar] [CrossRef]
  19. Ding, P.; Zhuge, Y.; Zhang, C.Z. The studies on breeding ecology of Syrmaticus ellioti swinhoe. Zool. Res. 1990, 11, 139–145, (In Chinese with an English Abstract). [Google Scholar]
  20. Jiang, P.P.; Ge, Y.F.; Lang, Q.L.; Ding, P. Genetic structure among wild populations of Elliot’s pheasant Syrmaticus Ellioti in China from mitochondrial DNA analyses. Bird Conserv. Int. 2007, 17, 177–185. [Google Scholar] [CrossRef]
  21. Zhao, Y.L.; Wu, L.; Li, L.; Wang, S.Y.; Li, Z.Y.; Xu, Z.G. Havioral rhythms of Elliot’s pheasant (Syrmaticus Ellioti) during summer and autumn in captivity. Ecol. Sci. 2019, 38, 50–56. [Google Scholar] [CrossRef]
  22. Luo, Y.; Yu, T.; Huang, C.; Zhao, T.; Li, H.; Li, C. Metabolism and thermoregulation between Mrs Hume’s Pheasant (Syrmaticus Humiae) and Elliot’s pheasant (S. ellioti). Zool. Res. 2011, 32, 396–402. [Google Scholar]
  23. Xu, Y.L.; Yang, Z.M.; Lu, S.J.; Zhou, F.; Zhou, P.C.; Wang, B. Habitat Suitability Assessment of Syrmaticus ellioti in Hunan Province Based on MaxEnt Modeling. Life Sci. Res. 2024, 28, 267–273, (in Chinese with English Abstract). [Google Scholar] [CrossRef]
  24. Wu, C. Simulation and Prediction of Suitable Habitats for Rare Animals Under the Background of Climate Change: A Case Study of Syrmaticus ellioti. Master’s Thesis, Zhejiang University, Hangzhou, China, 2020. [Google Scholar] [CrossRef]
  25. Zhang, G.; Yu, T.; Chen, D.; Ma, Y.; Wu, R. Food selection of released captive-bred Syrmaticus Ellioti in Amersham nature reserve, Guangxi, China. J. Guangxi Norm. Univ. Nat. Sci. Ed. 2019, 37, 218–222, (In Chinese with an English Abstract). [Google Scholar]
  26. Long, D.Z. Ecological study of Syrmaticus ellioti. Chin. Wildl. 1985, 1, 24–25, (In Chinese with an English Abstract). [Google Scholar] [CrossRef]
  27. Fan, Y.Q.; Yang, J.; Zhang, H.L.; Jiang, J.; Jiang, W.J.; Tang, S.P.; Bao, W.D. Food composition of medium sized carnivores in Beijing Songshan Nature Reserve. J. Biol. 2020, 37, 59–62. [Google Scholar] [CrossRef]
  28. Shao, X.N.; Song, D.Z.; Huang, Q.W.; Li, S.; Yao, M. Fast surveys and molecular diet analysis of carnivores based on fecal DNA and metabarcoding. Biodivers. Sci. 2019, 27, 543–556, (In Chinese with English Abstract). [Google Scholar] [CrossRef]
  29. Lee, O.; Lee, S.; Nam, D.-H.; Lee, H.Y. Food habits of the Leopard cat (Prionailurus bengalensis euptilurus) in korea. Mammal Study 2014, 39, 43–46. [Google Scholar] [CrossRef]
  30. Shao, X.; Lu, Q.; Liu, M.; Xiong, M.; Bu, H.; Wang, D.; Liu, S.; Zhao, J.; Li, S.; Yao, M. Generalist carnivores can be effective biodiversity samplers of terrestrial vertebrates. Front. Ecol. Environ. 2021, 19, 557–563. [Google Scholar] [CrossRef]
  31. Macdonald, D.W. Biology and Conservation of Wild Felids; Oxford University Press: New York, NY, USA; Ipswich, UK, 2010; pp. 581–596. [Google Scholar]
  32. Bao, W.; Li, X.; Shi, Y. Comparative Analysis of Food Habits in Carnivores from Three Areas of Beijing. Zool. Res. 2005, 26, 118–122. [Google Scholar] [CrossRef]
  33. Manandhar, P.; Pereira, K.S.; Kusi, N.; Joshi, J.; Levin, N.; Chaudhary, H.K.; Wultsch, C.; Lamichhane, S.; Bhandari, S.; Guragain, L.; et al. Feeding Habits of Leopards and Leopard cats in the Fragmented Forests Surrounding the Kathmandu Valley. Ecol. Evol. 2025, 15, e70927. [Google Scholar] [CrossRef]
  34. Zhang, L.; Wang, A.; Yuan, L.; Bao, W.; Yang, Y.; Baterr. Preliminary comparison of diet composition of four small sized carnivores at Saihanwula Nature Reserve, Inner Mongolia. Acta Theriol. Sin. 2011, 31, 55–61, (In Chinese with an English Abstract). [Google Scholar] [CrossRef]
  35. Luo, Y. Species Diversity and Threatened Categories Assessment of Mammals in Hunan Province, China. Master’s Thesis, Central South University of Forestry and Technology, Changsha, China, 2023. [Google Scholar]
  36. Emerson, L.D.; Wittmer, H.U.; Elbroch, L.M.; Kostoglou, K.; Bannister, K.J.; Psaila, J.J.; Whisson, D.; Ritchie, E.G. A global assessment of large terrestrial carnivore kill rates. Biol. Rev. Camb. Philos. Soc. 2025, 100, 327–350. [Google Scholar] [CrossRef] [PubMed]
  37. Mayhew, D.S.; Hearn, A.J.; Devineau, O.; Linnell, J.D.C.; Macdonald, D.W. Loss of Sunda clouded leopards and forest integrity drive potential impacts of mesopredator release on vulnerable avifauna. Heliyon 2024, 10, e32801. [Google Scholar] [CrossRef] [PubMed]
  38. Duan, S.W. Molecular Diet Analysis of Leopard Cats (Prionailurus bengalensis) and Red Foxes (Vulpes vulpes) in Jiaozishan National Nature Reserve, Yunnan Province, Based on Fecal DNA and Metabarcoding. Master’s Thesis, Yunnan Normal University, Kunming, China, 2023. [Google Scholar] [CrossRef]
  39. Teng, Y.; Gai, L.X.; Li, J.; Fang, X.M.; Yang, N.; Bao, W.D. A comparison of two methods of Leopard cat food content analysis. Acta Theriol. Sin. 2023, 43, 50–58, (In Chinese with an English Abstract). [Google Scholar] [CrossRef]
  40. Jin, S.L.; Qu, C.M.; Shi, X.G.; Zou, X.Y.; Liu, J.; Shao, X.N.; Yao, M.; He, T.M.; Li, S. The Species Diversity and Diet of Some Carnivores in Wolong National Nature Reserve, Sichuan Province. Chin. J. Wildl. 2021, 42, 958–964, (In Chinese with an English Abstract). [Google Scholar] [CrossRef]
  41. Shehzad, W.; Riaz, T.; Nawaz, M.A.; Miquel, C.; Poillot, C.; Shah, S.A.; Pompanon, F.; Coissac, E.; Taberlet, P. Carnivore diet analysis based on next-generation sequencing: Application to the Leopard cat (Prionailurus bengalensis) in Pakistan. Mol. Ecol. 2012, 21, 1951–1965. [Google Scholar] [CrossRef]
  42. Xiong, M.; Shao, X.; Long, Y.; Bu, H.; Zhang, D.; Wang, D.; Li, S.; Wang, R.; Yao, M. Molecular analysis of vertebrates and plants in scats of Leopard cats (Prionailurus bengalensis) in southwest China. J. Mammal. 2016, 97, 1054–1064. [Google Scholar] [CrossRef]
  43. Xiong, W.G.; Zhao, K.J. Evaluation of conservation value of Jiemuxi Nature Reserve in Hunan Province. Cent. South For. Inventory Plan. 2007, 26, 36–38, 46, (In Chinese with an English Abstract). [Google Scholar]
  44. Olson, D.M.; Dinerstein, E. The global 200: Priority ecoregions for global conservation. Ann. Mo. Bot. Gard. 2002, 89, 199–224. [Google Scholar] [CrossRef]
  45. Ning, S.J.; He, J.; Zhou, Q.; Chen, X.Y.; Wang, X.T.; He, Y. Diversity and faunal analysis of Butterfly Species in Jiemuxi National Nature Reserve, Hunan Province. J. Nat. Sci. Hunan Norm. Univ. 2024, 47, 132–142, (In Chinese with an English Abstract). [Google Scholar]
  46. Nazir, S.; Kaleem, M. Object classification and visualization with edge artificial intelligence for a customized camera trap platform. Ecol. Inform. 2024, 79, 102453. [Google Scholar] [CrossRef]
  47. Fisher, J.T. Camera trapping in ecology: A new section for wildlife research. Ecol. Evol. 2023, 13, e9925. [Google Scholar] [CrossRef] [PubMed]
  48. Tudge, S.J.; Brittain, S.; Kentatchime, F.; Kamogne-Tagne, C.T.; Rowcliffe, J.M. The impacts of human activity on mammals in a community forest near the Dja biosphere reserve in Cameroon. Oryx 2022, 56, 947–955. [Google Scholar] [CrossRef]
  49. Wang, Y.; Li, D.; Wang, G.; Zhu, P.B.D.; Liu, W.; Li, C.; Jin, K. Morphological, Phaneroptic, Habitat and Population Description of Three Muntjac Species in a Tibetan Nature Reserve. Animals 2022, 12, 2909. [Google Scholar] [CrossRef]
  50. Martin-Garcia, S.; Rodríguez-Recio, M.; Peragón, I.; Bueno, I.; Virgós, E. Comparing relative abundance models from different indices, a study case on the red fox. Ecol. Indic. 2022, 137, 108778. [Google Scholar] [CrossRef]
  51. Chen, X.; Tian, T.; Pan, H.; Jin, Y.; Zhang, X.; Long, Q.; Tang, L.; Yang, B.; Zhang, L. The minimal impact of anthropogenic disturbances on the spatial activities of Leopard cats in Xinglong, China. Animals 2023, 13, 3328. [Google Scholar] [CrossRef]
  52. Zhang, J.; Jiang, F.; Li, G.; Qin, W.; Li, S.; Gao, H.; Cai, Z.; Lin, G.; Zhang, T. Maxent modeling for predicting the spatial distribution of three raptors in the Sanjiangyuan National Park, China. Ecol. Evol. 2019, 9, 6643–6654. [Google Scholar] [CrossRef]
  53. Liu, P.; Huang, X.F.; Gu, S.S.; Lu, C.H. Habitat selection of four sympatric pheasants in Ganeshan national nature reserve, Jiangxi, China. Zool. Res. 2012, 33, 170–176. [Google Scholar] [CrossRef]
  54. Zhang, X.; Liu, L.; Chen, X.; Gao, Y.; Xie, S.; Mi, J. Glc_fcs30: Global land-cover product with fine classification system at 30 m using time-series Landsat imagery. Earth Syst. Sci. Data 2021, 13, 2753–2776. [Google Scholar] [CrossRef]
  55. Yang, J.; Dong, J.; Xiao, X.; Dai, J.; Wu, C.; Xia, J.; Zhao, G.; Zhao, M.; Li, Z.; Zhang, Y.; et al. Divergent shifts in peak photosynthesis timing of temperate and alpine grasslands in China. Remote Sens. Environ. 2019, 233, 111395. [Google Scholar] [CrossRef]
  56. Zhang, Y.; Tang, J.; Ren, G.; Zhao, K.; Wang, X. Global potential distribution prediction of xanthium italicum based on maxent model. Sci. Rep. 2021, 11, 16545. [Google Scholar] [CrossRef] [PubMed]
  57. Yu, X.; Tao, X.; Liao, J.; Liu, S.; Xu, L.; Yuan, S.; Zhang, Z.; Wang, F.; Deng, N.; Huang, J.; et al. Predicting potential cultivation region and paddy area for ratoon rice production in China using maxent model. Field Crops Res. 2022, 275, 108372. [Google Scholar] [CrossRef]
  58. Warren, D.L.; Glor, R.E.; Turelli, M. ENMTools: A toolbox for comparative studies of environmental niche models. Ecography 2010, 33, 607–611. [Google Scholar] [CrossRef]
  59. Zhang, L.; Wang, P.; Xie, G.; Wang, W. Impacts of Climate Change Conditions on the Potential Distribution of Anoplophora glabripennis and Its Host Plants, Salix Babylonia and Salix Matsuyama, in China. Ecol. Evol. 2024, 14, e70692. [Google Scholar] [CrossRef]
  60. Phillips, S.J.; Anderson, R.P.; Schapire, R.E. Maximum entropy modeling of species geographic distributions. Ecol. Model. 2006, 190, 231–259. [Google Scholar] [CrossRef]
  61. Shi, X.G.; Shi, X.Y.; He, Q.; Feng, X.; Jin, S.L.; Chen, Y.H.; Zhang, J.; Yao, M.; Li, S. Spatiotemporal Relationships Between Snow Leopard (Panthera uncia) and Red Fox (Vulpes vulpes) in Qionglai Mountains, Sichuan Province. Acta Theriol. Sin. 2021, 41, 115–127. [Google Scholar] [CrossRef]
  62. Zhao, J.; Shao, W.; Li, Y.; Chen, H.; Lin, Z.; Wei, L. Potential impact of climate change on the distribution of Capricornis milneedwardsii, a vulnerable mammal in China. Ecol. Evol. 2024, 14, e11582. [Google Scholar] [CrossRef]
  63. Hammadi, A.; Kalboussi, M. Modelling and mapping the current and future potential habitats of the Algero-Tunisian endemic newt Pleurodeles nebulosus under climate change. Eur. J. Wildl. Res. 2020, 66, 61. [Google Scholar] [CrossRef]
  64. Liu, C.; White, M.; Newell, G. Selecting thresholds for the prediction of species occurrence with presence-only data. J. Biogeogr. 2013, 40, 778–789. [Google Scholar] [CrossRef]
  65. You, Z.; Lu, B.; Du, B.; Liu, W.; Jiang, Y.; Ruan, G.; Yang, N. Spatio-Temporal Niche of Sympatric Tufted Deer (Elaphodus cephalophus) and Sambar (Rusa unicolor) Based on Camera Traps in the Gongga Mountain National Nature Reserve, China. Animals 2022, 12, 2694. [Google Scholar] [CrossRef]
  66. Warren, D.L.; Glor, R.E.; Turelli, M. Environmental niche equivalency versus conservatism: Quantitative approaches to niche evolution. Evolution 2008, 62, 2868–2883. [Google Scholar] [CrossRef] [PubMed]
  67. Viviano, A.; Mori, E.; Fattorini, N.; Mazza, G.; Lazzeri, L.; Panichi, A.; Strianese, L.; Mohamed, W.F. Spatiotemporal Overlap between the European Brown Hare and Its Potential Predators and Competitors. Animals 2021, 11, 562. [Google Scholar] [CrossRef] [PubMed]
  68. Ridout, M.S.; Linkie, M. Estimating overlap of daily activity patterns from camera trap data. J. Agric. Biol. Environ. 2009, 14, 322–337. [Google Scholar] [CrossRef]
  69. Meredith, M.; Ridout, M. Overlap: Estimates of Coefficient of Overlapping for Animal Activity Patterns. 2021. Available online: https://CRAN.R-project.org/package=overlap (accessed on 10 October 2024).
  70. Rowcliffe, M. Activity: Animal Activity StatistIEs. 2014. Available online: https://CRAN.R-project.org/package=activity (accessed on 10 October 2024).
  71. Cepeda-Duque, J.C.; Arango-Correa, E.; López-Velasco, V.; López-Barrera, A.; Link, A.; Lizcano, D.J.; Mazariegos, L.; Rendon-Jaramillo, U.; Oliveira, T.G.d. Avoiding the enemy while searching for dinner: Understanding the temporal niche of the threatened clouded tiger-cat in protected cloud forests of the middle Cauca, Colombia. Food Webs 2025, 42, e00385. [Google Scholar] [CrossRef]
  72. Allen, M.; Elbroch, L.; Wilmers, C.; Wittmer, H. The comparative effects of large carnivores on the acquisition of carrion by scavengers. Am. Nat. 2015, 185, 822–833. [Google Scholar] [CrossRef]
  73. Wang, D.; Li, Q.; Hou, L.; Su, X.; Lian, X. Spatiotemporal overlap among snow leopard, bharal, and free-ranging livestock: Suggestions on mitigating human-snow leopard conflict. Glob. Ecol. Conserv. 2024, 53, e03029. [Google Scholar] [CrossRef]
  74. Azevedo, F.C.; Lemos, F.G.; Freitas-Junior, M.C.; Rocha, D.G.; Azevedo, F.C.C. Puma activity patterns and temporal overlap with prey in a human-modified landscape at Southeastern Brazil. J. Zool. 2018, 305, 246–255. [Google Scholar] [CrossRef]
  75. Zhang, D.; An, B.; Chen, L.; Sun, Z.; Mao, R.; Zhao, C.; Zhang, L. Camera Trapping Reveals Spatiotemporal Partitioning Patterns and Conservation Implications for Two Sympatric Pheasant Species in the Qilian Mountains, Northwestern China. Animals 2022, 12, 1657. [Google Scholar] [CrossRef]
  76. Fokkema, R.W.; Velde, E.v.d.; Stessens, M.; Bos, D.; Belfín, O.; Jong, M.E.d.; Hooijmeijer, J.C.E.W.; Piersma, T. Mapping mammalian meadow bird nest predators in a Dutch dairy farming landscape. Eur. J. Wildl. Res. 2024, 70, 122. [Google Scholar] [CrossRef]
  77. Caro, T.; Girling, S. Antipredator Defenses in Birds and Mammals; University of Chicago Press: Chicago, IL, USA, 2005. [Google Scholar]
  78. Zou, B.Y.; Luo, G.; Zhu, B.W.; Ran, J.H.; Fang, C. The spatial distribution relationship between three pheasant species and mutual predator, the red fox (Vulpes vulpes), on the Western Sichuan Plateau. Biodivers. Sci. 2021, 29, 918–926, (In Chinese with English Abstract). [Google Scholar] [CrossRef]
  79. Tost, D.; Ludwig, T.; Strauss, E.; Jung, K.; Siebert, U. Habitat selection of black grouse in an isolated population in northern Germany-the importance of mixing dry and wet habitats. PeerJ 2022, 10, e14161. [Google Scholar] [CrossRef] [PubMed]
  80. Duncan, A.J.; Gordon, I.J. Habitat selection according to the ability of animals to eat, digest and detoxify foods. Proc. Nutr. Soc. 1999, 58, 799–805. [Google Scholar] [CrossRef] [PubMed]
  81. Sunquist, M. Wild Cats of the World; University of Chicago Press: Chicago, IL, USA, 2002; pp. 225–229. [Google Scholar]
  82. Gaál, D.K.; Heltai, M.; Sándor, G.; Schally, G.; Csányi, E. Ecotones in the Spotlight-Habitat Selection of the Golden Jackal (Canis aureus Linnaeus, 1758) in the Agricultural Landscapes of Central Europe. Animals 2025, 15, 760. [Google Scholar] [CrossRef]
  83. Choki, K.; Dröge, E.; Sillero-Zubiri, C.; Macdonald, D.W.; Penjor, U. Anthropogenic and environmental correlates of spatial patterns of co-occurrence of small felids in a montane landscape. Glob. Ecol. Conserv. 2025, 58, e03422. [Google Scholar] [CrossRef]
  84. Julliard, R.; McCleery, R.H. Phenotypic adjustment of clutch size due to nest predation in the great tit. Ecology 1997, 78, 394–404. [Google Scholar] [CrossRef]
  85. Gehrt, J.M.; Sullins, D.S.; Haukos, D.A. Looking at the bigger picture: How abundance of nesting and brooding habitat influences lek-site selection by lesser prairie-chickens. Am. Midl. Nat. 2020, 183, 52–77. [Google Scholar]
  86. Lautenbach, J.M.; Haukos, D.A.; Sullins, D.S.; Hagen, C.A.; Lautenbach, J.D.; Pitman, J.C.; Plumb, R.T.; Robinson, S.G.; Kraft, J.D. Factors influencing nesting ecology of lesser prairie-chickens. J. Wildl. Manag. 2019, 83, 205–215. [Google Scholar] [CrossRef]
  87. Ong-in, T.; Pierce, A.J.; Gale, G.A.; Browne, S.J.; Savini, T. Nesting ecology and nest site selection of green-legged partridge. Raffles Bull. Zool. 2016, 64, 89–97. [Google Scholar]
  88. Macdonald, E.C.; Camfield, A.F.; Martin, M.; Wilson, S.; Martin, K. Nest-site selection and consequences for nest survival among three sympatric songbirds in an alpine environment. J. Ornithol. 2016, 157, 393–405. [Google Scholar] [CrossRef]
  89. Chen, X.N.; Li, Q.W.; Yu, J.P.; Yu, S.H.; Li, S.; Cao, M.C. Habitat suitability assessment of Syrmaticus ellioti in the Qiangjiangyuan National Park. Ecol. Environ. Sci. 2022, 31, 1832–1839, (In Chinese with an English Abstract). [Google Scholar] [CrossRef]
  90. Vitekere, K.; Wang, J.; Karanja, H.; Consolée, K.T.; Jiang, G.; Hua, Y. Dynamic in Species Estimates of Carnivores (Leopard cat, Red Fox, and North Chinese Leopard): A Multi-Year Assessment of Occupancy and Coexistence in the Tieqiaoshan Nature Reserve, Shanxi Province, China. Animals 2020, 10, E1333. [Google Scholar] [CrossRef] [PubMed]
  91. Chung, O.-S.; Lee, J.K. Association of Leopard cat Occurrence with Environmental Factors in Chungnam Province, South Korea. Animals 2022, 13, 122. [Google Scholar] [CrossRef] [PubMed]
  92. Han, S.; Lu, D.; Han, Y.; Li, R.; Yang, J.; Sun, G.; Yang, L.; Qian, J.; Fang, X.; Luo, S.-J. Distribution of Leopard cats in the nearest mountains to urban Beijing and its affecting environmental factors. Biodivers. Sci. 2024, 32, 24138, (in Chinese with English Abstract). [Google Scholar] [CrossRef]
  93. Zhang, G. Study on Dispersal and Habitat Selection of Reintroduced Elliot’s Pheasant (Syrmaticus ellioti). Master’s Thesis, Guangxi Normal University, Guilin, China, 2018. [Google Scholar]
  94. Wang, L.; Lu, Y.; Cai, Y.; Ji, L.; Pang, D.; Zhou, M.; Cheng, Y.; Pu, F.; Zhang, B. The spatial relationship between two sympatric pheasant species and various human disturbance activities. Animals 2025, 15, 95. [Google Scholar] [CrossRef]
  95. Harrington, L.A.; Harrington, A.L.; Yamaguchi, N.; Thom, M.D.; Ferreras, P.; Windham, T.R.; Macdonald, D.W. The impact of native competitors on an alien invasive: Temporal niche shifts to avoid interspecific aggression? Ecology 2009, 90, 1207–1216. [Google Scholar] [CrossRef]
  96. Porfirio, G.; Foster, V.C.; Fonseca, C.; Sarmento, P. Activity patterns of ocelots and their potential prey in the Brazilian Pantanal. Mamm. Biol. 2016, 81, 511–517. [Google Scholar] [CrossRef]
  97. Wang, C.; Zhao, X.; Tao, B.; Peng, J.; Wang, H.; Yu, J.; Jin, L. Do domestic budgerigars perceive predation risk? Anim. Cogn. 2024, 27, 8. [Google Scholar] [CrossRef]
  98. Allen, M.L.; Wallace, C.F.; Wilmers, C.C. Patterns in bobcat (lynx rufus) scent marking and communication behaviors. J. Ethol. 2015, 33, 9–14. [Google Scholar] [CrossRef]
  99. Eichholz, M.W.; Dassow, J.A.; Stafford, J.D.; Weatherhead, P.J. Experimental evidence that nesting ducks use mammalian urine to assess predator abundance. Auk 2012, 129, 638–644. [Google Scholar] [CrossRef]
  100. House, P.K.; Vyas, A.; Sapolsky, R. Predator cat odors activate sexual arousal pathways in brains of toxoplasma gondii infected rats. PLoS ONE 2017, 6, e23277. [Google Scholar] [CrossRef]
  101. Shuai, L.; Zhengxiao, L.; Shan, T.; Kai, S.; Qian, H.; Jianqiang, L.; Jiliang, X. Sex-specific movement responses of Reeves’s pheasant to human disturbance: Importance of body characteristics and reproductive behavior. Animals 2022, 12, 1619. [Google Scholar] [CrossRef]
  102. Kumbhakar, R.; Jafari, S.; Pal, N. Impacts of Predation-Driven Allee Effect and Refuge on the Dynamics of a Predator–Prey Model in a Parameter Plane. Int. J. Bifurc. Chaos. 2025, 35, 2550036. [Google Scholar] [CrossRef]
  103. Bliard, L.; Dufour, P.; Griesser, M.; Covas, R. Family-living and cooperative breeding in birds are associated with the number of avian predators. Evolution 2024, 78, 1317–1324. [Google Scholar] [CrossRef] [PubMed]
Figure 1. Location map of the study area, including distribution of 90 infrared camera trap stations and elevation gradient.
Diversity 17 00460 g001
Figure 2. Methodological workflow integrating camera-trap, MaxEnt model, and kernel density estimation (KDE) for analyzing spatiotemporal niche relationships between Elliot’s pheasant and the Leopard cat.
Diversity 17 00460 g002
Figure 3. Distribution of camera sites and suitable habitat for Elliot’s pheasant and the leopard cat in the Jiemuxi Nature Reserve: (a) photos of the leopard cat (b) and Elliot’s pheasant (c).
Diversity 17 00460 g003
Figure 4. The AUC curves for Elliot’s pheasant (a) and the leopard cat (b) in the MaxEnt model.
Diversity 17 00460 g004
Figure 5. Contribution rate of environmental factors. The main environmental factors affecting the distribution of Elliot’s pheasant are Bio8, resp, Bio16, aspect, and dis-lrdl, whereas those affecting the leopard cat distribution are resp, aspect, Bio8, Bio16, and dis-5shrubland. (For code details, please see Table 1).
Diversity 17 00460 g005
Figure 6. Response curves of Habitat Suitability Index of Elliot’s pheasant and the leopard cat against key environmental factors: (a) mean temperature of wettest quarter (Bio8), (b) distance to settlements (resp), (c) precipitation of wettest month (Bio16), (d) aspect (Aspect), (e) distance to roads (dis-lrdl), and (f) distance to shrublands (dis-5shrubland).
Diversity 17 00460 g006
Figure 7. (a) Diel activity patterns of Elliot’s pheasant and the leopard cat in the Jiemuxi Nature Reserve. (b) Monthly activity frequency (expressed as percent frequency) of Elliot’s pheasant and the leopard cat in the Jiemuxi Nature Reserve.
Diversity 17 00460 g007
Figure 8. The number of independent effective photos of Elliot’s pheasant and the leopard cat in each time period (each 30 min time interval) in the Jiemuxi Nature Reserve.
Diversity 17 00460 g008
Figure 9. The activity patterns of Elliot’s pheasant at different scales: (a) breeding season, (b) non-breeding season, (c) leopard cat present sites, (d) leopard cat absent sites. The shaded area represents the temporal activity overlap between the two species.
Diversity 17 00460 g009
Figure 10. Predation evidence on Elliot’s pheasant in Jiemuxi National Nature Reserve, July 2024. (a,b) Feather remains from Elliot's pheasant (Syrmaticus ellioti) predation events.
Diversity 17 00460 g010
Table 1. Environmental variables. Environmental variables used in the MaxEnt model for Elliot’s pheasant and the leopard cat in Jiemuxi National Nature Reserve, including the followinf: 19 bioclimatic (Bio1–Bio19), 1 hydrological System, 2 anthropogenic disturbance, 6 vegetation, and 3 topographic variables with corresponding units.
TypeCodeVariables DescriptionUnit
ClimateBio1Annual Mean Temperature°C
Bio2Mean diurnal range°C
Bio3Isothermality%
Bio4Temperature Seasonality°C × 100
Bio5Max Temperature of Warmest Month°C
Bio6Min Temperature of Coldest Month°C
Bio7Temperature Annual Range°C
Bio8Mean Temperature of Wettest Quarter°C
Bio9Mean Temperature of Driest Quarter°C
Bio10Mean Temperature of Warmest Quarte°C
Bio11Mean Temperature of Coldest Quarter°C
Bio12Annual Precipitationmm
Bio13Precipitation of Wettest Monthmm
Bio14Precipitation of Driest Monthmm
Bio15Precipitation Seasonality%
Bio16Precipitation of Wettest Quartemm
Bio17Precipitation of Driest Quartermm
Bio18Precipitation of Warmest Quartermm
Bio19 Precipitation of Coldest Quartermm
Hydrological Systemdis-hydlDistance to riversm
Anthropogenic Disturbancedis-lrdlDistance to roadsm
respDistance to settlementsm
VegetationNDVINormalized difference vegetation index\
dis-1farmlandDistance to farmlandm
dis-2CLforestDistance to evergreen broad-leaved forestsm
dis-3LYforestDistance to deciduous broad-leaved forestsm
dis-4conforestDistance to coniferous and broad-leaved mixed forestsm
dis-5shrublandDistance to shrublandsm
TopographyaltitudeAltitudem
slopeSlope%
aspectAspect°
Table 2. Spatial niche overlap metrics between Elliot’s pheasant and the leopard cat in Jiemuxi National Nature Reserve, showing Maximum Training Sensitivity plus Specificity (MTSS) thresholds, total suitable habitat areas (km2), percentage of reserve coverage, and overlapping area proportion of overlapping area to each species’ total suitable habitat.
SpeciesMTSSTotal Suitable Area (km2)% of ReserveOverlapping Area (km2)% of Each Species’ Total Suitable Habitat
Elliot’s pheasant0.411332.4424.8821.3865.91
Leopard cat0.344536.6228.0858.39
Table 3. Comparison of activity rhythms overlaps (Δ) between Elliot’s pheasant and the Leopard cat across different temporal scales in Jiemuxi National Nature Reserve.
Analysis ContextCamera Sites (Elliot’s Pheasant)Independent Photos (Elliot’s Pheasant)Overlap IndexComparative Difference vs. Overall
Overall activity patterns51227Δ4 = 0.379 (p < 0.01)Baseline
Leopard cat present sites2278Δ1 = 0.343 (p < 0.01)↓ 0.036
Leopard cat absent sites29149Δ4 = 0.408 (p < 0.01)↑ 0.029
Breeding season \71Δ1 = 0.479 (p < 0.01)↑ 0.100
Non-breeding season\156Δ4 = 0.328 (p < 0.01)↓ 0.051
Disclaimer/Publisher’s Note: The statements, opinions and data contained in all publications are solely those of the individual author(s) and contributor(s) and not of MDPI and/or the editor(s). MDPI and/or the editor(s) disclaim responsibility for any injury to people or property resulting from any ideas, methods, instructions or products referred to in the content.

