Article

Effects of Land Use and Water Level Fluctuations on Phytoplankton in Mediterranean Reservoirs in Cyprus

by
Polina Polykarpou
1,2,*,
Natassa Stefanidou
3,
Matina Katsiapi
3,4,
Maria Moustaka-Gouni
3,
Savvas Genitsaris
1,
Gerald Dörflinger
2,
Athena Economou-Amilli
1 and
Dionysios E. Raitsos
1
1
School of Biology, National & Kapodistrian University of Athens, Zografou Campus, 15784 Athens, Greece
2
Water Development Department, 100-110 Kennedy Avenue, 1047 Pallouriotissa, Nicosia 1646, Cyprus
3
Department of Botany, School of Biology, Aristotle University of Thessaloniki, 54124 Thessaloniki, Greece
4
Thessaloniki Water Supply & Sewerage Co. S.A., 54635 Thessaloniki, Greece
*
Author to whom correspondence should be addressed.
Diversity 2025, 17(7), 457; https://doi.org/10.3390/d17070457
Submission received: 17 May 2025 / Revised: 23 June 2025 / Accepted: 27 June 2025 / Published: 28 June 2025
(This article belongs to the Section Freshwater Biodiversity)

Abstract

Land use composition, water level fluctuations (WLFs), and biogeographical factors are recognized as key drivers of phytoplankton dynamics in reservoir ecosystems. This two-year study presents the first assessment of the combined effects of catchment land use, WLFs, and geographical distance on phytoplankton biomass and community composition across twelve Mediterranean reservoirs in Cyprus, which serve primarily for drinking water supply and irrigation. The results show that higher phytoplankton biomass was recorded in reservoirs whose catchments had >30% coverage by developed land (urban and agricultural), suggesting that increased anthropogenic pressures may lead to nutrient enrichment and elevated productivity. However, despite elevated biomass, no consistent spatial patterns were observed in phytoplankton community composition. The geographical distance between reservoirs had only a minor effect on species distribution, implying that other factors—such as water residence time or hydrological variability—play a more prominent role in shaping community structure. Phytoplankton biomass maxima were most often recorded during periods of elevated water levels and were typically dominated by Chlorophyta, Dinoflagellata, Bacillariophyta, and Charophyta. The pronounced temporal variability in species composition across all reservoirs points to a highly dynamic system, where environmental fluctuations strongly influence community assembly. This study provides the first comprehensive data on phytoplankton in Cyprus reservoirs, highlighting the importance of land use and hydrological regulation for water quality management in similar settings. Importantly, this baseline dataset can support the implementation of the Water Framework Directive (WFD) by contributing to the definition of ecological status classes, establishing reference conditions, and guiding future monitoring and assessment efforts. Expanding such datasets through coordinated, basin-wide monitoring initiatives is essential to improve our understanding of phytoplankton dynamics and their role in ecosystem functioning under the pressures of climate change and intensified land use in this Mediterranean “hot spot”.

1. Introduction

Phytoplankton is a key component of aquatic ecosystems, serving as an indicator of ecological water quality due to its sensitivity and dynamic responses to environmental changes [1]. The spatial and temporal patterns of phytoplankton communities in lakes and reservoirs are driven by multiple factors that interact with one another, such as catchment land use composition, hydrology, light availability, and geographical distance between systems [2,3]. Changes in the taxonomic composition of phytoplankton as a result of environmental shifts have been extensively documented, revealing the dominance of different taxonomic groups under various conditions. For instance, several studies have demonstrated the comparative advantage of Chlorophyta and Charophyta in oligotrophic and mesotrophic conditions, while Cyanobacteria (or Cyanobacteriota) rapidly thrive in eutrophic lakes and reservoirs [4]. Cyanobacteria are the most notorious bloom formers in eutrophic systems and include numerous harmful and toxic species. Their blooms can lead to significant water quality issues impacting fisheries, aquaculture, and animal and human health [5]. As a result, the composition, abundance, and biomass of phytoplankton species have long been considered important key metrics for monitoring ecosystem health [6,7].
Catchment land use patterns play a critical role in shaping the quality of lake water, particularly affecting phytoplankton dynamics, as highlighted by multiple studies [8,9,10]. Mediterranean freshwater systems, in particular, are more sensitive to land use changes within their catchment [11]. The expansion of agricultural lands and the intensification of farming have emerged as major contributors to water quality degradation in lakes and reservoirs [12,13,14]. Agriculture and urban development are key drivers of eutrophication [10], a process that triggers harmful algal blooms, oxygen depletion, and a subsequent decline in biodiversity, including the loss of economically important species [12]. Toxic algal blooms, such as those caused by Cyanobacteria, can trigger fish kills due to their toxins or oxygen depletion, further disrupting aquatic ecosystems [4,13]. Moreover, land use changes can also influence the diversity of phytoplankton within a lake [11,15]. For example, Euglenophyta thrive in shallow, mesotrophic lakes with well-mixed waters and higher agricultural land area in the upstream watershed, while Cyanobacteria are more prevalent in eutrophic lakes surrounded by urban development [15]. In Mediterranean lakes and reservoirs, certain species of Cyanobacteria have been strongly linked to both agricultural and artificial land use types [11]. Urban development and agricultural intensification are also associated with higher phytoplankton abundance and biomass [11,16,17], with greater biomass typically found in lakes and reservoirs with more developed catchments [15,18]. In summary, changes in phytoplankton dynamics reported in the literature illustrate the complex relationship between land use and water quality.
Several hydrological factors have been identified as critical factors in shaping the community structure, succession, and dynamics of phytoplankton in lakes and reservoirs [19,20,21]. Among these, WLFs are particularly critical, as they serve as a major hydrological factor influencing phytoplankton community composition and dynamics [22,23]. It is known that WLFs can impact various abiotic factors, such as light availability and water column mixing. These, in turn, impact light and mixing regimes, potentially enhancing the proliferation and dominance of Cyanobacteria [24]. Studies have shown that periods of low water levels, reduced water renewal, and turbulence in reservoirs [25] create favorable conditions for cyanobacterial blooms [26]. These blooms pose serious health risk concerns due to the presence of nuisance species, which can release harmful toxins into the water [25]. Conversely, substantial water level reductions may result in increased sediment resuspension, thus elevated turbidity levels and reduced light penetration, conditions that are likely to be accompanied by phytoplankton biomass limitation and shifts in community structure [27]. Finally, reduced water levels can decrease the biodiversity and abundance of aquatic life, further affecting the trophic structure and overall ecosystem function [22]. Therefore, WLFs are a key factor in shaping phytoplankton dynamics and influencing the ecological health of freshwater bodies.
The biological similarity among communities typically decreases as the geographical distance increases, a concept known as the distance–decay relationship (DDR), which is a key metric for understanding spatial biodiversity patterns. The DDR, or beta diversity, is an important tool for ecologists to study variations in community composition between sites that are geographically separated [28]. Recent research has explored how geographical distance influences microorganism dispersal [2,29,30,31,32], with some studies suggesting that phytoplankton community structure is not significantly influenced by geographical distance alone [29] but is more strongly shaped by environmental heterogeneity across systems [33]. Conversely, other studies have observed a slight distance–decay pattern in phytoplankton communities, highlighting the combined influence of both geographical distance and environmental niche filtering in shaping community structure [32,34]. As a result, it is now widely accepted that both local environmental factors and geographical distance between systems influence microorganism community composition. DDRs have been widely used to assess the impact of geographical distance on community homogenization, revealing an inverse relationship in both terrestrial and aquatic metazoan communities [29,35,36].
Reservoirs are critical infrastructures for supplying water, especially in areas facing increased water scarcity [37]. Recent research indicates that Cyprus ranks among the six most water-stressed countries on an annual basis, along with Bahrain, Kuwait, Lebanon, Oman, and Qatar [38]. These countries face extreme water stress due to limited water availability, with over 80% of their water resources being used for irrigation, livestock, industry, and domestic purposes [38]. Cyprus manages its hydrological variability through water storage reservoirs that store water during wet periods and supply it during dry months. In recent decades, however, these water reservoirs have faced water shortages due to ever increasing water demand, as they represent one of the island’s main water sources, which has been further exacerbated by regional weather fluctuations and climate change [39,40]. These reservoirs are critical not only for supporting irrigation but also for providing drinking water and, in some cases, for recharging downstream rivers. Additionally, they serve as biodiversity hotspots, with many being part of areas protected both at a national and European level (e.g., Ramsar sites and Special Protected Areas (SPAs)). Despite their importance, these reservoir ecosystems remain largely unexplored. Previous research has mainly focused on phytoplankton monitoring to implement the WFD and assess water quality [41]. More recent research has examined the shifts in phytoplankton composition and structure in Cyprus’ ephemeral saline lakes [42]. Other studies have utilized remote sensing techniques to assess the water quality of specific reservoirs, such as Kouris and Asprokremmos [43,44], while some have examined the impact of climate change and rising water demand on reservoirs [40]; yet, none of these studies have included biological data.
The scope of this study is to provide the first assessment of the phytoplankton community structure (species richness, spatial and temporal β-diversity, abundance, and biomass) in Cyprus’ water storage reservoirs and evaluate the influence of key environmental drivers, including catchment land use, WLFs, and geographical distance. Given the limited research on the biology of these systems, the study aims to establish essential baseline information that can inform long-term monitoring, enhance water quality assessments, and guide the development of effective management strategies for Cyprus’ vital water resources. The findings are also relevant for similarly stressed Mediterranean freshwater ecosystems, which are increasingly vulnerable to the impacts of climate change.

2. Materials and Methods

2.1. Study Area and Sampling

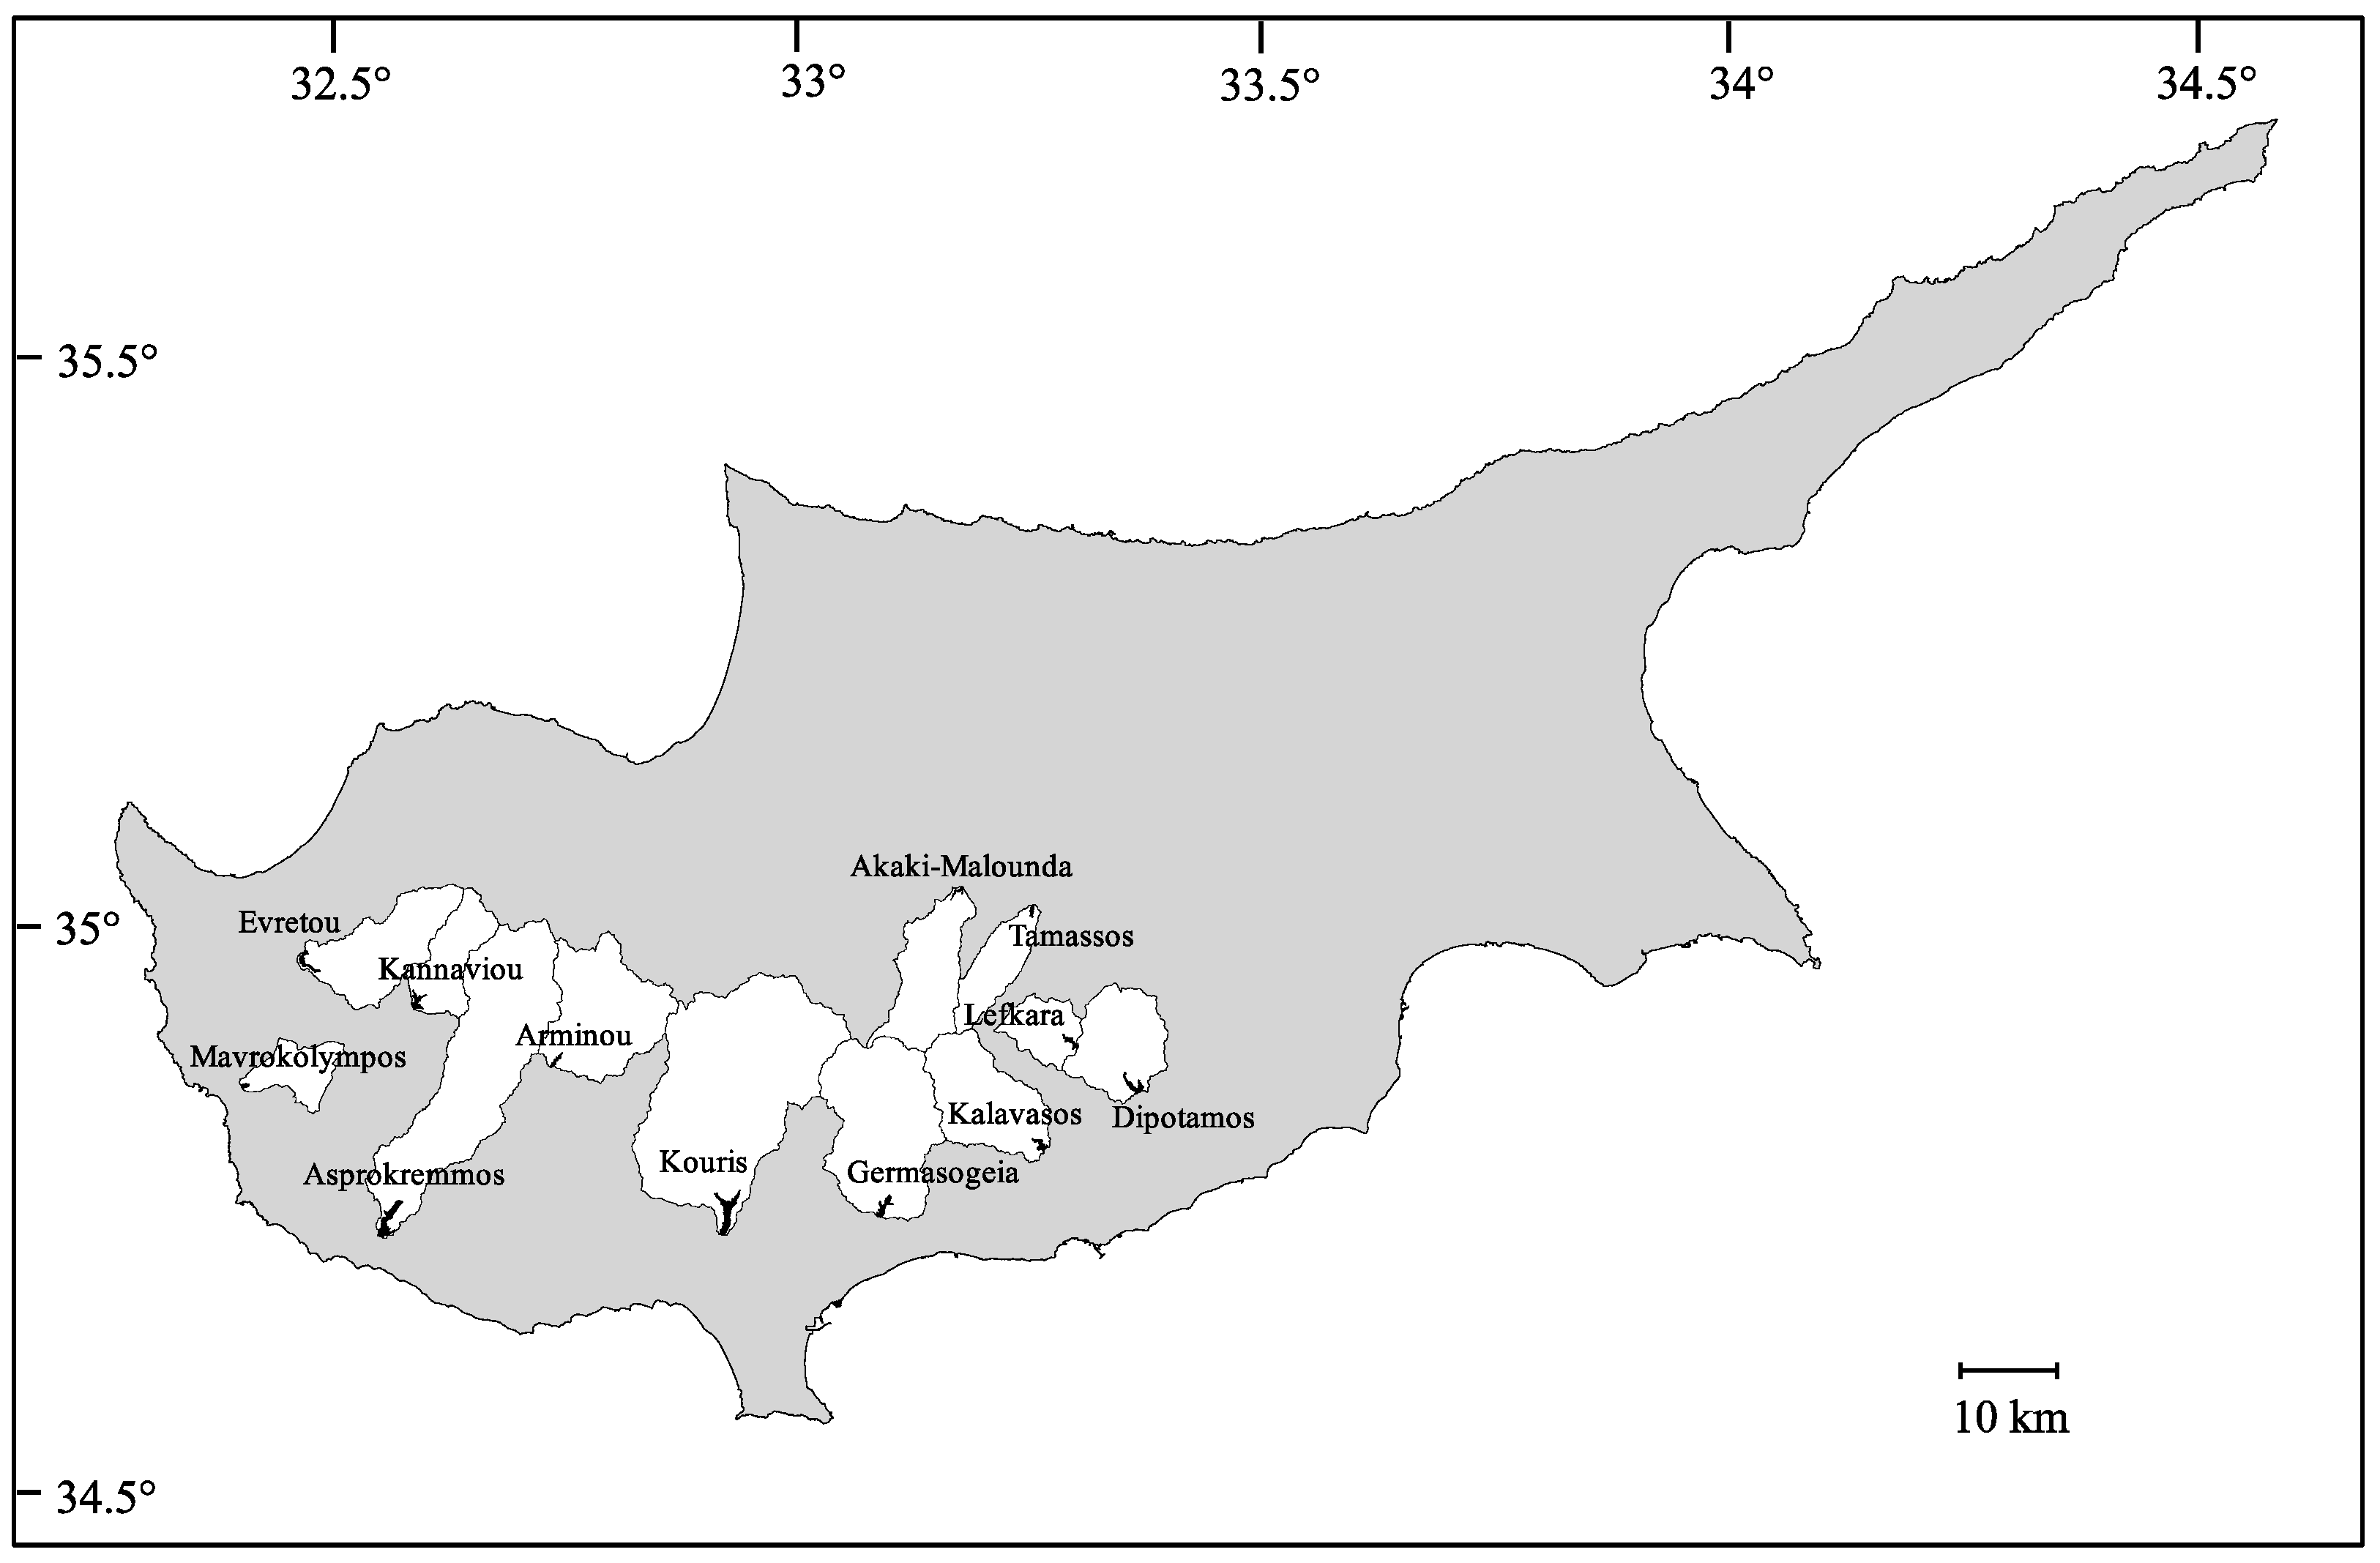
The present study comprises twelve reservoirs that were built by the Cyprus Water Development Department (WDD), Ministry of Agriculture, Rural Development and Environment between 1966 and 2007, primarily for water collection and storage (Figure 1 and Table 1). Kouris is the largest reservoir on the island, with a maximum storage capacity of 115 million m3, a surface area of around 3 km2, and an approximate maximum depth of 87 m at the deepest lake point (DLP). The second largest is the Asprokremmos Reservoir, with around half the maximum storage capacity (52 million m3), a surface area of approximately 2.6 km2, and an approximate 41 m maximum depth at the DLP. The other reservoirs are much smaller, with a storage capacity of 2.2–24 million m3 and around a 16–63 m maximum depth at the DLP.
The majority of these reservoirs are situated around the Troodos Mountain range, with a few located at lower altitudes, near coastal areas, such as the Mavrokolympos Reservoir in Pafos and the Germasogeia Reservoir in Limassol. Their inflows come mainly from precipitation–runoff processes, except from the Kouris and Dipotamos Reservoirs. Kouris receives water from the Arminou Reservoir via the “Dhiarizos-Kouris diversion”, a 14.5 km tunnel. Dipotamos receives additional water from the neighboring Maroni catchment. Ten out of the twelve reservoirs serve as sources of drinking water, and all of them are used for irrigation (Table 1). Additionally, some reservoirs, such as Arminou and Germasogeia, release water for downstream river recharging. The area is characterized by a semi-arid Mediterranean climate, where the main precipitation events occur during wintertime (December–January).
Most of these reservoirs have been declared as protected areas by the government of Cyprus. Arminou, Dipotamos, Lefkara, Evretou, Kannaviou, and Kouris are also protected bird habitats under the European Birds Directive. Additionally, Akaki-Malounta, Asprokremmos, Mavrokolympos, and Germasogeia are among the protected areas under the Habitats Directive 92/43/EEC (Natura 2000) [45] (Table 1). Finally, Lefkara and Kannaviou reservoirs have been identified as phytoplankton reference sites classified with a maximum ecological potential during the implementation of the WFD [41].
Phytoplankton sampling in the twelve reservoirs was conducted by the WDD between March 2016 and March 2018 (Figure 1 and Table 1). Depth-integrated water samples were collected at the deepest point of each reservoir, from the euphotic zone (defined as 2.5 × Secchi depth), using an integrating water sampler (Hydrobios). Five hundred mL subsamples were preserved in situ with acidic Lugol’s iodine solution and kept in the dark until phytoplankton analysis. Fresh (non-preserved) subsamples were also collected using a phytoplankton net (with a mesh size of 55 μm) and stored in the dark in a portable cooling box for immediate species identification. Samples were collected in spring (March), summer (June and July), and autumn (September and October).

2.2. Land Use Coverage

The land use coverage of the reservoirs’ catchments (Figure 1) was assessed using the CORINE Land Cover 2018 for Cyprus [46]. The CORINE Land Cover 2018 database is the only land use type database validated at the national level. Land use types are categorized into three levels, with increasing details on the spatial characteristics of each land use type. For our analysis, we utilized the third level, which provides the most detailed data. The proportions of land use cover were calculated for the entire catchment area of each reservoir using the analytical tools in ArcMap 10.5.1 (ArcGis Desktop 10.5.1 software). The primary land use categories in our study included agricultural (non-irrigated arable land, permanently irrigated land, vineyards, fruit trees and berry plantations, olive groves, annual crops associated with permanent crops, complex cultivation patterns, and land predominantly used for agriculture, with significant areas of natural vegetation), artificial (discontinuous urban fabric, industrial, or commercial units, mineral extraction sites, sports and leisure facilities), forest and semi-natural (broad-leaved forests, coniferous forests, mixed forests, natural grasslands, sclerophyllous vegetation, transitional woodland–shrub, beaches–dunes–sands, sparsely vegetated areas, and burnt areas), and water bodies (inland waterbodies).

2.3. Water Level

Water level data (m above mean sea level) for each reservoir were recorded and provided by the WDD. To facilitate comparisons across the different reservoirs, these data were transformed into standard deviations from the mean and expressed as water level anomalies. Water level anomalies indicate how much the water level at a given time deviates from the long-term average. Standardized anomalies were calculated using the z-score formula:
Water   level   anomaly = X μ σ
where
  • X = the observed water level at a given time;
  • μ = the mean water level over the period of interest (e.g., the full study period);
  • σ = the standard deviation of water level over the same period.

2.4. Microscopy Analysis

Phytoplankton microscopic analysis was performed using fresh and preserved samples [47,48]. The samples were examined using Hydrobios sedimentation chambers (3, 5, 10, 25, and 50 mL volumes) based on phytoplankton density under a light inverted microscope with phase contrast (Carl Zeiss Axio Observer.A1 (Zeiss, Jena, Germany), Nikon Eclipse TE 2000-S (NIKON, Amstelveen, The Netherlands)). Species identification was carried out using relevant taxonomic keys. Phytoplankton enumeration was performed using Utermöhl’s sedimentation method [47,48,49], counting at least 400 cells (individuals) per sample. Mean cell or filament volume estimates were calculated using appropriate geometric formulae based on the water quality standard CEN/EN 16695:2015 [48]. For this, the dimensions of 30 individuals (cells, filaments, and colonies) of each species (taxon) were measured using digital microscope cameras and the relevant software (Canon Power Shot A640 and Carl Zeiss AxioVision Rel. 4.7 and Nikon DS-L1) [48]. Phytoplankton species that exhibited a significant population increase (high cell density in relation to cell volume) were considered bloom-forming species.

2.5. Data Analysis

Land use can influence the structure of the freshwater phytoplankton community. A number of studies have shown positive nonlinear relationships between land use intensity and nutrient loading (or ecological degradation), although the exact thresholds vary [50]. In the present study, catchments with more than 30% of their area covered by artificial and agricultural land use types were defined as “developed areas”, following Katsiapi et al. [11]. Since Mediterranean-specific thresholds are lacking, this threshold may serve as a practical, regionally relevant benchmark for assessing eutrophication risk and the overall ecological integrity of reservoirs rather than an absolute ecological trigger. Based on the above, the studied reservoirs were divided into two distinct groups: reservoirs with >30% of their catchment area covered by “developed areas” and reservoirs with <30% land coverage by “developed areas”. In order to examine differences in the phytoplankton community structure (species richness, abundance, and biomass) between the two groups of reservoirs defined by catchment land use, one-way ANOVA was applied using the “dplyr” R statistical package, version 1.1.4. A generalized linear regression model was implemented to test the effect of land use coverage based on the third spatial data level of the CORINE Land Cover 2018 in the catchment area of each reservoir based on phytoplankton biomass. The statistical significance of the relationship between the two variables was assessed by F significance and the strength of the relationship was indicated by R2. All statistical analyses were performed in the R 4.3.3 environment [51].
Additionally, we computed spatial beta diversity for the six samplings (per reservoir) and each group of reservoirs based on their land use coverage using the “betapart” R package, version 1.6. Beta diversity, which quantifies the compositional dissimilarity among communities, was partitioned into spatial turnover and nestedness components, following Baselga’s approach [52]. This approach [35] suggests that Sorensen dissimilarity (bSOR) should be partitioned into two components: spatial turnover in species composition, which captures dissimilarity due to the replacement of species between sites, measured as the Simpson dissimilarity index (bSIM) and variation in species composition due to nestedness (bNES), which accounts for differences in species composition when one community is a subset of another, measured as the nestedness fraction of Sorensen dissimilarity.
Τo explore the relationship between spatial nestedness and geographic distance between reservoirs, pairs of reservoirs were formed across a range of distances, and we calculated pairwise beta diversity and its components, turnover, and nestedness using the “betapart” R package, version 1.6. The relationship between nestedness and distance for each group of reservoirs based on land use coverage was estimated using the Spearman rank correlation coefficient and linear, along with nonlinear, regression models. In every model that we constructed, distance was treated as the predictor variable and bNES as the response variable. Additionally, Spearman’s rank correlation coefficient was used to examine the relationship between phytoplankton biomass differences and distance across the same reservoir pairs.
Finally, temporal changes in community composition within each reservoir were assessed by calculating temporal beta diversity using the “betapart” R package, version 1.6. To explore the relationship between the WLFs and species turnover, as well as WLFs and phytoplankton biomass, Spearman’s rank correlation coefficient was applied.

3. Results

3.1. Catchment Land Use Coverage and Phytoplankton Community Structure

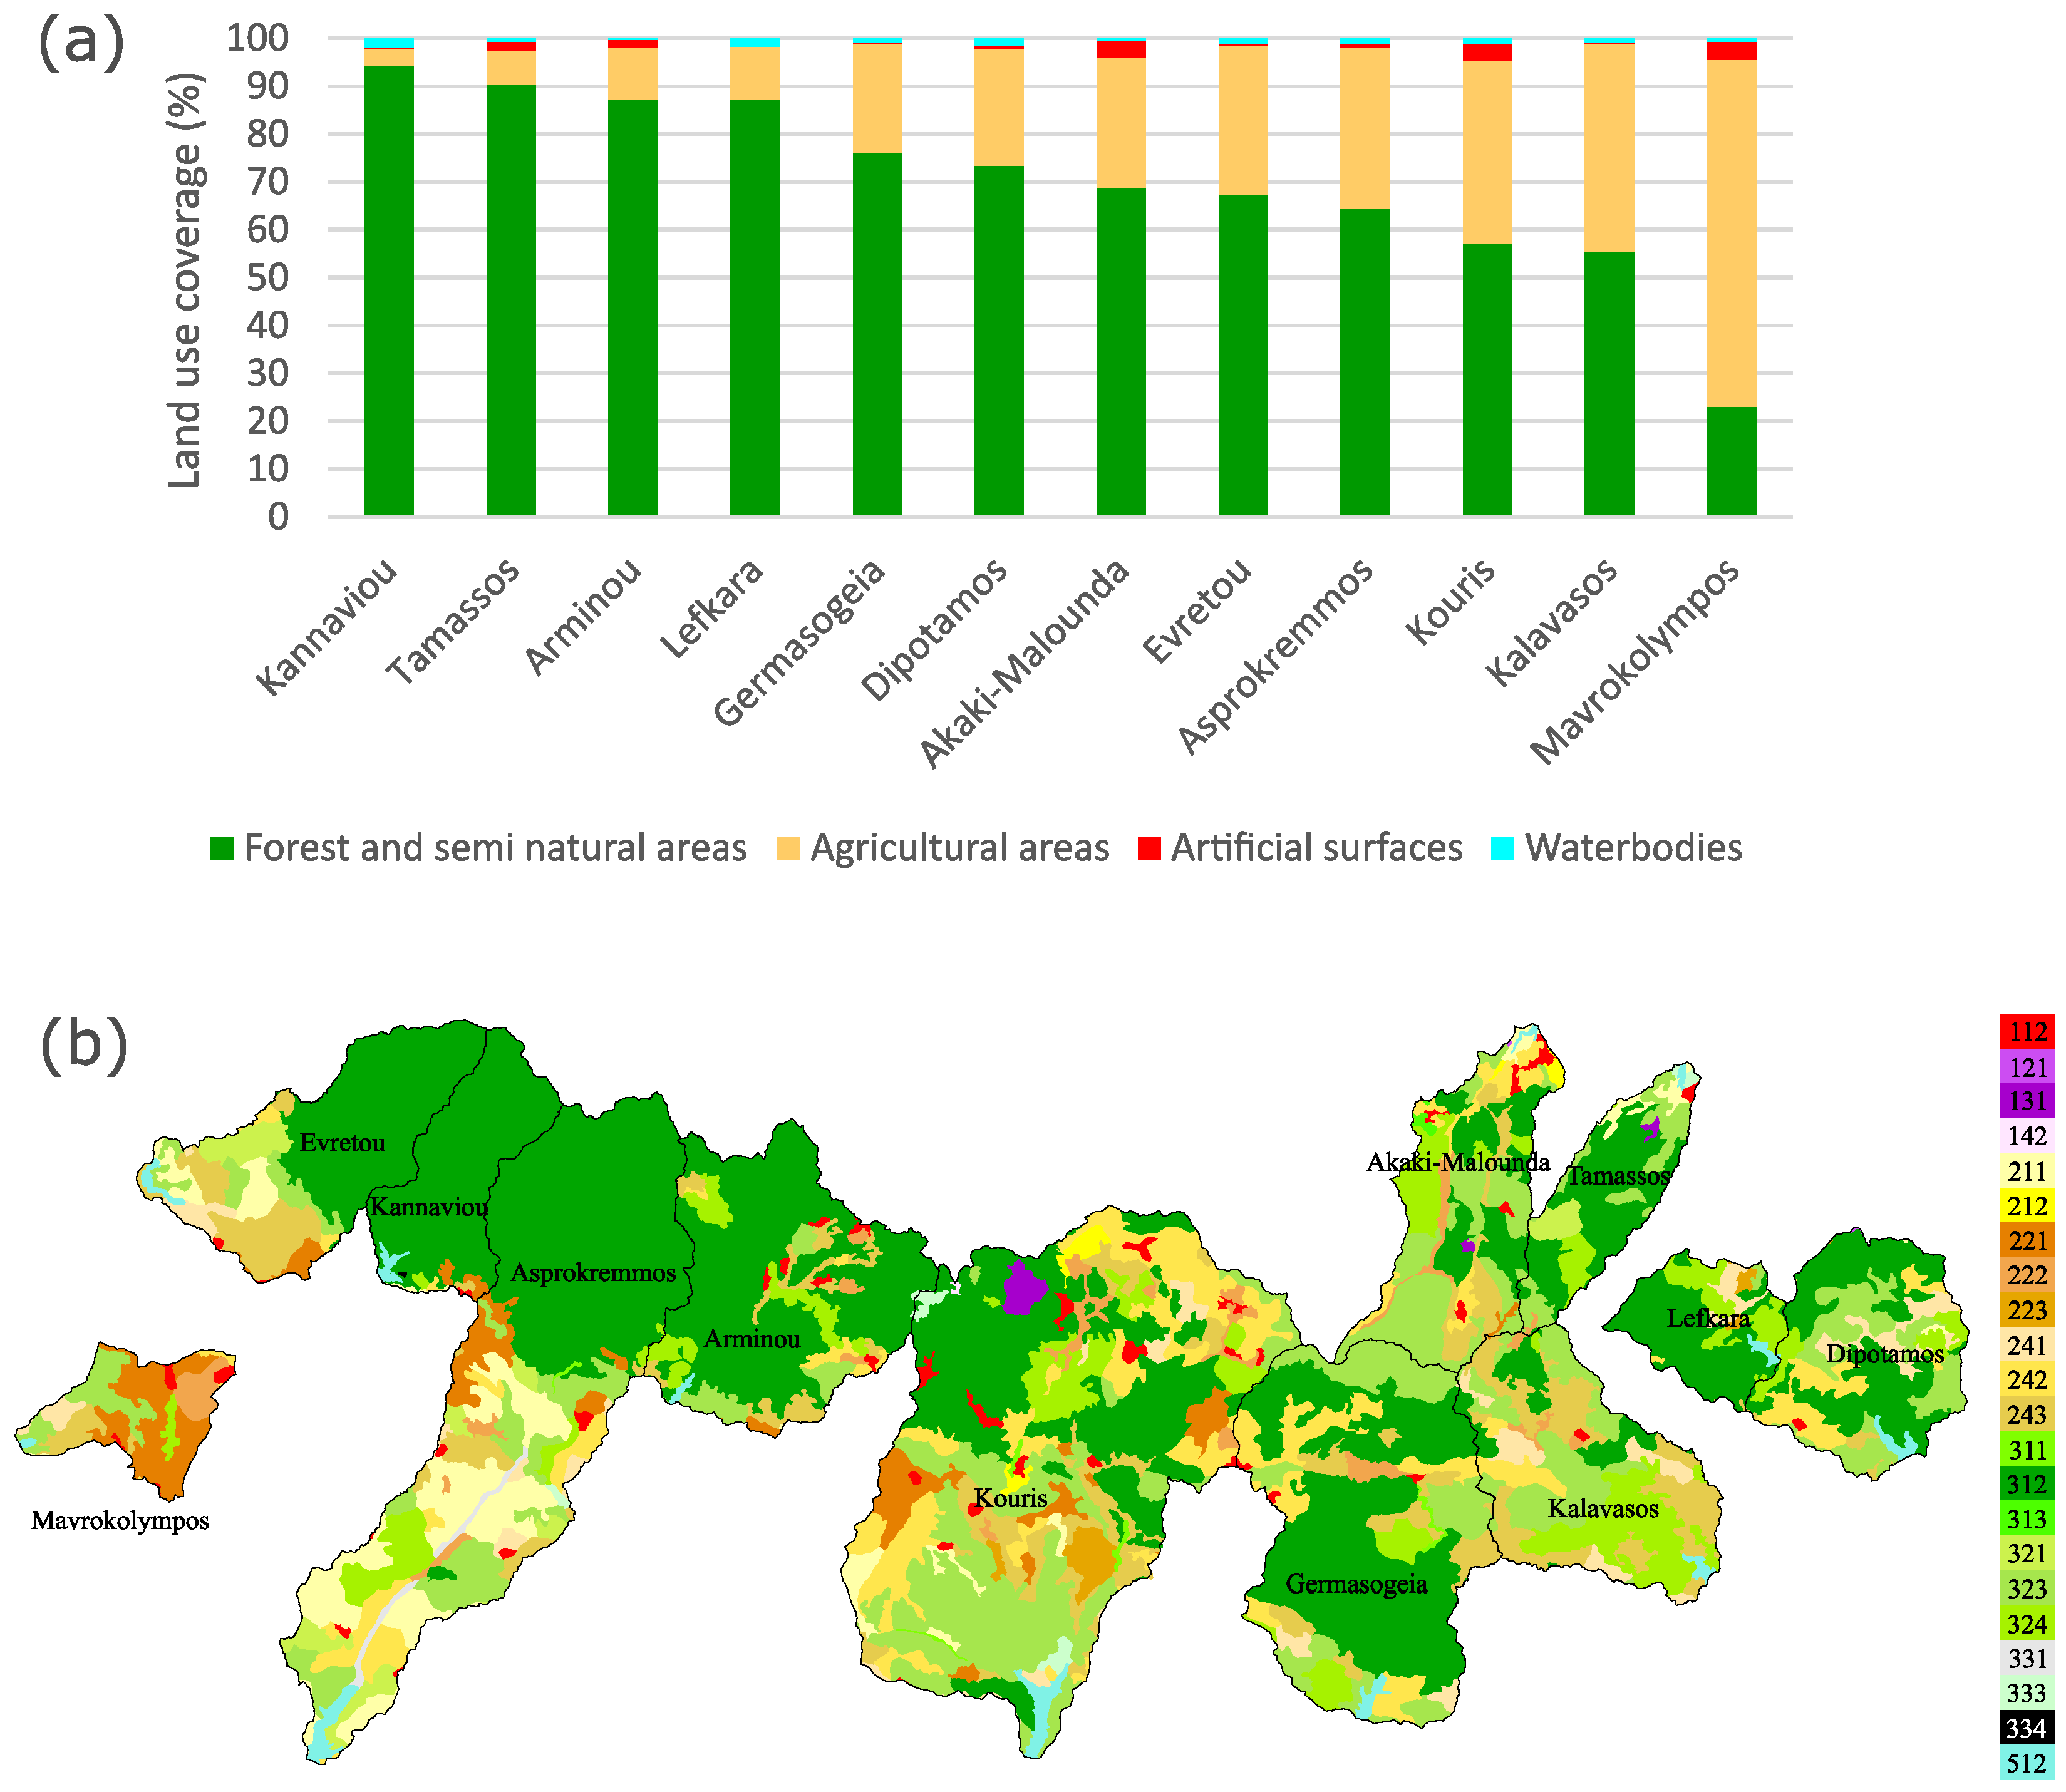
Analysis of catchment land use coverage of the studied reservoirs reveals that the predominant (>55%) land use types were forest and semi-natural areas, except for the Mavrokolympos Reservoir, where forest and semi-natural areas accounted for only 23% of the associated catchment (Figure 2). Agricultural areas were typically less than forest and semi-natural areas, ranging from 4% to 43% for most reservoirs. Nevertheless, agricultural land use in Mavrokolympos was calculated to account for 72% of the catchment’s area. Artificial surfaces had the lowest land use coverage in all the catchments, with the highest being 3.8% in Mavrokolympos. The highest percentages of forest and semi-natural areas (>73%) were found in the catchments of the Kannaviou, Tamassos, Arminou, Lefkara, Germasogeia, and Dipotamos Reservoirs. Regarding developed areas, the reservoirs with >30% of their catchment area covered by developed areas (first group) were Akaki-Malounta, Asprokremmos, Evretou, Kalavasos, Kouris, and Mavrokolympos, and the ones with <30% land coverage by developed areas (second group) were Arminou, Dipotamos, Germasogeia, Kannaviou, Lefkara, and Tamassos.
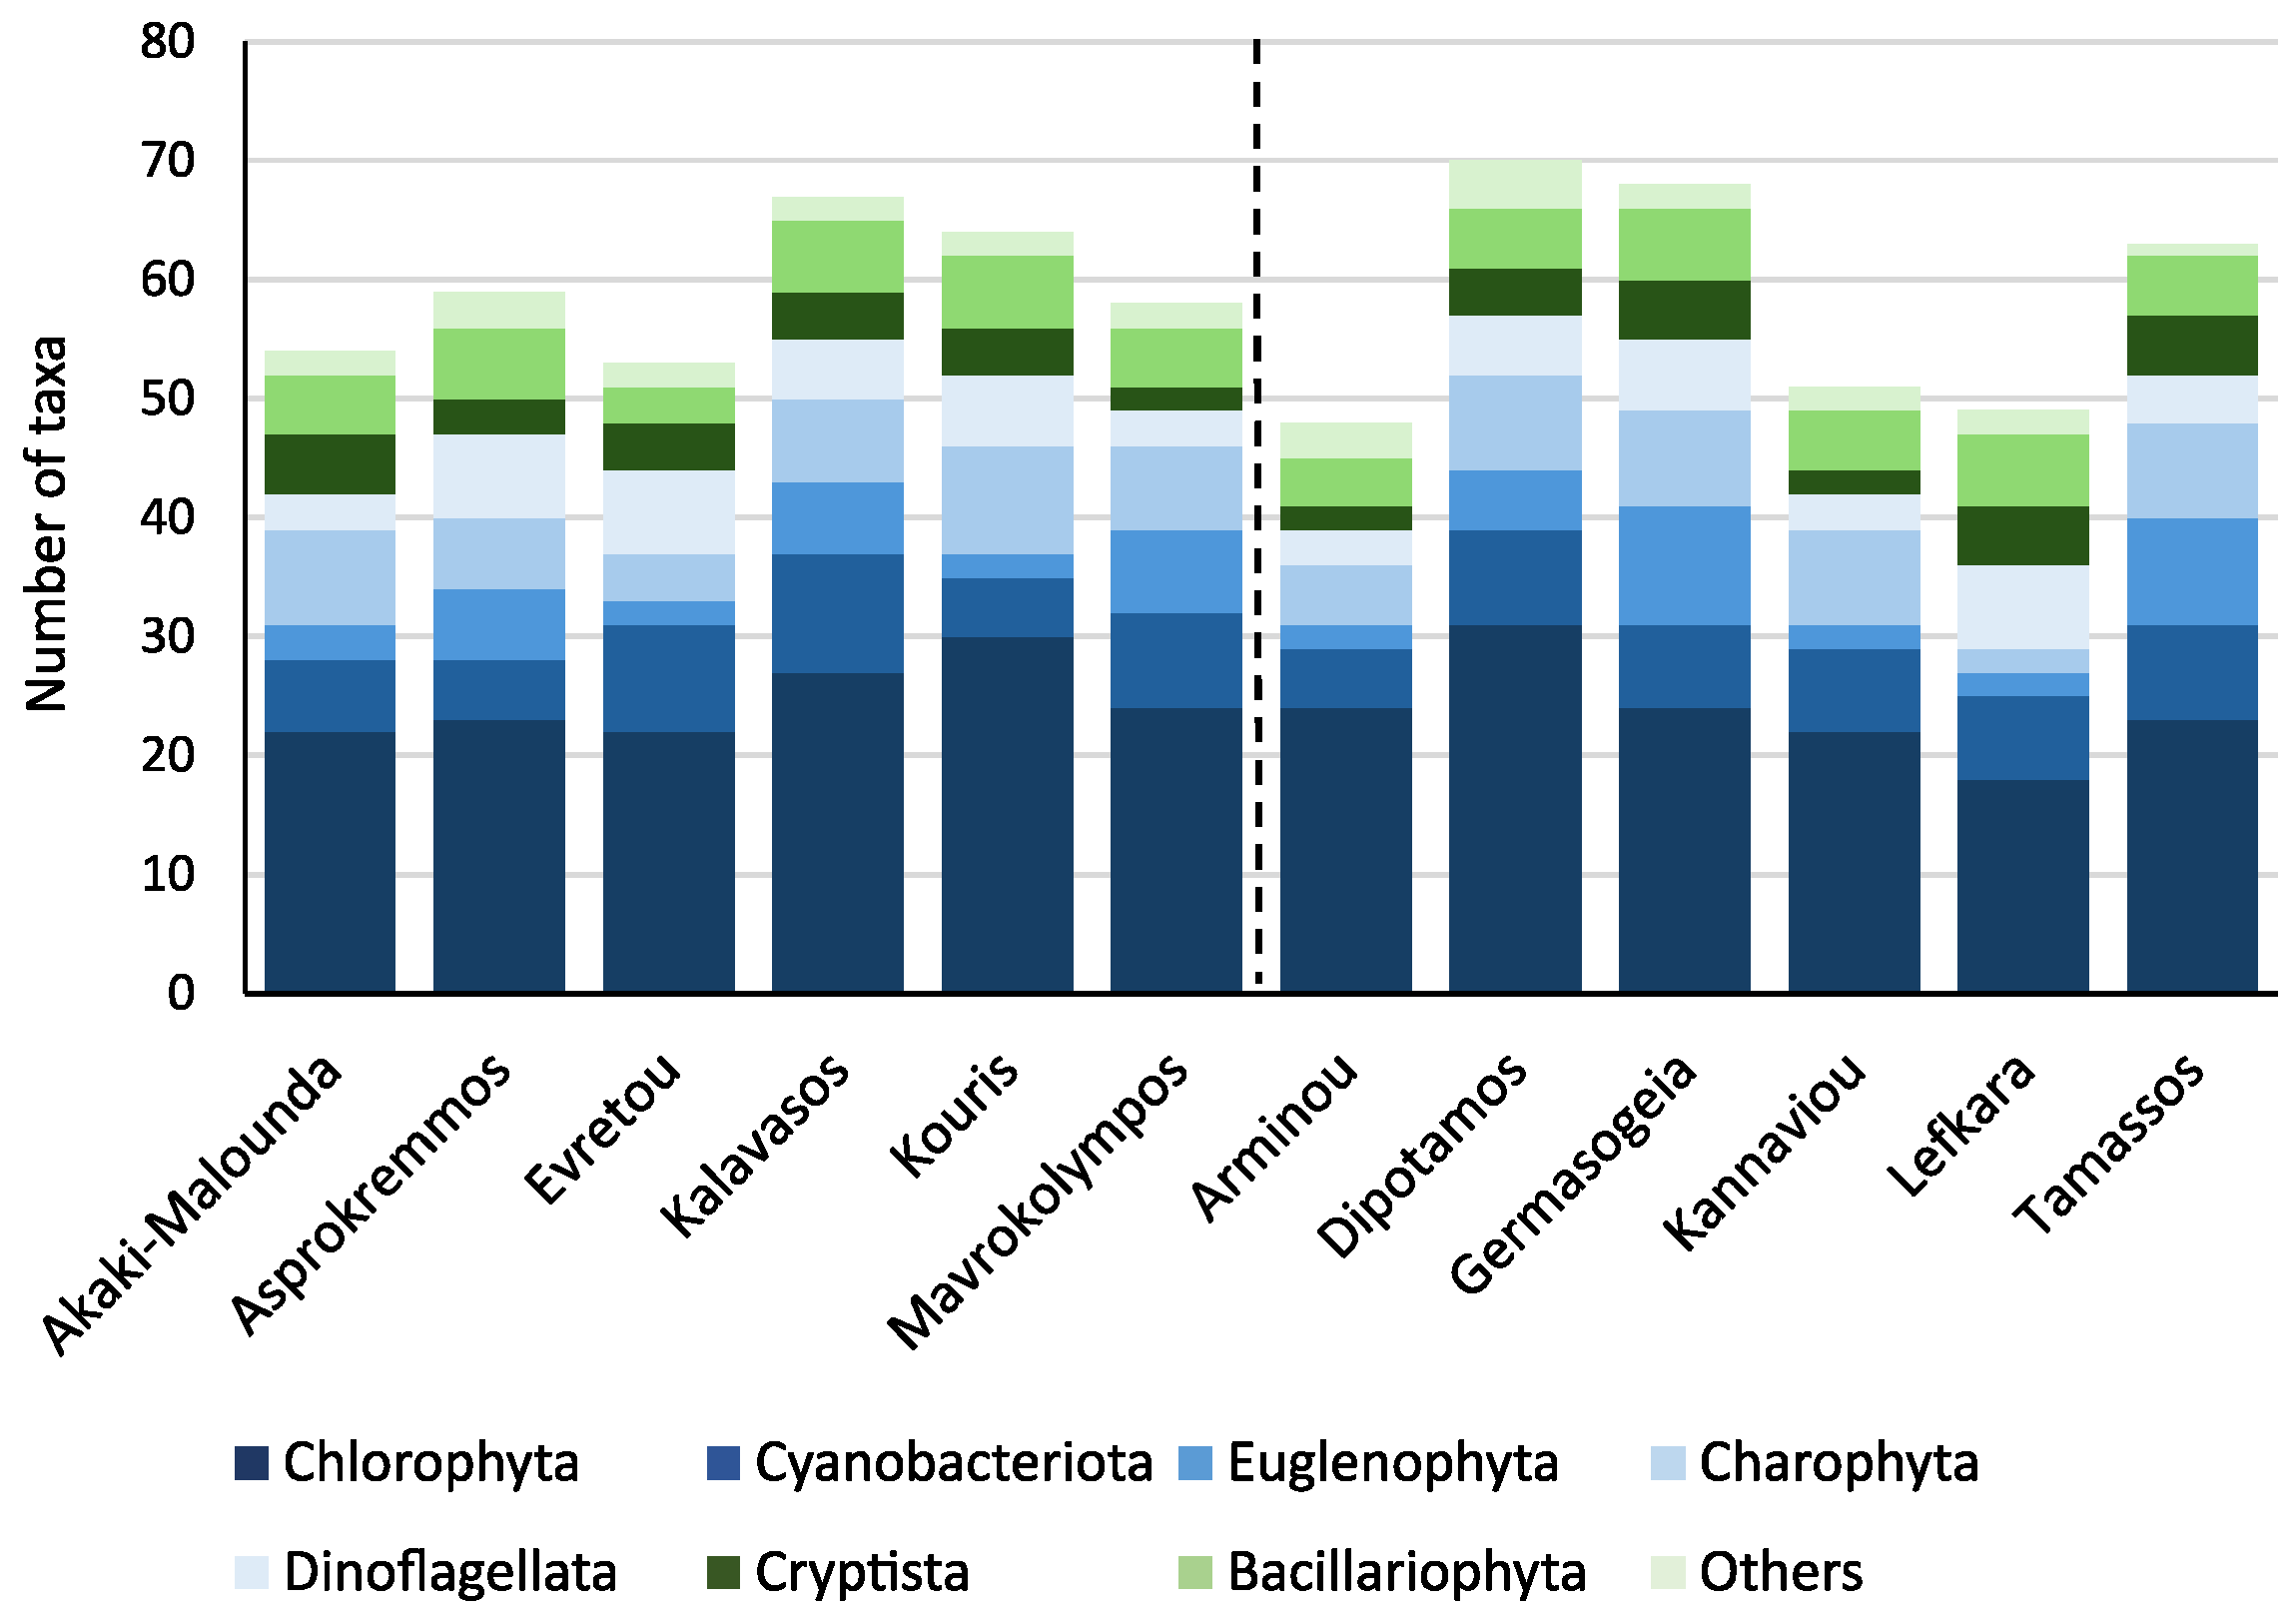
During the study period, a total of 162 phytoplankton morphospecies (taxa) were recorded in the studied reservoirs. Chlorophyta exhibited the highest species richness with 72 taxa, followed by Cyanobacteriota (24 taxa), Euglenophyta (18 taxa), Charophyta (16 taxa), Cryptista (10), Dinoflagellata (10 taxa), and Bacillariophyta (or “diatoms”–8 taxa). Haptophyta and Heterokontophyta (“other groups”) were represented by <3 taxa (Figure 3). In terms of species richness, Chlorophyta was the most diverse taxonomic group across all the reservoirs, followed by Cyanobacteriota and Charophyta (Figure 3). Dipotamos exhibited the highest number of taxa among the reservoirs (70 taxa), while the lowest species richness was recorded in the Arminou reservoir. No phytoplankton species richness pattern was observed distinguishing the two groups of reservoirs (Figure 3).
The phytoplankton spatial beta diversity (bSOR) varied between 0.943 and 0.965 for reservoirs with >30% developed areas and between 0.947 and 0.963 for those with <30% developed areas in their catchment area (Figure S1). Overall, the variation in the three components was minimal throughout the study period.
The phytoplankton temporal beta diversity (bSOR) within each reservoir ranged from 0.931 to 0.955, with species turnover being the primary contributor rather than nestedness. Specifically, temporal bSIM varied between 0.828 in Akaki-Malounta and 0.894 in Kouris for reservoirs with >30% developed areas and between 0.808 in Kannaviou and 0.901 in Germasogeia for those reservoirs with <30% developed areas (Figure 4). Additionally, bSNE remained below 0.12 in all reservoirs throughout the study period, indicating changes in community composition between samplings. Shifts in taxa richness were documented across all twelve reservoirs between successive samplings.
The overall abundance of phytoplankton exhibited a notably high variability (0.169 × 10⁶ Lefkara to 823.366 × 10⁶ cells L−1 Mavrokolympos) both between the reservoirs and in the same reservoir. For example, in the Mavrokolympos Reservoir, total phytoplankton abundance ranged from 4.135 × 10⁶ cells L−1 in March 2017 to 472.924 × 10⁶ cells L−1 in June 2017 (Figure S2, Table S1).
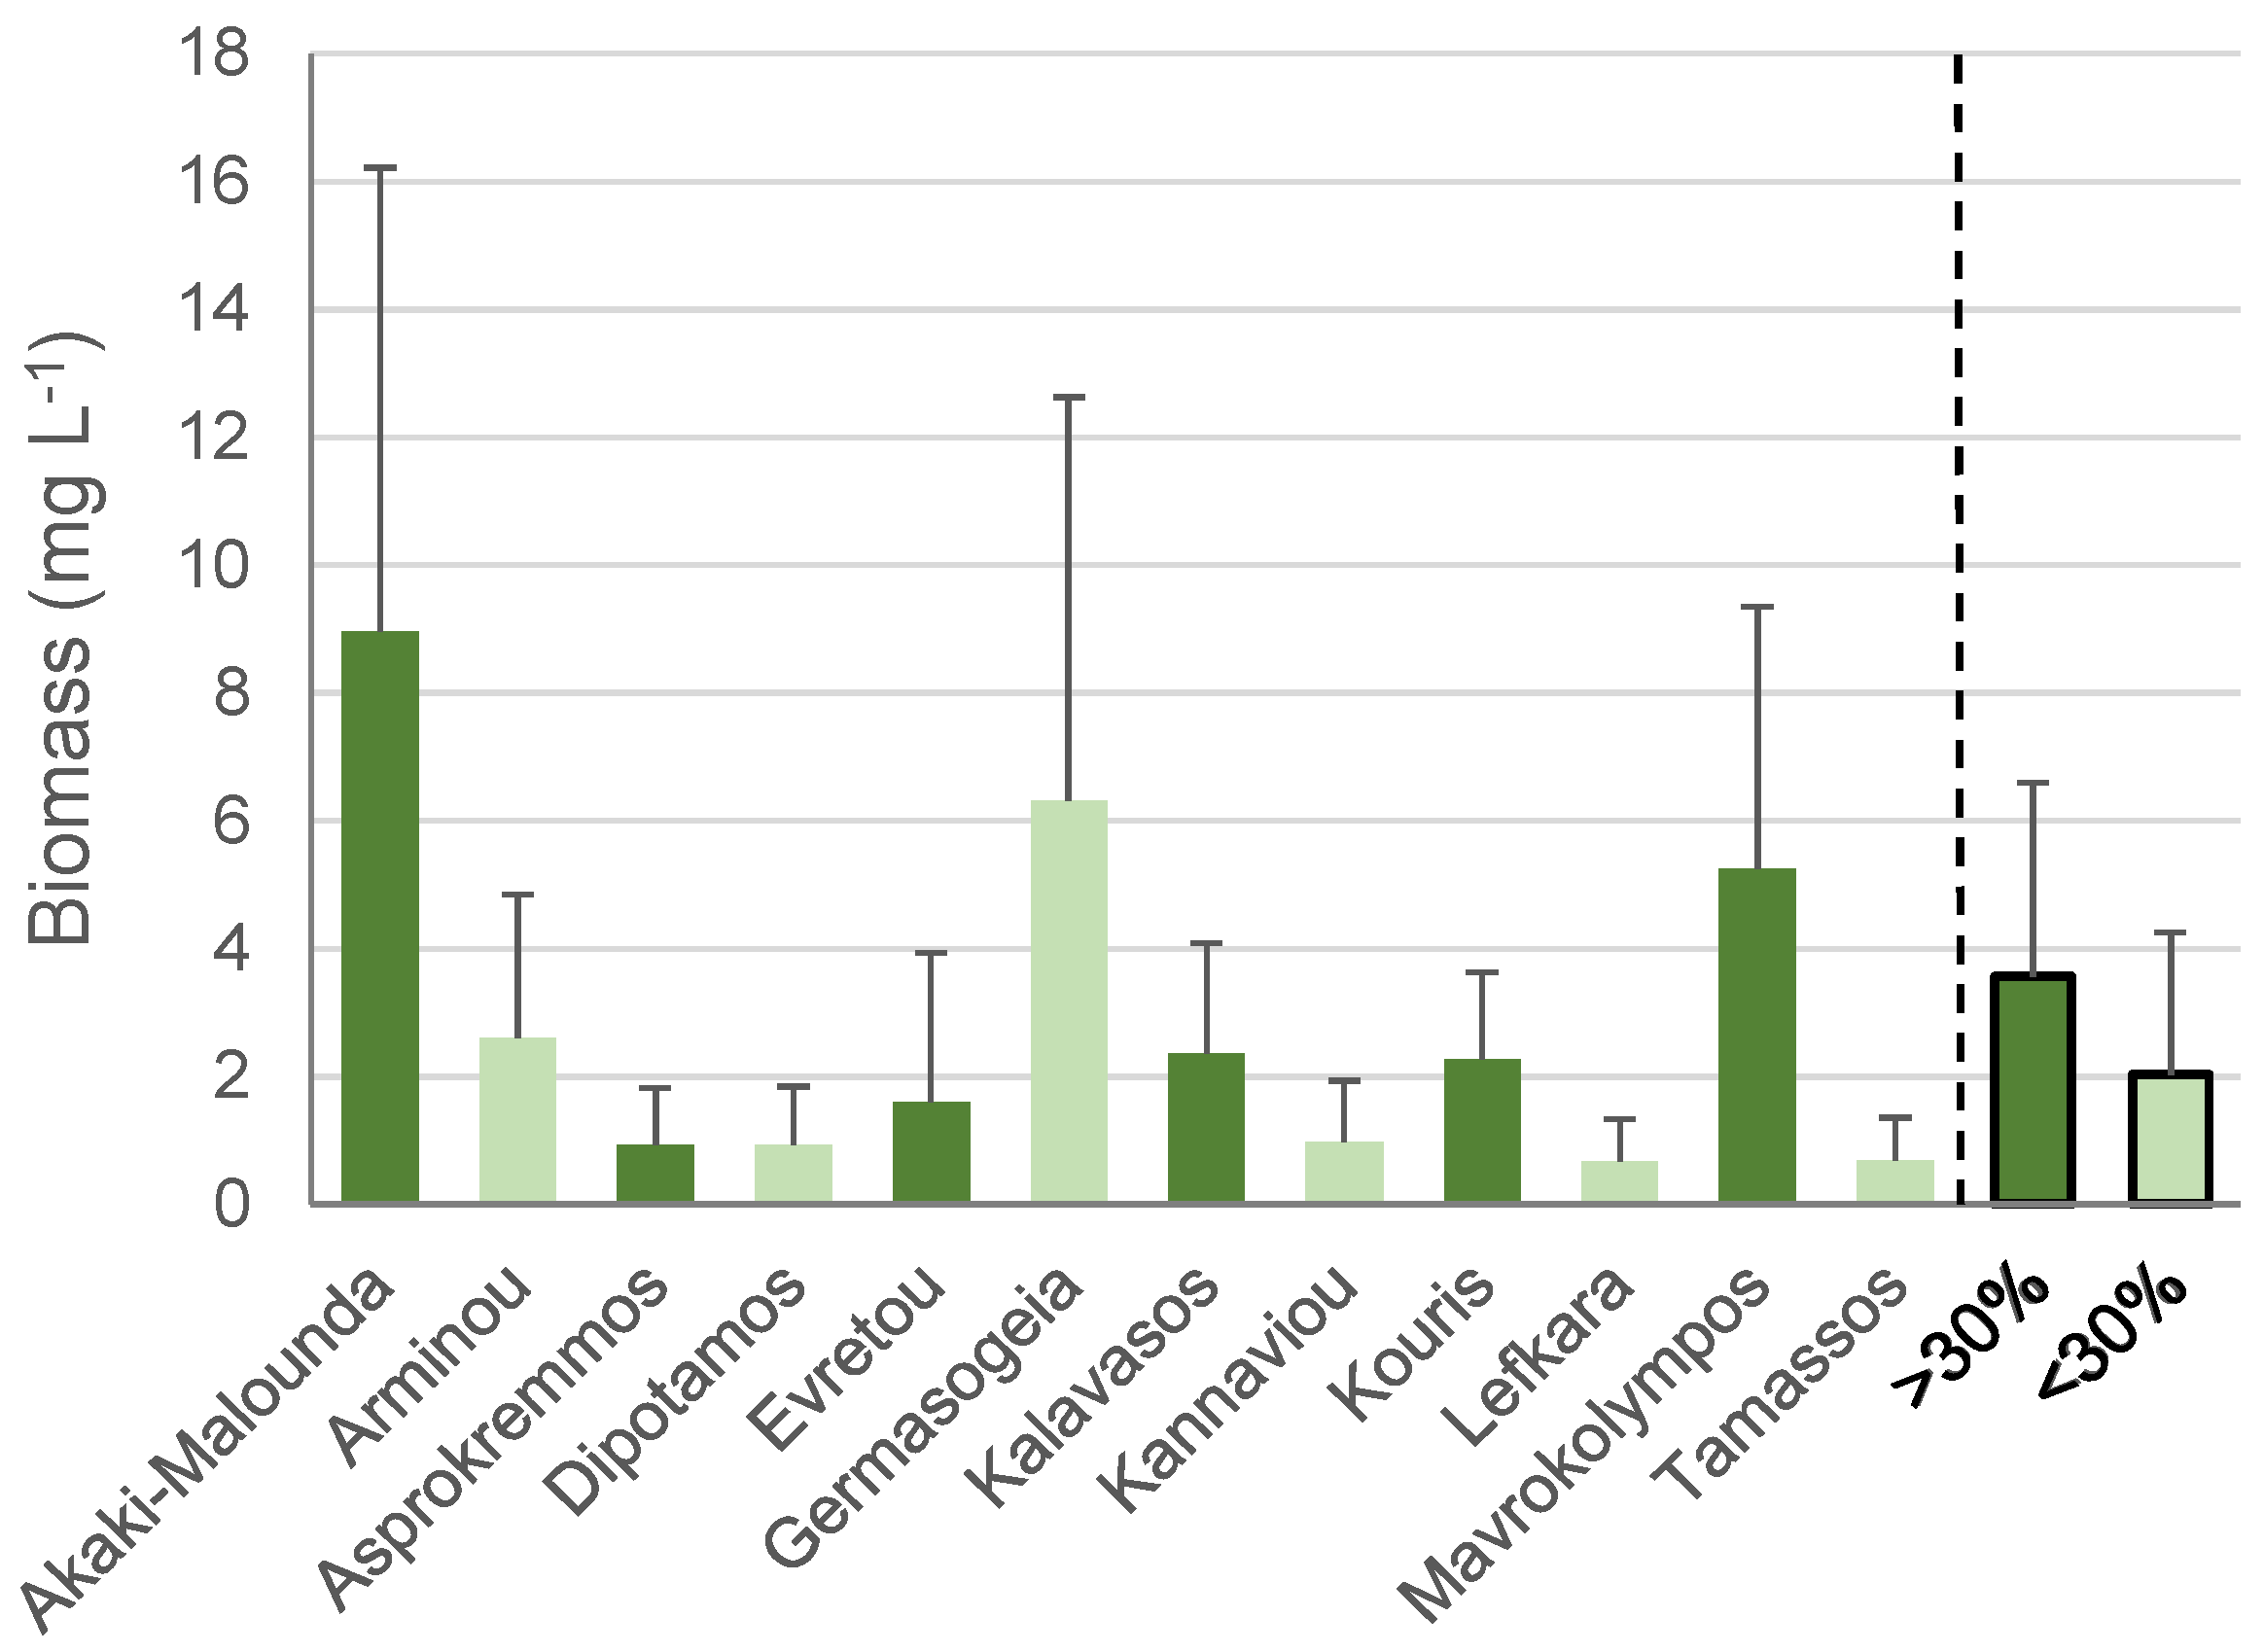
The average phytoplankton biomass was similar within reservoirs of the same land use category based on catchment development. In four out of six reservoirs with >30% developed areas (Akaki-Malounta, Kalavasos, Kouris, and Mavrokolympos), the average biomass exceeded 2 mg L−1. Notably, the biomass reached 5.2 mg L−1 in the Mavrokolympos Reservoir and 9.0 mg L−1 in the Akaki-Malounta Reservoir (Figure 5). In contrast, the average biomass in four out of six reservoirs (Dipotamos, Kannaviou, Lefkara, and Tamassos) with <30% developed areas remained lower than 1 mg L−1 (Figure 5), except for the Germasogeia Reservoir (6.3 mg L−1). Phytoplankton biomass varied considerably between different sampling dates in the reservoirs with the highest average biomass (Akaki-Malounta, Mavrokolympos, and Germasogeia), while it remained relatively low in the others (Table S1). Overall, reservoirs with >30% developed areas had slightly higher average biomass than those with <30% developed areas.
Total phytoplankton biomass was the only phytoplankton metric that showed a significant difference (Pone-way ANOVA = 0.05, F = 2.713) between reservoirs with >30% developed areas and those with <30% developed areas. In contrast, the differences in phytoplankton abundance (Pone-way ANOVA = 0.752, F = 0.125) and taxa richness (Pone-way ANOVA = 0.7725, F = 0.084) between the two reservoir groups were not statistically significant. Additionally, among the twenty land use categories examined, only one—discontinuous urban fabric areas (112)—was significantly positively associated with phytoplankton biomass (Table S2).

3.2. Water Level Fluctuations

Marked WLFs were observed across most reservoirs during the study period, primarily driven by anthropogenic water use, including drinking water demand and irrigation. The amplitude of water level variation ranged from 7.4 m in the Akaki-Malounta Reservoir to 19.0 m in the Kalavasos Reservoir, which exhibited the greatest fluctuation (Table 1). In the remaining reservoirs, water level changes ranged from 8.1 to 18.1 m (Table 1). Notably, abrupt changes in water levels were recorded over short timescales, particularly in smaller reservoirs. For instance, the Akaki-Malounta Reservoir experienced a 7.2 m increase in water level over an 18-day period, while the Arminou Reservoir recorded a 7.2 m water level decrease within just nine days.
High values of temporal bSIM were found to be correlated with WLFs according to the Spearman rank coefficient. Specifically, bSIM showed a moderate positive correlation with WLFs (Spearman coefficient = 0.543) for reservoirs with >30% developed areas and a weak positive correlation with WLFs (Spearman coefficient = 0.143) for reservoirs with <30% developed areas. However, the p-value was >0.05 in both cases, indicating that the correlation between the two variables was not statistically significant.
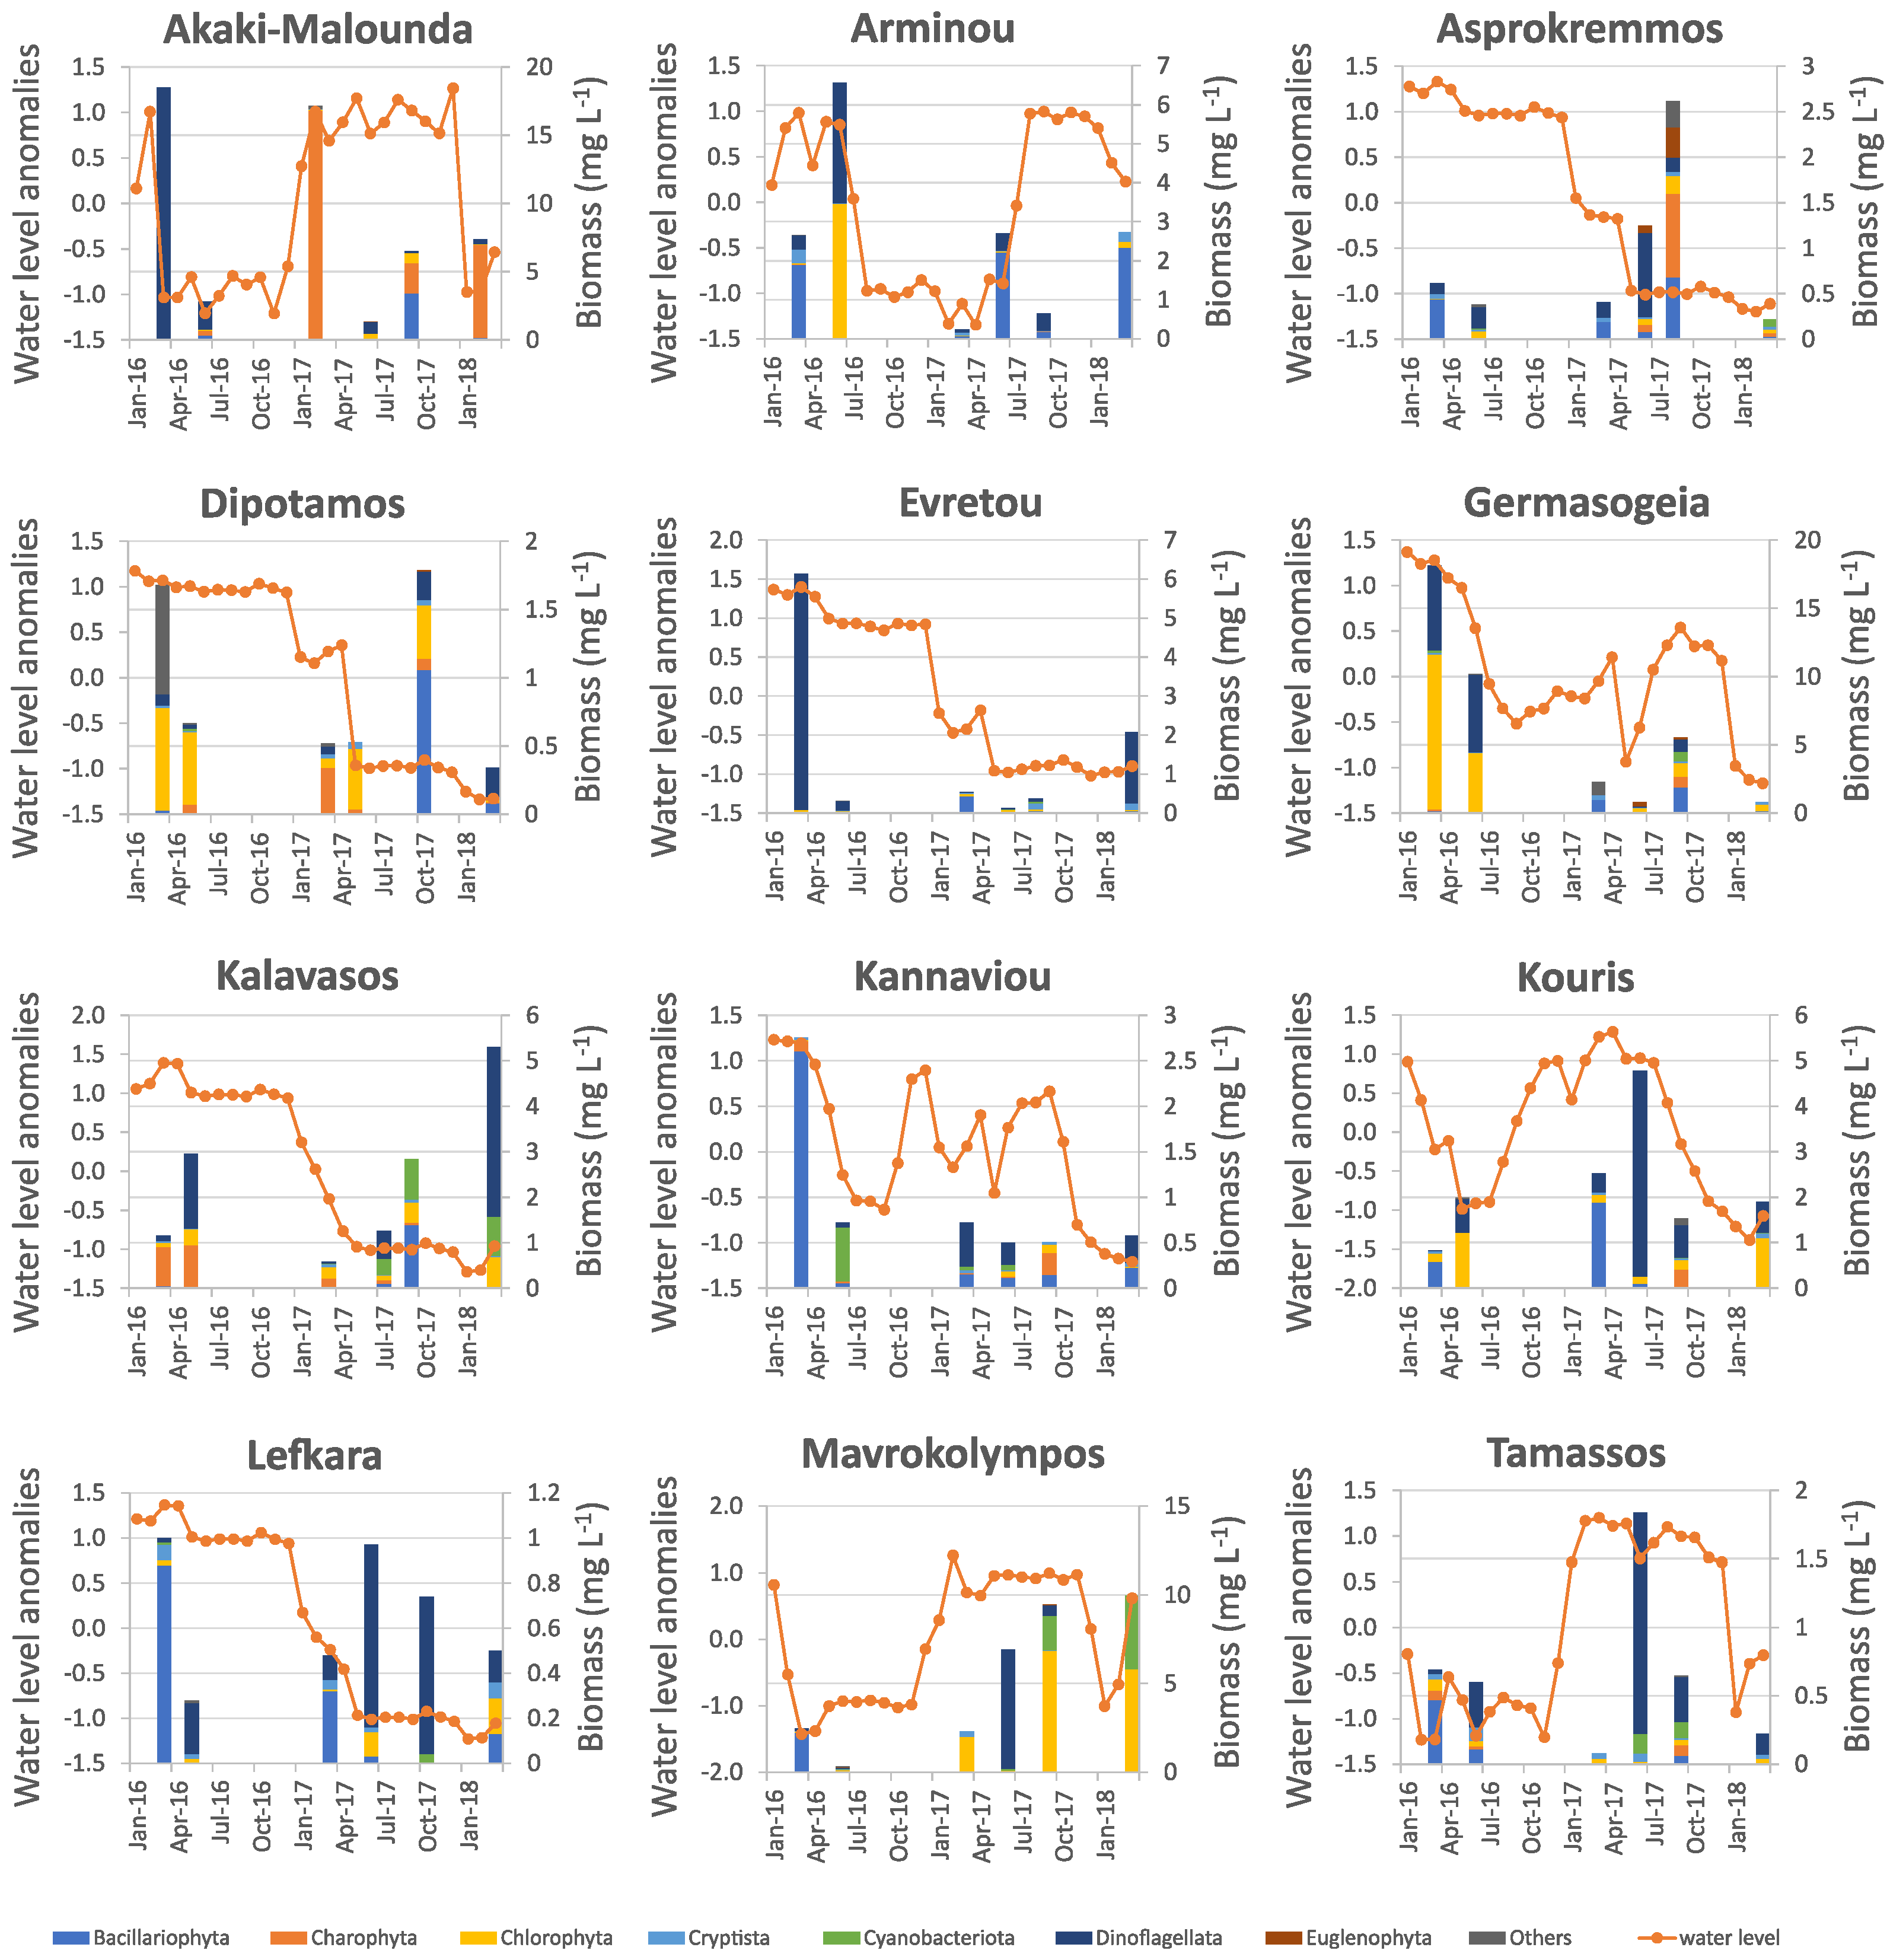
Regarding phytoplankton biomass, it ranged from 0.1 mg L−1 to 18.2 mg L−1 in the twelve reservoirs during the study period. The highest values were recorded in the Akaki-Malounta, Mavrokolympos, Germasogeia, and Kalavasos Reservoirs. Chlorophyta, Dinoflagellata, Bacillariophyta, and Charophyta were the main groups contributing to the highest biomass values in the majority of the reservoirs (Figure 6). The dinoflagellate Peridinium, the diatoms Aulacoseira granulata and Cyclotella, the chlorophytes Botryococcus braunii, Carteria, Coelastrum astroideum, Oocystis, and the charophytes Mougeotia and Cosmarium laeve were the representative dominants in the majority of the reservoirs, forming occasional blooms. Cyanobacteriota were found to dominate at times only in the Mavrokolympos and Kalavasos Reservoirs, represented by the bloom-forming species Aphanizomenon cf. gracile and Anabaena bergii, respectively (Table S3).
Reservoirs such as Akaki-Malounta, Mavrokolympos, Kouris, and Tamassos exhibited sharp increases in phytoplankton biomass, coinciding with periods of water level rises. In contrast, reservoirs like Lefkara, Asprokremmos, Kannaviou, and Dipotamos showed fluctuating but relatively low phytoplankton biomass throughout the study period. For example, Akaki-Malounta and Mavrokolympos exhibited pronounced peaks in biomass (Akaki-Malounta in the winter of 2016 and 2017 and Mavrokolympos in the autumn of 2017 and the winter of 2018), dominated by Dinoflagellata and Charophyta, and Chlorophyta and Cyanobacteria, respectively. Water level anomalies in some reservoirs (e.g., Germasogeia and Arminou) showed sharp fluctuations but without a consistent corresponding increase in biomass (Figure 6).
For the two groups of reservoirs, phytoplankton biomass variability showed contrasting, though non-significant, correlations with WLFs. In reservoirs with >30% developed areas, biomass variability was negatively correlated with WLFs (Spearman coefficient = −0.771, p = 11). In contrast, reservoirs with <30% developed areas exhibited a positive correlation with WLFs (Spearman coefficient = 0.657, p = 0.14).

3.3. Spatial Beta Diversity

Scatter plots comparing distance and nestedness for pairs of reservoirs within the same catchment land use group showed a weak negative correlation between the two variables. The Spearman coefficient indicates that nestedness was negatively related to distance in the group of reservoirs with >30% developed areas (Spearman coefficient = −0.691, p-value = 0.05, n = 8). In contrast, the correlation was non-significant but still negative for reservoirs with <30% developed areas (Spearman coefficient = −0.540, p-value = 0.17, n = 8). When calculating the Spearman coefficient for all pairs of reservoirs, a negative correlation between distance and nestedness was again observed (Spearman coefficient = −0.560, p-value = 0.02, n = 16). Polynomial regression analysis reveals slopes of −0.0008 for the group with >30% developed areas, −0.0006 for those with <30% developed areas, and −0.0007 for all reservoirs combined (p = 0.004, 0.167, and 0.00851, while R2 = 0.76, 0.29, and 0.40, respectively) (Figure 7). While exponential regression models with higher R2 values may offer a better fit, the negative correlation was stronger in the group of reservoirs with >30% developed areas compared to those with <30% developed areas and the overall group (R2 = 0.79, 0.54, and 0.53, respectively). Based on the exponential models, bSNE was found to decrease slightly as the distance between reservoirs increased.
The variation in phytoplankton biomass showed no significant correlation with distance in either group of reservoirs (Spearman coefficient = 0.547, p = 0.15 in >30% developed areas and Spearman coefficient = −0.252, p = 0.17 for reservoirs with <30% developed areas).

4. Discussion

Despite the importance of phytoplankton as primary producers and bioindicators of water quality and ecological stability, long-term and high-resolution data on their community structure and dynamics in Mediterranean reservoirs remain limited. These ecosystems are subject to strong seasonal variability, prolonged dry periods, and anthropogenic pressures that can significantly affect nutrient levels, light availability, and water residence time, which are all critical drivers of phytoplankton composition and productivity [53]. Basin land use plays a crucial role as a remote driver in influencing nutrient runoff, sediment input, and pollutant loads, all of which directly affect phytoplankton communities and water quality in Mediterranean reservoirs. Although data availability remains fragmented across countries and catchments, even limited phytoplankton records can help identify ecological thresholds, support the implementation of the WFD, and enhance predictive models for adaptive reservoir management [54]. In the present study, we aim to preliminarily explore the potential effect of catchment land use types, WLFs, and geographical distance on phytoplankton community structure in these water storage systems, using corresponding data from Cyprus reservoirs. Despite being limited in number and duration (six samplings during a two-year period), these data are critically important for assessing water quality, informing water management, and guiding operational decisions [55] in this “hot spot” area.

4.1. Land Use Types Influence on Phytoplankton Community

Over the past 50 years, land use in Cyprus has undergone remarkable changes, primarily characterized by urban expansion, agricultural intensification, and a decline in natural and semi-natural areas. According to CORINE Land Cover data, between 1990 and 2018, artificial surfaces increased markedly, particularly around major cities and coastal zones, while forested and scrubland areas declined due to urban development and infrastructure growth [56]. This typical trend for the Mediterranean area has important implications for hydrology, nutrient runoff, and the ecological health of freshwater systems, including reservoirs, since agricultural and urbanized catchments typically contribute higher nutrient loads, promoting eutrophication and potentially harmful algal blooms [57]. Yet, the majority of the studied reservoirs are located in catchments dominated by >55% of forest and semi-natural areas, with the exception of the catchment of the Mavrokolympos Reservoir (forest and semi-natural areas <23%). Thus, one would expect that since forested areas tend to mitigate nutrient input through natural filtration processes, eutrophication pressure on the studied reservoirs will be less prominent.
Given that Mediterranean freshwater systems are particularly sensitive to eutrophication, often exhibiting ecological responses at relatively low thresholds of agricultural and artificial land use in their catchments (i.e., ≥30%) [11], this study focused on phytoplankton biomass—the primary biological indicator of eutrophication—to assess the potential impacts of land use intensity. Notably, the mean phytoplankton biomass was elevated in those reservoirs with >30% developed areas in their catchment compared to those with <30%, which is consistent with previous studies indicating that phytoplankton biomass tends to increase in freshwater systems with extensive agricultural and artificial land uses (e.g., [58]). This increase in phytoplankton productivity is primarily due to elevated nutrient runoff from these land uses into surface waters [59]. Several studies have suggested that the expansion of agriculture and urbanization could exacerbate eutrophication and promote the dominance of harmful Cyanobacteria (e.g., [11]). This pattern was observed in the case of the Mavrokolympos Reservoir, where developed land comprises almost 70% of the catchment, and cyanobacteria were among the dominant phytoplankton taxa. The Germasogeia Reservoir represents an exception to the observed pattern, exhibiting relatively high mean phytoplankton biomass despite being situated within a catchment characterized by <30% developed land. This outlier may reflect localized nutrient inputs that could promote phytoplankton growth, possibly from urban runoff or wastewater inputs not captured in land use data. Additionally, Germasogeia has a relatively shallow morphology, which may also favor biomass accumulation. Further investigation would be needed to confirm these hypotheses. The correlation between discontinuous urban fabric land use and phytoplankton biomass in Cyprus reservoirs suggests that low- to medium-density urban development may exert considerable influence on freshwater productivity. Discontinuous urban areas, often characterized by scattered housing, roads, and small-scale infrastructure interspersed with green spaces, can contribute substantial nutrient loads through diffuse sources such as septic systems, garden runoff, and local agricultural practices [60]. Episodic rainfall—typical of Mediterranean settings—may amplify the mobilization of accumulated pollutants, enhancing nutrient delivery to reservoirs and promoting phytoplankton growth. These findings underscore the importance of accounting for semi-urbanized landscapes when assessing eutrophication risk, particularly in regions with high seasonal variability and water scarcity, such as Cyprus.
Although higher phytoplankton biomass was recorded in reservoirs with >30% agricultural and artificial land use in their catchments, no consistent correlation was found between land use composition and the phytoplankton community structure in terms of richness and diversity. This “lack of correlation” may reflect the fact that while nutrient inputs from agricultural and urbanized areas can enhance total biomass through eutrophication [13], they do not necessarily promote greater taxonomic diversity. In fact, elevated nutrient levels can often lead to competitive exclusion and dominance by a few fast-growing taxa, thereby reducing overall community diversity [61]. Furthermore, the hydrological regime of Cyprus reservoirs—characterized by fluctuating water levels, varying retention times, and water abstraction—can override or mask land use effects by imposing strong abiotic constraints on community assembly [62]. Additionally, internal processes such as sediment nutrient release, biotic interactions, and reservoir-specific management practices may exert greater control over phytoplankton composition than external land-derived inputs alone. Consequently, a certain phytoplankton community composition is typically the result of multiple causes, which often interact and are not always feasible to disentangle [11]. Thus, these findings highlight the complexity of trophic regulation in semi-arid systems and suggest that while land use is an important driver of nutrient loading, it may not directly predict phytoplankton diversity patterns in managed reservoir systems with variable hydrological conditions.

4.2. Water Level Fluctuations and Their Effects on Phytoplankton Community

Water reservoirs in Cyprus are subject to pronounced WLFs, primarily driven by semi-arid climatic conditions and anthropogenic water withdrawals for irrigation and domestic use [63,64]. These fluctuations can substantially disturb seasonal ecological dynamics, particularly affecting the succession and stability of phytoplankton communities [65]. Several studies have underpinned the abrupt changes that phytoplankton communities experience due to substantial water flushing and WLFs [66,67,68]. In our study, we observed substantial WLFs in all twelve reservoirs, often over short timescales, creating highly dynamic aquatic conditions. These disturbances are known to alter key environmental variables, such as light availability, nutrient distribution, and mixing regimes, all of which influence phytoplankton growth and the community structure [69].
In Mediterranean and arid-region reservoirs, such as Cyprus’ reservoirs, WLFs are not only frequent but also highly irregular and pulsed, driven by intense seasonal precipitation and extended dry periods [70]. This pulsed hydrological regime creates abrupt changes in nutrient loading, light penetration, and stratification, which can favor fast-growing phytoplankton species and increase community turnover. Unlike temperate systems, where hydrological patterns are more predictable, the abrupt and large-scale WLFs characteristic of Mediterranean reservoirs create both ecological stress and windows of opportunity, which can lead to rapid and frequent shifts in dominant phytoplankton taxa, especially during intense flushing or refilling episodes [71]. Thus, the frequent and unpredictable changes in phytoplankton species over time in the reservoirs are made even more intense because of the unique WLFs typical in Mediterranean climates.
High species turnover rates recorded across the study period reflect this instability, with marked shifts in community composition even between consecutive samplings. Such temporal heterogeneity is indicative of a system where only ecologically flexible or opportunistic species can persist and dominate [65]. Indeed, the taxa dominating the reservoirs during our study—such as the dinoflagellate Peridinium, the diatoms Cyclotella and Aulacoseira granulata, the chlorophytes Botryococcus braunii, Carteria, Coelastrum, and Oocystis, and the charophytes Mougeotia and Cosmarium—are known for their ability to tolerate fluctuating environmental conditions. Peridinium species are motile dinoflagellates capable of vertical migration, allowing them to optimize their position in the water column in response to light and nutrient gradients—a distinct advantage in stratified or rapidly mixing systems [72]. Similarly, Aulacoseira granulata is a large, heavily silicified diatom that thrives in turbid and mixed waters, often following disturbances that resuspend benthic nutrients [73,74]. Cyclotella species, on the other hand, are typically small-celled centric diatoms associated with oligotrophic to mesotrophic conditions and are tolerant of variable light and nutrient regimes [75,76,77]. The dominant chlorophytes Botryococcus braunii and Oocystis spp. are often favored in nutrient-rich, fluctuating habitats and can form colonies that resist grazing and sedimentation. Carteria, a motile green alga, and Coelastrum, which forms coenobia, also exhibit ecological strategies suited to environments with shifting conditions [78]. Finally, the charophytes Mougeotia and Cosmarium, often associated with less eutrophic waters, may appear opportunistically in periods of reduced nutrient stress or following flushing events that temporarily reset nutrient loads [79]. The dominance of these taxa highlights the influence of WLFs as a major ecological driver in Cyprus’ reservoirs, favoring resilient and opportunistic species adapted to sudden and frequent environmental disturbances. These findings align with previous studies suggesting that Mediterranean reservoirs, due to their climatic and hydrological variability, often support highly dynamic phytoplankton communities with low temporal stability [67,68,80].
WLFs were also highly variable among reservoirs, ranging from modest (~7 m) to extreme (~19 m). These fluctuations, particularly when abrupt, as seen in Akaki-Malounta and Arminou, may impose significant stress on aquatic biota, especially in smaller systems where short-term level shifts can translate into rapid environmental changes [81]. Although temporal beta diversity of phytoplankton showed a positive correlation with the amplitude of WLFs—more pronounced in catchments with >30% developed land—these correlations were not statistically significant. Despite the lack of statistical significance, the observed trend may indicate a biological response to hydrological instability in more urbanized or agricultural catchments, where nutrient enrichment and intensified water management are more pronounced [82]. These patterns imply that land use could influence how phytoplankton communities respond to water level fluctuations, potentially affecting the rate of species turnover over time.
Phytoplankton biomass varied widely across reservoirs, with notable peaks occurring in systems like Akaki-Malounta, Germasogeia, Kalavasos, and Mavrokolympos. In these cases, biomass increases often coincided with water level rises, possibly reflecting nutrient pulse events or improved light/nutrient conditions due to enhanced vertical mixing that favor phytoplankton growth [83]. Interestingly, in some reservoirs, such as Asprokremmos, Dipotamos, and Lefkara, phytoplankton biomass remained consistently low despite occasional WLF events, suggesting that other factors—such as light limitation, grazing pressure, or lower nutrient availability (associated catchments with <30% coverage of developed land)—may buffer or suppress phytoplankton responses in those systems. Additionally, the lack of a statistically significant correlation between WLFs and phytoplankton biomass, particularly in reservoirs with high land use intensity, could be attributed to the short duration of the study and limited sampling frequency, which may not adequately capture the temporal lag between hydrological changes and biological responses [84]. Consequently, long-term datasets including varied hydro-climatological conditions are essential for a deeper understanding of reservoir behavior. However, the lack of correlation does not mean there is no causation in ecosystems such as these, where nonlinearity may also exist [85].
Overall, the findings underscore the complexity of interactions between hydrology, land use, and biological communities in Mediterranean reservoirs. While the observed trends support previous studies showing the role of water level changes in shaping phytoplankton dynamics [86], the absence of strong statistical relationships also highlights the need for higher-resolution, long-term datasets to disentangle the multiple, interacting drivers of eutrophication and community composition in these vulnerable systems.

4.3. Geographical Distance and Its Influence on Phytoplankton Community Composition

Traditionally, geographical distance has been considered an important factor in structuring microbial communities, often through the framework of distance–decay relationships, which describe a decrease in community similarity with increasing spatial separation [87,88]. However, numerous studies investigating microbial biogeography, particularly of phytoplankton, have reported inconsistent or weak distance–decay patterns [89,90]. In our study, we observed only a weak effect of geographical distance on phytoplankton community composition across the twelve reservoirs. Although a slight decrease in nestedness with increasing pairwise reservoir distance was detected, this pattern was not strong, suggesting that spatial separation plays a minor role in shaping community structure.
Our findings instead imply that local environmental filtering significantly influences phytoplankton community assembly in these freshwater systems. This is in line with evidence from other aquatic ecosystems where environmental heterogeneity—such as nutrient concentrations, hydrology, and light availability—has been shown to outweigh the effects of spatial factors [36,91]. For example, studies on Tibetan Plateau lakes [91] and Mediterranean reservoirs [90] identified environmental variables as the primary drivers of community turnover, with spatial processes playing only a secondary role. This pattern is consistent with metacommunity theory, which predicts that at small spatial scales and in regions with low dispersal limitation—such as a single island ecosystem like Cyprus—environmental filtering can override spatial dynamics in shaping community structure [33]. Our results, showing pronounced differences in phytoplankton communities among geographically close reservoirs, highlight the importance of contemporary environmental conditions in shaping local assemblages.
Chlorophyta emerged as the most species-rich phytoplankton group, a finding consistent with observations from a wide range of lentic systems [29,32,92]. Their dominance may be attributed to their high ecological plasticity and dispersal capability traits, which enable rapid colonization of new habitats and confer resilience under fluctuating environmental conditions [72,93,94]. This adaptability is key to their distribution, allowing them to overcome natural dispersal barriers, even over large geographical distances. Furthermore, the dominant phytoplankton species possess traits that allow them to thrive in environments with rapid water flushing and WLFs, often leading to the succession of smaller-sized and fast-growing species (e.g., [63]).

5. Conclusions

This study aimed to examine the potential combined effects of catchment land use types, WLFs, and geographical distance on phytoplankton community dynamics in twelve reservoirs across Cyprus, using data from a two-year monitoring period. Regarding the effect of land use patterns and coverage in the associated catchments, higher phytoplankton biomass was recorded in the reservoirs located in catchments with developed areas (e.g., agricultural and urban) covering >30% of their total area. However, no spatially predictable occurrence pattern was found regarding this remote driver of phytoplankton composition, suggesting that other factors, such as rapid WLFs or water residence time, may play a more crucial role in shaping community structure. Notably, phytoplankton biomass maxima were recorded in the majority of the reservoirs during the periods of high water levels. Although no strong association was found between the pronounced water level changes in the studied reservoirs and the encountered phytoplankton community composition during the study period, the high temporal variation in species distribution suggests a dynamic environment strongly influenced by hydrological fluctuations. Moreover, no correlation was found between geographical distance and the distribution of phytoplankton species in the studied reservoirs, implying that the effect of local environmental factors (e.g., water level changes) might be more important. As water basins around the world face continuous changes regarding land use, hydrology, and climate, the ability to adapt to changing water demands will depend, at least partly, on the effective management of reservoir systems. Given the sensitivity of Mediterranean reservoirs to climatic and hydrological fluctuations—often considered “hot spots” of climate change—there is an imperative demand for more detailed studies investigating phytoplankton responses to environmental gradients (e.g., land use and water level fluctuations) in regions such as Cyprus. Although the dataset used is preliminary and may not fully capture the complexity of phytoplankton dynamics in the studied reservoirs, it provides a valuable baseline for hypothesis generation, informs future in-depth monitoring, and supports the development of targeted management strategies. For example, prioritizing gradual water level changes during biologically sensitive periods may help reduce community instability and mitigate bloom events. A better understanding of reservoir-specific hydrological thresholds, informed by long-term monitoring, will be critical for effectively implementing such recommendations. Ultimately, expanding these datasets through coordinated, basin-wide monitoring initiatives would significantly improve our understanding of phytoplankton dynamics and their role in ecosystem functioning under changing climatic and hydrological conditions in this “hot spot” region.

Supplementary Materials

The following supporting information can be downloaded at: https://www.mdpi.com/article/10.3390/d17070457/s1, Figure S1: Phytoplankton spatial beta diversity during the study period, in the reservoirs with >30% developed areas and in those with <30% developed areas; Figure S2: Variation in mean phytoplankton cell abundance (log10-transformed scale) during the study period, in reservoirs with >30% developed areas and in those with <30% developed areas. Due to the wide range in phytoplankton abundance (up to three orders of magnitude), data were log10-transformed prior to visualization; Table S1: Species number, total cell abundance, and total biomass measurements per sample; Table S2: Statistics of generalized linear regression model. The only significant relationship (F significance < 0.05) between land use types and phytoplankton biomass is shown in bold; Table S3: List of the dominant and bloom-forming recorded phytoplankton taxa in the twelve studied Cyprus reservoirs. Solid black circles show in which reservoir they dominated.

Author Contributions

Conceptualization, P.P. and D.E.R.; methodology, P.P. and M.K.; software, P.P. and N.S.; validation, M.K., S.G., M.M.-G., A.E.-A. and D.E.R.; formal analysis, P.P. and M.K.; investigation, P.P.; resources, G.D. and M.M.-G.; data curation, P.P., M.K., S.G. and N.S.; writing—original draft, P.P.; writing—review and editing, all authors.; visualization, P.P., N.S., S.G. and M.K.; supervision, D.E.R., M.M.-G. and A.E.-A.; project administration, G.D. and D.E.R. All authors have read and agreed to the published version of the manuscript.

Funding

This research received no external funding. Data were provided by the Hydrometry Division of the Water Development Department (WDD), Ministry of Agriculture, Rural Development and Environment of Cyprus.

Institutional Review Board Statement

Not applicable.

Data Availability Statement

Data is contained within the article or Supplementary Materials.

Acknowledgments

We extend our sincere gratitude to the Hydrometry Division (WDD) for their invaluable contribution to reservoir monitoring, as a part of the implementation of the WFD 2000/60/EC in Cyprus, as well as for giving us permission to use the associated data for this study. Special thanks go to Daniel B. Danielidis(†), Department of Biology, National and Kapodistrian University of Athens, who initially supervised this research. We are also deeply grateful to Charalambos Demetriou(†), Hydrometry Division (WDD), for his crucial support and dedication to reservoir monitoring efforts. Finally, the authors thank the reviewers for their constructive feedback, which significantly improved the quality of this manuscript.

Conflicts of Interest

The authors declare no conflicts of interest. Matina Katsiapi is employed by Thessaloniki Water Supply & Sewerage Co. S.A., previously associated with Aristotle University of Thessaloniki.

References

  1. Sommer, U. Life Forms of Aquatic Organisms. In Freshwater and Marine Ecology; Springer International Publishing: Cham, Switzerland, 2024; pp. 53–113. [Google Scholar]
  2. Soininen, J.; Korhonen, J.J.; Karhu, J.; Vetterli, A. Disentangling the spatial patterns in community composition of prokaryotic and eukaryotic lake plankton. Limnol. Oceanogr. 2011, 56, 508–520. [Google Scholar] [CrossRef]
  3. Heino, J.; Alahuhta, J.; Bini, L.M.; Cai, Y.; Heiskanen, A.S.; Hellsten, S.; Kortelainen, P.; Kotamäki, N.; Tolonen, K.T.; Vihervaara, P.; et al. Lakes in the era of global change: Moving beyond single-lake thinking in maintaining biodiversity and ecosystem services. Biol. Rev. 2021, 96, 89–106. [Google Scholar] [CrossRef] [PubMed]
  4. Moustaka-Gouni, M.; Sommer, U. Effects of Harmful Blooms of Large-Sized and Colonial Cyanobacteria on Aquatic Food Webs. Water 2020, 12, 1587. [Google Scholar] [CrossRef]
  5. Paerl, H.W.; Fulton, R.S.; Moisander, P.H.; Dyble, J. Harmful freshwater algal blooms, with an emphasis on cyanobacteria. Sci. World J. 2001, 1, 76. [Google Scholar] [CrossRef]
  6. European Commission. Directive 2000/60/EC of the European Parliament and of the Council Establishing a Framework for Community Action in the Field of Water Policy; European Commission: Brussels, Belgium, 2000. [Google Scholar]
  7. Katsiapi, M.; Moustaka-Gouni, M.; Sommer, U. Assessing ecological water quality of freshwaters: PhyCoI—A new phytoplankton community Index. Ecol. Inform. 2016, 31, 22–29. [Google Scholar] [CrossRef]
  8. Carney, E. Relative influence of lake age and watershed land use on trophic state and water quality of artificial lakes in Kansas. Lake Reserv. Manag. 2009, 25, 199–207. [Google Scholar] [CrossRef]
  9. Liu, W.; Zhang, Q.; Liu, G. Effects of watershed land use and lake morphometry on the trophic state of Chinese lakes: Implications for eutrophication control. Clean-Soil Air Water 2011, 39, 35–42. [Google Scholar] [CrossRef]
  10. Zhu, Y.; Gao, J.; Zhao, H.; Deng, S.; Lin, M.; Wang, N.; Liu, M.; Hu, S.; Luo, L. Land Use Impact on Water Quality and Phytoplankton Community Structure in Danjiangkou Reservoir. Diversity 2024, 16, 275. [Google Scholar] [CrossRef]
  11. Katsiapi, M.; Mazaris, A.D.; Charalampous, E.; Moustaka-Gouni, M. Watershed land use types as drivers of freshwater phytoplankton structure. In Phytoplankton Responses to Human Impacts at Different Scales, Developments in Hydrobiology; Springer: Dordrecht, The Netherlands, 2012; Volume 221, pp. 121–131. [Google Scholar] [CrossRef]
  12. Carpenter, S.R.; Stanley, E.H.; Vander Zanden, M.J. State of the world’s freshwater ecosystems: Physical, chemical, and biological changes. Annu. Rev. Environ. Resour. 2011, 36, 75–99. [Google Scholar] [CrossRef]
  13. Carpenter, S.R.; Caraco, N.F.; Correll, D.L.; Howarth, R.W.; Sharpley, A.N.; Smith, V.H. Nonpoint pollution of surface waters with phosphorus and nitrogen. Ecol. Appl. 1998, 8, 559–568. [Google Scholar] [CrossRef]
  14. Soranno, P.A.; Cheruvelil, K.S.; Wagner, T.; Webster, K.E.; Bremigan, M.T. Effects of land use on lake nutrients: The importance of scale, hydrologic connectivity, and region. PLoS ONE 2015, 10, e0135454. [Google Scholar] [CrossRef] [PubMed]
  15. Zhang, Z.; Gao, J.; Cai, Y. The direct and indirect effects of land use and water quality on phytoplankton communities in an agriculture-dominated basin. Environ. Monit. Assess. 2020, 192, 760. [Google Scholar] [CrossRef] [PubMed]
  16. Borics, G.; Nagy, L.; Miron, S.; Grigorszky, I.; László-Nagy, Z.; Lukács, B.A.; Toth, L.G.; Várbíró, G. Which factors affect phytoplankton biomass in shallow eutrophic lakes? Hydrobiologia 2013, 714, 93–104. [Google Scholar] [CrossRef]
  17. Kakouei, K.; Kraemer, B.M.; Anneville, O.; Carvalho, L.; Feuchtmayr, H.; Graham, J.L.; Higgins, S.; Pomati, F.; Rudstam, L.G.; Stockwell, J.D.; et al. Phytoplankton and cyanobacteria abundances in mid-21st century lakes depend strongly on future land use and climate projections. Glob. Change Biol. 2021, 27, 6409–6422. [Google Scholar] [CrossRef]
  18. Burns, C.W.; Galbraith, L.M. Relating planktonic microbial food web structure in lentic freshwater ecosystems to water quality and land use. J. Plankton Res. 2007, 29, 127–139. [Google Scholar] [CrossRef]
  19. Wang, L.; Cai, Q.; Xu, Y.; Kong, L.; Tan, L.; Zhang, M. Weekly dynamics of phytoplankton functional groups under high water level fluctuations in a subtropical reservoir-bay. Aquat. Ecol. 2011, 45, 197–212. [Google Scholar] [CrossRef]
  20. Li, J.; Yang, W.; Li, W.; Mu, L.; Jin, Z. Coupled hydrodynamic and water quality simulation of algal bloom in the Three Gorges Reservoir, China. Ecol. Eng. 2018, 119, 97–108. [Google Scholar] [CrossRef]
  21. Znachor, P.; Nedoma, J.; Hejzlar, J.; Seďa, J.; Komárková, J.; Kolář, V.; Mrkvička, T.; Boukal, D.S. Changing environmental conditions underpin long-term patterns of phytoplankton in a freshwater reservoir. Sci. Total Environ. 2020, 710, 135626. [Google Scholar] [CrossRef]
  22. Jeppesen, E.; Brucet, S.; Naselli-Flores, L.; Papastergiadou, E.; Stefanidis, K.; Noges, T.; Noges, P.; Attayde, J.L.; Zohary, T.; Coppens, J.; et al. Ecological impacts of global warming and water abstraction on lakes and reservoirs due to changes in water level and related changes in salinity. Hydrobiologia 2015, 750, 201–227. [Google Scholar] [CrossRef]
  23. Qian, K.; Liu, X.; Chen, Y. Effects of water level fluctuation on phytoplankton succession in Poyang Lake, China-a five year study. Ecohydrol. Hydrobiol. 2016, 16, 175–184. [Google Scholar] [CrossRef]
  24. Paerl, H.W.; Huisman, J. Climate change: A catalyst for global expansion of harmful cyanobacterial blooms. Environ. Microbiol. Rep. 2009, 1, 27–37. [Google Scholar] [CrossRef] [PubMed]
  25. Katsiapi, M.; Moustaka, M.; Michaloudi, E.; Kormas, A.K. Phytoplankton and water quality in a Mediterranean drinking-water reservoir (Marathonas Reservoir, Greece). Environ. Monit. Assess. 2011, 185, 563–575. [Google Scholar] [CrossRef] [PubMed]
  26. Li, Q.; Xiao, J.; Ou, T.; Han, M.; Wang, J.; Chen, J.; Li, Y.; Salmaso, N. Impact of water level fluctuations on the development of phytoplankton in a large subtropical reservoir: Implications for the management of cyanobacteria. Environ. Sci. Pollut. Res. 2018, 25, 1306–1318. [Google Scholar] [CrossRef]
  27. Allende, L.; Tell, G.; Zagarese, H.; Torremorell, A.; Pérez, G.; Bustingorry, J.; Escaray, R.; Izaguirre, I. Phytoplankton and primary production in clear-vegetated, inorganic-turbid, and algal-turbid shallow lakes from the pampa plain (Argentina). Hydrobiologia 2009, 624, 45–60. [Google Scholar] [CrossRef]
  28. Anderson, M.J.; Crist, T.O.; Chase, J.M.; Vellend, M.; Inouye, B.D.; Freestone, A.L.; Sanders, N.J.; Cornell, H.V.; Comita, L.S.; Davies, K.F.; et al. Navigating the multiple meanings of β diversity: A roadmap for the practicing ecologist. Ecol. Lett. 2011, 14, 19–28. [Google Scholar] [CrossRef]
  29. Mazaris, A.D.; Moustaka-Gouni, M.; Michaloudi, E.; Bobori, D.C. Biogeographical patterns of freshwater micro-and macroorganisms: A comparison between phytoplankton, zooplankton and fish in the eastern Mediterranean. J. Biogeogr. 2010, 37, 1341–1351. [Google Scholar] [CrossRef]
  30. Zhang, J.; Zhang, B.; Liu, Y.; Guo, Y.; Shi, P.; Wei, G. Distinct large-scale biogeographic patterns of fungal communities in bulk soil and soybean rhizosphere in China. Sci. Total Environ. 2018, 644, 791–800. [Google Scholar] [CrossRef]
  31. Chen, W.; Ren, K.; Isabwe, A.; Chen, H.; Liu, M.; Yang, J. Stochastic processes shape microeukaryotic community assembly in a subtropical river across wet and dry seasons. Microbiome 2019, 7, 138. [Google Scholar]
  32. Jin, L.; Chen, H.; Xue, Y.; Soininen, J.; Yang, J. The scale-dependence of spatial distribution of reservoir plankton communities in subtropical and tropical China. Sci. Total Environ. 2022, 845, 157179. [Google Scholar] [CrossRef]
  33. Leibold, M.A.; Holyoak, M.; Mouquet, N.; Amarasekare, P.; Chase, J.M.; Hoopes, M.F.; Holt, R.D.; Shurin, J.B.; Law, R.; Tilman, D.; et al. The metacommunity concept: A framework for multi-scale community ecology. Ecol. Lett. 2004, 7, 601–613. [Google Scholar] [CrossRef]
  34. Chang, C.; Gao, L.; Wei, J.; Ma, N.; He, Q.; Pan, B.; Li, M. Spatial and environmental factors contributing to phytoplankton biogeography and biodiversity in mountain ponds across a large geographic area. Aquat. Ecol. 2021, 55, 721–735. [Google Scholar] [CrossRef]
  35. Baselga, A.; Gómez-Rodríguez, C. Assessing the equilibrium between assemblage composition and climate: A directional distance-decay approach. J. Anim. Ecol. 2021, 90, 1906–1918. [Google Scholar] [CrossRef] [PubMed]
  36. Soininen, J.; McDonald, R.; Hillebrand, H. The distance decay of similarity in ecological communities. Ecography 2007, 30, 3–12. [Google Scholar] [CrossRef]
  37. Turley, L.; Bréthaut, C.; Pflieger, G. Institutions for reoperating reservoirs in semi-arid regions facing climate change and competing societal water demands: Insights from Colorado. Water Int. 2021, 47, 30–54. [Google Scholar] [CrossRef]
  38. Kuzma, S.; Saccoccia, L.; Chertock, M. 25 Countries, Housing One-Quarter of the Population, Face Extremely High-Water Stress; World Resources Institute: Washington, DC, USA, 2023. [Google Scholar]
  39. Ma, S.; Kassinos, S.C.; Fatta Kassinos, D.; Akylas, E. Effects of selective water withdrawal schemes on thermal stratification in Kouris Dam in Cyprus. Lakes Reserv. Res. Manag. 2008, 13, 51–61. [Google Scholar] [CrossRef]
  40. Papadaskalopoulou, C.; Giannakopoulos, C.; Lemesios, G.; Zachariou-Dodou, M.; Loizidou, M. Challenges for water resources and their management in light of climate change: The case of Cyprus. Desalination Water Treat. 2015, 53, 3224–3233. [Google Scholar] [CrossRef]
  41. De, H.C.; Catalan, J.; Dörflinger, G.; Ferreira, J.; Kemitzoglou, D.; Laplace-Treyture, C.; Pahissa, L.J.; Marchetto, A.; Mihail, O.; Morabito, G.; et al. Water Framework Directive Intercalibration Technical Report: Mediterranean Lake Phytoplankton Ecological Assessment Methods; Publications Office of the European Union: Luxembourg, 2014; p. 70. [Google Scholar]
  42. Polykarpou, P.; Katsiapi, M.; Genitsaris, S.; Stefanidou, N.; Dörflinger, G.; Moustaka-Gouni, M.; Economou-Amilli, A.; Raitsos, D.E. Phytoplankton Diversity and Blooms in Ephemeral Saline Lakes of Cyprus. Diversity 2023, 15, 1204. [Google Scholar] [CrossRef]
  43. Hadjimitsis, D.G.; Hadjimitsis, M.G.; Clayton, C.; Clarke, B.A. Determination of turbidity in Kourris Dam in Cyprus utilizing Landsat TM remotely sensed data. Water Resour. Manag. 2006, 20, 449–465. [Google Scholar] [CrossRef]
  44. Hadjimitsis, D.G.; Clayton, C. Assessment of temporal variations of water quality in inland water bodies using atmospheric corrected satellite remotely sensed image data. Environ. Monit. Assess. 2009, 159, 281–292. [Google Scholar] [CrossRef]
  45. Council of the European Commission. Council directive 92/43/EEC of 21 May 1992 on the conservation of natural habitats and of wild fauna and flora. Off. J. Eur. Communities Bruss. 1992, 206, 7–49. [Google Scholar]
  46. European Environmental Agency. Corine Land Cover Technical Quide; Addendum; European Environmental Agency: Copenhagen, Denmark, 2000. [Google Scholar]
  47. CEN 15204; Water Quality. Guidance Standard on the Enumeration of Phytoplankton Using Inverted Microscopy (Utermöhl Technique). European Committee for Standardization, Management Centre: Brussels, Belgium, 2006.
  48. CEN/EN 16695; Water Quality—Guidance on the Estimation of Microalgal Biovolume. European Committee for Standardization, Management Centre: Brussels, Belgium, 2015.
  49. Utermöhl, H. Zur vervollkommnung der quantitativen phytoplankton-methodik: Mit 1 Tabelle und 15 abbildungen im Text und auf 1 Tafel. Int. Ver. Für Theor. Und Angew. Limnol. Mitteilungen 1958, 9, 1–38. [Google Scholar] [CrossRef]
  50. Tromboni, F.; Dodds, W. Relationships Between Land Use and Stream Nutrient Concentrations in a Highly Urbanized Tropical Region of Brazil: Thresholds and Riparian Zones. Environ. Manag. 2017, 60, 30–40. [Google Scholar] [CrossRef] [PubMed]
  51. R Core Team. R: A Language and Environment for Statistical Computing; R Foundation for Statistical Computing: Vienna, Austria, 2021. [Google Scholar]
  52. Baselga, A. Partitioning the turnover and nestedness components of beta diversity. Glob. Ecol. Biogeogr. 2010, 19, 134–143. [Google Scholar] [CrossRef]
  53. Gallardo-Mayenco, A.; Guerrero, F.; Toja, J. Environmental factors and phytoplankton composition in Mediterranean reservoirs. Limnetica 2009, 28, 35–46. [Google Scholar]
  54. Borics, G.; Wolfram, G.; Chiriac, G.; Belkinova, D.; Donabaum, K. Intercalibration of the National Classifications of Ecological Status for Eastern Continental Lakes: Biological Quality Element: Phytoplankton; Poikane, S., Ed.; Publications Office of the European Union: Luxembourg, 2018; ISBN 978-92-79-92972-4. EUR 29338 EN; JRC112693. [Google Scholar] [CrossRef]
  55. Romero, F.; Ruiz, M.; Gálvez-Cloutier, R. Impacts of drought on phytoplankton dynamics in Mediterranean reservoirs. Ecol. Indic. 2018, 85, 759–768. [Google Scholar] [CrossRef]
  56. European Environment Agency (EEA). Corine Land Cover (CLC) 1990, 2000, 2006, 2012, 2018 Datasets. 2020. Available online: https://land.copernicus.eu/pan-european/corine-land-cover (accessed on 20 January 2025).
  57. Pulido-Villena, E.; Reche, I.; Morales-Baquero, R. Significance of atmospheric inputs of phosphorus and nitrogen to Mediterranean lakes. Limnol. Oceanogr. 2006, 51, 830–837. [Google Scholar]
  58. Qu, Y.; Wu, N.; Guse, B.; Fohrer, N. Distinct indicators of land use and hydrology characterize different aspects of riverine phytoplankton communities. Sci. Total Environ. 2022, 851, 158209. [Google Scholar] [CrossRef]
  59. Fraterrigo, J.M.; Downing, J.A. The influence of land use on lake nutrients varies with watershed transport capacity. Ecosystems 2008, 11, 1021–1034. [Google Scholar] [CrossRef]
  60. Tong, S.T.Y.; Chen, W.; Susanna, T.Y. Modeling the relationship between land use and surface water quality. J. Environ. Manag. 2002, 66, 377–393. [Google Scholar] [CrossRef]
  61. Smith, V.H.; Tilman, G.D.; Nekola, J.C. Eutrophication: Impacts of excess nutrient inputs on freshwater, marine, and terrestrial ecosystems. Environ. Pollut. 1999, 100, 179–196. [Google Scholar] [CrossRef] [PubMed]
  62. Moreno-Ostos, E.; Cruz-Pizarro, L.; Basanta, A.; George, D.G. The influence of wind-induced mixing on the horizontal distribution of phytoplankton in a Mediterranean lake. Freshw. Biol. 2008, 53, 435–447. [Google Scholar]
  63. Moustaka-Gouni, M. Phytoplankton succession and diversity in a warm monomictic, relatively shallow lake: Lake Volvi, Macedonia, Greece. Hydrobiologia 1993, 249, 33–42. [Google Scholar] [CrossRef]
  64. Albay, M.; Akçaalan, R. Factors influencing the phytoplankton steady state assemblages in a drinking-water reservoir (Ömerli reservoir, Istanbul). In Phytoplankton and Equilibrium Concept: The Ecology of Steady-State Assemblages, Proceedings of the 13th Workshop of the International Association of Phytoplankton Taxonomy and Ecology (IAP), Castelbuono, Italy, 1–8 September 2002; Springer: Dordrecht, The Netherlands, 2003; pp. 85–95. [Google Scholar]
  65. Santos, J.B.; Silva, L.H.; Branco, C.W.; Huszar, V.L. The roles of environmental conditions and geographical distances on the species turnover of the whole phytoplankton and zooplankton communities and their subsets in tropical reservoirs. Hydrobiologia 2016, 764, 171–186. [Google Scholar] [CrossRef]
  66. Harris, G.P.; Baxter, G. Interannual variability in phytoplankton biomass and species composition in a subtropical reservoir. Freshw. Biol. 1996, 35, 545–560. [Google Scholar] [CrossRef]
  67. Moustaka-Gouni, M.; Vardaka, E.; Michaloudi, E.; Kormas, K.A.; Tryfon, E.; Mihalatou, H.; Gkelis, S.; Lanaras, T. Plankton food web structure in a eutrophic polymictic lake with a history of toxic cyanobacterial blooms. Limnol. Oceanogr. 2006, 51, 715–727. [Google Scholar] [CrossRef]
  68. Chen, L.; Ge, L.; Wang, D.; Zhong, W.; Zhan, T.; Deng, A. Multi-objective water-sediment optimal operation of cascade reservoirs in the Yellow River Basin. J. Hydrol. 2022, 609, 127744. [Google Scholar] [CrossRef]
  69. Liao, N.; Zhang, L.; Chen, M.; Li, J.; Wang, H. The influence mechanism of water level operation on algal blooms in canyon reservoirs and bloom prevention. Sci. Total Environ. 2024, 912, 169377. [Google Scholar] [CrossRef]
  70. Sabater, S. Alterations of the global water cycle and their effects on river structure, function and services. Freshw. Rev. 2008, 1, 75–89. [Google Scholar] [CrossRef]
  71. Zohary, T.; Ostrovsky, I. Ecological impacts of excessive water level fluctuations in stratified freshwater lakes. Inland Waters 2011, 1, 47–59. [Google Scholar] [CrossRef]
  72. Reynolds, C.S. The Ecology of Phytoplankton; Cambridge University Press: Cambridge, UK, 2006. [Google Scholar] [CrossRef]
  73. Padisák, J.; Reynolds, C.S.; Sommer, U. Intermediate Disturbance Hypothesis in Phytoplankton Ecology; Developments in Hydrobiology 81; Kluwer Academic Publishers: Dordrecht, The Netherlands, 1993; Reprinted from Hydrobiologia 249. [Google Scholar]
  74. Dokulil, M.T.; Teubner, K. Cyanobacterial dominance in lakes. Hydrobiologia 2000, 438, 1–12. [Google Scholar] [CrossRef]
  75. Sommer, U. Comparison between steady state and non-steady state competition: Experiments with natural phytoplankton. Limnol. Oceanogr. 1985, 30, 335–346. [Google Scholar] [CrossRef]
  76. Reynolds, C.S.; Huszar, V.; Kruk, C.; Naselli-Flores, L.; Melo, S. Towards a functional classification of the freshwater phytoplankton. J. Plankton Res. 2002, 24, 417–428. [Google Scholar] [CrossRef]
  77. Krammer, K.; Lange-Bertalot, H. Bacillariophyceae, Teil 3. Siisswasserjlora von Mitteleuropu, Band 2; Gustav Fischer Verlag: Stuttgart, Germany; New York, NY, USA, 1991. [Google Scholar]
  78. Wehr, J.D.; Sheath, R.G. Freshwater Algae of North America: Ecology and Classification; Academic Press: San Diego, CA, USA, 2003. [Google Scholar]
  79. Brook, A.J. The Biology of Desmids; Blackwell Scientific Publications: Boston, MA, USA, 1981. [Google Scholar]
  80. Fowler, J.; Cohen, L.; Jarvis, P. Practical Statistics for Field Biology; John Wiley & Sons: New York, NJ, USA, 1998. [Google Scholar]
  81. Naselli-Flores, L.; Barone, R. Fight on plankton! Or, phytoplankton shape and size between nutrient supply and hydrodynamic forces. Hydrobiologia 2011, 668, 19–26. [Google Scholar]
  82. Romero, J.R.; Antenucci, J.P.; Imberger, J. The effects of lake morphology on the stratification and mixing of reservoirs in Mediterranean climates. Limnetica 2016, 35, 233–250. [Google Scholar]
  83. Jeppesen, E.; Kronvang, B.; Meerhoff, M.; Søndergaard, M.; Hansen, K.M.; Andersen, H.E.; Lauridsen, T.L.; Liboriussen, L.; Beklioglu, M.; Özen, A.; et al. Climate change effects on runoff, catchment phosphorus loading and lake ecological state, and potential adaptations. J. Environ. Qual. 2009, 38, 1930–1941. [Google Scholar] [CrossRef]
  84. Gallardo, B.; García, M.; Cabezas, A.; González, E.; González, M.; Ciancarelli, C.; Comín, F.A. Macroinvertebrate patterns along environmental gradients and hydrological connectivity within a regulated river-floodplain. Aquat. Sci. 2008, 70, 248–258. [Google Scholar] [CrossRef]
  85. Sugihara, G.; May, R.; Ye, H.; Hsieh, C.; Deyle, E.; Fogarty, M.; Munch, A. Detecting Causality in Complex Ecosystems. Science 2012, 338, 496–500. [Google Scholar] [CrossRef]
  86. Naselli-Flores, L. Phytoplankton assemblages in twenty-one Sicilian reservoirs: Relationships between species composition and environmental factors. In The Trophic Spectrum Revisited; Developments in Hydrobiology; Reynolds, C.S., Dokulil, M., Padisák, J., Eds.; Springer: Dordrecht, The Netherlands, 2000; Volume 150. [Google Scholar] [CrossRef]
  87. Horner-Devine, M.; Lage, M.; Hughes, J.B.; Bohannan, B.J.M. A taxa–area relationship for bacteria. Nature 2004, 432, 750–753. [Google Scholar] [CrossRef]
  88. Bell, T. Experimental tests of the bacterial distance–decay relationship. ISME J. 2010, 4, 1357–1365. [Google Scholar] [CrossRef]
  89. Martiny, J.B.; Bohannan, B.J.; Brown, J.H.; Colwell, R.K.; Fuhrman, J.A.; Green, J.L.; Horner-Devine, M.C.; Kane, M.; Krumins, J.A.; Kuske, C.R.; et al. Microbial biogeography: Putting microorganisms on the map. Nat. Rev. Microbiol. 2006, 4, 102–112. [Google Scholar] [CrossRef] [PubMed]
  90. Zorzal-Almeida, S.; Bini, L.M.; Bicudo, D.C. Beta diversity of diatoms is driven by environmental heterogeneity, spatial extent and productivity. Hydrobiologia 2017, 800, 7–16. [Google Scholar] [CrossRef]
  91. Yang, Y.; Hu, R.; Lin, Q.; Hou, J.; Liu, Y.; Han, B.P.; Naselli-Flores, L. Spatial structure and β-diversity of phytoplankton in Tibetan Plateau lakes: Nestedness or replacement? Hydrobiologia 2018, 808, 301–314. [Google Scholar] [CrossRef]
  92. Katsiapi, M.; Moustaka-Gouni, M.; Vardaka, E.; Kormas, K.A. Different phytoplankton descriptors show asynchronous changes in a shallow urban lake (L. Kastoria, Greece) after sewage diversion. Fundam. Appl. Limnol. 2013, 182, 219–230. [Google Scholar] [CrossRef]
  93. Chrisostomou, A.; Moustaka-Gouni, M.; Sgardelis, S.; Lanaras, T. Air-dispersed phytoplankton in a Mediterranean river-reservoir system (Aliakmon-Polyphytos, Greece). J. Plankton Res. 2009, 31, 877–884. [Google Scholar] [CrossRef]
  94. Genitsaris, S.; Moustaka-Gouni, M.; Kormas, K.A. Airborne microeukaryote colonists in experimental water containers: Diversity, succession, life histories and established food webs. Aquat. Microb. Ecol. 2011, 62, 139–152. [Google Scholar] [CrossRef]
Figure 1. The location of the twelve studied reservoirs (in black) and their catchment areas (in white) in Cyprus: Akaki-Malounta, Arminou, Asprokremmos, Dipotamos, Evretou, Germasogeia, Kalavasos, Kannaviou, Kouris, Lefkara, Mavrokolympos, and Tamassos. The catchments areas were provided by the WDD.
Diversity 17 00457 g001
Figure 2. The spatial distribution of land use coverage in the catchments of the studied reservoirs in Cyprus. (a) The percentage of land use coverage (%) within the respective reservoir catchments. (b) Corine 2018 land data coverage for the catchments of the twelve reservoirs under investigation (Corine Land Cover Codes 112: discontinuous urban fabric, 121: industrial or commercial units, 131: mineral extraction sites, 142: sport and leisure facilities, 211: non-irrigated arable land, 212: permanently irrigated land, 221: vineyards, 222: fruit trees and berry plantations, 223: olive groves, 241: annual crops associated with permanent crops, 242: complex cultivation patterns, 243: land principally occupied by agriculture, with significant areas of natural vegetation, 311: broad-leaved forest, 312: coniferous forest, 313: mixed forest, 321: natural grasslands, 323: sclerophyllous vegetation, 324: transitional woodland–shrub, 331: beaches, dunes, and sands, 333: sparsely vegetated areas, 334: burnt areas, and 512: water bodies).
Diversity 17 00457 g002
Figure 3. The number of phytoplankton taxa and associated taxonomic groups recorded in the twelve Cyprus studied reservoirs. Reservoirs with >30% developed areas are shown on the left side of the vertical dotted line, while those with <30% are on the right side.
Diversity 17 00457 g003
Figure 4. Temporal turnover across the twelve studied reservoirs in Cyprus from March 2016 to March 2018, highlighting reservoirs with >30% developed areas (indicated by dark green) and those with <30% developed areas (indicated by light green).
Diversity 17 00457 g004
Figure 5. A comparison of average phytoplankton biomass (mg L−1) from March 2016 to March 2018 across the twelve studied Cyprus reservoirs. Reservoirs with >30% developed areas are shown in dark green, while those with <30% developed areas are shown in a light green color. The two bars at the far right, highlighted with bold black borders, represent the average for each group of reservoirs. Error bars indicate the standard deviation.
Diversity 17 00457 g005
Figure 6. Temporal dynamics of phytoplankton biomass and community composition in studied Cyprus reservoirs from January 2016 to January 2018, shown alongside water level anomalies (z-scores). Phytoplankton biomass (mg L−1) is presented as stacked bars, differentiated by major taxonomic groups, while orange lines represent standardized water level anomalies.
Diversity 17 00457 g006
Figure 7. The scatter plots of distance (km) between the studied Cyprus reservoirs versus their nestedness (index value) in (a) the group of reservoirs with >30% developed areas (n = 8), (b) the group of reservoirs with <30% developed areas (n = 8), and (c) all reservoirs (n = 16). Reservoirs with >30% developed areas are represented with dark green, while those with <30% developed areas are shown in light green. The curve represents the exponential equation fitted to the data points.
Diversity 17 00457 g007
Table 1. The morphometric and topographic features of the studied Cyprus reservoirs (*: drinking water reservoirs, ▲: protected areas, WA:LA = watershed area/lake area). The morphometric datasets were provided by the WDD or calculated using CORINE Land Cover 2018 for Cyprus.
ReservoirAltitude (m a.s.l.)Latitude (N)Longitude (E)Surface Area (LA) (km2)Catchment Area (WA) (km2)WA:LAMax Depth, Approx. (m)Max Storage Capacity (million m3)Max. Water Level Fluctuation (m)
Akaki-Malounta *▲37035.0333.170.33842552227.4
Arminou *▲40434.8832.740.4212028232414.1
Asprokremmos *▲3734.7332.562.6322485415218.1
Dipotamos *▲13534.8533.361.197965391613.7
Evretou ▲10334.9732.470.979193632410.0
Germasogeia *▲5534.7533.091.18163138271416.1
Kalavasos *12634.8033.260.8097121501719.0
Kannaviou *▲37034.9332.590.985556611812.4
Kouris *▲15634.7332.923.06304998711517.9
Lefkara *▲29734.8933.290.673857591413.9
Mavrokolympos ▲8134.8632.410.253815131212.8
Tamassos *38435.0233.250.32461452138.1
Disclaimer/Publisher’s Note: The statements, opinions and data contained in all publications are solely those of the individual author(s) and contributor(s) and not of MDPI and/or the editor(s). MDPI and/or the editor(s) disclaim responsibility for any injury to people or property resulting from any ideas, methods, instructions or products referred to in the content.