Article

Effects of Temperature on Competition Between Toxic and Non-Toxic Raphidiopsis raciborskii and Cylindrospermopsin Production

Department of Ecology, Jinan University, Guangzhou 510632, China
*
Author to whom correspondence should be addressed.
Diversity 2025, 17(7), 450; https://doi.org/10.3390/d17070450
Submission received: 27 May 2025 / Revised: 19 June 2025 / Accepted: 22 June 2025 / Published: 25 June 2025
(This article belongs to the Special Issue Diversity and Ecology of Freshwater Plankton)

Abstract

Toxic and non-toxic strains of Raphidiopsis raciborskii coexist widely in natural water bodies, with the dominance of toxic strains directly influencing bloom toxicity. This study investigates how temperature affects the relative dominance of toxic R. raciborskii strains and the production of cylindrospermopsin (CYN). We conducted monoculture and co-culture experiments in nutrient-rich BG11 medium at three temperatures (16 °C, 24 °C, and 32 °C) using two pairs of strains (CS506/CS510 from Australia and QDH7/N8 from China). The results revealed that the Australian strains failed to grow at 16 °C, while the Chinese strains thrived. In a co-culture experiment, the Australian toxic strain CS506 exhibited the fastest growth at 24 °C, whereas the Chinese toxic strain QDH7 reached similar maximum cell densities across all temperatures but peaked more quickly at 24 °C and 32 °C compared to 16 °C. Regardless of temperature and strain pairs, toxic strains consistently maintained a higher relative abundance than their non-toxic counterparts. Analysis using the rate of competitive displacement (RCD) model indicated that higher temperatures accelerated the displacement of non-toxic strains by toxic ones. Total CYN concentrations in co-cultures increased with temperature, although the cell quota of CYN (QCYN) did not vary significantly across temperatures. In co-culture, the CYN production rate during the exponential phase was positively correlated with cell growth rate, but this correlation weakened or reversed in the stationary phase, likely due to changes in nutrient availability. These findings suggest that rising temperatures under eutrophic conditions may enhance the growth and competitive advantage of toxic R. raciborskii strains, thereby exacerbating bloom toxicity.

Graphical Abstract

1. Introduction

Raphidiopsis raciborskii (formerly Cylindrospermopsis raciborskii) is a filamentous, nitrogen-fixing freshwater cyanobacterium, originally characterized as a tropical species. However, in recent decades, this organism has exhibited a strong tendency to expand its distribution into subtropical and temperate regions [1,2,3]. R. raciborskii is also known for its ability to produce various cyanotoxins, with cylindrospermopsin (CYN), a guanidine alkaloid, being the most commonly reported [4]. Studies have shown that exposure to CYN rapidly increased intracellular reactive oxygen species (ROS) production and led to a range of toxic effects, including cytotoxicity, genotoxicity, immunotoxicity, and neurotoxicity, posing a significant threat to human and animal health [2,5]. The first recorded intoxication event caused by R. raciborskii occurred in 1979 on Palm Island, Australia, where 148 individuals were affected, exhibiting symptoms such as anorexia, vomiting, and hepatomegaly [6]. The World Health Organization (WHO) officially recommended a guideline value of 0.7 µg L−1 for CYN in drinking water, underscoring the importance of understanding the regulation of CYN production in toxic R. raciborskii strains [5].
Due to the rapid expansion of R. raciborskii around the world, extensive studies have focused on its adaptation mechanisms and invasion strategies [2,3]. R. raciborskii exhibits remarkable adaptability to a wide range of temperatures and light intensities, which may result in its global existence in tropical, subtropical, and temperate regions [7]. This cyanobacteria is able to utilize diverse nitrogen sources, including ammonia, nitrate, urea, and atmospheric N2, making it a nitrogen generalist. Among these, nitrogen fixation allows R. raciborskii to convert atmospheric N2 into bioavailable forms. This ability is an important mechanism enabling it to outcompete non-N2-fixing species under nitrogen-limited conditions [8]. However, nitrogen fixation is a highly energy-consuming process [9], and many studies have shown that the nitrogen obtained through nitrogen fixation is often insufficient to support the development of cyanobacterial blooms [10,11]. Otherwise, R. raciborskii exhibits a high uptake affinity for dissolved inorganic phosphorus and a strong capacity for phosphorus storage, giving it an ecological advantage under low phosphorus conditions [2,12]. Although these studies have profoundly elucidated the adaptation of R. raciborskii to fluctuating environments, they have rarely distinguished between toxic and non-toxic strains [12,13,14,15,16]. In natural water bodies, toxic and non-toxic strains of the same cyanobacterial species often coexist, and the relative abundance and toxin production of toxic genotypes are critical determinants of bloom toxicity [17,18].
Extensive research on Microcystis has revealed that the relative dominance of toxic versus non-toxic genotypes was influenced by environmental factors such as temperature, light, nitrogen and phosphorus availability, and CO2 concentrations [17,19,20,21,22,23,24,25]. However, inconsistencies often arise across these observations. For example, in the Yanghe Reservoir of China and Lake Erie in the United States, the abundance of toxic Microcystis and microcystin (MC) concentrations exhibited a significant positive correlation with total phosphorus. However, no such correlation has been observed in Lake Taihu (China) and Lake Mikata (Japan), where nitrogen sources (nitrate or ammonium) have been found to strongly influence the seasonal dynamics of toxic Microcystis [23,24,25]. These discrepancies underscore the need for further investigation into how environmental factors shape the dominance of toxic cyanobacteria.
For R. raciborskii, only a few studies have examined the population dynamics of toxic and non-toxic genotypes [26,27,28,29,30]. Two field studies in several Australian freshwater bodies found an obvious shift from toxic R. raciborskii dominance during the early bloom phase to non-toxic strains at the end of the bloom, a pattern attributed to nutrient availability [26,27]. Subsequent mesocosm experiments in North Pine Reservoir confirmed that the addition of phosphorus promoted the dominance of the toxic genotype within the R. raciborskii population [28]. Our recent study, combining field investigation with competition experiments, further demonstrated that nitrogen and phosphorus availability modulate the relative dominance of toxic versus non-toxic R. raciborskii strains and CYN production [30]. Despite this, how environmental factors such as nitrogen, phosphorus, and temperature regulate the relative dominance of toxic and non-toxic genotypes remains poorly understood.
Temperature is a crucial factor influencing phytoplankton growth, metabolism, and community structure [31]. Many bloom-forming cyanobacteria reach their maximal growth rates at relatively high temperatures, typically above 25 °C [31,32,33]. Global warming is expected to promote the proliferation of cyanobacteria, increasing both the frequency and intensity of cyanobacterial blooms [31,33]. As a species of tropical origin, R. raciborskii is expected to benefit more from rising temperatures driven by climate change [34]. However, little is known about how its toxic and non-toxic genotypes respond to temperature changes. Studies on Microcystis have shown that elevated temperatures favor toxic strains and enhance microcystin (MC) synthesis [20,22,35,36,37]. Similarly, our recent observations from southern Chinese reservoirs suggest that the proportion of toxic R. raciborskii increases with rising water temperature [38].
Therefore, we hypothesized that rising temperature may promote the dominance of the CYN-producing genotype within R. raciborskii populations and enhance CYN production. Co-culture experiments using isolated toxic and non-toxic strains provide a useful framework for elucidating the mechanisms driving genotype succession [30,35,39]. To test this hypothesis, we conducted monoculture and co-culture experiments under different temperatures, using toxic and non-toxic R. raciborskii strains isolated from China and Australia, respectively. We analyzed the influence of temperature on the dominance of CYN-producing strains by applying the rate of competitive displacement (RCD) model and performing linear regression analysis between cell growth rate (μC) and toxin production rate (μTOX). This study aims to provide new insights into how future climate warming may alter the toxicity of R. raciborskii blooms.

2. Materials and Methods

2.1. Raphidiopsis raciborskii Strains and Culture Conditions

Two CYN-producing strains (R. raciborskii CS506 and QDH7) and two non-CYN-producing strains (R. raciborskii CS510 and N8) were used in monoculture and co-culture experiments. As previously described [30], CS506 and CS510 were from Australia, and QDH7 and N8 were isolated from reservoirs in Guangdong, southern China. These R. raciborskii strains were non-axenic, and regular microscopic inspection was used to confirm low bacterial contamination [40]. The strains were maintained in BG11 medium (pH 7.4) [40] at 25 °C with a light intensity of 35 µmol/m2·s under a 12 h:12 h light–dark cycle. The illumination was supplied with cool white, fluorescent tubes, and light intensities were measured using a QSL2101 Scalar PAR Irradiance Sensor (Biospherical Instruments Inc., San Diego, CA, USA).

2.2. Monoculture Experiments

The four R. raciborskii strains were cultivated to the late exponential growth phase and then harvested by centrifugation at 4500 rpm for 10 min. Each strain was then diluted to 105 cells/mL using the BG11 medium. A 30 mL aliquot of resuspended cells was transferred into a 50 mL capped test tube (25 mm × 150 mm), and each treatment was performed in triplicate. The cells were incubated at 16 °C (low temperature, LT), 24 °C (moderate temperature, MT), and 32 °C (high temperature, HT), with a light intensity of 35 µmol/m2·s and a 16:8 h light–dark cycle. Tubes were gently shaken twice daily. As previously described [30], chlorophyll-a (Chl.a) concentrations were measured daily using a TD-700 laboratory fluorometer (Turner Designs, San Jose, CA, USA). The specific growth rates (µ, d−1) during the exponential growth phase were calculated according to the following equation [28]:
μ = (lnX2 − lnX1)/(t2 − t1),
where X1 and X2 represent the biomass of R. raciborskii (measured as Chl.a concentration (μg/L) at time points t1 and t2, respectively.

2.3. Co-Culture Experiments

We conducted co-culture experiments to investigate the dynamics between toxic and non-toxic R. raciborskii strains under nutrient-replete conditions (N = 247 mg/L, P = 7.14 mg/L) at three temperatures, that is, 16 °C (LT), 24 °C (MT), and 32 °C (HT). Two pairs of strains from Australia (CS506/CS510) and China (QDH7/N8) were used in the experiments.
Cell concentrations of four Raphidiopsis raciborskii strains were counted using a Sedgwick-Rafter chamber (Hausser Scientific, Horsham, PA, USA) under an Olympus microscope (Olympus Corporation, Tokyo, Japan) at 400× magnification. Prior to counting, the samples were allowed to settle to ensure even distribution of filaments at the bottom of the chamber. Toxic (CS506 or QDH7) and non-toxic (CS510 or N8) strains were inoculated at a cell ratio of 1:1 in 500 mL Pyrex Erlenmeyer flasks containing 400 mL of BG11 medium. The 400 mL volume was used to ensure sufficient sample availability. To maintain adequate gas exchange, the flasks were gently shaken twice daily. Each treatment was conducted in triplicate. Cultures were incubated in an illuminated incubator under the same light intensity and light/dark cycle conditions as the monoculture experiments. Samples (5–10 mL) were collected every 3–4 days, and cell mixtures were filtered using a 0.45 μm pore-size filter membrane for subsequent DNA extraction. Additionally, 1 mL of culture was collected for CYN concentration measurement. All samples were immediately frozen at −20 °C for subsequent analysis.

2.4. DNA Extraction and Real-Time PCR

Total DNA was extracted from filtered R. raciborskii cells during the co-culture experiment using a DNeasy Plant Mini Kit (Magen Biotechnology Co., Ltd, Hangzhou, China). Filter membranes were dissected into small pieces, and 800 μL of lysis buffer from the kit was added. Cell disruption was performed using a FastPrep 24-5G cell disrupter (MP Biomedicals, Irvine, CA, USA), followed by DNA extraction according to the manufacturer’s instructions. The extracted DNA was stored at −20 °C until use.
Quantification of total and CYN-producing R. raciborskii was performed using quantitative real-time PCR (qPCR) as established by Lei et al. (2019) [41]. Specific primers and probes (Table 1) targeting the rpoC1 gene (RNA polymerase β′ subunit 1) and cyrJ gene (a component of the CYN synthetase gene cluster) were employed. The standard curves were generated from linear regression between the cycle threshold (CT) values and the logarithmic gene copy numbers. The abundances of total and CYN-producing R. raciborskii were calculated according to the linear equation derived from the standard curves. The abundance of non-CYN-producing R. raciborskii was calculated by subtracting cyrJ gene copies from rpoC1 gene copies. The proportion of CYN-producing cells was calculated as (cyrJ/rpoC1) × 100.
Real-time PCR reactions were performed in 20 μL volumes containing 10 μL PCR reaction solution, 0.5 μL (10 pmol) of each primer, 0.5 μL (10 pmol) of each TaqMan probe, 2 μL DNA template, and 5 μL Milli-Q water. Quantitative real-time PCR was performed using the AGS4800 system (Hangzhou An Yu Technologies Co., Ltd., Hangzhou, China). Each sample was prepared in triplicate. The PCR conditions were as follows: 95 °C for 30 s and 45 cycles of 95 °C for 5 s, and 59 °C for 30 s. Negative controls without DNA were included in each PCR run.

2.5. CYN Measurement

One milliliter of culture was subjected to 3~5 cycles of freezing and thawing, followed by 1 min of sonication to lyse the cells. The lysates were centrifuged for 10 min to remove insoluble debris, and the resulting supernatant was collected for CYN measurement. We used a direct competitive time-resolved fluorescence immunoassay (TRFIA) to measure CYN concentration as previously described [42]. The assay followed a one-step procedure, and a linear calibration curve was constructed using the logit-log method. CYN concentrations in the sample were calculated according to the linear equation derived from the standard curves. The cell quota of CYN (QCYN) was calculated as the ratio of CYN concentration to the abundance of toxic R. raciborskii (as determined by cyrJ gene copy numbers via real-time PCR).

2.6. Data Analysis and Processing

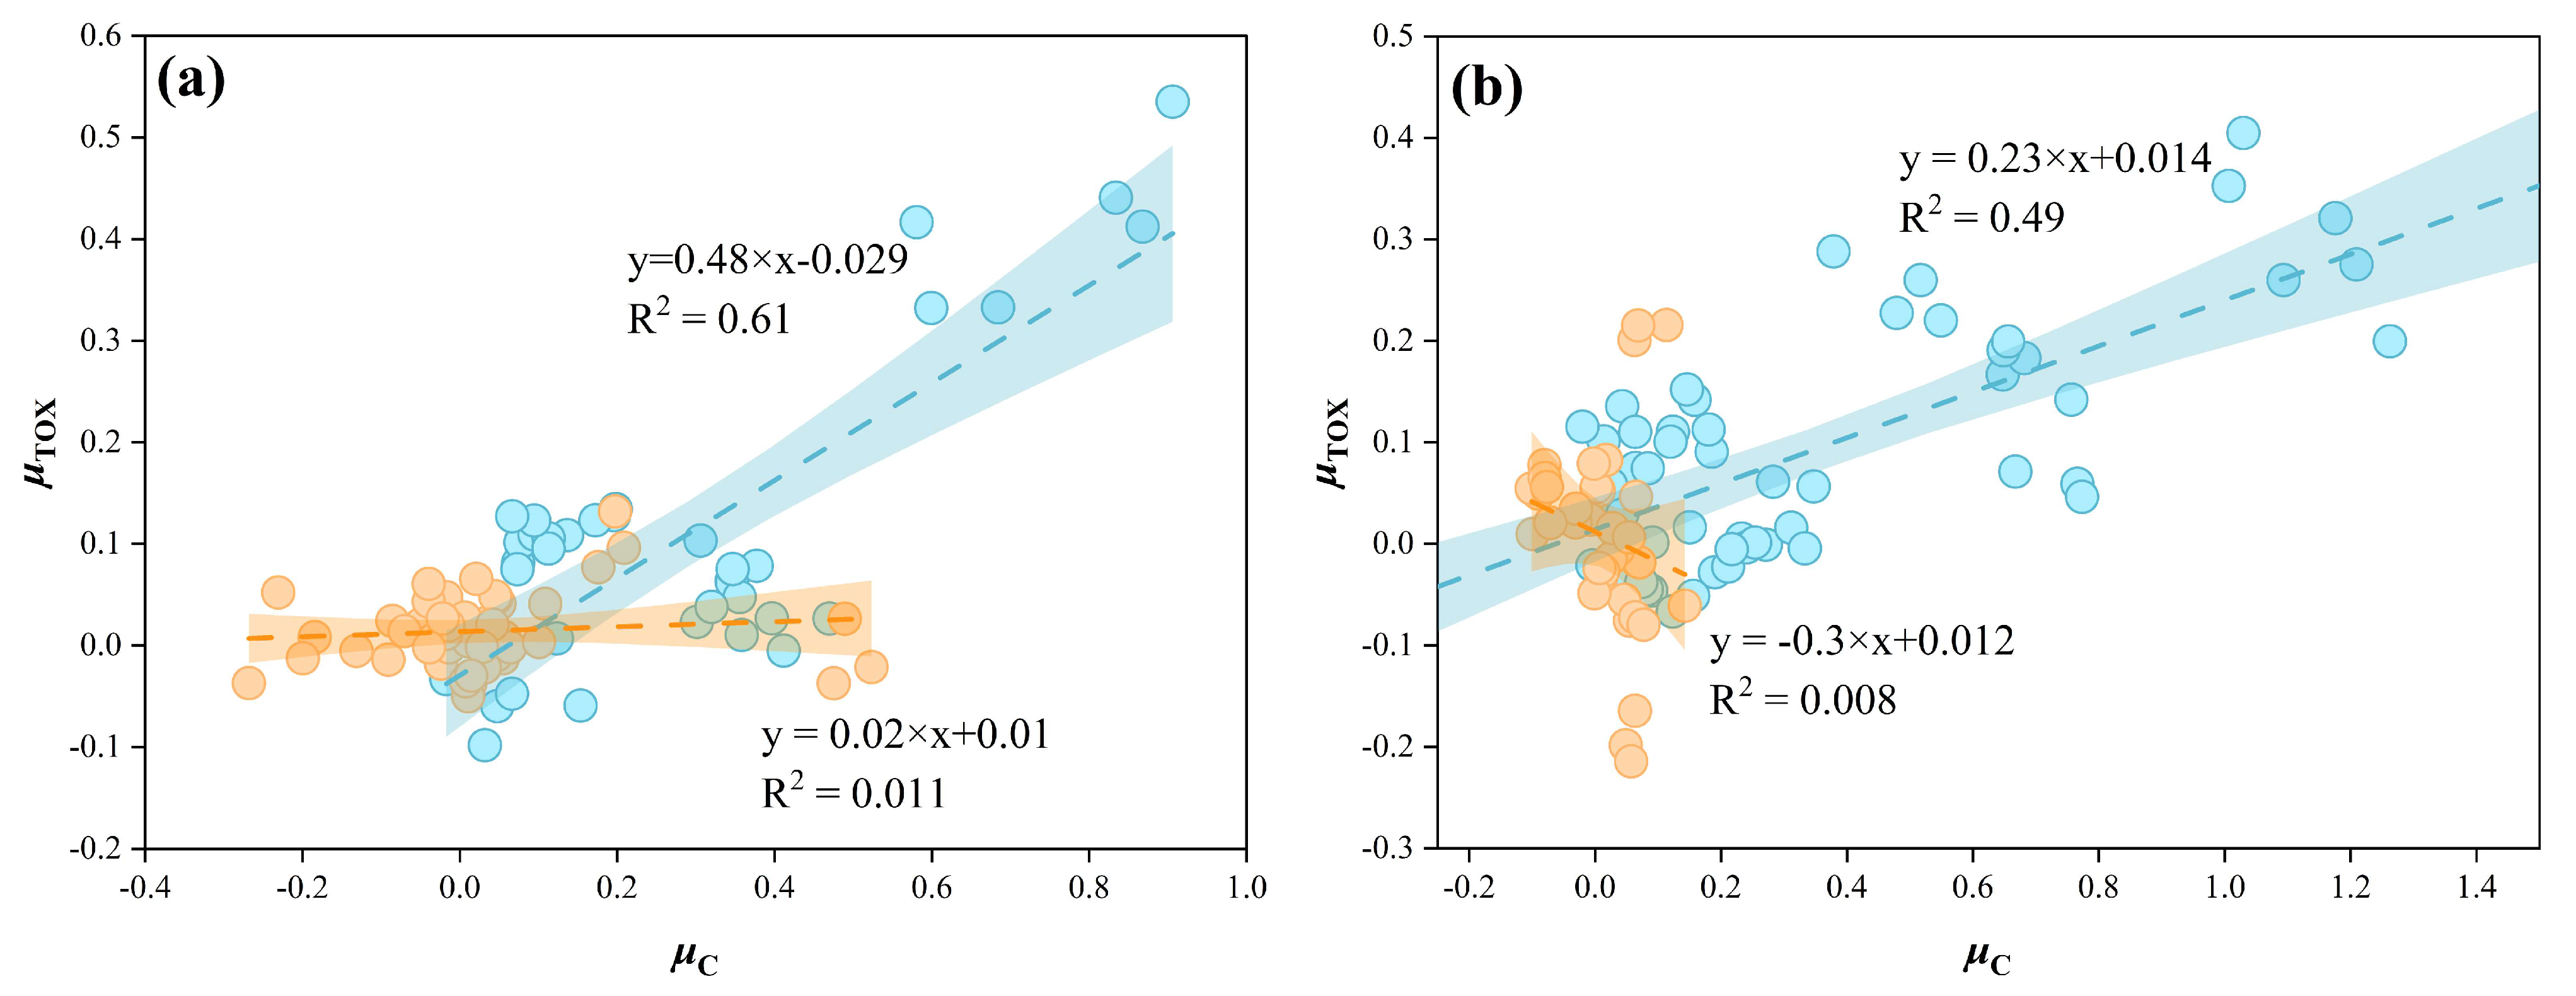
2.6.1. Analysis of the Relationship Between Growth Rate and CYN Production

The toxin production rate (μTOX) and the specific growth rate (μC) of CYN-producing strains (CS506 and QDH7) in the co-culture experiments were calculated using a first-order kinetic model [43]. The calculation formula is as follows:
μTOX(μC) = [ln(C1) − ln(C0)]/(t1 − t0),
where C1 and C0 represent the toxin concentration or abundance of toxin-producing cells at times t1 and t0, respectively.

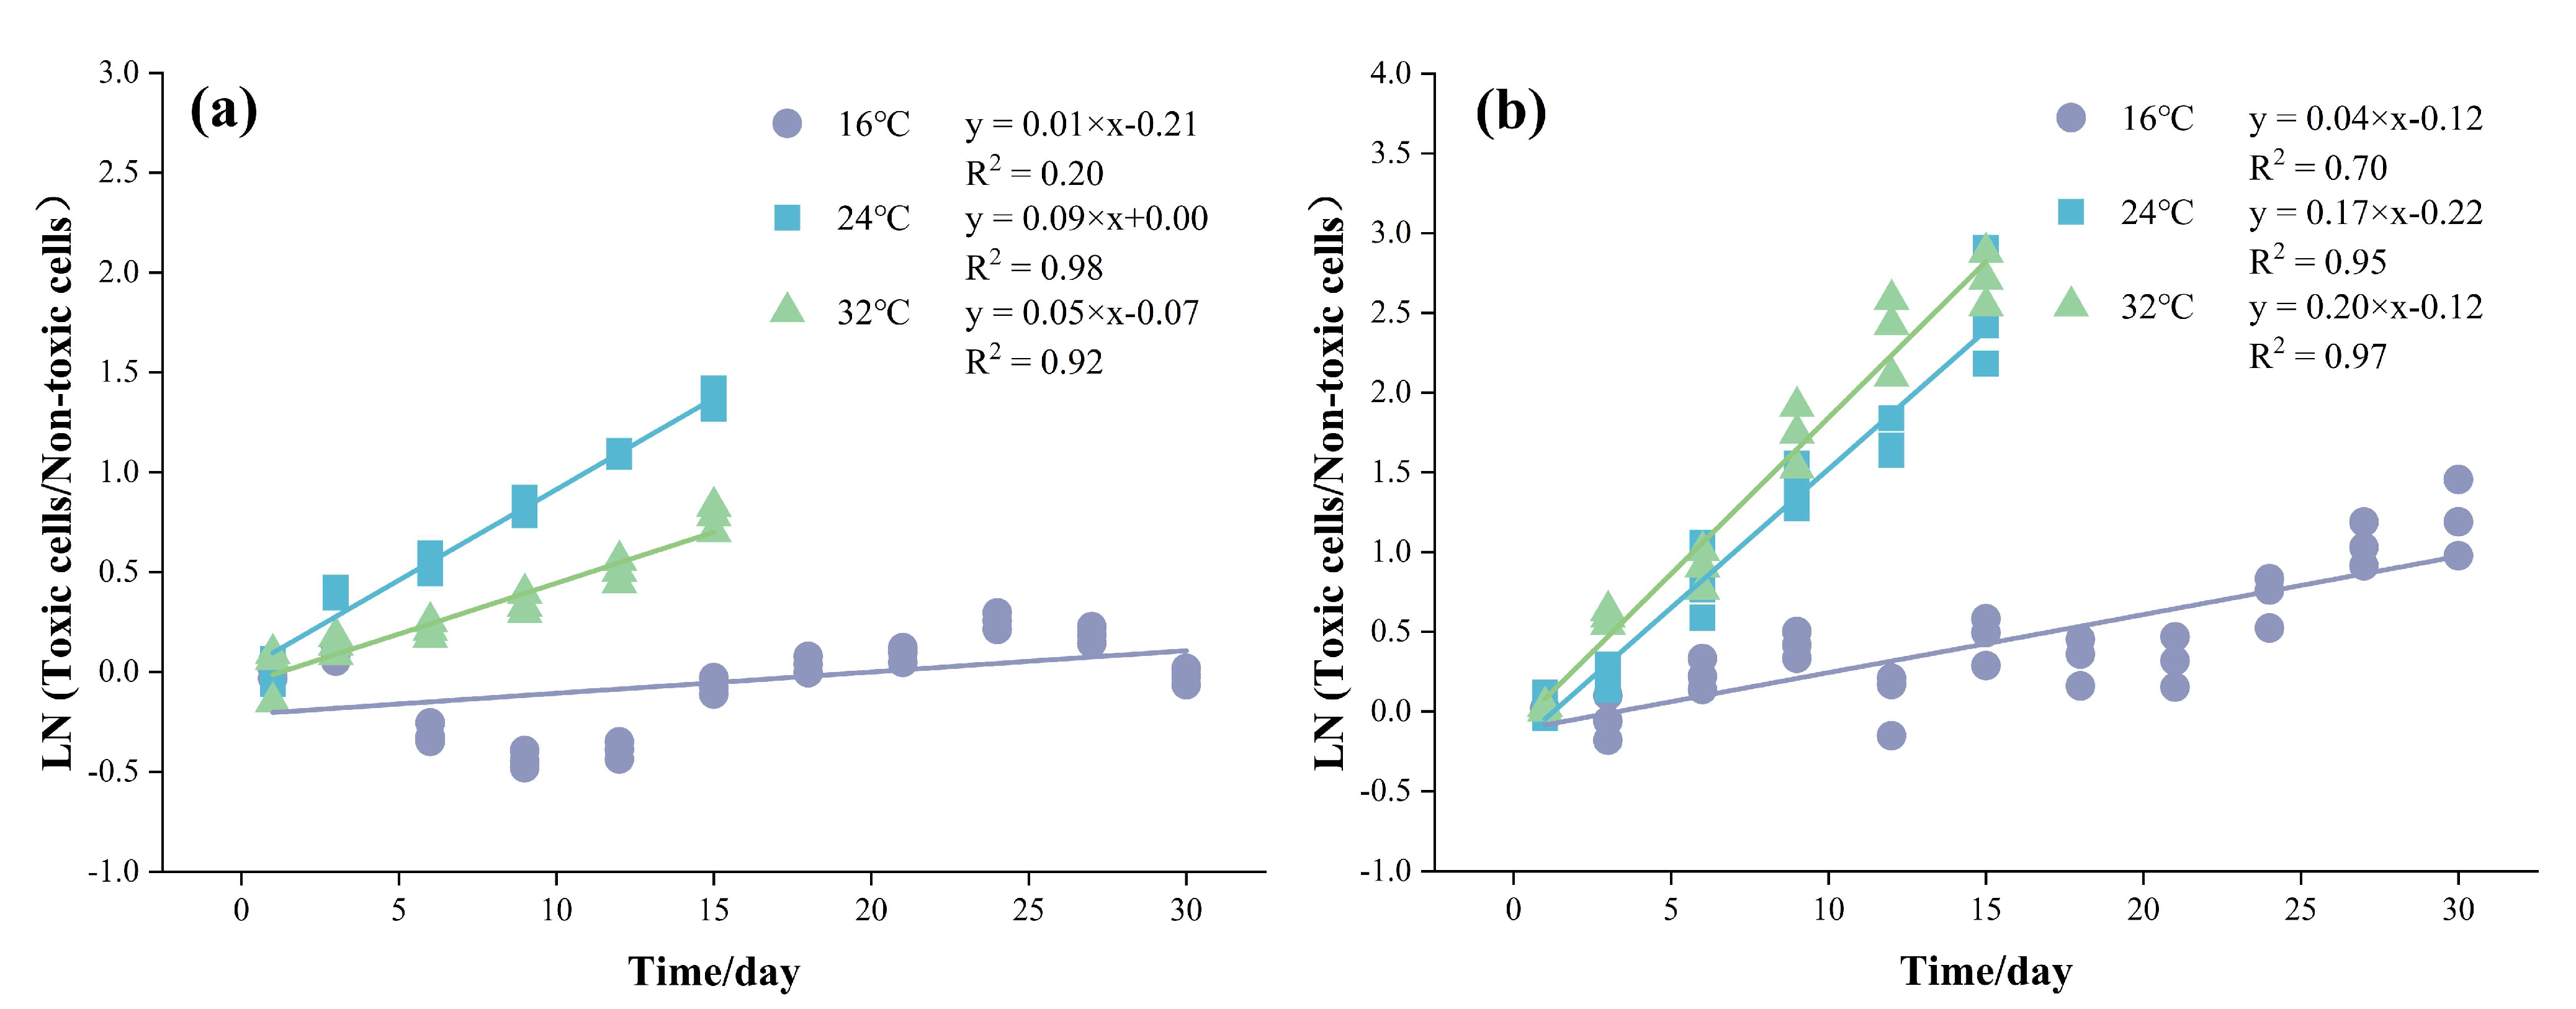
2.6.2. The Rate of Competitive Displacement

The competitive advantage of CYN-producing over non-CYN-producing R. raciborskii strains in co-culture was quantified using the rate of competitive displacement (RCD) [44]. The calculation formula is as follows:
RCD = dln(Xa/Xb)/dt,
where Xa and Xb represent the cell abundance of CYN-producing and non-CYN-producing R. raciborskii, respectively. The natural logarithm of the ratio (ln(Xa/Xb)) is regressed against time (d), and the slope of the regression line is taken as the RCD.

2.6.3. Data Analysis

In the monoculture experiments, one-way analysis of variance (ANOVA) followed by Tukey’s multiple comparison test was employed to assess whether the specific growth rates of the four R. raciborskii strains differed significantly across three temperature conditions. Prior to ANOVA, the data were tested for normality using the Shapiro–Wilk test and homogeneity of variance using Levene’s test. A significance level of p < 0.05 was used to determine whether the assumptions were met. In the co-culture experiments, a competitive displacement rate (RCD) model was used to evaluate the influence of temperature on the displacement of non-toxic strains by toxic R. raciborskii. Furthermore, linear regression analysis was performed to investigate the relationship between the specific growth rate (μC) and the toxin production rate (μTOX) in toxic R. raciborskii. All figure preparations and statistical analyses were performed using Origin 2024 software. Differences were considered statistically significant at p < 0.05.

3. Results

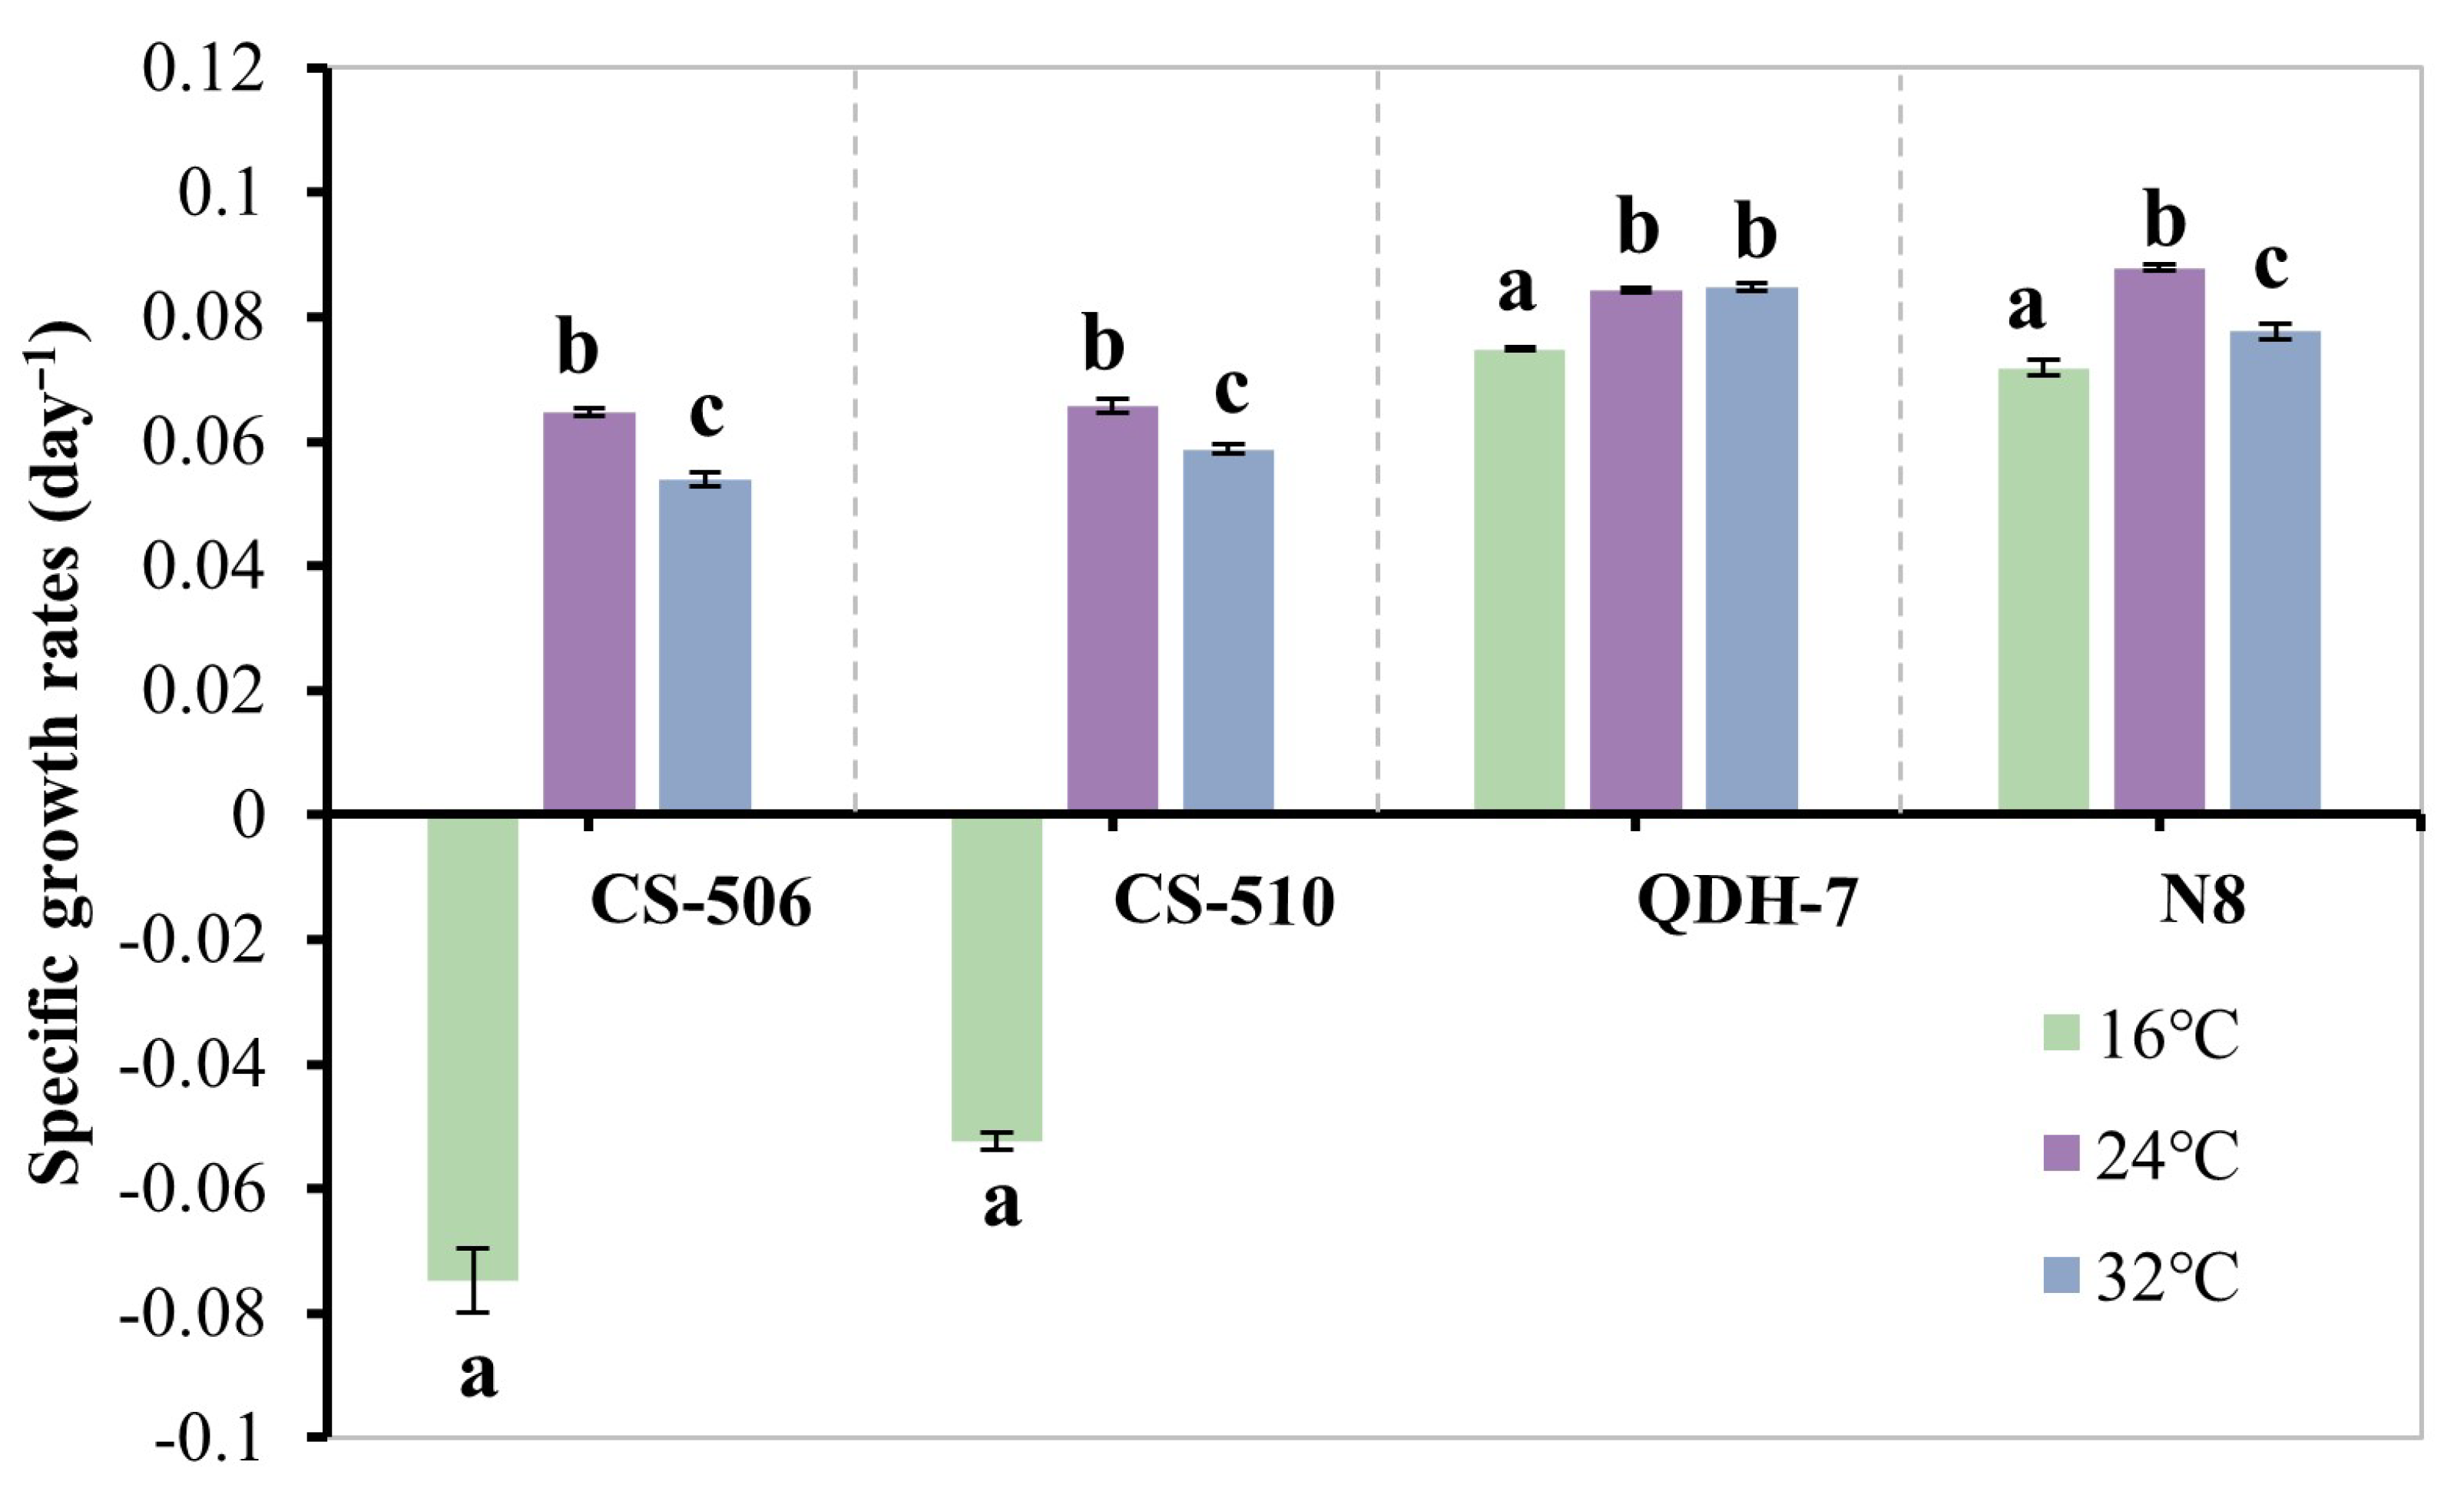
3.1. Specific Growth Rate of R. raciborskii Under Monoculture Conditions

The growth of all four R. raciborskii strains increased with rising temperature (Figure S1), with significantly higher specific growth rates observed at 24 °C and 32 °C compared to 16 °C (Figure 1, p < 0.05). Under the same temperature conditions, no significant differences in growth were found between the Australian strains (CS506 and CS510). Similarly, no significant differences were observed between the Chinese strains (QDH7 and N8) at 16 °C and 24 °C; however, a significant difference was detected between the Chinese strains at 32 °C (p > 0.05). This suggested that the four R. raciborskii strains followed a similar growth pattern under monoculture conditions, regardless of CYN production capability. At 16 °C, the Australian strains failed to proliferate, whereas the Chinese strains grew well. Additionally, strains CS506, CS510, and N8 reached the maximum specific growth rate at 24 °C, while the Chinese strain QDH7 showed no significant difference between 24 °C and 32 °C (p > 0.05). This suggested that strains from different geographic origins responded differently to temperature variations.

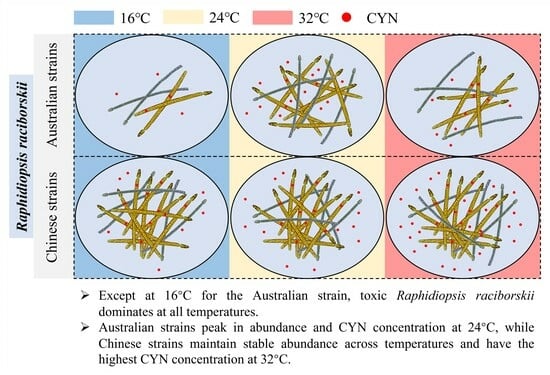
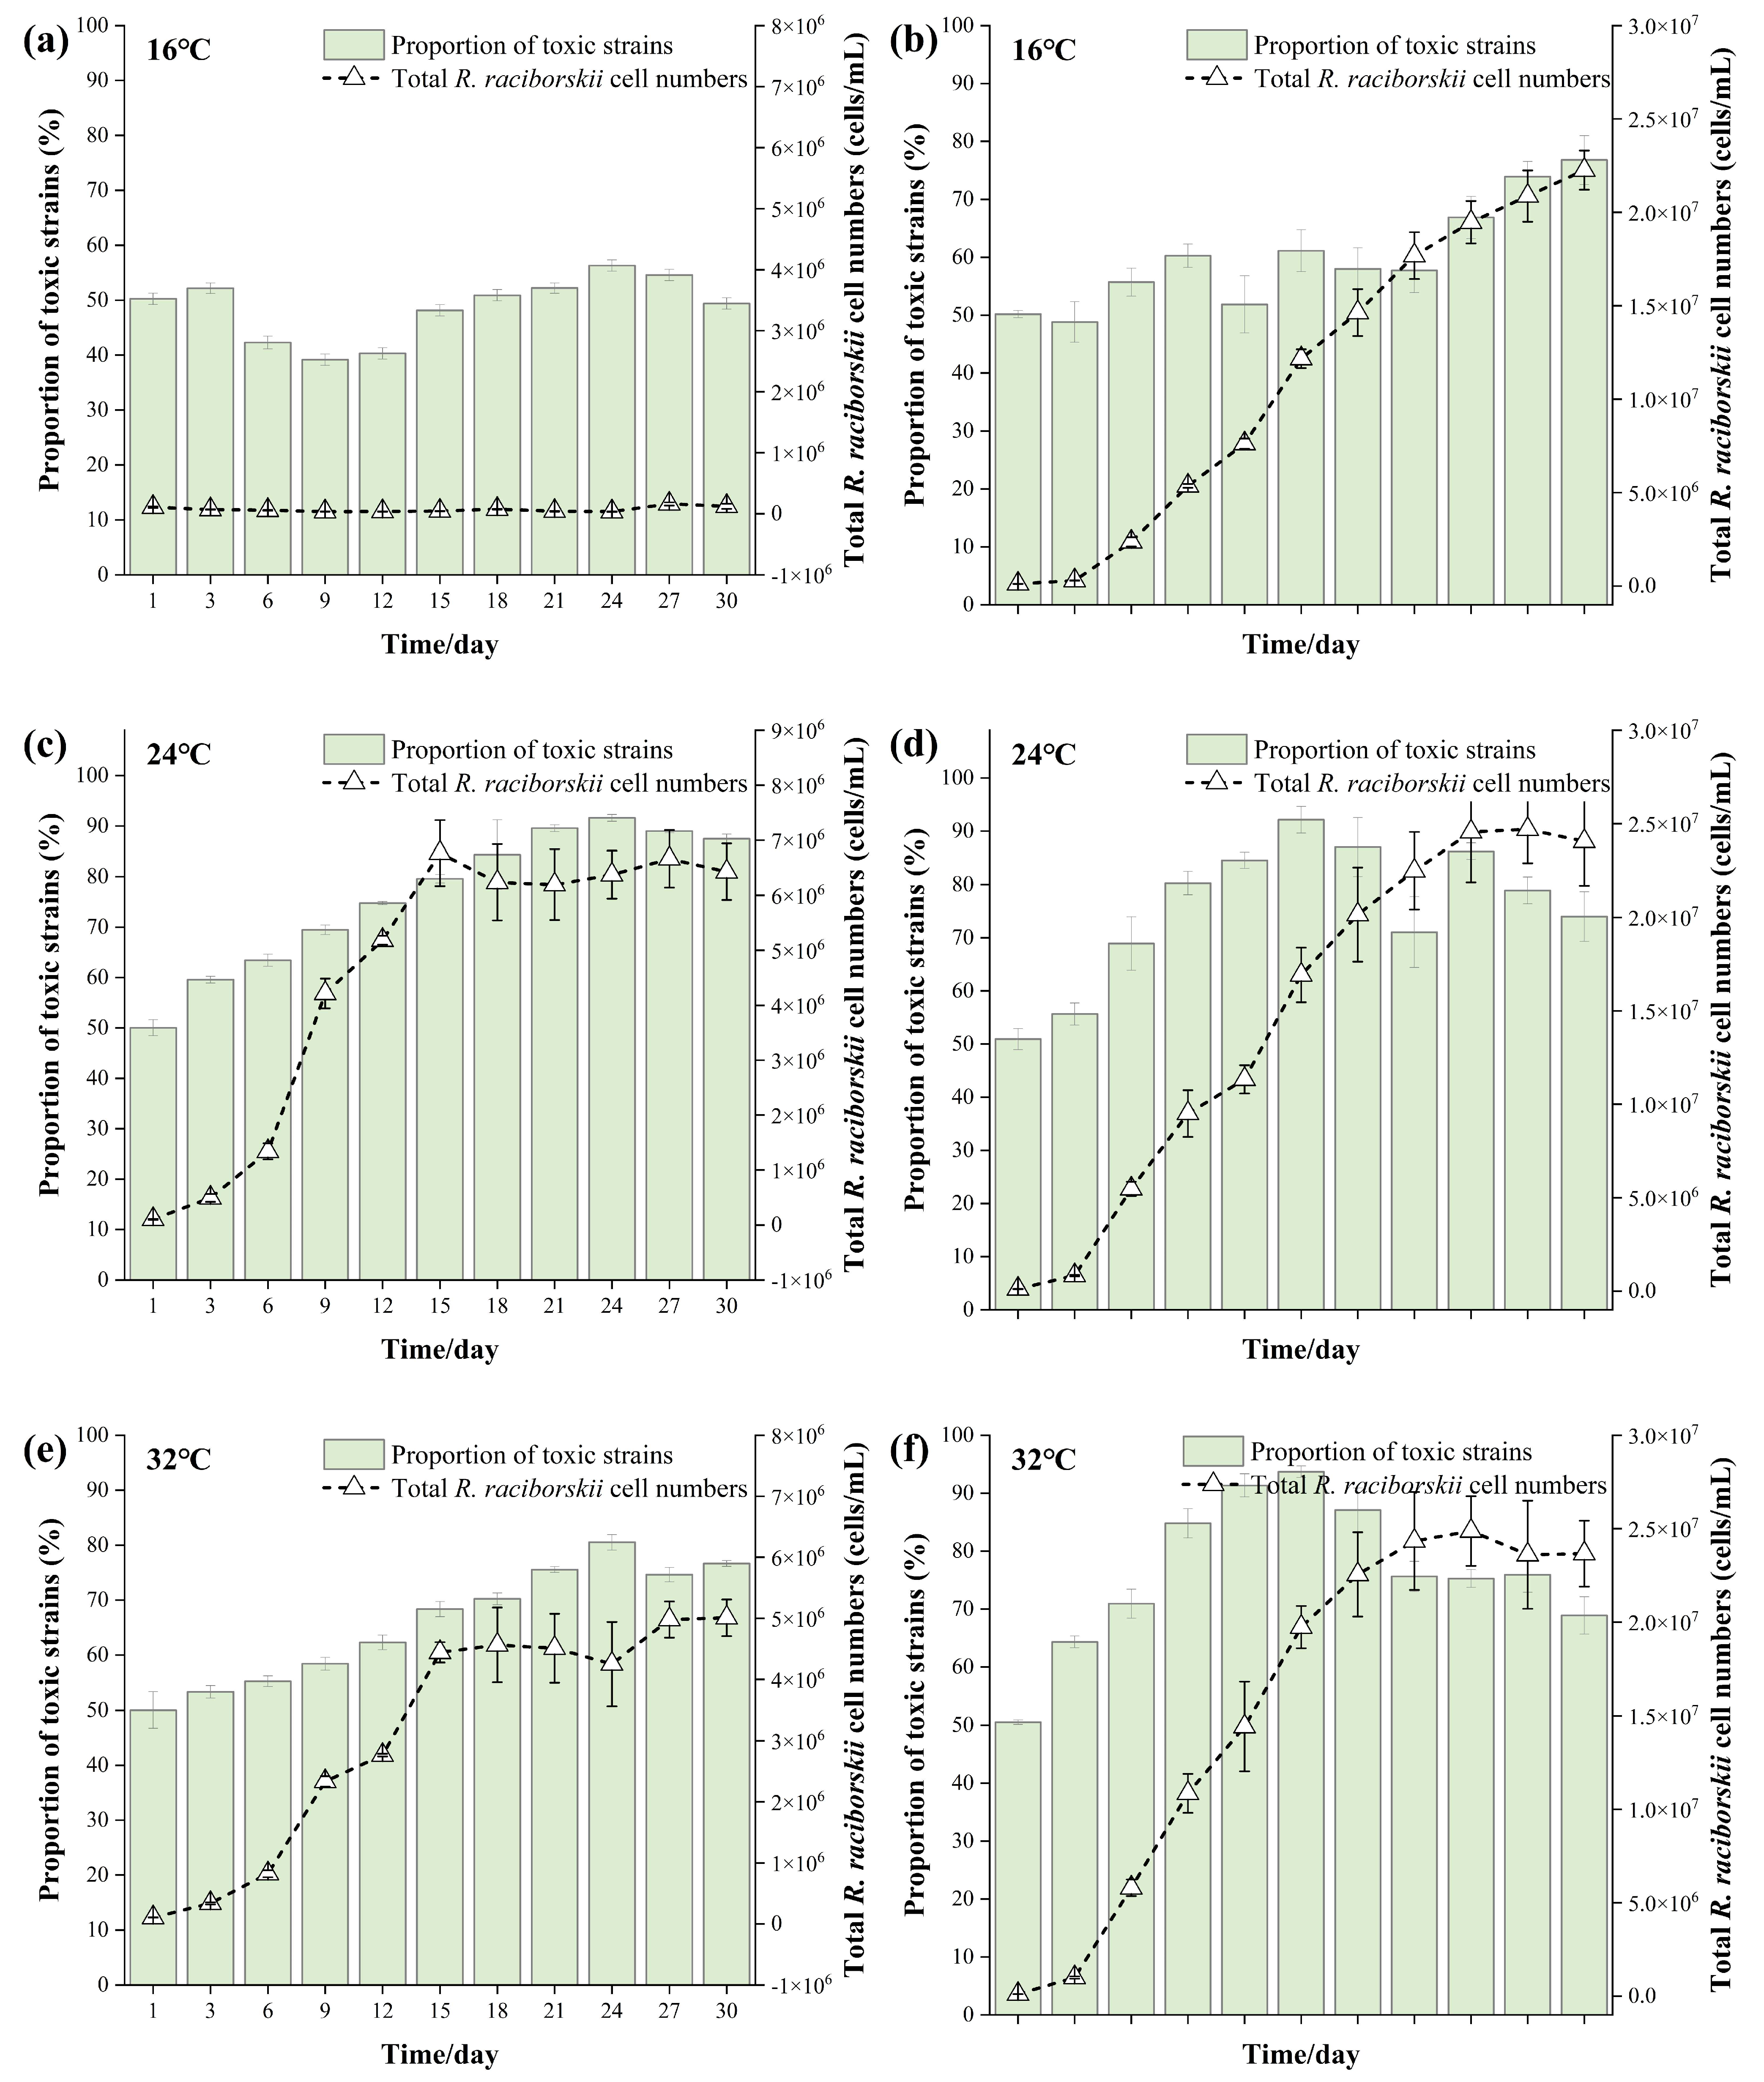
3.2. Changes in Total R. raciborskii Abundance and Proportion of CYN-Producing Strains in the Co-Culture Experiments

In the co-culture experiment, the Australian strains (CS506/CS510) failed to grow at 16 °C, with the proportion of toxic R. raciborskii fluctuating around 50% throughout the experiment (Figure 2a). At 24 °C and 32 °C, both CS506/510 strains grew well, reaching their maximum abundance (6.77 × 10⁶ cells/mL, Figure 2c) on day 15 under 24 °C conditions, which was significantly higher than the maximum abundance at 32 °C (4.56 × 10⁶ cells/mL, p < 0.05, Figure 2e). At both 24 °C and 32 °C, the proportion of toxic strain CS506 exceeded 50% on day 3 and maintained this dominance until the end of the experiment. The maximum proportions of toxic CS506 were 91.57% at 24 °C and 80.38% at 32 °C (Figure 2c,e). Similar to monoculture observations, the QDH7/N8 mixtures of the Chinese strains exhibited robust growth at 16 °C (Figure 2b). At 24 °C and 32 °C, the maximum abundance of the total R. raciborskii (based on rpoC1 copy numbers) was almost identical, reaching 24.70 × 10⁶ cells/mL and 24.87 × 10⁶ cells/mL, respectively (Figure 2d,f). At 16 °C, the proportion of toxic QDH7 increased gradually, peaking at 76.88% by the end of the experiment. In contrast, at 24 °C and 32 °C, the proportion of toxic cells rose rapidly, reaching maximum values of 92.06% and 93.68% on day 15, respectively (Figure 2d,f).
The RCD model analysis revealed that the competitive displacement rates of the Australian toxic strain CS506 over the non-toxic CS510 at 16 °C, 24 °C, and 32 °C were 0.01, 0.09, and 0.05, respectively. These results indicated that CS506 exhibited a distinct competitive advantage at 24 °C (Figure 3a). For the Chinese strains, the displacement rates of toxic QDH7 over non-toxic N8 at 16 °C, 24 °C, and 32 °C were 0.04, 0.17, and 0.20, respectively (Figure 3b), suggesting that the competitive advantage of the toxic QDH7 increased with rising temperatures.

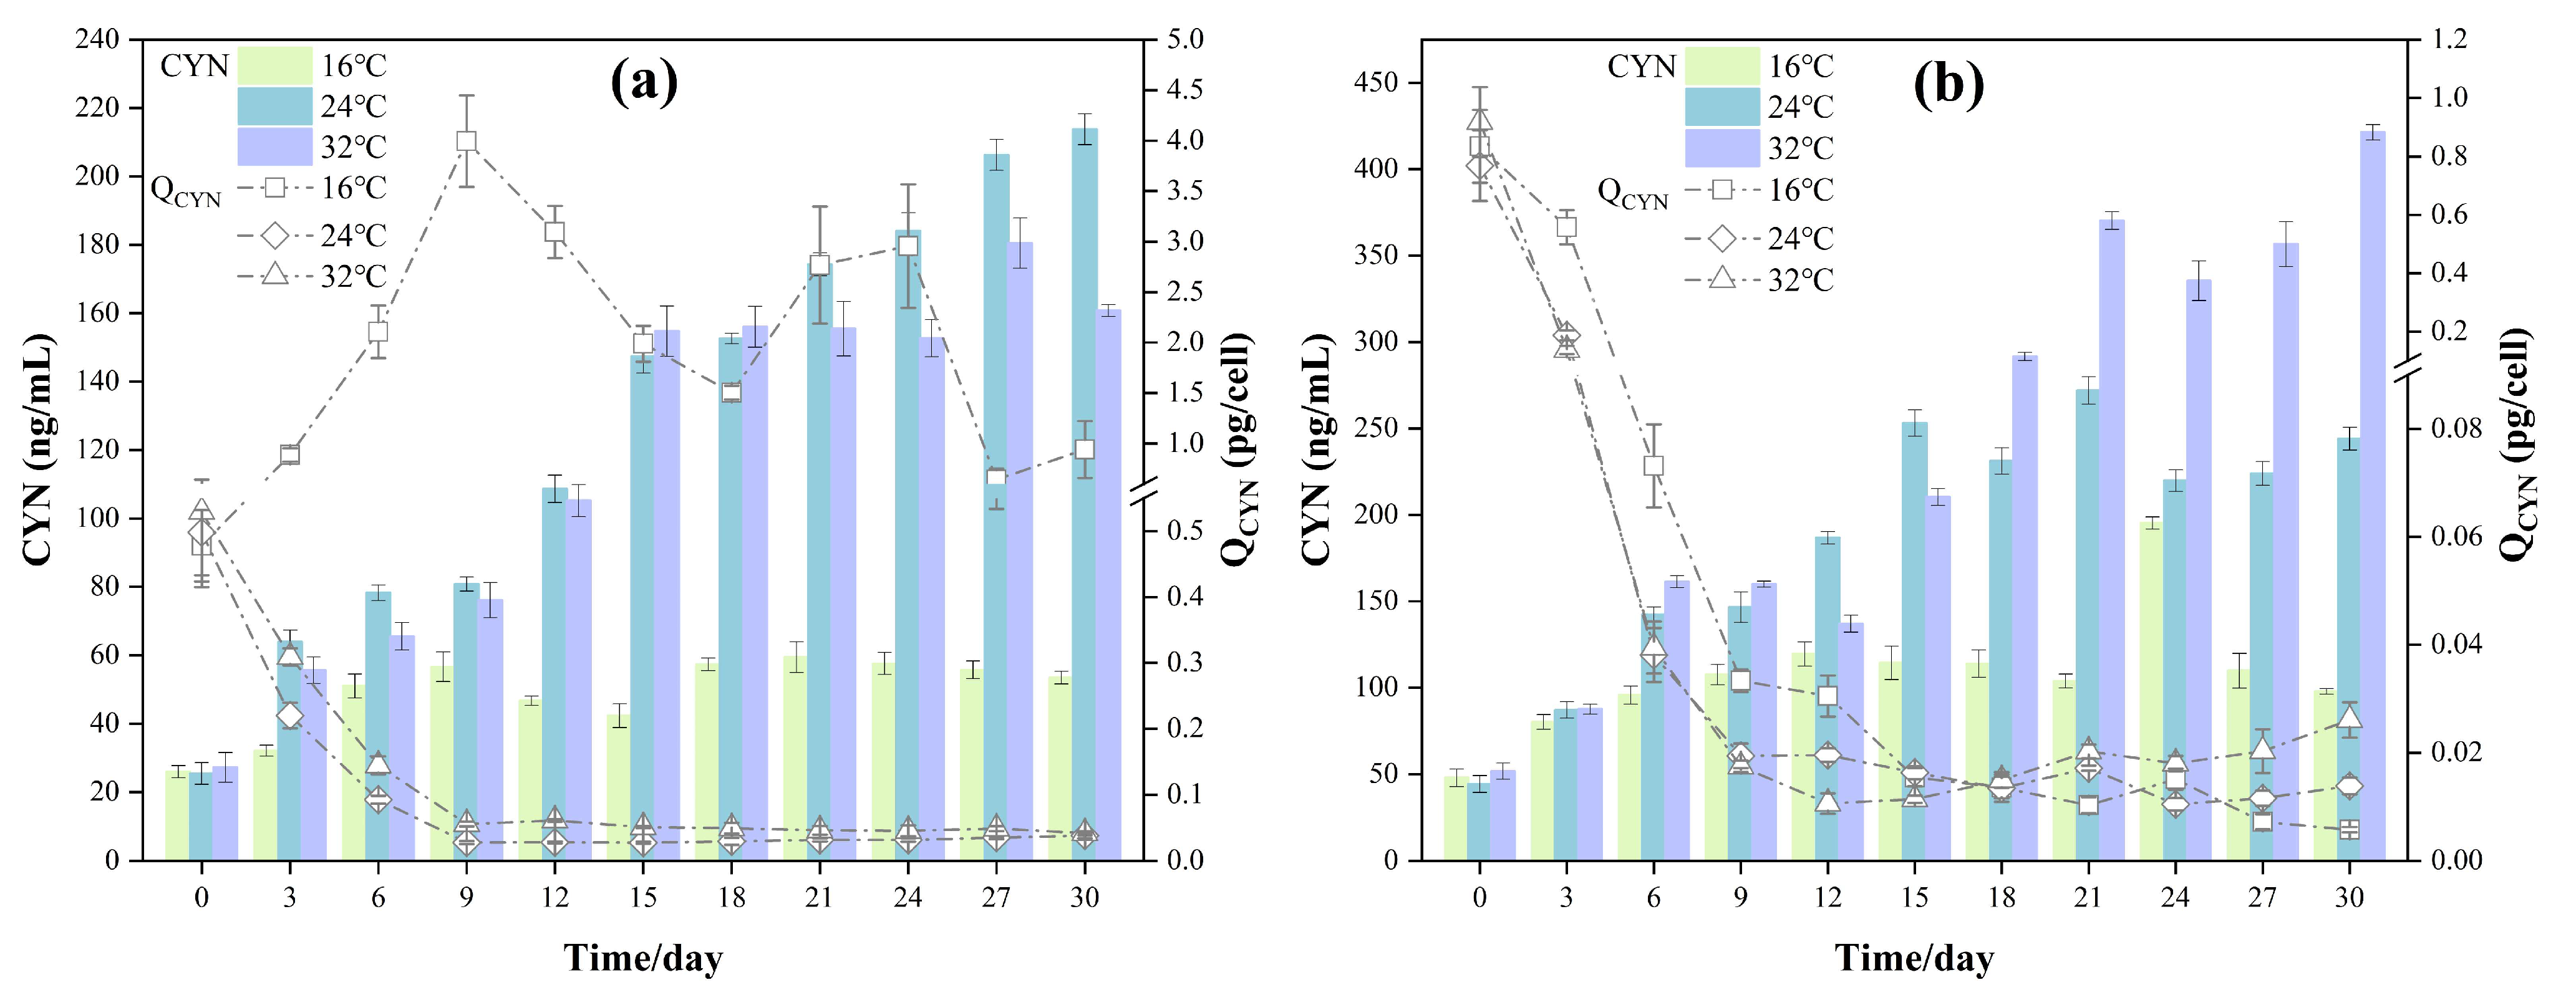
3.3. Changes in CYN Concentration and QCYN in the Co-Culture Experiments

CYN concentrations in both Australian and Chinese mixed cultures increased gradually throughout the experimental period (Figure 4). For the Australian strain mixtures, CYN concentrations at 24 °C and 32 °C were significantly higher than those at 16 °C (p < 0.05), with the highest concentration of 213.8 ng/mL observed at 24 °C. However, no significant difference was observed between 24 °C and 32 °C (p > 0.05, Figure 4a). For the Chinese strain mixtures, CYN concentration exhibited a clear increasing trend with rising temperatures, reaching a maximum of 421.46 ng/mL at 32 °C (p < 0.05, Figure 4b). Except for the Australian strain CS506 at 16 °C, the QCYN of both toxic strains declined significantly during the first 9 days, and then stabilized until the end of the experiment (Figure 4a,b). At 16 °C, the QCYN of CS506 was significantly higher than those at 24 °C and 32 °C (p < 0.05, Figure 4a), whereas no significant difference was observed between the latter two temperatures (p > 0.05). The QCYN of strain QDH7 showed no significant difference across all three temperatures (p > 0.05, Figure 4b).
During the exponential growth phase, a positive relationship was observed between μCYN and μc, with slopes of 0.48 and 0.23, and R2 = 0.61 and 0.49 for CS506 (Figure 5a) and QDH7 (Figure 5b), respectively. This relationship disappeared for strain CS506 (Figure 5a) and even reversed for strain QDH7 (Figure 5b) when the mixed population entered the stationary phase.

4. Discussion

Climate warming and eutrophication increase the frequency and intensity of cyanobacterial blooms, while synergistically enhancing bloom toxicity [31]. Our previous field observations suggested that the proportion of toxic R. raciborskii increased with rising water temperature [38]. This study further investigated the effect of temperature on the competitive advantage of toxic R. raciborskii through laboratory co-culture experiments. The results showed that under nutrient-rich conditions, elevated temperatures accelerated the displacement of non-toxic strains by toxic R. raciborskii, leading to increased CYN concentration. This finding is consistent with numerous studies on Microcystis, which have shown that elevated temperatures promote the growth of toxic strains and enhance microcystin synthesis [20,22,35,45]. Compared to Microcystis, research on the succession dynamics between toxic and non-toxic R. raciborskii remains relatively limited [26,27,28,29,30]. To our knowledge, this is the first study to investigate how temperature influences the competition between toxic and non-toxic R. raciborskii and its subsequent impact on CYN production in co-culture settings.
Temperature influences algal growth by regulating enzyme activity, photosynthesis, and biosynthetic processes within algal cells [7]. It plays a critical role in regulating phytoplankton growth by influencing metabolic and physiological processes [7,46]. In our monoculture experiments, the specific growth rates of all four R. raciborskii strains were significantly lower at 16 °C compared to 24 °C and 32 °C, indicating that higher temperatures favor the growth and potential bloom formation of this species, consistent with many previous studies [47,48,49]. Both our monoculture and co-culture experiments demonstrate that R. raciborskii strains with different origins responded differently to temperature. Specifically, the Chinese strains grew well at 16 °C, but the Australian strains did not. These findings imply that the optimal growth temperature of R. raciborskii may be shaped by the geographical origin of the strains. In terms of toxin production, CYN concentrations in the Australian strain co-cultures peaked at 24 °C, whereas the Chinese mixed population had the maximum concentrations at 32 °C. Our results were consistent with previous studies showing that R. raciborskii presented strain-specific variations in growth, toxin production, and morphology [50,51]. Although R. raciborskii typically prefers temperatures above 25 °C, it demonstrates remarkable adaptability to a wide range of temperatures [47,52], occasionally accounting for up to 95% of the total phytoplankton biomass, even at 11 °C [53,54]. Jia et al. (2021) [54] reported that the CHAB 3409 strain of R. raciborskii from central China could not grow at 15 °C, whereas two other strains from Yunnan Province in southern China thrived at this temperature. Similarly, both Chinese strains used in this study grew well at 16 °C. The presence of low temperature-adapted ecotypes within R. raciborskii populations may facilitate its expansion from tropical to temperate regions [2]. With the increase in global warming, we infer that R. raciborskii will further expand its distribution across China.
Our co-culture experiments showed that toxic R. raciborskii always outcompeted non-toxic strains across all temperature treatments. However, field observation in Guangdong reservoirs demonstrated the dominance of non-toxic R. raciborskii [30,38]. Previous studies have shown that elevated nutrient concentrations enhance the abundance and relative proportion of toxic R. raciborskii [28,29,30]. For example, in Macao reservoirs, the abundance of CYN-producing R. raciborskii was positively correlated with ammonia nitrogen concentrations [29]. In this study, the competition experiments were conducted using the nutrient-rich BG11 medium, with initial nitrogen and phosphorus concentrations of 247 mg/L and 7.14 mg/L, respectively. Such high nutrient availability may contribute to the dominance of toxic strains. In our previous study conducted under nutrient-rich conditions, a shift from non-toxic to toxic genotype was observed; however, this regime was reversed under nutrient-limited conditions [30]. A similar pattern was also reported in competition experiments between MC-producing and non-MC-producing strains of Planktothrix agardhii [55]. It is worth noting that while ample nutrients in the laboratory may promote toxin-producing strains, such conditions are often transient in natural environments. When algal growth enters the stationary phase, nutrient depletion often becomes the limiting factor [56]. Although the toxic QDH7 strain dominated through the co-culture period, its proportion began to decline during the stationary phase, possibly due to nutrient limitation.
One possible ecological role of CYN is to act as an allelochemical that suppresses the growth of sympatric species, thereby enhancing the competitive advantage of its producer [57,58]. Therefore, the higher proportion of toxic R. raciborskii observed in our co-culture experiment may be attributed to the potential allelopathic effects of CYN. Previous studies have shown that CYN can inhibit the growth of Microcystis, Chlorella, and other algae species [59,60]. However, Pinheiro et al. (2013) [61] reported that pure CYN (0.025–2.5 mg/L) did not inhibit the growth of microalgae, whereas CYN-containing crude extracts from Aphanizomenon exhibited significant inhibitory effects. This suggests that the suppression of algal growth is likely driven by other allelopathic substances rather than CYN alone. Additionally, Figueredo et al. (2007) [62] also proposed that, apart from CYN, R. raciborskii may produce other allelopathic substances contributing to its competitive advantage. Therefore, further research is needed to investigate whether CYN inhibits non-CYN-producing R. raciborskii strains and contributes to the competitive advantage of toxin-producing strains.
We observed a significant positive correlation between the specific toxin production rate (μTOX) and specific growth rate (μC) during the exponential growth phase for both toxic R. raciborskii strains, consistent with the study of Willis et al. (2015) [63]. This indicates that CYN production by R. raciborskii may be a constitutive process. However, this relationship disappeared, and even reversed, during the stationary phase. Similarly, Park et al. (2023) [64] found that growth and toxin production were poorly coupled during the stationary phase and decoupled during the declining phase in batch cultures of Alexandrium. Another study has documented a negative correlation between specific growth rate and toxin production rate under grazing pressure, suggesting a potential trade-off between growth and defense [64,65,66]. In this study, the negative correlation between CYN production and the growth of R. raciborskii strains was only observed during the stationary phase. We inferred that toxic R. raciborskii strains exhibited a trade-off between growth and toxin production under nutrient limitations.
The impact of temperature on cyanotoxin production remains a topic of debate. Our results showed that the maximum CYN concentrations increased with rising temperatures, aligning with the findings of Cirés et al. (2011) [67] and Nor et al. (2019) [15]. However, several studies reported that no significant correlation, or even a negative correlation, was found between temperature and CYN concentration [68,69,70]. For instance, the toxic R. raciborskii strain CR4-7 was able to thrive at a high temperature of 35 °C, yet its CYN synthesis was completely suppressed at that temperature [68]. In our study, with the exception of the low-temperature group in the CS506/CS510 co-culture, QCYN gradually declined and stabilized, with no significant differences across temperature treatments. This is consistent with the findings of Pierangelini et al. (2015) [71] and Willis et al. (2015) [63], who suggested that CYN production is not directly regulated by environmental factors. Rather, QCYN remained constant despite variations in nitrogen and phosphorus concentrations. Therefore, high CYN concentrations in water bodies may result from a high abundance of toxic R. raciborskii, which tends to rise with temperature.

5. Conclusions and Perspectives

5.1. Conclusions

This study explored the impact of temperature on the competitive advantage of toxic R. raciborskii strains and CYN production through classical competition experiments. The findings revealed that growth and toxin production exhibited strain-specific responses to temperature, particularly between Australian and Chinese strains. Notably, regardless of temperature variations, toxic R. raciborskii strains always gained a competitive advantage under nutrient-rich co-culture experiments. More importantly, an increase in temperature significantly accelerated the displacement of non-toxic R. raciborskii by toxic ones, resulting in elevated CYN concentrations and enhanced bloom toxicity.

5.2. Perspectives

This study examined the effects of temperature on competition between toxic and non-toxic R. raciborskii under nutrient-rich conditions. However, nitrogen and phosphorus concentrations in natural water bodies are typically much lower than those used in the experiment. To better elucidate the ecological implications of temperature on the population dynamics and toxin production of toxic R. raciborskii, future studies should incorporate competition experiments under environmentally relevant nutrient levels. This would provide a more realistic assessment of how temperature fluctuation influences the competitive interactions and toxicity of R. raciborskii in natural water bodies.

Supplementary Materials

The following supporting information can be downloaded at: https://www.mdpi.com/article/10.3390/d17070450/s1.

Author Contributions

W.L. and L.L. conceived of the study and wrote the paper, M.L. conducted the experiments, X.T. and S.Z. assisted in sampling and analyzing the data. All authors have read and agreed to the published version of the manuscript.

Funding

This study was supported financially by the National Natural Science Foundation of China (No. 32371616) and the Science and Technology Innovation Program from Water Resources of Guangdong Province (No. 2025-04).

Data Availability Statement

The data that support the findings of this study are available from the corresponding author upon reasonable request.

Conflicts of Interest

The authors declare no conflicts of interest.

References

  1. Aguilera, A.; Gómez, E.B.; Kastovsky, J.; Echenique, R.O.; Salerno, G.L. The polyphasic analysis of two native Raphidiopsis isolates supports the unification of the genera Raphidiopsis and Cylindrospermopsis (Nostocales, Cyanobacteria). Phycologia 2018, 57, 130–146. [Google Scholar] [CrossRef]
  2. Burford, M.A.; Beardall, J.; Willis, A.; Orr, P.T.; Magalhaes, V.F.; Rangel, L.M.; Azevedo, S.M.F.O.E.; Neilan, B.A. Understanding the winning strategies used by the bloom-forming cyanobacterium Cylindrospermopsis raciborskii. Harmful Algae 2016, 54, 44–53. [Google Scholar] [CrossRef]
  3. Wu, Z.; Yang, S.; Shi, J. Overview of the distribution and adaptation of a bloom-forming cyanobacterium Raphidiopsis raciborskii: Integrating genomics, toxicity, and ecophysiology. J. Oceanol. Limnol. 2022, 40, 1774–1791. [Google Scholar] [CrossRef]
  4. Zheng, L.; Liu, Y.; Li, R.; Yang, Y.; Jiang, Y. Recent Advances in the Ecology of Bloom-Forming Raphidiopsis (Cylindrospermopsis) raciborskii: Expansion in China, Intraspecific Heterogeneity and Critical Factors for Invasion. Int. J. Environ. Res. Public Health 2023, 20, 1984. [Google Scholar] [CrossRef]
  5. Yang, Y.; Yu, G.; Chen, Y.; Jia, N.; Li, R. Four decades of progress in cylindrospermopsin research: The ins and outs of a potent cyanotoxin. J. Hazard. Mater. 2021, 406, 124653. [Google Scholar] [CrossRef] [PubMed]
  6. Byth, S. Palm Island Mystery Disease. Med. J. Aust. 1980, 2, 40–42. [Google Scholar] [CrossRef]
  7. Zheng, B.; He, S.; Zhao, L.; Li, J.; Du, Y.; Li, Y.; Shi, J.; Wu, Z. Does temperature favour the spread of Raphidiopsis raciborskii, an invasive bloom-forming cyanobacterium, by altering cellular trade-offs? Harmful Algae 2023, 124, 102406. [Google Scholar] [CrossRef]
  8. Sprőber, P.; Shafik, H.M.; Présing, M.; Kovács, A.W.; Herodek, S. Nitrogen uptake and fixation in the cyanobacterium Cylindrospermopsis raciborskii under different nitrogen conditions. Hydrobiologia 2003, 506, 169–174. [Google Scholar] [CrossRef]
  9. Dixon, R.; Kahn, D. Genetic regulation of biological nitrogen fixation. Nat. Rev. Microbiol. 2004, 2, 621–631. [Google Scholar] [CrossRef]
  10. Shatwell, T.; Köhler, J. Decreased nitrogen loading controls summer cyanobacterial blooms without promoting nitrogen-fixing taxa: Long-term response of a shallow lake. Limnol. Oceanogr. 2019, 64, S166–S178. [Google Scholar] [CrossRef]
  11. Xu, H.; McCarthy, M.J.; Paerl, H.W.; Brookes, J.D.; Zhu, G.; Hall, N.S.; Qin, B.; Zhang, Y.; Zhu, M.; Hampel, J.J. Contributions of external nutrient loading and internal cycling to cyanobacterial bloom dynamics in Lake Taihu, China: Implications for nutrient management. Limnol. Oceanogr. 2021, 66, 1492–1509. [Google Scholar] [CrossRef]
  12. Wu, Z.; Shi, J.; Li, R. Comparative studies on photosynthesis and phosphate metabolism of Cylindrospermopsis raciborskii with Microcystis aeruginosa and Aphanizomenon Flos-aquae. Harmful Algae 2009, 8, 910–915. [Google Scholar] [CrossRef]
  13. Tokodi, N.; Latkowska, E.; Klimczak, B.; Kłodawska, K.; Malec, P.; Willis, A.; Kokociński, M.; Antosiak, A.; Dziga, D. Toward understanding the mechanisms of Raphidiopsis raciborskii response to chill/light stress. J. Phycol. 2025, 61, 488–508. [Google Scholar] [CrossRef]
  14. Aubriot, L.; Clivio, F.; Somma, A.; Galvanese, E.; Colombo, S.; Haakonsson, S. Control of cyanobacterial blooms with iron addition can favor stress-tolerant toxic species. Harmful Algae 2025, 142, 102784. [Google Scholar]
  15. Mohamed Nor, N.H.; Te, S.H.; Mowe, M.A.D.; Gin, K.Y.-H. Environmental factors influence cylindrospermopsin production of Cylindrospermopsis raciborskii (CR12). J. Plankton Res. 2019, 41, 114–126. [Google Scholar] [CrossRef]
  16. Xiao, M.; Hamilton, D.P.; Chuang, A.; Burford, M.A. Intra-population strain variation in phosphorus storage strategies of the freshwater cyanobacterium Raphidiopsis raciborskii. FEMS Microbiol. Ecol. 2020, 96, fiaa092. [Google Scholar] [CrossRef]
  17. Gobler, C.J.; Burkholder, J.M.; Davis, T.W.; Harke, M.J.; Johengen, T.; Stow, C.A.; Van de Waal, D.B. The dual role of nitrogen supply in controlling the growth and toxicity of cyanobacterial blooms. Harmful Algae 2016, 54, 87–97. [Google Scholar] [CrossRef]
  18. Pearson, L.A.; Dittmann, E.; Mazmouz, R.; Ongley, S.E.; D’Agostino, P.M.; Neilan, B.A. The genetics, biosynthesis and regulation of toxic specialized metabolites of cyanobacteria. Harmful Algae 2016, 54, 98–111. [Google Scholar] [CrossRef] [PubMed]
  19. Barnard, M.A.; Chaffin, J.D.; Plaas, H.E.; Boyer, G.L.; Wei, B.; Wilhelm, S.W.; Rossignol, K.L.; Braddy, J.S.; Bullerjahn, G.S.; Bridgeman, T.B.; et al. Roles of Nutrient Limitation on Western Lake Erie CyanoHAB Toxin Production. Toxins 2021, 13, 47. [Google Scholar] [CrossRef]
  20. Davis, T.W.; Berry, D.L.; Boyer, G.L.; Gobler, C.J. The effects of temperature and nutrients on the growth and dynamics of toxic and non-toxic strains of Microcystis during cyanobacteria blooms. Harmful Algae 2009, 8, 715–725. [Google Scholar] [CrossRef]
  21. Harke, M.J.; Davis, T.W.; Watson, S.B.; Gobler, C.J. Nutrient-Controlled Niche Differentiation of Western Lake Erie Cyanobacterial Populations Revealed via Metatranscriptomic Surveys. Environ. Sci. Technol. 2016, 50, 604–615. [Google Scholar] [CrossRef]
  22. Lei, L.; Li, C.; Peng, L.; Han, B.-P. Competition between toxic and non-toxic Microcystis aeruginosa and its ecological implication. Ecotoxicology 2015, 24, 1411–1418. [Google Scholar] [CrossRef] [PubMed]
  23. Rinta-Kanto, J.M.; Konopko, E.A.; DeBruyn, J.M.; Bourbonniere, R.A.; Boyer, G.L.; Wilhelm, S.W. Lake Erie Microcystis: Relationship between microcystin production, dynamics of genotypes and environmental parameters in a large lake. Harmful Algae 2009, 8, 665–673. [Google Scholar] [CrossRef]
  24. Yoshida, M.; Yoshida, T.; Takashima, Y.; Hosoda, N.; Hiroishi, S. Dynamics of microcystin-producing and non-microcystin-producing Microcystis populations is correlated with nitrate concentration in a Japanese lake. FEMS Microbiol. Lett. 2007, 266, 49–53. [Google Scholar] [CrossRef]
  25. Wang, M.; Shi, W.; Chen, Q.; Zhang, J.; Yi, Q.; Hu, L. Effects of nutrient temporal variations on toxic genotype and microcystin concentration in two eutrophic lakes. Ecotoxicol. Environ. Saf. 2018, 166, 192–199. [Google Scholar] [CrossRef]
  26. Orr, P.T.; Rasmussen, J.P.; Burford, M.A.; Eaglesham, G.K.; Lennox, S.M. Evaluation of quantitative real-time PCR to characterise spatial and temporal variations in cyanobacteria, Cylindrospermopsis raciborskii (Woloszynska) Seenaya et Subba Raju and cylindrospermopsin concentrations in three subtropical Australian reservoirs. Harmful Algae 2011, 10, 234. [Google Scholar] [CrossRef]
  27. Al-Tebrineh, J.; Merrick, C.; Ryan, D.; Humpage, A.; Bowling, L.; Neilan, B.A. Community Composition, Toxigenicity, and Environmental Conditions during a Cyanobacterial Bloom Occurring along 1,100 Kilometers of the Murray River. Appl. Environ. Microbiol. 2012, 78, 263–272. [Google Scholar] [CrossRef] [PubMed]
  28. Burford, M.A.; Davis, T.W.; Orr, P.T.; Sinha, R.; Willis, A.; Neilan, B.A. Nutrient-related changes in the toxicity of field blooms of the cyanobacterium, Cylindrospermopsis raciborskii. FEMS Microbiol. Ecol. 2014, 89, 135–148. [Google Scholar] [CrossRef] [PubMed]
  29. Zhang, W.; Lou, I.; Ung, W.K.; Kong, Y.; Mok, K.M. Analysis of cylindrospermopsin- and microcystin-producing genotypes and cyanotoxin concentrations in the Macau storage reservoir. Hydrobiologia 2014, 741, 51–68. [Google Scholar] [CrossRef]
  30. Lei, L.; Lei, M.; Cheng, N.; Chen, Z.; Xiao, L.; Han, B.-P.; Lin, Q. Nutrient Regulation of Relative Dominance of Cylindrospermopsin-Producing and Non-cylindrospermopsin-Producing Raphidiopsis raciborskii. Front. Microbiol. 2021, 12, 793544. [Google Scholar] [CrossRef]
  31. Huisman, J.; Codd, G.A.; Paerl, H.W.; Ibelings, B.W.; Verspagen, J.M.H.; Visser, P.M. Cyanobacterial blooms. Nat. Rev. Microbiol. 2018, 16, 471–483. [Google Scholar] [CrossRef] [PubMed]
  32. Thomas, M.K.; Litchman, E. Effects of temperature and nitrogen availability on the growth of invasive and native cyanobacteria. Hydrobiologia 2016, 763, 357–369. [Google Scholar] [CrossRef]
  33. Paerl, H.W.; Huisman, J. Blooms Like It Hot. Science 2008, 320, 57–58. [Google Scholar] [CrossRef]
  34. Sinha, R.; Pearson, L.A.; Davis, T.W.; Burford, M.A.; Orr, P.T.; Neilan, B.A. Increased incidence of Cylindrospermopsis raciborskii in temperate zones–Is climate change responsible? Water Res. 2012, 46, 1408–1419. [Google Scholar] [CrossRef]
  35. Dziallas, C.; Grossart, H.-P. Increasing Oxygen Radicals and Water Temperature Select for Toxic Microcystis sp. PLoS ONE 2011, 6, e25569. [Google Scholar] [CrossRef]
  36. Meng, H.; Guo, Y.; Zhang, L.; Qi, Y.; Liu, J.; He, H.; Wang, G.; Li, S.; Zhang, L. Effects of Elevated Overwinter Temperature on the Growth Strategies of Microcystis aeruginosa. Freshw. Biol. 2025, 70, e14370. [Google Scholar] [CrossRef]
  37. Li, X.; Tikhonova, I.V.; Potapov, S.A.; Krasnopeev, A.Y.; Zhuchenko, N.A.; Niao, X.; Wang, L.; Sorokovikova, E.G.; Wang, W.; Belykh, O.I. World’s largest oligotrophic Lake Baikal: Concerns about cyanobacterial blooms and potential microcystin producers along the littoral zone. Harmful Algae 2025, 144, 102841. [Google Scholar] [CrossRef] [PubMed]
  38. Wu, M.; Fan, L.; Wu, Y.; Q, W.; Shang, T.; Cheng, N.; Lei, L. Low dominance of toxic genotype within the Cylindrospermopsis raciborskii population and its affecting factors in tropical reservoirs of southern China a case study of Zhuhai city. Acta Hydrobiol. Sin. 2024, 48, 211–221. [Google Scholar]
  39. Briand, E.; Bormans, M.; Quiblier, C.; Salençon, M.-J.; Humbert, J.-F. Evidence of the Cost of the Production of Microcystins by Microcystis aeruginosa under Differing Light and Nitrate Environmental Conditions. PLoS ONE 2012, 7, e29981. [Google Scholar] [CrossRef]
  40. Rippka, R.; Deruelles, J.; Waterbury, J.B.; Herdman, M.; Stanier, R.Y. Generic assignments, strain histories and properties of pure cultures of cyanobacteria. Microbiology 1979, 111, 1–61. [Google Scholar] [CrossRef]
  41. Lei, L.; Lei, M.; Lu, Y.; Peng, L.; Han, B.-P. Development of real-time PCR for quantification of Cylindrospermopsis raciborskii cells and potential cylindrospermopsin-producing genotypes in subtropicalreservoirs of southern China. J. Appl. Phycol. 2019, 31, 3749–3758. [Google Scholar] [CrossRef]
  42. Lei, L.; Peng, L.; Yang, Y.; Han, B.-P. Development of Time-Resolved Fluoroimmunoassay for Detection of Cylindrospermopsin Using Its Novel Monoclonal Antibodies. Toxins 2018, 10, 255. [Google Scholar] [CrossRef]
  43. Orr, P.T.; Willis, A.; Burford, M.A. Application of first order rate kinetics to explain changes in bloom toxicity—The importance of understanding cell toxin quotas. J. Oceanol. Limnol. 2018, 36, 1063–1074. [Google Scholar] [CrossRef]
  44. Van de Waal, D.B.; Verspagen, J.M.H.; Finke, J.F.; Vournazou, V.; Immers, A.K.; Kardinaal, W.E.A.; Tonk, L.; Becker, S.; Van Donk, E. Reversal in competitive dominance of a toxic versus non-toxic cyanobacterium in response to rising CO2. ISME J. 2011, 5, 1438–1450. [Google Scholar] [CrossRef] [PubMed]
  45. Walls, J.T.; Wyatt, K.H.; Doll, J.C.; Rubenstein, E.M.; Rober, A.R. Hot and toxic: Temperature regulates microcystin release from cyanobacteria. Sci. Total Environ. 2018, 610–611, 786–795. [Google Scholar] [CrossRef]
  46. Godoy, R.F.B.; Trevisan, E.; Battistelli, A.A.; Crisigiovanni, E.L.; do Nascimento, E.A.; da Fonseca Machado, A.L. Does water temperature influence in microcystin production? A case study of Billings Reservoir, São Paulo, Brazil. J. Contam. Hydrol. 2023, 255, 104164. [Google Scholar]
  47. Briand, J.F.; Leboulanger, C.; Humbert, J.F.; Bernard, C.; Dufour, P. Cylindrospermopsis raciborskii (Cyanobacteria) invasion at mid-latitudes: Selection, wide physiological tolerance, or global warming? J. Phycol. 2004, 40, 231–238. [Google Scholar] [CrossRef]
  48. dos Santos Silva, R.D.; Chia, M.A.; Barbosa, V.V.; dos Santos Severiano, J.; de Lucena Barbosa, J.E. Synergistic effects of temperature and nutrients on growth and saxitoxin content of the cyanobacterium Raphidiopsis raciborskii. J. Appl. Phycol. 2022, 34, 941–952. [Google Scholar] [CrossRef]
  49. Recknagel, F.; Zohary, T.; Rücker, J.; Orr, P.T.; Branco, C.C.; Nixdorf, B. Causal relationships of Raphidiopsis (formerly Cylindrospermopsis) dynamics with water temperature and N:P-ratios: A meta-analysis across lakes with different climates based on inferential modelling. Harmful Algae 2019, 84, 222–232. [Google Scholar] [CrossRef]
  50. Willis, A.; Chuang, A.W.; Woodhouse, J.N.; Neilan, B.A.; Burford, M.A. Intraspecific variation in growth, morphology and toxin quotas for the cyanobacterium, Cylindrospermopsis raciborskii. Toxicon 2016, 119, 307–310. [Google Scholar] [CrossRef]
  51. Lu, Y.; Lei, M.; Ye, J.; Lei, L.; Han, B. Intraspecific variation of morphological traits and toxin-producing capacity and phylogenetic analysis for Cylindrospermopsis raciborskii from Qiandenghu Lake, Guangdong Province. J. Lake Sci. 2020, 32, 144–153. [Google Scholar]
  52. Yu, T.; Dai, J.; Lei, L.; Peng, L. Effects of temperature, irradiance and nitrate on the growth of Cylindrospermopsis raciborskii N8. J. Lake Sci. 2014, 26, 441–446. [Google Scholar]
  53. Bonilla, S.; Aubriot, L.; Soares, M.C.S.; González-Piana, M.; Fabre, A.; Huszar, V.L.M.; Lürling, M.; Antoniades, D.; Padisák, J.; Kruk, C. What drives the distribution of the bloom-forming cyanobacteria Planktothrix agardhii and Cylindrospermopsis raciborskii? FEMS Microbiol. Ecol. 2012, 79, 594–607. [Google Scholar] [CrossRef] [PubMed]
  54. Jia, N.; Wang, Y.; Guan, Y.; Chen, Y.; Li, R.; Yu, G. Occurrence of Raphidiopsis raciborskii blooms in cool waters: Synergistic effects of nitrogen availability and ecotypes with adaptation to low temperature. Environ. Pollut. 2021, 270, 116070. [Google Scholar] [CrossRef]
  55. Briand, E.; Yéprémian, C.; Humbert, J.F.; Quiblier, C. Competition between microcystin- and non-microcystin-producing Planktothrix agardhii (cyanobacteria) strains under different environmental conditions. Environ. Microbiol. 2008, 10, 3337–3348. [Google Scholar] [CrossRef]
  56. Giannuzzi, L. Cyanobacteria Growth Kinetics; IntechOpen: London, UK, 2019. [Google Scholar]
  57. Rzymski, P.; Poniedziałek, B. In search of environmental role of cylindrospermopsin: A review on global distribution and ecology of its producers. Water Res. 2014, 66, 320–337. [Google Scholar] [CrossRef]
  58. Holland, A.; Kinnear, S. Interpreting the possible ecological role(s) of cyanotoxins: Compounds for competitive advantage and/or physiological aide? Mar. Drugs 2013, 11, 2239–2258. [Google Scholar] [CrossRef]
  59. Rzymski, P.; Poniedziałek, B.; Kokociński, M.; Jurczak, T.; Lipski, D.; Wiktorowicz, K. Interspecific allelopathy in cyanobacteria: Cylindrospermopsin and Cylindrospermopsis raciborskii effect on the growth and metabolism of Microcystis aeruginosa. Harmful Algae 2014, 35, 1–8. [Google Scholar] [CrossRef]
  60. B-Béres, V.; Vasas, G.; Dobronoki, D.; Gonda, S.; Nagy, S.A.; Bácsi, I. Effects of Cylindrospermopsin Producing Cyanobacterium and Its Crude Extracts on a Benthic Green Alga—Competition or Allelopathy? Mar. Drugs 2015, 13, 6703–6722. [Google Scholar] [CrossRef]
  61. Pinheiro, C.; Azevedo, J.; Campos, A.; Loureiro, S.; Vasconcelos, V. Absence of negative allelopathic effects of cylindrospermopsin and microcystin-LR on selected marine and freshwater phytoplankton species. Hydrobiologia 2013, 705, 27–42. [Google Scholar] [CrossRef]
  62. Figueredo, C.C.; Giani, A.; Bird, D.F. Does allelopathy contribute to Cylindrospermopsis raciborskii (cyanobacteria) bloom occurrence and geographic expansion? J. Phycol. 2007, 43, 256–265. [Google Scholar] [CrossRef]
  63. Willis, A.; Adams, M.P.; Chuang, A.W.; Orr, P.T.; O’Brien, K.R.; Burford, M.A. Constitutive toxin production under various nitrogen and phosphorus regimes of three ecotypes of Cylindrospermopsis raciborskii ((Wołoszyńska) Seenayya et Subba Raju). Harmful Algae 2015, 47, 27–34. [Google Scholar] [CrossRef]
  64. Park, G.; Norton, L.; Avery, D.; Dam, H.G. Grazers modify the dinoflagellate relationship between toxin production and cell growth. Harmful Algae 2023, 126, 102439. [Google Scholar] [CrossRef]
  65. Chakraborty, S.; Pančić, M.; Andersen, K.H.; Kiørboe, T. The cost of toxin production in phytoplankton: The case of PST producing dinoflagellates. ISME J. 2018, 13, 64–75. [Google Scholar] [CrossRef]
  66. Lei, L.; Liu, W.; Chen, Z.; Peng, L.; Xiao, L.; Han, B.; Neilan, B.A. Grazer-induced toxin production is energetically costly and significantly reduces growth of cylindrospermopsin-producing cyanobacteria. Limnol. Oceanogr. 2024, 69, 2929–2940. [Google Scholar] [CrossRef]
  67. Cirés, S.; Wörmer, L.; Timón, J.; Wiedner, C.; Quesada, A. Cylindrospermopsin production and release by the potentially invasive cyanobacterium Aphanizomenon ovalisporum under temperature and light gradients. Harmful Algae 2011, 10, 668–675. [Google Scholar] [CrossRef]
  68. Saker, M.L.; Griffiths, D.J. The effect of temperature on growth and cylindrospermopsin content of seven isolates of Cylindrospermopsis raciborskii (Nostocales, Cyanophyceae) from water bodies in northern Australia. Phycologia 2000, 39, 349–354. [Google Scholar] [CrossRef]
  69. Rücker, J.; Stüken, A.; Nixdorf, B.; Fastner, J.; Chorus, I.; Wiedner, C. Concentrations of particulate and dissolved cylindrospermopsin in 21 Aphanizomenon-dominated temperate lakes. Toxicon 2007, 50, 800–809. [Google Scholar] [CrossRef]
  70. Wiedner, C.; Rücker, J.; Fastner, J.; Chorus, I.; Nixdorf, B. Seasonal dynamics of cylindrospermopsin and cyanobacteria in two German lakes. Toxicon 2008, 52, 677–686. [Google Scholar] [CrossRef]
  71. Pierangelini, M.; Sinha, R.; Willis, A.; Burford, M.A.; Orr, P.T.; Beardall, J.; Neilan, B.A. Constitutive Cylindrospermopsin Pool Size in Cylindrospermopsis raciborskii under Different Light and CO2 Partial Pressure Conditions. Appl. Environ. Microbiol. 2015, 81, 3069–3076. [Google Scholar] [CrossRef]
Figure 1. Specific growth rates of the four R. raciborskii strains at different temperatures. The different letters on the column indicate a significant difference (p < 0.05).
Diversity 17 00450 g001
Figure 2. Changes of total R. raciborskii cell numbers (rpoC1 copy numbers) and the proportion of toxic strains (cyrJ/rpoC1) in co-culture experiments at three temperatures; (a,c,e) shows data for CS506/CS510 co-culture experiments, whereas (b,d,f) shows data for QDH7/N8 co-culture experiments.
Diversity 17 00450 g002
Figure 3. Rate of competitive displacement (RCD) calculated from the exponential growth phase in co-culture experiments at three temperatures. (a) CS506/CS510 Australian strains, (b) QDH7/N8 Chinese strains.
Diversity 17 00450 g003
Figure 4. Changes of CYN concentration and cell quota of CYN (QCYN) in co-culture experiments at three temperatures. (a) CS506/CS510 Australian strains; (b) QDH7/N8 Chinese strains.
Diversity 17 00450 g004
Figure 5. The relationship between the toxin production rate (μTOX) and cell growth rate (μC) of R. raciborskii during co-culture. (a) CS506; (b) QDH7. Blue and yellow dots indicate the exponential growth and stable phases, respectively.
Diversity 17 00450 g005
Table 1. Primers and probe sequences used for real-time PCR.
GenePrimer and Probe NamesPrimer and Probe SequencesProduct Length
rpoC1CYL-F5′-CGGGTTCGTCATAGAGGTATTG-3′186 bp
CYL-R5′-GCTACAGGTGCTGCTAACTT-3′
CYL-P5′(FAM)-TAACAGAATCACGAGTTCGCCGCC-(BHQ1)3′
cyrJCyrJ-F5′-TGATTCGCCAACCCAAAGAA-3′165 bp
CyrJ-R5′-GATCGTTCAGCAAGTCGTGT-3′
CyrJ-P5′(FAM)-CGGAGTAATCCCGCCTGTCATAGATGC-(BHQ1)3′
Disclaimer/Publisher’s Note: The statements, opinions and data contained in all publications are solely those of the individual author(s) and contributor(s) and not of MDPI and/or the editor(s). MDPI and/or the editor(s) disclaim responsibility for any injury to people or property resulting from any ideas, methods, instructions or products referred to in the content.

