Article

Symmetric Responses to Diet by Plumage Carotenoids in Violet-Sensitive Piciform–Coraciiform Birds

by
Robert Bleiweiss
1,2,3
1
Department of Integrative Biology, University of Wisconsin, Madison, WI 53706, USA
2
UW Zoological Museum, University of Wisconsin, Madison, WI 53706, USA
3
División de Ornithología, Instituto Nacional de Biodiversidad-INABIO, Quito 170506, Ecuador
Diversity 2025, 17(6), 379; https://doi.org/10.3390/d17060379
Submission received: 23 February 2025 / Revised: 4 May 2025 / Accepted: 6 May 2025 / Published: 27 May 2025
(This article belongs to the Collection Feature Papers in Animal Diversity)

Abstract

:
Biological studies on symmetry can be expanded to consider red (longer wavelengths) and blue (shorter wavelengths) shifts as antisymmetries (opposite-pattern symmetries), which may arise from similar underlying causes (invariant process symmetries). In this context, classic shift asymmetries of redder plumage in response to higher dietary carotenoids appear conceptually incomplete, as potential blue-shifted counterparts were not considered. A latent symmetric response is highlighted by recent evidence showing that the maximum absorbance bands of various colorful plumage pigments are red-shifted in birds with ultraviolet-sensitive (UVS) color vision but blue-shifted in those with violet-sensitive (VS) color vision. Blue-shifted responses to increased dietary carotenoid contents may also be underestimated, as relevant studies have focused on species-rich but uniformly UVS Passerida passerines. This study explored the relationship between pattern–process symmetries and diets of VS Piciformes–Coraciiformes by gauging the responses of their plumage reflectance to a modified diet index (Dietc), where the overall rank carotenoid contents of food items were weight-averaged by three levels of importance in a species’ diet. In the case of both sexes, the main long-wavelength reflectance band for the three carotenoid-based pigment classes defined the same graded series of blue shifts in response to higher Dietc. Yellow showed a strong absolute (negative slope) blue shift, orange showed a weaker absolute blue shift, and red exhibited only a blue shift (flat, non-significant slope) relative to absolute red shifts (positive slope). The secondary shorter-wavelength reflectance band was also unresponsive to Dietc in the VS Piciformes–Coraciiformes (relative blue shift) compared with earlier evidence for it decreasing (absolute red shift) at higher Dietc in UVS species. Results for the intervening minimum reflectance (maximum absorbance) band were intermediate between those for the other reflectance bands. No pigment class monopolized lower or higher Dietc, but red was less variable overall. Phylogenetic independence, sexually similar responses, and specimen preservation reinforced characterizations. A review of avian perceptual studies suggested that VS models discriminate yellows and oranges extremely well, consistent with the importance of the corresponding carotenoids as Dietc indicators. Both UVS and VS species appear to produce putatively more costly and possibly beneficial carotenoid metabolites and/or concentrations in response to higher Dietc, supporting underlying invariant processes in relation to carotenoid limitations and honest signaling despite opposite plumage shifts and their different chemical bases. In symmetry parlance, pigment classes (red) or wavebands (short) that lack responses to Dietc suggest broken pattern and process symmetry. The biology of VS Piciformes–Coraciiformes may favor such exceptions owing to selection for visual resemblance and tuning specializations, although universal constraints on physical and chemical properties of (particularly red) carotenoids may favor certain functional tendencies. Thus, symmetry principles organize carotenoid diversity into a simplified and predictive framework linked to color vision.

Graphical Abstract

1. Introduction

Organic symmetry implies a wide range of evolutionary phenomena, including patterns of phylogenetic relationships [1,2], progressive change [3,4], co-adaptation of form and function [5], developmental canalization [6], esthetic preferences [7,8], and missing phenomena for apparent asymmetries [9,10]. Despite this rich potential, most evolutionary applications of symmetry consider only structural morphology in terms of body shapes, i.e., bilateral (vertebrates), radial (anthozoans), pentameral (echinoderms), or other geometric forms (Figure 1A,B). However, symmetry concepts can be abstracted into various contexts. Thus, symmetry can also be applied to the physical geometry of any form that can be divided into a scheme of similar pieces. In this case, symmetry is still demonstrated if the form retains its overall shape despite transformations that move around the individual pieces. The specific symmetry then depends on piecemeal organization and transformation, which can include one (reflection, rotation, scaling, or translation) or more (glide reflection) operations [11,12]. For example, in simple line or reflection symmetries, features retain their inter-relationships when flipped across a dividing line or axis (Figure 1C). This more formal type of symmetry can be further expanded to include operations that reverse the form or function, referred to as antisymmetry (Figure 1D–F). Such considerations reveal that symmetry concepts can be applied to any situation wherein the underlying phenomena are preserved, despite arbitrary quantitative transformations. For this reason, symmetry has been generalized to mean invariance under any transformation, which can apply just as well to a process as to a pattern [13]. Moreover, disruptions to these relationships can be viewed as broken symmetries of the corresponding cases [10]. Therefore, generalized symmetry concepts appear fundamental to the study of ecology and evolution, as they provide simplified and predictive frameworks that can help distinguish general phenomena amidst the diversity of nature.
In this regard, an expanded conception of symmetries may be an underappreciated aspect of the exceptional diversity in organismal colorations and their physical bases (wavelengths). In addition to more typical color symmetries associated with body form, color antisymmetries incorporate the reversal of wavelengths by which long (“red”) ones are interchanged with short (“blue”) ones [14]. These reversals are dichromatic if only two colors or wavelengths are involved, or polychromatic if many are involved, as in a gradient (Figure 1E,F). It is therefore noteworthy that animals that manipulate carotenoid pigments as plumage colorants appear to favor visible red shifts in response to an increased uptake of carotenoids in their diet, which is the ultimate source of these epidermal biochromes in virtually all animals [15]. Thus, numerous asymmetric red shifts (to longer wavelengths), but no comparable blue shifts (to shorter wavelengths), have been documented within and among individuals or species that ingest greater quantities of these human-perceived yellow, orange, and red pigments in their diets [16,17,18,19,20,21,22,23]. Although perceptions of light are subjective, red shifts have an objective physical basis because of the association between perceived carotenoid yellowness and redness with distinct absorbance and reflectance properties [24,25,26]. These dietary red shifts also transcend pigmentation details—being expressed by a yellower (shorter wavelength) pigment class at lower to a redder (longer wavelength) pigment class at higher dietary carotenoid levels [16,21]—by a single pigment class (e.g., concentrations of yellow, orange, or red) across dietary carotenoid levels [16,17,20,27,28,29], through various mechanisms influencing feather characteristics, such as thickness, nanostructures, and pigment × protein interactions alone or in combination [20,21,22,30,31], and by patches or plumages [20,21]. Thus, plumage red shifts appear to be general physical phenomena not associated with any particular divergence level, chemistry, or anatomy, suggesting their pertinence to general patterns and processes. These shifts are of fundamental biological importance, as animals appear to have exploited connections between ecology and red shifts to provide visual information regarding the underlying qualities that affect individual survival and reproduction related to foraging, health, and fitness costs and benefits of carotenoid use [18,32,33,34,35]. Despite intensive studies, current asymmetries in carotenoid-based plumage expression require further exploration to determine if they are part of even broader symmetries.
A latent capacity for carotenoid-related blue shifts as opposed to red shifts and insights into how they may arise are suggested by subtle differences in plumage carotenoids between birds with ultraviolet-sensitive (UVS) or violet-sensitive (VS) tetrachromatic color vision systems [36,37]. Many diurnal birds with either of these main color vision systems develop various yellow-, orange-, and red-carotenoid-based plumages. However, a relation between plumage and visual pigment characteristics is suggested by an alignment between the maximal absorption wavebands of plumage carotenoids and those of the V and S single-cones distinguishing the color vision systems (350–500 nm) in the four-cone array (λ of maximum sensitivity ranked VViolet < SShort < MMedium < LLong). This connection appears to be borne out by evidence that the average spectral location of plumage carotenoid absorption maxima (i.e., of reflectance minima, λRmin) occurs at longer wavelengths for UVS Passeriformes [21,38] and Trogoniformes [26] compared with VS Piciformes and Coraciiformes [26]. Notably, the average spectral locations of λRmin are extremely similar between carotenoids in VS Piciformes–Coraciiformes and colorful plumage porphyrins unique to VS non-passerines (Galliformes, Musophagiformes, and Charadriiformes) [39]. Thus, λRmin values for colored plumage pigments appear relatively “red-shifted” (to longer wavelengths) for UVS and relatively “blue-shifted” (to shorter wavelengths) for VS. The quantitative alignments of the λRmin of plumage carotenoids and porphyrins with diagnostic V and S single-cone maximum sensitivity values in each color vision system suggest that concerted UVS-red versus VS-blue shifts in λRmin have some relationship with the key differences between visual systems [26,38,39]. These various shifts and alignments could relate to signaling as λRmin integrates many informational pigment properties, including their chemistry, optical density, and dietary or metabolic origin. The possible salience of wavelength-based shifts described for λRmin seems less intuitive than that of those described for reflectance maxima. Nevertheless, pigments create color via selective wavelength subtraction (absorption) from the white light spectrum [24]. Hence, absorption and reflection are complementary phenomena in pigment-based color mechanisms.
Considering these patterns, sampling bias could explain the apparent asymmetry in shift patterns if the red-biased UVS system is the only one considered. This explanation is plausible, as relevant studies have focused mainly on the extraordinarily diverse Passerida passerine clade [25,40,41], whose members appear exclusively UVS [42,43,44]. To broaden the exploration of wavelength-based shifts in carotenoid-based plumage evolution, this study analyzes carotenoid-based plumage shift patterns in relation to dietary carotenoid composition in VS Piciformes–Coraciiformes with the physical blue shift in average λRmin described above. This species-rich assemblage, which includes woodpeckers, barbets, toucans, and bee-eaters, provides several advantages for examining plumage-shift dynamics. First, many members of the VS Piciformes–Coraciiformes orders have developed spectacular carotenoid-based plumages comparable to or rivaling those of many UVS groups [45,46,47,48]. Second, the VS piciform–coraciiform group is minimally paraphyletic in that only a single derived, depauperate, and carotenoid-lacking lineage (Momotidae) has evolved the UVS characteristic within this radiation [37,49,50], providing a practical way to define the study system [26]. Third, the VS Piciformes–Coraciiformes have undergone dramatic diversification in their diets, covering the gamut of carotenoid contents in avian foods [51,52,53,54,55]. Finally, a large body of evidence from wild [56,57] and captive [58,59,60,61] VS Piciformes–Coraciiformes strongly suggests that their carotenoid-based plumages are highly sensitive to dietary changes. Therefore, morphological, historical, ecological, and physiological factors appear to favor a response of carotenoid-based plumages to diet among VS Piciformes–Coraciiformes.
I evaluated carotenoid-based plumage responses to diet by VS Piciformes–Coraciiformes by analyzing carotenoid pigment classes and their key spectral features in the visible range of diurnal birds. These attributes were treated as standardized physical measures of fundamental traits potentially related to shift patterns that could be compared across taxa and used to diagnose physical and chemical processes that underlie plumage information content. Subjective visual models are not applied because of the paucity of realistic parameter values and categorical color spaces assigned for Piciformes–Coraciiformes [62]. Relevant to the physical approach of evaluating dietary responses in relation to color vision, contour plumage carotenoids of UVS birds actually respond to higher dietary carotenoids with three forms of red shift. More intuitively, the characteristic main reflectance band shifts to longer wavelengths as dietary carotenoid amounts increase [16,17,20,28,63,64]. Less intuitively, the prominence of a characteristic secondary reflectance band at shorter wavelengths diminishes greatly as dietary carotenoid amounts increase [20,21,22], reinforcing the parallel long-wavelength bias of the main reflectance band [22]. Both of these responses are related to λRmin, which marks the boundary between the main (at its short-wavelength end) and secondary (at its long-wavelength end) reflectance bands. Consequently, λRmin can also be red-shifted at relatively high dietary carotenoid levels [21]. Thus, wavelength-based reflectance enables shift patterns (wavelength compositions as longer = “redder” or shorter = “bluer”) and processes (chemistry, cost, and benefits) for these spectral components to be compared objectively on the same scale across studies, physical components, and color vision systems. Therefore, the aims of this study are twofold: (1) to assess shift pattern symmetries in functional responses to dietary carotenoid contents across pigment classes and spectral features as related to the color vision system; (2) to explore internal evidence that shift process symmetries in carotenoid limitations, honest signaling, and other factors may underlie these patterns. The results support the importance of the symmetry principles in plumage carotenoids, similar to other photonic systems.

2. Materials and Methods

2.1. Data Collection

Plumage Carotenoids. Analyses were limited to piciform and coraciiform taxa with known (VS) color visual systems at the species to family level [26], and plumage patches colored predominantly by carotenoid pigments (e.g., no carotenoid–melanin mixes), as determined by their visual appearance and electronic spectra [21,26,38,46,47,65,66]. A gonadal definition of sex implied by specimen label data was applied in accordance with best ornithology practices. The species and adult specimens analyzed by sex in this study are listed in Table S1. All VS specimens were used in previous studies [26], except that another female Northern Flicker (Colaptes auratus; Picidae) was added for the red cockade. Chemically based (as opposed to physically based) [67,68] carotenoid pigmentation encompassed colors that humans perceive from yellow to orange to red (Figure 2), although objective groupings corresponding to these perceived categories are evident from the electronic spectra [26]. Additional sampling criteria applied to the specimens, patches, and spectra have been described previously [26].
Spectral Features. Raw plumage reflectance data generated during an earlier study on plumage maximum absorbance (λRmin) in VS Piciformes–Coraciiformes [26] were further analyzed. The nanometer range analyzed here encompasses the lower (320 nm) and upper (700 nm) general physical limits for avian VS wavelength sensitivities based on V (sensitivity to shortest wavelengths) and L (sensitivity to longest wavelengths) single-cone responses [36] and ocular medium transmission [69]. In addition, alignments of the four avian single-cone (V, S, M, and L) maximum sensitivity values with physical features of these spectra provided insights into shift patterns and processes for each avian color vision system [26].
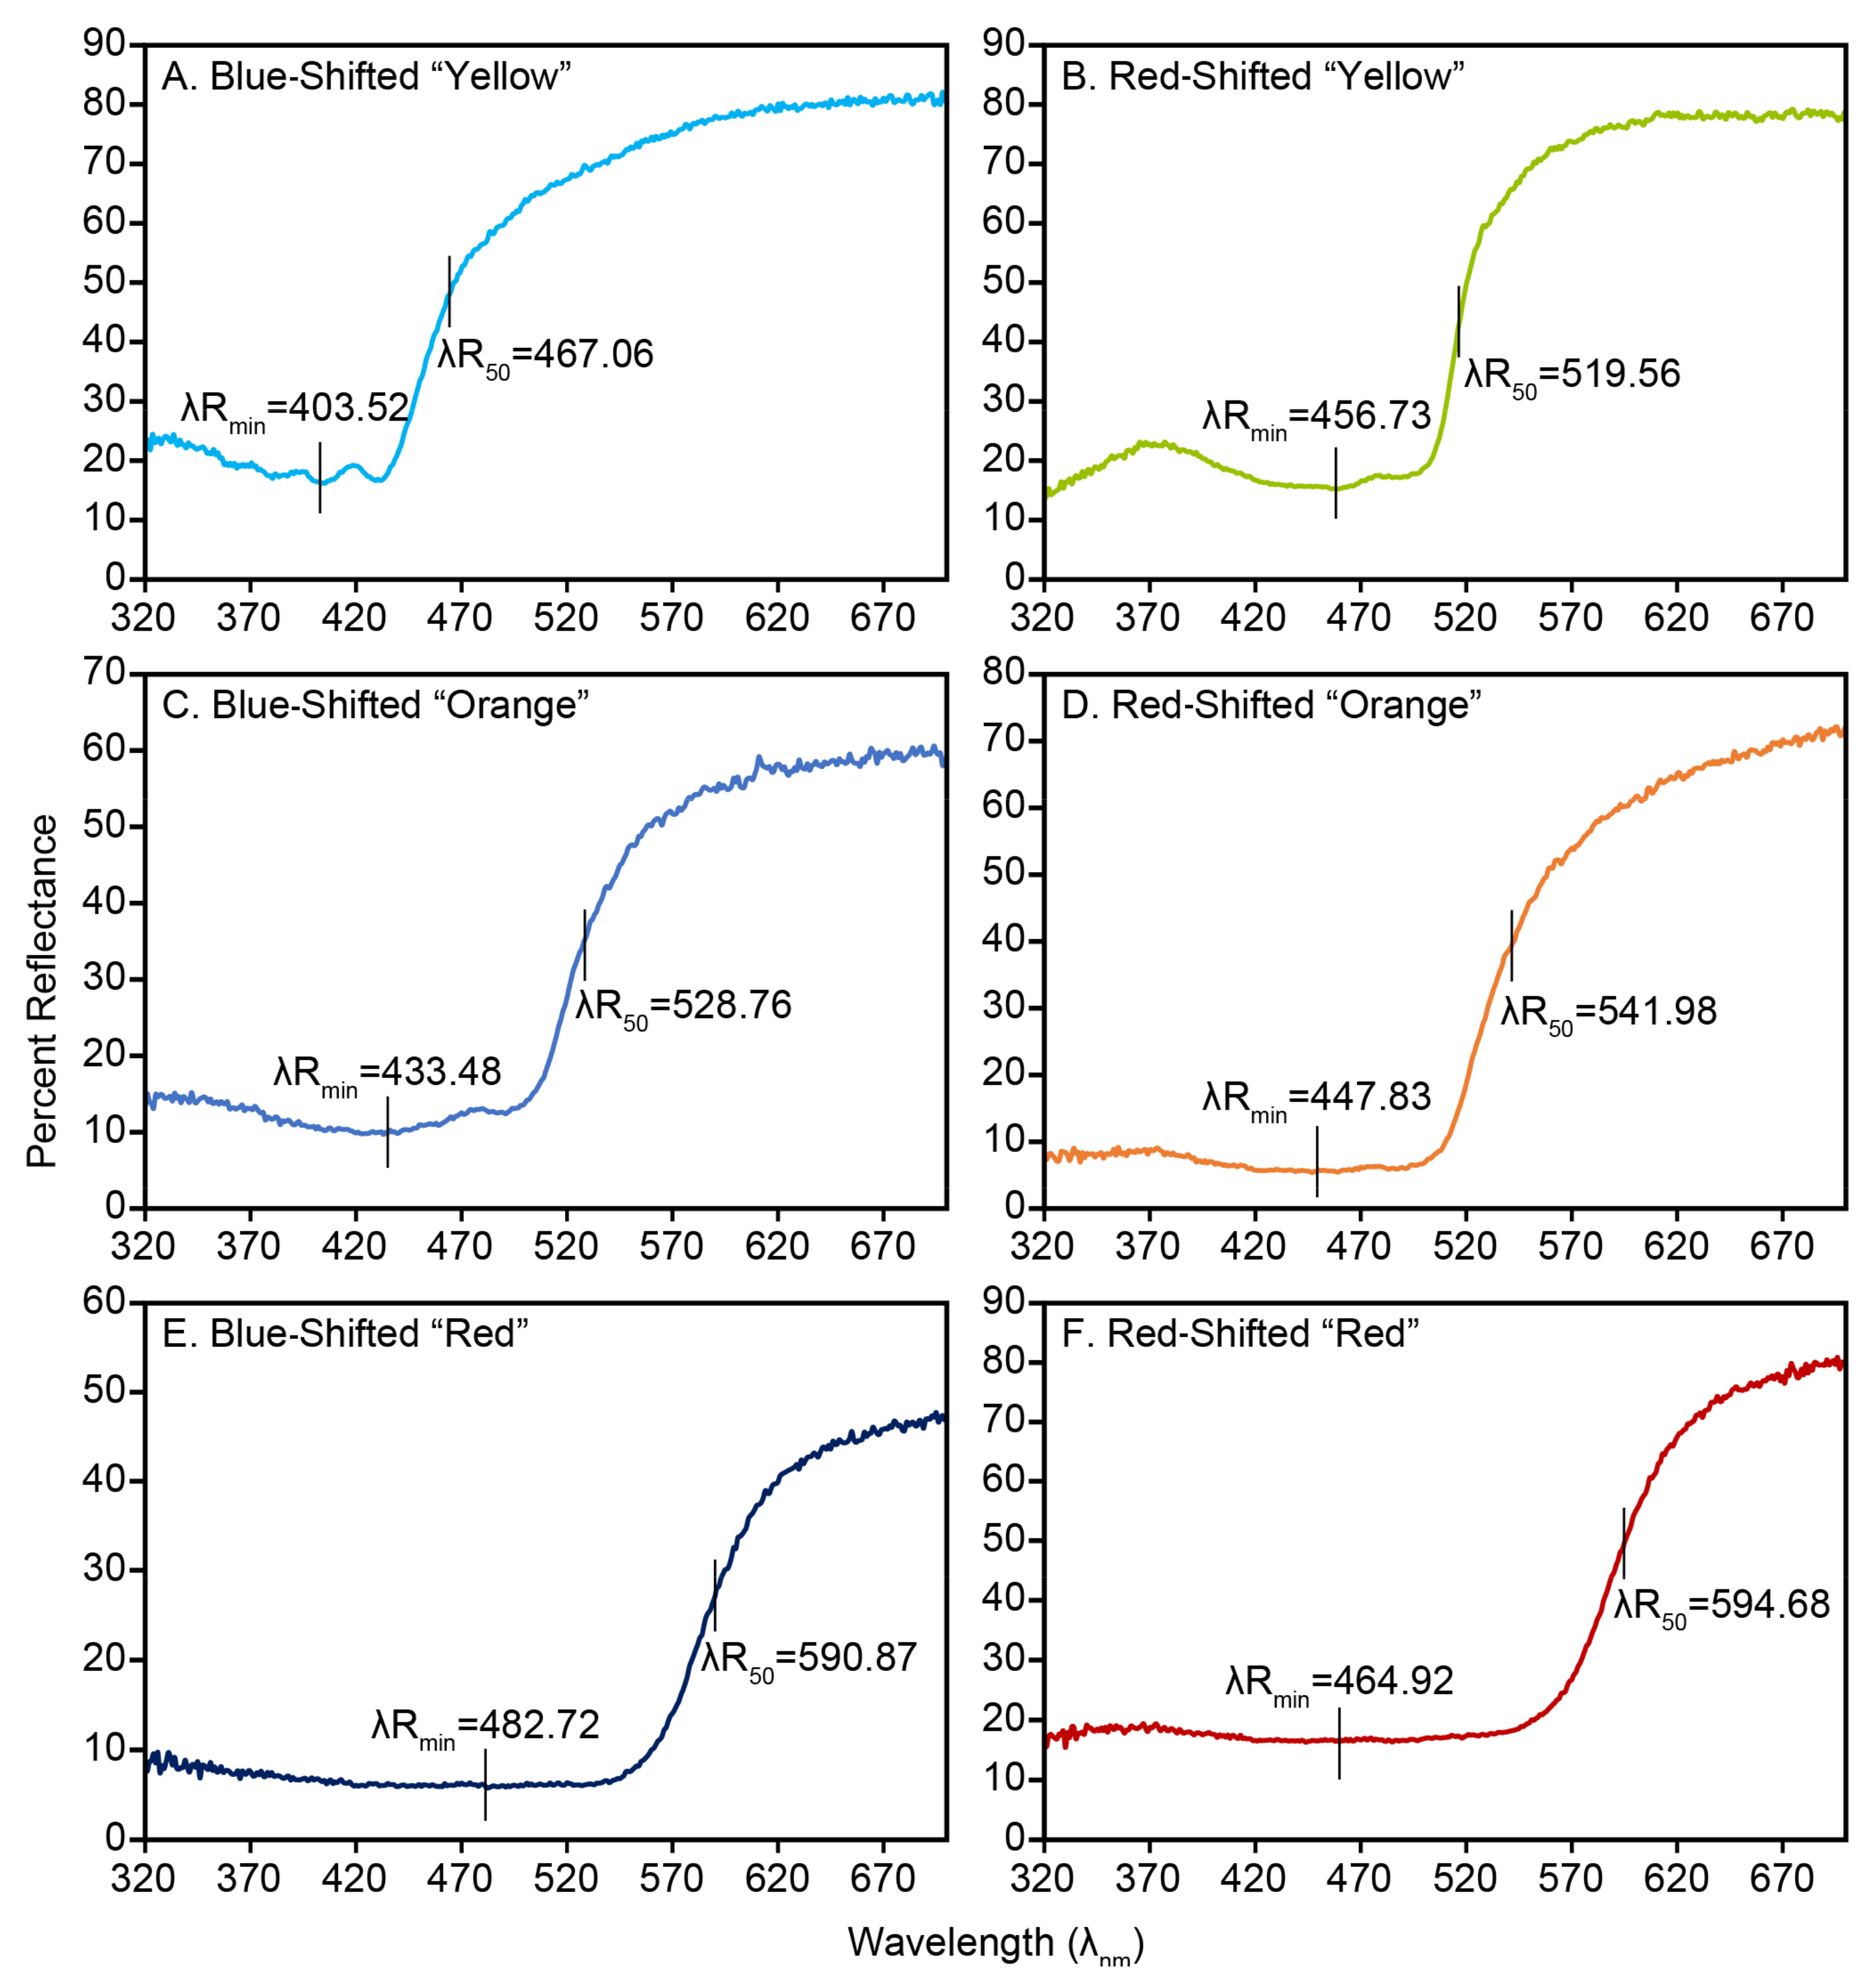
Principal shift patterns in plumage carotenoid spectra were embodied by both their main and secondary reflectance bands (Figure 3), of which only the former band occurred entirely above the normal lower limit of the human visible range (>400 nm). However, all carotenoid pigments act as optical cutoff filters that strongly absorb light only below a certain wavelength range [26]. As such and by convention [22,25], the spectral location of the main reflectance band was identified with that of the cutoff feature, a rapid transition from the highest (Rmax) to the lowest (Rmin) reflectance at longer and intermediate wavelengths, respectively, summarized as the wavelength of half-maximal reflectance using Equation (1) as follows:
λR50 = λ[(Rmax + Rmin)/2],
where the average of the maximum (Rmax) and minimum (Rmin) reflectance (Figure 3) provides the reflectance value from which to obtain the spectral location of the cutoff feature [21,22,70].
Two related shorter-wavelength spectral features typical of carotenoids were also assessed to test the predictions for short wavelengths and consider the consistency of shift patterns across the avian VS-visible spectrum. The wavelength of Rmin (λRmin) was the nadir of the strongest relevant absorption band and a characteristic feature of all carotenoids. The values of λRmin were located well below (usually between 400 and 500 nm) the longer-wavelength values for λR50 (Figure 3) and, therefore, embodied distinct shorter-wavelength features. In addition, the secondary reflectance band located at even shorter wavelengths rose below λRmin and then tapered off at the limits of avian visual perception, well into the ultraviolet (≤400 nm) wavelengths (Figure 3). To quantify this feature while controlling for the levels of overall reflectance, the relative amount of short-wavelength reflectance was estimated using Equation (2) as follows [21,70]:
Rcontrast = [(RλRmin–700) − (R320–λRmin)]/(R320–700).
Based on this equation, Rcontrast increased with a greater proportion of longer wavelengths and decreased with a greater proportion of shorter wavelengths (Figure 3).
Pigment Classes. The reflectance and (inverse) absorbance data were used to classify plumage patches into chemical classes based on diagnostic absorption features [26,39]. Typical yellow carotenoids exhibit a narrow cluster of absorption bands at relatively short wavelengths (Figure 3A,B), whereas typical red carotenoids exhibit a single broad absorption band at relatively long wavelengths (Figure 3E,F). These properties of yellow and red carotenoids depend on the extent of electronic conjugation, a system of resonating double bonds, in their hydrocarbon backbones. The classification of patches into those with predominantly yellow or red pigments (“pigment classes”), therefore, has objective validity at both the physical (spectral form) and chemical (molecular form) levels even if human color names are applied.
The same holds for relatively rare, visibly “orange” (described as such in the literature) plumages, which exhibited characteristics between those of yellow and red plumages (Figure 3C,D). The shortest λR50 obtained for these orange plumages was approximately 530 nm (males: 530.675 nm; females: 531.2 nm), and the longest λR50 did not exceed 555 nm (males: 552.895 nm; females: 540.245 nm). Moreover, these ranges were contiguous but non-overlapping at their short ends with the longest yellows, and widely separated at their long ends from the shortest reds (males: 575.517 nm; females: 568.745 nm). Orange pigmentation may arise from concentrated yellow, a mixture of yellow and red, or inherently orange carotenoids [71,72,73]. Taken together, these considerations support orange as an intermediate third category, indicating that it is closer to yellow than to red, but that its physical and chemical composition may combine aspects of the other two pigment class categories. Therefore, an orange pigment class was distinguished for shift pattern analysis.
Dietary Carotenoid Contents. Dietary carotenoid content for all species included in this study was estimated from publicly available data. The online version of the Birds of the World database was used to inventory diets [53,54,74]. Using the same source for each species aids in standardizing diet contents by limiting variation in how diets are reported and described. Dietary carotenoid content was calculated in several steps based on the considerations described earlier [75]. First, each item was placed into one of 32 ranked content categories based on carotenoid concentrations from lowest (1) to highest (32), which differed by several orders of magnitude in mg/kg (Table 1 in [75]; Table S2). Additional items consumed by Piciformes–Coraciiformes but not enumerated earlier [75] (bold items in Table S2) were added to the appropriate content category based on concentration values provided in the literature (Table S2). Each item was then assigned to one among the predominant (1°), secondary (2°), or tertiary (3°) importance categories of the diet based on adjectives (rarely percentages) used to describe how often the item was consumed by a species (Table 3 in [75]). Finally, the dietary carotenoid content index (hereafter Dietc) was calculated as a weighted average of the average ranked carotenoid contents of dietary items in each importance category, a modification avoiding bias caused by the number of items reported in each category, using Equation (3) as follows:
Dietc = [3(1°AveRankContent) + 2(2°AveRankContent) + 1(3°AveRankContent)]/(Sum of Weights).
In this equation, the terms include the average rank carotenoid contents (AveRankContent) of items within each importance category (importance ordered 1° > 2° > 3°) weighted based on the importance category (3 × 1°, 2 × 2°, and 1 × 3°; 0 = item not consumed). The calculated Sum of Weights for diets with all three importance categories was six, which was reduced for diets with fewer importance categories (e.g., five for 1° and 2°, four for 1° and 3°, and three for 1° only). A rank/importance approach provided a robust continuous scale from carotenoid-poor (generally more animal-based) to carotenoid-rich (generally more plant-based) diets (Table S2), lending itself to the quantitative evaluation of wavelength-based shift patterns in relation to diets. Only adult diets were analyzed because of the consistent bias towards more animal foods in nestling diets and the unavailability of plumage measurements for nestlings. Sex differences in diet were not distinguished because of the lack of available information.

2.2. Statistical Treatments

Data Treatments. All measured patches were contour feathers, with one exception (i.e., flight feathers of Colaptes auratus); therefore, feather type was not distinguished. Each plumage data point used in the analysis was the average of (2–4) replicate scans per patch × number of patches × carotenoid pigment class × sex of each species [26]. The final dataset included information on a maximum of 54 species, although the females of a few species lacked plumage carotenoids. However, the sample sizes analyzed for each sex were greater than the number of species because patches that differed in the predominant pigment class were averaged separately, producing up to three data points × sex for the species in question. As the data used to determine Dietc did not distinguish between male and female food preferences, only the plumage spectral features could be estimated separately for each sex within a species. However, the exact combination of species and plumages also differed for each sex (see Figures S1 and S2), providing additional independence in their estimated responses to Dietc. These considerations are implicit in the following analyses.
Multiple Regression Models. Multiple regressions exploring functional responses of the three spectral features (λR50, Rcontrast, and λRmin) were constructed to include two dummy variables to encode the three pigment classes, and the continuous covariate Dietc (Table 1). The variable Year (specimen collection year) was also included to control for possible post-mortem changes that often occur in carotenoid-based coloration [21,76,77]. Exploratory models indicated that multiplicative terms (Year × Year, Year × Dietc, and Dietc × Dietc) and their interactions made small and non-significant contributions. Therefore, only full models that included all main effect terms and their interactions (see Table 1) were systematically explored.
Table 1. Definitions of independent variables used in multiple regression analyses.
Interpretation of Independent Variables
Model Independent Variables aDescriptionProperty
Year bSpecimen collection yearContinuous
YO c,dDummyYellowOrangeCategorical
YR c,dDummyYellowRedCategorical
Dietc d,eDietc (ReferenceCategory)Continuous
YYearOYear fYellowYear × OrangeYearInteraction
YYearRYearYellowYear × RedYearInteraction
YDietcODietc fYellowDietc × OrangeDietcInteraction
YDietcRDietcYellowDietc × RedDietcInteraction
a Specimen collection year averaged for more than one specimen × sex × species. b Model: dependent variables used are λR50, Rcontrast, and λRmin (spectral features; see Section 2). c Pigment class categories: Y = Yellow, O = Orange, and R = Red. The leading term is the Reference Category for the pigment classes, Yellow (Y) in this case. d If Yellow is the Reference Category, then dummy variables used for the Reference Category (0, 0), dummy variables used for Yellow versus Orange (0, 1), and dummy variables used for Red versus Yellow (1, 0) jointly encode the three pigment classes. e The regression coefficient for Dietc is the functional response by Reference Category pigment class to Dietc. f Interaction (×) tests the differences in functional responses to Year or Dietc based on Reference (Y) compared with that in the other pigment class category in that interaction term.
The functional response coefficient (slope B) of the dependent variable to Dietc for each pigment class was estimated by decomposing the individual terms in the full model. Absent interaction terms, the Dietc coefficient can be interpreted as the common slope across dummy variable categories [78]. However, Dietc coefficients for each pigment class can be determined by including interaction terms based on the conditional interpretation of the coefficients for Dietc and the interaction terms [79,80,81]. With the interaction terms (Table 1), the Dietc coefficient and its significance pertain to the slope only for the pigment class designated as the Reference Category (the pigment class coded 0, 0 across both dummy variables). The Dietc coefficients for the Non-Reference Categories (each of the other pigment classes) are then obtained by adding the coefficient for the Reference Category to that of the appropriate two-pigment interaction term in turn (“probing”). Designating Yellow as the (0, 0 dummy coded) Reference Category, for example, yields BYellow = BDietc, BOrange = BDietc + BYellowDietcXOrangeDietc, and BRed = BDietc + BYellowDietcXRedDietc. The magnitudes of the slope differences in the dependent variable response to Dietc by pigment class were then determined in the usual way through the significance of the coefficients for the corresponding interaction terms.
Changing the Reference Category for pigment class allows the same information to be obtained for that class in a similar manner. Specification of the Reference Category does not otherwise affect the overall model fit for a given analytical method or coefficient estimates for the functional response of each pigment class to Dietc. Accordingly, it is equally valid to use any pigment class as a Reference Category, with the qualification that a relatively small sample size will reduce the power to detect statistically significant interactions [82]. This consideration is applied here, particularly to orange as the Reference Category (Nmale = 6, Nfemale = 10). However, coefficients calculated in this way are also heuristic for non-significant (p > 0.05) interactions [82].
Comparative Evolutionary Models. To explore the robustness of associations between carotenoid pigment class (yellow, orange, and red), plumage spectral features (λR50, Rcontrast, and λRmin), and dietary carotenoid content (Dietc), a variety of comparative evolutionary regression models were implemented in the R software environment version 3.6.1 [83] using “ape” version 5.3 [84] and “nlme” version 3.1.141 [85] and linked packages. These models included one based on a conventional ordinary least squares (OLS) approach (equivalent to star phylogeny, which lacks historical constraints based on relatedness) and others based on phylogenetic generalized least squares (PGLS) regression, which incorporates explicit phylogenetic structure. The OLS approach does not consider non-independence among species owing to their shared history, whereas the PGLS approach does so by estimating the phylogenetic signal in the response variable, as expressed by any non-independence in the correlation structure among the regression residuals.
The phylogenetic trees used in the PGLS models (Figures S1 and S2) were based on those assembled for an earlier analysis of plumage carotenoid absorption patterns in the same piciform–coraciiform taxa [26], except that relationships among woodpeckers were updated [86] in Mesquite (version 3.04) [87]. The phylogeny was based on several sources and data types, including traditional taxonomy, and statistical models required the assignment of branch lengths to multiple pigment classes within a species’ sex. Accordingly, results for branch lengths assigned unit or ultrametric (arbitrarily ultrametric) values (Mesquite 3.02) [87] were explored. The consensus user tree containing all taxa was strictly dichotomous, except for two instances in which the occurrence of patches for all three pigment classes was modeled as a trichotomy for that species and sex. Male and female trees differed slightly because of some differences in carotenoid-based coloration between the sexes (Figures S1 and S2). Owing to tree variations, males and females were analyzed separately to assess sexual dimorphism in functional responses to Dietc (see also Dietary Carotenoid Content).
The specific correlation structures for the PGLS models were based on Brownian motion under Ornstein–Uhlenbeck processes (OU, corMartins) or Grafen’s method (BMGrafen, corGrafen). These models further aid in the interpretation of evolutionary process, although the values for the additional parameters are specific to each model. The constrained random walk model under an OU process includes α, which measures the strength of the evolutionary force that returns traits to the long-term mean μ. When α approaches 10, phylogenetic constraint is considered small and approximates the “white noise” of a star phylogeny, in which all taxa are equally related and evolve independently. By comparison, α’s that approach 0 are consistent with a Brownian process of phylogenetic constraint and the less parsimonious OU process can be rejected [88]. More objective support for either interpretation can be obtained by converting α to the phylogenetic half-life using Equation (4) as follows:
t1/2 = (ln(2))/α,
which measures the time required for a niche-shifted species to evolve to its new optimum in comparison to the overall tree height (11 in all cases), such that relatively small values of t1/2 imply weak constraints and vice versa. The modified Brownian motion model of Grafen estimates branch lengths through a different process, embodied by ρ [89]. A ρ < 1.0 indicates compression of internodes to the base of the tree, suggesting reduced phylogenetic signal and an approach to a star-type phylogeny. Conversely, a larger ρ indicates a more structured phylogeny in which internodes are more spaced out from the root of the tree to its tips. I explored three values for ρ, including (BMGrafenF) ρ = 1.0 (the unit or ultrametric branch length starter trees), ρ = 0.5 (modest compression of internodes), and (BMGrafenE) ρ = estimated (empirically determined from the data). The implementation of all models assumed uniform evolutionary rates and a single trait optimum (OU), which were the default options. Alternatively, multiple-trait optima explored using Bayesian approaches require large sample sizes and the selection of appropriate priors a posteriori (dependent on this study).
Statistics for Model Selection. The main advantage of evaluating a suite of process models is that it allows interpretations of functional relationships based on best-fit criteria. Corresponding multiple regressions across evolutionary models were ranked by ln maximum likelihood support (more positive) estimated in ape for each model. The significance of differences in support was assessed using likelihood-ratio tests (LRTs) not available for the related Akaike information criterion. However, a caveat to the LRT approach is that simulation studies [88] suggest that these tests may incorrectly favor OU over BM models because of the formal properties of the data and the violation of LRT assumptions (which are based on an unbounded χ2 distribution with one degree of freedom) by the bounded parameter values of OU models, particularly with small sample sizes (<200, as here). Mistakes in model selection and subsequent interpretations based on fit alone can be further avoided by considering the values of the parameters estimated for the PGLS models (see above) [88]. Additional support was assessed by adjusted R2 calculated from R2lik generated in the R package “rr2” version 1.0.2 [90,91,92].
Sex was characterized separately using identical methods. Analyses focused on functional responses (slopes) of spectral features to the covariate Dietc and on probing related interactions of Dietc with pigment class, which are unaffected by the choice of the y-intercept (x = 0, no mean centering or other transforms) [93]. The regression coefficients were unstandardized effect sizes (B) comparable across structurally parallel models for variables in the same original units. Multicollinearities assessed by the variance inflation factor estimated with the R package “car” version 3.0.13 [94] for continuous control (Year) or covariate (Dietc) predictors were within acceptable (<3) limits, and inconsequential for dummy-variable interactions with continuous predictors [82,95]. The degrees of freedom were not adjusted for the two (yellow, orange, and red) trichotomies in the tree, which slightly increased Type I errors [96]. However, the nearly identical results for OLS and PGLS indicate that this modification has little impact on the results or conclusions. Two-tailed tests are mainly reported throughout, but these can be readily converted (P/2) to one-tailed tests for directional predictions in relation to an expected red or blue shift (e.g., effects of Dietc) based on prior results (see Section 1) [26]. No adjustments were made for multiple comparisons [97]. Additional data processing and statistics were implemented in SAS (version 9.4) [98], Microsoft® Excel for Mac version 16.16.27, or Social Science Statistics http://www.socscistatistics.com/ (accessed on 9 October 2023) [99].

3. Results

3.1. Dynamic Responses to Dietc

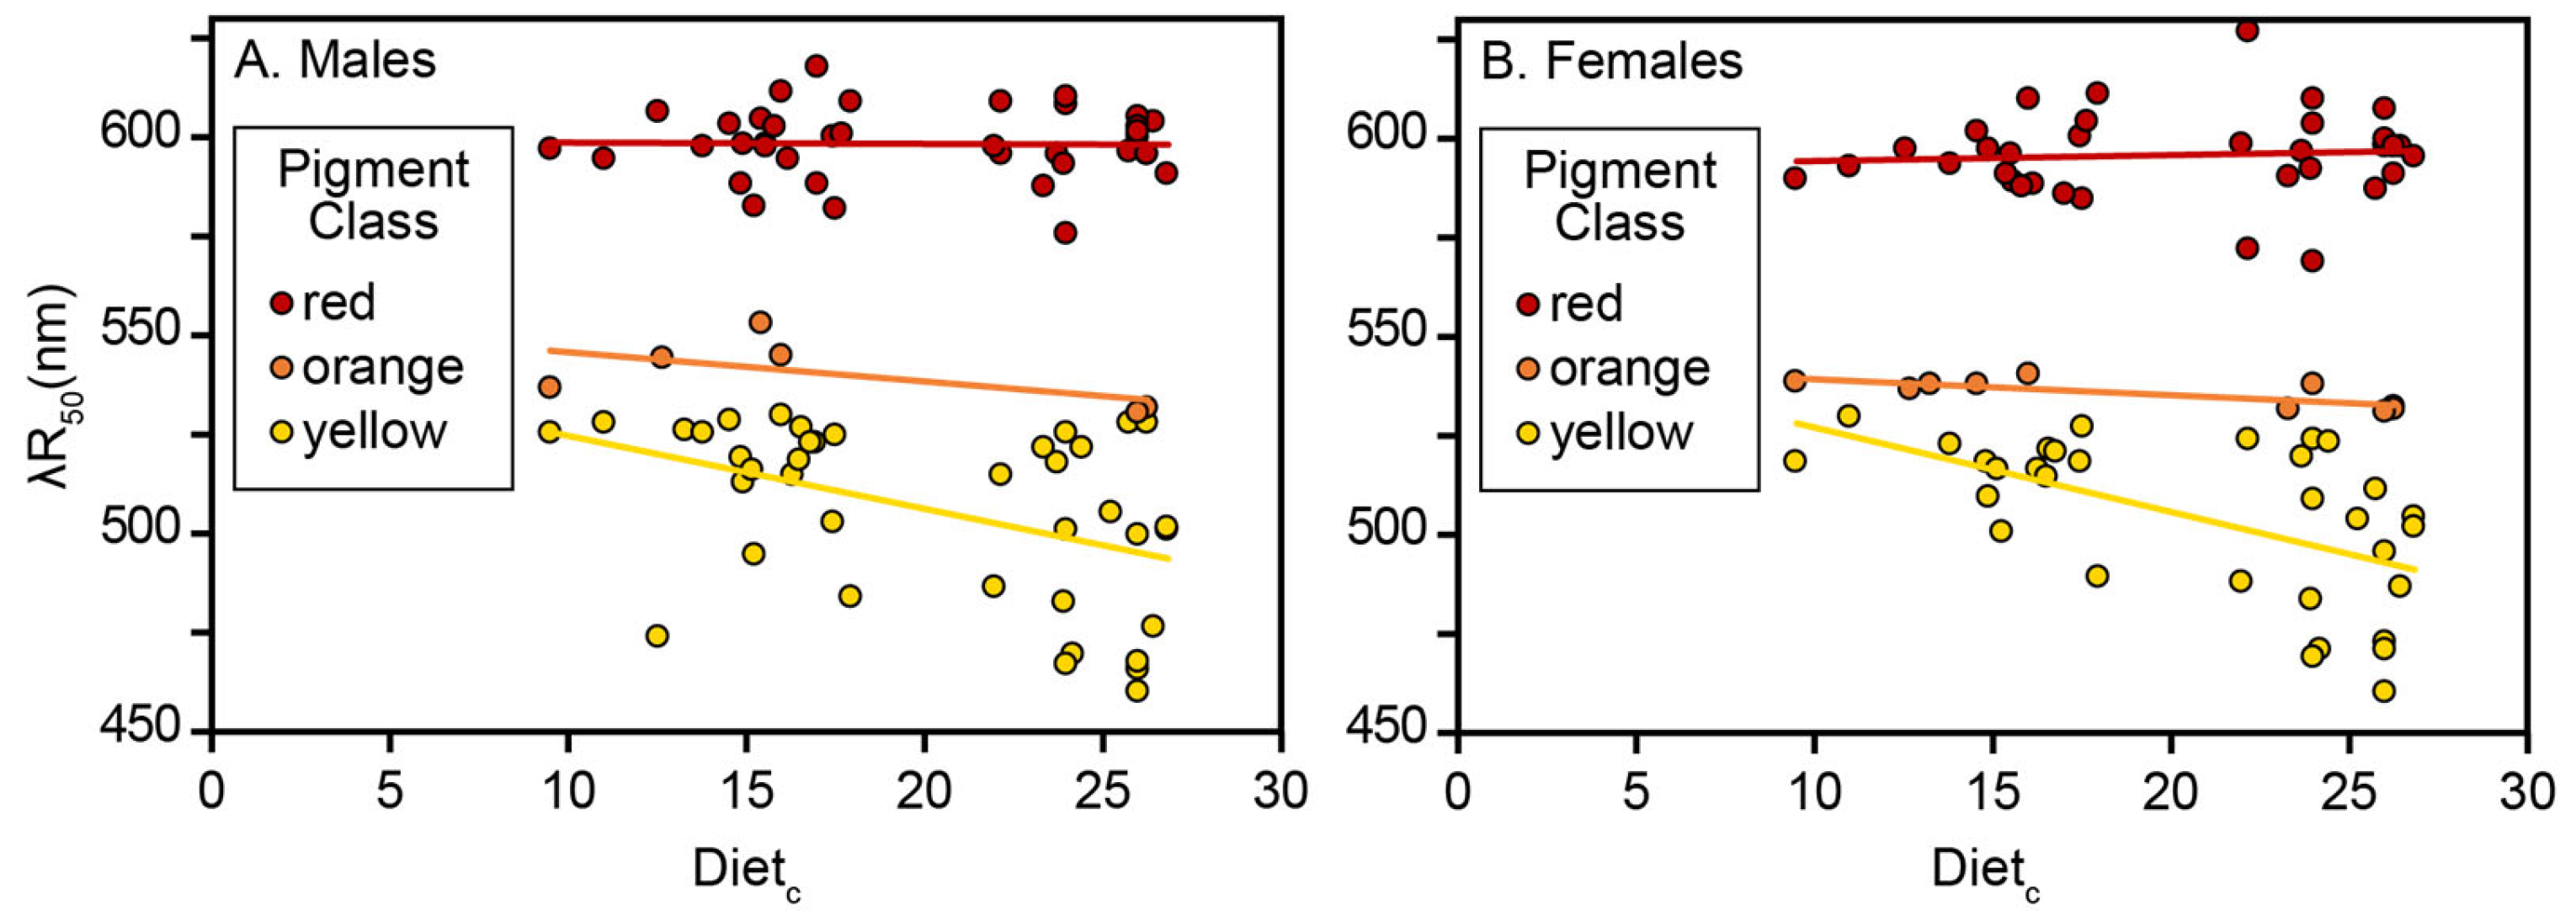
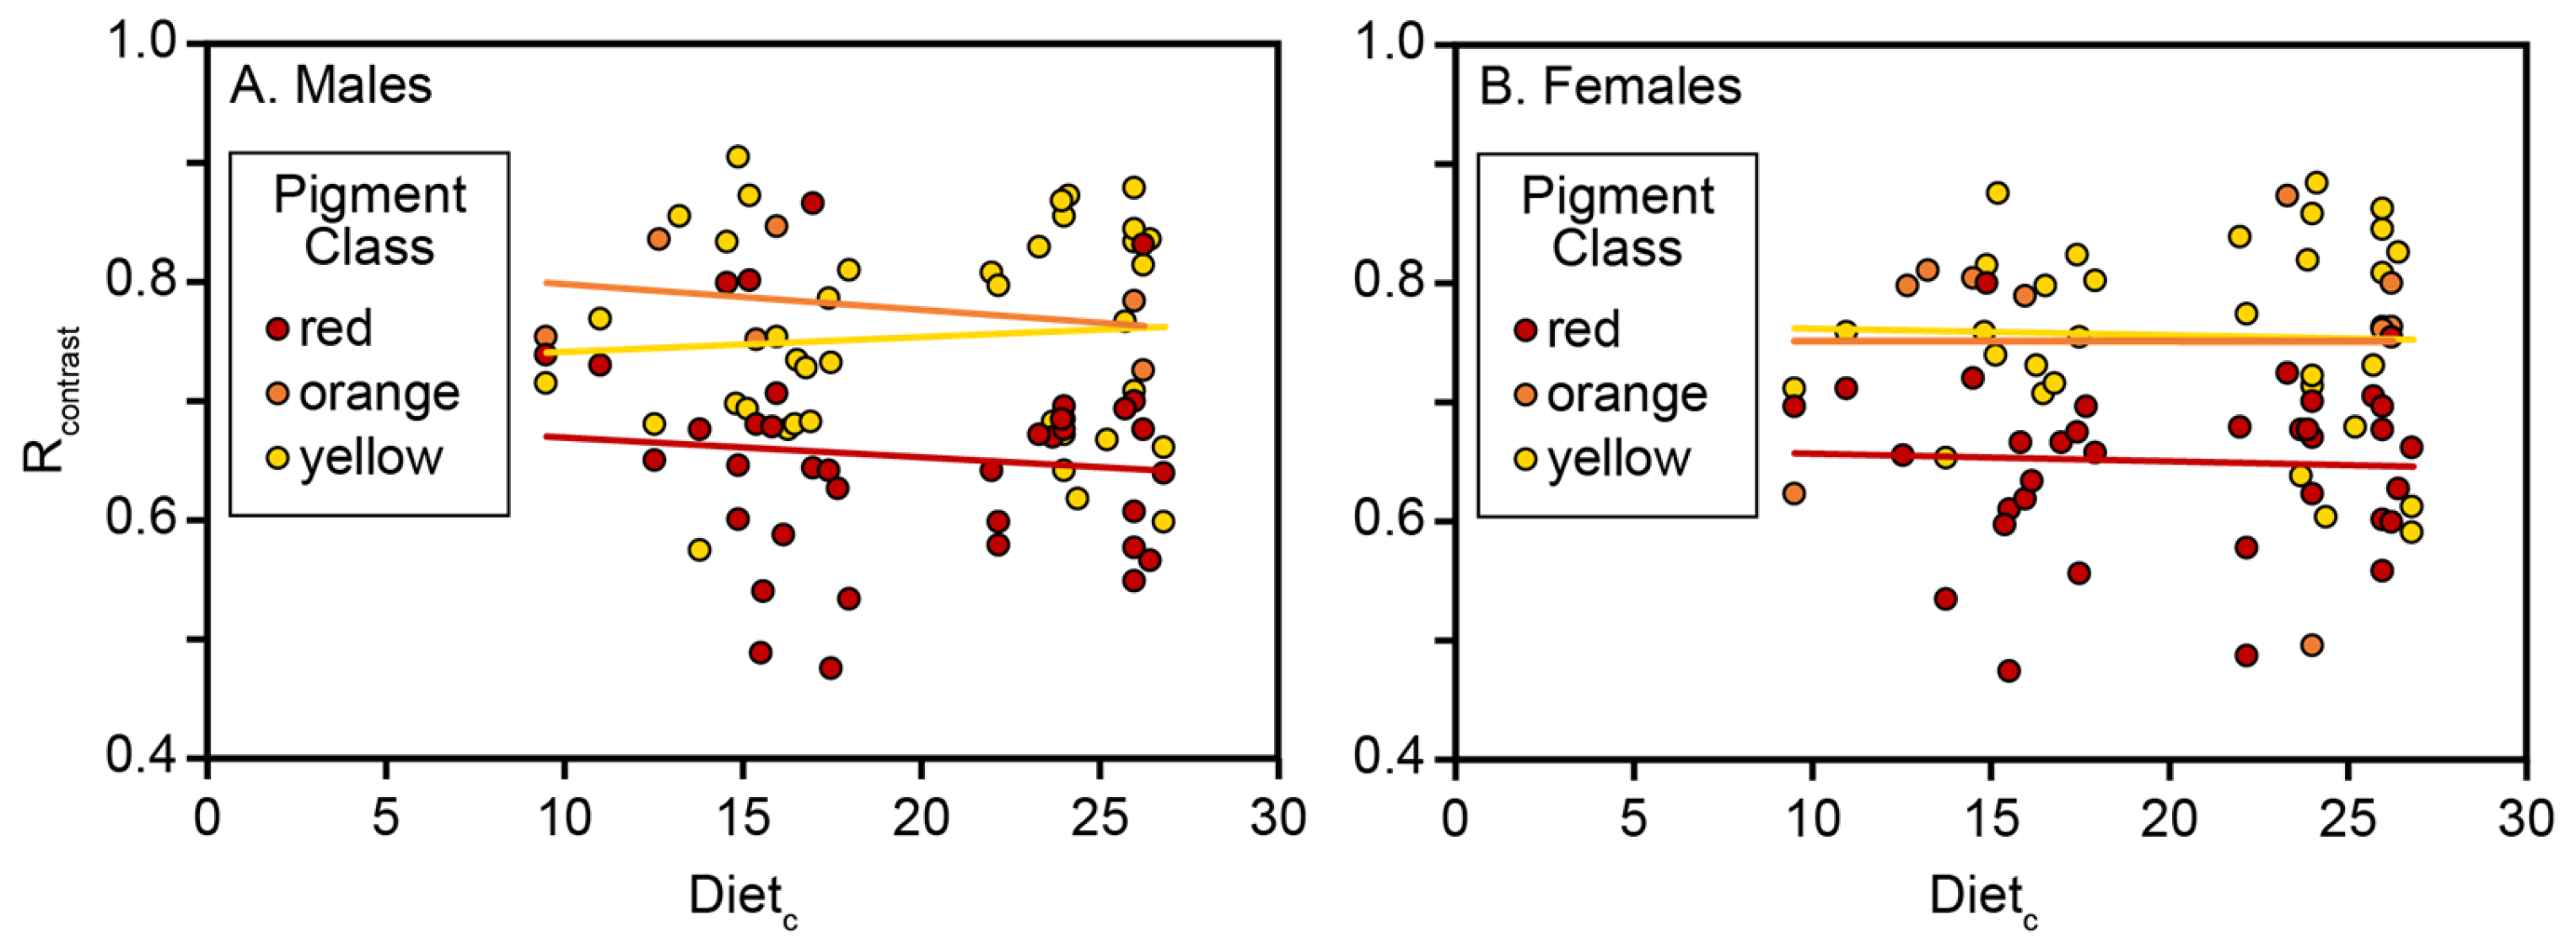
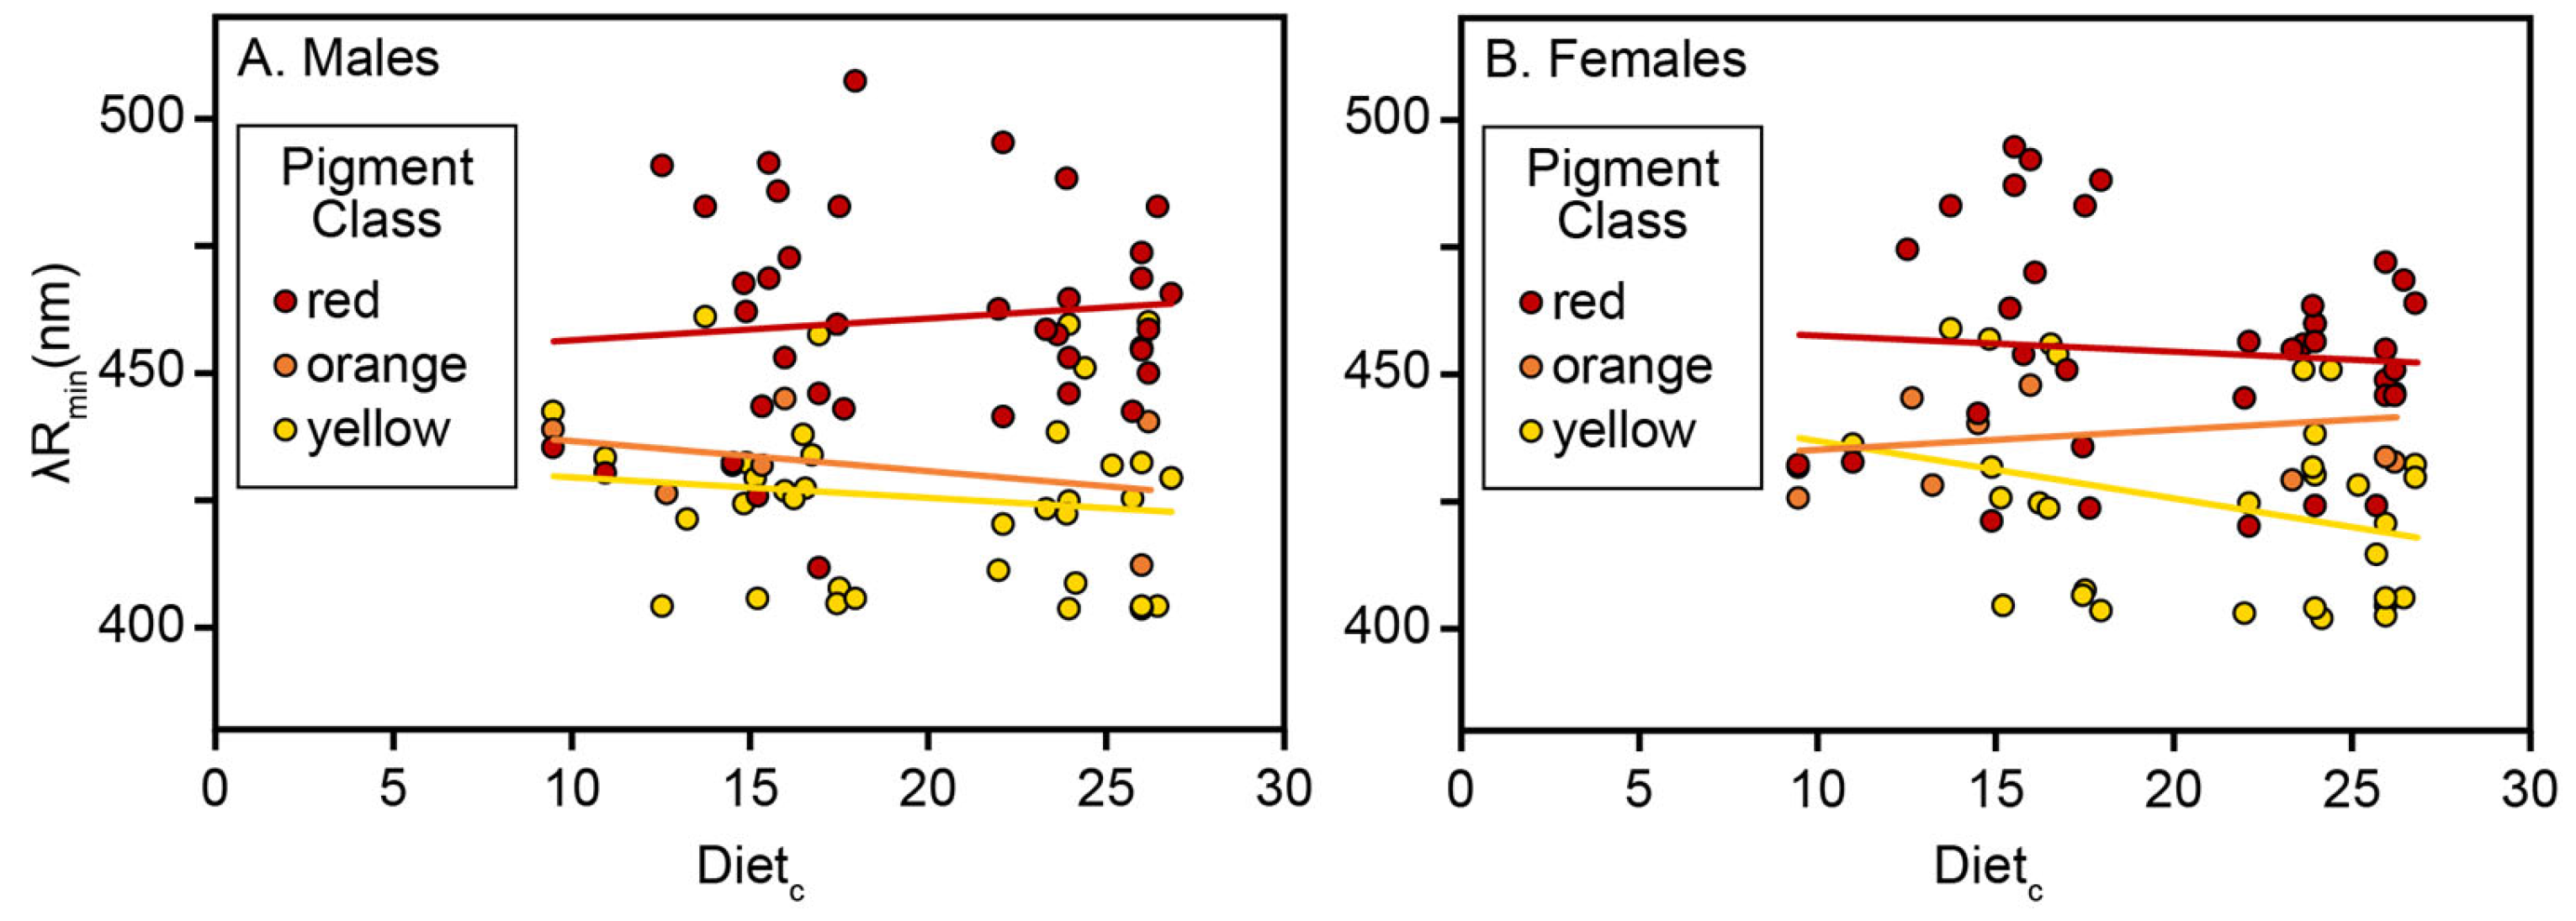
The characteristics of the raw data suggested a phenotype space best described as covariant in that all three pigment class categories overlapped broadly across the span of Dietc values (Figure 4, Figure 5 and Figure 6). This formal structure contrasts strongly with a more collinear one in which, for example, yellow pigments are expressed at lower Dietc and red pigments are expressed at higher Dietc [16,21]. However, a small gap among species with intermediate Dietc suggests that specializations for dietary taxa with these contents are underrepresented or underestimated (Figure 4, Figure 5 and Figure 6). Although the possible unevenness of Dietc is of biological interest, regression imposes no assumptions on the distribution (e.g., normal or continuous) of independent variables. Instead, the raw data suggested analyses using relatively simple multiple regressions that treat pigment class as a categorical variable and Dietc as a covariate. The control variable Year (Table 1) is included in these models but is not discussed further because of inconsistent and mostly weak effects.
Wavelength of Half-Maximal Reflectance (λR50). Results for λR50 were similar for both sexes (Table 2, Table 3 and Table 4, and Figure 4). Values for R2adjusted were notably high (~0.9) for all models, suggesting that the suite of terms provided an excellent fit to the data that was robust to the starter tree branch length specification (Table 2). However, LRT assessed OLS, OU, and BMGrafenE models as significantly and equally superior to those that place greater emphasis on Brownian motion (BMGraftenF, ρ = 1.0, 0.5) phylogenetic structuring. Specifically, the three best-supported models provided mutually reinforcing evidence for little or no phylogenetic constraint on λR50 evolution. OLS models do this implicitly because of their lack of an implied phylogenetic correlation structure (equivalent to star phylogeny). The OU models do this explicitly through the relatively large values of α (~10) and small values of t1/2 (<<<1) relative to tree height (11). The BMGrafenE is as explicit through its tiny estimated ρ (<<< 0.5), which suggests approximation to a star phylogeny. By comparison, fixing ρ at 1.0 or 0.5 to emphasize phylogenetic structure resulted in the inferior BMGraftenF models. Considering the evidence of equal support among the OLS, OU, and BMGraftenE models for both sexes, the OU model was used to enumerate the full multiple regression (Table 3) and parallel the results for the other dependent variables. However, the OLS results for λR50 were virtually identical to those obtained under OU and BMGrafenE (Table 2).
For all “favored” (OLS, OU, and BMGrafenE) models, each Reference Category supported a graded series of blue shifts by λR50 in response to higher Dietc, in the order yellow > orange > red among pigment classes for both sexes (Table 3 and Table 4, and Figure 4). Under explicit multiple regressions with each pigment class used in turn as Reference Category (ultrametric OU model shown for consistency, Table 3; other favored models similar), the slope for yellow was the most significant and strongly negative (males: B~−1.95; females: B~−2.15), that for orange was of intermediate significance and less negative (males: B~−0.9; females: B~−0.35), and that for red not nearly significant and almost zero (males: B~0.02) or slightly positive (females” B~0.15). Thus, at a higher Dietc, yellow and orange are blue-shifted, whereas red is blue-shifted only compared to a red shift. Probing the additive properties of Bs across all favored models and Reference Categories revealed similar patterns (Table 4). Consistent with these results, enumerated interaction terms supported larger and more significant slope differences between yellow and red than for either compared to orange (Table 3 and Table 4). For pigment classes with small sample (orange) or effect (red) sizes, shift patterns were consistently negative (orange) or slightly positive (red) across all favored models and both sexes (12 of 12 in the binomial one-tailed test: p < 0.001, for a 0.5 probability of obtaining the same slope sign for each trial). Despite significant interactions with Dietc, the λR50 response lines for each pigment class did not cross over the range of observed Dietc values, with yellow at shortest and red at longest wavelengths (Figure 4). Thus, the functional responses by pigment class to Dietc are unambiguous for λR50 (Table 3 and Table 4, and Figure 4), as statistical analyses and general trends for λR50 support the same conclusions.
Table 2. Full model (Table 1) selection table for wavelength of half-maximal reflectance (λR50). Note greater support for models with no (OLS) or weak (OU, BMGrafenE) compared to stronger (other BM models) phylogenetic constraints.
Model Results
FitParameters
Model aR2adjusted bMLK cLRT dRANK dPARM et1/2 f
Males
Unit
OLS0.91664534−330.5871*1
OU0.91664534−330.5871*18.7278540.07941782
BMGrafenE0.91667659−330.5715*10.00869885
BMGrafenF0.88390606−344.3358 20.5
BMGrafenF0.87547702−347.2446 31.0
Ultrametric
OLS0.91664534 −330.5871*1
OU0.91664534 −330.5871*18.7558290.07916408
BMGrafenE0.91667659 −330.5715*10.00869885
BMGrafenF0.88390606 −344.3358 20.5
BMGrafenF0.86844175 −349.5254 31.0
Females
Unit
OLS0.919511529−301.6970*1
OU0.919511529−301.6970*19.1178330.07602104
BMGrafenE0.919511529−301.6970*19.12 × 10−9
BMGrafenF0.882718141−316.1910 20.5
BMGrafenF0.875707588−318.4262 31.0
Ultrametric
OLS0.919511529−301.6970*1
OU0.919511529−301.6970*19.0442390.07663964
BMGrafenE0.919511529−301.6970*19.12 × 10−9
BMGrafenF0.882718141−316.1910 20.5
BMGrafenF0.8639429−321.908 31.0
a Evolutionary process models (models) include non-phylogenetic ordinary least squares (OLS) and phylogenetic generalized least squares (PGLS) under an Ornstein–Uhlenbeck (OU) or Brownian motion (BM) process. BM models were further subdivided by parameterization with Grafen’s ρ (BMGrafen), with ρ estimated by the model (BMGrafenE) or pre-set to 0.5 or starter tree 1.0 (BMGrafenF). All PGLS models were tested two ways, using trees assigned unit (set to 1) or ultrametric (arbitrary ultrametrization) branch lengths in Mesquite v 3.03 [87]. b All parameter values were unchanged by the Reference Category designation. R2adjusted is based on 1 − {[(1 − R2) (N − 1)]/(N-p-1)}, where R2 = sample R2, p = number of predictors, and N = total sample size. c ln restricted maximum likelihood (MLK). A more positive value indicated an improved model fit. d The likelihood ratio test (LRT) for significant differences in model fit. Significance was based on the assumption that twice the difference in the paired ln ML values followed a χ2 distribution with 1 df, for which the critical value was 3.841 at p < 0.05. The best model(s) are indicated by * and RANK (rank support). e The values of key model parameters (PARM). OU α = evolutionary force strength returning trait to long-term optimum; GrafenE = Grafen’s ρ estimated; and GrafenF = Grafen’s ρ pre-set to 0.5 or 1.0. f Phylogenetic half-life (t1/2 = (ln(2))/α). All model values of t1/2 were small relative to tree height (11 for both sexes), supporting a rapid return to the trait optimum in both sexes.
Table 3. Full model multiple regressions based on an OU process model and ultrametric tree for the wavelength of half-maximal reflectance (λR50) as a dependent variable. The eight predictor variables differ only in which of the three pigment classes is designated as the Reference Category (0, 0) for these dummy variables.
Pigment Class Reference Category a
YellowOrangeRed
Model b,cBPModelBPModelBP
Males
Year−0.23570.0103Year−0.57890.6246Year0.09050.3644
YO683.51010.7689OY−683.51010.7689RY583.53870.0291
YR−583.53870.0291OR−1267.04870.5864RO1267.04870.5864
Dietc d−1.9590.0000Dietc e−0.91670.3664Dietc f0.0250.9579
YYearOYear−0.34330.7722OYearYYear0.34330.7722RYearYYear−0.32620.017
YYearRYear0.32620.017OYearRYear0.66950.573RYearOYear−0.66950.573
YDietcODietc1.04230.3488ODietcYDietc−1.04230.3488RDietcYDietc−1.9840.0033
YDietcRDietc1.9840.0033ODietcRDietc0.94170.4005RDietcODietc−0.94170.4005
Females
Year0.07370.5357Year0.02160.8866Year−0.02650.7661
YO95.82730.8008OY−95.82730.8008RY−239.93810.41
YR239.93810.41OR144.11090.6788RO−144.11090.6788
Dietc d−2.15350.0000Dietc e−0.3480.6546Dietc f0.14630.7424
YYearOYear−0.05220.7862OYearYYear0.05220.7862RYearYYear0.10030.5006
YYearRYear−0.10030.5006OYearRYear−0.04810.7842RYearOYear0.04810.7842
YDietcODietc1.80550.0495ODietcYDietc−1.80550.0495RDietcYDietc−2.29980.0006
YDietcRDietc2.29980.0006ODietcRDietc0.49430.5814RDietcODietc−0.49430.5814
a Pigment classes: Y = yellow, O = orange, and R = red. b Nmale = 83, Nfemale = 77. Likelihood ratio tests revealed no significant differences between the best-fit models (OLS, OU, and BMGrafenE in the case of both sexes). Near-identical results for OLS and PGLS suggest that the df corrections for (two) tree polytomies were inconsequential. All the model term probabilities were two-tailed. c The interaction terms by pigment class (Y, O, and R). The intercept terms included in the models are not shown. Higher-order and multiplicative terms were excluded (non-significant). d Slope determination based on the additive properties of Bs. Yellow λR50 on Dietc = Dietc; Orange λR50 on Dietc = Dietc + YDietcODietc; and Red λR50 on Dietc = Dietc + YDietcRDietc. e Slope determination using the additive properties of Bs. Orange λR50 on Dietc = Dietc; Yellow λR50 on Dietc = Dietc + ODietcYDietc; and Red λR50 on Dietc = Dietc + ODietcRDietc. f Slope determination using the additive properties of Bs. Red λR50 on Dietc = Dietc; Yellow λR50 on Dietc = Dietc + RDietcYDietc; and Orange λR50 on Dietc = Dietc + RDietcODietc.
Table 4. Best-fit full model pigment class functional responses of the wavelength of half-maximal reflectance (λR50) to Dietc determined from the additive properties of the functional responses of the Reference Category (yellow) with interactions of the reference with the other two (orange and red) pigment classes.
Reference CategoryInteraction bPigment Class B λR50 on Dietc
YDietcYDietcODietcYDietcRDietcYellowOrangeRed
Model aBPBPBPYDietcYDietc + YDietcODietcYDietc + YDietcRDietc
Males
Unit
OLS−1.95900.00001.04230.34881.98400.0033−1.9590−0.91670.0250
OU−1.95900.00001.04230.34881.98400.0033−1.9590−0.91670.0250
BMGrafenE−1.92950.00011.11690.31452.00020.0029−1.9295−0.81260.0707
Ultrametric
OLS−1.95900.00001.04230.34881.98400.0033−1.9590−0.91670.0250
OU−1.95900.00001.04230.34881.98400.0033−1.9590−0.91670.0250
BMGrafenE−1.92950.00011.11690.31452.00020.0029−1.9295−0.81260.0707
Females
Unit
OLS−2.15350.00001.80550.04952.29980.0006−2.1535−0.3480.1463
OU−2.15350.00001.80550.04952.29980.0006−2.1535−0.3480.1463
BMGrafenE−2.15350.00001.80550.04952.29980.0006−2.1535−0.3480.1463
Ultrametric
OLS−2.15350.00001.80550.04952.29980.0006−2.1535−0.3480.1463
OU−2.15350.00001.80550.04952.29980.0006−2.1535−0.3480.1463
BMGrafenE−2.15350.00001.80550.04952.29980.0006−2.1535−0.3480.1463
a For a full list of models, see Table 2. b For a full list of independent variables, see Table 3.
Relative Short-Wavelength Reflectance (Rcontrast). As with λR50, responses by Rcontrast to higher Dietc were similar for both sexes (Table 5, Table 6 and Table 7, and Figure 5). Relative support for the different models was also similar, except that the OLS models were slightly less favored in females (Table 5). Nevertheless, parameter estimates for the more consistently favored OU and BMGrafenE models for Rcontrast indicated only modest phylogenetic constraint on either sex (still relatively large α, small t1/2, ρ), and no consistent sexual patterns among these parameter values (Table 5). However, the amounts of variation explained by models were no different than zero (all R2adjusted were slightly negative, between −0.8 and −1.5).
Explicit multiple regressions were consistent with these results. Across all models, Rcontrast lacked significance for any functional responses to a higher Dietc for any pigment class used in turn as the Reference Category or for any enumerated interactions among pigment classes (ultrametric OU model shown in Table 6; other favored models similar). Moreover, the unstandardized effect sizes were near zero (Bs ± 0.00) and insignificant (even for a one-tailed test). Similar patterns were obtained by probing the additive properties of Bs of the Reference Category for the Dietc term and its enumerated interactions among pigment classes with Dietc (Table 7), indicating statistically uniform non-responses across pigment classes. Thus, the lack of Rcontrast trends across Dietc for all pigment classes (Figure 5) is a blue shift relative to the red shift implied by diminished short-wavelength reflectance at higher Dietc [20,21,22].
Wavelength of Minimum Reflectance (λRmin). The model support patterns, including parameter estimates and sexual distinctions, were more similar between λRmin (Table 8, Table 9 and Table 10, and Figure 6) and the other short-wavelength (Rcontrast) spectral feature than between λRmin and the long-wavelength (λR50) spectral feature. Similarly to Rcontrast, OLS was less favored in females than in males (Table 8). Unlike for Rcontrast, the additional parameters of the OU and BMGrafenE models appeared to better describe λRmin evolution in males (much larger α, much smaller t1/2 and ρ) than in females. However, the phylogenetic effects were modest, even for the latter sex. Otherwise, R2adjusted values for λRmin were roughly midway (0.25–0.55) between those modeled for the other two spectral features, suggesting that the strength of functional response by λRmin to higher Dietc was also intermediate by comparison (Table 8).
As with Rcontrast, explicit multiple regressions for λRmin across all Reference Categories (ultrametric OU model shown, Table 9; other favored models similar) lacked any significant functional response to higher Dietc, or significance to enumerated interactions between pigment classes with Dietc (Table 9), implying similar non-responses across all three pigment classes. However, probing (Table 10) revealed that the yellow response by λRmin to higher Dietc had consistently negative slopes (males: B~−0.5; females: B~−0.6 to −1.15) across all favored models and both sexes (12 of 12 in the binomial one-tailed test: p < 0.001, for a 0.5 probability of obtaining a negative slope for each trial). Moreover, these responses were occasionally marginally non-significant, particularly in females (Table 9). These consistent patterns suggest a parallel but weaker blue shift response to higher Dietc by yellow plumage λRmin than that by λR50 (Table 10). This blue shift tendency by λRmin carried over to orange plumage in males but not females and vice versa for red plumage, without ever approaching significance (Table 9). Thus, a few extremely minor and complex sexual differences also may exist in the response of yellow, orange, and red λRmin to higher Dietc (Table 10).

3.2. Static Responses to Dietc

Conventional OLS statistics can be considered more parsimonious than PGLS because both approaches yield virtually identical results, even though OLS is based on fewer assumptions and modeling parameters. Therefore, only conventional statistics were used to explore additional shift patterns related to the occupancy of reflectance × Dietc phenotype space.
Pigment Class Biases. Models failed to support any obvious red shifts at higher Dietc within the covariance structure of the VS piciform–coraciiform data. However, a red-biased pattern at higher Dietc in the VS system could potentially be expressed if only species with red pigmentation occupied the “extensions” of phenotype space aligned with a higher Dietc. This pattern resembles the aforementioned collinear one, with yellower plumages at lower and redder plumages at or extending to higher Dietc as in some UVS passerines [16,21]. In the VS Piciformes–Coraciiformes, however, each pigment class spanned a similar range from the lowest to the highest Dietc values within and between the sexes (Table 11, Figure 4, Figure 5 and Figure 6). Even species at the high end of Dietc were equally likely to develop strongly blue-shifted yellows and oranges as they were to develop reds. Furthermore, both the yellow and red pigment classes extended to slightly higher Dietc values than did the intermediate pigment class orange, even though the latter was physically much closer to yellow in λR50 (Table 11, Figure 4, Figure 5 and Figure 6). Consistent with these patterns, OLS on mean differences for Dietc between the pigment classes (Dietc = YO + YR or OR) were also not significantly different in males (YO t = −1.051; OR t = 0.899; YR t = −0.290; all p > 0.296) or females (YO t = −0.754; OR t = 0.471; YR t = −0.426; all p > 0.453). Parallel OLS (λR50 = year + YO + YR or OR) also demonstrated that blue shift strength in response to higher Dietc (yellow > orange > red) was directly related to the blueness of the pigment class in males (YO t = 4.79; OR t = 8.012; YR t = 24.71; all p < 0.0001) and females (YO t = 5.65; OR t = 11.17; YR t = 24.84; all p < 0.0001).
Presence–Absence Expressions of Sexual Pigment Classes The sexes expressed similar qualitative (significant or non-significant) and quantitative (slope) functional responses to Dietc for each of the three spectral features × pigment classes (Table 4, Table 7, and Table 10). Consistent with these sexually similar functional responses, presence–absence expressions for the three carotenoid pigment classes showed only minor sexual distinctions (Table 12), supported by a conservative test for deviations from expectations of equal on (sexes similar, 43/27) and off (sexes dissimilar, 11/27) diagonal elements (χ2 = 10.394, p < 0.002; 2 × 2 contingency table test). The few apparent sexual differences were because of the expression of carotenoid pigmentation in males, or the use of red in males versus yellow or orange in females. However, these differences were unexpectedly limited and contradicted by other patterns and pigments (Table 12). In summary, the sexes generally exhibited the same corresponding functional responses and pigmentations (Table 12), and their pigment differences (irrespective of patch location) were only infrequently expressed by their presence versus absence or by their carotenoid pigment class (Table 12). Thus, the sexually similar functional responses to Dietc apparently transcend any sexually distinct pigmentations, such as reds.
Quantitative Variations. The sexual variability patterns within each of the three spectral features were similar (Table 13). However, variational characteristics based on pigment class differed greatly for λR50 (four out of six comparisons were significant, with one nearly reaching significance) but not markedly for Rcontrast or λRmin (one of twelve was marginally significant) spectral features (Table 13). Further consideration is limited to λR50, without distinguishing sex. For raw λR50 relative variability, yellow was consistently the most variable, orange was the least variable, and red was intermediate. Regarding statistically significant differences in variability, yellow and red differed the most, followed by yellow and orange, and orange and red—in that order (Table 13). In summary, for λR50, the extremes in the functional response (yellow being the strongest and red the weakest) were consistent with the extremes in statistical variability (yellow being the most variable compared to red).

4. Discussion

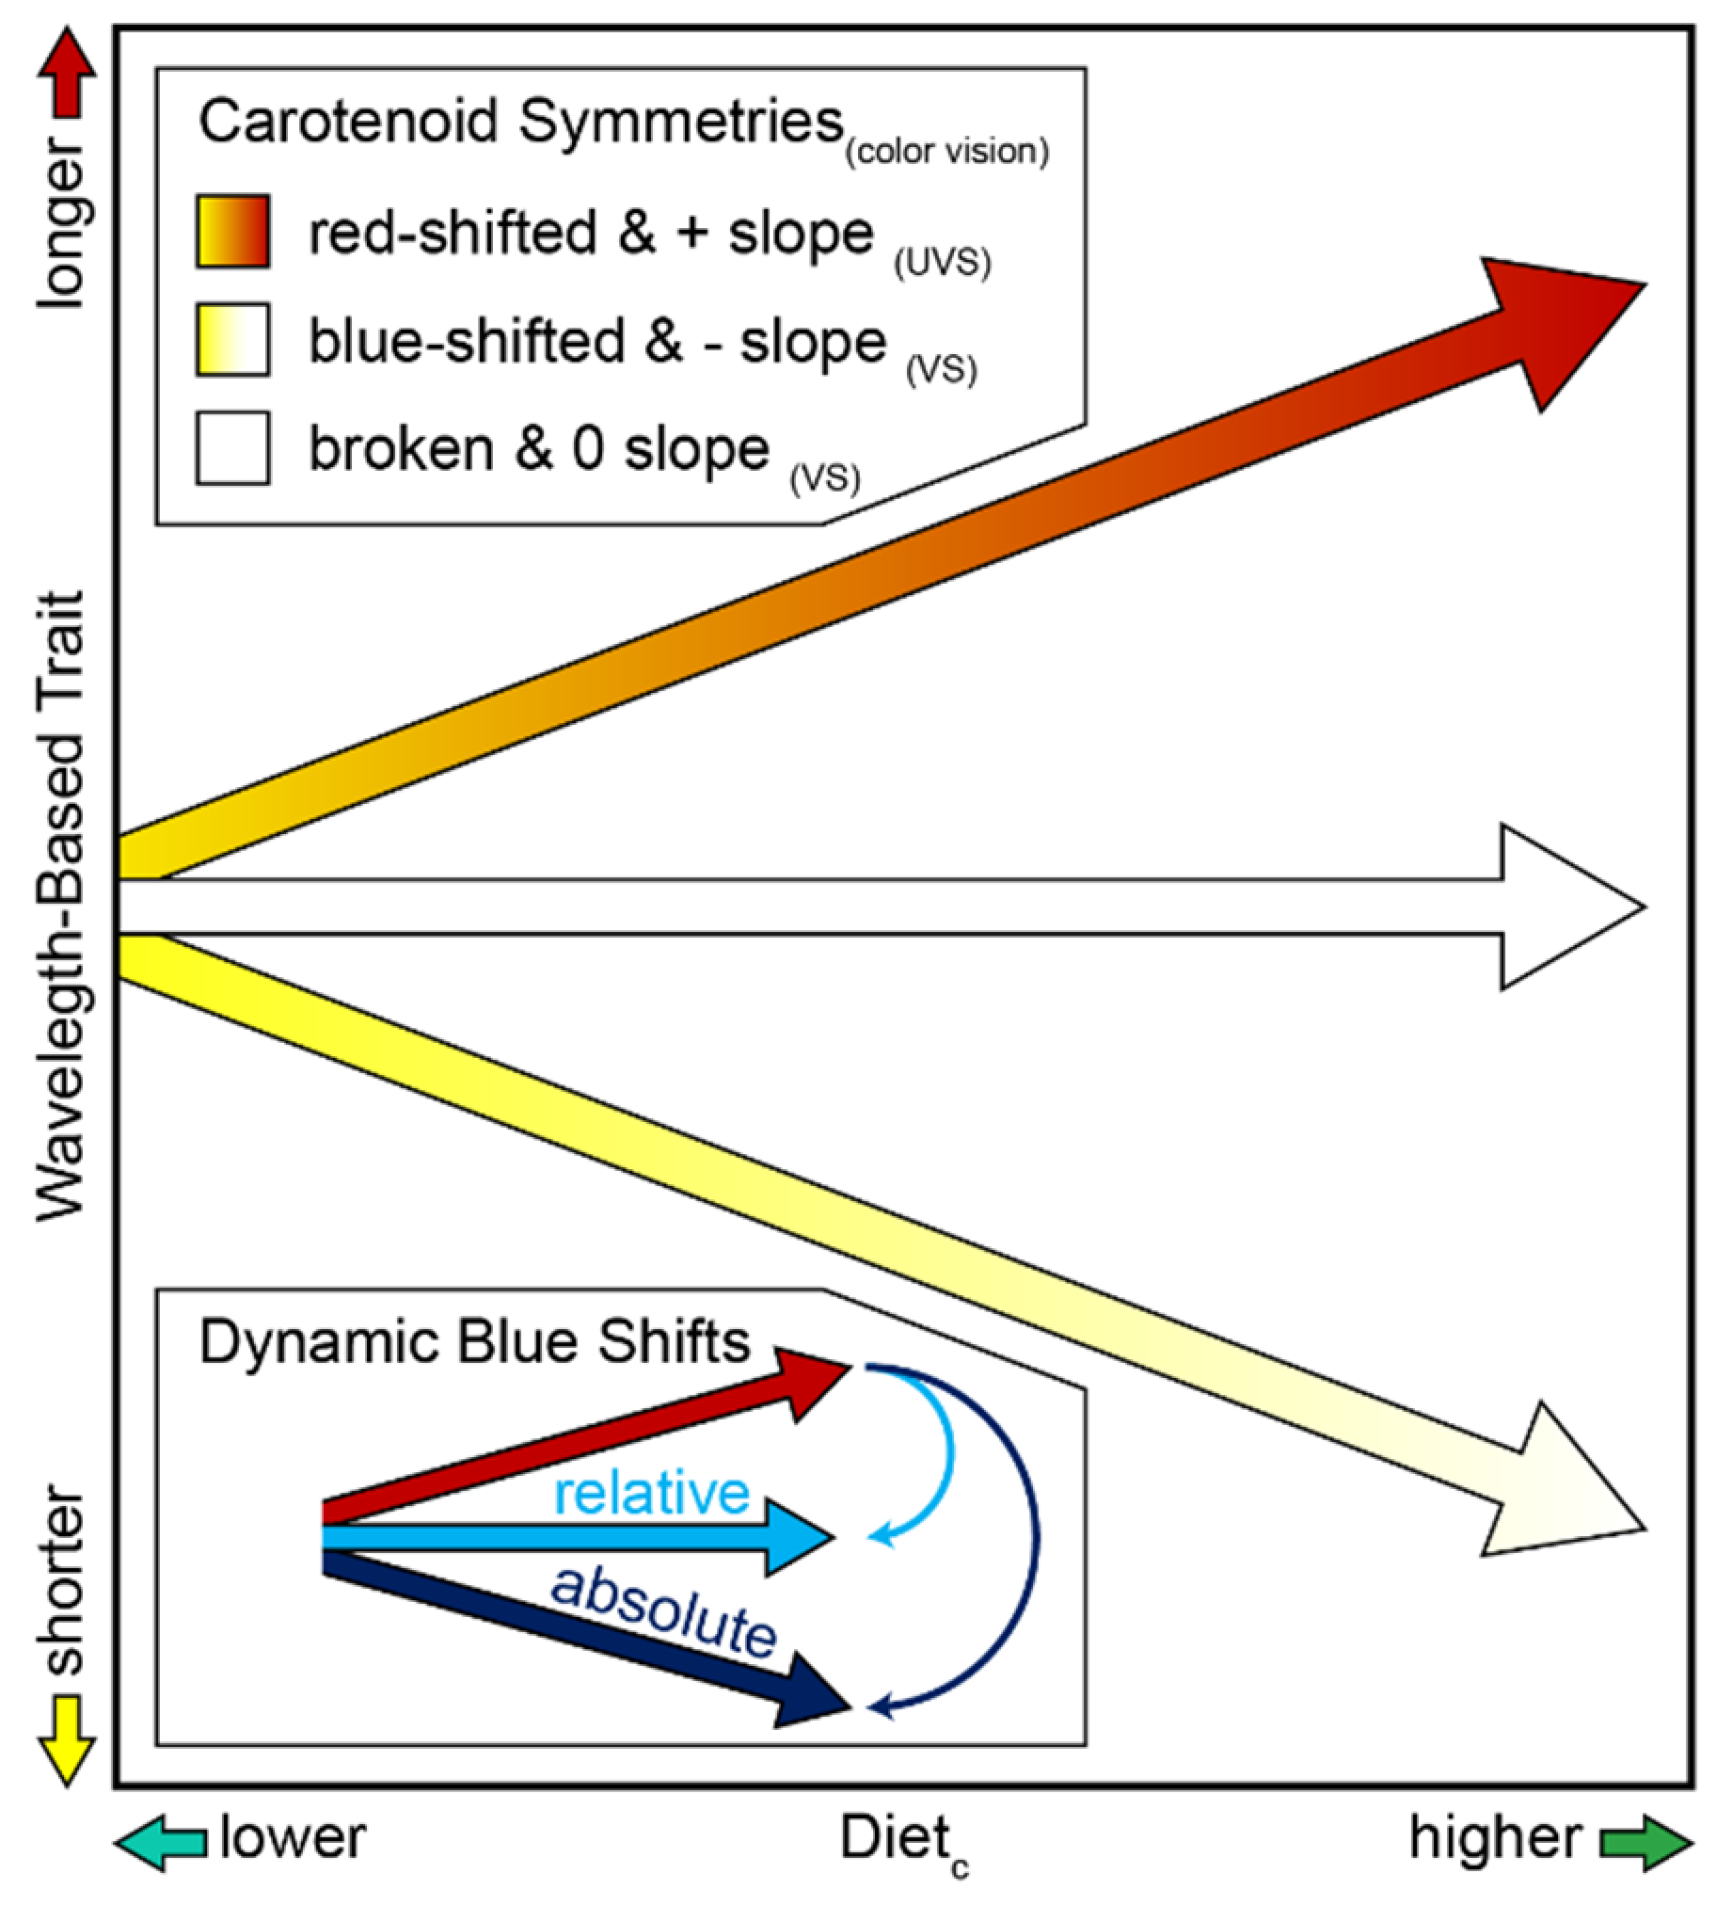
The analysis of carotenoid-based reflectance in an ecological context among VS Piciformes–Coraciiformes is consistent with earlier evidence based on mean λRmin alone for changes towards bluer (shorter) or redder (longer) wavelengths depending on color vision system (see Section 1) [26,38,39], extending this distinction to dynamic responses at higher Dietc. In the case of either sexual pattern in VS Piciformes–Coraciiformes, none of the three carotenoid-pigment classes were significantly red-shifted (i.e., no significant positive slopes) at higher Dietc, red-extended (i.e., no collinear yellow to red pigmentation) at higher Dietc, or red-dimorphic (i.e., no red-male expression bias), contrary to the red-shifted, largely UVS groups [16,20,21,41]. Instead, the VS piciform–coraciiform response to higher Dietc revealed both absolute (i.e., significant negative slopes) and relative (i.e., non-significant zero slopes) blue compared with absolute red shifts at higher Dietc, covariant (equal) expression of all pigment classes at higher Dietc, and roughly equal sexual pigment class expression (Table 11 and Table 12, Figure 4, Figure 5 and Figure 6). Moreover, VS piciform–coraciiform tendencies were mutually reinforcing in that patterns at long (λR50) wavelength were not contradicted by those at short (Rcontrast non-shifts) or intermediate (λRmin blue shifts between those observed for λR50 and Rcontrast) wavelengths. These blue–red distinctions can be summarized as a series of physically objective opposite-pattern symmetries (Figure 7). In the case of yellow and orange pigment classes in VS Piciformes–Coraciiformes, absolute blue shifts and their negative slopes in response to higher Dietc by λR50, and to a lesser extent by λRmin, are antisymmetries when compared with absolute red shifts and their positive slopes (Figure 1D). The wavelength continuum within each shift pattern implied polychromatic symmetries between them, qualified by the fact that categorical perceptions could reduce these to dichromatic ones (Figure 1E,F). The flat responses by λR50 in the case of the red pigment class, and Rcontrast for all pigment classes, are relatively blue-shifted but not strictly opposite (Figure 7 bottom inset) to the positive slope (λR50) or diminishing the short-wavelength reflectance (Rcontrast) of their red-shifted counterparts at higher Dietc. These responses can be considered broken symmetries [10] rather than antisymmetries (Figure 7). The nearly identical results of parallel OLS and favored PGLS models, and interpretation of their fitted parameter values (appropriate R2adjusted; large α compared with small t1/2 and ρ), provided strong statistical support for VS blue biases and symmetries, with little evidence for historical, sexual, or preservation (Year) contributions but strong evidence for process models that incorporated trait adaptation or ecophenotypy (Dietc distribution, OU model support). Therefore, the next step in developing a symmetry framework is to determine whether the underlying processes are similar (invariance symmetry) for the antisymmetries but not for the broken symmetries (Figure 7). A certain level of process invariance is implied when concerted, antisymmetric shift responses to diet (higher Dietc) are expressed between comparisons (e.g., color vision systems). However, no responses by VS Piciformes–Coraciiformes for other spectral features (e.g., Rcontrast) or pigment classes (e.g., red) suggest altered processes. To further explore process symmetry and symmetry breaking, the well-studied red shifts of UVS Passerida passerines (UVS) best inform the VS piciform–coraciiform (VS) system.
Relation to Color Vision. Several observations suggest that the blue shifts in VS Piciformes–Coraciiformes are linked indirectly or directly to color vision. First, blue shifts in VS Piciformes–Coraciiformes are particularly striking, considering the many dietary red shifts associated with the UVS system (see Section 1). This qualitative association is prima facie evidence that shifts and color vision patterns are conjoined. Second, VS Piciformes–Coraciiformes align the maximum sensitivity of their diagnostic V cone with the characteristic λRmin of their strongly blue-shifted yellow pigments, suggesting a mutual relationship [26]. Not only does alignment imply visual function, but λRmin embodies the chemical information content of any pigment [24] used as a signal. Third, the failure to detect any response by short-wavelength reflectance (Rcontrast) to Dietc for any carotenoid pigment class in VS (Table 5, Table 6 and Table 7) as compared with its strong response in UVS [20,21] is a pattern consistent with perceptual differences between the VS and UVS systems. Thus, the maximum sensitivities of the avian V and S cones mainly responsible for short-wavelength perception are 410 and 480 nm, respectively, in the VS system but 350 and 450 nm in the UVS system [36], whereas the secondary short-wavelength reflectance band of carotenoids (Figure 3) best covers the UVS sensitivity range [22]. Fourth, the S single-cone maximum sensitivity in the VS system subtends their most blue-shifted (470–490 nm) λR50 values (Figure 4), whereas the maximum sensitivity of the S single-cone in the UVS system lies below these values [26]. Consequently, the VS tuning patterns provide multiple reasons that favor λR50 over Rcontrast for signaling in the observed order yellow over orange over red. Parallel evidence linking red shifts to the UVS cone characteristics complements these arguments [26,38]. In contrast, the red shifts known for VS groups (particularly in waders) arise from cosmetic coloration, which is strongly impacted by the environment [100,101,102].
Although most parameter values required to model the VS piciform–coraciiform system are lacking, the perceptual salience of blue-shift patterns is supported by experiments on VS visual behavior. The VS pigeon model (Columba livia) can discriminate wavelength differences between 2 and 10 nm for narrow-bandwidth visual stimuli (<10 nm) presented across a carotenoid-relevant spectral range of 450–625 nm [103]. Even relatively more realistic behavioral choice experiments with broad-band stimuli similar to those of carotenoids suggest that VS jungle fowl (Gallus gallus) are superior at discriminating wavelengths in the “yellow” and “orange” ranges, even when the physical differences are only a few nanometers and virtually indistinguishable to humans [104,105]. Remarkably, modeling studies of other pigeon data that account for subjective judgements indicate that maximal monochromatic discrimination also occurs in the physical yellow (500 nm) and orange (600 nm) ranges [106]. Thus, VS discrimination or categorical perception abilities of VS models encompass much of the variation and spectral range within and among carotenoid pigment classes in VS Piciformes–Coraciiformes and particularly fit the stronger yellow and orange shift responses to the Dietc of the latter group. Conversely, the implication that red wavelengths are relatively less discriminated matches their weak response to Dietc. This consistency supports the putative signal value of the VS piciform–coraciiform blue shifts (Figure 4). The opposite (absolute) or divergent (relative) signs of blue and red shifts between the color vision groups imply that these global patterns are even relatively more obvious for birds. Any dietary effects on oil droplet carotenoids [107,108,109] that filter light before it reaches the retinal cones presumably would amplify these discriminations across species. Therefore, even without an explicit VS piciform–coraciiform visual model, participation in carotenoid-based pigment classes and blue shifts in signaling and communication is likely.
Columbidae (pigeons and doves) are especially informative for VS Piciformes–Coraciiformes, considering their similar ecological habits and responsiveness to diet by plumage carotenoids (extent in fruit doves) [110]. The strong association of λR50 with generic colorimetric perceptions such as hue and saturation in vertebrate visual systems [35] is also useful for inferring avian from human perceptions of shift patterns. Thus, the ability of humans to distinguish blue-shift patterns based on generic color parameters (Figure 2) implies salience to birds, given the latter’s ability to discriminate among yellows and oranges that are difficult for humans to distinguish [104,105]. For us, the physical blue shift in λR50 (Figure 3 and Figure 4) by yellow plumage (pigment class) among species with higher Dietc because of more plant-based diets (Figure 2A,C,E) translates to a consistently less saturated (broader reflectance plateau), lemon-yellow (shorter λR50) compared to a golden-yellow in species with more animal-based diets (Figure 2B). Compatible with its overall insignificant response to Dietc, the red pigment class appears to lack any human-visual tendencies among species with more plant- (Figure 2A,C,E) or animal-based (Figure 2D,F) diets. Though slightly ambiguous, the intermediate response by orange λR50 to Dietc seems visually intermediate to humans in relation to these dietary distinctions between more plant- (Figure 2C) versus more animal- (Figure 2D) based diets. Moreover, the lack of any UV-based (<400 nm) trends (incorporated into Rcontrast) that would be invisible to humans implies that our perceptions of plumage differences (compare Figure 2 and Figure 3) provide a conservative assessment of what avian systems can distinguish [111]. Thus, quantitative and qualitative variations (perceivable to humans) are mutually consistent. Therefore, human-visible λR50 variations should provide useful biomarkers of Dietc for VS such that trophic habits can (yellow and orange) or cannot (red) be appreciated from plumage appearance, even to us.
General sexual similarities in color vision [36,37,42,112] are also consistent with the observed sexual similarities in carotenoid-based shift (Figure 4, Figure 5 and Figure 6) and expression (Table 12) patterns, or at least allow for them indirectly, including by genetic correlations between the sexes. Compatible with this interpretation, a few typical UVS Passerida passerines (Parulidae) exhibit sexual differences in their visual opsin sensitivities that correlate with plumage sexual dimorphisms [43]. However, other considerations suggest that the inter-relationships between sexual distinctions in vision and plumage are more complicated. In particular, the primary diet data did not distinguish between the sexes or account for any diet-related sexual perceptions related to oil-droplet carotenoids [107,108,109] or the foraging environment, which could have altered the interpretation of resemblance. The sexes of the UVS Passerida passerines and VS Piciformes-Coraciiformes may also differ in their visual environments. For example, most Passerida passerines build arboreal open-cup nests that expose the sexes to visual detection by predators, which can select for plumage divergence based on male versus female reproductive roles [113]. In comparison, VS Piciformes–Coraciiformes are cavity nesters [74], a habit that may better conceal both sexes from visually hunting predators, thereby reducing that source of divergent selection on plumage [114]. Moreover, nest cavities are usually limited resources that lead to strong competition among pairs, which may select for mutual resemblance through social selection [115,116]. These general habits of VS Piciformes–Coraciiformes could, therefore, explain why their sexual carotenoid-based shifts and expression patterns are similar, even across a wide range of Dietc values from associated foraging preferences. How these and other factors interact to produce the observed patterns requires further study.
Yellow and Orange Responses. Physically different plumage responses to diet by birds with different color vision systems could result from different adaptive processes. However, the VS absolute blue-shifted (yellow and orange pigment classes) and UVS absolute red-shifted responses to Dietc share many attributes suggestive of process symmetries. The most descriptive of these is that in both systems, some plumage spectral features within one or more carotenoid-based pigment classes are reliable markers of diet. A relatively more mechanistic shared process is suggested by evidence for a shared role of limitations in dietary carotenoid content (Dietc) on λR50 and (less) λRmin plumage expression. This sensitivity has been supported in VS Piciformes–Coraciiformes by their captive counterparts [58,59,60]. However, general fading of all carotenoid-based plumages for individuals on captive diets [58] suggests that evolutionary in addition to ecophenotypic factors are responsible for the different sensitivities (yellow > orange > red) of pigment classes to Dietc among wild taxa. Qualitatively, both color vision systems appear to lack any obvious bias in using carotenoids when they are scarce or abundant [16,32,41,115,117]. In the VS system for example, carotenoid pigments were expressed in species over a wide span of trophic habits (Table 11), whose Dietc values range from 9.5 (emphasizing low-content arthropods) to 26.83 (emphasizing high-content fruits). Furthermore, the response by especially VS yellow λR50 remained linear over the same Dietc range (Table 2, Table 3 and Table 4, and Figure 4) whereas non-linear (saturation) effects occur in certain UVS birds [21,22]. Notably, many VS piciform–coraciiform frugivores favor so-called “superfruits” [74], whose high nutritional along with carotenoid content could maintain informativeness regarding dietary limitations even at the highest Dietc levels. In this regard, assessing dietary carotenoid content as the richness of food items (Figure 4, Figure 5 and Figure 6, and Table S2) rather than the amount of food consumed simply emphasizes signal design through dietary specialization rather than through food-gathering abilities per se. Conversely, the specific taxonomies for the carotenoid content of dietary items used to estimate Dietc (see Table S2) qualify other effects on bioavailability, including indirect climate–humidity [34] or internal physiological [118] regulations.
Whether the similar responsiveness of VS and UVS to dietary limitations reflects deeper shared processes depends on whether similar active mechanisms of carotenoid handling produce similar color vision-appropriate shift patterns. Further understanding can be gained by examining the underlying chemistries. In these terms, UVS that eat carotenoid-poor foods (typically grains or arthropods) often deposit dietary “native” yellow carotenoids (typically the xanthophylls lutein, zeaxanthin, β-cryptoxanthin, or rarely the carotene β-carotene) directly to produce yellow to orange plumage [19,25]. However, endogenous processes acting on higher levels of dietary natives in UVS produce mainly red shifts in individuals and species with higher Dietc [16,20,21], either by depositing carotenoids at higher concentration or greater thickness to increase optical density [16,17,20,21], by enhancing carotenoid X protein interactions [30], or by converting yellower carotenoids to intrinsically more orange to red xanthophylls [16,17,19,25,72,119]. Many UVS also convert dietary natives to yellow metabolites, providing another way to encode Dietc. However, these UVS yellow carotenoids (canary xanthophylls, 3′-dehydrolutein, 2′,3′-anhydrolutein) are not strongly blue-shifted (λRmin usually ≤ 3 nm, up to 9 nm shorter) compared with dietary natives [17,63,120,121], which they closely resemble. Birds may still be able to distinguish small blue shifts to a certain extent [104]. However, the greatly restricted physical magnitude of these blue shifts leaves little room for encoding ecological radiation in Dietc this way, thereby reinforcing a red bias in terms of interspecific wavelength-based shifts. Considering the basic yellow-to-orange carotenoid chemistry in UVS, the universal physical properties of carotenoids [20,21,122] pertaining to increased optical density (by concentration, thickness, and carotenoid type) are more likely to produce a red shift in response to a higher Dietc.
In contrast to UVS, however, many VS Piciformes-Coraciiformes can convert dietary native yellow to metabolized yellow “picofulvin” (dihydro- or tetrahydro- derivatives of dietary natives) [25,123,124] carotenoids characterized by strong blue shifts of up to approximately 70 nm compared with dietary natives. At least five empirical observations support the hypothesis that picofulvins cause absolute blue shifts in yellow carotenoids at high Dietc in VS Piciformes–Coraciiformes. First, picofulvins are common in this group (various woodpeckers) [123]. Second, λRmin of picofulvins in vitro [123,124] match those observed for the most blue-shifted yellow plumages (Figure 3A and Figure 6) [26]. Third, the maximum blue shifts of λR50 (Figure 4) and λRmin (Figure 6) are similar. Fourth, the distinctive undulating series of Rmins across the overall low reflectance at short visible (400–500 nm) wavelengths in spectra from species with the highest Dietc (Figure 3A) resemble those obtained from yellow plumages known to be picofulvin-rich [26,119,124]. Fifth, endogenous metabolite use is consistent with evolutionary influences. Conversely, picofulvins are rare or absent in UVS [25], whereas native-like yellow carotenoid metabolites produced by UVS are rare (small amounts in the red plumage of one toucan) [46] or absent [72,119,123] in VS Piciformes–Coraciiformes. These patterns also imply that more red-shifted (λR50 = 510–530 nm) yellows produced by many VS Piciformes-Coraciiformes (Figure 3B and Figure 4) at low Dietc are dietary natives, consistent with chemical analyses of a few woodpeckers (Colaptes, Picoides) [123]. Therefore, for VS Piciformes–Coraciiformes, absolute or relative amounts of picofulvins in reciprocal combination with their relatively red-shifted (Figure 3A,B) dietary native precursors provide a consistent basis for the variation in blue shifts with Dietc. Intermediate blue shifts (Figure 4) by oranges most parsimoniously arise from mixes of yellow picofulvins with orange or red xanthophylls, as suggested by orange’s intermediate spectra (Figure 3C,D) and occasional formation within yellow patches in species that also produce red (Ramphastos dicolorus; Figure 2C). Mixes containing metabolized picofulvins also seem to be the only way to achieve a blue shift with a higher Dietc, as greater amounts of dietary or metabolized orange or red xanthophylls would create a red shift. Therefore, species in both color vision systems appear to use native yellows at lower Dietc but diverge in the carotenoid metabolites they produce at higher Dietc.
Although these chemical hypotheses require confirmation, they are consistent with the active control of plumage carotenoids, as suggested by the greater specificity of responses among species compared to those by individuals in feeding trials (see above). Consequently, the yellow carotenoids available to VS Piciformes–Coraciiformes can produce dramatic (λR50) or modest (λRmin) absolute blue shifts at higher Dietc through the increased deposition of their metabolized picofulvins over dietary natives, whereas comparable shifts are constrained for the combinations of metabolized and dietary yellows available to UVS (see above). In turn, these properties represent divergent processes between VS and UVS yellows, but convergent ones between VS yellows and UVS reds. In the convergent cases, a metabolized carotenoid that is strongly λR50-shifted compared to dietary native carotenoids strengthens the shift response to higher Dietc [19]; however, this produces absolute blue shifts in VS and absolute red shifts in UVS. Higher concentrations of yellows at higher Dietc apparently also contribute to corresponding shifts, but the VS blue shift may require metabolized picofulvins to avoid the red shift created by higher concentrations of dietary native [17] or UVS-type metabolized [30] yellows. The production and deposition of more or metabolized pigmentation at higher Dietc in both VS (blue) and UVS (red) shift systems suggests invariant processes consistent with several models of honest signaling based on costs and benefits [16,17,34,64]. This mutually reinforcing evidence for shared honesty could extend to more detailed invariances related to diet, including ecological signaling [20,21,22], imposition of signal costs (higher concentrations and metabolites) when carotenoids are abundant (higher Dietc) to avoid cheating [34], possible costs or benefits of native or metabolite carotenoids in (different) physiological processes [19,34,125], trade-offs between these or other influences [118], or some combinations thereof. Notably, λRmin values typical of picofulvins also occur at low Dietc (Figure 6). In the one species (Pileated Woodpecker, Dryocopus pileatus; Picidae) analyzed both ecologically (Dietc = 12.543, λR50 = 474.155 nm) and chemically [123], the blue shift is associated with mostly picofulvins but at very low concentrations, consistent with a lower cost. Accordingly, using picofulvins alone at various concentrations may augment the changing ratios of picofulvins and dietary natives (see above) to produce an honest-signaling system that achieves even greater flexibility across Dietc. The spread-out distribution of picofulvins may also explain why λRmin has an intermediate association with Dietc, even though this feature should correlate strongly with λR50 [21,22]. With regard to λR50, however, a strong functional blue shift by yellow and orange in VS Piciformes–Coraciiformes up to nearly the maximal possible terrestrial Dietc (30 for a pure fruit diet; see Table S2) suggests little limitation on their signal informativeness, which is consistent with predictions that honest signals must span the range of costs and benefits to be fully reliable [7]. Nevertheless, ambiguities for orange through its physical proximity to yellow and possible mixed signal content (informative yellow + uninformative red), combined with avoidance of common dietary orange carotenes as pure plumage colorants [25], may help explain the surprising scarcity of orange plumages in honesty systems, both in VS (herein) and UVS (“orange gap” in UVS Thraupidae) [22] birds.
Red Response. Considering that red plumage in VS Piciformes–Coraciiformes responds to individual diets in captivity [58], the absence of a response by any of the measured spectral features for red pigments to Dietc across wild VS piciform–coraciiform taxa suggests a certain evolutionary control in the latter context. This inference is consistent with the evidence that most terrestrial birds produce red plumage by metabolizing red keto-carotenoids from yellow dietary precursors [25,123] rather than by ingesting red pigments [41]. However, a countergradient selection-type mechanism [126] appears unlikely because red plumage in VS Piciformes–Coraciiformes otherwise contains little, if any, of the diet-dependent yellow natives or their picofulvin derivatives (woodpeckers) [123], whose relative blue shifts could otherwise cancel a genetic red shift expressed in birds with a higher Dietc. The reduced response of red to Dietc is consistent with claims for the same pattern (in plumage coverage) in UVS [41], but the complete absence of a shift response in VS Piciformes–Coraciiformes challenges expectations for carotenoids, considering the past emphasis on metabolized red carotenoids as central to honest plumage colors in UVS [16,32]. Instead, different (yellow and orange versus red within VS) or the same (red between VS and UVS) carotenoid pigment classes may evolve under different constraints or functional specializations. As with yellow and orange, the different physical mechanisms for producing red [66] presumably vary in costs and benefits, which could undermine honesty if their deployment strategy varies with respect to Dietc across species. However, both the chemical data [123] and the distinctness of VS piciform–coraciiform pigment class spectra (Figure 3) in λR50 phenotype space (Figure 4) suggest that reds here are distinctive keto-carotenoid metabolites, inconsistent with the main alternative route to increasing carotenoid-based redness through greater optical densities of yellow to orange pigments [17,20,31]. Any inherent limitations on red-pigment variation (e.g., saturation) also seem unrelated to the non-response of red carotenoids to Dietc in VS Piciformes–Coraciiformes, in that the same red keto-carotenoids [123] participate in plumage red shifts in UVS [16]. Therefore, how much the different functional response by reds in VS and UVS systems indicate divergent processes depends on whether mechanisms differ only in degree (remain honesty-enforcing) or also in kind (related to dishonesty, or to communication outside the honesty rubric).
In principle, chemical constraints on red plumage could also prevent its use as an accurate indicator of dietary carotenoid content. Thus, if red was too cheap (cheatable) to be honest, then we would expect Dietc values for red to move lower relative to yellow. Conversely, if red was ineffective because it was too expensive (limiting) to be universally honest, then we would expect Dietc values for red to move higher relative to yellow. Instead, the extensive overlap among pigment classes across Dietc (Table 11, Figure 4, Figure 5 and Figure 6) suggests that red is not different from other carotenoids in terms of more traditional honesty potential in relation to Dietc. With respect to alternative honesty-enforcing processes, the shared pathway hypothesis [18,19,33,125] suggests that carotenoids are more sensitive to the internal (cellular) environment than to the external (dietary) environment because of links between carotenoid metabolism and vital cellular processes. Accordingly, carotenoid-based signal honesty may still vary, but its expression may arise from the disruption of these internal cellular processes rather than from a response to external factors, such as Dietc. This mechanism is, therefore, consistent with the metabolic origin [123] and dietary independence (herein) demonstrated by red carotenoids in VS Piciformes–Coraciiformes. Moreover, vital effects favoring plumage redness have been linked specifically to physiology, which may depend on many traits not examined here [125]. However, in light of traditional links between diet, carotenoids, and liver function, for example [127], variation in reds that is strongly independent of Dietc (Table 13, Figure 4, Figure 5 and Figure 6) implies additional or other complex processes. Additionally, the blue shift of red pigments in VS relative to their red shifts in UVS suggests an active mechanism against greater redness with a higher Dietc among VS Piciformes–Coraciiformes. Notably, studies on a few woodpeckers suggest that their red plumage functions differently based on species-specific morphological or ecological contexts [128,129]. Any widespread selection influenced by this plasticity could eliminate or obscure dietary trends in red plumages with Dietc. Therefore, other natural history features of red plumage in VS Piciformes–Coraciiformes may also incorporate additional or alternative signal properties and functions that account for the unresponsiveness of red pigment reflectance to Dietc.
Based on these considerations, variation by red in all three spectral features at each level of Dietc (Table 13, Figure 4, Figure 5 and Figure 6) suggests that the red pigment class has some potential to respond to Dietc but that selection operates differently. Adaptive explanations based on processes actively favoring resemblance among reds plausibly explain no significant functional response to Dietc. An intrinsic sensory preference [126,130,131,132,133] shared among the VS Piciformes–Coraciiformes would potentially be strong enough to override any response to Dietc. In this regard, a striking feature of VS Piciformes–Coraciiformes is that red carotenoids are surprisingly ubiquitous among the plumages of both sexes (Table 11 and Table 12, Figure 4, Figure 5 and Figure 6), compared with the general avian patterns for yellow plumage carotenoids to predominate [116] and for a red bias in males [32]. Moreover, many of these red plumage patches occur around the head, face, and rump and are most likely to be important in visual communication. These patterns suggest a deep-seated preference for red pigmentation by various means. For example, if the red carotenoid content of neither plumage nor the oil droplets of longer wavelength-sensitive M and L cones respond to Dietc, then a bias for certain reds may emerge or be reinforced. Sensory preference also could compromise honest Dietc signaling through related foraging biases that allow “expensive” red pigments to be obtained more cheaply as a component of sought-after foods [134]. Thus, certain Colaptes woodpeckers appear to obtain their red pigments through narrow myrmecophilous diets [56], which otherwise have a very low overall carotenoid content (Table S2). Foraging specializations associated with terrestrial habits in Colaptes [55] could further reduce the cost of seeking these red pigment sources, thereby circumventing the usual intrinsic physiological costs and benefits relating red pigmentation to Dietc and honesty. However, broad variation in reds at each level of Dietc challenges sensory preference explanations whereas the relative constancy of variation in reds across Dietc values supports them (see Figures). Other sensory factors such as habitat, light environment, and biotic interactions may contribute to these complexities.
Resemblances driven by social mimicries directed towards competitors or aposematic mimicries directed towards predators are also particularly relevant for VS Piciformes–Coraciiformes [45,135,136,137]. Typical VS piciform–coraciiform traits favoring such resemblances include bold markings, large size, physical prowess, sexual resemblance, intense competition (e.g., for nest cavities), and interspecific communication [137,138,139,140,141]. Moreover, the strong OLS and OU model support for the non-response of red to Dietc is consistent with evolutionary convergence and not relatedness as the cause of resemblance. Evolved resemblance does not need to be independent of any tendency for red to saturate (physically similar) or create sensory biases (perceptually similar), as both phenomena enhance functional resemblance. Furthermore, the many physical mechanisms by which a red appearance can be achieved with carotenoids [17,22] and other pigments [66] could produce corresponding variations in production costs and benefits that would further undermine honest signaling, potentially favoring numerous social and aposematic mechanisms based on deception/dishonesty. Reduced variation of red compared with yellow λR50 (Table 13), the large gap between yellow + orange versus red λR50 values (Figure 4), and overall strong support for OU models of λR50 covariation (Table 2, Table 3 and Table 4) suggest a favored zone of long-wavelength (red) plumage phenotypes consistent with resemblance hypotheses. Conversely, the scatter of λR50 at a given Dietc is not disqualifying in that resemblance need not be exact to be effective, as different species may be perceived as members of the same category, be at different stages of perfecting resemblance, or belong to different resemblance rings [137]. The only requirement in the present case is that the importance of resemblance overrides the response to carotenoid limitation, resulting in no functional response to Dietc (cf. yellow and orange). The slight and non-significant but more positive functional response to higher Dietc by red λR50 in females (B~0.15) than in males (B~0.02) may, therefore, indicate marginally stronger selection for honesty over resemblance in females, consistent with sexual differences in certain behaviors (see above references). Physical and perceived similarities could favor red over yellow and orange under any resemblance scenario for the red response, although all pigments, particularly their Dietc-independent wavebands, could participate. Thus, if VS incorporates yellow and orange as diet-limited to honesty-based signals, then the different characteristics of reds may lead to alternative functions, including ones related to dishonesty.
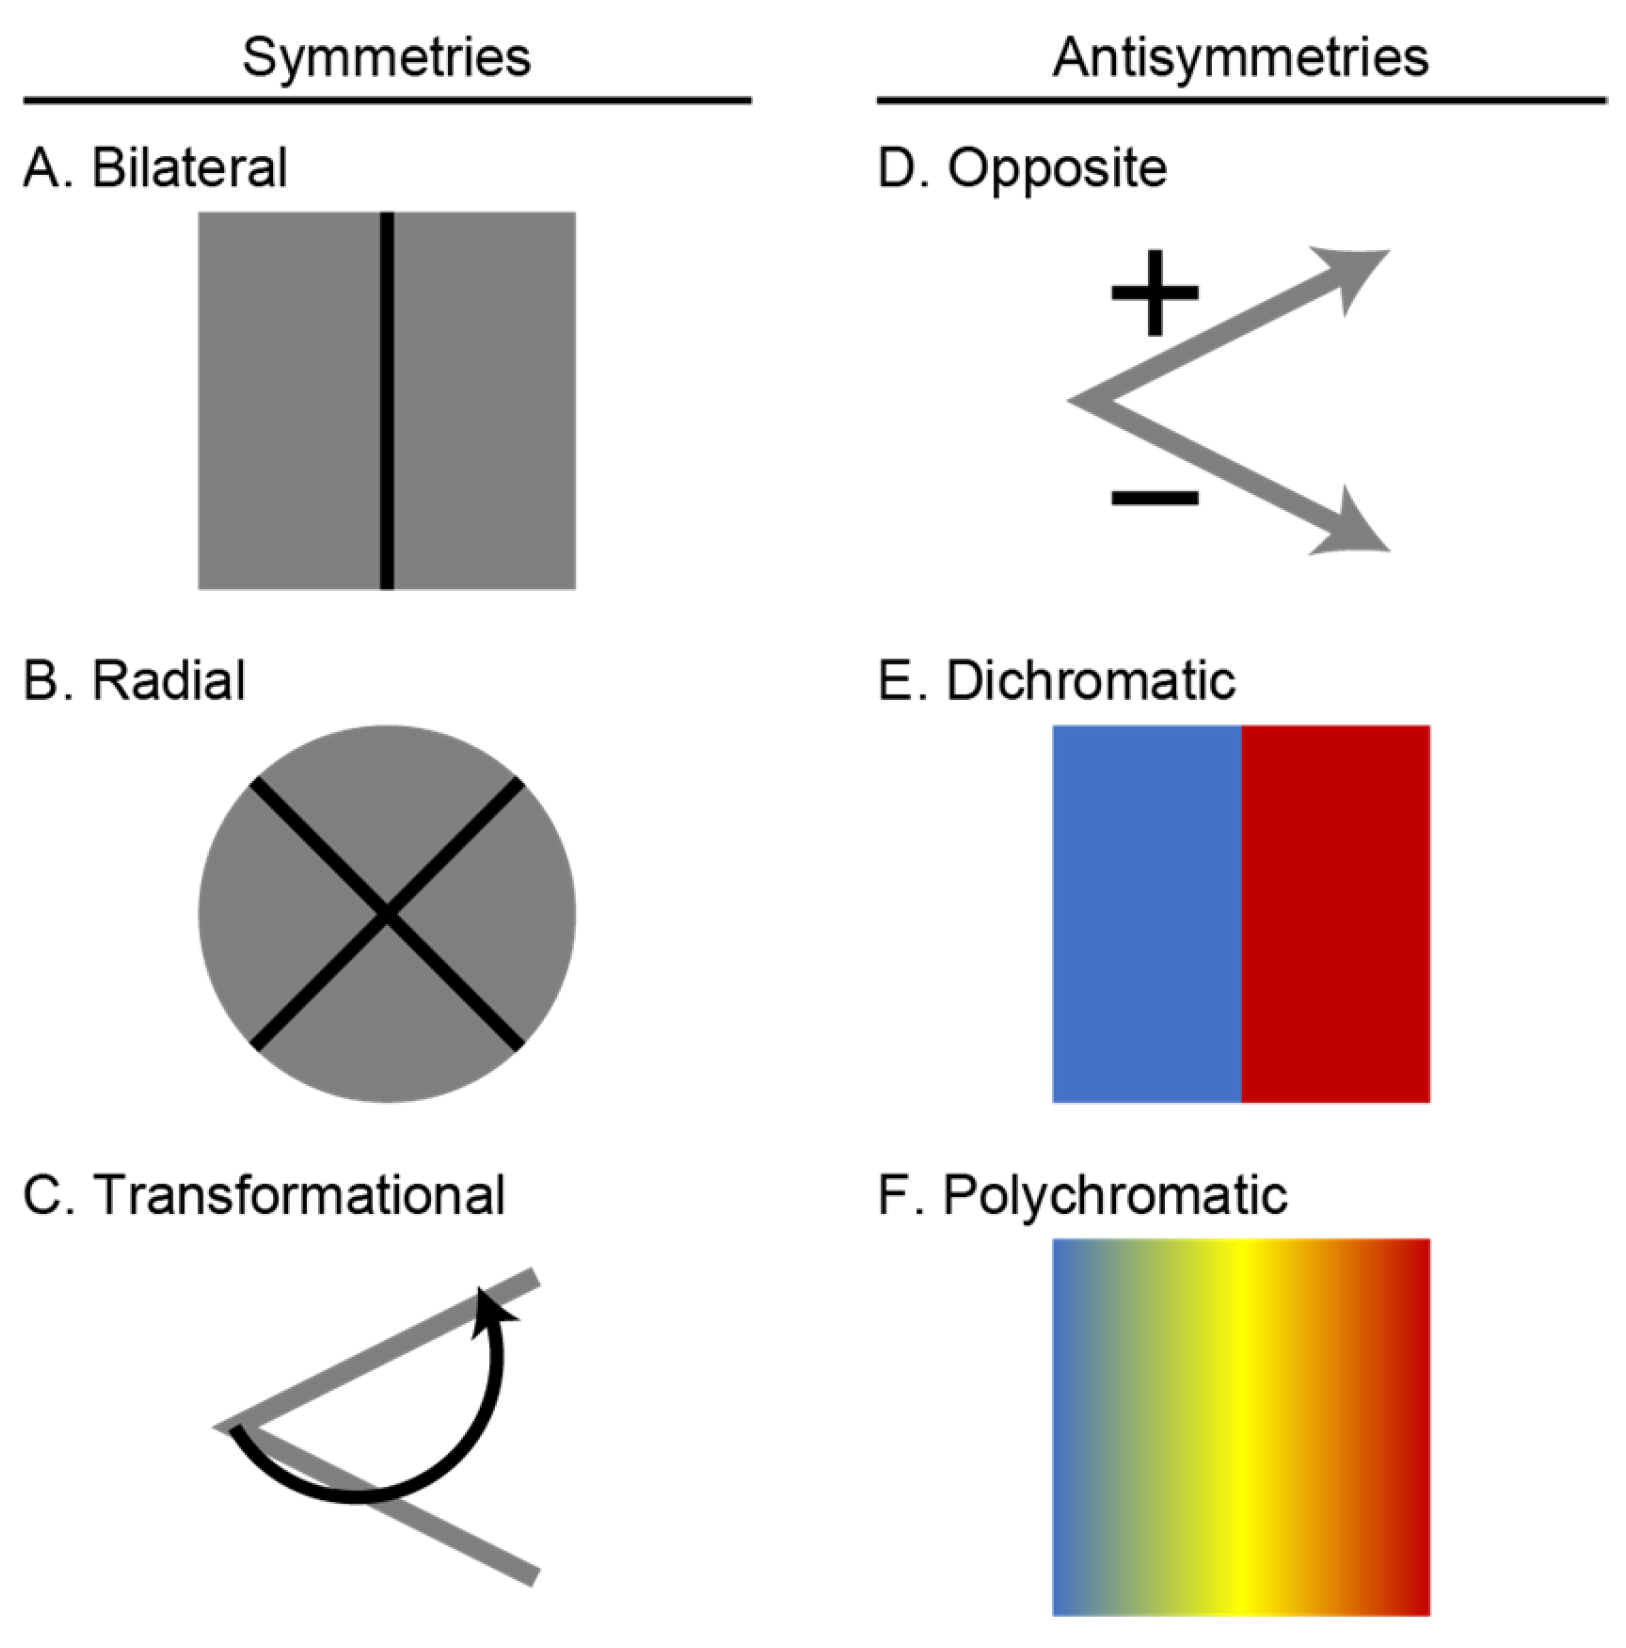
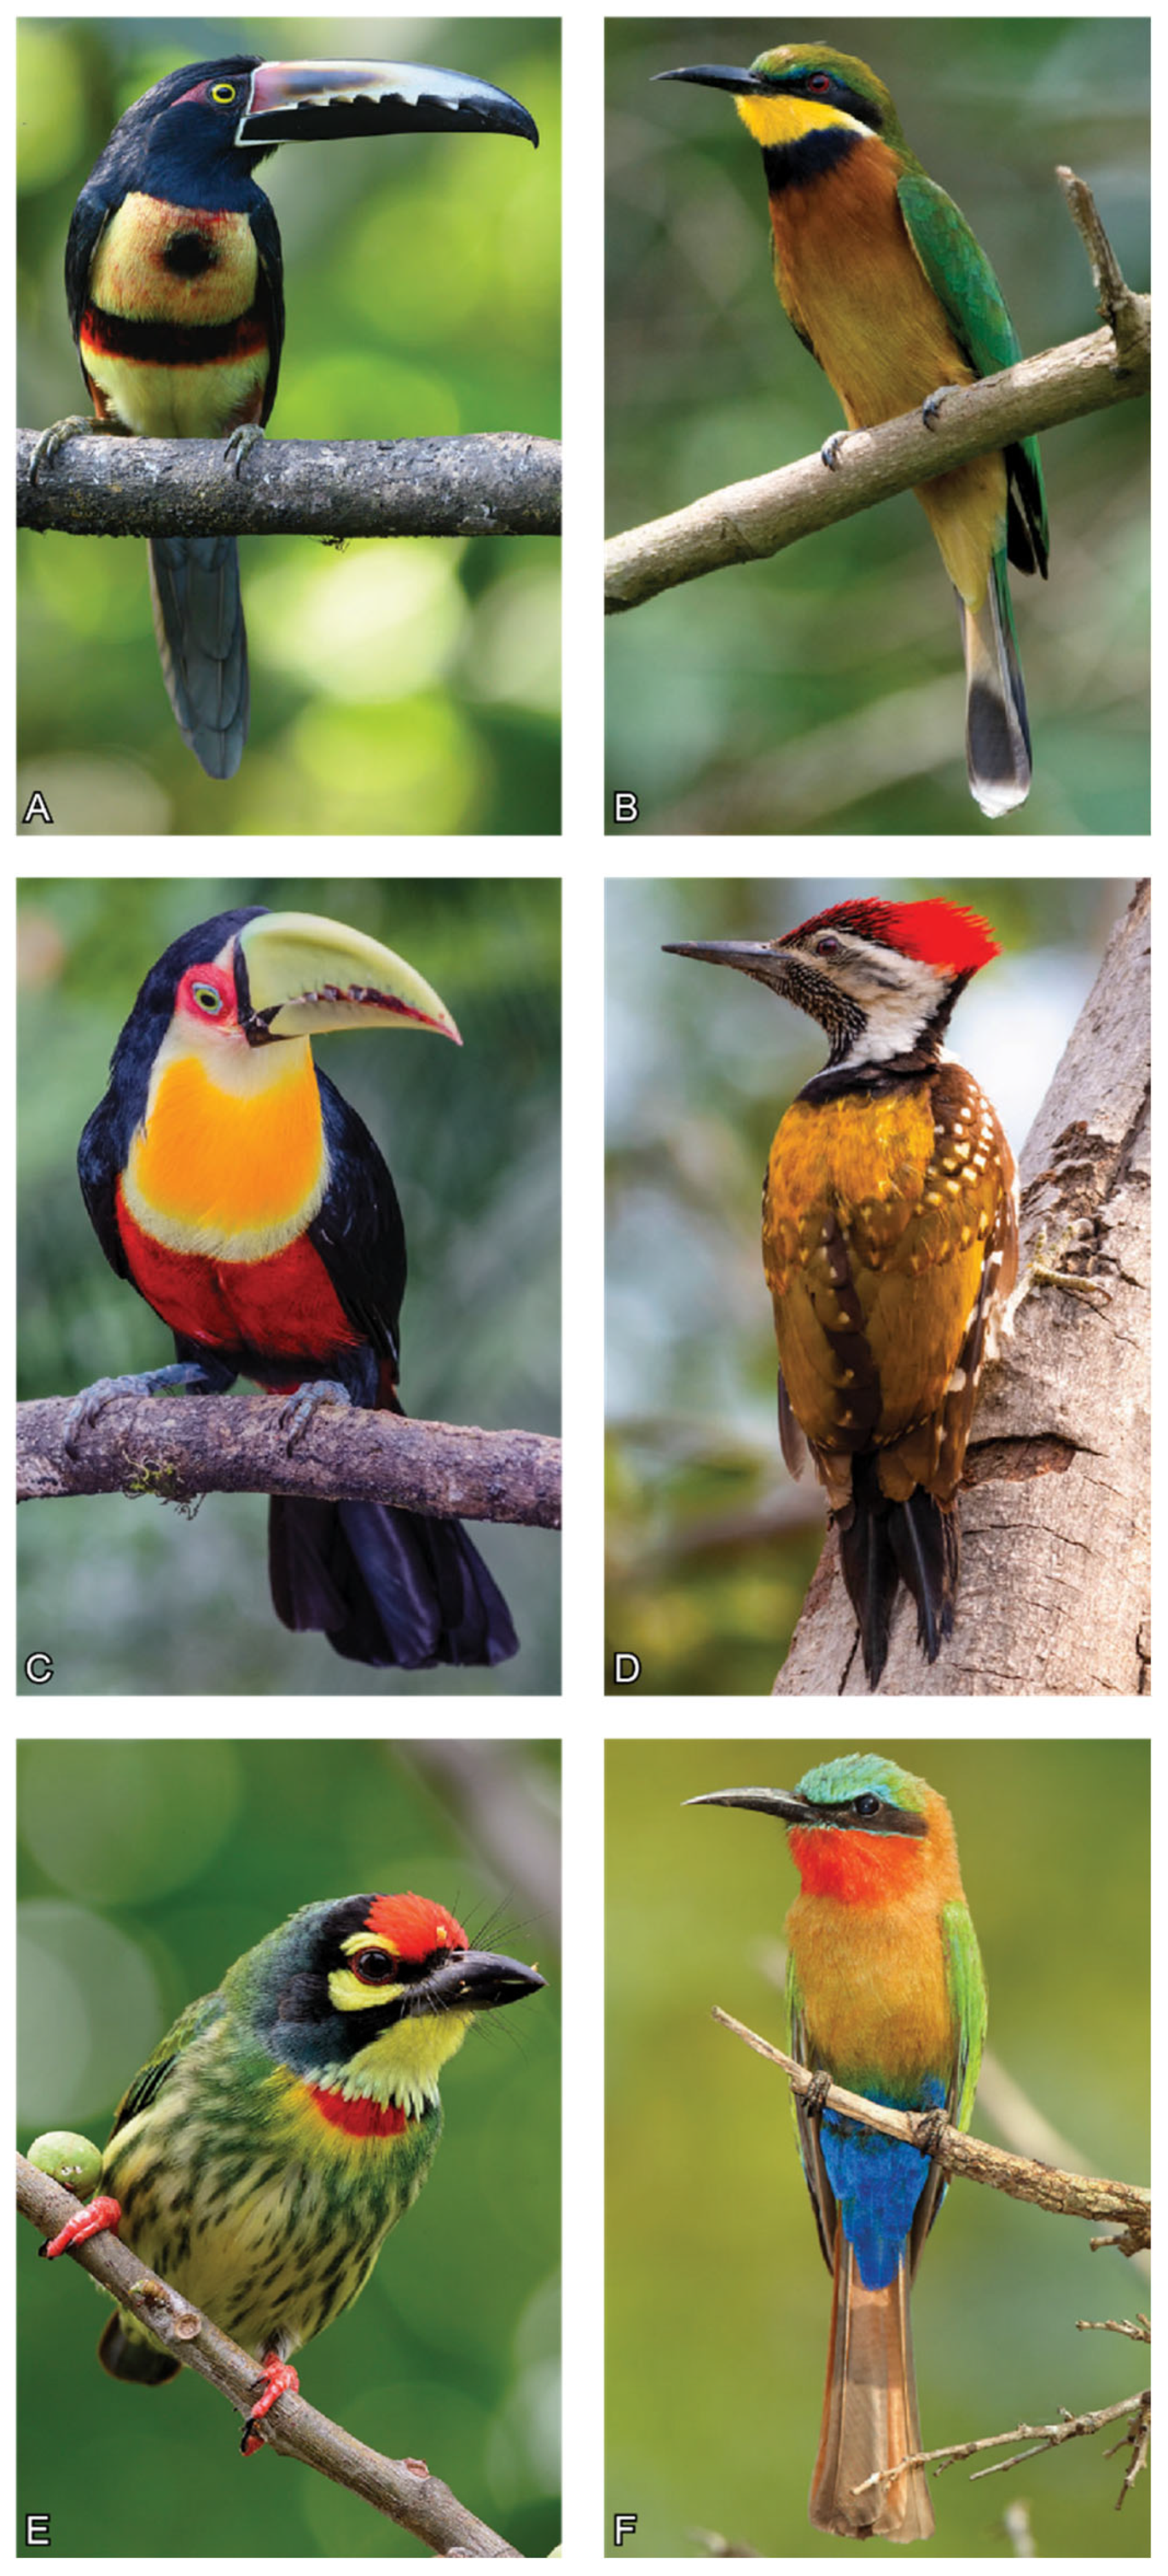
5. Conclusions

The results obtained in this study highlight the absence of a universal response of plumage carotenoids to diet within and among selected categories (pigment class, clade, and color vision system). However, a simplified symmetry framework for this variation (wavelength shifts at higher Dietc) appears to illustrate a few universal principles for natural carotenoid diversity and physical systems in general [10,13]. In the symmetric vernacular, blue (VS) versus red (UVS) shifts are overlain by both invariant (e.g., color vision, dietary limitations, metabolites, honest signaling, pigment class effects, and dietary biomarkers, all for yellow and orange) processes under antisymmetries, but also different (e.g., for VS Piciformes–Coraciiformes, de-emphasis of certain wavebands, emphasis on resemblance, and deceptive signaling for red) processes under broken symmetries. If orange combines yellow and red, then a gradient between symmetries and broken symmetries may parallel the gradient from yellow to red in functional responses to Dietc. These regularities may be underestimated if provisional evidence holds that the strength of the shift at higher Dietc by pigment class is usually in the order yellow > orange > red, regardless of the blue (herein) or red [41] shift. Notably, the shifts by the in vivo ocular sensitivities of the V and S cones of the two diurnal color vision systems acquire a new interpretation as underlying antisymmetries themselves. In this regard, the apparent linkage between color vision system and shift form in response to Dietc modifies the common dictum that birds are “what they eat” to include “what they see.” This elaboration recognizes the possibility that intrinsic factors, such as different color vision and metabolism, may lead to divergent functional responses, even though extrinsic dietary inputs are the ultimate sources of plumage carotenoids. Thus, symmetry principles appear to organize carotenoid diversity into a simplified predictive framework linked to color vision.
Ascertaining more specific ecological similarities or differences within a symmetry framework is beyond the scope of this study. However, the aforementioned symmetries are ultimately integrated specializations in color vision, pigmentation, and ecology that require careful consideration of evolutionary phenomena. Thus, divergent plumage shift patterns may arise from the convergent processes of honest signaling. Conversely, convergent pigmentation may have divergent functions (honest versus dishonest). Importantly, this additional complexity enables functional divergence between different carotenoid-based plumage patches within and between individuals, sexes, species, and color vision systems, thereby augmenting their signal diversity, adaptive potential, and homoplasies [21]. Within VS Piciformes–Coraciiformes, for example (Table 12), yellows and oranges may permute diet-limitation, honesty, and mimicry (toucan) [45], and reds may emphasize sensory bias and mimicry (woodpecker examples) [136]; however, all three pigment classes may be good indicators of condition (e.g., in captive or wild birds; personal observations) [58]. Between color vision systems, blue-shifted metabolites may be more integral to VS, and vice versa for UVS. Consequently, ignoring covariance by lumping pigment classes or color vision systems may obscure more structured dynamics within (VS) or between (VS and UVS) these systems. In this regard, comparisons among other VS birds should determine whether broken responses to Dietc in VS Piciformes–Coraciiformes are typical of this visual system or an idiosyncrasy of certain members. Conversely, the differences and similarities between VS Piciformes–Coraciiformes and their UVS relatives (Trogoniformes) provide critical tests for the association between opposite shift patterns and color vision. Such symmetries and their underlying causes are general enough to be expected for many pigments and organisms.

Supplementary Materials

The following supporting information can be downloaded at: https://www.mdpi.com/article/10.3390/d17060379/s1, Figure S1: Phylogeny and pigment class expression in male Piciformes–Coraciiformes; Figure S2: Phylogeny and pigment class expression in female Piciformes–Coraciiformes; Table S1: Excel spreadsheet of museum specimens used in the study; Table S2: Table of carotenoid contents of avian food items and sources. References [142,143,144,145,146,147,148,149,150,151] are cited in the Supplementary Materials.

Author Contributions

R.B. designed the study, collected and analyzed the data, and wrote and submitted the manuscript. All authors have read and agreed to the published version of the manuscript.

Funding

The National Science Foundation (IOS 0741857) and Vilas Life Cycle Program of the University of Wisconsin (133-PRJ45EB, 133-PRJ45EC) provided generous financial support for this work.

Data Availability Statement

The author confirms that the data supporting the findings of this study are available within the article, in the Supplementary Data Files, and in the open data online resource https://birdsoftheworld.org/bow/home (accessed on 28 April 2025). Additional datasets are not readily available as they are part of ongoing studies. Reasonable requests for access should be directed to the author.

Acknowledgments

I thank numerous museums and their curators for the loan of specimens under their care, including the Academy of Natural Sciences of Philadelphia (Nate Rice), the Cornell University Museum of Vertebrates (Charles Dardia), the Delaware Museum of Natural History (Jean Woods), the Natural History Museum of Los Angeles County (Kimball Garrett), the Museum of Comparative Zoology (Jeremiah Trimble), the University of Michigan Museum of Zoology (Janet Hinshaw), the University of Wisconsin Zoological Museum (Laura A. Monahan, Emily Halverson, Paula Holahan, Kathryn Jones, Dianna M. Krejsa), and the Western Foundation of Vertebrate Zoology (René Corado). Katherine L. Baldwin expertly assisted with the figures. Two anonymous reviewers provided helpful comments regarding the manuscript.

Conflicts of Interest

The author declares no conflicts of interest.

References

  1. Palmer, A.R. From symmetry to asymmetry: Phylogenetic patterns of asymmetry variation in animals and their evolutionary significance. Proc. Natl. Acad. Sci. USA 1996, 93, 14279–14286. [Google Scholar] [CrossRef] [PubMed]
  2. Ellis, G.F.R.; Di Sia, P. Complexity theory in biology and technology: Broken symmetries and emergence. Symmetry 2023, 15, 1945. [Google Scholar] [CrossRef]
  3. Johnston, I.G.; Dingle, K.; Greenbury, S.F.; Camargo, C.Q.; Doyle, J.P.K.; Ahnert, S.E.; Louis, A.A. Symmetry and simplicity spontaneously emerge from the algorithmic nature of evolution. Proc. Natl. Acad. Sci. USA 2022, 119, e2113883119. [Google Scholar] [CrossRef]
  4. Ocklenburg, S.; Mundorf, A. Symmetry and asymmetry in biological structures. Proc. Natl. Acad. Sci. USA 2022, 119, e2204881119. [Google Scholar] [CrossRef]
  5. Armbruster, W.S. Floral specialization increases pollination precision: The roles of floral orientation, symmetry, fusion and stamen number. New Phytol. 2022, 235, 1307–1309. [Google Scholar] [CrossRef]
  6. Grimes, D.T.; Burdine, R.D. Left-right patterning: Breaking symmetry to asymmetric morphogenesis. Trends Genet. 2017, 33, 616–628. [Google Scholar] [CrossRef]
  7. Smith, J.M. Must reliable signals always be costly? Anim. Behav. 1994, 47, 1115–1120. [Google Scholar] [CrossRef]
  8. Koshio, C.; Muraji, M.; Tatsuta, H.; Kudo, S. Sexual selection in a moth: Effect of symmetry on male mating success in the wild. Behav. Ecol. 2007, 18, 571–578. [Google Scholar] [CrossRef]
  9. Weyl, H. Symmetry; Princeton University Press: Princeton, NJ, USA, 1982; p. 176. [Google Scholar]
  10. Li, R.; Bowerman, B. Symmetry breaking in biology. Cold Spring Harb. Perspect. Biol. 2010, 2, a003475. [Google Scholar] [CrossRef]
  11. Lockwood, E.H.; Macmillan, R.H. Geometric Symmetry; Cambridge Press: London, UK, 1978; p. 228. [Google Scholar]
  12. Kuznetsov, A.N. Glide symmetry in deuterostomes: An evolutionary perspective. Zool. J. Linn. Soc. 2024, 200, 621–643. [Google Scholar] [CrossRef]
  13. Gross, D.J. The role of symmetry in fundamental physics. Proc. Natl. Acad. Sci. USA 1996, 93, 14256–14259. [Google Scholar] [CrossRef] [PubMed]
  14. Loeb, A.L. Color and Symmetry; Wiley: New York, NY, USA, 1971; p. 179. [Google Scholar]
  15. Moran, N.A.; Jarvik, T. Lateral transfer of genes from fungi underlies carotenoid production in aphids. Science 2010, 328, 624–627. [Google Scholar] [CrossRef] [PubMed]
  16. Hill, G.E. A Red Bird in a Brown Bag: The Function and Evolution of Colorful Plumage in the House Finch; Oxford University Press: Oxford, UK, 2002; p. 318. [Google Scholar]
  17. Andersson, S.; Prager, M.; Johansson, E.I.A. Carotenoid content and reflectance of yellow and red nuptial plumages in widowbirds (Euplectes spp.). Funct. Ecol. 2007, 21, 272–281. [Google Scholar] [CrossRef]
  18. Hill, G.E.; Johnson, J.D. The vitamin A-redox hypothesis: A biochemical basis for honest signaling via carotenoids pigmentation. Am. Nat. 2012, 180, E127–E150. [Google Scholar] [CrossRef]
  19. Weaver, R.J.; Santos, E.S.A.; Tucker, A.M.; Wilson, A.E.; Hill, G.E. Carotenoid metabolism strengthens the link between feather coloration and individual quality. Nat. Commun. 2017, 9, 73. [Google Scholar] [CrossRef]
  20. Bleiweiss, R. Novel chromatic and structural biomarkers of diet in carotenoid-bearing plumage. Proc. Royal Soc. 2004, 271, 2327–2335. [Google Scholar] [CrossRef]
  21. Bleiweiss, R. On the ecological basis of interspecific homoplasy in carotenoid-bearing signals. Evolution 2007, 61, 2861–2878. [Google Scholar] [CrossRef]
  22. Bleiweiss, R. Phenotypic integration expressed by carotenoid-bearing plumages of tanager-finches (Thraupini, Emberizinae) across the avian visible spectrum. Biol. J. Linn. Soc. 2008, 93, 89–109. [Google Scholar] [CrossRef]
  23. Price, T. Speciation in Birds; Roberts & Company Publishers: Greenwood Village, CO, USA, 2007; p. 470. [Google Scholar]
  24. Rodriguez-Amaya, D.B. A Guide to Carotenoid Analysis in Foods; International Life Sciences Institute Press: Washington, DC, USA, 2001; p. 64. [Google Scholar]
  25. McGraw, K.J. Mechanics of carotenoid-based coloration. In Bird Coloration: Mechanisms and Measurements; Hill, G.E., McGraw, K.J., Eds.; Harvard University Press: Cambridge, UK, 2006; Volume I, pp. 177–242. [Google Scholar]
  26. Bleiweiss, R. Concerted shifts in absorption maxima of yellow and red plumage carotenoids support specialized tuning of chromatic signals to different visual systems in near-passerine birds. Evol. Biol. 2017, 45, 75–95. [Google Scholar] [CrossRef]
  27. Linville, S.U.; Breitwisch, R. Carotenoid availability and plumage coloration in a wild population of Northern Cardinals. Auk 1997, 114, 796–800. [Google Scholar] [CrossRef]
  28. Eeva, T.; Helle, S.; Salminen, J.-P.; Hakkarainen, H. Carotenoid composition of invertebrates consumed by two insectivorous bird species. J. Chem. Ecol. 2010, 36, 608–613. [Google Scholar] [CrossRef] [PubMed]
  29. García-Navas, V.; Ferrer, E.S.; Sanz, J.J. Plumage yellowness predicts foraging ability in the blue tit Cyanistes caeruleus. Biol. J. Linn. Soc. 2012, 106, 418–429. [Google Scholar] [CrossRef]
  30. Stradi, R.; Celentano, G.; Rossi, E.; Rovati, G.; Pastore, M. Carotenoids in bird plumage—I. The carotenoid pattern in a series of palearctic carduelinae. Comp. Biochem. Physiol. Part B Biochem. Mol. Biol. 1995, 110, 131–143. [Google Scholar] [CrossRef]
  31. McCoy, D.E.; Shultz, A.J.; Dall, J.E.; Dionne, J.A.; Johnsen, S. The carotenoid redshift: Physical basis and implications for visual signaling. Ecol. Evol. 2023, 13, e10408. [Google Scholar] [CrossRef]
  32. Hill, G.E. Redness as a measure of the production cost of ornamental coloration. Ethol. Ecol. Evol. 1996, 8, 157–175. [Google Scholar] [CrossRef]
  33. Hill, G.E. Condition-dependent traits as signals of the functionality of vital cellular processes. Ecol. Lett. 2011, 14, 625–634. [Google Scholar] [CrossRef]
  34. Olson, V.A.; Owens, I.P.F. Costly sexual signals: Are carotenoids rare, risky or required? Trends Ecol. Evol. 1999, 13, 510–514. [Google Scholar] [CrossRef]
  35. Pryke, S.R.; Andersson, S.; Lawes, M.J. Sexual selection on multiple handicaps in the red-collared widowbird: Female choice of tail length but not carotenoid display. Evolution 2001, 55, 1452–1463. [Google Scholar] [CrossRef]
  36. Hart, N.S.; Hunt, D.M. Avian visual pigments: Characteristics, spectral tuning, and evolution. Am. Nat. 2007, 169 (Suppl. S1), S7–S26. [Google Scholar] [CrossRef]
  37. Ödeen, A.; Håstad, O. The phylogenetic distribution of ultraviolet sensitivity in birds. BMC Evol. Biol. 2013, 13, 36. [Google Scholar] [CrossRef]
  38. Bleiweiss, R. Physical alignments between plumage carotenoid spectra and cone sensitivities in ultraviolet-sensitive (UVS) birds (Passerida: Passeriformes). Evol. Biol. 2014, 41, 404–424. [Google Scholar] [CrossRef]
  39. Bleiweiss, R. Extrinsic versus intrinsic control of avian communication based on colorful plumage porphyrins. Evol. Biol. 2015, 42, 483–501. [Google Scholar] [CrossRef]
  40. Hill, G.E. Female mate choice for ornamental coloration. In Bird Coloration: Function and Evolution; Hill, G.E., McGraw, K.J., Eds.; Harvard University Press: Cambridge, MA, USA, 2006; Volume 2, pp. 137–200. [Google Scholar]
  41. Delhey, K.; Valcu, M.; Dale, J.; Kempenaers, B. The evolution of carotenoid-based plumage colours in passerine birds. J. Anim. Ecol. 2023, 92, 66–77. [Google Scholar] [CrossRef]
  42. Ödeen, A.; Håstad, O.; Alström, P. Evolution of ultraviolet vision in the largest avian radiation—The passerines. BMC Evol. Biol. 2011, 11, 313. [Google Scholar] [CrossRef]
  43. Bloch, N.I. Evolution of opsin expression in birds driven by sexual selection and habitat. Proc. Royal Soc. Series B Biol. Sci. 2015, 282, 2321–2329. [Google Scholar] [CrossRef]
  44. Casalía, B.; Vilacoba, E.; Lavinia, P.D.; Tubaro, P.L.; Barreira, A.S. UV sensitive vision in cardinals and tanagers is ubiquitous. Emu-Austr. Ornith. 2020, 120, 355–359. [Google Scholar] [CrossRef]
  45. Weckstein, J.D. Molecular phylogenetics of the Ramphastos toucans: Implications for the evolution of morphology, vocalizations, and coloration. Auk 2005, 122, 1191–1209. [Google Scholar] [CrossRef]
  46. Thomas, D.B.; McGraw, K.J.; James, H.F.; Madden, O. Non-destructive descriptions of carotenoids in feathers using Raman spectroscopy. Anal. Methods 2014, 6, 1301–1308. [Google Scholar] [CrossRef]
  47. Thomas, D.B.; McGraw, K.J.; Butler, M.W.; Carrano, M.T.; Madden, O.; James, H.F. Ancient origins and multiple appearances of carotenoid-pigmented feathers in birds. Proc. Royal Soc. Ser. B Biol. Sci. 2014, 281, 20140806. [Google Scholar] [CrossRef]
  48. Prum, R.O.; Samuelson, L. Mimicry cycles, traps, and chains. The coevolution of toucan and kiskadee mimicry. Am. Nat. 2016, 187, 753–764. [Google Scholar] [CrossRef]
  49. Jarvis, E.D.; Mirarab, S.; Aberer, A.J.; Li, B.; Houde, P.; Li, C.; Ho, S.Y.; Faircloth, B.C.; Nabholz, B.; Howard, J.T.; et al. Whole-genome analyses resolve early branches in the tree of life of modern birds. Science 2014, 346, 1320–1331. [Google Scholar] [CrossRef] [PubMed]
  50. Feng, S.; Stiller, J.; Deng, Y.; Armstrong, J.; Fang, Q.I.; Reeve, A.H.; Xie, D.; Chen, G.; Guo, C.; Faircloth, B.C.; et al. Dense sampling of bird diversity increases power of comparative genomics. Nature 2020, 587, 252. [Google Scholar] [CrossRef] [PubMed]
  51. Stiles, F.G.; Skutch, A.F. A Guide to the Birds of Costa Rica; Cornell University Press: Ithaca, NY, USA, 1989; p. 656. [Google Scholar]
  52. Remsen, J.V., Jr.; Hyde, M.A.; Chapman, A. The diets of Neotropical trogons, motmots, barbets and toucans. Condor 1993, 95, 178–192. [Google Scholar] [CrossRef]
  53. Del Hoyo, J.; Elliott, A.; Sargatal, J. Handbook of Birds of the World. Mousebirds to Hornbills; Lynx Ediciones: Barcelona, Spain, 2001; Volume 6, p. 589. [Google Scholar]
  54. Del Hoyo, J.; Elliott, A.; Sargatal, J. Handbook of Birds of the World. Jacamars to Woodpeckers; Lynx Ediciones: Barcelona, Spain, 2002; Volume 7, p. 613. [Google Scholar]
  55. Short, L.L.; Horne, J.F.M. Toucans, Barbets, and Honeyguides; Oxford University Press: Oxford, UK, 2001; p. 526. [Google Scholar]
  56. Test, F.H. Relation of wing and tail color of the woodpeckers Colaptes auratus and C. cafer to their food. Condor 1969, 71, 206–211. [Google Scholar] [CrossRef]
  57. Hudon, J.; Driver, R.J.; Rice, N.H.; Lloyd-Evans, T.L.; Craves, J.A.; Shustack, D.P. Diet explains red flight feathers in Yellow-shafted Flickers in eastern North America. Auk 2016, 134, 22–33. [Google Scholar] [CrossRef]
  58. Dierenfeld, E.S.; Sheppard, C.D. Canthaxanthin pigment does not maintain color in carmine bee-eaters. Zoo Biol. 1996, 15, 183–185. [Google Scholar] [CrossRef]
  59. Gamble, K.C. Coraciiformes (kingfishers, motmots, bee-eaters, hoopoes, hornbills). In Zoo and Wild Animal Medicine; Miller, R.E., Fowler, M.E., Eds.; Elsevier Saunders: St. Louis, MO, USA, 2015; Volume 8, pp. 225–230. [Google Scholar]
  60. Sykes, J.M.I.V. Piciformes (honeyguides, barbets, woodpeckers, toucans). In Zoo and Wild Animal Medicine; Miller, R.E., Fowler, M.E., Eds.; Elsevier Saunders: St. Louis, MO, USA, 2015; Volume 8, pp. 230–236. [Google Scholar]
  61. Association of Zoos & Aquariums. Toucan Husbandry Manual. 2021. Available online: https://www.coursehero.com/file/103180628/Toucan-manualpdf/ (accessed on 7 June 2024).
  62. Green, P.A.; Brandley, N.C.; Nowicki, S. Categorical perception in animal communication and decision-making. Behav. Ecol. 2020, 31, 859–867. [Google Scholar] [CrossRef]
  63. Inouye, C.Y.; Hill, G.E.; Stradi, R.D.; Montgomerie, R. Carotenoid pigments in male house finch plumage in relation to age, subspecies, and ornamental coloration. Auk 2001, 118, 900–915. [Google Scholar] [CrossRef]
  64. Prager, M.; Andersson, S. Convergent evolution of red carotenoid coloration in widowbirds and bishops (Euplectes spp.). Evolution 2010, 64, 3609–3619. [Google Scholar] [CrossRef]
  65. Andersson, S.; Prager, M. Quantifying colors. In Bird Coloration: Mechanisms and Measurements; Hill, G.E., McGraw, K.J., Eds.; Harvard University Press: Cambridge, UK, 2006; Volume I, pp. 41–89. [Google Scholar]
  66. Toral, G.M.; Figuerola, J.; Negro, J.J. Multiple ways to become red: Pigment identification in red feathers using spectrometry. Comp. Biochem. Physiol. Part B Biochem. Mol. Biol. 2008, 150, 147–152. [Google Scholar] [CrossRef]
  67. LaFountain, A.M.; Prum, R.O.; Frank, H. Diversity, physiology, and evolution of avian plumage carotenoids and the role of carotenoid-protein interactions in plumage color appearance. Arch. Biochem. Biophys. 2015, 572, 201–212. [Google Scholar] [CrossRef] [PubMed]
  68. Mendes-Pinto, M.M.; LaFountain, A.M.; Stoddard, M.C.; Prum, R.O.; Frank, H.A.; Robert, B. Variation in carotenoid-protein interaction in bird feathers produces novel plumage coloration. J. Royal Soc. Interf. 2012, 9, 3338–3350. [Google Scholar] [CrossRef] [PubMed]
  69. Lind, O.; Mitkus, M.; Olsson, P.; Kelber, A. Ultraviolet vision in birds: The importance of transparent eye media. Proc. Royal Soc. Series B Biol. Sci. 2014, 281, 20132209. [Google Scholar] [CrossRef]
  70. Bleiweiss, R. Variation in ultraviolet reflectance by carotenoid-bearing feathers of tanagers (Thraupini: Emberizinae: Passeriformes). Biol. J. Linn. Soc. 2005, 84, 243–257. [Google Scholar] [CrossRef]
  71. Hudon, J. Unusual carotenoid use by the western tanager (Piranga ludoviciana) and its evolutionary implications. Can. J. Zool. 1991, 69, 2311–2320. [Google Scholar] [CrossRef]
  72. Brambilla, L.; Canali, G.; Mannucci, E.; Massa, R.; Saino, N.; Stradi, R.; Zerbi, G. Colori In Volo: Il Piumaggio Degli Uccelli Ricerca Scientifica e Cultura Umanistica; Universita degli Studi di Milano: Milan, Italy, 1999. [Google Scholar]
  73. Eisermann, K.; Omland, K. Coloration anomaly of a male collared trogon (Trogon collaris). Acta Zool. Mex. 2007, 23, 197–200. [Google Scholar] [CrossRef]
  74. Billerman, S.M.; Keeney, B.K.; Rodewald, P.G.; Schulenberg, T.S. Birds of the World; Cornell Laboratory of Ornithology: Ithaca, NY, USA, 2022; Available online: https://birdsoftheworld.org/bow/home (accessed on 28 April 2025).
  75. Olson, V.A. Estimating nutrient intake in comparative studies of animals: An example using dietary carotenoid content in birds. Oikos 2006, 112, 620–628. [Google Scholar] [CrossRef]
  76. McNett, G.D.; Marchetti, K. Ultraviolet degradation in carotenoid patches: Live versus museum specimens of wood warblers (Parulidae). Auk 2005, 122, 793–802. [Google Scholar] [CrossRef]
  77. Armenta, J.K.; Dunn, P.O.; Whittingham, L.A. Effects of specimen age on plumage color. Auk 2008, 125, 803–808. [Google Scholar] [CrossRef]
  78. Engqvist, L. The mistreatment of covariate interaction terms in linear model analyses of behavioural and evolutionary ecology studies. Anim. Behav. 2005, 70, 967–971. [Google Scholar] [CrossRef]
  79. Whisman, M.A.; McClelland, G.H. Designing, testing, and interpreting interactions and moderator effects in family research. J. Fam. Psychol. 2005, 19, 111–120. [Google Scholar] [CrossRef] [PubMed]
  80. Draper, N.R.; Smith, H. Applied Regression Analysis, 3rd ed.; John Wiley & Sons, Inc.: New York, NY, USA, 1998; p. 706. [Google Scholar]
  81. UCLA: Statistical Consulting Group. Decomposing, Probing, and Plotting Interactions in R. 2021. Available online: https://stats.idre.ucla.edu/r/seminars/interactions-r/#s4a (accessed on 11 November 2021).
  82. Allison, P. When Can You Safely Ignore Multicollinearity? Statistical Horizons. 2012. Available online: http://statisticalhorizons.com/multicollinearity (accessed on 26 March 2024).
  83. R Core Team. R Version 3.6.1: A Language and Environment for Statistical Computing. R Foundation for Statistical Computing, Vienna, Austria. 2019. Available online: https://www.R-project.org/ (accessed on 7 June 2024).
  84. Paradis, E.; Schliep, K. ape 5.0: An environment for modern phylogenetics and evolutionary analyses in R. Bioinformatics 2018, 35, 526–528. [Google Scholar] [CrossRef] [PubMed]
  85. Pinheiro, J.; Bates, D.; DebRoy, S.; Sarkar, D.; R Core Team. nlme: Linear and Nonlinear Mixed Effects Models. R Package Version 3.1-141. 2019. Available online: https://CRAN.R-project.org/package=nlme (accessed on 7 June 2024).
  86. Shakya, S.B.; Fuchs, J.; Pons, J.-M.; Sheldon, F.H. Tapping the woodpecker tree for evolutionary insight. Mol. Phylogenetics Evol. 2017, 116, 182–191. [Google Scholar] [CrossRef]
  87. Maddison, W.P.; Maddison, D.R. Mesquite: A Modular System for Evolutionary Analysis. Version 3.04. 2015. [Google Scholar]
  88. Cooper, N.; Thomas, G.H.; Venditti, C.; Meade, A.; Freckleton, R.P. A cautionary note on the use of Ornstein Uhlenbeck models in macroevolutionary studies. Biol. J. Linn. Soc. 2016, 118, 64–77. [Google Scholar] [CrossRef]
  89. Grafen, A. The phylogenetic regression. Philos. Trans. R. Soc. Lond. Ser. B 1989, 326, 119–157. [Google Scholar] [CrossRef]
  90. Ives, A.R.; Li, D. rr2: An R package to calculate R2s for regression models. J. Open Source Softw. 2018, 3, 1028. [Google Scholar] [CrossRef]
  91. Ives, A.R.; Li, D. rr2 1.0.2: (R Package). 2018. Available online: https://github.com/arives/rr2 (accessed on 7 June 2024).
  92. Ives, A.R. R2s for correlated data: Phylogenetic models, LMMs, and GLMMs. Syst. Biol. 2019, 68, 234–251. [Google Scholar] [CrossRef]
  93. Echambadi, R.; Hess, J.D. Mean-centering does not alleviate collinearity problems in moderated multiple regression models. Mark. Sci. 2007, 26, 438–445. [Google Scholar] [CrossRef]
  94. Fox, J.; Weisberg, S. An R Companion to Applied Regression, 3rd ed.; SAGE: Thousand Oaks CA, USA, 2019; p. 608. Available online: https://www.john-fox.ca/Companion/ (accessed on 7 June 2024).
  95. Iacobucci, D.; Schneider, M.J.; Popovich, D.L.; Bakamitsos, G.A. Mean centering helps alleviate “micro” but not “macro” multicollinearity. Behav. Res. Methods 2016, 48, 1308–1317. [Google Scholar] [CrossRef]
  96. Lavin, S.R.; Karasov, W.H.; Ives, A.R.; Middleton, K.M.; Garland, T., Jr. Morphometrics of the avian small intestine compared with that of nonflying mammals: A phylogenetic approach. Physiol. Biochem. Zool. 2008, 81, 526–550. [Google Scholar] [CrossRef]
  97. Rothman, K.J. No adjustments are needed for multiple comparisons. Epidemiology 1990, 1, 43–46. [Google Scholar] [CrossRef] [PubMed]
  98. SAS Users Guide, Version 9.4 On Line Documentation. SAS® Institute Inc: Cary NC, USA. 2015. Available online: https://support.sas.com/en/documentation.html (accessed on 7 June 2024).
  99. Social Science Statistics. Levene’s Test of Homogeneity of Variance Calculator. Available online: https://www.socscistatistics.com/tests/levene/default.aspx (accessed on 9 October 2023).
  100. Delhey, K.; Peters, A.; Kempenaers, B. Cosmetic coloration in birds: Occurrence, function, and evolution. Am. Nat. 2007, 169, S145–S158. [Google Scholar] [CrossRef] [PubMed]
  101. Chiale, M.C.; Rendón, M.A.; Labaude, S.; Deville, A.-S.; Garrido-Fernández, J.; Pérez-Gálvez, A.; Garrido, A.; Rendón-Martos, M.; Béchet, A.; Amat, J.A. The color of greater flamingo feathers fades when no cosmetics are applied. Ecol. Evol. 2021, 11, 13773–13779. [Google Scholar] [CrossRef]
  102. Amat, J.A.; Garrido, A.; Rendón-Martos, M.; Portavia, F.; Rendón, M.A. Plumage coloration in greater flamingos Phoenicopterus roseus is affected by interactions between foraging site, body condition and sex. Ardeola 2022, 69, 219–229. [Google Scholar] [CrossRef]
  103. Emmerton, J.; Delius, J.D. Wavelength discrimination in the “visible” and ultraviolet spectrum by pigeons. J. Comp. Physiol. 1980, 141, 47–52. [Google Scholar] [CrossRef]
  104. Osorio, D.; Vorobyev, M.; Jones, C.D. Colour vision of domestic chicks. J. Exp. Biol. 1999, 202, 2951–2959. [Google Scholar] [CrossRef]
  105. Osorio, D.; Jones, C.D.; Vorobyev, M. Accurate memory for colour but not pattern contrast in chicks. Curr. Biol. 1999, 9, 199–202. Available online: http://biomednet.com/elecref/0960982200900199 (accessed on 7 June 2024).
  106. Garcia, J.E.; Rohr, D.H.; Dyer, A.G. Colour discrimination from perceived differences by birds. Front. Ecol. Evol. 2021, 9, 639513. [Google Scholar] [CrossRef]
  107. Knott, B.; Berg, M.L.; Morgan, E.R.; Buchanan, K.L.; Bowmaker, J.K.; Bennett, A.T.D. Avian retinal oil droplets: Dietary manipulation of colour vision. Proc. R. Soc. Ser. B Biol. Sci. 2010, 277, 953–962. [Google Scholar] [CrossRef]
  108. Lim, H.H.; Pike, T.W. Dietary carotenoid availability affects avian color discrimination. Behav. Ecol. 2016, 27, 1579–1584. [Google Scholar] [CrossRef]
  109. Toomey, M.B.; Lind, O.; Frederiksen, R.; Curley, R.W., Jr.; Riedl, K.M.; Wilby, D.; Schwartz, S.J.; Witt, C.C.; Harrison, E.H. Complementary shifts in photoreceptor spectral tuning unlock the full adaptive potential of ultraviolet vision in birds. eLife 2016, 5, e15675. [Google Scholar] [CrossRef] [PubMed]
  110. Mahler, B.; Araujo, L.S.; Tubaro, P.L. Dietary and sexual correlates of carotenoid pigment expression in dove plumage. Condor 2003, 105, 258–267. [Google Scholar] [CrossRef]
  111. Bergeron, Z.T.; Fuller, R.C. Using human vision to detect variation in avian coloration: How bad is it? Am. Nat. 2018, 191, 269–276. [Google Scholar] [CrossRef]
  112. Hart, N.S.; Vorobyev, M. Modelling oil droplet absorption spectra and spectral sensitivities of bird cone photoreceptors. J. Comp. Physiol. Part A Neuroethol. Sens. Neural Behav. Physiol. 2005, 191, 381–392. [Google Scholar] [CrossRef]
  113. Martin, T.E.; Badyaev, A.V. Sexual dichromatism in birds: Importance of nest predation and nest location for females versus males. Evolution 1996, 50, 2454–2460. [Google Scholar] [CrossRef] [PubMed]
  114. Bednarz, J.C.; Ripper, D.; Radley, P.M. Emerging concepts and research directions in the study of cavity-nesting birds: Keystone ecological processes. Condor 2004, 106, 1–4. [Google Scholar] [CrossRef]
  115. West-Eberhard, M.J. Sexual selection, social competition, and speciation. Q. Rev. Biol. 1983, 58, 155–183. [Google Scholar] [CrossRef]
  116. Olson, V.A.; Owens, I.P.F. Interspecific variation in the use of carotenoid-based coloration in birds: Diet, life history and phylogeny. J. Evol. Biol. 2005, 18, 1534–1546. [Google Scholar] [CrossRef]
  117. Senar, J.C.; Negro, J.J.; Quesada, J.; Ruiz, I.; Garrido, J. Two pieces of information in a single trait? The yellow breast of the great tit (Parus major) reflects both pigment acquisition and body condition. Behaviour 2008, 145, 1195–1210. [Google Scholar] [CrossRef]
  118. Koch, R.E.; Hill, G.E. Do carotenoid-based ornaments entail resource trade-offs? An evaluation of theory and data. Funct. Ecol. 2018, 32, 1908–1920. [Google Scholar] [CrossRef]
  119. Stradi, R. The Colour of Flight: Carotenoids in Bird Plumage; Solei Gruppo Editoriale Informatico: Milan, Italy, 1998. [Google Scholar]
  120. McGraw, K.J.; Gregory, A.J. Carotenoid pigments in male American goldfinches: What is the optimal biochemical strategy for becoming colorful? Biol. J. Linn. Soc. 2004, 83, 273–280. [Google Scholar] [CrossRef]
  121. Chui, K.S.; McGraw, K.J.; Doucet, S.M. Carotenoid-based plumage coloration in golden-crowned kinglets Regulus satrapa: Pigment characterization and relationships with migratory timing and condition. J. Avian Biol. 2011, 42, 309–322. [Google Scholar] [CrossRef]
  122. Liebman, P.A.; Granda, A.M. Super dense carotenoid spectra resolved in single cone oil droplets. Nature 1975, 253, 370–372. [Google Scholar] [CrossRef]
  123. Stradi, R.; Hudon, J.; Celentano, G.; Pini, E. Carotenoids in bird plumage: The complement of yellow and red pigments in true woodpeckers (Picinae). Comp. Biochem. Physiol. B 1998, 120, 223–230. [Google Scholar] [CrossRef]
  124. Prum, R.O.; LaFountain, A.M.; Berg, C.J.; Tauber, M.J.; Frank, H.A. Mechanism of carotenoid coloration in the brightly colored plumages of broadbills (Eurylaimidae). J. Comp. Physiol. B 2014, 184, 651–672. [Google Scholar] [CrossRef]
  125. Hill, G.E.; Hood, W.R.; Ge, Z.; Grinter, R.; Greening, C.; Johnson, J.D.; Park, N.R.; Taylor, H.A.; Andreasen, V.A.; Powers, M.J.; et al. Plumage redness signals mitochondrial function in the house finch. Proc. R. Soc. Ser. B Biol. Sci. 2019, 286, 20191354. [Google Scholar] [CrossRef]
  126. Grether, G.F.; Kolluru, G.R.; Rodd, F.H.; De La Cerda, J.; Shimazaki, K. Carotenoid availability affects the development of a colour-based mate preference and the sensory bias to which it is genetically linked. Proc. R. Soc. Lond. Ser. B 2005, 272, 2181–2188. [Google Scholar] [CrossRef]
  127. McGraw, K.J.; Nolan, P.M.; Crino, O.L. Carotenoid accumulation strategies for becoming a colourful House Finch: Analyses of plasma and liver pigments in wild moulting birds. Funct. Ecol. 2006, 20, 678–688. [Google Scholar] [CrossRef]
  128. Leniowski, K.; Węgrzyn, E. The carotenoid-based red cap of the Middle Spotted Woodpecker Dendrocopos medius reflects individual quality and territory size. Ibis 2013, 155, 804–813. [Google Scholar] [CrossRef]
  129. Surmacki, A.; Zduniak, R.; Dylewski, L.; Nowakowska, P.; Myczko, L. No evidence for potential sexual information from a monochromatic carotenoid trait in a dichromatic woodpecker species. J. Ornithol. 2022, 163, 967–975. [Google Scholar] [CrossRef]
  130. Fuller, R.C.; Houle, D.; Travis, J. Sensory bias as an explanation for the evolution of mate preferences. Am. Nat. 2005, 166, 437–446. [Google Scholar] [CrossRef] [PubMed]
  131. Ryan, M.J.; Cummings, M.E. Perceptual biases and mate choice. Annu. Rev. Ecol. Evol. Syst. 2013, 44, 437–459. [Google Scholar] [CrossRef]
  132. Ninnes, C.E.; Andersson, S. Male receiver bias for red agonistic signalling in a yellow-signalling widowbird: A field experiment. Proc. R. Soc. Lond. Ser. B 2014, 281, 20140971. [Google Scholar] [CrossRef] [PubMed]
  133. Cummings, M.E.; Endler, J.A. 25 years of sensory drive: The evidence and its watery bias. Curr. Zool. 2018, 64, 471–484. [Google Scholar] [CrossRef]
  134. Rodd, F.H.; Hughes, K.A.; Grether, G.F.; Baril, C.T. A possible non-sexual origin of mate preference: Are male guppies mimicking fruit? Proc. R. Soc. Lond. Ser. B 2002, 269, 475–481. [Google Scholar] [CrossRef]
  135. Benz, B.W.; Robbins, M.B.; Zimmer, K.J. Phylogenetic relationships of the Helmeted Woodpecker (Dryocopus galeatus): A case of interspecific mimicry? Auk 2015, 132, 938–950. [Google Scholar] [CrossRef]
  136. Miller, E.T.; Leighton, G.M.; Freeman, B.G.; Lees, A.C.; Ligon, R.A. Ecological and geographical overlap drive plumage evolution and mimicry in woodpeckers. Nat. Commun. 2019, 10, 1602. [Google Scholar] [CrossRef]
  137. Hedley, E.; Caro, T. Aposematism and mimicry in birds. Ibis 2021, 163, 1–13. [Google Scholar] [CrossRef]
  138. Baker, R.R.; Parker, G.A. The evolution of colouration in birds. Phil. Trans. R. Soc. Lond. Series B 1979, 287, 63–130. [Google Scholar] [CrossRef]
  139. Cody, M.L. Convergent characteristics in sympatric species: A possible relation to interspecific competition and aggression. Condor 1969, 71, 222–239. [Google Scholar] [CrossRef]
  140. Dumbacher, J.P.; Fleischer, R.C. Phylogenetic evidence for colour pattern convergence in toxic pitohuis: Mullerian mimicry in birds? Proc. R. Soc. Ser. B Biol. Sci. 2001, 268, 1971–1976. [Google Scholar] [CrossRef] [PubMed]
  141. Prum, R.O. Interspecific social dominance mimicry in birds. Zool. J. Linn. Soc. 2014, 172, 910–941. [Google Scholar] [CrossRef]
  142. Cassey, P.; Ewen, J.G.; Boulton, R.L.; Blackburn, T.M.; Møller, A.P.; Baird, C.; Olson, V.; Karadas, F. Egg carotenoids in passerine birds introduced to New Zealand: Relations to ecological factors, integument coloration and phylogeny. Funct. Ecol. 2005, 19, 719–726. [Google Scholar] [CrossRef]
  143. Czegzuga, B. Carotenoids in some parasitic nematodes. Bull. Acad. Pol. Sci. Biol. 1981, 28, 463–465. [Google Scholar]
  144. Czegzuga, B.; Weyda, F. Investigation on carotenoids in insects. V. Archaeognatha (Insecta, Apterygota). Zool. Polon. 1982, 29, 23–31. [Google Scholar]
  145. Czeczuga, B.; Czeczuga-Semeniuk, E.; Semeniuk, A. Carotenoids and carotenoproteins in the species of Odonata (Insecta). Trends Entomol. 2010, 6, 103–112. [Google Scholar]
  146. Finke, M.D. Complete nutrient content of four species of feeder insects. Zoo Biol. 2013, 32, 27–36. [Google Scholar] [CrossRef]
  147. Goodwin, T.W. The Biochemistry of the Carotenoids. Volume II. Animals, 2nd ed; Chapman and Hall: London, UK; New York, NY, USA, 1984; p. 224. [Google Scholar]
  148. Güi, A.; Pehlivan, T. Antioxidant activities of some monofloral honey types produced across Turkey. Saudi J. Biol. Sci. 2018, 25, 1056. [Google Scholar] [CrossRef]
  149. Kennedy, A.C. Examining Breeding Bird Diets to Improve Avian Conservation Efforts. Unpublished Doctoral Dissertation, University of Delaware, 2019; p. 130. Available online: https://udspace.udel.edu/server/api/core/bitstreams/4ced7460-3eb2-498b-96e5-7e4edc0d0de1/content (accessed on 7 June 2024).
  150. Keyser, H. Carotenoids in stick insects (phasmids). A quantitative comparison of six species at major developmental stages. Comp. Biochem. Physiol. Part B 1982, 72 B, 427–432. [Google Scholar] [CrossRef]
  151. Oonincx, D.G.A.B.; Dierenfeld, E.S. An investigation into the chemical composition of alternative invertebrate prey. Zoo Biol. 2012, 31, 40–54. [Google Scholar] [CrossRef]
Figure 1. Schematics depicting two broad categories of symmetries observed in nature, i.e., those that preserve the same (conventional symmetries) or opposite (antisymmetries) relationships. Symmetries of morphological form (bilateral and radial) in relation to a reference axis are the best-known ones for biological systems (A,B); however, formal symmetries can be generalized to any transformation that preserves the relationships between constituent parts (C). The extension of symmetry concepts to the consideration of opposites enables the consideration of many additional phenomena in this framework, including those of slopes and colors (DF). The latter can be described as dichromatic if two colors are involved, and polychromatic if three or more are, as in a gradient. Wavelength-based color symmetries are those most relevant to studies of plumage reflectance. In the diagram, an arrow indicates a dynamic relationship, and colors indicate corresponding wavelengths.
Diversity 17 00379 g001
Figure 2. Representative species and higher taxa of unsexed, adult violet-sensitive (VS) Piciformes–Coraciiformes included in this study of carotenoid-based (yellow, orange, and red) plumage coloration: (A) Collared Araçari Pteroglossus torquatus (Ramphastidae); (B) cinnamon-chested bee-eater Merops oreobates (Meropidae); (C) green-billed toucan Ramphastos dicolorus (Ramphastidae); (D) black-rumped flameback woodpecker Dinopium benghalense (Picidae); (E) coppersmith barbet Psilopogon haemacephalus (Megalaimidae); (F) red-throated bee-eater Merops bulocki (Meropidae). Birds are not shown to absolute or relative scale, and color names are based on human eye perceptions. Shutterstock photo credits: (A) Vaclav Sebek, (B) Agami Photo Agency, (C) Rafael Martos Martins, (D) Thsulemani, (E) Anusak Thuwangkawat, (F) Martin Mecnarowski.
Diversity 17 00379 g002
Figure 3. Representative yellow (A,B), orange (C,D), and red (E,F) reflectance spectra of carotenoid-based plumage coloration for the violet-sensitive (VS) piciform–coraciiform species shown in Figure 2: (A) Collared Araçari Pteroglossus torquatus (male breast), DMNH 38756; (B) cinnamon-chested bee-eater Merops oreobates (female throat), DMNH 53850; (C) green-billed toucan Ramphastos dicolorus (female breast), LACM 47611; (D) black-rumped flameback woodpecker Dinopium benghalense (female back), UMMZ 144610; (E) coppersmith barbet Psilopogon haemacephalus (male breast), UMMZ 78565; and (F) red-throated bee-eater Merops bulocki (male throat), UMMZ 216790. Note the general sigmoidal shape typical of carotenoid-based plumage spectra, in which reflectance is modest at short wavelengths, lowest at middle wavelengths, and then rises rapidly to a higher plateau at long wavelengths. Three variables emphasizing features at longer (λR50) and shorter (Rcontrast, λRmin) wavelengths were used to estimate plumage blue (to shorter λs) and red (to longer λs) shifts in relation to dietary carotenoid content (Dietc). Vertical bars mark the wavelengths of half-maximal reflectance (λR50) and minimum reflectance (λRmin). Landmarks (λ320, λRmin, and λ700) used to calculate Rcontrast are also shown (see Section 2 for details). The horizontal pairs of species are color-coded to exemplify comparatively blue- (A,C,E) versus red- (B,D,F) shifted (based on λR50) plumage reflectance for each of the three carotenoid pigment classes (yellow > orange > red). Note the strong shifts observed in particular for yellow and orange plumages. By convention, ultraviolet wavelengths begin at ≤400 nm. See Table S1 for the key to museum abbreviations.
Diversity 17 00379 g003
Figure 4. Scatter plots showing the functional responses of the wavelength of half-maximal reflectance (λR50) to dietary carotenoid contents (Dietc) for yellow, orange, and red carotenoid pigment classes in violet-sensitive (VS) piciform–coraciiform males (A) and females (B). Functional responses (λR50 shift at higher values of Dietc) for each of the three carotenoid pigment classes summarized by best-fit least square regression lines. Note the overlap of pigment classes across Dietc, and graded functional responses across pigment classes (blue-shifts for yellow > orange > red) but not sex. See Section 3 for statistical details.
Diversity 17 00379 g004
Figure 5. Scatter plots showing the functional responses of the relative short-wavelength reflectance (Rcontrast) to dietary carotenoid contents (Dietc) for yellow, orange, and red carotenoid pigment classes in violet-sensitive (VS) piciform–coraciiform males (A) and females (B). Non-functional responses (no Rcontrast shifts at higher values of Dietc) for each of the three carotenoid pigment classes summarized by best-fit least square regression lines. Note the overlap of pigment classes across Dietc and no functional responses across pigment classes or sexes. See Section 3 for statistical details.
Diversity 17 00379 g005
Figure 6. Scatter plots showing the functional responses of the wavelength of minimum reflectance (λRmin) to dietary carotenoid contents (Dietc) for yellow, orange, and red carotenoid pigment classes in violet-sensitive (VS) piciform–coraciiform males (A) and females (B). Inconsistent functional responses (mainly absolute blue shifts for yellow λRmin at higher values of Dietc) among the three carotenoid pigment classes summarized by best-fit least square regression lines. Note the overlap of pigment classes across Dietc and varied functional responses across pigment classes and both sexes. See Section 3 for statistical details.
Diversity 17 00379 g006
Figure 7. Proposed pattern and process symmetries in wavelength-based plumage-carotenoid traits in response to Dietc and based on the color vision system independent of sex. Antisymmetric shift patterns are expressed by positive (color-coded red shift) versus negative (color-coded blue shift) slopes in response to higher Dietc (upper key) and are inherently polychromatic (Figure 1). Invariant processes are implied by ties between opposite shift patterns and higher Dietc (x-axis). The symmetries of patterns and processes appear broken when there is no response to Dietc. Arrows indicate dynamic responses, which may produce relative (zero slope) or absolute (negative slope) blue compared with red (positive slope) shifts (lower key). “Shared” intercepts emphasize that shifts are dynamic (based on slope) not static (based on mean) descriptions of functional responses to Dietc. Compared with a red-shift response (upper arrow), VS piciform–coraciiform shifts either are antisymmetric, polychromatic, and invariant (lower arrow), or else broken (middle arrow).
Diversity 17 00379 g007
Table 5. A full model (Table 1) selection table for relative short-wavelength reflectance (Rcontrast). Note the greater support observed for models with no (OLS) or weak (OU, BMGrafenE) compared with that for models with stronger (other BM models) phylogenetic constraints.
Model Results
FitParameters
Model aR2adjusted bMLK cLRT dRANK dPARM et1/2 f
Males
Unit
OLS−0.911178151.58054*1
OU−0.89419191151.95103*10.62112371.11595674
BMGrafenE−0.84897877352.95362*10.06682804
BMGrafenF−1.25753091944.66864 20.5
BMGrafenF−1.39522775742.21156 31.0
Ultrametric
OLS−0.911178151.58054*1
OU−0.911178151.58054*110.649360.065088154
BMGrafenE−0.84897877352.95362*10.06682804
BMGrafenF−1.25753091944.66864 20.5
BMGrafenF−1.46518151441.0169 31.0
Females
Unit
OLS−1.06448825347.82255 2
OU−0.93794758250.25778*10.47589471.456513764
BMGrafenE−0.97573344149.51434*10.1161438
BMGrafenF−1.22550978844.93106 30.5
BMGrafenF−1.32727311843.20967 41.0
Ultrametric
OLS−1.06448825347.82255 2
OU−0.92793122950.45729*10.42454631.632677474
BMGrafenE−0.97573344149.51434*10.1161438
BMGrafenF−1.22550978844.93106 30.5
BMGrafenF−1.36336529442.61718 41.0
a Evolutionary process models (models) include non-phylogenetic ordinary least squares (OLS) and phylogenetic generalized least squares (PGLS) under an Ornstein–Uhlenbeck (OU) or Brownian motion (BM) process. BM models were further subdivided by parameterization with Grafen’s ρ (BMGrafen), with ρ estimated by the model (BMGrafenE) or pre-set to 0.5 or starter tree 1.0 (BMGrafenF). All PGLS models were tested in two ways, using trees assigned unit (set to 1) or ultrametric (arbitrary ultrametrization) branch lengths in Mesquite v 3.03 [87]. b All parameter values were unchanged by the Reference Category designation. R2adjusted is based on 1 − {[(1 − R2) (N − 1)]/(N-p-1)}, where R2 = sample R2, p = number of predictors, and N = total sample size. c ln restricted maximum likelihood (MLK). A relatively more positive value indicates an improved model fit. d The likelihood ratio test (LRT) was applied for testing significant differences in model fit. Significance was based on the assumption that twice the difference in the paired ln ML values followed a χ2 distribution with 1 df, for which the critical value was 3.841 at p < 0.05. The best model(s) are indicated by * and RANK (rank support). e The values of key model parameters (PARM). OU α = evolutionary force strength returning the trait to long-term optimum; GrafenE = Grafen’s ρ estimated; GrafenF = Grafen’s ρ pre-set to 0.5 or 1.0. f Phylogenetic half-life (t1/2 = (ln(2))/α). The model values of t1/2 relative to tree height (11 for both sexes) supported a more rapid return to trait optimum in males (smaller) than in females (larger).
Table 6. Full model multiple regressions based on an OU process model and ultrametric tree for relative short-wavelength reflectance (Rcontrast) as dependent variable. The eight predictor variables differ only in which of the three pigment classes is designated as the Reference Category (0, 0) for these dummy variables.
Pigment Class Reference Category a
YellowOrangeRed
Model b,cBPModelBPModelBP
Males
Year−0.0013140.0123Year0.0018840.7805Year−0.000740.1956
YO−6.1793880.6423OY6.1793880.6423RY1.1671040.4388
YR−1.1671040.4388OR5.0122840.7064RO−5.0122840.7064
Dietc d0.0005960.8183Dietc e−0.0015810.7847Dietc f−0.002110.4368
YYearOYear0.0031980.6373OYearYYear−0.0031980.6373RYearYYear−0.0005740.455
YYearRYear0.0005740.455OYearRYear−0.0026240.6989RYearOYear0.0026240.6989
YDietcODietc−0.0021770.7315ODietcYDietc0.0021770.7315RDietcYDietc0.0027070.4714
YDietcRDietc−0.0027070.4714ODietcRDietc−0.000530.9339RDietcODietc0.000530.9339
Females
Year−0.00080010.2244Year−0.0021910.0121Year−0.0009320.0842
YO2.76096030.1808OY−2.760960.1808RY−0.1714760.9075
YR0.17147580.9075OR−2.5894850.1321RO2.5894840.1321
Dietc d0.00043160.8847Dietc e−0.0046340.2871Dietc f−0.0014010.6168
YYearOYear−0.00139050.1841OYearYYear0.001390.1841RYearYYear0.0001320.8618
YYearRYear−0.00013160.8618OYearRYear0.0012590.1466RYearOYear−0.0012590.1466
YDietcODietc−0.0050660.2826ODietcYDietc0.0050660.2826RDietcYDietc0.0018330.5667
YDietcRDietc−0.00183260.5667ODietcRDietc0.0032330.469RDietcODietc−0.0032330.469
a Pigment classes: Y = yellow, O = orange, and R = red. b Nmale = 83, and Nfemale = 77. Likelihood ratio tests revealed no significant differences between the best-fit models (OLS, OU, and BMGrafenE in males; OU and BMGrafenE in females). The near-identical results obtained for OLS and PGLS suggest that the df corrections for (two) tree polytomies were inconsequential. All the model term probabilities were two-tailed. c The interaction terms by pigment class (Y, O, and R). The intercept terms included in the models are not shown. Higher-order and multiplicative terms were excluded (non-significant). d Slope determination based on the additive properties of Bs. Yellow Rcontrast on Dietc = Dietc; Orange Rcontrast on Dietc = Dietc + YDietcODietc; and Red Rcontrast on Dietc = Dietc + YDietcRDietc. e Slope determination using the additive properties of Bs. Orange Rcontrast on Dietc = Dietc; Yellow Rcontrast on Dietc = Dietc + ODietcYDietc; and Red Rcontrast on Dietc = Dietc + ODietcRDietc. f Slope determination using the additive properties of Bs. Red Rcontrast on Dietc = Dietc; Yellow Rcontrast on Dietc = Dietc + RDietcYDietc; and Orange Rcontrast on Dietc = Dietc + RDietcODietc.
Table 7. Best-fit full model pigment class functional responses of relative short-wavelength reflectance (Rcontrast) to Dietc determined from the additive properties of the functional responses of the Reference Category (yellow) with interactions of the reference with the other two (orange and red) pigment classes.
Reference CategoryInteraction bPigment Class B Rcontrast on Dietc
YDietcYDietcODietcYDietcRDietcYellowOrangeRed
Model aBPBPBPYDietcYDietc + YDietcODietc YDietc + YDietcRDietc
Males
Unit
OLS0.00060.8183−0.00220.7315−0.00270.47140.0006−0.0016−0.0021
OU0.00150.5984−0.00340.5705−0.00370.27560.0015−0.0019−0.0022
BMGrafenE0.00100.7647−0.00210.7291−0.00300.38360.0010−0.0011−0.0020
Ultrametric
OLS0.00060.8183−0.00220.7315−0.00270.47140.0006−0.0016−0.0021
OU0.00060.8183−0.00220.7315−0.00270.47140.0006−0.0016−0.0021
BMGrafenE0.00100.7647−0.00210.7291−0.00300.38360.0010−0.0011−0.0020
Females
Unit
OLS−0.00010.9603−0.00410.4449−0.00010.9693−0.0001−0.0042−0.0003
OU0.00060.8431−0.00500.302−0.00130.69050.0006−0.0043−0.0007
BMGrafenE0.00130.7335−0.00410.4156−0.00050.89370.0013−0.00280.0008
Ultrametric
OLS−0.00010.9603−0.00410.4449−0.00010.9693−0.0001−0.0042−0.0003
OU0.00040.8847−0.00510.2826−0.00180.56670.0004−0.0046−0.0001
BMGrafenE0.00130.7335−0.00410.4156−0.00050.89370.0013−0.00280.0008
a For a full list of models, see Table 5. b For a full list of independent variables, see Table 6.
Table 8. The full model (Table 1) selection table for the wavelength of minimum reflectance (λRmin). Note greater support for models with no (OLS) or weak (OU, BMGrafenE) compared to stronger (other BM models) phylogenetic constraints.
Model Results
FitParameters
Model aR2adjusted bMLK cLRT dRANK dPARM et1/2 f
Males
Unit
OLS0.533508316−349.8368*1
OU0.533508316−349.8368*18.8302450.07849694
BMGrafenE0.533508316−349.8368*12.13 × 10−9
BMGrafenF0.355745835−363.2353 20.5
BMGrafenF0.32127503−365.3983 31.0
Ultrametric
OLS0.533508316−349.8368*1
OU0.533508316−349.8368*18.7588070.079137168
BMGrafenE0.533508316−349.8368*12.13 × 10−9
BMGrafenF0.355745835−363.2353 20.5
BMGrafenF0.278452746−367.9374 31.0
Females
Unit
OLS0.461572971−323.9015 2
OU0.493743324−321.5296*10.4610131.503530335
BMGrafenE0.492237294−321.644*10.1039528
BMGrafenF0.414395635−327.1352 30.5
BMGrafenF0.391746741−328.5962 41.0
Ultrametric
OLS0.461572971−323.9015 2
OU0.496649094−321.308*10.404894 1.711922579
BMGrafenE0.492237294−321.644*10.1039528
BMGrafenF0.414395635−327.1352 30.5
BMGrafenF0.385947829−328.9615 41.0
a Evolutionary process models (models) include non-phylogenetic ordinary least squares (OLS) and phylogenetic generalized least squares (PGLS) under an Ornstein–Uhlenbeck (OU) or Brownian motion (BM) process. BM models were further subdivided by parameterization with Grafen’s ρ (BMGrafen), with ρ estimated by the model (BMGrafenE) or pre-set to 0.5 or starter tree 1.0 (BMGrafenF). All PGLS models were tested in two ways, using trees assigned unit (set to 1) or ultrametric (arbitrary ultrametrization) branch lengths in Mesquite v 3.03 [87]. b All parameter values were unchanged by the Reference Category designation. R2adjusted is based on 1 − {[(1 − R2) (N − 1)]/(N-p-1)}, where R2 = sample R2, p = number of predictors, and N = total sample size. c ln restricted maximum likelihood (MLK). A relatively more positive value indicates an improved model fit. d The likelihood ratio test (LRT) was used for testing significant differences in model fit. Significance was based on the assumption that twice the difference in the paired ln ML values followed a χ2 distribution with 1 df, for which the critical value was 3.841 at p < 0.05. The best model(s) are indicated by * and RANK (rank support). e The values of key model parameters (PARM). OU α = evolutionary force strength returning the trait to long-term optimum; GrafenE = Grafen’s ρ estimated; GrafenF = Grafen’s ρ pre-set to 0.5 or 1.0. f The phylogenetic half-life (t1/2 = (ln(2))/α). The model values of t1/2 relative to tree height (11 for both sexes) supported a more rapid return to trait optimum in males (smaller) than in females (larger).
Table 9. Full model multiple regressions based on an OU process model and ultrametric tree for the wavelength of minimum reflectance (λRmin) as the dependent variable. The eight predictor variables differ only in which of the three pigment classes is designated as the Reference Category (0, 0) for these dummy variables.
Pigment Class Reference Category a
YellowOrangeRed
Model b,cBPModelBPModelBP
Males
Year−0.1670.1548Year−1.6490.284Year0.0540.6786
YO2,916.70590.3351OY−2916.7060.3351RY413.5850.228
YR−413.58540.228OR−3330.2910.2718RO3330.2910.2718
Dietc d−0.48510.4112Dietc e−1.0990.4038Dietc f0.4610.4541
YYearOYear−1.48250.3366OYearYYear1.4830.3366RYearYYear−0.220.2073
YYearRYear0.22050.2073OYearRYear1.7030.2704RYearOYear−1.7030.2704
YDietcODietc−0.61350.67ODietcYDietc0.6140.67RDietcYDietc−0.9460.2684
YDietcRDietc0.9460.2684ODietcRDietc1.560.2838RDietcODietc−1.560.2838
Females
Year−0.05860.7054Year0.25040.2169Year0.3610.0057
YO−620.42290.2019OY620.42290.2019RY806.95720.0228
YR−806.95720.0228OR−186.53420.642RO186.53420.642
Dietc d−1.07920.1331Dietc e0.49480.6306Dietc f−0.19250.774
YYearOYear0.3090.2104OYearYYear −0.3090.2104RYearYYear−0.41960.0209
YYearRYear0.41960.0209OYearRYear 0.11060.5851RYearOYear−0.11060.5851
YDietcODietc1.5740.1576ODietcYDietc−1.5740.1576RDietcYDietc−0.88660.2406
YDietcRDietc0.88660.2406ODietcRDietc−0.68740.5127RDietcODietc0.68740.5127
a Pigment classes: Y = yellow, O = orange, and R = red. b Nmale = 83, and Nfemale = 77. Likelihood ratio tests revealed no significant differences between the best-fit models (OLS, OU, and BMGrafenE in males; OU and BMGrafenE in females). Near-identical results obtained for OLS and PGLS suggest that the df corrections for (two) tree polytomies were inconsequential. All the model term probabilities were two-tailed. c The interaction terms by pigment class (Y, O, and R). The intercept terms included in the models are not shown. Higher-order and multiplicative terms were excluded (non-significant). d Slope determination based on the additive properties of Bs. Yellow λRmin on Dietc = Dietc; Orange λRmin on Dietc = Dietc + YDietcODietc; and Red λRmin on Dietc = Dietc + YDietcRDietc. e Slope determination using the additive properties of Bs. Orange λRmin on Dietc = Dietc; Yellow λRmin on Dietc = Dietc + ODietcYDietc; and Red λRmin on Dietc = Dietc + ODietcRDietc. f Slope determination using the additive properties of Bs. Red λRmin on Dietc = Dietc; Yellow λRmin on Dietc = Dietc + RDietcYDietc; and Orange λRmin on Dietc = Dietc + RDietcODietc.
Table 10. Best-fit full model pigment class functional responses of the wavelength of minimum reflectance (λRmin) to Dietc determined from the additive properties of the functional responses of the Reference Category (yellow) with interactions of the reference with the other two (orange and red) pigment classes.
Reference CategoryInteraction bPigment Class B λRmin on Dietc
YDietc YDietcODietcYDietcRDietc YellowOrangeRed
Model aBPBPBPYDietc YDietc + YDietcODietcYDietc + YDietcRDietc
Males
Unit
OLS−0.48510.4112−0.61350.67 0.9460.2684−0.4851−1.09860.4609
OU−0.48510.4112−0.61350.67 0.946 0.2684 −0.4851−1.09860.4609
BMGrafenE−0.48510.4112−0.61350.670.946 0.2684−0.4851−1.09860.4609
Ultrametric
OLS−0.48510.4112−0.61350.67 0.9460.2684−0.4851−1.09860.4609
OU−0.48510.4112−0.61350.67 0.946 0.2684 −0.4851−1.09860.4609
BMGrafenE−0.48510.4112−0.61350.670.946 0.2684−0.4851−1.09860.4609
Females
Unit
OLS−1.14820.07861.69110.181 0.80120.3708−1.14820.5429 −0.347
OU−0.95220.20231.56130.17 0.827 0.2864−0.95220.6091−0.1252
BMGrafenE−0.61210.47671.08390.36170.56090.4894−0.61210.4718−0.0512
Ultrametric
OLS−1.14820.07861.69110.181 0.8012 0.3708−1.14820.5429 −0.347
OU−1.07920.13311.574 0.15760.88660.2406−1.07920.4948−0.1926
BMGrafenE−0.61210.47671.08390.36170.56090.4894−0.61210.4718−0.0512
a For a full list of models, see Table 8. b For a full list of independent variables, see Table 9.
Table 11. Dietc range and plumage phenotype space extensions by sex for three carotenoid pigment classes across species sampled.
Carotenoid Class a
Dietc Range bPlumage Phenotype Space Extensions
Dietc cYellowOrangeRed Red–Yellow d Red–Orange eOrange–Yellow f
Males
High26.8326.2526.8300.58−0.58
Low9.59.59.5000
Females
High26.8326.2526.8300.58−0.58
Low9.59.59.5000
a Yellow, orange, and red pigment classes (see Section 2). b The Dietc as calculated by the methods described in the text and Table 1 (see Section 2). c The high and low values of Dietc. d Plumage phenotype RedHigh–YellowHigh: a positive number is a red extension and a negative number is a yellow extension. e Plumage phenotype RedHigh–OrangeHigh: a positive number is a red extension and a negative number is an orange extension. f Plumage phenotype OrangeHigh–YellowHigh: a positive number is an orange extension and a negative number is a yellow extension.
Table 12. Presence–absence expressions based on sex for the three carotenoid-based pigment classes across species sampled. Only 11 (20.37%) of 54 species were recorded as having these kinds of sexual expression differences.
Pigment Classes a
Singles Combinations b
Males c
YORY + OY + RO + RY + O + RMissing
Females c
Y120001000
O11000000
R00801100
Y + O00000000
Y + R000019000
O + R00102100
Y + O + R00000020
Missing d2020000NA d
a Matrix values are sexual pigment expression (presence-absence) monomorphisms (bolded, on-diagonal entries) or dimorphisms (unbolded, off-diagonal entries). Three carotenoid-based pigment classes were distinguished, as described in Section 2. The data calculations are shown in Figures S1 and S2. Y = yellow, O = orange, and R = red. b A “+” indicates combinations among patches; different patches are averaged within but not between pigment classes. c Frequencies may differ for unmeasured subspecies owing to their different carotenoid-based pigmentations. d Missing = no yellow, orange, or red plumage patches; and NA = by definition, excluded from this study.
Table 13. Levene’s tests of raw variational differences for spectral features between pigment classes within sex across species sampled.
SexPhenotypesTest Statistic
FeaturePigment Class (SD) a vs. Pigment Class (SD) aF bP c
Males d
lR50Yellow (11.091)Orange (3.603) 6.116490.0174
Yellow (11.091)Red (5.617) 36.46504<0.0001
Orange (3.603)Red (5.617)0.102530.7504
RcontrastYellow (0.042)Orange (0.023)4.556360.0385
Yellow (0.042)Red (0.056)1.081490.3017
Orange (0.023)Red (0.056)1.194690.2806
lRminYellow (10.605)Orange (6.715)0.929480.3404
Yellow (10.605)Red (12.692)1.650640.2028
Orange (6.715)Red (12.692)2.110740.1537
Females e
lR50Yellow (10.583)Orange (1.152)16.016670.0003
Yellow (10.583)Red (7.372) 16.194360.0002
Orange (1.152)Red (7.372)3.851220.0562
RcontrastYellow (0.046)Orange (0.075)0.349630.5577
Yellow (0.046)Red (0.043)0.897180.3470
Orange (0.075)Red (0.043)1.41240.2412
lRminYellow (10.291)Orange (5.393)3.124790.0847
Yellow (10.291)Red (12.710)0.258050.6132
Orange (5.393)Red (12.710)3.245210.0786
a Pigment class (standard deviation, SD). Levene’s test of variance was used, but variation was summarized as SD to enable comparisons in the units of the original measures. b Levene’s test of variance homogeneity. c All probabilities are two-tailed. d Male sample size: Nyellow = 39, Norange = 6, and Nred = 38. e Female sample size: Nyellow = 32, Norange =10, and Nred = 35.
Disclaimer/Publisher’s Note: The statements, opinions and data contained in all publications are solely those of the individual author(s) and contributor(s) and not of MDPI and/or the editor(s). MDPI and/or the editor(s) disclaim responsibility for any injury to people or property resulting from any ideas, methods, instructions or products referred to in the content.