Abstract
This study evaluated the genetic diversity and population structure of Vicugna pacos (Huacaya alpacas) from two contrasting breeding contexts in Junín, Peru: the genetically managed herd of INIA’s Santa Ana Experimental Station (Suitucancha) and the community-based herd of Huayre, where natural, unregulated mating practices are common. An external reference population from Quimsachata was also included. Genetic diversity parameters revealed high allelic richness and heterozygosity within all populations. Analyses of molecular variance (AMOVA), principal coordinate analysis (PCoA), Bayesian clustering, and phylogenetic reconstruction indicated moderate genetic differentiation between Suitucancha and Huayre, likely influenced by the use of selected males under controlled mating in Suitucancha versus natural, unregulated group mating in Huayre, which facilitates broader gene flow. The Quimsachata group displayed distinct genetic characteristics, likely reflecting limited gene flow due to its role as a germplasm conservation nucleus under closed reproductive management. These results reflect how differences in reproductive management may influence population structure in alpacas.
1. Introduction
Peru has more than 3,700,000 alpaca specimens within its territory, representing 87% of the world’s population, and it is the leading global producer of fiber from this high-Andean camelid [1]. Alpacas (Vicugna pacos) are fully domesticated livestock species, managed mainly for their high-quality fiber under traditional and semi-intensive systems in the Andean highlands [2]. They play a fundamental role in Andean agropastoral systems and are well adapted to the harsh puna ecosystems. In these regions, alpacas are not only a key source of income through fiber commercialization, but also hold deep cultural significance for rural communities, reinforcing traditional livelihoods and contributing to their economic resilience [2].
Maintaining high levels of genetic variability is the primary objective in conservation plans. This genetic variation is a prerequisite for populations to be able to cope with environmental changes that may occur in the future and to ensure, in the long term, the response to natural or artificial selection for traits of economic or cultural interest [3,4,5]. One of the main challenges in the genetic improvement of alpacas is to assess productive traits, develop innovative strategies for managing reproductive males, and preserve the genetic variability available in these species [6].
Understanding genetic diversity in domestic populations allows assessing their current status; the loss of genetic diversity reduces the ability to recover threatened species and maintain and improve the performance of those included in the production system [7]. Genetic diversity within a population can provide general insights into evolutionary processes such as gene flow, drift, and selection, as it reflects the distribution and frequency of genetic variants over time [8].
The need to conduct research using molecular genetics tools aimed at studying the genetic variability of domestic South American camelids is crucial to design management plans that conserve the genetic reservoir of these camelids and improve their productive characteristics. Based on previous genetic characterization studies [9,10,11], which include analyses using microsatellite and mitochondrial DNA markers, significant differences have been identified in genetic diversity and population structure between wild and domestic South American camelids. These studies also revealed substantial genetic variability within alpaca populations, providing a reference for selective breeding programs focused on productive traits, while underscoring the importance of managing this diversity to avoid unintended genetic erosion.
Microsatellites have become highly informative molecular markers in South American camelids to assess genetic variability and population structure. These hypervariable markers detect polymorphisms with high resolution, revealing a high level of intra- and inter-population genetic diversity in alpacas and llamas [12]. Additionally, microsatellites remain essential for parentage verification in alpacas and llamas, providing accurate pedigree information that supports breeding value prediction and genetic management. The high variability revealed through microsatellites allows for the delineation of subtle genetic structures and even the identification of undesired [13] hybridizations between species (alpaca × llama), which can affect fiber quality. However, the effectiveness of these analyses depends not only on the inherent variability of the markers, but also on the number and genomic distribution of the microsatellite loci used, as inadequate coverage can limit the detection of genetic patterns. The information that these markers provide is key to the conservation of alpacas and llamas, as they detect populations with sufficient variability to serve as genetic reservoirs [14]. Furthermore, they are valuable in genetic improvement, guiding breeding programs that aim to enhance desirable traits while implementing strategies to monitor and preserve genetic diversity [15].
Therefore, this study aims to evaluate the genetic diversity and population structure of alpacas from INIA’s Santa Ana Experimental Station (located in the Suitucancha area) and from the rural community of Huayre, by using microsatellite molecular markers. This research seeks to provide relevant information on genetic variability, inbreeding, and population differentiation, contributing to genetic management and the preservation of genetic resources in these alpaca populations.
2. Materials and Methods
2.1. Study Area
This study was conducted in two distinct locations in the department of Junín, Peru: the Suitucancha estate, where the Santa Ana Experimental Station (EEA Santa Ana) of INIA is located, and the rural community of Huayre (Figure 1). The Suitucancha population, managed by INIA’s experimental program, constitutes a semi-closed nucleus under a controlled genetic improvement scheme that employs group-sire mating and selection for fiber quality and reproductive traits. In contrast, the Huayre population is a community-managed, open population, with natural multiple-sire mating systems and no structured selection or conservation strategy in place.
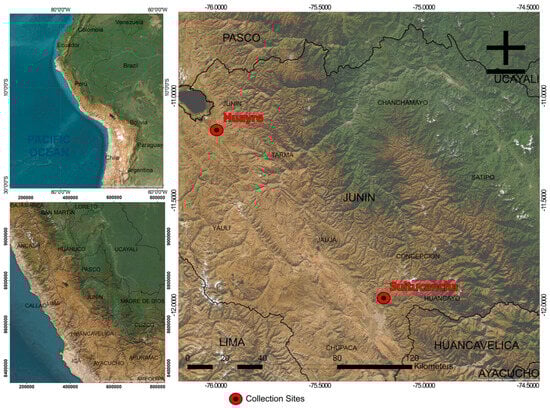
Figure 1.
Map of the provinces of Huayre and Suitucancha.
2.2. Sampling
A total of 38 Huacaya alpacas were randomly selected and evenly distributed between the two study locations, with 19 alpacas from the EEA Santa Ana, located in the Suitucancha estate of the rural community of Paccha, and 19 from different family-managed herds within the rural community of Huayre, ensuring an adequate representation of both populations (Table S1).
Blood samples were collected from these alpacas through direct puncture of the caudal artery of the thigh, using sterile vacutainers with anticoagulant and 22 × 1½ gauge needles. The samples were transported under cold chain conditions to the Molecular Biology and Genomics Laboratory of INIA—Lima.
2.3. DNA Extraction and Microsatellite Genotyping
Upon arrival at the laboratory, the blood samples were centrifuged, and the leukocyte layer (buffy coat) was recovered and stored under cold conditions for subsequent DNA extraction. DNA extraction was performed using the PureLink® Genomic DNA Kit (Invitrogen, Waltham, MA, USA), following the manufacturer’s instructions with minor modifications adapted to the sample type. The extraction was carried out in duplicate, selecting the intermediate phase (leukocytes) of the blood samples to maximize DNA yield. The quality and concentration of the extracted DNA were assessed by 1% agarose gel electrophoresis and nucleic acid spectrophotometry using a Nanodrop 8000TM (NanoDrop, Wilmington, Delaware, USA), ensuring absorption ratios (A260/A280 between 1.8 and 2.0 and A260/A230 between 2.0 and 2.2) within acceptable ranges for genetic analyses.
For microsatellite allele determination, eleven microsatellite loci described for alpacas and llamas were used, specifically LCA08, LCA19, LCA24, LCA37, LCA56, LCA65, LCA66, LCA94, LGU49, YWLL29, and YWLL40 (Table S2). Locus amplification was performed using multiplex PCR with a Qiagen Multiplex PCR Kit (Qiagen, Hilden, Germany) in a 9700 GeneAmp® thermal cycler (Applied Biosystems, Foster City, CA, USA). The amplified products were separated by capillary electrophoresis using an ABI3137 XL genetic analyzer (Applied Biosystems). The 400HD ROX size standard was used for sample analysis, and allele sizing in base pairs (bp) was conducted using a set of alpaca DNA samples to create a bin set. Allele designation was carried out using GeneMapper v4.0 (Applied Biosystems) software.
2.4. Genetic Diversity Analysis
External data from 116 alpacas was included [16], considering only the microsatellite loci that overlapped with those used in the present study (LCA08, LCA19, LCA24, LCA37, LCA56, LCA65, LCA66, LCA94, LGU49, YWLL29, and YWLL40). For the genetic diversity analysis, parameters such as the number of alleles (k), observed heterozygosity (Ho), expected heterozygosity (He), and polymorphic information content (PIC) were calculated for each of the eleven microsatellite loci using the software Cervus v3.0.7 [17]. The Hardy–Weinberg equilibrium (HWE) test was performed for each locus using the same software. The fixation index (Fis), which measures the degree of inbreeding or outbreeding within populations, was estimated using Arlequin v3.5.2 [18]. To assess the genetic structure of the alpaca populations, an analysis of molecular variance (AMOVA) was performed using Arlequin v3.5. This analysis estimated F-statistic coefficients, including overall Fis for population differentiation and Fis for intra-population inbreeding. The significance of the variance components was tested under the assumption of Hardy–Weinberg equilibrium. Population structure was analyzed using STRUCTURE v2.3.4 [19], considering an admixture model with correlated allele frequencies. A burn-in period of 50,000 iterations and 500,000 Monte Carlo Markov Chain (MCMC) simulations were run in 10 independent replicates for each number of genetic clusters (K), ranging from 1 to 10. The optimal number of genetic groups (K) was determined using STRUCTURE HARVESTER v0.7 [20], and the results were visualized using Pophelper [21]. A principal coordinate analysis (PCoA) was performed using GenAlEx v6.5 [22] to evaluate genetic differentiation between populations. A phylogenetic tree was constructed using the Neighbor-Joining (NJ) method based on Nei’s genetic distance matrix. A total of 1000 bootstrap replicates were conducted, and the tree was rooted at the midpoint. The tree was generated using iTOL v6 [23].
3. Results
3.1. Genetic Diversity
A total of 79 different alleles were identified across eleven microsatellite loci in the Suitucancha alpaca population (Table 1). All loci were polymorphic, exhibiting more than one allele per locus. The number of alleles per locus (k) ranged from 3 (YWLL40) to 10 (LCA65 and LCA66). Observed heterozygosity (Ho) values ranged from 0.526 (LCA37) to 0.947 (LCA94), with a mean Ho of 0.782. Expected heterozygosity (He) fluctuated between 0.615 (YWLL40) and 0.870 (LCA8), with a global mean He of 0.749. The polymorphic information content (PIC) varied from 0.467 (YWLL40) to 0.853 (LCA8), with an average PIC of 0.686.

Table 1.
Genetic diversity across eleven microsatellite loci in the Suitucancha alpaca population.
In the Huayre alpaca population, a total of 113 alleles were identified across the same eleven microsatellite loci (Table 2). All markers were polymorphic. The number of alleles per locus ranged from 6 (LCA24) to 15 (LCA65). Observed heterozygosity (Ho) ranged from 0.421 (YWLL40) to 0.947 (LCA66), with a mean Ho of 0.768. Expected heterozygosity (He) varied from 0.704 (LCA24) to 0.895 (LCA65), with a mean He of 0.837. The PIC values ranged from 0.616 (LCA24) to 0.884 (LCA65), with an overall average of 0.796.
Table 2.
Genetic diversity across eleven microsatellite loci in the Huayre alpaca population.
In the Suitucancha alpaca population, eight microsatellite loci exhibited negative Fis values (LCA8, LCA24, LCA56, LCA65, LCA66, LCA94, LGU49, and YWLL40), suggesting a potential excess of heterozygotes at these loci (Table 3). The average Fis across all loci was approximately −0.063, indicating a general trend toward heterozygote excess in this population. The highest positive Fis was observed at locus LCA37 (Fis = 0.224), suggestive of a moderate heterozygote deficiency at this specific locus. Regarding Hardy–Weinberg equilibrium (HWE), no significant deviations were detected in any of the loci analyzed, indicating that the observed genotypic frequencies were consistent with equilibrium expectations. In contrast, the Huayre population displayed predominantly positive Fis values, indicative of a general trend toward heterozygote deficiency. Notable positive Fis values were observed at loci YWLL40 (Fis = 0.477) and LCA94 (Fis = 0.277), both of which exhibited statistically significant deviations from Hardy–Weinberg equilibrium (**), possibly indicating non-random mating patterns or underlying population substructure affecting the genotypic distribution at these loci. The overall average Fis for the Huayre population was approximately 0.064, reflecting a mild tendency toward heterozygote deficiency, although negative values were also detected at loci LCA24, LCA37, and LCA66.
Table 3.
Fis values and Hardy–Weinberg equilibrium in microsatellite loci of the Suitucancha and Huayre populations.
3.2. Genetic Structure
The analysis of molecular variance (AMOVA) revealed significant genetic differentiation between the Suitucancha and Huayre populations (Table 4), with a variance component of 3.7071 attributed to differences among populations and 19.72 to variation within populations. Similarly, the AMOVA including the Suitucancha, Huayre, and Quimsachata populations (Table 5) showed a variance component of 4.1259 among populations and 10.4463 within populations, indicating moderate population structure.
Table 4.
Analysis of molecular variance (AMOVA) between the alpaca populations of Suitucancha and Huayre.
Table 5.
Analysis of molecular variance (AMOVA) among the alpaca populations of Suitucancha, Huayre, and Quimsachata.
The principal coordinate analysis (PCoA) based on microsatellite data revealed a clear genetic separation between the Suitucancha (P1) and Huayre (P2) alpaca populations (Figure 2A). The first principal coordinate axis (PCoA1) explained 12.87% of the genetic variation, while the second axis (PCoA2) explained 7.63%, accounting for a total of 20.5% of the variation. Individuals from Suitucancha (P1) clustered compactly in the left quadrant, indicating greater genetic homogeneity within this population. In contrast, individuals from Huayre (P2) exhibited greater genetic dispersion, suggesting higher genetic diversity within this population. The genetic distance observed between the two groups supports the genetic differentiation identified in the AMOVA, suggesting the presence of a population-level genetic structure between Suitucancha and Huayre. The PCoA analysis also demonstrated a genetic differentiation between the Suitucancha (P1), Huayre (P2), and Quimsachata (P3) alpaca populations (Figure 2B). The first principal component (PCoA1) explained 15.98% of the genetic variation, while the second principal component (PCoA2) explained 5.21%. The Suitucancha (P1) and Huayre (P2) populations grouped closely in the left quadrant indicating genetic proximity between them. In contrast, the Quimsachata population (P3) was separated in the right quadrant, exhibiting high genetic dispersion and a strong differentiation from the Huancayo populations (P1 and P2).
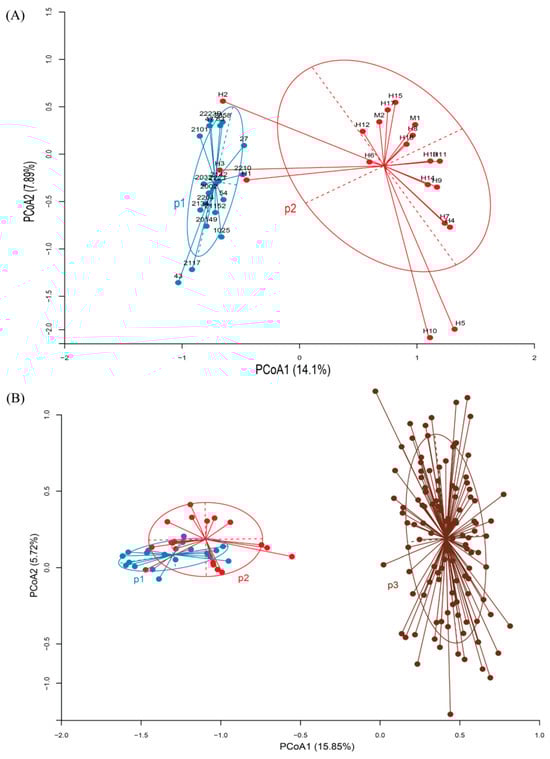
Figure 2.
Principal coordinate analysis (PCoA) of the genetic structure of alpaca populations. (A) Suitucancha (P1) and Huayre (P2). (B) Suitucancha (P1), Huayre (P2), and Quimsachata (P3).
The population structure analysis using the STRUCTURE program indicated that the optimal K value for the Suitucancha (P1) and Huayre (P2) populations was K = 2 (Figure 3A). When the external Quimsachata population (P3) was included, the optimal K value remained K = 2 (Figure 3B). The STRUCTURE analysis with K = 2 revealed genetic differentiation between the Suitucancha (P1, in blue) and Huayre (P2, in pink) populations (Figure 4A). The Suitucancha individuals exhibited high genetic homogeneity, with a predominance of the blue genetic component. In contrast, the Huayre individuals showed a higher proportion of genetic admixture, with the appearance of a second genetic component, indicating a higher level of admixture in this population. The clear separation of genetic components between the two populations supports the population structure observed in the PCoA analysis, confirming the genetic differentiation between Suitucancha and Huayre.
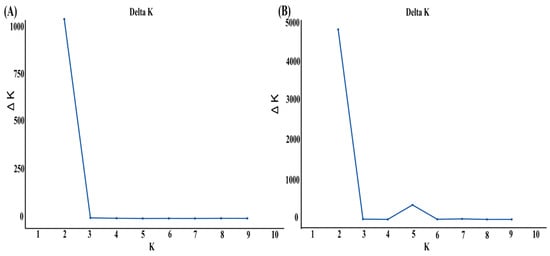
Figure 3.
Delta K analysis for the determination of the optimal number of genetic groups (K) in alpaca populations. (A) Suitucancha and Huayre, (B) Suitucancha, Huayre, and Quimsachata.
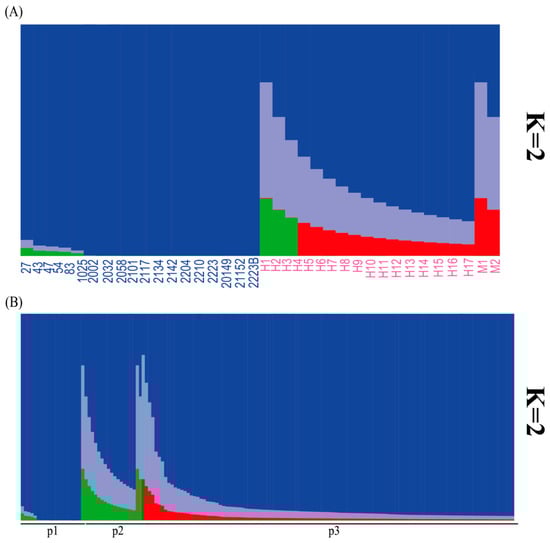
Figure 4.
(A) Genetic structure of the Suitucancha (P1) and Huayre (P2) alpaca populations according to the STRUCTURE analysis with K = 2. (B) Genetic structure of the Suitucancha (P1), Huayre (P2), and external Quimsachata (P3) alpaca populations according to the STRUCTURE analysis with K = 2.
The population structure analysis using the STRUCTURE program with K = 2 revealed a clear genetic differentiation among the Suitucancha (P1), Huayre (P2), and external Quimsachata (P3) populations (Figure 4B). The Suitucancha (P1) and Huayre (P2) populations exhibited greater levels of genetic admixture, as evidenced by the presence of multiple genetic clusters (blue, lilac, green, and red) inferred by the STRUCTURE analysis. In Suitucancha (P1), the blue cluster predominated, whereas Huayre (P2) displayed a higher proportion of the lilac, green, and red components, suggesting increased admixture in this population. The external Quimsachata population (P3) exhibited high genetic homogeneity, with an almost exclusive predominance of the blue cluster, clearly differentiating it from the Huancayo populations (P1 and P2).
3.3. Population Genetic Relationship
The phylogenetic analysis using the Neighbor-Joining (NJ) method revealed a clear genetic separation between the Suitucancha (blue) and Huayre (pink) populations (Figure 5). The Suitucancha individuals clustered into well-defined clades in the upper part of the dendrogram, indicating greater genetic homogeneity within this population. In contrast, the Huayre individuals were distributed across multiple clades in the lower part of the tree, demonstrating higher intra-population genetic diversity.
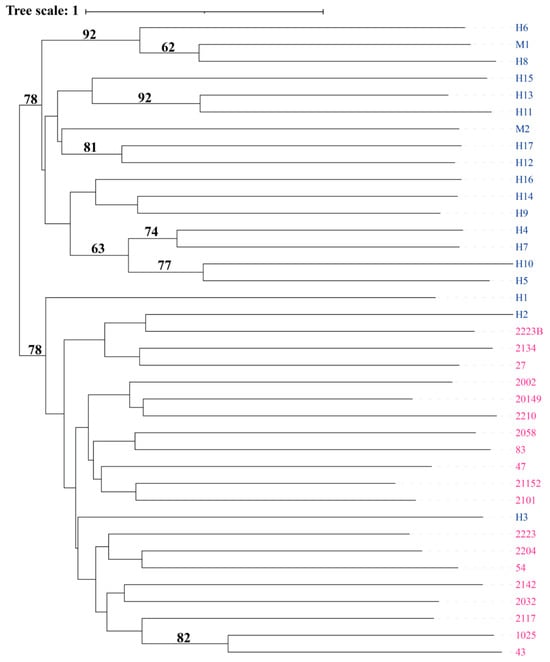
Figure 5.
Neighbor-Joining cladogram showing the genetic relationship among individuals from Suitucancha (blue) and Huayre (pink).
The phylogenetic analysis using the Neighbor-Joining (NJ) method revealed the genetic relationships among the Suitucancha (blue), Huayre (pink), and external Quimsachata (brown) populations (Figure 6). The Suitucancha and Huayre individuals clustered into distinct clades in the upper part of the tree, reflecting genetic proximity between these two populations. However, the Quimsachata individuals (brown) formed scattered clades around the circular dendrogram, indicating high genetic diversity and a clear differentiation from the local Huancayo populations (Suitucancha and Huayre).
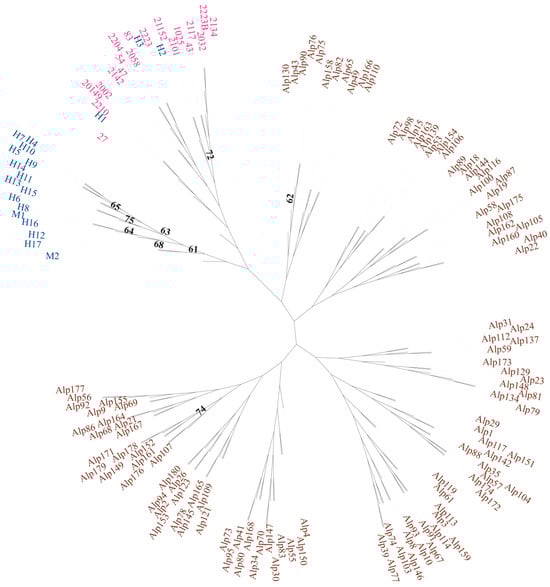
Figure 6.
Circular Neighbor-Joining cladogram showing the genetic relationship among the Suitucancha (blue), Huayre (pink), and external Quimsachata (brown) populations.
4. Discussion
This study examined the genetic diversity and relationships among the alpaca populations of Suitucancha and Huayre in Junín, along with an external group from Quimsachata. Suitucancha is managed by INIA’s Santa Ana Experimental Station as a genetic improvement nucleus, using a group-sire mating system and selecting animals based on fiber quality and reproductive performance. This population exhibits low levels of genetic variation and a high frequency of shared genotypes, likely due to the long-term application of controlled breeding practices. In contrast, Huayre is a community-managed herd where natural multiple-sire mating occurs, and no structured selection or conservation program is implemented, likely resulting in greater genetic heterogeneity. Meanwhile, the Quimsachata population is part of INIA’s Germplasm Bank and is managed under a conservation-oriented program with controlled single-sire mating and limited external gene flow. The analysis using microsatellite markers provides insights into the evolutionary processes and management strategies that have shaped the genetic structure of these populations, guiding future breeding and conservation efforts.
The results suggest differences in genetic diversity between the alpaca populations of Suitucancha and Huayre, aligning with previous studies on Andean alpacas. The Huayre population exhibits higher allelic richness and expected heterozygosity, which can be scientifically interpreted as the result of continuous gene flow and a larger effective population size. In populations with a high effective size, genetic drift has a lesser impact, allowing for the retention of greater genetic variability, a phenomenon documented in studies conducted in Peru and Bolivia [24,25]. Additionally, research by La Manna et al. (2011) [26] and Figueroa et al. (2023) [16] suggests that the reproductive exchange of breeding alpacas from different herds could lead to the introduction of novel alleles can contribute to increased heterozygosity, which may help explain the relatively high expected heterozygosity values observed in Huayre.
On the other hand, the Suitucancha population showed a trend toward an excess of heterozygotes, as evidenced by negative Fis indices, which may reflect reduced inbreeding resulting from controlled breeding practices that promote genetic mixing. In contrast, the Huayre population exhibited positive fixation indices and significant deviations from Hardy–Weinberg equilibrium in some loci. These patterns may indicate the presence of an internal substructure or localized inbreeding within family groups, rather than generalized breeding restrictions. Although Huayre displays high overall genetic diversity, reproductive events may occur in semi-isolated herds, which can lead to deviations from equilibrium expectations. Similar patterns have been reported in comparable studies [13,27], emphasizing the importance of implementing management strategies that enhance genetic exchange to maintain diversity and reduce inbreeding in alpaca populations.
Although this study found higher genetic dispersion in the Huayre population, it is important to note that conservation-managed herds like Quimsachata are generally expected to harbor high genetic variability due to structured breeding practices aimed at preserving diversity. Indeed, Figueroa et al. (2023) [16] reported that the Quimsachata alpaca population maintained high allelic richness and expected heterozygosity, comparable to or exceeding that of community herds, confirming the effectiveness of conservation-oriented management in sustaining broad genetic pools.
The differences in genetic structure observed among the Suitucancha, Huayre, and external Quimsachata alpaca populations reflect the effects of reproductive management and gene flow in the Andes of Peru. Controlled reproductive management, as implemented in Suitucancha and Quimsachata, can lead to reduced variability due to selection and limited mating among selected individuals. In contrast, gene flow—more common in open or community-managed systems like Huayre—introduces new alleles and increases intra-population variability, while reducing genetic differentiation between populations. Recent studies have shown that in populations with continuous reproductive exchange, most genetic variation is concentrated within populations, minimizing intergroup differentiation [16,27,28]. This phenomenon suggests that in community-based mating plans—where each herd is managed independently by local farmers, often without coordinated mating plans—the exchange of animals between herds helps preserve a broad genetic pool, enhancing adaptability and resilience in the species. In this study, the Suitucancha and Huayre populations exhibited moderate differentiation, consistent with the existing literature, indicating that genetic connectivity remains relatively high in the absence of strict reproductive isolation or centralized selection.
The more homogeneous clustering of Suitucancha and the greater dispersion in Huayre suggest differences in internal genetic connectivity, likely influenced by variations in reproductive management and breeding frequency, as observed in Andean studies [13,29]. Simultaneously, the inclusion of the external Quimsachata population revealed an increase in genetic variation explained between groups [30], suggesting that this population has differentiated due to relative isolation or specific management practices. The clear genetic separation of Quimsachata in the dendrogram supports this interpretation, indicating that factors such as geographic isolation or controlled reproductive strategies have generated a distinct gene pool [16,31]. This situation has been documented in recent studies, which indicate that even subtle restrictions on gene flow or reproductive exchange can lead to the formation of genetic substructures [28,29,32]. This differentiation, corroborated by comparative analyses in both Peruvian and global contexts [33,34], emphasizes the importance of targeted genetic management strategies—such as the rotational exchange of breeding males, the maintenance of pedigree records, and the avoidance of close-relative mating—to mitigate inbreeding accumulation and preserve the genetic diversity essential for alpaca improvement and long-term sustainability.
Despite the valuable insights provided, this study has certain limitations. The use of a limited number of molecular markers and a modest sampling effort may constrain the resolution of genetic patterns and lead to an underestimation of allelic diversity. Previous research in South American camelids has highlighted how small marker sets or restricted sample sizes can reduce the accuracy and representativeness of diversity estimates [12,16,35]. Future studies incorporating larger datasets and higher-density genomic tools are recommended to enhance genetic assessments and inform long-term conservation strategies.
5. Conclusions
The genetic differentiation observed between the Suitucancha and Huayre populations reflects the influence of distinct reproductive management practices on their population structure. The inclusion of the Quimsachata population as an external reference revealed a more divergent genetic profile, likely shaped by its conservation-oriented management and relative reproductive isolation. These results highlight the importance of breeding context in shaping genetic variability and suggest that coordinated practices—such as promoting reproductive exchange and minimizing substructuring—can support the preservation of genetic diversity in alpaca herds. Future research should incorporate higher-resolution genomic tools and broader geographic sampling to enhance population structure assessments and inform conservation and breeding strategies.
Supplementary Materials
The following supporting information can be downloaded at: https://www.mdpi.com/article/10.3390/d17050353/s1. Table S1: Biological Samples of Alpacas. Table S2: List of primers used in the study [36,37,38,39,40,41].
Author Contributions
Conceptualization, W.P. and R.E.; methodology, W.P., A.N., J.G., M.R., J.S. and R.E.; software, R.E.; validation, R.E.; formal analysis, R.E.; investigation, W.P., A.N., J.G., M.R., J.S. and R.E.; resources, W.P.; data curation, R.E.; writing—original draft preparation, W.P., A.N., J.G., M.R., J.S. and R.E.; writing—review and editing, W.P., A.N., J.G., M.R., J.S. and R.E.; supervision, W.P. All authors have read and agreed to the published version of the manuscript.
Funding
This research was funded by the project “Mejoramiento de los Servicios de Investigación y Transferencia de Tecnología en Ganadería Alto Andina en las Regiones: Apurímac, Arequipa, Ayacucho, Cusco, Huancavelica, Junín, Moquegua, Pasco, Puno y Tacna, 33 Distritos”, CUI N° 2491159, of the Instituto Nacional de Innovación Agraria.
Institutional Review Board Statement
The sample collection from alpaca specimens was conducted in accordance with Peruvian National Law No. 30407, “Animal Protection and Welfare”, and was carried out by the Instituto Nacional de Innovación Agraria (INIA) under project code CUI N° 2491159, approved in March 2024.
Data Availability Statement
The raw data supporting the conclusions of this article will be made available by the authors on request.
Acknowledgments
We gratefully acknowledge the Paccha Community (Huancayo), the Huayre Community (Junín), and the technical team of the PROGAN project for their valuable support. We also extend our sincere thanks to Wilder Cruz for his assistance in coordinating PROGAN activities.
Conflicts of Interest
The authors declare no conflicts of interest.
References
- INEI IV Censo Nacional Agropecuario 2012—Cuadros Estadísticos. Available online: https://censos.inei.gob.pe/cenagro/tabulados/?id=CensosNacionales (accessed on 6 March 2025).
- Ananthakrishnan, T.N.; Sivaramakrishnan, K.G. Animal Biodiversity: Patterns and Process; Scientific Publishers: Valencia, CA, USA, 2016; ISBN 978-93-87307-47-6. [Google Scholar]
- Ballou, J.D.; Lacy, R.C. Identifying Genetically Important Individuals for Management of Genetic Variation in Pedigreed Populations. In Population Management for Survival and Recovery, Analytical Methods and Strategies in Small Population Management; Columbia University Press: New York, NY, USA, 1995. [Google Scholar]
- Oldenbroek, J.K. Genebanks and the Management of Farm Animal Genetic Resources; ID-DLO: Lelystad, The Netherlands, 1999. [Google Scholar]
- Barker, J.S. Conservation and Management of Genetic Diversity: A Domestic Animal Perspective. Can. J. For. Res. 2001, 31, 588–595. [Google Scholar] [CrossRef]
- Oria, I.; Quicaño, I.; Quispe, E.; Alfonso, L. Variabilidad Del Color de La Fibra de Alpaca En La Zona Altoandina de Huancavelica-Perú. Anim. Genet. Resour. Génétiques Anim. Genéticos Anim. 2009, 45, 79–84. [Google Scholar] [CrossRef]
- Groeneveld, L.F.; Lenstra, J.A.; Eding, H.; Toro, M.A.; Scherf, B.; Pilling, D.; Negrini, R.; Finlay, E.K.; Jianlin, H.; Groeneveld, E.; et al. Genetic Diversity in Farm Animals—A Review. Anim. Genet. 2010, 41, 6–31. [Google Scholar] [CrossRef]
- Mamani, R.H.; Huanca Mamani, T.; Apaza, N.; Gonzáles Castillo, M.L.; Sapana, R.; Cárdenas Minaya, O.E.; Cavalcanti, G.S.; Condori Rojas, N.; Gallegos Acero, R.F.; Gutiérrez, J.P. Parámetros Genéticos de Caracteres de Crecimiento en Alpacas Huacaya (Vicugna pacos) del INIA—PERÚ—Utilizando el Método de Máxima Verosimilitud Restringida. 2013, pp. 129–132. Available online: https://repositorio.inia.gob.pe/items/2d4afd15-07f2-48f4-a2cd-3f0bfb9cdcbf (accessed on 5 April 2025).
- Wheeler, J.C.; Fernández, R.; Rosadio, R.; Hoces, D. Diversidad Genética y Manejo de Poblaciones de Vicuñas En El Perú. Rev. Inv. Vet. Perú 2001, 1, 170–183. [Google Scholar]
- Sarno, R.J.; Franklin, W.L.; O’Brien, S.J.; Johnson, W.E. Patterns of mtDNA and Microsatellite Variation in an Island and Mainland Population of Guanacos in Southern Chile. Anim. Conserv. Forum 2001, 4, 93–101. [Google Scholar] [CrossRef]
- Maté, M.L.; Bustamante, A.; Giovambattista, G.; de Lamo, D.; von Thüngen, J.; Zambelli, A.; Vidal-Rioja, L. Genetic Diversity and Differentiation of Guanaco Populations from Argentina Inferred from Microsatellite Data. Anim. Genet. 2005, 36, 316–321. [Google Scholar] [CrossRef]
- Paredes, G.F.; Yalta-Macedo, C.E.; Gutierrez, G.A.; Veli-Rivera, E.A. Genetic Diversity and Population Structure of Llamas (Lama Glama) from the Camelid Germplasm Bank—Quimsachata. Genes 2020, 11, 541. [Google Scholar] [CrossRef]
- Podbielska, A.; Piórkowska, K.; Szmatoła, T. Microsatellite-Based Genetic Structure and Hybrid Detection in Alpacas Bred in Poland. Animals 2021, 11, 2193. [Google Scholar] [CrossRef]
- Vallejo Trujillo, A.; Yalta Macedo, C.E.; Veli Rivera, E.A.; Cerna, D. Diversidad y Estructuración Genética de Alpacas de Color de La Región Puno (Perú). In Proceedings of the Congreso Mundial de Camelidos Sudamericanos, Arica, Chile, 21–23 November 2012; p. 140. [Google Scholar]
- Sheriff, O.; Alemayehu, K. Genetic Diversity Studies Using Microsatellite Markers and Their Contribution in Supporting Sustainable Sheep Breeding Programs: A Review. Cogent Food Agric. 2018, 4, 1459062. [Google Scholar] [CrossRef]
- Figueroa, D.; Corredor, F.-A.; Mamani-Cato, R.H.; Gallegos-Acero, R.F.; Condori-Rojas, N.; Estrada, R.; Heredia, L.; Salazar, W.; Quilcate, C.; Arbizu, C.I. Microsatellite-Based Genetic Diversity and Population Structure of Huacaya alpacas (Vicugna pacos) in Southern Peru. Animals 2023, 13, 1552. [Google Scholar] [CrossRef]
- Kalinowski, S.T.; Taper, M.L.; Marshall, T.C. Revising How the Computer Program Cervus Accommodates Genotyping Error Increases Success in Paternity Assignment. Mol. Ecol. 2007, 16, 1099–1106. [Google Scholar] [CrossRef] [PubMed]
- Excoffier, L.; Lischer, H.E.L. Arlequin Suite Ver 3.5: A New Series of Programs to Perform Population Genetics Analyses under Linux and Windows. Mol. Ecol. Resour. 2010, 10, 564–567. [Google Scholar] [CrossRef] [PubMed]
- Pritchard, J.K.; Stephens, M.; Donnelly, P. Inference of Population Structure Using Multilocus Genotype Data. Genetics 2000, 155, 945–959. [Google Scholar] [CrossRef]
- Earl, D.A.; vonHoldt, B.M. STRUCTURE HARVESTER: A Website and Program for Visualizing STRUCTURE Output and Implementing the Evanno Method. Conserv. Genet. Resour. 2012, 4, 359–361. [Google Scholar] [CrossRef]
- Francis, R.M. Pophelper: An R Package and Web App to Analyse and Visualize Population Structure. Mol. Ecol. Resour. 2017, 17, 27–32. [Google Scholar] [CrossRef]
- Peakall, R.; Smouse, P.E. Genalex 6: Genetic Analysis in Excel. Population Genetic Software for Teaching and Research. Mol. Ecol. Notes 2006, 6, 288–295. [Google Scholar] [CrossRef]
- Letunic, I.; Bork, P. Interactive Tree of Life (iTOL) v6: Recent Updates to the Phylogenetic Tree Display and Annotation Tool. Nucleic Acids Res. 2024, 52, W78–W82. [Google Scholar] [CrossRef]
- Barreta, J.; Iñiguez, V.; Saavedra, V.; Romero, F.; Callisaya, A.M.; Echalar, J.; Gutiérrez-Gil, B.; Arranz, J.-J. Genetic Diversity and Population Structure of Bolivian Alpacas. Small Rumin. Res. 2012, 105, 97–104. [Google Scholar] [CrossRef]
- Paredes, M.; Machaca, J.; Azor, P.J.; Alonso-Moraga, A.; Membrillo, A.; Muñoz-Serrano, A. Genetic Differentiation of Six Peruvian Alpaca Populations. In Fibre Production in South American Camelids and Other Fibre Animals; Pérez-Cabal, M.Á., Gutiérrez, J.P., Cervantes, I., Alcalde, M.J., Eds.; Academic Publishers: Wageningen, The Netherlands, 2012; pp. 161–166. ISBN 978-90-8686-727-1. [Google Scholar]
- Manna, V.L.; Terza, A.L.; Dharaneedharan, S.; Ghezzi, S.; Saravanaperumal, S.A.; Apaza, N.; Huanca, T.; Bozzi, R.; Renieri, C. A Microsatellite Study on the Genetic Distance between Suri and Huacaya Phenotypes in Peruvian Alpaca (Vicugna pacos). In Fibre Production in South American Camelids and Other Fibre Animals; Pérez-Cabal, M.Á., Gutiérrez, J.P., Cervantes, I., Alcalde, M.J., Eds.; Academic Publishers: Wageningen, The Netherlands, 2012; pp. 151–159. ISBN 978-90-8686-727-1. [Google Scholar]
- Morón, J.A.; Veli, E.A.; Membrillo, A.; Paredes, M.M.; Gutiérrez, G.A. Genetic Diversity and Validation of a Microsatellite Panel for Parentage Testing for Alpacas (Vicugna pacos) on Three Peruvian Farms. Small Rumin. Res. 2020, 193, 106246. [Google Scholar] [CrossRef]
- Echalar, J.; Barreta, J.; Iniguez, V.; Romero, F.; Callisaya, A.M.; Saavedra, V. Intraspecific Genetic Analysis of Bolivian Alpacas and Interspecific Relationship with Llamas and Vicunas. Small Rumin. Res. 2020, 189, 106137. [Google Scholar] [CrossRef]
- Casey, C.S.; Orozco-terWengel, P.; Yaya, K.; Kadwell, M.; Fernández, M.; Marín, J.C.; Rosadio, R.; Maturrano, L.; Hoces, D.; Hu, Y.; et al. Comparing Genetic Diversity and Demographic History in Co-Distributed Wild South American Camelids. Heredity 2018, 121, 387–400. [Google Scholar] [CrossRef] [PubMed]
- Huanca Mamani, T.; Apaza Castillo, N.; Lazo, A. Evaluación Del Diámetro de Fibra en Alpacas de Las Comunidades de Los Distritos de Cojata y Santa Rosa—Puno; Asociación Latinoamericana de Producción Animal: Calgary, Canada, 2007; pp. 1–8. [Google Scholar]
- Bello-Bravo, J.; Pilares, D.; Brito, L.F.; Toro Ospina, A.M.; Sousa Junior, L.P.B.; Mamani Mamani, G.C.; Schoonmaker, J.; Richardson, J. Social Sustainability and Genetic Biodiversity in Peruvian Alpaca Production: A Review. Pastor. Res. Policy Pract. 2024, 14, 13668. [Google Scholar] [CrossRef]
- González, B.A.; Vásquez, J.P.; Gómez-Uchida, D.; Cortés, J.; Rivera, R.; Aravena, N.; Chero, A.M.; Agapito, A.M.; Varas, V.; Wheleer, J.C.; et al. Phylogeography and Population Genetics of Vicugna vicugna: Evolution in the Arid Andean High Plateau. Front. Genet. 2019, 10, 445. [Google Scholar] [CrossRef]
- Fan, R.; Gu, Z.; Guang, X.; Marín, J.C.; Varas, V.; González, B.A.; Wheeler, J.C.; Hu, Y.; Li, E.; Sun, X.; et al. Genomic Analysis of the Domestication and Post-Spanish Conquest Evolution of the Llama and Alpaca. Genome Biol. 2020, 21, 159. [Google Scholar] [CrossRef] [PubMed]
- Tan, K.; Adeniyi, O.O.; Letko, A.; RuddGarces, G.; Manz, E.; Wagner, H.; Zanolari, P.; Drögemüller, C.; Lühken, G. Identification of Genomic Regions Associated with Differences in Fleece Type in Huacaya and Suri Alpacas (Vicugna pacos). Anim. Genet. 2024, 55, 163–167. [Google Scholar] [CrossRef]
- More, M.; Gutiérrez, G.; Rothschild, M.; Bertolini, F.; Ponce de León, F.A. Evaluation of SNP Genotyping in Alpacas Using the Bovine HD Genotyping Beadchip. Front. Genet. 2019, 10, 361. [Google Scholar] [CrossRef]
- Penedo, M.C.T.; Caetano, A.R.; Cordova, K.I. Microsatellite markers for South American camelids. Anim. Genet. 1998, 29, 411–412. [Google Scholar]
- Radwan, M.A.; Sharaf, M.M.; Mahmoud, S.; Ahmed, H.A. Evaluation of microsatellite markers for use during genotyping and parentage exclusion for dromedary camels in Qatar. J. Camel Pract. Res. 2019, 26, 31–37. [Google Scholar] [CrossRef]
- Penedo, M.C.T.; Caetano, A.R.; Cordova, K. Eight microsatellite markers for South American camelids. Anim. Genet. 1999, 30, 166–167. [Google Scholar] [CrossRef]
- Penedo, M.C.T.; Caetano, A.R.; Cordova, K.I. Six microsatellite markers for South American camelids. Anim. Genet. 1999, 30, 399. [Google Scholar] [CrossRef]
- Sarno, R.J.; David, V.A.; Franklin, W.L.; O’Brien, S.J.; Johnson, W.E. Development of microsatellite markers in the guanaco, Lama guanicoe: Utility for South American camelids. Mol. Ecol. 2000, 9, 1922–1924. [Google Scholar] [CrossRef] [PubMed]
- Lang, K.D.M.; Wang, Y.; Plante, Y. Fifteen polymorphic dinucleotide microsatellites in llamas and alpacas. Anim. Genet. 1996, 27, 293. [Google Scholar] [CrossRef] [PubMed]
Disclaimer/Publisher’s Note: The statements, opinions and data contained in all publications are solely those of the individual author(s) and contributor(s) and not of MDPI and/or the editor(s). MDPI and/or the editor(s) disclaim responsibility for any injury to people or property resulting from any ideas, methods, instructions or products referred to in the content. |
© 2025 by the authors. Licensee MDPI, Basel, Switzerland. This article is an open access article distributed under the terms and conditions of the Creative Commons Attribution (CC BY) license (https://creativecommons.org/licenses/by/4.0/).