Article

Macrofaunal Communities Associated with Ecklonia radiata Holdfast Along the Southeast Coast of South Africa

by
Naledi Nkohla
* and
Thembinkosi Steven Dlaza
Biological and Environmental Sciences Department, Walter Sisulu University, Private Bag X1, Mthatha 5117, South Africa
*
Author to whom correspondence should be addressed.
Diversity 2025, 17(3), 203; https://doi.org/10.3390/d17030203
Submission received: 10 January 2025 / Revised: 7 March 2025 / Accepted: 8 March 2025 / Published: 12 March 2025

Abstract

:
Kelp forests are recognized as biodiversity hotspots and ecosystem engineers, while the macroinvertebrates linked with their holdfasts serve as markers of pollution and ecological and environmental change. Notwithstanding the evident ecological and economic importance of this system, no research has been undertaken in South Africa to examine the macroinvertebrate community assemblage patterns within the Ecklonia radiata holdfast, nor the mechanisms driving the observed distribution patterns. This study identified and compared the assemblage patterns of holdfast-associated macroinvertebrates across several sites using univariate and multivariate approaches, and delineated physical factors influencing invertebrate community organization. The key findings indicated that abundance exhibited little variations among sites, with Dwesa presenting the highest average abundance and Kob-Inn the lowest. Mazeppa exhibited the greatest species richness, succeeded by Dwesa and Nqabara. Beta diversity measured 0.42, with turnover and nestedness contributing equally. Xhorha and Nqabara exhibited the largest local contribution to beta diversity (LCBD) regarding turnover, whereas Mazeppa and Kob-Inn demonstrated the highest LCBD in terms of nestedness. Substantial clustering among sites was observed, with each site harbouring a distinct assemblage of macroinvertebrates. Species that discriminated the sites were Zeuxoides helleri, Cirolana venusticauda and Amphipholis squamata.

1. Introduction

The recognition of kelp forests as biodiversity hotspots can be traced to the 1900s when Darwin conceded that kelp forests are more prone to massive extinctions than terrestrial forests [1]. Subsequent studies further emphasized this biodiversity hotspot notion by recording greater diversity and high densities, including rare species, in kelp forests [2,3,4]. This remarkable feature is owed to the distinct compartments of habitable space available in kelp forests [5], with kelp species being canopy-forming macroalgae that influence their surrounding environmental conditions to promote optimum habitat conditions for an array of understory species [6]. Species sensitive to light, form the community of species living understory of the kelp, while those more tolerant to desiccation attach either on the blades or stipe. Understory community includes individuals occupying either a rock substrate under the canopy or the species associated with the holdfast forests [5].
Compared to the stipe and blades, the kelp holdfast is the most complex as it provides a long-term habitat for a mosaic of micro-, macro- and meiofauna [7]. It is the most species-rich and highly species-abundant part of the thallus, compared to the other two. Holdfasts, although they vary in morphology, size and complexity from one kelp species to another, all share similar elements such as a three dimensional shape, network of twigs called haptera, and the creation of habitable space between the holdfast and the primary substrate [3,6,8,9]. The branching network of haptera creates crevices that trap sediment and dead organic matter, making the holdfast a highly productive system with various niches [10]. The number of species and individuals increase with an increase in the size/volume of the holdfast [3,5,8,10]. Therefore, larger and complex holdfasts are characterized by high species abundance and diversity, and this pattern is consistent globally [11,12], although pollution and environmental gradient are also useful predictors [2,13,14,15].
Predictive climate models suggest that enhanced physico-chemical parameters will be more extreme on habitat-forming species like kelp [16]. Parameters like sea surface temperature (SST) are crucial in governing the interaction between kelp and symbiotic macroinvertebrates at wide geographical ranges [17]. The composition of the associated faunal assemblages is determined by the response of kelp to SST at biogeographical scales [15]. This would explain the discontinuity in the distribution of kelp in some coastal places, where temperatures are a limiting factor [4]. As a result, as kelp population density decreases, so do the faunal taxa associated with it [3,15,17]. However, patch sizes cause the substrate to become less homogeneous and allow for foliose algal growth, which also increases the number of species in kelp holdfasts [18]. Changes in SST reduces the fitness of local species, while increasing the intensity of invasive species in coastal regions [16]. The arrival of new species can significantly change the community structure in kelp beds [19,20]. Although SST are more influential on the kelp–invertebrate association at biogeographical scales [3], turbidity, depth, light levels, sediment and pollution, currents and wave exposure are critical at small and medium spatial scales [13,14,18,21,22,23]. In some instances, environmental variation, even at small scales, may result in heterogeneity in macrofaunal populations linked with kelp holdfast [24].
The southeast coast of South Africa, which is known as a transition zone between warm temperate west coast and subtropical east coast presents a unique opportunity to assess the influence of environmental heterogeneity on the community structure of macroinvertebrates associated with the holdfast of kelp Ecklonia radiata. Such studies on this coastline are particularly important, since the distribution of E. radiata on low subtidal and intertidal zones in South Africa are restricted to the southeast and east coast, with patchy occurrence at deep depths in the west coast [4,25,26]. The predominant research on macroinvertebrates associated with kelp holdfasts in South Africa has focused on Ecklonia maxima from the cold temperate west coast [27,28,29], with no investigations concerning Ecklonia radiata in the transition zone or warm temperate bioregion of the southeast coast, except the recent work from the current project [30]. Nonetheless, Nkohla and Dlaza (2024) [30] focused solely on polychaetes, neglecting the comprehensive exploration of the macroinvertebrate communities associated with the E. radiata holdfast. This knowledge gap impedes the comprehensive understanding of the mechanisms governing the distribution of invertebrate species in South Africa, especially within kelp reef-dominated coastal systems, and the impact of environmental fluctuations on their assemblage patterns.
This study examined the spatial patterns of the community composition in macroinvertebrates associated with Ecklonia radiata holdfast along the southeast coast of South Africa. We hypothesized that (i) the macrofaunal communities found in the kelp holdfasts vary across different sites due to differences in local environmental conditions; (ii) when comparing diversity between sites, the use of univariate and multivariate approaches leads to contrasting results; and (iii) species diversity increases from the west to the east coast of South Africa, aligning with the typical biogeographic pattern observed for macroinvertebrates in this region.

2. Materials and Methods
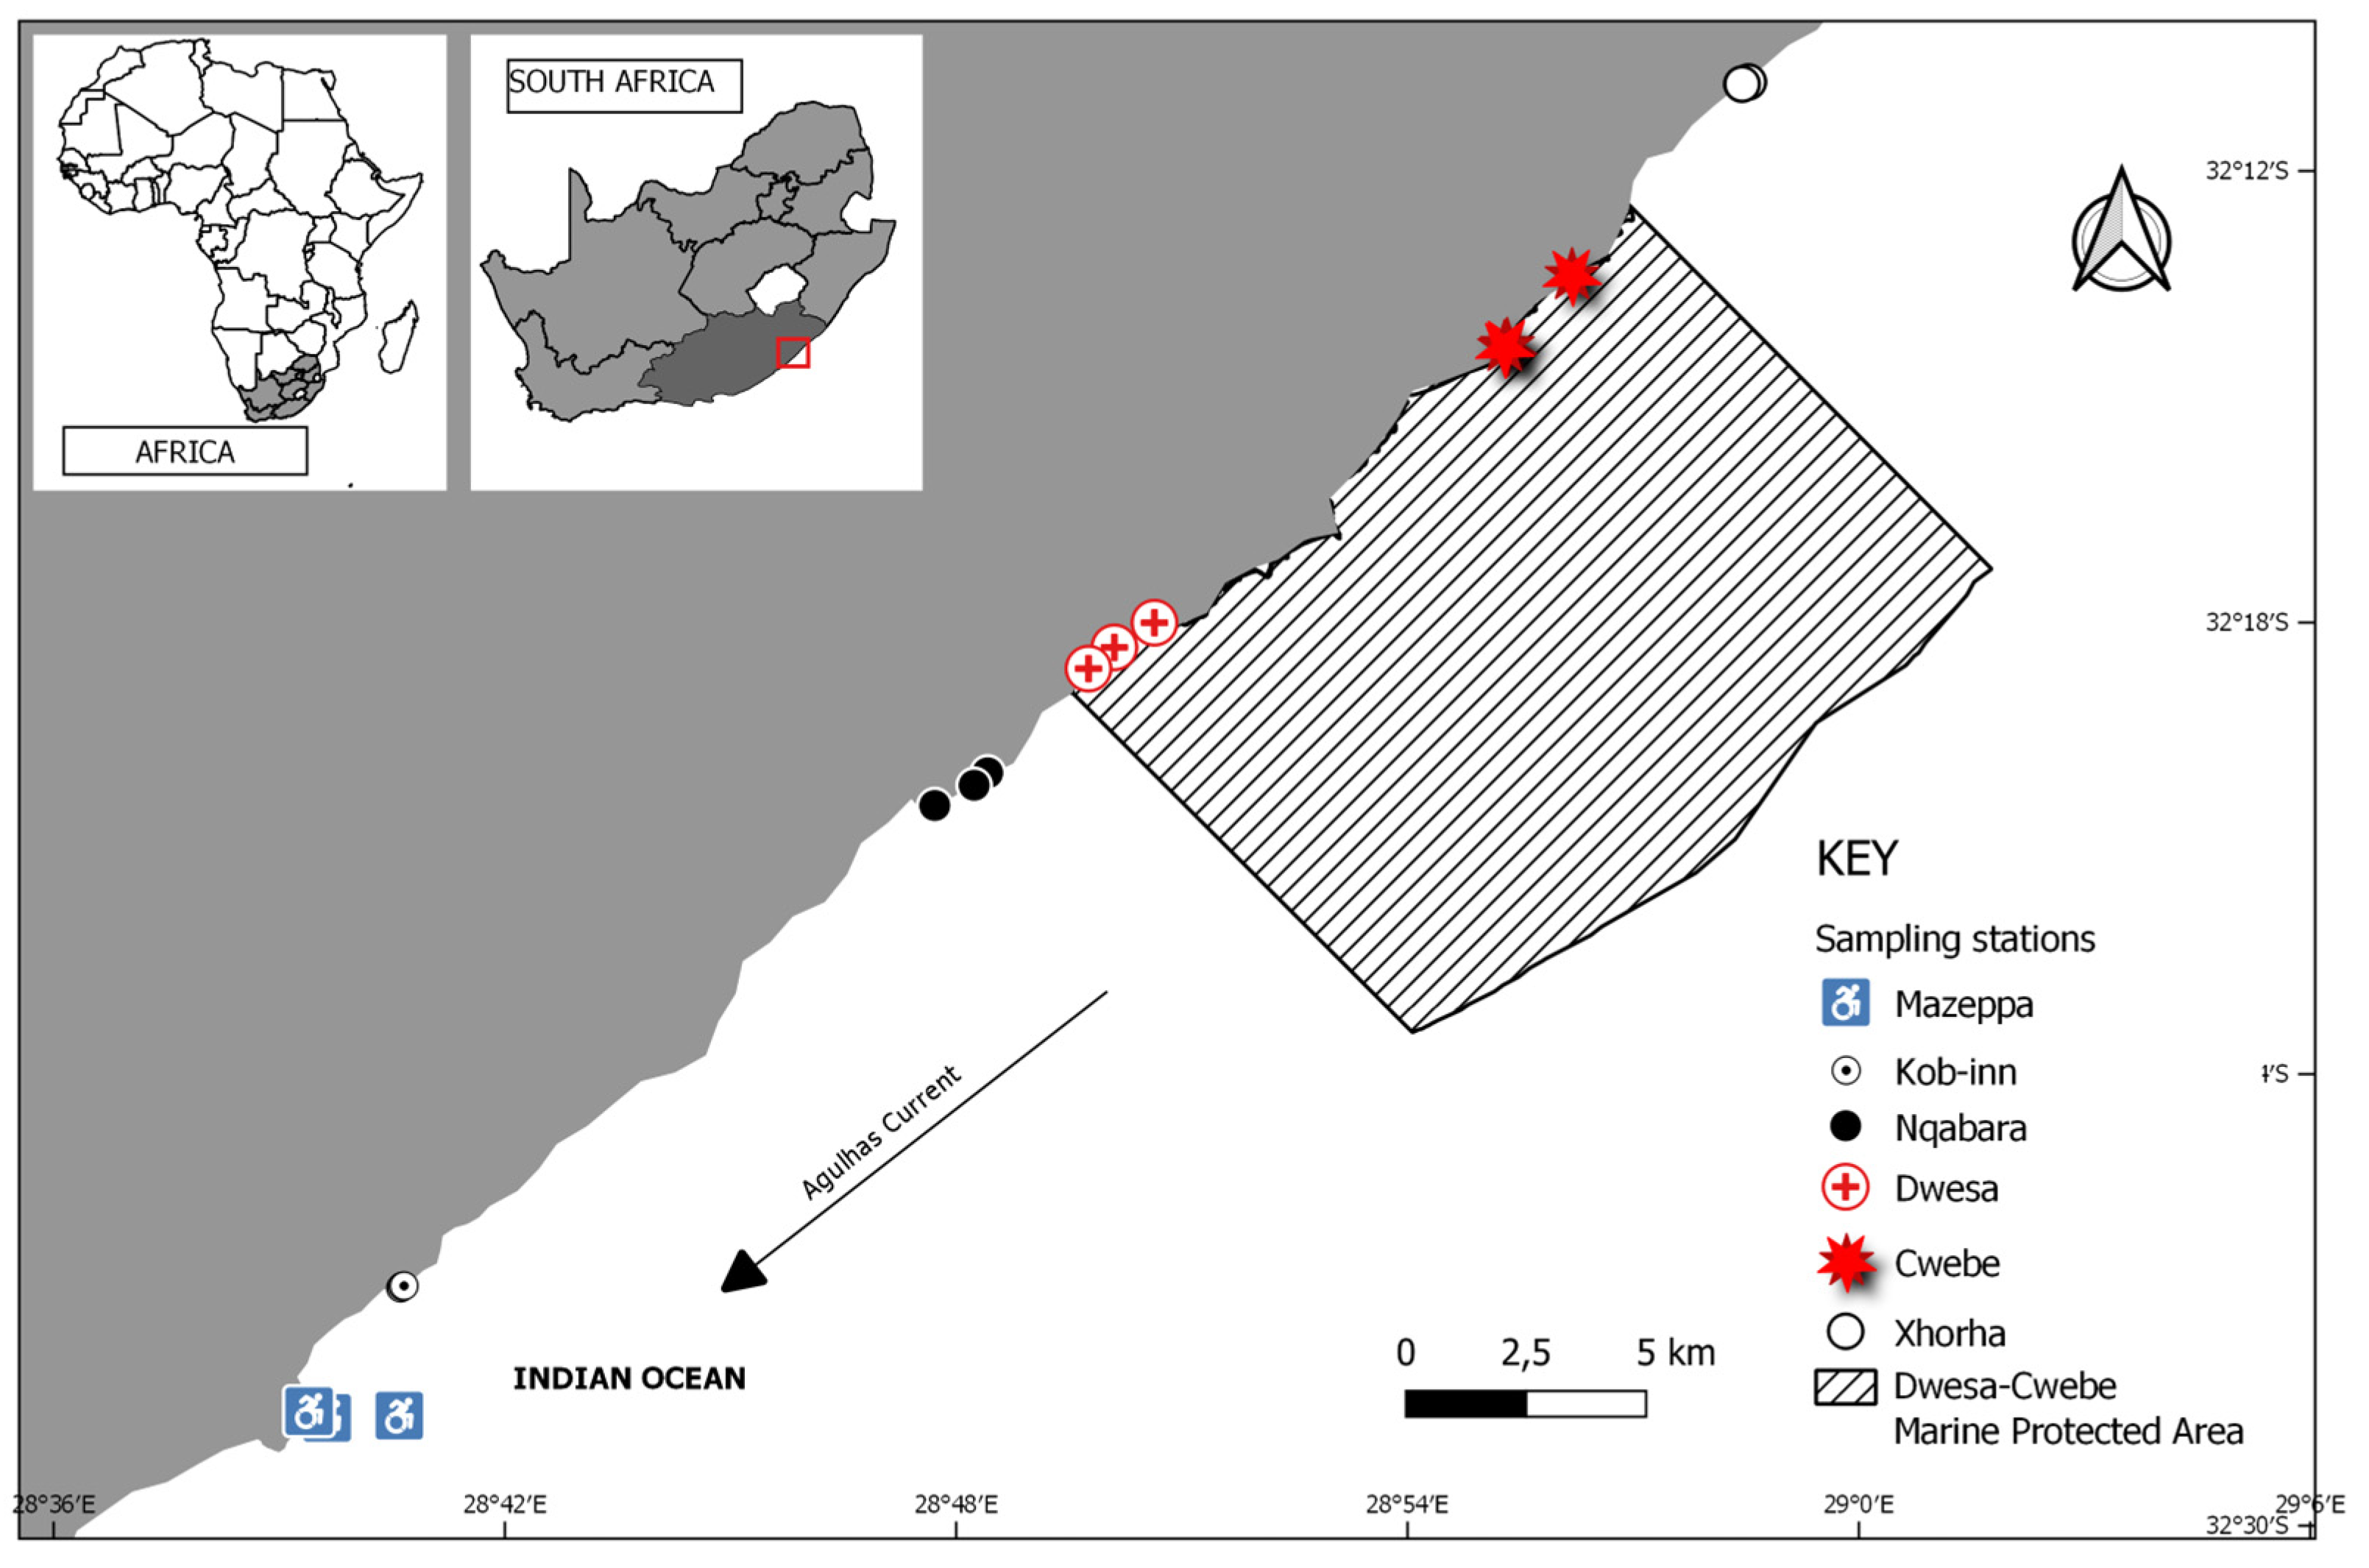
2.1. Study Area

The Eastern Cape southeast coast is often warmer compared to the west coast due to the presence of the Agulhas current, which influences the conditions of the sea in this area [31]. The beaches are semi-exposed to wave action and characterized by nutrient inadequacy due to a lack of upwelling [22,31,32].
The samples were collected during the spring low tide in late August/September 2022, when most of the kelp beds within the gullies were visible due to exposure [31,32]. The sampling for this study was carried out at six locations along the southeastern coast of the EC: Xhorha, Cwebe, Dwesa, Nqabarha, Kob-Inn, and Mazeppa (Figure 1). Each site consisted of three sampling stations, positioned at intervals of roughly 150 m. The spatial separation among sites ranged from 5 to 50 km [9]. At each of the three sampling stations per site, five replicate holdfasts were sampled randomly by carefully removing them from the substrate using sharp knives (n = 15 per site). The stipe was promptly separated from the holdfast to prevent any confusion between the fauna collected from different parts of the sporophyte [9]. The holdfast was then placed in a Ziplock bag and fixed in 70% ethanol while being transferred to the Marine Biology Laboratory at Walter Sisulu University. Depth was measured on-site with a scaled measuring stick. The latitude and longitude were determined using the Garmin GPSMAP 65 device on-site during the sampling period.

Laboratory Processing

In the lab, holdfast weight and volume were determined using an electronic weighing balance and measuring cylinder, respectively. The visible organisms were removed with a pair of forceps. Holdfast was then dissected on the sieves of different mesh sizes overlaid on top of each other in a descending order from top (2 mm) to bottom (pan- 0 mm). The sample was then washed under the tap with freshwater, and the sediment trapped at the bottom of the 0.125 µm and collection pan was collected and quantified (wet weight and volume) for each holdfast. A haptera wet weight and volume were also measured in the laboratory. All organisms retained on a 0.5 mm sieve screen were sorted and preserved in 70% ethanol. Most animals were identified to the highest possible taxonomic resolution, except some amphipods, echinoderms and polychaetes that were left at genus level, using the relevant key guides [33,34,35,36,37,38,39,40,41].

2.2. Data Analysis

Prior the actual statistical analyses the data were examined following the recommended data exploration principles [42] to determine the correct statistical technique required for our dataset. The data were then tested for homogeneity and normality with flinger () and shapiro. test () functions in R. Finally, to ensure independency between the sampling sites, a spatial autocorrelation test based on the Moran’s I index was conducted on the ecological indices’ dataset in ArcGIS.

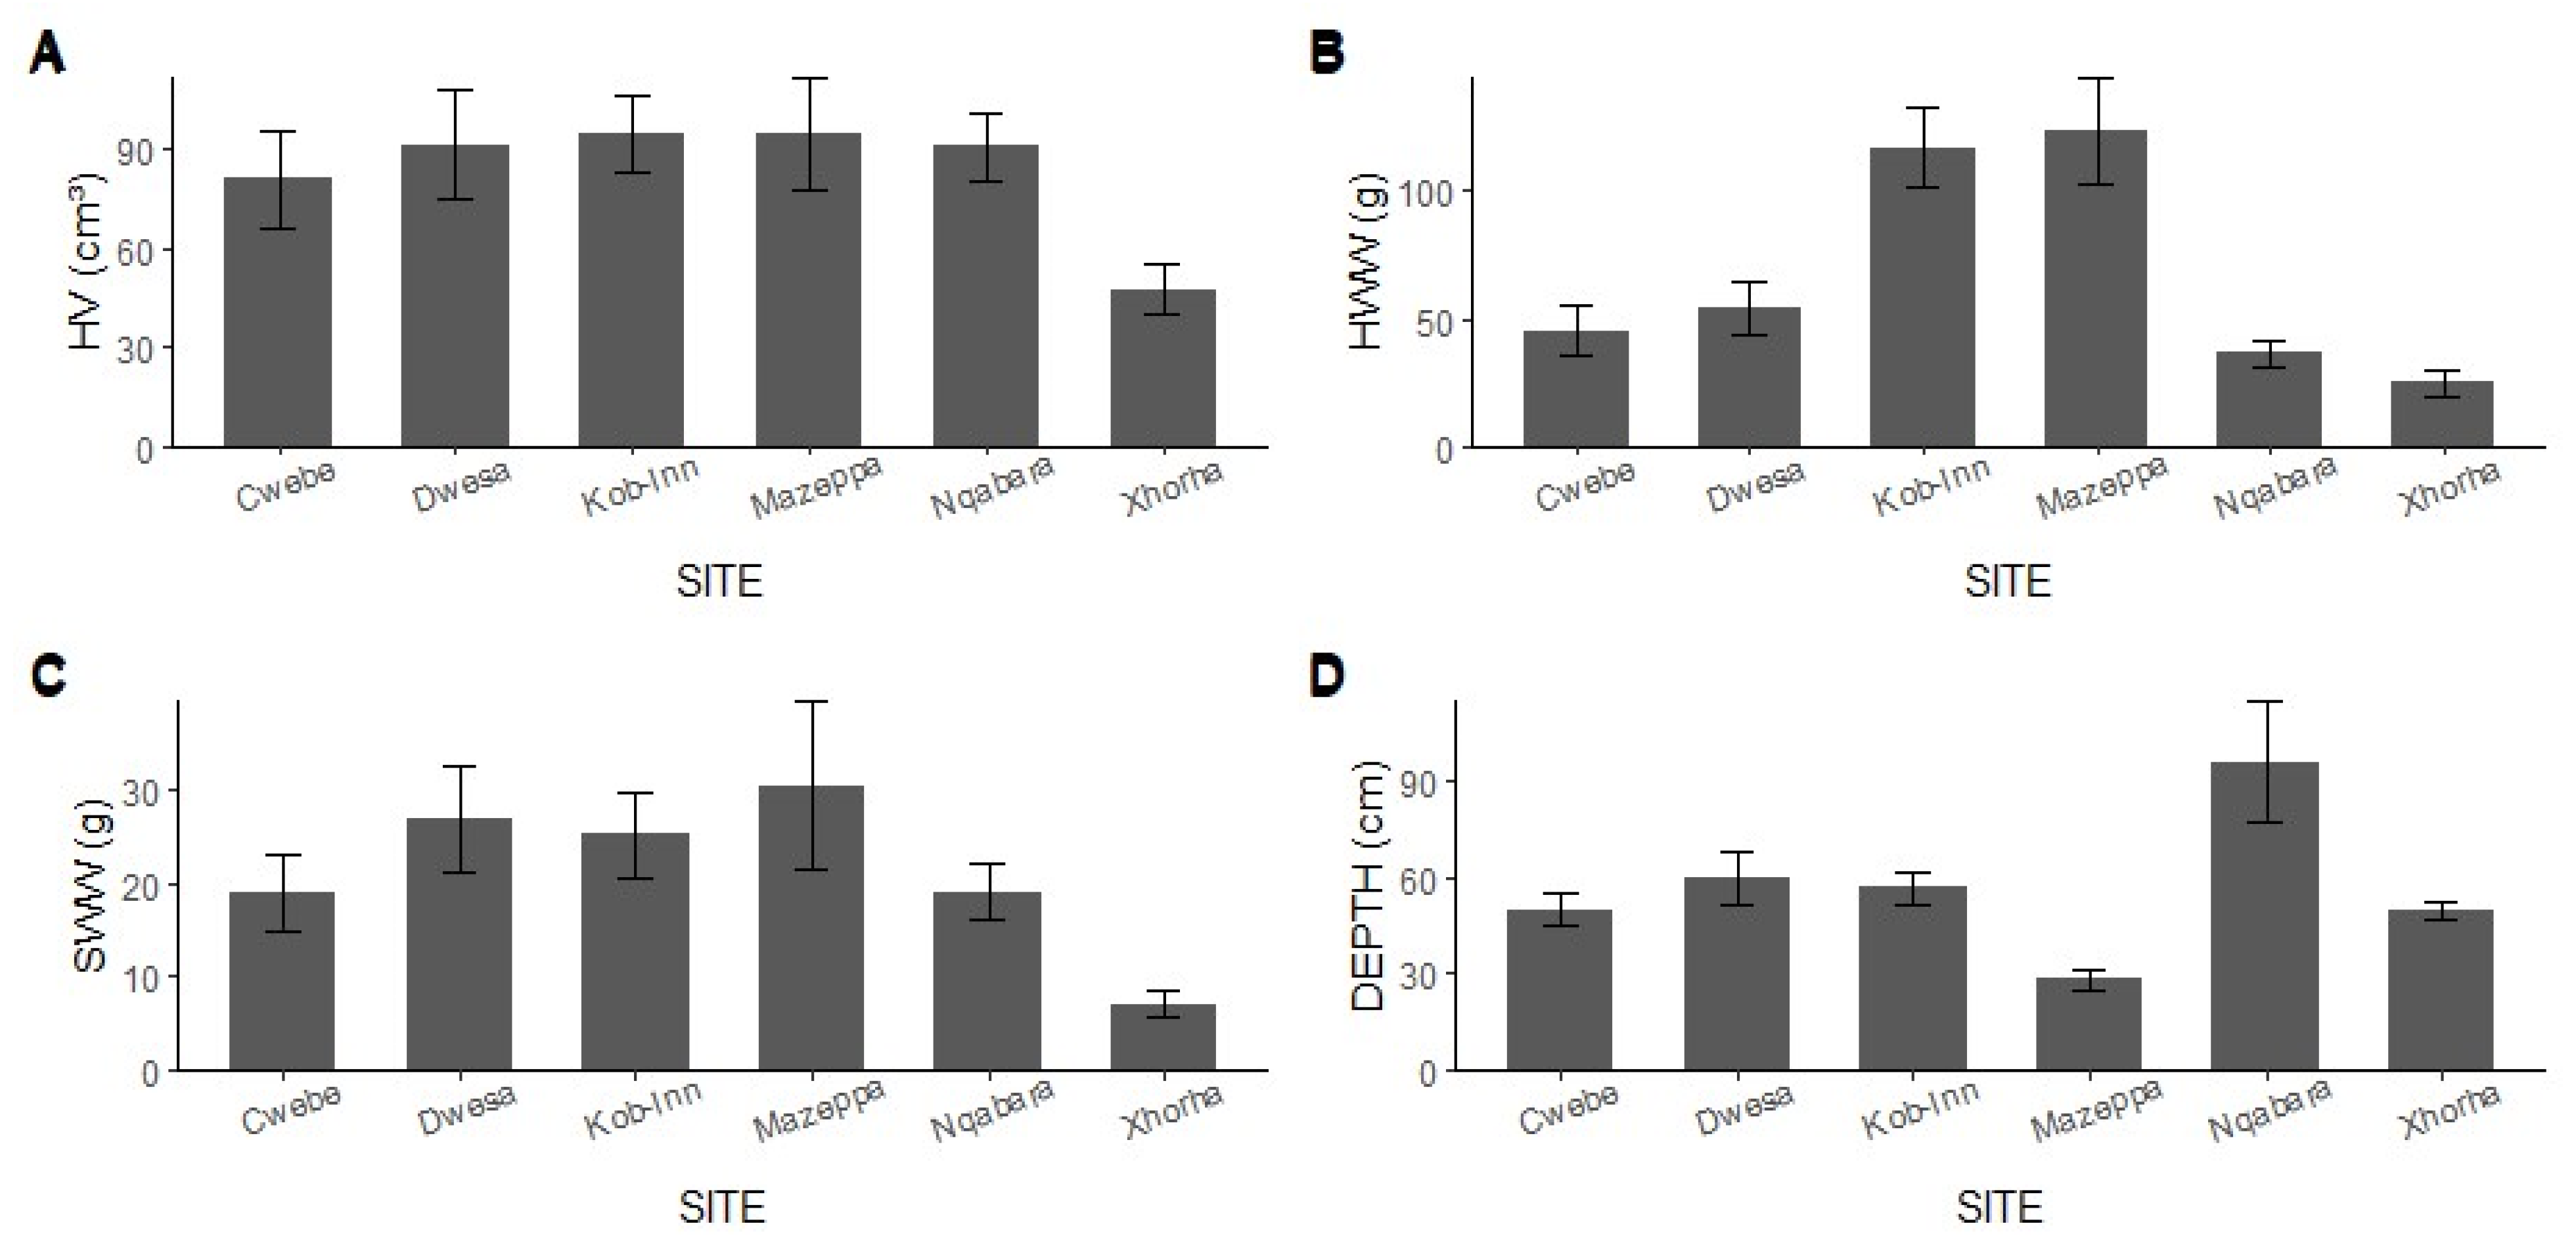
2.2.1. Local Environmental Conditions

The assessed local environmental conditions encompassed solely the physical attributes (holdfast volume, haptera wet weight, sediment wet weight, and depth) directly linked to the fauna residing within the holdfast. The variation in local environmental conditions was illustrated graphically for various sites. Bar plots with standard error bars were created to visually represent the averages of holdfast volume, haptera volume wet weight, sediment wet weight, and the depth of the gullies from which the holdfasts were collected. Univariate main and pairwise Permutational Multivariate Analysis of Variance (PERMANOVA) tests based on Euclidean distances were conducted to assess the differences in local environmental conditions across the sites [43].

2.2.2. Statistical Analyses

A univariate test was conducted to test the null hypothesis suggesting that there is no statistically significant difference in the ecological indices (species abundance, richness, Shannon diversity index, and evenness) between the sites. The generalized linear mixed models (GLMMs) based on the negative distribution family were fitted into the ecological indices’ dataset using the following formula:
glmer (Ecolgical parameter ~ Site + (1|Holdfast volume), family = negative.binomial (theta = 9.44841706620248)
The above model was accessed through lme4 package in R, and the function used to construct it was glmer (). The fixed effect in the model was the site, while ecological parameters (species abundance, species richness, Shannon diversity, and evenness) were the response variables, and the holdfast volume was a random effect. The holdfast volume was included in the model since it is documented as the influential factors in macroinvertebrate species richness in most studies [3,9,10,44,45]. A post hoc test was conducted only for significant models (species abundance and species richness), using multiple comparisons of means (Tukey Contrast) to determine the sites that differed substantially from each other. The function used for the post hoc test was glht () accessed through the multcomp () package. Finally, the model was tested for overdispersion and significant deviances with simulateResiduals () plot from the DHARMa package.
Below is the report of the statistical analyses of the measured ecological indices, augmented by the descriptive statistics. The comparison of the ecological parameters is based on the median ranks and the standard deviation. A correlation matrix was constructed to analyze the relationship between the morphological attributes of the kelp holdfast and the ecological indices and among the latter with the correlation coefficient function corr_coef () from the metan package [46]. The scatterplots and linear regressions were generated to visualize these associations.
A beta diversity was determined from the functions provided by the adespatial package in order to compare the diversity between the sites [47]. To ensure that sites were independent of each other, and that the samples were based on the random distribution, Moran’s I index was quantified. The specific beta diversity parameters that were calculated were the total beta diversity (BDtotal), variables that contributed to the beta diversity such as the turnover rate and nestedness. Turnover rate quantifies the rate of species replacement by various species across distinct sites or along environmental gradients. High turnover signifies notable variations in species composition among communities, indicating a rapid rate of species replacement. Nestedness pertains to the extent to which species in areas with low species diversity are subsets of those found in areas with high species diversity. This metric assesses the degree to which the species composition of one community is nested within that of another. High nestedness suggests that communities with fewer species predominantly consist of species present in communities with a greater number of species [48]. We then calculated the local (site) contribution to beta diversity (LCBD) to assess the extent to which each site influences the variance in beta diversity. The community composition data were subject to a Hellinger transformation to reduce the influence of the abundant taxa to total beta diversity. Finally, a relationship between LCBD and taxa richness was assessed with Pearson product–moment correlation test. This test was performed to evaluate whether the site ecological uniqueness can be used as a proxy for species richness [48].
To map out the clustering of the species composition between sites, we used a multidimensional scale (MDS). To clearly illustrate the spatial variations in species composition via MDS, we categorized the sites based on geographical and environmental affinities: Mazeppa and Kob-Inn constituted a westernmost cluster, while Nqabara, Dwesa, Cwebe, and Xhora formed an easternmost cluster. This was followed up by the statistical comparison of the species composition between sites with the Permutational Multivariate Analysis of Variance (PERMANOVA) with Bray–Curtis [49]. Site was the only factor in the model, and holdfast volume was included as the covariable against a matrix of about 151 species. A cubic transformation was applied to reduce the influence of the most abundant taxa in the comparison of the difference between sites. Where a significant difference was detected, a PERMANOVA pairwise was conducted to discriminate the significance between sites. To evaluate the model homogeneity, we used betadisper () to test the variance within sites. A similarity percentage (SIMPER) was conducted to identify the species that contributed the most to the dissimilarity among sites. All the calculations were based on the R vegan package [49]. A multidimensional scale (MDS) was generated from R ggordiplots package () to visualize the clustering of holdfast-associated macroinvertebrates across sites [50].

3. Results

3.1. Univariate Community Variables

The average volume of the holdfasts across sites was generally around 90 cm³, with the only exception being Xhorha, that had a volume less than 50 cm³ (Figure 2A). The highest kelp volume was recorded in Mazepa (205 cm³) and Kob-Inn (200 cm³), while the lowest was recorded in Xhorha (4 cm³). The average holdfast volumes across the sites were as follows: Mazeppa 95 ± 17.24 cm³, Kob-Inn 94.67 ± 11.56 cm³, Nqabara 90.87 ± 10.40 cm³, Dwesa 91.67 ± 16.46 cm³, Cwebe 81 ± 14.75 cm³, and Xhorha 47 ± 7.75 cm³. However, the variation in holdfast volume across sites was statistically insignificant (df = 5, pseudo-F = 1.83, p = 0.12). In contrast to holdfast volume, the holdfast wet weights varied, with Mazeppa (123.93 ± 21.28 g) and Kob-Inn (117.20 ± 15.80 g) characterized by heavier haptera, while Xhorha (24.92 ± 5.17 g) had the lightest haptera (Figure 2B). The differences in haptera wet weight between sites was statistically significant (df = 5, pseudo-F = 11.22, p = 0.001). A post hoc test denoted the sites that differed from each other (Table 1). Similarly, sediment wet weight varied across sites, although exhibited no clear pattern: Mazeppa 30.48 ± 9.0 g, Kob-Inn 25.17 ± 4.47 g, Nqabara 19.08 ± 2.30 g, Dwesa 29.95 ± 5.67 g, Cwebe 18.89 ± 4.15 g and Xhorha 7.14 ± 1.37 g (Figure 2C). The holdfasts retrieved from Mazeppa contained substantial sediment, whereas the holdfasts from Xhorha exhibited minimal sediment levels. The sediment variation across sites was statistically significant (df = 5, pseudo-F = 2.58, p = 0.04). Sites that varied significantly with each other are summarized in Table 1. The deepest stations (Figure 2D) were found in Nqabara (95.67 ± 18.8), with Kob-Inn (56.5 ± 5.0), Dwesa (59.33 ± 8.26), Xhorha (49.47 ± 3.05) and Cwebe (49.63 ± 5.02) moderately deep, while Mazeppa (28.21 ± 2.94) had the shallowest stations. The depth varied significantly between sites (df = 5, pseudo-F = 5.72, p = 0.001). Sites that were distinct to each other are summarized in Table S1.

3.1.1. Univariate Patterns

The alpha diversity measures of the community varied across sites. The patterns of variation between ecological indices (richness, evenness, and Shannon) across sites were relatively the same (Figure 3). The only exception to the general pattern was the abundance.

3.1.2. Species Richness

Mazeppa was the most species-rich site (median and standard deviation: 13 ± 8.34), followed by Dwesa (10.27 ± 4.38), Nqabara (9.7 ± 4.11), Cwebe (7.8 ± 2.98) and Xhorha (8.87 ± 4.49), with Kob-Inn (6 ± 3.89) almost devoid of species (Figure 3A). The generalized linear mixed model utilizing the negative distribution family indicates a statistically significant difference in species richness among sites, with Mazeppa exhibiting a positive effect, suggesting that this site is more speciose than others (Table 1). The random effect of the holdfast volume was minimal (variance = 0.02 and standard deviation = 0.13), suggesting that variations in species richness are exclusively due to site differences. The negative binomial distribution presented the best model, as no substantial deviations were detected (Figure S8).

3.1.3. Shannon’s Index

The highest species diversity (Figure 3B) was detected in Mazeppa (1.84 ± 0.99), followed by Nqabarha (1.87 ± 0.58), Cwebe (1.67 ± 0.43), Xhorha (1.81 ± 0.45), Dwesa (1.78 ± 0.44) and lastly, Kob-Inn (1.40 ± 0.61). However, based on the GLMM output, no statistically significant differences in species diversity were observed between sites.

3.1.4. Abundance

The greatest number of individuals per holdfast (Figure 3C) was also recorded in Mazeppa (5.92 ± 3.47), followed by Dwesa (6.96 ± 5.08), Cwebe (4.24 ± 1.48), Nqabara (4.24 ± 1.53), Xhorha (4.0 ± 1.71) and Kob-Inn (3.63 ± 1.50). The GLMM output based on the negative binomial distribution indicated that Mazeppa and Dwesa had a positive statistically significant effect on the species abundance (Table 1). This implies that Mazeppa and Dwesa were characterized by the greater number of individuals compared to other sites. However, a holdfast volume presented a substantial random effect across sites (variance = 0.30 and standard deviation = 0.45). Furthermore, the negative binomial distribution model was the best fit model, as no significant deviations were detected (Figure S9).

3.1.5. Evenness

Contrary to the general pattern observed in other ecological indices, Xhorha (0.90 ± 0.85) presents a highly evenly distributed community (Figure 3D). Other sites were also characterized by a low dominance of single individuals, for example, Nqabara (0.85 ± 0.14), Dwesa (0.81 ± 0.15), Mazeppa (0.84 ± 0.10), Cwebe (0.86 ± 0.10) and Kob-Inn (0.83 ± 0.11). Not surprisingly, a fitted generalized linear model (negative binomial distribution) detected no significant site effect on the crustacean species richness.

3.2. Local Environmental Conditions vs. Ecological Indices

The relationship between holdfast volume and species richness varied across sites (Figure S1). For instance, the strong statistically significant positive associations between the holdfast volume and species richness were only detected in Dwesa (r² = 0.86, t = 6.03, df = 13, p < 0.001) and Xhorha (r² = 0.56, t = 2.44, df = 13, p = 0.03). No statistically significant associations were seen among these variables in other sites.
Similarly to the pattern that was observed for the species richness, the only sites that had significant positive associations between holdfast volume and species abundance (Figure S2) were Dwesa (r² = 0.81, t = 5.1, df = 13, p < 0.001) and Xhorha (r² = 0.65, t = 3.06, df = 13, p = 0.01).
The relationship between the sediment wet weight and the species abundance was different across sites (Figure S3). The statistically significant positive associations were detected in Cwebe (r² = 078, t = 4.44, df = 13, p < 0.001), Dwesa (r² = 0.88, t = 6.84, df = 13, p < 0.001), Nqabara (r² = 0.59, t = 2.67, df = 13, p = 0.02) and Xhorha (r² = 0.82, t = 5.22, df = 13, p < 0.001).
The association between the sediment wet weight and the species richness varied from site to site (Figure S4). There were statistically significant positive associations in Cwebe (r² = 0.62, t = 2.86, df = 13, p = 0.01), Dwesa (r² = 0.79, t = 4.63, df = 13, p < 0.001) and Xhora (r² = 0.76, t = 4.27, df = 13, p < 0.001).
The depth at which the holdfasts were collected influenced the species richness differently in different sites (Figure S5). However, the relationship between depth and species richness was only statistically significant in Dwesa (r² = 0.68, t = 3.31, df = 13, p = 0.006) and Nqabara (r² = 0.74, t = 4.0, df = 13, p = 0.002).
The association between depth at which holdfasts were collected and the species abundance was generally weak almost in all sites (Figure S6). The only exception to this pattern was the Dwesa site, at which the number of individuals were positively correlated with depth (r² = 0.74, t = 3.92, df = 13, p = 0.002).

3.3. Multivariate Patterns

3.3.1. Spatial Autocorrelation

An analysis of randomness in samples of species richness and local contribution to beta diversity across sites showed no clustering associated with the location. Therefore, the sampling sites are randomly distributed. The Moran’s I spatial autocorrelation index was −0.22, z-score = −0.97, and p = 0.33.

3.3.2. Beta Diversity

The overall beta diversity within all sites was β-diversity = 0.42, the portion of contribution related to turnover rate = 0.22, and the nestedness = 0.20. The sites that had the highest local contribution to the beta diversity in terms of turnover rates were Xhora (0.24) and Nqabara (0.23), respectively, while the site with the lowest replacement contribution was Mazeppa (0.10). On the other hand, the sites that had the highest local contribution in terms of the differences in species richness were Mazeppa (0.31) and Kob-Inn (0.24), whereas Xhora (0.088) and Nqabara (0.089) had a small influence. However, the local contribution to beta diversity (LCBD was similar across sites, and no statistically significant difference was detected Cwebe (LCBD = 0.15, p = 1), Dwesa (LCBD = 0.15, p = 1), Xhora (LCBD = 0.20, p = 0.77), Nqabara (LCBD = 0.18, p = 1), Mazeppa (LCBD = 0.14, p = 1) and Kob-Inn (LCBD = 0.18, p = 1).

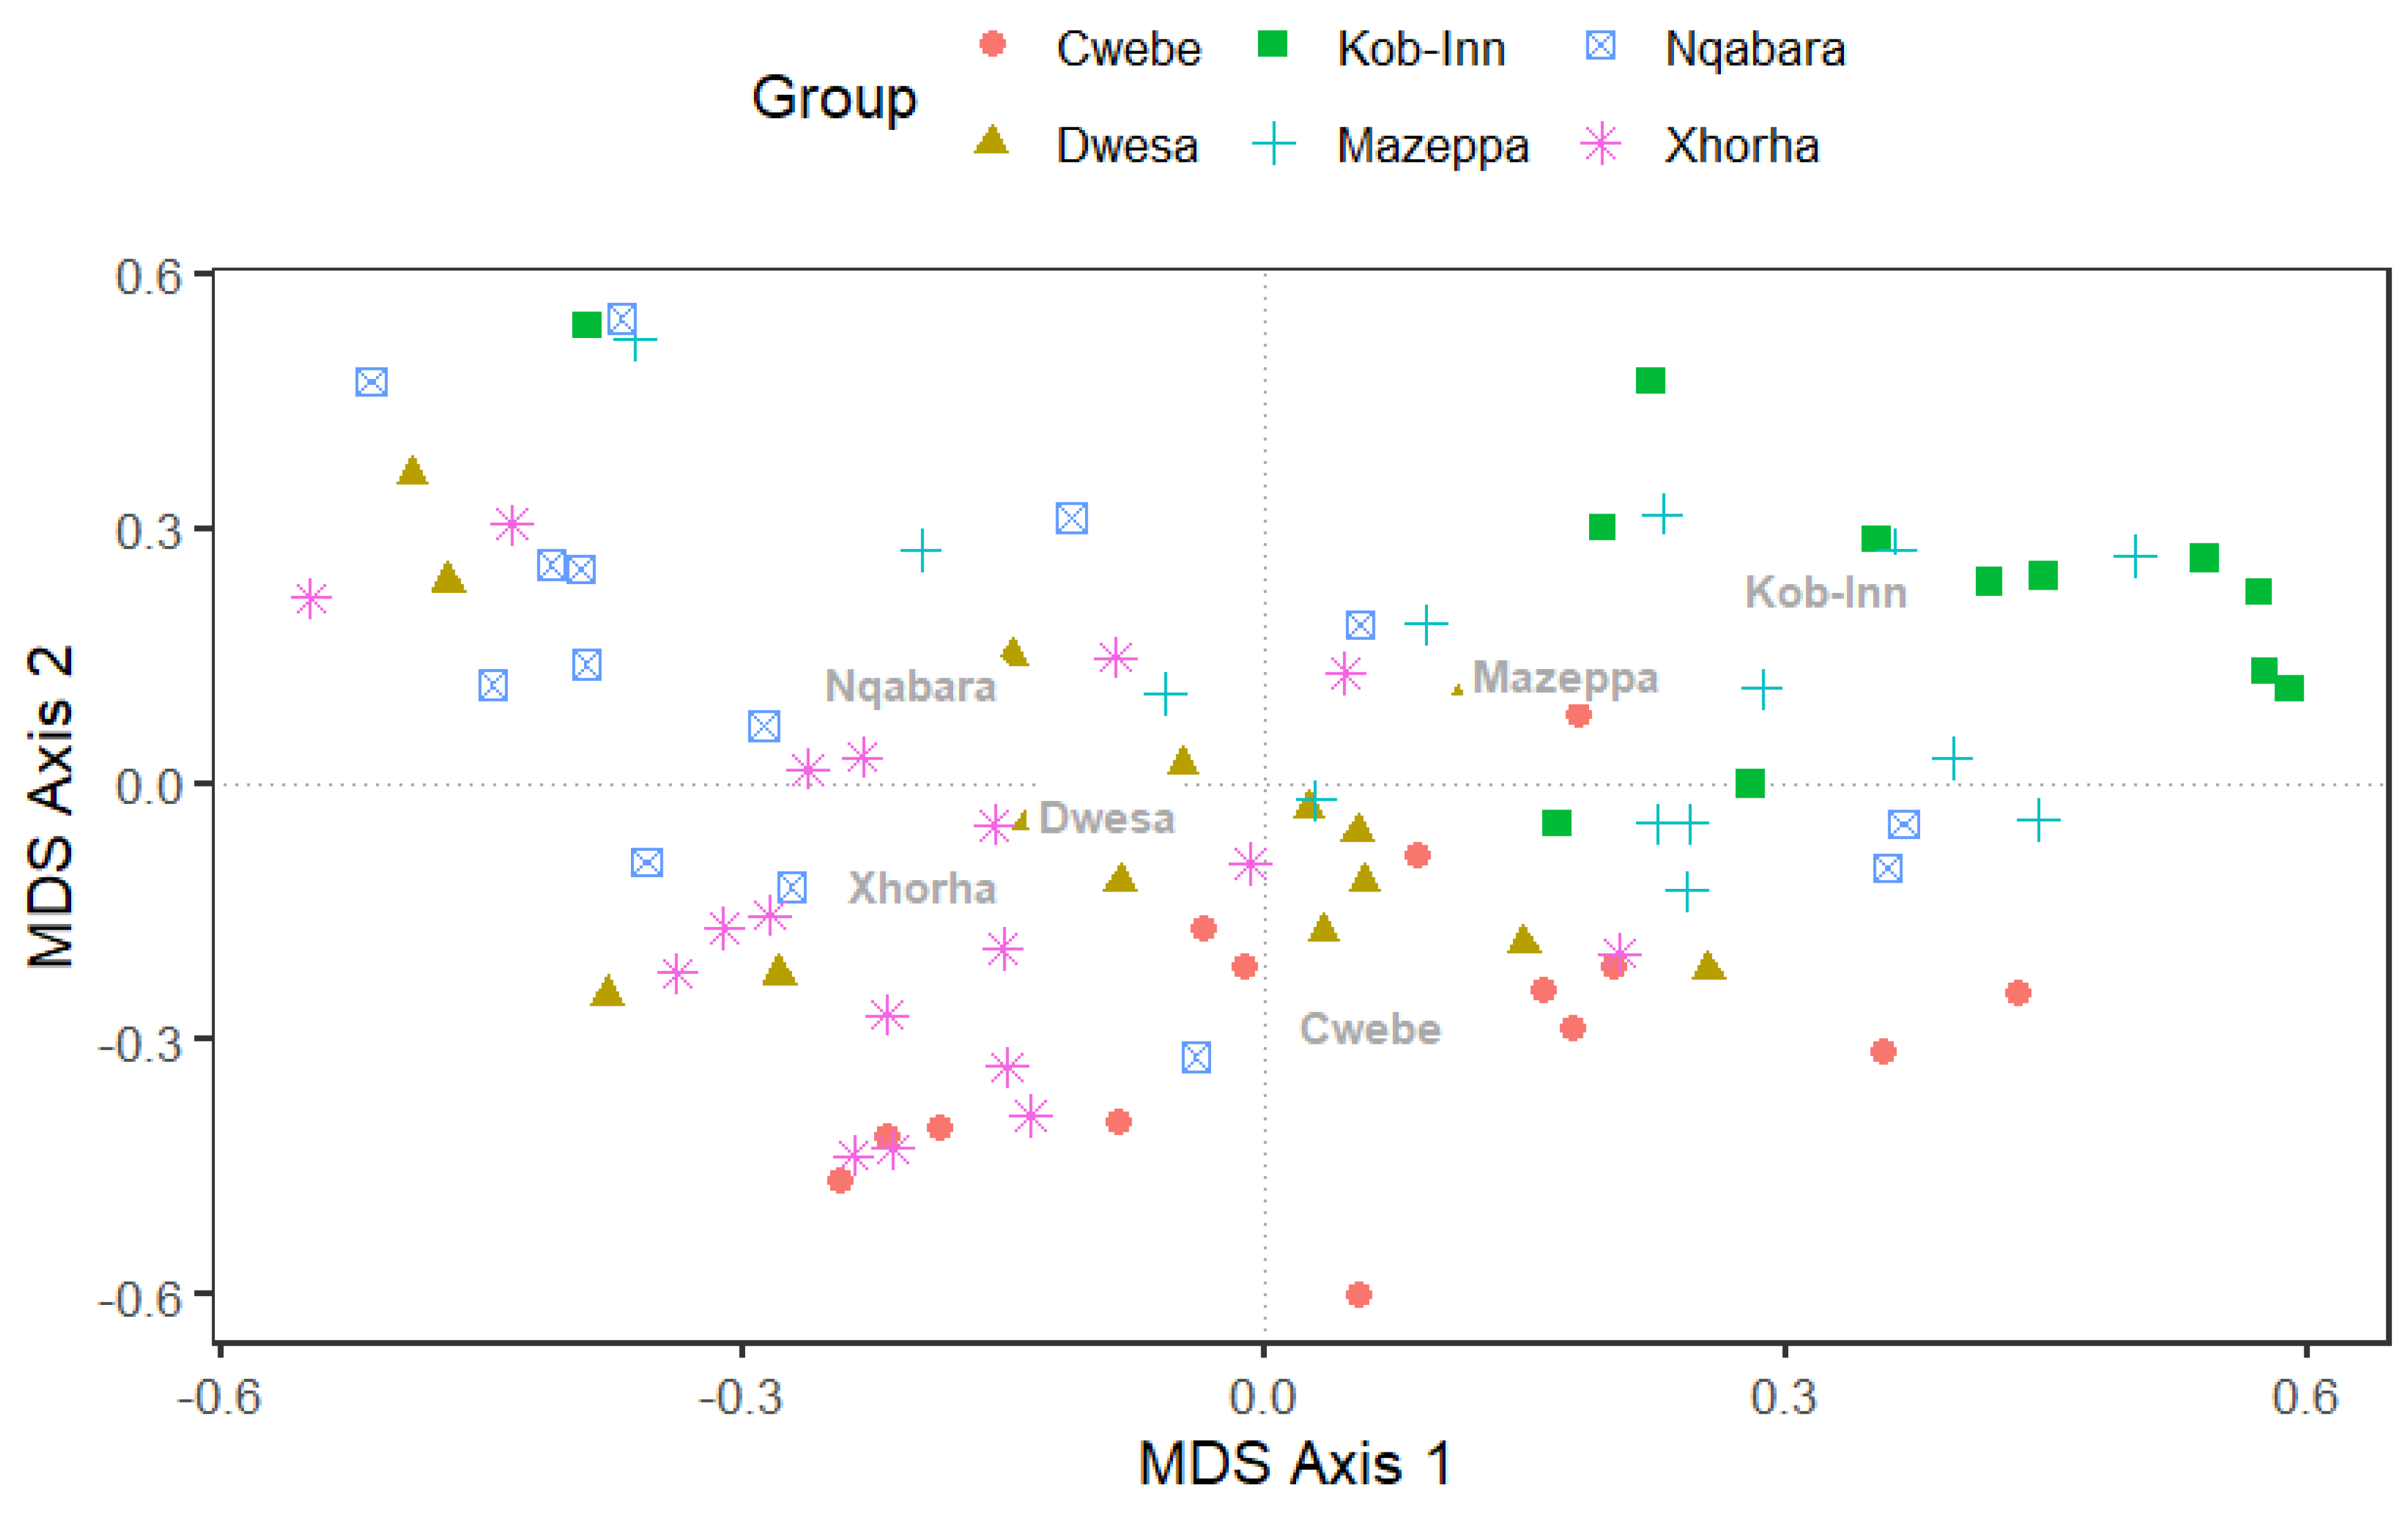
3.3.3. Multidimensional Scaling (MDS) and PERMANOVA

The multidimensional scaling MDS) plot was employed to graphically depict the spatial organization of the community structure of the species throughout the study sites (Figure 4). The MDS unveiled a clear geographic pattern, with each site displaying a cluster of organisms. An additional MDS based on sites geographical and environmental affinities, further depicted a westernmost and easternmost clustering in species composition of holdfast-associated macrofauna (Figure S7). The community composition of macroinvertebrates associated with kelp holdfast showed a significant site effect, as evidenced by the permutational multivariate analysis of variance (PERMANOVA: pseudo-F = 3.85, df = 5, p < 0.001) (Table 2). The model effectively explained 18% of the variation associated with various sites. Significant statistical differences were seen between the Mazeppa and Cwebe pairs (p = 0.015), as well as between Dwesa and Nqabara (p = 0.015), despite some overlapping observations (Figure 3). Each site had a unique collection of species, although there were certain species that were present at multiple sites. A statistically significant site effect (p = 0.015) was found throughout the studied sites (Table 2).
A similarity percentage (SIMPER) analysis showed the species that accounted for more than 50% contribution to the difference between locations (Table 3). Zeuxoides helleri (ratio = 1.0) was an important species determining the dissimilarity among locations. Other prominent species across sites that had a consistent contribution, as reflected in high ratio were Lepidonotus semitectus (ratio = 0.70), Arabella iricolor (ratio = 0.66) and Cirolana venusticauda (ratio = 0.63).

4. Discussion

4.1. Spatial Variation in Local Environmental Conditions Across the Kelp-Associated Coastal Systems

The distribution of holdfast volume was similar in most sites, ranging between 80 and 120 cm3. Such homogeneity among sites is important since the holdfast volume is known to exert a significant influence on the diversity and abundance of taxa per cubic centimetre [10]. This allowed for unbiased selection of sampling units, and a fair comparison in community structure among sites [8,9]. However, the holdfast size decreased from the westernmost sites to the easternmost sites, and this coincides with a pattern generally observed for invertebrate’s species richness in South Africa’s coastline [51]. It was expected that there would be a congruency between the invertebrate species richness and the species-area model [52]. Conversely, the haptera wet weight decreased from westernmost to easternmost sites, and this pattern of variation was statistically significant. The differences in kelp haptera wet weight could be driven by environmental factors such as wave exposure, nutrient availability, and sea surface temperature [53]. The kelp holdfasts gathered from the Mazeppa and Kob-Inn sites experienced more intense wave action than those from the easternmost sites. Additionally, the Mazeppa and Kob-Inn are closest to the West Cold Temperate Bioregion, characterized by low sea surface temperatures and high nutrient levels, conditions conducive to substantial kelp biomass [51]. On the contrary, holdfast sedimentation was highest in Mazeppa and Dwesa, while Xhora was the least sedimented site. These results were unexpected since Dwesa, Cwebe and Nqabara are the sites that were closest to the beaches and bordered by the large river systems, which are anticipated to transport the sediments from the catchment down to the ocean [54]. Understanding the trends in holdfast-associated sediment is crucial since sediment mass/characteristics are known to facilitate invertebrate species richness in coastal systems [44]. Therefore, it is to be expected that sediment rich sites could be associated with high species richness [23]. Depth showed no consistent pattern, with Nqabara being the deepest site, while Mazeppa was the shallowest site. Several studies have reported that kelp is found in various depth ranges, from the shallowest subtidal to the mesophotic zone [55]. However, in the current work, kelp collection was restricted to the subtidal zone.

4.2. Alpha Diversity

The invertebrate species richness showed no clear pattern, although a variation among sites was detected. Mazeppa was the most species-rich sites, compared to other studied sites. Statistical evidence denotes that Mazeppa was significantly different from all other sites (Table 1). Notably, Mazeppa exhibited greater species richness than the adjacent site Kob-Inn, thereby eliminating any potential impact of proximity on the overall findings regarding species richness. Numerous factors could contribute to the high species richness, but the ones quantified in this study include the holdfast volume and sediment wet weight. Both factors are known to increase the species richness in the kelp holdfast [10]. Noteworthy, both Dwesa and Mazeppa were highly ranked in holdfast volume, haptera and sediment wet weight. It was expected that Dwesa and Nqabara would record similar numbers of species, as they are similar in topography and closer to each other. Likewise, Mazeppa and Kob-Inn sites are similar in terms of topography but the species in the latter were very low compared to the former. The reasons for the low species numbers in Kob-Inn are suspected to be related to the observed point source effluent discharge that was sighted in this area (Plate S1). This warrants further investigation, focusing on the effect of sewage discharge on the holdfast-associated macroinvertebrates. Point source outfall is recognized to diminish species richness, especially among native organisms, and/or to supplant them with invasive species [13,56,57].
Mazeppa and Dwesa exhibited the highest individual counts relative to other locations, whereas Kob-Inn ranked lowest in species abundance. This trend was substantiated by statistical data (Table 1). Mazeppa demonstrated significant individual numbers per holdfast compared to other sites, except for Dwesa. Nevertheless, a precaution must be taken as the holdfast volumes exhibited significant variance among the sites, suggesting that size discrepancies may have influenced site differentiation. Consequently, this suggests that Mazeppa, despite not being designated as a marine protected area (MPA), displays characteristics akin to a well-managed MPA, as it is comparable to Dwesa regarding biodiversity.
The species evenness was highest in Xhorha, indicating that the macrofaunal community in this site is mostly evenly distributed compared to other sites. Kob-Inn ranked lowly, even in this index, indicating that the community on this site might be unstable [58]. Be that as it may, there was no statistically significant evidence to discriminate the sites.

4.3. Relationship Between Local Environmental Conditions and Biodiversity Patterns

The relationship between the holdfast attributes (volume, sediment, and depth) and the ecological indices (species richness and abundance) tended to be site-specific. For instance, only in Dwesa and Xhorha (easternmost sites) where an increment in the holdfast volumed translated into a predictable increase in the species richness and abundance. These findings are in agreement with similar studies conducted in other areas and conforming to the species-area hypothesis [3,5,8,9,10,11,21]. Our findings for the easternmost sites contrast with recent results from a similar study on Ecklonia maxima conducted on the west coast of South Africa [29]. In contrast, our results for the westernmost sites (Mazeppa and Kob-Inn) align with those of Katharoyan et al. (2024) [29], as no relationship between holdfast volume and species richness and abundance was identified. Similarly, sediment wet weight was only influential in facilitating the species richness and abundance for Dwesa, Cwebe and Xhorha sites. Interestingly, these are easternmost sites, and thus could be reflecting the differences in sediment grain sizes between eastern and westernmost sites. Sediment is known to create a heterogenous surface, which enhances the species richness [23]. Similarly, depth was only positively associated with the species abundance of Dwesa. However, the species richness increased with depth only in Nqabara and Dwesa sites. These results disagree with findings from other researchers who reported either negative or no relationship between depth and species richness for holdfast-associated macroinvertebrates [45,59].

4.4. Beta Diversity

Prior to formal statistical comparison among sites, a Moran’s I spatial autocorrelation test was conducted to assess the spatial relationship [60], and the test provided no evidence of relativity among localities. This means that the sites were independent of each other. Thus, the results from the experiments can be used without caution. The sites, Xhora, Nqabara and Kobi-Inn, were characterized by high values of LCBD, which in this context, based on historical archives, translate into highly disturbed areas [61]. Xhora and Nqabara are unprotected sites adjacent to Cwebe and Dwesa MPA sections and are historically overexploited areas [62,63]. These results, thus, indirectly echo the MPA effects along this coastline [64,65]. Similarly, although Kob-Inn was far from the MPAs, yet not comparable to Mazeppa, a nearby unprotected site, the biodiversity in the former might have been affected by the sewage discharge from the pipe that was sighted during the holdfast collection (Nkohla and Dlaza, unpublished). The high LCBD value indicates that a site is characterized by ecological uniqueness or has a combination of rare taxa in its species composition [48]. For instance, Xhora and Nqabara had high LCBD in relation to replacement, indicating the rare species found between them. In contrast, Mazeppa had the lowest turnover rate, indicating the possibility of containing a set of species found in all other sites. These results further reinforce that Mazeppa is a species-rich site and shows signs of minimal disturbance [48]. Interestingly, Kob-Inn also had the highest LCBD in relation to differences in species richness compared to other sites, except Mazeppa, despite being one of the sites characterized by poor diversity. A plausible explanation for those values would be the presence of rare/opportunistic species that came about as a result of point source pollution (Nkohla and Dlaza, unpublished). Overall, species replacement and nestedness substantially contribute to the total beta diversity in the study areas. These results may also highlight the low dispersing capacity of some organisms, causing disconnection among sites which could be reflected in the high LCBD by the species replacement value. Similarly, nestedness value contribution to LCBD was also high, indicating some form of overlap between species-rich and species-poor sites [66]. Both replacement gradient and nestedness regulate the community composition dynamics in the current study. Due to the ecological contribution of the Mazeppa site to the overall biodiversity of the area, it might be worth considering this site for MPA protection in the next phase of extension of MPA network along the Eastern Cape shoreline [67]. Similarly, Xhora and Nqabarha may require considerable conservation effort, although these sites can indirectly benefit from the overflow of the adjacent MPAs. A disconnection in species composition could be due to the limited dispersing abilities of some holdfast-associated organisms, local environmental conditions, differences in protection levels, and exposure to various point source pollutants across the study sites. All the sites were statistically significantly different from each other, signalling the unique set of species constituting the community structure of macroinvertebrates in each site. The species contributing to the dissimilarity among sites came from various taxonomic groups with varying life histories, including polychaetes, peanut worms, echinoderms, isopods, and amphipods. Zeuxoides helleri was the organism that exhibited consistent contribution to dissimilarity between sites and separating the westernmost and easternmost cluster (Figure 3). This tanaid is found to be associated with sediments or detritus and has a low dispersing capacity. It reproduces the juveniles directly after a period of brooding in its pouch [33,68]. Due to its body size, it may not be possible to swim actively from westernmost to easternmost sites. The plausible explanation for its wide distributional range is through macroalgal rafting [69]. Another equally important organism in contribution to the dissimilarity among sites is Cirolana venusticauda, an isopod that distinguishes itself from other members in the genera also occurring along the wild coast by the presence of about eighteen tubercles on the hind margin of Pereonite VII, and pleonite, as well as the occurrence of the ridges and tubercles on the pleotelson [70]. This species has excellent adaptability to a wide range of habitats across various depth levels, from intertidal to pelagic zones. Most members of this genus are predators and scavengers, although some can be parasitic, feeding on fish and other marine fauna [71]. Although locomotion is possible, they are generally sedentary, found burrowing in sediment or kelp holdfast. They are gonochoric, and females have pouches for brooding their babies (Kensley, 1978) [70]. Dispersing mode could only be possible through rafting or man-made [71]. Therefore, its adaptability and tolerance range to wide environmental conditions could be the reason for its occurrence in most sites. Hence, it became one of the important organisms in discriminating the sites. Amphipholis squamata, a hermaphrodite ophiuroid capable of self-fertilization, as well as brooding offspring [72], often dominates the community of fauna within the holdfast. These organisms are omnivores and detritivores [40,73], a feeding guild that thrives in holdfast. Their feeding guild and colour varieties enable them to survive in many habitats, but their life history and reproductive strategy that lack a swimming planktonic phase restrict their dispersal abilities [40], and hence, they are only dominant in specific local environment conditions.

5. Conclusions

This study provided the initial species list of the macroinvertebrates that are found in association with the holdfast of Ecklonia radiata along the Wild Coast of South Africa (Table S2). Therefore, it acts as the standard for future mentions of human-caused alteration and eastward ocean cooling along the South African coastline. The results of our study demonstrated that the composition of macroinvertebrates in holdfast-associated communities differed among different sites but conformed to the established biogeographical model of South African marine invertebrates. The association of the holdfast attributes and ecological indices were site-specific, but where the relationship was detected, it was always positive. These features underscore the preservation of the biogeographical pattern by the fauna connected with the holdfast. In contrast, alpha and beta diversity exhibited contrasting results. Alpha diversity (ecological indices) demonstrated statistically significant results solely for species abundance and richness, with not all sites exhibiting differences. Conversely, beta diversity (species composition) indicated significant variation across all sites. Furthermore, our data provided support for the hypotheses we presented. Moreover, these findings provide a potent instrument for strategizing biodiversity planning and identifying the places that need prioritization for conservation efforts. However, the analyses conducted on the holdfast-related community assemblages recovered in Kob-Inn, a site directly exposed to point source pollution, provided evidence that the macrofauna associated with holdfasts are significant indicators. The biodiversity pattern in the studied area was mostly influenced by species replacement and turnover, indicating the connectivity among sites and the ecological uniqueness of various sites. This information is of utmost importance to conservation authorities.

Supplementary Materials

The following supporting information can be downloaded at: https://www.mdpi.com/article/10.3390/d17030203/s1, Figure S1: The relationship between a holdfast volume and species richness across sites; Figure S2: The relationship between a holdfast volume and species abundance across sites; Figure S3: The relationship between a sediment wet weight and species abundance across sites; Figure S4: The relationship between a sediment wet weight and species richness across sites; Figure S5: The relationship between depth and species richness across sites; Figure S6: The relationship between depth weight and species abundance across sites; Figure S7: The multidimensional scale (MDS) showing the spatial structure of the holdfast-associated macroinvertebrates between Easternmost and Westernmost sites; Figure S8: The residual plot depicting the best fit of the model for the species richness dataset; Figure S9: The residual plot depicting the best fit of the model for the species abundance dataset; Table S1: The PERMANOVA pairwise output for the significant differences in the holdfast attributes between sites; Table S2: A list of Ecklonia radiata holdfast-associated macroinvertebrate species and the variation in their occurrences at different sites along the wild coast of South Africa; Plate S1: Point source pollution at Kob-Inn site.

Author Contributions

Conceptualization, N.N.; Methodology, N.N. and T.S.D.; Investigation, N.N.; Resources, T.S.D.; Data curation, N.N.; Writing—original draft, N.N.; Writing—review & editing, N.N. and T.S.D.; Supervision, T.S.D.; Funding acquisition, T.S.D. All authors have read and agreed to the published version of the manuscript.

Funding

National Research Foundation Grant number: MND200611530457.

Institutional Review Board Statement

The Ethical Clearance was issued by the Ethical Committee of Walter Sisulu University, Faculty of Natural Sciences. Protocol number: WSU/FNS-GREC/2024/03/11/G51. Date of approval: 19 July 2024.

Data Availability Statement

The additional data to support our results can be accessed on the following link: Nkohla, N., & Dlaza, T. (2025). Holdfast Fauna [Data set]. Zenodo. https://doi.org/10.5281/zenodo.15005270.

Conflicts of Interest

The authors declare no conflicts of interest.

References

  1. Darwin, C. The Origin of Species [On the Origin of Species]; PF Collier & Son: New York, NY, USA, 1909. [Google Scholar]
  2. Jones, D. Variation in the trophic structure and species composition of some invertebrate communities in polluted kelp forests in the North Sea. Mar. Biol. 1973, 20, 351–365. [Google Scholar] [CrossRef]
  3. Teagle, H.; Moore, P.J.; Jenkins, H.; Smale, D.A. Spatial variability in the diversity and structure of faunal assemblages associated with kelp holdfasts (Laminaria hyperborea) in the northeast Atlantic. PLoS ONE 2018, 13, e0200411. [Google Scholar] [CrossRef]
  4. Wernberg, T.; Coleman, M.A.; Babcock, R.C.; Bell, S.Y.; Bolton, J.J.; Connell, S.D.; Hurd, C.L.; Johnson, C.R.; Marzinelli, E.M.; Shears, N.T. Biology and Ecology of the Globally Significant Kelp Ecklonia Radiata; Oceanography and marine biology; Taylor & Francis: Abingdon, UK, 2019. [Google Scholar]
  5. Carbajal, P.; Gamarra Salazar, A.; Moore, P.J.; Pérez-Matus, A. Different kelp species support unique macroinvertebrate assemblages, suggesting the potential community-wide impacts of kelp harvesting along the Humboldt current system. Aquat. Conserv. Mar. Freshw. Ecosyst. 2022, 32, 14–27. [Google Scholar] [CrossRef]
  6. Teagle, H.; Hawkins, S.J.; Moore, P.J.; Smale, D.A. The role of kelp species as biogenic habitat formers in coastal marine ecosystems. J. Exp. Mar. Biol. Ecol. 2017, 492, 81–98. [Google Scholar] [CrossRef]
  7. Wernberg, T. Holdfast aggregation in relation to morphology, age, attachment and drag for the kelp Ecklonia radiata. Aquat. Bot. 2005, 82, 168–180. [Google Scholar] [CrossRef]
  8. Anderson, M.J.; Connell, S.D.; Gillanders, B.M.; Diebel, C.E.; Blom, W.M.; Saunders, J.E.; Landers, T.J. Relationships between taxonomic resolution and spatial scales of multivariate variation. J. Anim. Ecol. 2005, 74, 636–646. [Google Scholar] [CrossRef]
  9. Anderson, M.J.; Diebel, C.E.; Blom, W.M.; Landers, T.J. Consistency and variation in kelp holdfast assemblages: Spatial patterns of biodiversity for the major phyla at different taxonomic resolutions. J. Exp. Mar. Biol. Ecol. 2005, 320, 35–56. [Google Scholar] [CrossRef]
  10. Smith, S.D.; Simpson, R.D.; Cairns, S.C. The macrofaunal community of Ecklonia radiata holdfasts: Description of the faunal assemblage and variation associated with differences in holdfast volume. Aust. J. Ecol. 1996, 21, 81–95. [Google Scholar] [CrossRef]
  11. Blight, A.; Thompson, R. Epibiont species richness varies between holdfasts of a northern and a southerly distributed kelp species. J. Mar. Biol. Assoc. U. K. 2008, 88, 469–475. [Google Scholar] [CrossRef]
  12. Fernández, C.; Pineiro-Corbeira, C.; Barrientos, S.; Barreiro, R. Could the annual Saccorhiza polyschides replace a sympatric perennial kelp (Laminaria ochroleuca) when it comes to supporting the holdfast-associated fauna? Mar. Environ. Res. 2022, 182, 105772. [Google Scholar] [CrossRef] [PubMed]
  13. Smith, S.D. Evaluating stress in rocky shore and shallow reef habitats using the macrofauna of kelp holdfasts. J. Aquat. Ecosyst. Stress Recovery 2000, 7, 259–272. [Google Scholar] [CrossRef]
  14. Smith, S.D.; Simpson, R.D. Effects of pollution on holdfast macrofauna of the kelp Ecklonia radiata: Discrimination at different taxonomic levels. Mar. Ecol. Prog. Ser. Oldendorf 1993, 96, 199–208. [Google Scholar] [CrossRef]
  15. Teagle, H.; Smale, D.A. Climate-driven substitution of habitat-forming species leads to reduced biodiversity within a temperate marine community. Divers. Distrib. 2018, 24, 1367–1380. [Google Scholar] [CrossRef]
  16. Thompson, R.; Crowe, T.; Hawkins, S. Rocky intertidal communities: Past environmental changes, present status and predictions for the next 25 years. Environ. Conserv. 2002, 29, 168–191. [Google Scholar] [CrossRef]
  17. Zahn, L.A.; Claisse, J.T.; Williams, J.P.; Williams, C.M.; Pondella, D.J. The biogeography and community structure of kelp forest macroinvertebrates. Mar. Ecol. 2016, 37, 770–785. [Google Scholar] [CrossRef]
  18. Shelamoff, V.; Layton, C.; Tatsumi, M.; Cameron, M.J.; Wright, J.T.; Johnson, C.R. Patch size and density of canopy-forming kelp modify influences of ecosystem engineering on understorey algal and sessile invertebrate assemblages. Mar. Ecol. Prog. Ser. 2019, 632, 59–79. [Google Scholar] [CrossRef]
  19. Blamey, L.K. Ecosystem Effects of a Rock-Lobster ‘Invasion’: Comparitive and Modelling Approaches. Ph.D. Thesis, University of Cape Town, Cape Town, South Africa, 2010. [Google Scholar]
  20. Steyn, C.; Shannon, L.J.; Blamey, L.K. Changes in food-web structure and energy flow in kelp forest ecosystems on the south-west coast of South Africa following the invasion of Jasus lalandii. Food Webs 2021, 28, e00200. [Google Scholar] [CrossRef]
  21. Bué, M.; Smale, D.A.; Natanni, G.; Marshall, H.; Moore, P.J. Multiple-scale interactions structure macroinvertebrate assemblages associated with kelp understory algae. Divers. Distrib. 2020, 26, 1551–1565. [Google Scholar] [CrossRef]
  22. Bustamante, R.; Branch, G.; Eekhout, S. The influences of physical factors on the distribution and zonation patterns of South African rocky-shore communities. Afr. J. Mar. Sci. 1997, 18, 119–136. [Google Scholar] [CrossRef]
  23. Mcquaid, C.D.; Dower, K.M. Enhancement of habitat heterogeneity and species richness on rocky shores inundated by sand. Oecologia 1990, 84, 142–144. [Google Scholar] [CrossRef]
  24. Ríos, C.; Arntz, W.E.; Gerdes, D.; Mutschke, E.; Montiel, A. Spatial and temporal variability of the benthic assemblages associated to the holdfasts of the kelp Macrocystis pyrifera in the Straits of Magellan, Chile. Polar Biol. 2007, 31, 89–100. [Google Scholar] [CrossRef]
  25. Bolton, J.J.; Anderson, R.J.; Smit, A.J.; Rothman, M.D. South African kelp moving eastwards: The discovery of Ecklonia maxima (Osbeck) Papenfuss at De Hoop Nature Reserve on the south coast of South Africa. Afr. J. Mar. Sci. 2012, 34, 147–151. [Google Scholar] [CrossRef]
  26. Dunga, L.; Lück-Vogel, M.; Blamey, L.K.; Bolton, J.; Rothman, M.; Desmet, P.; Sink, K. Mapping South Africa’s canopy-forming kelp forests using low-cost, high-resolution Sentinel-2 imagery. Estuar. Coast. Shelf Sci. 2024, 310, 108989. [Google Scholar] [CrossRef]
  27. Anderson, R.; Carrick, P.; Levitt, G.; Share, A. Holdfasts of adult kelp Ecklonia maxima provide refuges from grazing for recruitment of juvenile kelps. Mar. Ecol. Prog. Ser. 1997, 159, 265–273. [Google Scholar] [CrossRef]
  28. Beviss-Challinor, M.; Field, J. Analysis of a benthic community food web using isotopically labeled potential food. Mar. Ecol. Prog. Ser. 1982, 9, 223–230. [Google Scholar] [CrossRef]
  29. Katharoyan, C.; Peer, N.; Landschoff, J.; Griffiths, C.L.; Samaai, T.; Beeslaar, D. Kelp holdfasts in the Great African Seaforest provide habitat for diverse assemblages of macroinvertebrates. Aquat. Biol. 2024, 33, 33–45. [Google Scholar] [CrossRef]
  30. Nkohla, N.; Dlaza, T. Site-and habitat-dependent variations in the diversity of polychaetes associated with golden kelp Ecklonia radiata holdfasts along the southeast coast of South Africa. Afr. J. Mar. Sci. 2024, 46, 41–54. [Google Scholar] [CrossRef]
  31. Branch, G. Living Shores; Penguin Random House South Africa: New York, NY, USA, 2018. [Google Scholar]
  32. Branch, G.; Branch, M.; Bannister, A. The Living Shores of Southern Africa; Penguine Random House South Africa: New York, NY, USA, 1981. [Google Scholar]
  33. Branch, G.; Branch, M.; Griffiths, C.; Beckley, L. Two Oceans: A Guide to The Marine Life of Southern Africa; Penguin Random House South Africa: New York, NY, USA, 2022. [Google Scholar]
  34. Day, J.H. A Monograph on the Polychaeta of Southern Africa. Part 1. Errantia; BM(NH): London, UK, 1967. [Google Scholar]
  35. Day, J.H. A Monograph on the Polychaeta of Southern Africa. Part 2. Sedentaria; BM(NH): London, UK, 1967. [Google Scholar]
  36. Day, J.H. A Guide to Marine Life on South African Shores; University of Cape Town: Cape Town, South Africa, 1969. [Google Scholar]
  37. Griffiths, C. Crustacean systematics in South Africa—Status and historical overview. Trans. R. Soc. S. Afr. 1999, 54, 43–52. [Google Scholar] [CrossRef]
  38. Griffiths, C.L. The Gammaridean and Caprellid Amphipoda of Southern Africa. Ph.D. Thesis, University of Cape Town, Cape Town, South Africa, 1974. [Google Scholar]
  39. Kensley, B.F. Isopoda. Guides to the Freshwater Invertebrates of Southen Africa. Volume 4: Crustacea III, Bathynellacea, Amphipoda, Isopoda, Spelaeogriphacea, Tanaidacea and Decapoda. Afr. J. Aquat. Sci. 2001, 27, 95. [Google Scholar]
  40. Olbers, J.M. Taxonomy, Biodiversity and Biogeography of the Brittle Stars (Echinodermata: Ophiuroidea) of South Africa. Ph.D. Thesis, University of Cape Town, Cape Town, South Africa, 2016. [Google Scholar]
  41. Simon, C.; Kara, J.; Clarke, D.; Sedick, S. Revisiting ‘A monograph on the Polychaeta of southern Africa’: Establishing taxonomic research priorities in southern Africa. Afr. J. Mar. Sci. 2022, 44, 83–100. [Google Scholar] [CrossRef]
  42. Zuur, A.; Ieno, E.; Elphick, C. Zuur AF, Ieno EN, Elphick CS. A protocol for data exploration to avoid common statistical problems. Methods Ecol Evol 1: 3–14. Methods Ecol. Evol. 2010, 1, 3–14. [Google Scholar] [CrossRef]
  43. Clarke, K.; Gorley, R. PRIMER Version 7: User Manual/Tutorial; PRIMER-E: Auckland, New Zealand, 2015; Volume 192. [Google Scholar]
  44. Baldrich, Á.M.; Rodríguez-Villegas, C.; Buschmann, A.H. The giant kelp holdfasts macroinvertebrate assemblages: Towards benthic management and conservation using alpha and beta diversity in Northern Patagonia. Reg. Stud. Mar. Sci. 2024, 80, 103896. [Google Scholar]
  45. Ronowicz, M.; Kukliński, P.; Włodarska-Kowalczuk, M. Diversity of kelp holdfast-associated fauna in an Arctic fjord-inconsistent responses to glacial mineral sedimentation across different taxa. Estuar. Coast. Shelf Sci. 2018, 205, 100–109. [Google Scholar] [CrossRef]
  46. Olivoto, T.; Lúcio, A.D.C. metan: An R package for multi-environment trial analysis. Methods Ecol. Evol. 2020, 11, 783–789. [Google Scholar] [CrossRef]
  47. Dray, S.; Pélissier, R.; Couteron, P.; Fortin, M.-J.; Legendre, P.; Peres-Neto, P.R.; Bellier, E.; Bivand, R.; Blanchet, F.G.; De Cáceres, M.; et al. Community ecology in the age of multivariate multiscale spatial analysis. Ecol. Monogr. 2012, 82, 257–275. [Google Scholar] [CrossRef]
  48. Landeiro, V.L.; Franz, B.; Heino, J.; Siqueira, T.; Bini, L.M. Species-poor and low-lying sites are more ecologically unique in a hyperdiverse Amazon region: Evidence from multiple taxonomic groups. Divers. Distrib. 2018, 24, 966–977. [Google Scholar] [CrossRef]
  49. Oksanen, J.; Blanchet, F.G.; KINDT, R.; Legendre, P.; O’hara, R.G.; Simpson, G.; Solymos, P.; Stevens, H.; Wagner, H. Multivariate Analysis of Ecological Communities in R: Vegan Tutorial; R Package Version 1.7; R Core Team: Vienna, Austria, 2013. [Google Scholar]
  50. Quensen, J.; Simpson, G.; Oksanen, J. ggordiplots: Make Ggplot Versions of Vegans Ordiplots; R Package Version; R Core Team: Vienna, Austria, 2018; Volume 8. [Google Scholar]
  51. Awad, A.A.; Griffiths, C.L.; Turpie, J.K. Distribution of South African marine benthic invertebrates applied to the selection of priority conservation areas. Divers. Distrib. 2002, 8, 129–145. [Google Scholar] [CrossRef]
  52. Guilhaumon, F.; Basset, A.; Barbone, E.; Mouillot, D. Species–area relationships as a tool for the conservation of benthic invertebrates in Italian coastal lagoons. Estuar. Coast. Shelf Sci. 2012, 114, 50–58. [Google Scholar] [CrossRef]
  53. Gundersen, H.; Rinde, E.; Bekkby, T.; Hancke, K.; Gitmark, J.K.; Christie, H. Variation in population structure and standing stocks of kelp along multiple environmental gradients and implications for ecosystem services. Front. Mar. Sci. 2021, 8, 578629. [Google Scholar] [CrossRef]
  54. Wampler, P. Rivers and Streams—Water and Sediment in Motion. Nat. Educ. Knowl. 2012, 3, 18. [Google Scholar]
  55. Anderson, R.; Stegenga, H.; Bolton, J. Seaweeds of the South African South Coast; World Wide Web Electronic Publication, University of Cape Town: Cape Town, South Africa, 2016; Available online: http://southafrseaweeds.uct.ac.za (accessed on 20 December 2024).
  56. Fowles, A.E.; Edgar, G.J.; Stuart-Smith, R.D.; Kirkpatrick, J.B.; Hill, N.; Thomson, R.J.; Strain, E.M. Effects of pollution from anthropogenic point sources on the recruitment of sessile estuarine reef biota. Front. Mar. Sci. 2018, 5, 417. [Google Scholar] [CrossRef]
  57. Jones, D. Ecological studies on macroinvertebrate populations associated with polluted kelp forests in the North Sea. Helgol. Mar. Res. 1971, 22, 417–441. [Google Scholar] [CrossRef]
  58. Wilsey, B.J.; Potvin, C. Biodiversity and ecosystem functioning: Importance of species evenness in an old field. Ecology 2000, 81, 887–892. [Google Scholar] [CrossRef]
  59. Coleman, M.A.; Vytopil, E.; Goodsell, P.J.; Gillanders, B.M.; Connell, S.D. Diversity and depth-related patterns of mobile invertebrates associated with kelp forests. Mar. Freshw. Res. 2007, 58, 589–595. [Google Scholar] [CrossRef]
  60. Hamylton, S.; Barnes, R. The effect of sampling effort on spatial autocorrelation in macrobenthic intertidal invertebrates. Hydrobiologia 2018, 811, 239–250. [Google Scholar] [CrossRef]
  61. Sor, R.; Legendre, P.; Lek, S. Uniqueness of sampling site contributions to the total variance of macroinvertebrate communities in the Lower Mekong Basin. Ecol. Indic. 2018, 84, 425–432. [Google Scholar] [CrossRef]
  62. Lasiak, T. The shellfish-gathering practices of indigenous coastal people in Transkei: Patterns, preferences and perceptions. S. Afr. J. Ethnol. 1993, 16, 115–120. [Google Scholar]
  63. Mills, C.G. Shellfish Utilization and Its Effect on Rocky Shore Biota in Transkei. Master’s Thesis, Faculty of Science, Department of Environmental and Geographical Science, University of Cape Town, Cape Town, South Africa, 1985. [Google Scholar]
  64. Baliwe, N.G.; Pfaff, M.C.; Branch, G.M. Assessing the effects of no-take zones in a marine protected area spanning two ecoregions and rock substrate types. Front. Mar. Sci. 2022, 9, 893260. [Google Scholar] [CrossRef]
  65. Kirkman, S.; Mann, B.; Sink, K.; Adams, R.; Livingstone, T.; Mann-Lang, J.; Pfaff, M.; Samaai, T.; Van Der Bank, M.; Williams, L. Evaluating the evidence for ecological effectiveness of South Africa’s marine protected areas. Afr. J. Mar. Sci. 2021, 43, 389–412. [Google Scholar] [CrossRef]
  66. Ruhí, A.; Datry, T.; Sabo, J.L. Interpreting beta-diversity components over time to conserve metacommunities in highly dynamic ecosystems. Conserv. Biol. 2017, 31, 1459–1468. [Google Scholar] [CrossRef]
  67. Dubois, R.; Proulx, R.; Pellerin, S. Ecological uniqueness of plant communities as a conservation criterion in lake-edge wetlands. Biol. Conserv. 2020, 243, 108491. [Google Scholar]
  68. Esquete, P.; Bamber, R.; Moreira, J.; Troncoso, J. Redescription and postmarsupial development of Apseudopsis latreillii (Crustacea: Tanaidacea). J. Mar. Biol. Assoc. U. K. 2012, 92, 1023–1041. [Google Scholar] [CrossRef]
  69. Fraser, C.I.; Nikula, R.; Waters, J.M. Oceanic rafting by a coastal community. Proc. R. Soc. B Biol. Sci. 2011, 278, 649–655. [Google Scholar]
  70. Kensley, B.F. Guide to the Marine Isopods of Southern Africa; The Rustica Press: Cape Town, South Africa, 1978. [Google Scholar]
  71. Bruce, N.L. Revision of the isopod crustacean genus Mothocya Costa, in Hope, 1851 (Cymothoidae: Flabellifera), parasitic on marine fishes. J. Nat. Hist. 1986, 20, 1089–1192. [Google Scholar] [CrossRef]
  72. Deheyn, D.; Jangoux, M. Colour varieties as sibling species in the polychromatic ophiuroid Amphipholis squamata (Echinodermata): Evidence from inheritance of body colour and luminescence characters. J. Exp. Mar. Biol. Ecol. 1999, 234, 219–234. [Google Scholar] [CrossRef]
  73. Jones, M.; Smaldon, G. Aspects of the biology of a population of the cosmopolitan brittlestar Amphipholis squamata (Echinodermata) from the Firth of Forth, Scotland. J. Nat. Hist. 1989, 23, 613–625. [Google Scholar] [CrossRef]
Figure 1. Map of South Africa showing the location of the study sites on the southeast coast where macroinvertebrates associated with the holdfasts of kelp Ecklonia radiata were collected.
Diversity 17 00203 g001
Figure 2. The variation in the holdfast volume (A), haptera wet weight (B), sediment wet weight (C), and depth (D) in different locations.
Diversity 17 00203 g002
Figure 3. (AD): A boxplot showing the spatial variation in ecological indices of macroinvertebrates associated with the holdfast of the golden kelp. Geographically, Mazeppa is the westernmost site, while Xhorha is the easternmost site. The lines extending (whiskers) outside the box show the minimum (bottom) and maximum (top) values; the horizontal lines enclosing the box show minimum quartile (bottom) and maximum quartile (top), while the thick line in the middle shows the median quartile range. The points along the line and inside the box show the distribution of data. The points outside the whiskers are known as the outliers.
Diversity 17 00203 g003
Figure 4. The multidimensional scale (MDS) showing the spatial structure of the holdfast-associated macroinvertebrates across sites. The site names in the plot correspond to the centroids. The stress value of the MDS plot is 0.22.
Diversity 17 00203 g004
Table 1. The generalized linear mixed model (GLMM) showing the variation in ecological indices across the sites in macroinvertebrates within kelp holdfast. A table of the multiple comparison of means based on Tukey Contrasts is presented below, but only the significant pairs are included.
GLMM
Fixed EffectsEstimateStandard Errorz Valuep Value
Species richness
Site (Mazeppa)0.630.183.630.001
AIC: 521.8
BIC:541.7
Species abundance
Site (Dwesa)0.810.302.710.007
Site (Mazeppa)0.940.303.300.001
AIC: 765.6
BIC:785.4
Multiple Comparison of Means: Tukey Contrasts
PairsEstimateStandard Errorz Valuep ValueIndices
Mazeppa vs. Cwebe0.630.173.630.004Species
Richness
Mazeppa vs. Kob-Inn 0.810.184.470.001
Xhorha vs. Mazeppa−0.500.17−2.920.041
Mazeppa vs. Cwebe0.940.303.300.001Species Abundance
Kob-Inn vs. Dwesa−1.070.30−3.540.001
Mazeppa vs. Kob-Inn1.210.294.110.001
Nqabara vs. Mazeppa−0.930.31−3.040.029
Xhora vs. Mazeppa−0.860.29−2.930.040
Table 2. The multivariate Permutational Multivariate Analysis of Variance (PERMANOVA) of the community composition of macroinvertebrates across the sites. A permutational dispersion and pairwise test results are also included below.
PERMANOVA
PERMANOVA FactorsDfSSPseudo-Fp Value
Site567,2244.270.001
Residuals852.68
Total903.34
PERMDISP
DfSSPseudo-Fpvalue
Sites50.071.450.40
Residuals85 0.80
PERMANOVA Pairwise Test
Pairst-valuep-valueUnique Permutations
Cwebe vs. Dwesa2.160.001997
Cwebe vs. Kob-Inn2.470.001998
Cwebe vs. Mazeppa2160.001998
Cwebe vs. Nqabara2.280.001998
Cwebe vs. Xhorha2.010.001999
Dwesa vs. Kob-Inn2.590.001999
Dwesa vs. Mazeppa2.180.001999
Dwesa vs. Nqabara1.640.001997
Dwesa vs. Xhorha1.620.003997
Kob-Inn vs. Mazeppa1.490.006998
Kob-Inn vs. Nqabara2.250.001998
Kob-Inn vs. Xhorha2.520.001998
Mazeppa vs. Nqabara1.780.001997
Mazeppa vs. Xhorha2.000.001998
Nqabara vs. Xhorha1.640.002999
Table 3. A similarity percentage (SIMPER) analysis showing the cumulative contribution to the dissimilarity of the most influential (>50%) species between the easternmost and westernmost sites. Ava = Average contribution to dissimilarity of the easternmost cluster. Avb = Average contribution dissimilarity of the westernmost cluster.
SpeciesAverageStandard
Deviation
AvaAvbRatioCumulative
Contribution (%)
Zeuxoides helleri0.137890.134507.317005.536001.0252015
Amphipolis squamata0.061220.115342.127004.286000.5308021.6
Phascolosoma sp0.036760.069941.365000.393000.5256025.6
Gunnarea gaimardi0.036300.091431.651000.250000.3970029.6
Amphibalanus venustus0.034240.061271.587000.429000.5589033.3
Lepidonotus semitectus0.032070.045421.333000.071000.7061036.8
Limaria tuberculata0.031020.059492.651000.607000.5215040.2
Cirolana venusticauda0.028550.045331.381001.964000.6298043.3
Lepidonotus durbanensis0.026910.050100.143000.964000.5372046.2
Limnoria quadripunctata0.022210.064383.429000.464000.3450048.6
Arabella iricolor0.021970.033980.556000.821000.6465051.0
Disclaimer/Publisher’s Note: The statements, opinions and data contained in all publications are solely those of the individual author(s) and contributor(s) and not of MDPI and/or the editor(s). MDPI and/or the editor(s) disclaim responsibility for any injury to people or property resulting from any ideas, methods, instructions or products referred to in the content.

