Article

Comparing the Utility of Capture–Mark–Recapture, Telemetry, and Genetic Data in Assessing Population-Level Dispersal

by
Shashwat Sirsi
1,*,
Brian J. Halstead
2,
Michael L. Morrison
3,
M. Clay Green
1,
David Rodriguez
1 and
Michael R. J. Forstner
1
1
Department of Biology, Texas State University, San Marcos, TX 78666, USA
2
U.S. Geological Survey, Western Ecological Research Center, Dixon, CA 95620, USA
3
Department of Rangeland, Wildlife and Fisheries Management, Texas A&M University, College Station, TX 77840, USA
*
Author to whom correspondence should be addressed.
Diversity 2025, 17(3), 163; https://doi.org/10.3390/d17030163
Submission received: 29 October 2024 / Revised: 4 February 2025 / Accepted: 18 February 2025 / Published: 26 February 2025

Abstract

:
Gaps in dispersal data limit habitat protection efforts. We sought to characterize such gaps and compare the utility of dispersal data from demographic and genetic methods in making habitat protection decisions. Here, we used a search string to retrieve dispersal studies for amphibians, reptiles, birds, and mammals. We included studies based on a set of selection criteria. We used this sample of selected studies to assess for persistence of taxonomic and geographic biases. We extracted non-effective (i.e., demographic) and effective (i.e., genetic) dispersal rates. We weighted these dispersal rates by associated sample size and standard deviation to indicate the ability to capture population-level dispersal. We then tested for variation in weighted dispersal by study type using Bayesian mixed-effects models. Amphibians were the most under-represented taxonomic group in our sample. Dispersal studies were mostly retrieved from developed nations indicating the distribution of dispersal research reflected GDP rather than the number of threatened species. The magnitude of dispersal from genetic methods exceeded demographic methods in all vertebrate groups considered in our study. Further, genetic studies consistently sampled a larger number of individuals. Thus, genetic methods may be better suited to characterize population-level dispersal. However, demographic and genetic approaches enable examination of the dispersal process at varying spatial and temporal scales and a combination of these approaches can be used to address persistent gaps in dispersal and enable land-management decisions.

1. Introduction

Overwhelming evidence points to the role of human actions in driving biodiversity decline, necessitating transformative change [1]. Parties to the Convention on Biological Diversity (CBD) met in 2022 to determine the post-2020 global biodiversity framework. This was an effort to implement broad-based actions for the transformation of society’s relationship with biodiversity [2]. Among the overarching goals of this global plan was to enhance ecosystem integrity and support healthy and resilient populations of all species, concomitantly resulting in reduced extinction rates [3]. Enhancements in the coverage and connectivity of Protected Areas (PAs) serve as a primary approach to this goal [3,4].
Connectivity of the network of terrestrial PAs across the globe has been assessed based on the number of PAs and their spatial arrangement [4], A range of dispersal distances derived from the home range size of multiple species was used to account for the movement abilities of terrestrial vertebrates in such assessments of connectivity [5]. The levels of connectivity were dependent on the spatial arrangement of PAs, with connectivity increasing as the size and number of PAs increased. An increase in dispersal distance resulted in an increase in connectivity when the size and number of PAs was increased [4,5]. Thus, given that dispersal can vary across animals, we expect connectivity will vary differently by species as the size and number of PAs varies. Intended increases in the coverage and connectivity of PA networks to maximize species persistence may therefore require information on dispersal that is specific to each species or groups of species [6].
We refer to dispersal herein as animal movement. Dispersal is called “effective” when such movement results in the transmission of genes, while “non-effective” dispersal refers to the movement of an animal regardless of whether it reproduces and transmits its genes [7]. Dispersal is a crucial life-history trait that strongly influences the health, survival, and reproductive success of an individual as well as the spatial dynamics of populations [7]. Knowledge on dispersal is thus critical to understanding habitat requirements for a species and therein enabling management decisions to protect such habitats for biodiversity conservation [8,9]. Dispersal is assessed using either demographic or genetic approaches [7,10]. Among demographic methods, photo-identification, capture–mark–recapture or capture–mark–resight (CMR), and telemetry are commonly used to study animal movements [11,12]. These incorporate varied analytical approaches but essentially require marking or tagging animals and recording their movements over time. Genetic methods quantify dispersal by studying the movement of genes among populations [7]. Indirect genetic approaches typically assess genotype frequencies to assess effective dispersal via population genetic models, while direct genetic methods assess non-effective dispersal by typically attempting to assign individuals to at least one of their parents or to their population of origin [13,14].
Thus, non-effective dispersal can be estimated using both demographic and genetic methods but there are differences in the dispersal knowledge that each offer [7,15]. For instance, demographic approaches allow hypotheses tests of environmental and individual factors on each step of the dispersal process (i.e., emigration, transience, and immigration) while also elucidating social and behavioral factors related to such movements [7,15]. However, demographic methods such as CMR tend to have constraints on the spatial extent that is studied, leading to an underestimation of dispersal distance [7,10,16]. CMR studies can also be limited in their ability to mark individuals of a small body size [7,17]. Similarly, limited battery capacities on animal-borne devices result in study periods that are short relative to the lifespan of the study species, which reduces the chances of detecting occasional long-distance dispersal events—particularly in long-lived animals [7,18]. This is exemplified in a recent study [19] that revealed a mismatch between gene flow and migratory movements detected via telemetry data. Finally, telemetry data may not capture population-level dispersal patterns, since the relatively high cost of telemetry devices allows for a relatively small number of animals (usually <30) to be surveyed [7,20].
Genetic methods to quantify dispersal have received increased attention [8,13]. This can be attributed to decreased sequencing costs coupled with newer analytical approaches, which enable a range of methods to genotype or sequence a large number of individuals and permit inferences on demographic history and dispersal [7,21]. Genetic methods such as assignment or parentage analysis can detect non-effective dispersal with less extensive fieldwork relative to traditional CMR approaches [22]. Genetic approaches can use direct and indirect (e.g., hair, feces) samples for taxa (e.g., small-bodied species) that may be ill-suited for CMR and telemetry methods [7,21,23]. However, genetic methods can be limited in discerning the role of environmental, physiological, and social cues in influencing dispersal [15]. Additionally, indirect genetic methods make assumptions about population structure that are rarely met and may represent historic rather than contemporary dispersal patterns [8]. Furthermore, direct genetic methods decrease in accuracy as the genetic variation among sampled populations decreases and may require sampling of a large proportion of each population [7,8].
While dispersal can be assessed using either demographic or genetic approaches, gaps in dispersal knowledge continue to persist across taxa and geographic regions [8]. We expect that this lack in dispersal information is concordant with gaps identified via recent surveys of the biodiversity research literature [24]. For instance, taxonomic and geographic biases have been identified in biodiversity research, wherein studies are more frequently carried out on mammal and bird species in developed countries with larger economies [24]. Moreover, demographic and genetic methods have inherent differences in estimating dispersal that translate to differences in the spatial and temporal scales at which such dispersal is inferred [15,25]. These differences in dispersal estimates that are inherent to each methodological approach can have different implications towards making decisions on habitat protection. We first seek to characterize potential gaps in knowledge for taxonomic groups and regions relative to the number of threatened species [26] within said taxonomic groups for such regions. Second, we seek to demonstrate differences in the magnitude, variability, and sample size from which dispersal information is inferred by demographic and genetic approaches. We expect dispersal estimates with a small standard deviation and large sample size are likely to represent population-scale dispersal patterns, potentially proving informative to broad-scale land-management decisions.
Here, we have surveyed the published literature for dispersal studies of amphibians, reptiles, birds, and mammals. We sought to help identify taxonomic groups and geographic regions that are data depauperate and in need of targeted dispersal research. Additionally, we synthesized dispersal estimates from these studies and compared dispersal distances among demographic and genetic methods while accounting for sample size and the variability associated with each dispersal estimate. We hypothesized that genetic methods would yield larger dispersal estimates, with smaller standard deviations relative to demographic methods.

2. Materials and Methods

2.1. Literature Search

We used the ISI Web of Science and Scopus databases as principal search systems [27] to retrieve peer-reviewed articles published over the last century, from 1900 to July 2020. We used a search string (Table S1) to obtain 7376 unique peer-reviewed articles.

2.2. Eligibility Criteria

We assessed eligibility of articles for inclusion in our study per the following criteria: (1) The study used CMR or telemetry or genetic methods on native populations of amphibians or reptiles or birds or mammals; we did not include non-native species since dispersal in such taxa may be brought about by human-mediated introductions in novel areas. (2) CMR and telemetry studies were selected if they reported movement distance (i.e., maximum range or total distance moved). (3) The tagging duration was provided (i.e., duration between first and last capture or relocation). (4) The study was conducted over more than 24 h. (5) Genetic studies were selected if they included Isolation By Distance (IBD) tests or provided estimates of pairwise genetic distance between populations (i.e., FST, RST, ΦST, θST, and Nei’s genetic distance); (6) The study provided the geographic distance between sampling localities or a map of the sampling locations. (7) The study showed a positive relationship between the genetic and geographic distance of populations. The lead author screened articles in two stages. We first used the title and abstract to broadly assess the relevance of studies to our objective of synthesizing dispersal estimates. We identified 920 studies that seemed potentially relevant via the first stage of screening. We then read the full text of these articles to discern their eligibility. From these 920 articles, we identified 574 studies with suitable metadata. We provide a flow diagram representing the process and outcome of publication search and selection in Figure S1.

2.3. Data Extraction

We classified each study as a capture–mark–recapture or capture–mark–resight (CMR) or telemetry or genetic study. For each study, we included data on the country in which the study took place. Additionally, we assigned each species to its taxonomic order and family. We compiled data on the maximum linear movement and associated tagging duration and sample size for demographic methods. We included estimates of total movement when the maximum linear movement was not available. We assembled pairwise genetic and geographic distances from genetic studies along with associated sample sizes. We obtained more than one set of metadata from some demographic studies that included among-group comparisons (e.g., among-sex, -site, or -season comparisons). Similarly, we obtained more than one set of metadata from some genetic studies that used more than one molecular marker or included among-group comparisons.

2.4. Statistical Analysis

Statistical analyses were conducted using R v4.0.4 [28] and IBD 1.52 for Windows [29,30]. We tested for variation in the number of studies obtained by taxonomic group using generalized linear models in R [28]. We specified a univariate model and a Poisson response distribution. We created maps in ArcGis Pro 2.2.1 to represent the geographic distribution of dispersal studies relative to the distribution of the IUCN red-listed species [26] within each taxonomic group.
We observed variation in the duration over which CMR and telemetry studies reported dispersal estimates. We normalized dispersal distances to dispersal rates (i.e., km/day) for each study by dividing the direct dispersal distance (in km) by the duration (in days) over which said dispersal was observed. For demographic studies, we calculated dispersal rates as the maximum linear displacement or total displacement divided by the associated duration over which individuals were followed. We calculated mean and standard deviation of these dispersal rates for each group of individuals included in each study.
We standardized the values of genetic distance among studies as FST/(1 − FST) among studies for FST and analogous measures (i.e., RST, ΦST, and θST). However, we did not recalculate Nei’s genetic distance. We regressed the standardized pairwise genetic distance against the geographic distance and log-transformed geographic distance in linear (e.g., freshwater catchments) and two-dimensional habitats, respectively. In a linear habitat, the slope of the regression is m = 1 4 D σ 2 ; and in a two-dimensional habitat, the slope is m = 1 4 D π σ 2 . Essentially, 4 D σ 2 and 4 D π σ 2 represent the “neighborhood” size, where D represents the density of reproducing individuals and σ represents the mean parent–offspring dispersal distance [31].
We estimated parent–offspring dispersal as σ = 1 4 D m in a linear habitat for amphibians and freshwater mammals and reptiles. Amphibians tend to congregate in breeding assemblages, often at specific ponds, which enables sampling in genetic studies [32] and our application of one-dimensional IBD models is meant to reflect this tendency to sample freshwater catchments. Similarly, we estimated parent–offspring dispersal as σ = 1 4 D π m in a two-dimensional habitat for all birds, mammals, and reptiles in terrestrial and marine environments.
To this end, we recalculated regression slopes (i.e., m) wherever possible, using Reduced Major Axis (RMA) regression in IBD 1.52 for Windows [29,30]. Since we estimated some spatial distances from published maps or geographic coordinates, RMA regression was appropriate as our independent variable was measured with error [33]. We retained studies with positive values of m, irrespective of their statistical significance. We required the density of reproducing individuals, D, to estimate parent–offspring dispersal (i.e., σ ) . However, we also required estimates of D that were independent of m, so we uniformly sampled values of effective density (i.e., D) from a pre-defined range. The upper limit of this range was equal to the census density estimate for each species [34]. We compiled census density estimates from literature searches and species-level databases [35,36] and used the mean from multiple estimates, wherever available, to approximate range-wide census density. We set the lower limit of our sampling range for effective density (D) at 1 individual per sq. km when census densities were 1 individual per sq. km, otherwise we used a lower limit that was one order of magnitude smaller than the census density estimate (e.g., a lower limit of 0.01 individual per sq. km when census density was 0.1 individual per sq. km).
We sought to test the effect of the number of uniformly drawn values of effective density (D) on the variance of the effective dispersal estimates ( σ ). To this end, we uniformly sampled 10, 100, 1000, and 10,000 values of D from a pre-defined range and calculated the standard deviation of effective dispersal ( σ ) associated with each sample size for effective density (D). We could not discern an increase in the standard deviation of indirect dispersal with a decreasing sample size of D (Figures S2–S6); therefore, we retained a sample size of 10,000 to estimate effective dispersal. We consider effective dispersal is estimated at the minimum, over the span of one generation, since such dispersal refers to the movement and transmission of genes. This time span for indirect dispersal from genetic studies is different from direct dispersal in demographic studies, wherein the latter is estimated over a duration that may include the emigration, transience, and settlement of an animal. We sought to use indirect dispersal estimates for comparison in our study by calculating indirect/effective dispersal rates (in km/day) for a species as the effective dispersal estimate divided by the number of days required for the species to achieve maturity.
Additionally, for each direct and indirect dispersal estimate, we sought to incorporate the associated variance as well as the number of individuals from which the estimate was derived. We sought to penalize dispersal rates with a relatively small sample size and a relatively large variance, as these were unlikely to represent population-level dispersal patterns. To this end, we weighted dispersal rates by the ratio of sample size and standard deviation associated with each estimate of dispersal rate.
We used the brms package in R to implement Bayesian mixed-effects models and analyze the variation in the weighted dispersal rates from each study [37]. For each taxonomic order, we fit models assuming a gamma response distribution since distributions of weighted dispersal rates had heavier tails or a higher probability of extreme values. We included random effects for species and study identity to account for the non-independence of repeated measures for the same species and study. We did not explicitly examine between-study variations in design and sample size but attempted to account for this heterogeneity in the random-effects structure of our model. We also included random effects for taxonomic family to account for the non-independence of measures due to phylogenetic relatedness [38]. We fit univariate models using a means parameterization, i.e., we excluded the intercept, to test for the effect of study type on weighted dispersal rates. Removing the intercept allowed us to compare 95% credible intervals (CIs) for each level relative to zero rather than the reference level, which was of less interest.
We used default uninformative (i.e., flat) priors for fixed factors and half Student-t priors with three degrees of freedom and a scale parameter of 2.5 for the standard deviation of each random factor. Scale parameters were dependent on the standard deviation of the response after applying log link functions in our models. Similarly, we used a default gamma prior with shape and scale parameters of 0.01 for the shape parameter of our response distribution [37]. We did not test additional predictors, such as transmitter type and marker type, either due to unbalanced or small sample sizes for such predictors. For each model, we ran four chains of 10,000 iterations each with a burn-in of 1000 iterations for a total of 36,000 iterations. We assessed convergence by examining trace plots and when the Gelman–Rubin statistic~1 [39]. We conducted post-hoc comparisons of beta coefficients for each study type (i.e., population-level effects) using hypothesis tests. These provided evidence ratios, i.e., the ratio of the posterior probability of a  >  b and the posterior probability of a < b, wherein values greater than 1 would indicate that the evidence in favor of a > b is larger than the evidence in favor of a < b [37].

3. Results

3.1. Taxonomic Coverage of Dispersal Research

Amphibian studies (n = 51) numbered less than half, relative to the number of reptile studies (n = 113; β = 0.80, SE = 0.17, Z = 4.72, p < 0.001), and about one-fourth relative to the number of bird (n = 206; β = 1.40, SE = 0.16, Z = 8.93, p < 0.001) and mammal studies (n = 204; β = 1.39, SE = 0.16, Z = 8.86, p < 0.001). Similarly, we retrieved nearly twice as many studies of birds ( β = −0.60, SE = 0.12, Z = −5.13, p < 0.001) and mammals ( β = −0.59, SE = 0.12, Z = −5.04, p < 0.001) relative to reptiles. The numbers of bird and mammal studies were similar ( β = −0.01, SE = 0.01, Z = −0.10, p > 0.999).

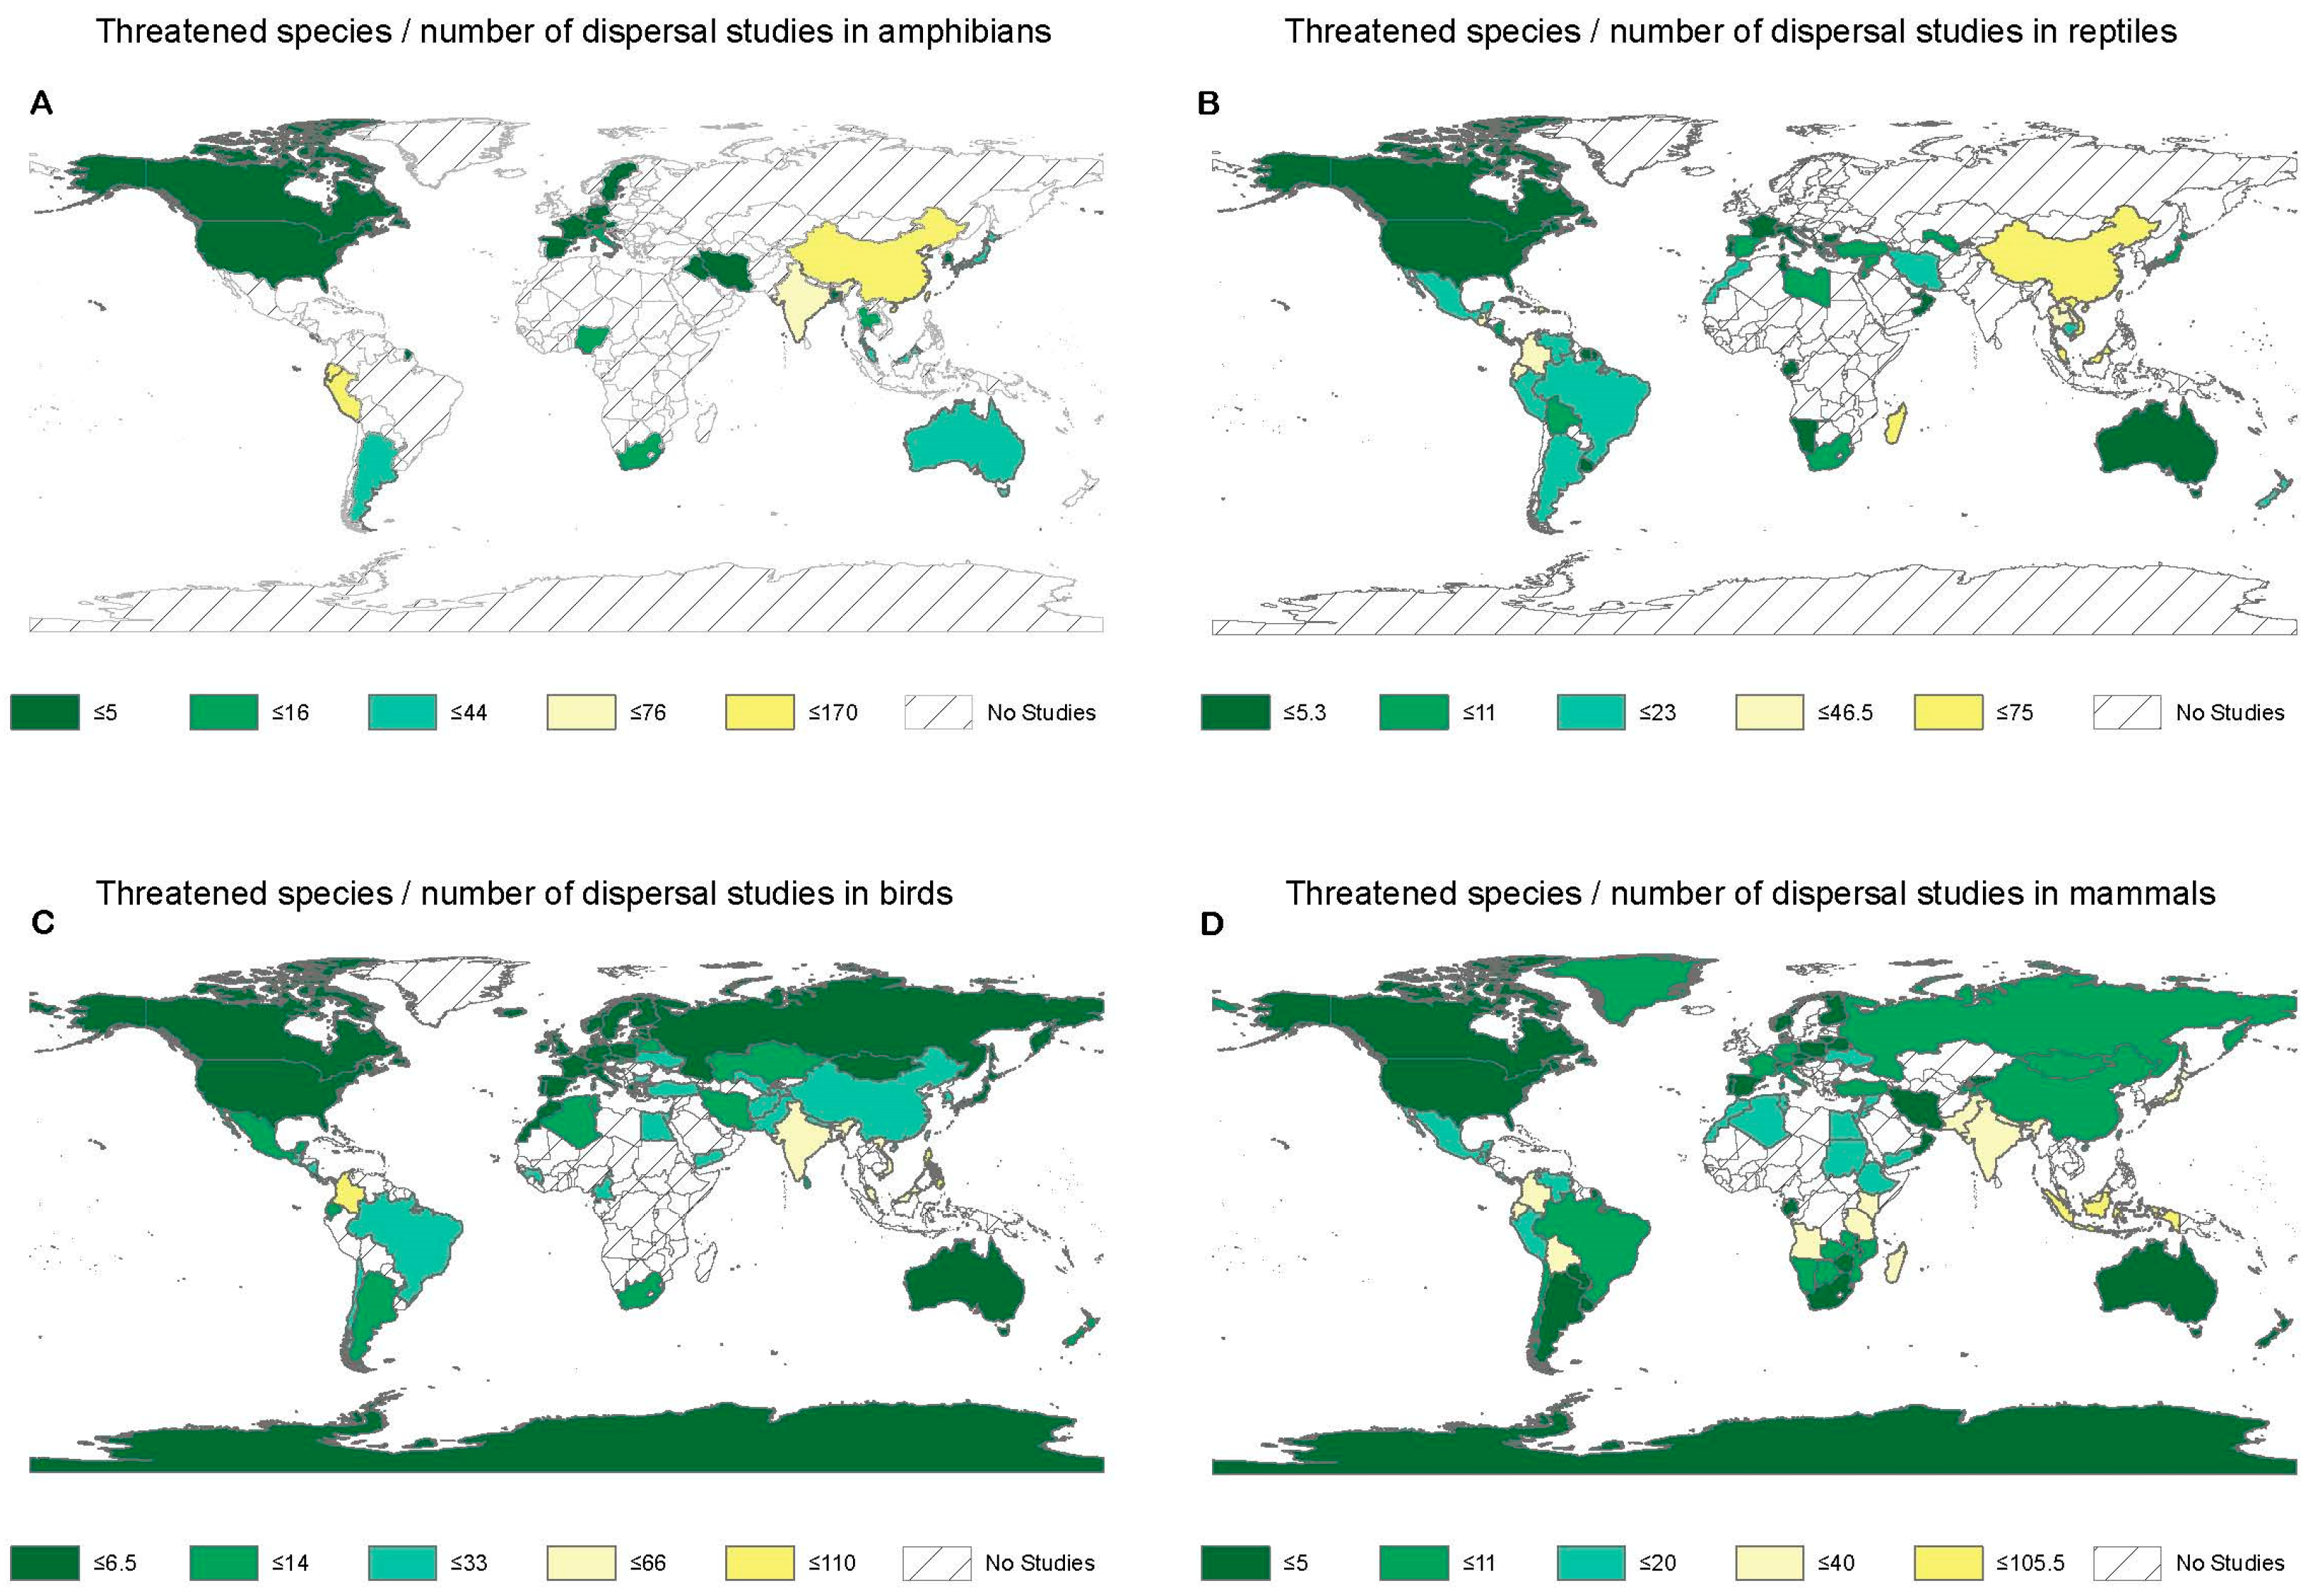
3.2. Geographic Coverage of Dispersal Research in Amphibians

Geographic coverage of dispersal research was poorest in amphibians. We observed greater dispersal research efforts relative to the number of threatened species in the United States, Canada, Spain, France, Germany, Sweden, Iraq, and Iran. The number of threatened species divided by the number of dispersal studies in these countries was 5. Ecuador, Peru, India, and China showed relatively low dispersal research efforts relative to the number of threatened species, where the ratio of the number of threatened species and number of dispersal studies ranged between 45 and 170. We did not retrieve any studies in our sample for this taxonomic group over large parts of Central America, South America, Africa, and Asia (Figure 1A).

3.3. Geographic Coverage of Dispersal Research in Reptiles

Dispersal research for reptiles had a wider geographic spread relative to amphibians. However, we did not retrieve any studies in our sample from large parts of Africa and Asia (Figure 1B). We observed greater dispersal research efforts relative to the number of threatened reptiles in the United States, Canada, Guyana, Suriname, Uruguay, Portugal, France, Italy, Croatia, Serbia, Greece, Tunisia, Gabon, Namibia, Oman, and Australia. The number of threatened species divided by the number of dispersal studies in these countries was 5. We observed a higher number of threatened reptile species relative to dispersal research effort in Guatemala, Cuba, Puerto Rico, Ecuador, Colombia, Madagascar, China, Thailand, Malaysia, and Vietnam, where the ratio of the number of threatened species and the number of dispersal studies ranged between 24 and 75 (Figure 1B).

3.4. Geographic Coverage of Dispersal Research in Birds

Our sample for this taxonomic group did not include any dispersal studies over large parts of Africa. The dispersal research effort was greater for bird species in the United States, Canada, Portugal, Spain, France, Iceland, the United Kingdom, Germany, Austria, Czechia, Poland, Norway, Sweden, Finland, Greece, Latvia, Estonia, Russia, Australia, and Antarctica. The ratio of the number of threatened species and the number of dispersal studies was 7. Colombia, India, Vietnam, Malaysia, and the Philippines had a higher number of threatened bird species relative to dispersal research efforts. The ratio of the number of threatened species and the number of dispersal studies ranged between 34 and 110 for these regions (Figure 1C).

3.5. Geographic Coverage of Dispersal Research in Mammals

Mammals had the widest geographic spread among all taxonomic groups in our study. However, our sample of mammal dispersal studies did not include studies from several African countries. We observed greater dispersal research efforts relative to the number of threatened mammals in the United States, Canada, Argentina, Uruguay, Paraguay, Portugal, Spain, Norway, Finland, Switzerland, Poland, Czechia, Austria, Slovakia, Lithuania, Belarus, Gabon, South Africa, Zimbabwe, Iran, Oman, Kyrgyzstan, Australia, and Antarctica. The number of threatened species divided by the number of dispersal studies in these countries was 5. We observed a higher number of threatened mammal species relative to the number of dispersal studies in Colombia, Ecuador, Bolivia, Angola, Tanzania, Kenya, Madagascar, India, Pakistan, Nepal, Bhutan, Malaysia, Indonesia, and Japan. The ratio of the number of threatened species and number of dispersal studies ranged between 21 and 106 for these countries (Figure 1D).

3.6. Weighted Dispersal by Study Type

We extracted 1065 dispersal estimates which spanned 2, 3, 19, and 17 taxonomic orders in amphibians, reptiles, birds, and mammals, respectively (Figure S7). However, we observed a comparable number of direct and indirect dispersal estimates in nine taxonomic orders and present the results for these representative orders: Anura and Urodela (Class Amphibia), Squamata and Testudines (Class Reptilia), Charadriiformes and Passeriformes (Class Aves), and Carnivora, Primates, and Chiroptera (Class Mammalia). These account for a total of 597 dispersal estimates from 297 studies for 37 amphibian, 57 reptile, 117 bird, and 74 mammal taxa.

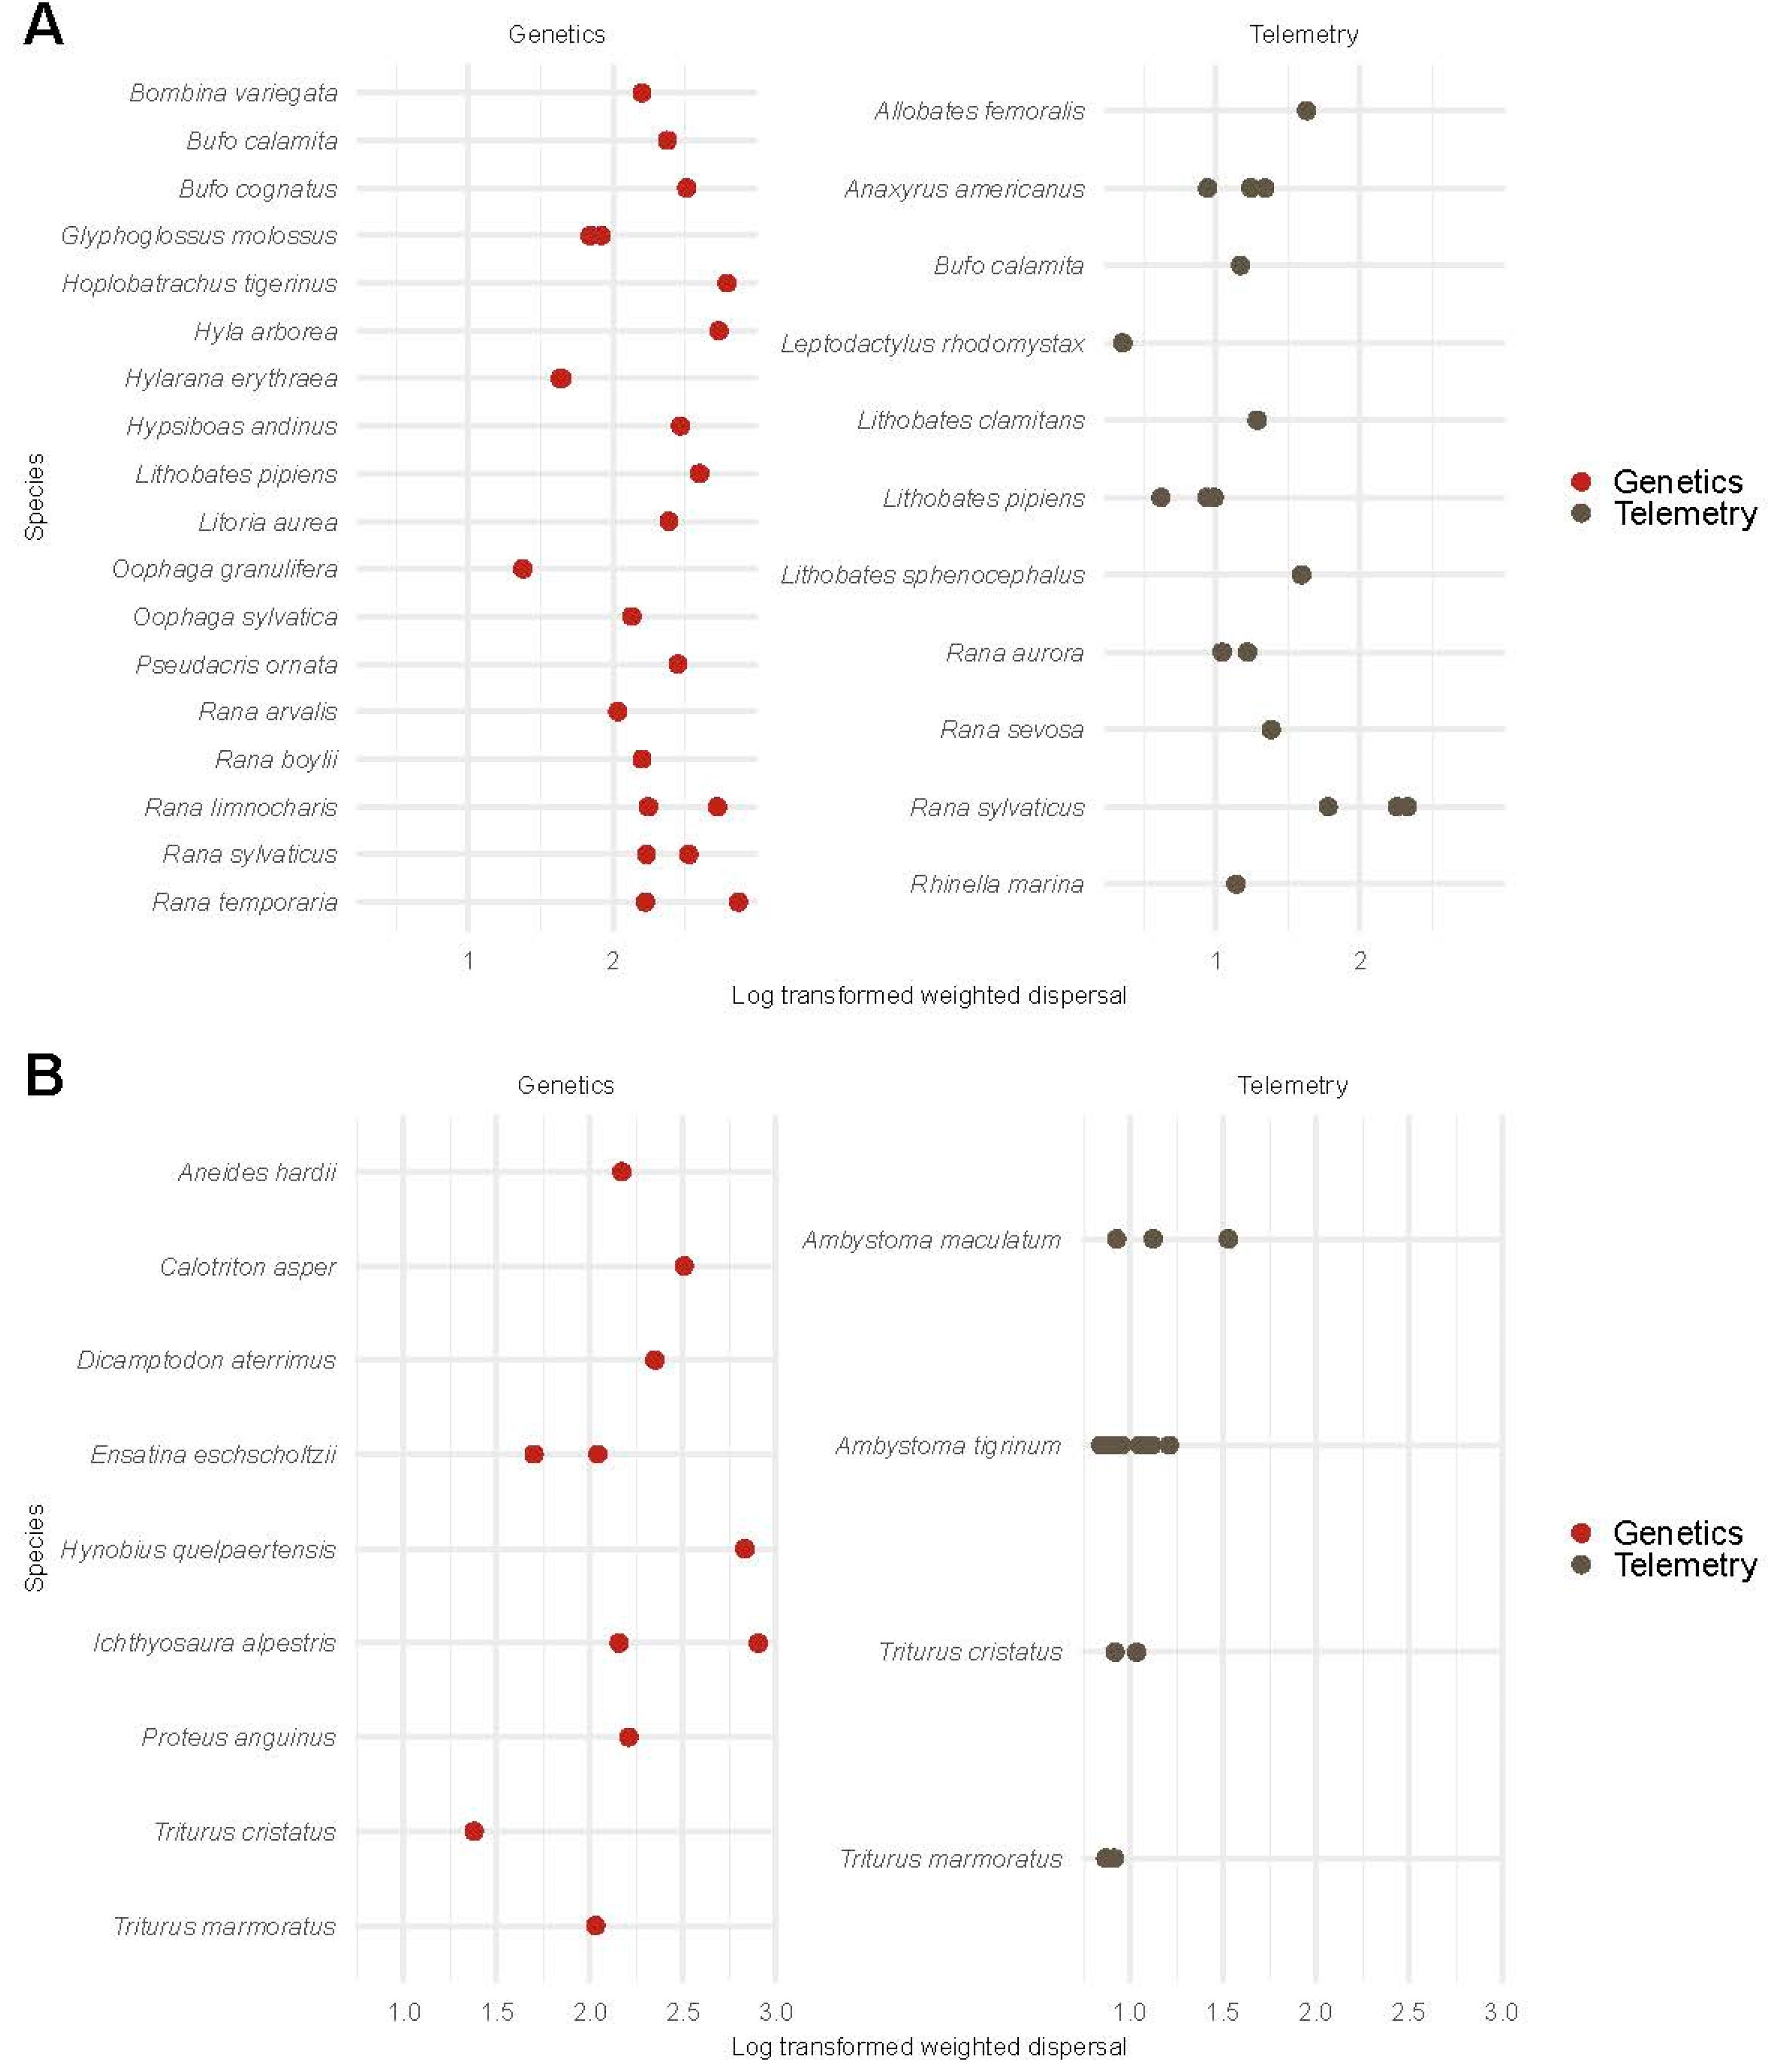
3.6.1. Weighted Dispersal in Amphibians

For anurans (i.e., frogs and toads), we compared estimates of weighted dispersal between telemetry and genetic methods. The log-scale weighted dispersal inferred via genetic methods ( β = 5.21, 95% CI [4.44, 5.90]) exceeded that observed in telemetry studies ( β = 3.04, 95% CI [2.11, 3.93]; Figure 2A; Figure S8). Hypothesis tests indicated a posterior probability > 95% in favor of weighted dispersal from genetic studies exceeding weighted dispersal from telemetry studies in anurans.
For urodeles (i.e., newts and salamanders), we compared estimates of weighted dispersal between telemetry and genetic studies. The log-scale weighted dispersal from genetic methods ( β = 5.33, 95% CI [4.31, 6.38]) exceeded the log-scale weighted dispersal from telemetry studies ( β = 2.61, 95% CI [1.17, 4.07]; Figure 2B; Figure S8). Hypothesis tests indicated a posterior probability > 95% in favor of the weighted dispersal from genetic studies exceeding the weighted dispersal from telemetry studies in urodeles.

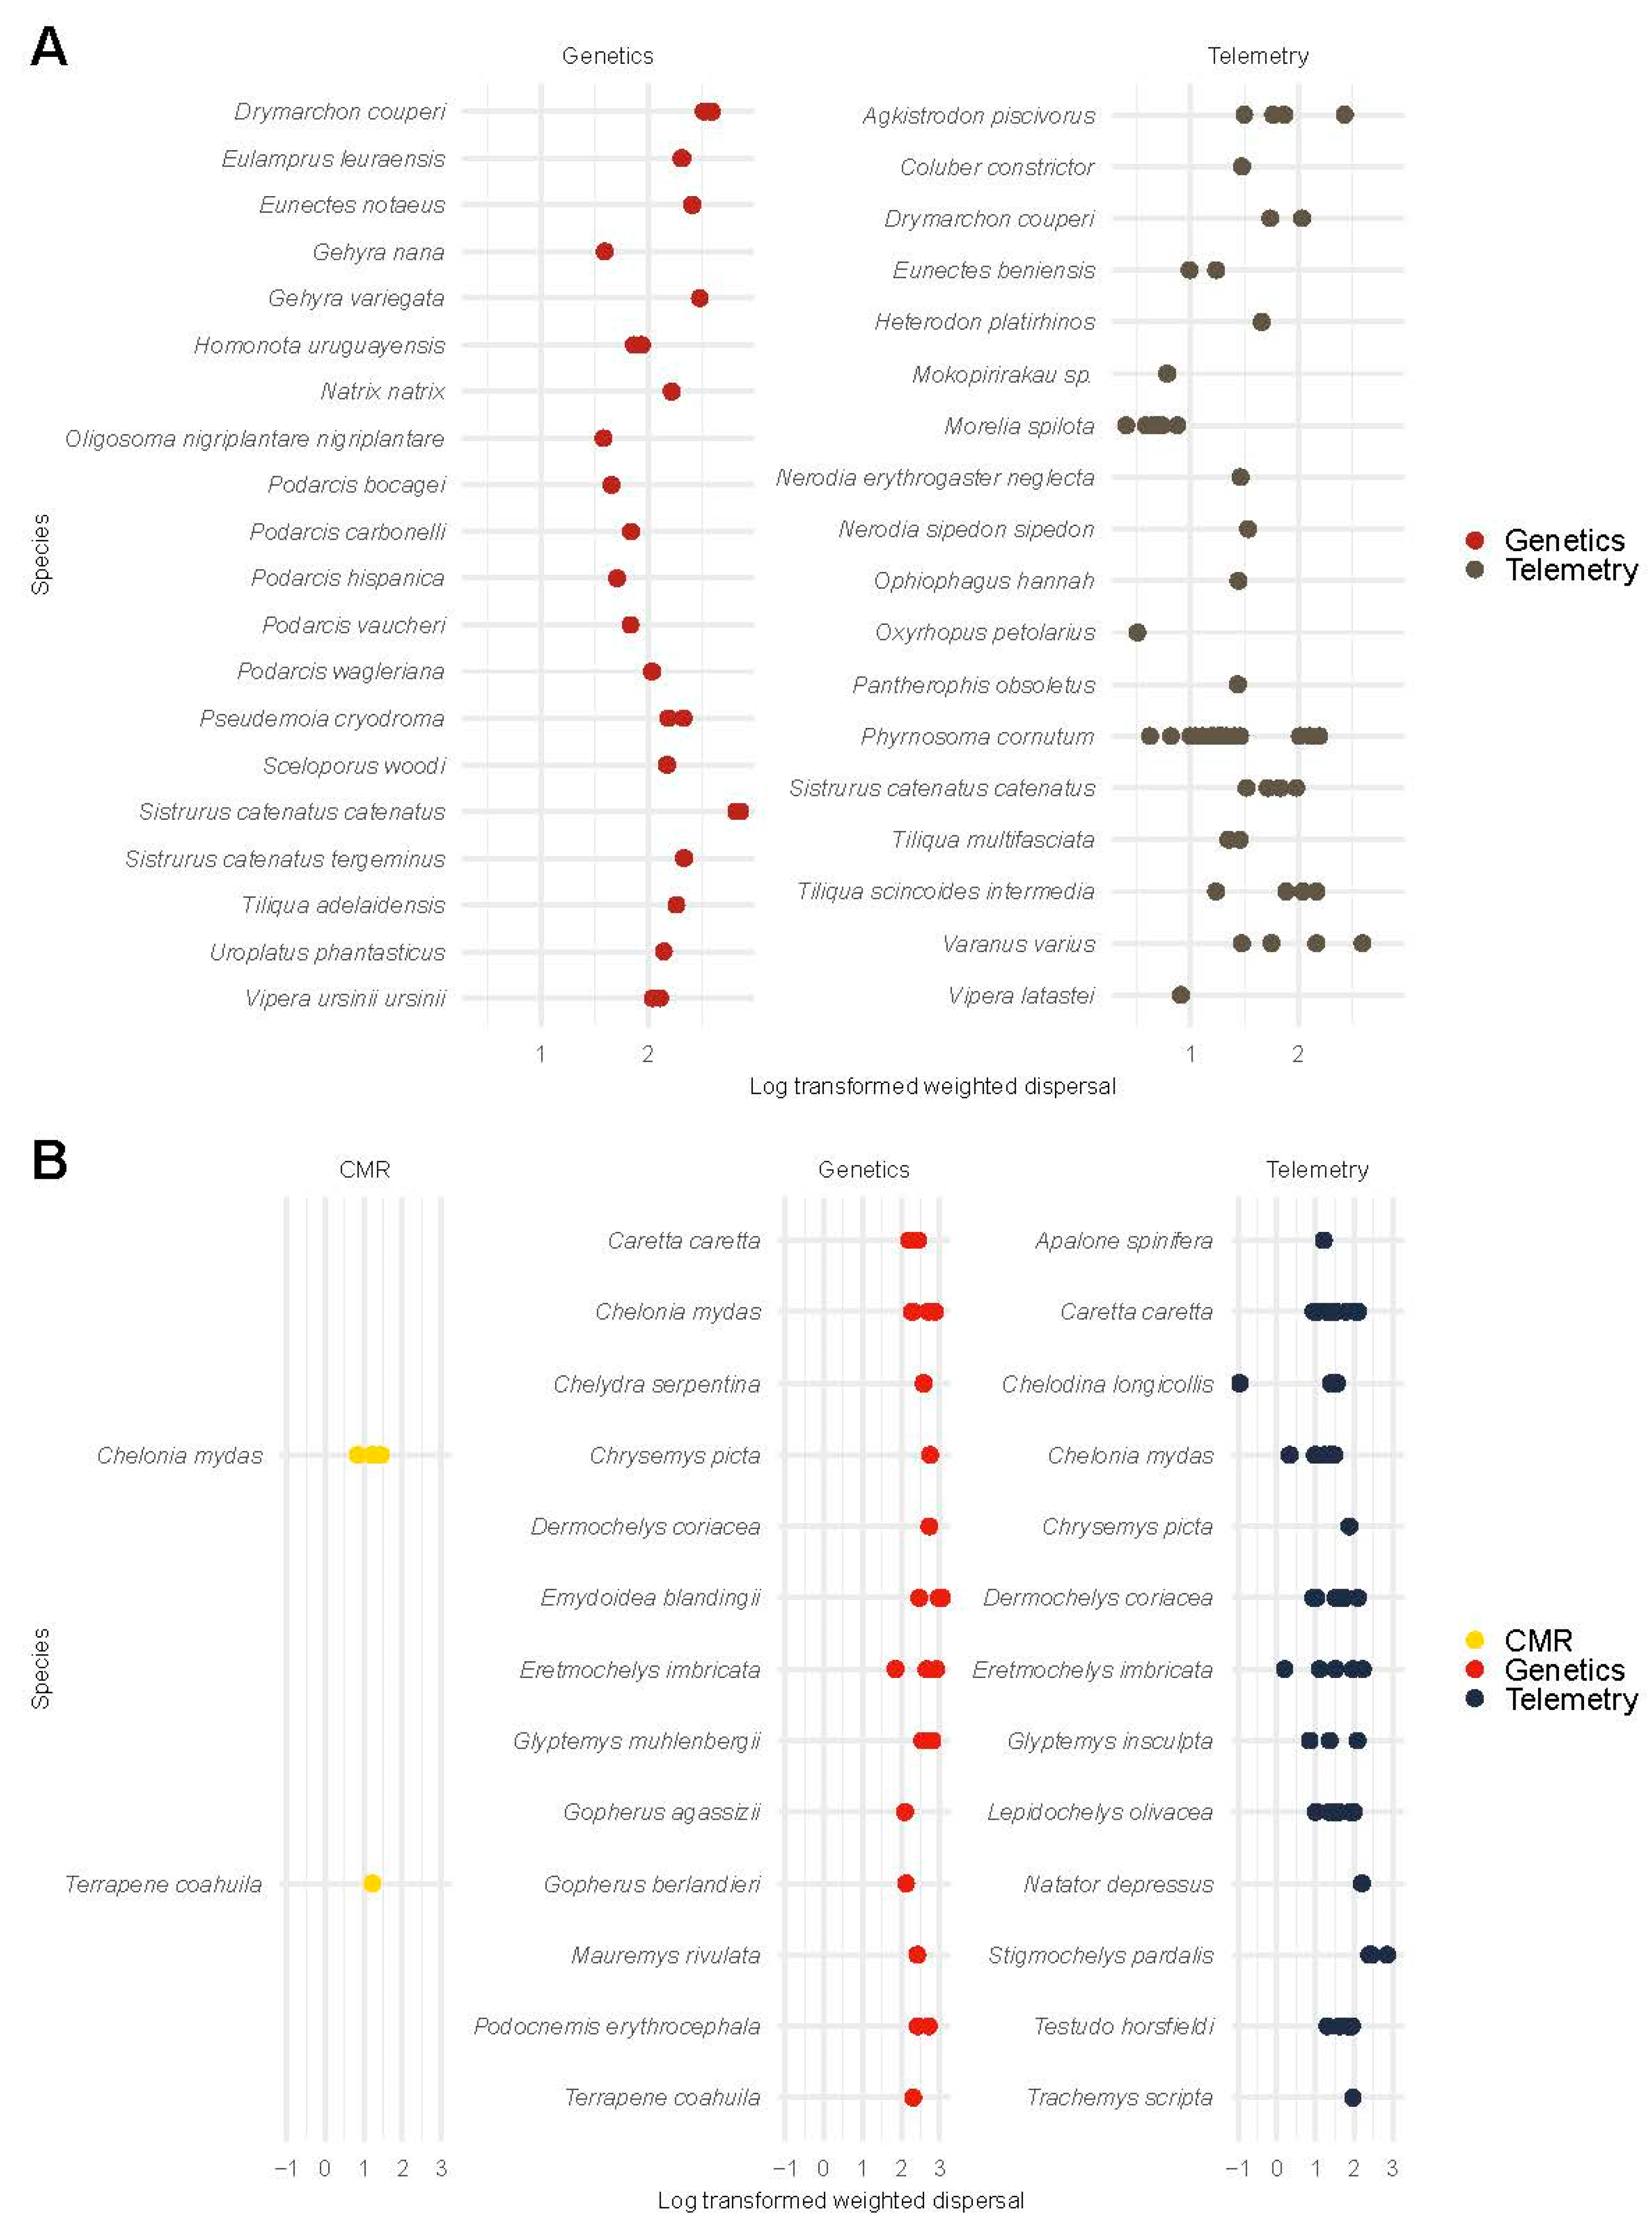
3.6.2. Weighted Dispersal in Reptiles

For squamates (i.e., snakes and lizards), we compared the log-transformed weighted dispersal between telemetry and genetic studies. The log-scale weighted dispersal from genetic methods ( β = 5.09, 95% CI [4.48, 5.71]) exceeded that from telemetry methods ( β = 3.40, 95% CI [2.76, 3.99]; Figure 3A; Figure S9). Hypothesis tests indicated a posterior probability > 95% in favor of the weighted dispersal from genetic studies exceeding the weighted dispersal from telemetry studies in squamates.
For testudines (i.e., turtles and tortoises), we compared weighted dispersal between CMR, telemetry, and genetic studies. The log-scale weighted dispersal from genetic methods ( β = 5.98, 95% CI [5.29, 6.61]) exceeded that from telemetry methods ( β = 3.66, 95% CI [3.03, 4.25]). Hypothesis tests indicated a posterior probability > 95% in favor of the weighted dispersal from genetic studies exceeding the weighted dispersal from telemetry studies in testudines. Similarly, the log-scale weighted dispersal from genetic methods exceeding that from CMR studies ( β = 3.25, 95% CI [2.05, 4.50]), with hypothesis tests indicating a posterior probability > 95% in favor of the weighted dispersal from genetic studies exceeding the weighted dispersal from CMR studies. We observed a posterior probability of 76% in favor of the weighted dispersal from telemetry studies exceeding the weighted dispersal from CMR studies (Figure 3B; Figure S9).

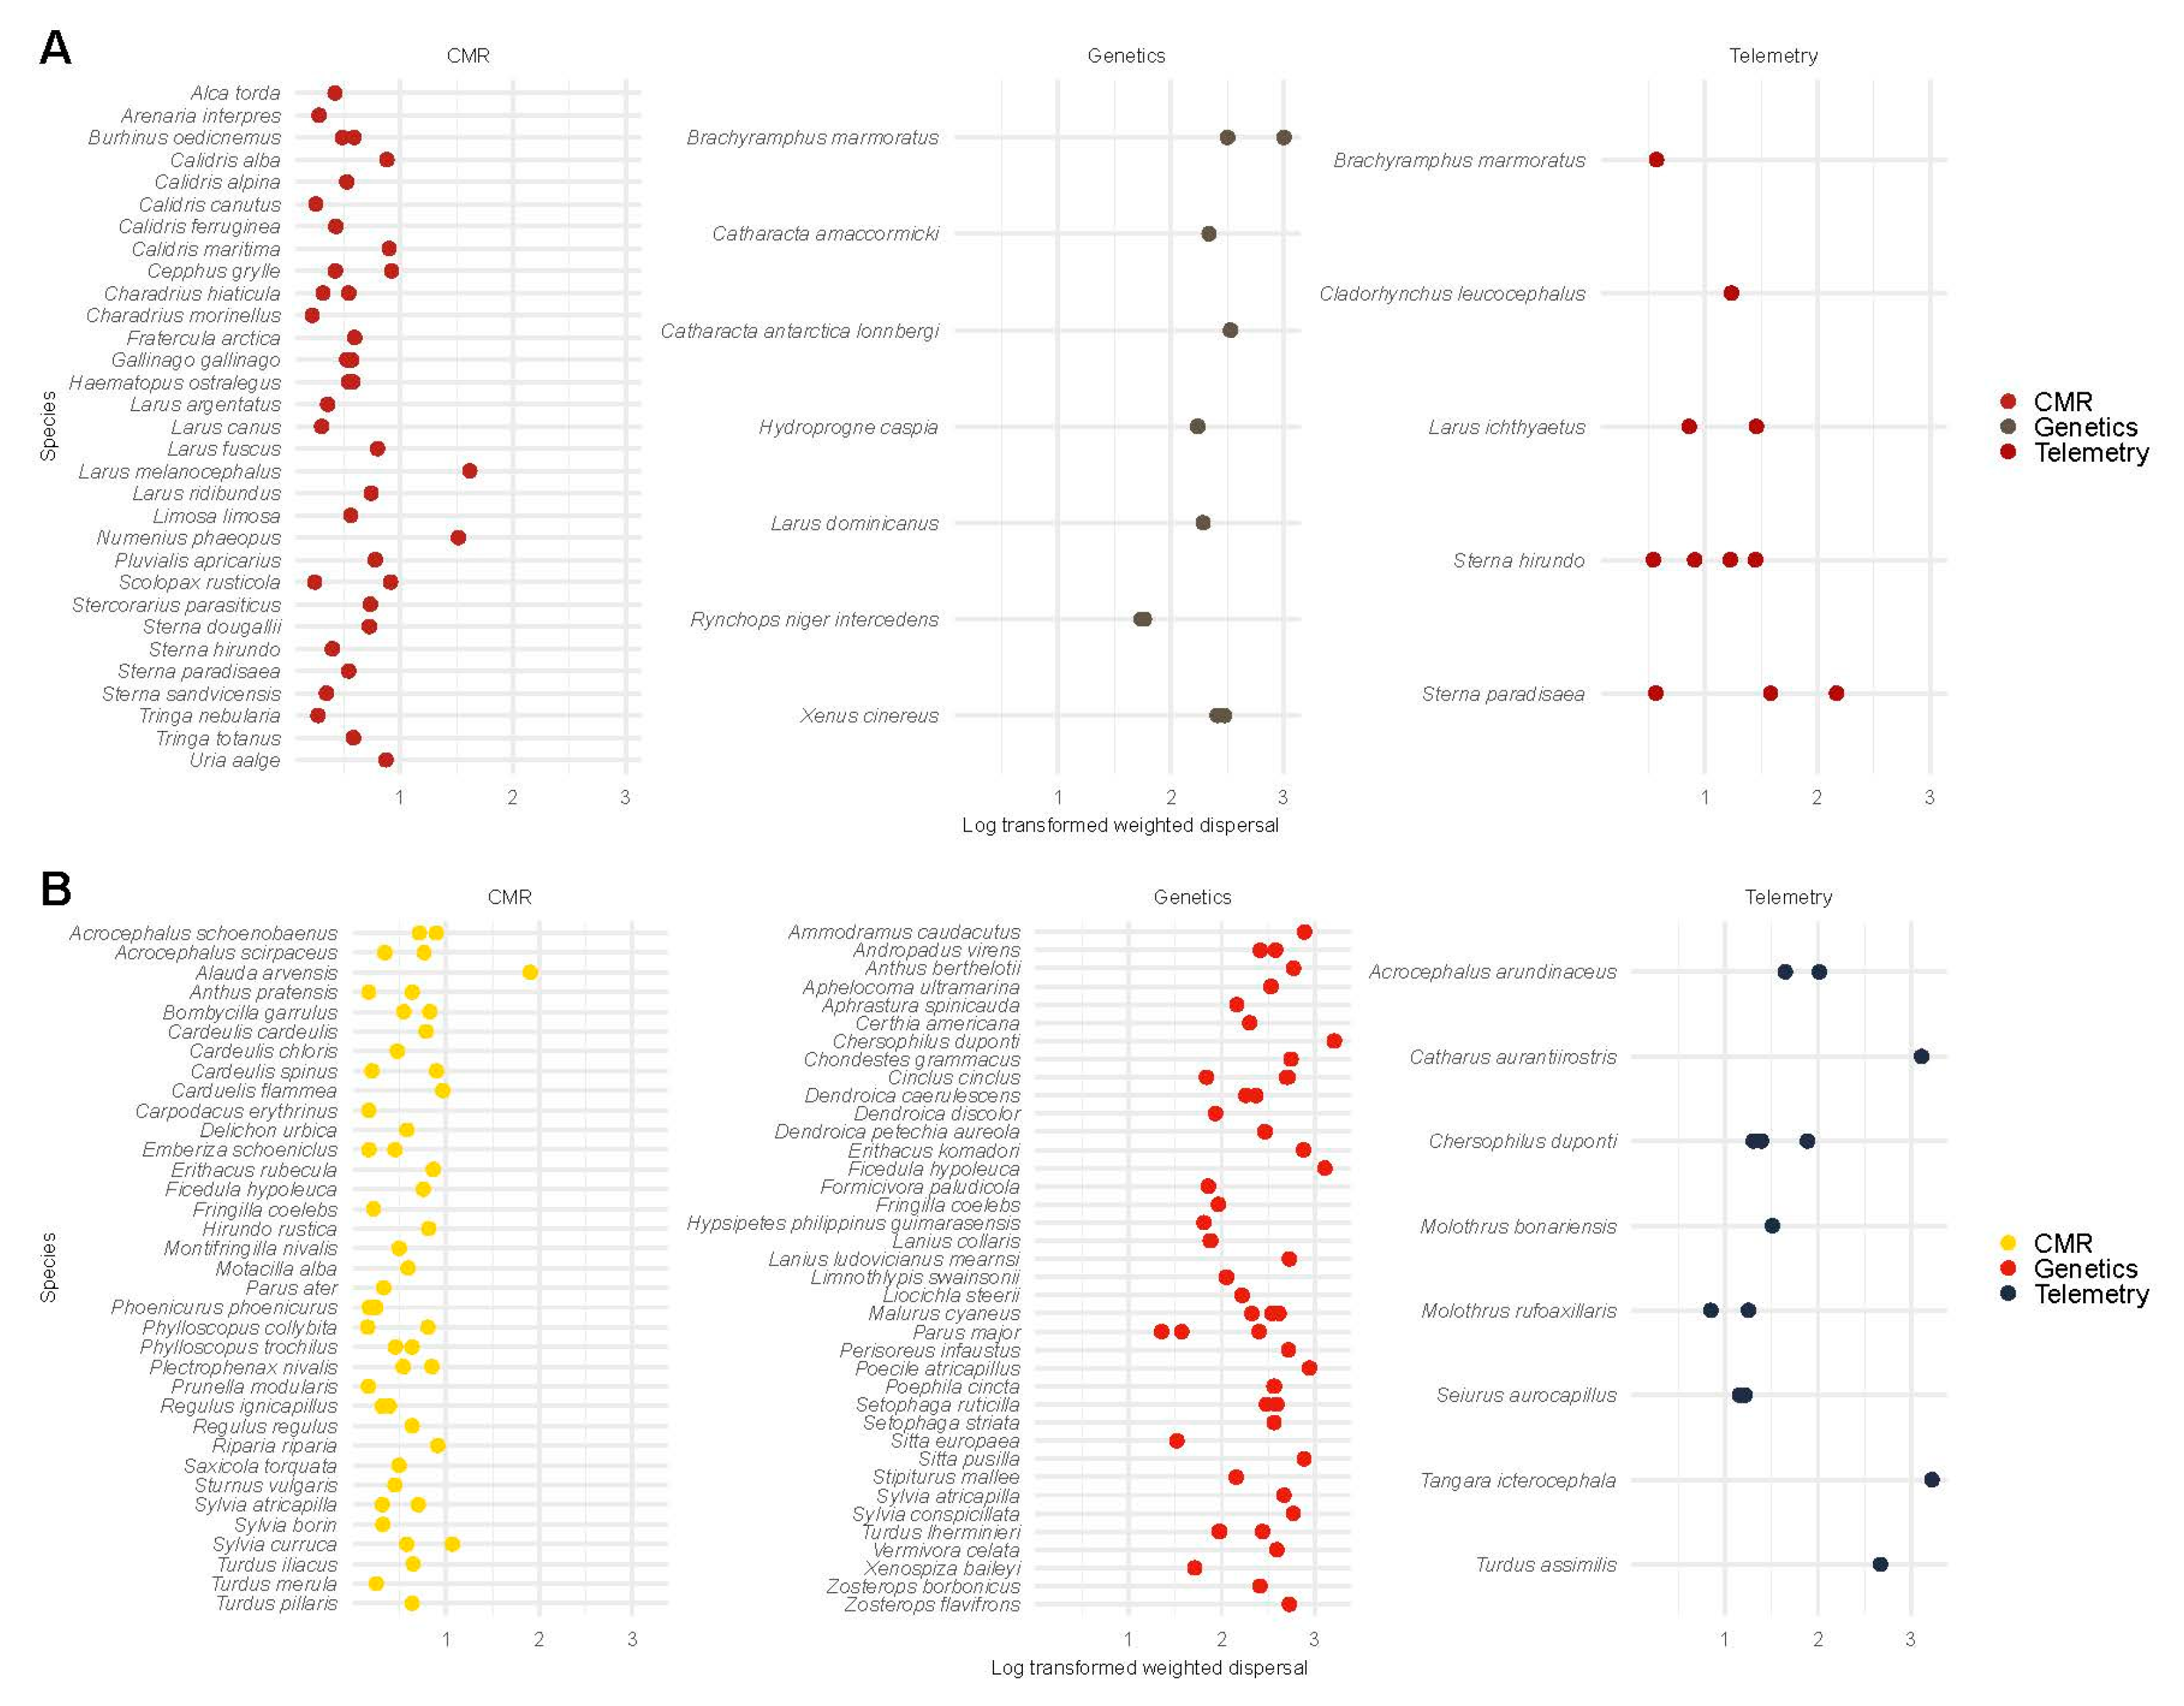
3.6.3. Weighted Dispersal in Birds

For Charadriiformes (e.g., shorebirds and seabirds), we compared weighted dispersal between CMR, telemetry, and genetic studies. Log-scale weighted dispersal from genetic methods ( β = 5.51, 95% CI [4.49, 6.51]) exceeded that from telemetry methods ( β = 3.00, 95% CI [1.98, 4.03]) and from CMR studies ( β = 1.56, 95% CI [0.11, 3.02]). Hypothesis tests indicated a posterior probability > 95% in favor of weighted dispersal from genetic studies exceeding weighted dispersal from telemetry and CMR studies. Similarly, hypothesis tests indicated a posterior probability of 95% in favor of log-scale weighted dispersal from telemetry studies exceeding that from CMR studies (Figure 4A; Figure S10).
For passerines (e.g., sparrows and finches), we compared weighted dispersal between CMR, telemetry, and genetic studies. The log-scale weighted dispersal from genetic methods ( β = 5.74, 95% CI [5.37, 6.11]) exceeded that from telemetry methods ( β = 4.14, 95% CI [3.22, 5.04]) and CMR studies ( β = 1.38, 95% CI [0.30, 2.47]). Hypothesis tests indicated a posterior probability > 95% in favor of the weighted dispersal from genetic studies exceeding the weighted dispersal from telemetry and CMR studies. Similarly, hypothesis tests indicated a posterior probability of > 95% in favor of the log-scale weighted dispersal from telemetry studies exceeding that from CMR studies (Figure 4B; Figure S10).

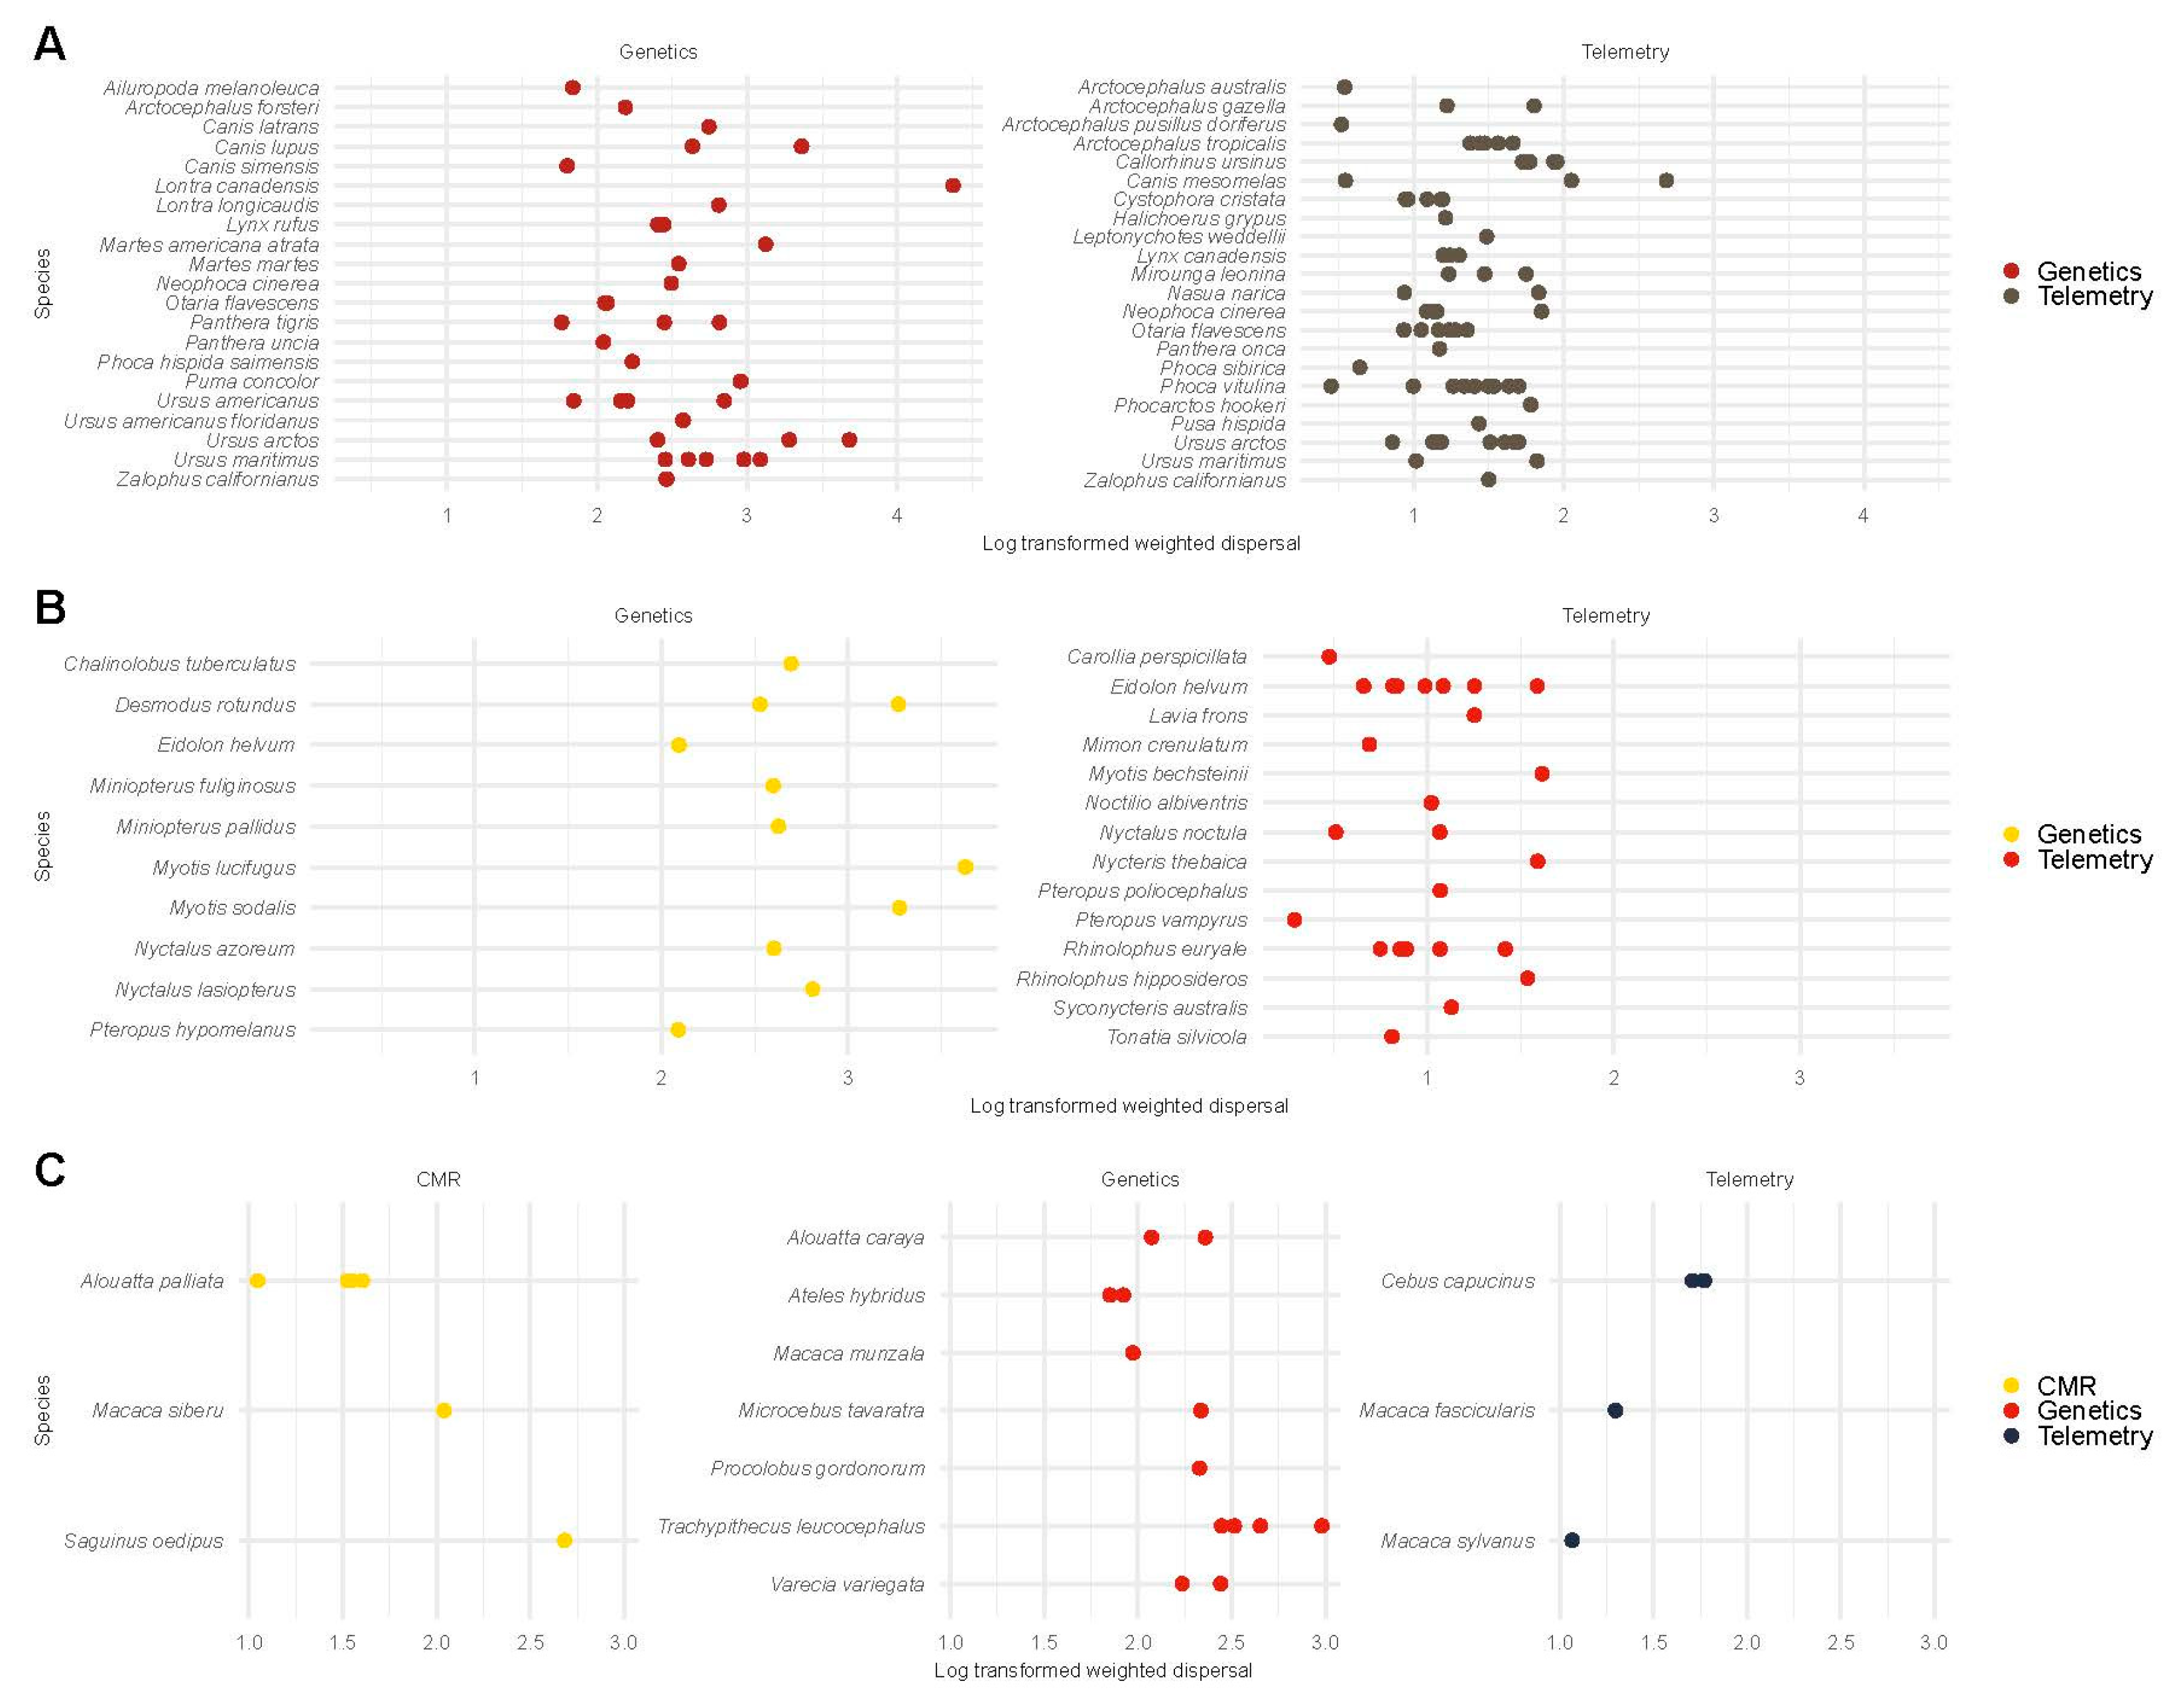
3.6.4. Weighted Dispersal in Mammals

For Carnivora (e.g., seals, bears, and wolves), we compared weighted dispersal between telemetry and genetic studies. The log-scale weighted dispersal from genetic methods ( β = 6.11, 95% CI [5.45, 6.79]) exceeded that from telemetry methods ( β = 3.42, 95% CI [2.80, 4.19]; Figure 5A; Figure S11). The posterior probability of the weighted dispersal from genetic studies exceeding that from telemetry studies was > 95%.
For chiropterans (i.e., bats), we compared weighted dispersal between telemetry and genetic studies. The log-scale weighted dispersal from genetic methods ( β = 6.44, 95% CI [5.56, 7.34]) exceeded that from telemetry methods ( β = 2.78, 95% CI [2.00, 3.59]; Figure 5B; Figure S11). The posterior probability of the weighted dispersal from genetic studies exceeding that from telemetry studies was > 95%.
For primates (e.g., lemurs and monkeys), we compared weighted dispersal between CMR, telemetry, and genetic studies. The log-scale weighted dispersal from genetic methods ( β = 5.55, 95% CI [4.37, 6.88]) exceeded that from telemetry ( β = 3.29, 95% CI [1.61, 5.02]) and CMR studies ( β = 4.83, 95% CI [3.35, 6.36]). The posterior probability of the weighted dispersal exceeding that from telemetry and CMR studies was 99% and 85%, respectively. The posterior probability of the weighted dispersal from CMR studies exceeding that from telemetry studies was 95% (Figure 5C; Figure S11).

4. Discussion

We reviewed a substantial number of published studies and provided a synthesis of dispersal data from demographic and genetic approaches. We obtained far fewer CMR studies relative to telemetry and genetic studies, but we attribute this to a low proportion of studies reporting the data we required (i.e., range length or total displacement with associated tagging duration) rather than a low incidence of CMR studies per se. We acknowledge that our selection criteria may thus result in our sample underestimating the number of published dispersal studies by study type. We additionally acknowledge that including the taxonomic class of interest as an “AND” term in our search string may have resulted in the exclusion of studies that did not list the taxonomic class explicitly. However, we believe that the rate of exclusion of such studies would be relatively comparable across taxonomic classes. Furthermore, our search string was agnostic to study location. Thus, we believe the distribution of dispersal studies in our sample may accurately reflect underlying geographic biases as well as under-represented taxa within the taxonomic groups sampled via our search string.
The distribution of dispersal studies we retrieved for this study corroborated taxonomic and geographic biases that were previously observed via surveys of the biodiversity research literature [24]. Areas with a high proportion of threatened species continue to remain understudied and dispersal research when conducted is most skewed towards less-speciose taxonomic groups [24]. For instance, we observed amphibians were the most under-represented taxonomic group in our sample of dispersal studies. In assessing geographic biases, Niger, Chad, the Democratic Republic of Congo, Central African Republic, and South Sudan were among the most under-represented countries with no dispersal studies retrieved for any taxonomic group in these regions. Across all vertebrate groups, we retrieved dispersal studies more frequently from developed nations indicating the distribution of dispersal studies matched the distribution of Gross Domestic Product (GDP) rather than the number of threatened species. This is exemplified in the fact that countries in Africa, Asia, and South America exhibit relatively lower dispersal research efforts across all taxonomic groups. Additionally, we qualitatively observed an interaction of these taxonomic and geographic biases. For instance, our study indicated a relatively low level of dispersal research effort in China relative to the number of threatened species, and most dispersal studies conducted in China focused largely on bird and mammal taxa. Further, given the critical need for dispersal information in making habitat protection decisions for biodiversity conservation, there is a real possibility that we will remain ill-equipped to conserve many vertebrate species. Thus, a concerted effort to increase the level of detail on dispersal patterns in amphibians and reptiles is required—particularly for regions in South America, Asia, and Africa [40]. Similarly, there is a dire need for increased dispersal research efforts in central Africa, across all taxonomic groups included in our study. We acknowledge that we only take published studies into account while identifying gaps in knowledge, as above. A wealth of grey literature (e.g., field guides and internal reports) from regions we identify as data-deficient may contain vital, species-specific dispersal data. Thus, efforts to make such data publicly accessible may address perceived gaps in knowledge.
Such dispersal assessments that are required can be conducted using both demographic and genetic methods, and our study sought to compare the relative utility of each to broad-scale PA management decisions. We observed that net dispersal estimates inferred from genetic approaches were consistently larger in magnitude relative to telemetry and CMR approaches. However, within a given taxonomic group, the rate of indirect dispersal in km/day was much lower than the rate of direct dispersal. We attribute this to differences in duration over which indirect and direct dispersal rates were normalized. Indirect dispersal occurred, at minimum, over the span of a generation, while direct dispersal rates were observed over a relatively short tagging duration in demographic studies. Thus, the daily rate of indirect dispersal (i.e., relating to the movement of genes) is slower than the daily rate of movement for an animal. However, indirect dispersal is inferred from a large number of individuals which is likely positively related to the spatial extent of a study and inversely related to variance. We used dispersal rates to enable comparison among studies that provide dispersal data over varying time scales while weighting such rates with the associated sample size and variance. Our reasoning was that dispersal rates associated with larger sample sizes and lower variance were more likely to represent dispersal patterns at the population level, which is more informative to broad-scale land-management decisions.
We observed that the weighted dispersal from genetic methods exceeded that from demographic methods in all vertebrate groups considered in our study. The only instance where genetic and demographic methods showed overlap was in comparisons of CMR and genetic studies of primates. A potential reason for this overlap in dispersal scores is that capture–mark–resight studies in primates can yield fine-scale, precise data on movement paths [41] for a relatively large number of individuals [42], thereby indicating that resighting marked animals may offer a less invasive, less expensive [43], and more representative alternative to traditional mark–recapture methods in monitoring animal dispersal. However, mark–resight studies of birds included in our study do not appear to capture population-level dispersal patterns with the same ability, possibly from a relatively small proportion of marked individuals and a lower number of recoveries.
Thus, the use of dispersal observed in demographic studies or inferred from genetic methods can have varying implications on land-management decisions. For instance, network analyses were used to assess connectivity within and between PAs at global and regional scales [4,5,6]. The scales of such analyses were defined using median dispersal distances that ranged from 1 to 100 km, wherein these median dispersal distances were estimated using the relationship between dispersal distance and home range size [4,5,6]. Such observations of home range were likely generated from demographic approaches. Such demographic dispersal data yielded differences in connectivity with differences in the magnitude of dispersal. Saura et al. [4] observed that the proportion of total protected land that was connected increased with dispersal distance, increasing from 58% at a dispersal distance of 1 km to 80% at a dispersal distance of 100 km. Similarly, Minor and Lookingbill [6] found taxa with considerable dispersal abilities could potentially move between most of the protected lands in an ecoregion. However, Santini et al. [5] observed that the size and number of PAs were more important in determining connectivity with dispersal distance independently contributing less. Dispersal observed via demographic studies is often positively related and population density is negatively related to home range size [5]. Thus, animals that have large direct dispersal distances also require large areas to be conserved, which possibly elucidates the observed, largest contribution of PA size on the amount of reachable area for an animal [5]. Additionally, in long-distance dispersers, the composition of the landscape outside PAs to facilitate movement between PAs becomes important. This is even more crucial when PAs are small and fragmented, where animals can compensate for a smaller extent of habitat by extending their home range to habitat patches outside their core range [5]. However, animals that are assessed as short-distance dispersers via demographic approaches may be capable of long-distance dispersal over the span of a generation [7,9,10]. Thus, the use of indirect dispersal estimates may lead us to conclude that larger areas may in fact be required for multiple species, even those with smaller home ranges. Similarly, the permeability of the landscape outside PAs to movement may be important to several species including those that have been demographically assessed as short-distance dispersers.
Genetic data can be generated from a smaller subset of a population with one sampling event per patch or deme to quantify dispersal. Furthermore, genetic methods can characterize long-distance dispersal over a shorter study duration [22], while demographic methods may be better suited at examining multi-annual patterns of short- or medium-distance dispersal [7]. Given the gaps in dispersal that persist for taxonomic groups and geographic regions, genetic studies to infer dispersal may enable relatively rapid assessments of broad-scale dispersal. Furthermore, genetic data from specific groups of species may be appropriate to enable an integration of multi-species connectivity in land-management decisions [5]. Dispersal quantified from genetic approaches could enable decisions on the size of PAs and determine whether these are self-feeding [44], enable qualitative assessments of connectivity between PAs [22], and facilitate spatially focused management of the landscape that is outside PAs [6].
We do not suggest that genetic approaches are infallible. For instance, we used IBD models to infer effective dispersal in our study species, given that these represent the simplest model of spatial genetic structure [33], and maximize the number of studies from which suitable genetic data could be extracted. However, by using this approach we were ignorant to the effects of environmental differences (e.g., elevation, type of vegetation, or substrate) on dispersal and the role of historical or environmental processes on genetic structure [45,46]. Additionally, estimates of parent–offspring dispersal require a direct estimate of effective population density, which is a non-trivial requirement [7]. The use of erroneous effective densities may introduce considerable bias in dispersal estimated from IBD slopes [47]. Our use of available census density data to define species-specific ranges from which we uniformly sampled effective densities likely represents an additional source of uncertainty in our study. Furthermore, the relationship between effective density and parent–offspring dispersal is violated when dispersal and population density are not homogenous and when the processes of migration and drift are not in equilibrium [31]. These assumptions are likely frequently violated in biological populations [8,13]. Assignment and parentage analyses can efficiently detect non-effective dispersal via sampling a subset of a population and serve as a potential alternative to demographic methods when several populations need to be surveyed [7]. However, assignment tests and parentage analyses decrease in accuracy with decreases in genetic differentiation among populations [22]. Genetic approaches, particularly indirect methods that quantify effective dispersal, usually provide little information on the timing and route of movement, the factors that influence movement, and the fitness consequences of individual dispersal strategies [15]. Demographic methods are more expensive [15] but can provide insights on the impact of emigration and immigration rates on the dynamics of biological populations as well as the manner in which such rates are impacted by dispersing individuals interpreting local environmental characteristics in light of their own phenotypic characteristics [7].
Considering that demographic and genetic approaches enable examination of the dispersal process at varying spatial and temporal scales, it is advantageous to cross-validate dispersal estimates from a combination of these approaches to identify conservation strategies [7,25]. The acquisition of smaller stepping-stone reserves with spatially focused management of the landscape outside the PA is likely a potential mechanism to enhance the amount of protected connected land and therein maximize the long-term persistence of biodiversity [5,6]. Landscape genetic methods provide a suitable framework to study the effect of landscape composition and configuration on effective transience between PAs [7]. These employ statistical comparisons between pairwise measures of inter-individual or inter-population genetic differentiation and pairwise landscape distances quantifying the connectivity between PAs [7,48]. However, such approaches suffer confoundment if landscape features limiting dispersal also constrain population size [7]. Furthermore, the effect of landscape surfaces on dispersal is often parameterized using expert opinion. Demographic methods such as CMR studies can be used in combination with landscape genetics to provide estimates of census population and some insight into the factors accounting for variation in the ratio of effective population size to census size [7]. Demographic approaches can also help us to understand the effect of landscape composition in enabling movement and thereby help to parameterize landscape genetic models [7,48,49].
We suggest separate species-specific assessments that combine genetic and demographic methods to facilitate movement within and between PAs. This would enable land-management decisions to enhance the connectivity of PA networks. We acknowledge that it is likely that species remain under-studied partly due to a lack of funding opportunities [24,50]. This in turn may place limits on the sources of complementary dispersal data that can be used to inform habitat protection decisions. Therefore, we suggest that landscape genetic approaches that seek to assess transience between PAs could, at minimum, characterize the ability for an animal to move through land-cover types using habitat suitability or species distribution models derived from species occurrence data. Such species occurrence data could be concurrently generated during sample collection for genetic data. This would potentially lead to assessments of PA connectivity at large spatial scales over relatively short periods of time within understudied areas and for data-depauperate species—therein informing land-management decisions that would facilitate connectivity gains for species threatened with extinction.

Supplementary Materials

The following supporting information can be downloaded at https://www.mdpi.com/article/10.3390/d17030163/s1, Figure S1: Process and outcome of publication selection; Figure S2: Effect of sample size on standard deviation of indirect dispersal in anurans (A) and urodeles (B); Figure S3: Effect of sample size on standard deviation of indirect dispersal in squamates within one-dimensional (A) and two-dimensional habitats (B); Figure S4: Effect of sample size on standard deviation of indirect dispersal in testudines within one-dimensional (A) and two-dimensional habitats (B); Figure S5: Effect of sample size on standard deviation of indirect dispersal in Charadriiformes (A) and passerines (B); Figure S6: Effect of sample size on standard deviation of indirect dispersal in Carnivora (A), chiropterans (B), and primates (C); Figure S7: Number of dispersal observations retrieved for amphibians (A), reptiles (B), birds (C), and mammals (D); Figure S8: Univariate regression of weighted dispersal score by study type for anurans (A) and urodeles (B); Figure S9: Univariate regression of weighted dispersal score by study type for squamates (A) and testudines (B); Figure S10: Univariate regression of weighted dispersal score by study type for Charadriiformes (A) and passerines (B); Figure S11: Univariate regression of weighted dispersal scores by study type for Carnivora (A), chiropterans (B), and primates (C); Table S1: Search string used to recover published articles on animal dispersal; Appendix SA: R code used to estimate effective dispersal and compare weighted dispersal among study types in amphibians; Appendix SB: R code used to estimate effective dispersal and compare weighted dispersal among study types in reptiles; Appendix SC: R code used to estimate effective dispersal and compare weighted dispersal among study types in birds; Appendix SD: R code used to estimate effective dispersal and compare weighted dispersal among study types in mammals.

Author Contributions

S.S. conceived the study, formulated the research question, conducted the literature review, collected the data, performed analyses, and wrote the initial and final drafts of the manuscript. B.J.H. contributed to formulating the research question, provided guidance on data analyses, and revised the manuscript. M.L.M., M.C.G. and D.R. provided guidance on data analyses and revised the manuscript. M.R.J.F. conceived the study, helped formulate the research question, revised the manuscript, and supervised the work. All authors have read and agreed to the published version of the manuscript.

Funding

This research was funded by United States Fish and Wildlife Service, The Graduate College at Texas State University, The Department of Biology at Texas State University, and Bastrop Utilities Habitat Conservation Plan.

Institutional Review Board Statement

Not applicable.

Data Availability Statement

We intend to enable the discovery and reuse of our research dataset by publishing it as a Data Descriptor in Scientific Data.

Acknowledgments

S.S. would like to thank his friends and colleagues for their support during the implementation of this study.

Conflicts of Interest

The authors declare they have no conflicts of interest. Any use of trade, product, or firm names in this publication is for descriptive purposes only and does not imply endorsement by the U.S. government.

References

  1. Díaz, S.; Settele, J.; Brondízio, E.S.; Ngo, H.T.; Agard, J.; Arneth, A.; Balvanera, P.; Brauman, K.A.; Butchart, S.H.M.; Chan, K.M.A.; et al. Pervasive human-driven decline of life on Earth points to the need for transformative change. Science 2019, 366, eaax3100. [Google Scholar] [CrossRef] [PubMed]
  2. Milner-Gulland, E.; Addison, P.; Arlidge, W.N.; Baker, J.; Booth, H.; Brooks, T.; Bull, J.W.; Burgass, M.J.; Ekstrom, J.; zu Ermgassen, S.O. Four steps for the Earth: Mainstreaming the post-2020 global biodiversity framework. One Earth 2021, 4, 75–87. [Google Scholar] [CrossRef]
  3. Jetz, W.; McGowan, J.; Rinnan, D.S.; Possingham, H.P.; Visconti, P.; O’Donnell, B.; Londoño-Murcia, M.C. Include biodiversity representation indicators in area-based conservation targets. Nat. Ecol. Evol. 2022, 6, 123–126. [Google Scholar] [CrossRef] [PubMed]
  4. Saura, S.; Bastin, L.; Battistella, L.; Mandrici, A.; Dubois, G. Protected areas in the world’s ecoregions: How well connected are they? Ecol. Indic. 2017, 76, 144–158. [Google Scholar] [CrossRef] [PubMed]
  5. Santini, L.; Saura, S.; Rondinini, C. Connectivity of the global network of protected areas. Divers. Distrib. 2016, 22, 199–211. [Google Scholar] [CrossRef]
  6. Minor, E.S.; Lookingbill, T.R. A multiscale network analysis of protected-area connectivity for mammals in the United States. Conserv. Biol. 2010, 24, 1549–1558. [Google Scholar] [CrossRef]
  7. Cayuela, H.; Rougemont, Q.; Prunier, J.G.; Moore, J.S.; Clobert, J.; Besnard, A.; Bernatchez, L. Demographic and genetic approaches to study dispersal in wild animal populations: A methodological review. Mol. Ecol. 2018, 27, 3976–4010. [Google Scholar] [CrossRef]
  8. Driscoll, D.A.; Banks, S.C.; Barton, P.S.; Ikin, K.; Lentini, P.; Lindenmayer, D.B.; Smith, A.L.; Berry, L.E.; Burns, E.L.; Edworthy, A. The trajectory of dispersal research in conservation biology. Systematic review. PLoS ONE 2014, 9, e95053. [Google Scholar] [CrossRef]
  9. Beese, W.J.; Deal, J.; Dunsworth, B.G.; Mitchell, S.J.; Philpott, T.J. Two decades of variable retention in British Columbia: A review of its implementation and effectiveness for biodiversity conservation. Ecol. Process. 2019, 8, 1–22. [Google Scholar] [CrossRef]
  10. Koenig, W.D.; Van Vuren, D.; Hooge, P.N. Detectability, philopatry, and the distribution of dispersal distances in vertebrates. Trends Ecol. Evol. 1996, 11, 514–517. [Google Scholar] [CrossRef]
  11. Caci, G.; Biscaccianti, A.B.; Cistrone, L.; Bosso, L.; Garonna, A.P.; Russo, D. Spotting the right spot: Computer-aided individual identification of the threatened cerambycid beetle Rosalia alpina. J. Insect Conserv. 2013, 17, 787–795. [Google Scholar] [CrossRef]
  12. Muñoz, D.J.; Miller, D.A.; Sutherland, C.; Grant, E.H.C. Using spatial capture–recapture to elucidate population processes and space-use in herpetological studies. J. Herpetol. 2016, 50, 570–581. [Google Scholar] [CrossRef]
  13. Broquet, T.; Petit, E.J. Molecular estimation of dispersal for ecology and population genetics. Annu. Rev.Ecol.Evol. Syst. 2009, 40, 193–216. [Google Scholar] [CrossRef]
  14. Slatkin, M. Gene flow and the geographic structure of natural populations. Science 1987, 236, 787–792. [Google Scholar] [CrossRef]
  15. Griesser, M.; Halvarsson, P.; Sahlman, T.; Ekman, J. What are the strengths and limitations of direct and indirect assessment of dispersal? Insights from a long-term field study in a group-living bird species. Behav. Ecol. Sociobiol. 2014, 68, 485–497. [Google Scholar] [CrossRef]
  16. Alex Smith, M.; Green, D.M. Dispersal and the metapopulation paradigm in amphibian ecology and conservation: Are all amphibian populations metapopulations? Ecography 2005, 28, 110–128. [Google Scholar] [CrossRef]
  17. Brannelly, L.A.; Chatfield, M.W.; Richards-Zawacki, C. Visual implant elastomer (VIE) tags are an unreliable method of identification in adult anurans. Herpetol. J. 2013, 23, 125–129. [Google Scholar]
  18. Alford, R.; Rowley, J. Techniques for tracking amphibians: The effects of tag attachment, and harmonic direction finding versus radio telemetry. Amphib.-Reptil. 2007, 28, 367–376. [Google Scholar]
  19. Moore, J.S.; Harris, L.N.; Le Luyer, J.; Sutherland, B.J.; Rougemont, Q.; Tallman, R.F.; Fisk, A.T.; Bernatchez, L. Genomics and telemetry suggest a role for migration harshness in determining overwintering habitat choice, but not gene flow, in anadromous Arctic Char. Mol. Ecol. 2017, 26, 6784–6800. [Google Scholar] [CrossRef]
  20. Hebblewhite, M.; Haydon, D.T. Distinguishing technology from biology: A critical review of the use of GPS telemetry data in ecology. Philos. Trans. R. Soc. B Biol. Sci. 2010, 365, 2303–2312. [Google Scholar] [CrossRef] [PubMed]
  21. Andrews, K.R.; Good, J.M.; Miller, M.R.; Luikart, G.; Hohenlohe, P.A. Harnessing the power of RADseq for ecological and evolutionary genomics. Nat. Rev. Genet. 2016, 17, 81–92. [Google Scholar] [CrossRef]
  22. Berry, O.; Tocher, M.D.; Sarre, S.D. Can assignment tests measure dispersal? Mol. Ecol. 2004, 13, 551–561. [Google Scholar] [CrossRef]
  23. Taberlet, P.; Waits, L.P.; Luikart, G. Noninvasive genetic sampling: Look before you leap. Trends Ecol. Evol. 1999, 14, 323–327. [Google Scholar] [CrossRef]
  24. Titley, M.A.; Snaddon, J.L.; Turner, E.C. Scientific research on animal biodiversity is systematically biased towards vertebrates and temperate regions. PLoS ONE 2017, 12, e0189577. [Google Scholar] [CrossRef]
  25. Leidner, A.K.; Haddad, N.M. Combining measures of dispersal to identify conservation strategies in fragmented landscapes. Conserv. Biol. 2011, 25, 1022–1031. [Google Scholar] [CrossRef] [PubMed]
  26. IUCN. The IUCN Red List of Threatened Species. Version 2023-1. Available online: https://www.iucnredlist.org (accessed on 22 May 2024).
  27. Gusenbauer, M.; Haddaway, N.R. Which academic search systems are suitable for systematic reviews or meta-analyses? Evaluating retrieval qualities of Google Scholar, PubMed, and 26 other resources. Res. Synth. Methods 2020, 11, 181–217. [Google Scholar] [CrossRef] [PubMed]
  28. R Core Team. R: A Language and Environment for Statistical Computing; R Foundation for Statistical Computing: Vienna, Austria, 2023. [Google Scholar]
  29. Bohonak, A.J. IBD (isolation by distance): A program for analyses of isolation by distance. J. Hered. 2002, 93, 153–154. [Google Scholar] [CrossRef]
  30. Jensen, J.L.; Bohonak, A.J.; Kelley, S.T. Isolation by distance, web service. BMC Genet. 2005, 6, 13. [Google Scholar] [CrossRef] [PubMed]
  31. Rousset, F. Genetic differentiation and estimation of gene flow from F-statistics under isolation by distance. Genetics 1997, 145, 1219–1228. [Google Scholar] [CrossRef]
  32. Beebee, T.J. Conservation genetics of amphibians. Heredity 2005, 95, 423–427. [Google Scholar] [CrossRef] [PubMed]
  33. Jenkins, D.G.; Carey, M.; Czerniewska, J.; Fletcher, J.; Hether, T.; Jones, A.; Knight, S.; Knox, J.; Long, T.; Mannino, M. A meta-analysis of isolation by distance: Relic or reference standard for landscape genetics? Ecography 2010, 33, 315–320. [Google Scholar] [CrossRef]
  34. Puebla, O.; Bermingham, E.; Guichard, F. Estimating dispersal from genetic isolation by distance in a coral reef fish (Hypoplectrus puella). Ecology 2009, 90, 3087–3098. [Google Scholar] [CrossRef]
  35. Jones, K.E.; Bielby, J.; Cardillo, M.; Fritz, S.A.; O’Dell, J.; Orme, C.D.L.; Safi, K.; Sechrest, W.; Boakes, E.H.; Carbone, C. PanTHERIA: A species-level database of life history, ecology, and geography of extant and recently extinct mammals: Ecological Archives E090-184. Ecology 2009, 90, 2648. [Google Scholar] [CrossRef]
  36. Santini, L.; Isaac, N.J.; Ficetola, G.F. TetraDENSITY: A database of population density estimates in terrestrial vertebrates. Glob. Ecol. Biogeogr. 2018, 27, 787–791. [Google Scholar] [CrossRef]
  37. Bürkner, P.C. brms: An R package for Bayesian multilevel models using Stan. J. Stat. Softw. 2017, 80, 1–28. [Google Scholar] [CrossRef]
  38. Doherty, T.S.; Balouch, S.; Bell, K.; Burns, T.J.; Feldman, A.; Fist, C.; Garvey, T.F.; Jessop, T.S.; Meiri, S.; Driscoll, D.A. Reptile responses to anthropogenic habitat modification: A global meta-analysis. Glob. Ecol. Biogeogr. 2020, 29, 1265–1279. [Google Scholar] [CrossRef]
  39. Gelman, A.; Rubin, D.B. Inference from iterative simulation using multiple sequences. Stat. Sci. 1992, 7, 457–472. [Google Scholar] [CrossRef]
  40. Antonelli, A.; Ariza, M.; Albert, J.; Andermann, T.; Azevedo, J.; Bacon, C.; Faurby, S.; Guedes, T.; Hoorn, C.; Lohmann, L.G.; et al. Conceptual and empirical advances in Neotropical biodiversity research. PeerJ 2018, 6, e5644. [Google Scholar] [CrossRef]
  41. Marcus Rowcliffe, J.; Carbone, C.; Kays, R.; Kranstauber, B.; Jansen, P.A. Bias in estimating animal travel distance: The effect of sampling frequency. Methods Ecol. Evol. 2012, 3, 653–662. [Google Scholar] [CrossRef]
  42. Dawson, G.A. The use of time and space by the Panamanian tamarin, Saguinus oedipus. Folia Primatol. 1979, 31, 253–284. [Google Scholar] [CrossRef]
  43. McClintock, B.T.; White, G.C. A less field-intensive robust design for estimating demographic parameters with mark–resight data. Ecology 2009, 90, 313–320. [Google Scholar] [CrossRef] [PubMed]
  44. Palumbi, S.R. Population genetics, demographic connectivity, and the design of marine reserves. Ecol. Appl. 2003, 13, 146–158. [Google Scholar] [CrossRef]
  45. Manel, S.; Holderegger, R. Ten years of landscape genetics. Trends Ecol. Evol. 2013, 28, 614–621. [Google Scholar] [CrossRef] [PubMed]
  46. Wang, I.J.; Bradburd, G.S. Isolation by environment. Mol. Ecol. 2014, 23, 5649–5662. [Google Scholar] [CrossRef] [PubMed]
  47. Comte, L.; Olden, J.D. Fish dispersal in flowing waters: A synthesis of movement- and genetic-based studies. Fish Fish. 2018, 19, 1063–1077. [Google Scholar] [CrossRef]
  48. Epps, C.W.; Wehausen, J.D.; Bleich, V.C.; Torres, S.G.; Brashares, J.S. Optimizing dispersal and corridor models using landscape genetics. J. Appl. Ecol. 2007, 44, 714–724. [Google Scholar] [CrossRef]
  49. Thatte, P.; Joshi, A.; Vaidyanathan, S.; Landguth, E.; Ramakrishnan, U. Maintaining tiger connectivity and minimizing extinction into the next century: Insights from landscape genetics and spatially-explicit simulations. Biol. Conserv. 2018, 218, 181–191. [Google Scholar] [CrossRef]
  50. Martín-López, B.; Montes, C.; Ramírez, L.; Benayas, J. What drives policy decision-making related to species conservation? Biol. Conserv. 2009, 142, 1370–1380. [Google Scholar] [CrossRef]
Figure 1. The number of red-listed animal species in each country relative to the number of dispersal studies. Dividing the number of threatened amphibian (A), reptile (B), avian (C), and mammal (D) species [26] by the number of dispersal studies reveals regions that are understudied relative to the number of threatened species. Across all vertebrate groups, countries in Asia, Africa, and South America appeared relatively understudied. Yellow colors represent a higher number of threatened species per study.
Diversity 17 00163 g001
Figure 2. Log-transformed weighted dispersal estimates of anuran species (A) and urodele species (B) from telemetry and genetic studies. We display anuran and urodele species on the y-axis and log-transformed weighted dispersal on the x-axis. In anurans (i.e., frogs and toads), log-scale weighted dispersal estimates from telemetry studies (1.29 ± 0.50) and log-transformed weighted dispersal estimates from genetic studies (2.30 ± 0.38) were compared using a univariate regression model. The posterior probability of the weighted dispersal from genetic studies exceeding the weighted dispersal from telemetry studies was >95%. For urodeles (i.e., newts and salamanders), log-scale weighted dispersal estimates from telemetry studies (1.02 ± 0.17) and log-transformed weighted dispersal estimates from genetic studies (2.24 ± 0.43) were compared using a univariate regression model. The posterior probability of the weighted dispersal from genetic studies exceeding the weighted dispersal from telemetry studies was >95%.
Diversity 17 00163 g002
Figure 3. Log-transformed weighted dispersal estimates of squamate species (A) and testudines (B) from demographic and genetic studies. We display squamates and testudines on the y-axis and log-transformed weighted dispersal on the x-axis. In squamates (i.e., snakes and lizards), log-scale weighted dispersal estimates from telemetry studies (1.40 ± 0.51) and log-transformed weighted dispersal estimates from genetic studies (2.03 ± 0.34) were compared using a univariate regression model. The posterior probability of the weighted dispersal from genetic studies exceeding the weighted dispersal from telemetry studies was >95%. For testudines (i.e., turtles and tortoises), log-scale weighted dispersal estimates from CMR studies (1.18 ± 0.25), telemetry studies (1.47 ± 0.60), and genetic studies (2.43 ± 0.37) were compared using a univariate regression model. The posterior probability of the weighted dispersal from genetic studies exceeding the weighted dispersal from telemetry and CMR studies was >95%. The posterior probability of the weighted dispersal from telemetry studies exceeding the weighted dispersal from CMR studies was 76%.
Diversity 17 00163 g003
Figure 4. Log-transformed weighted dispersal estimates of Charadriiformes (A) and Passeriformes (B) from demographic and genetic studies. We display Charadriiformes and Passeriformes on the y-axis and log-transformed weighted dispersal on the x-axis. In Charadriiformes (e.g., shorebirds and seabirds), log-scale weighted dispersal estimates from CMR (0.60 ± 0.31), telemetry (1.14 ± 0.51), and genetic studies (2.32 ± 0.36) were compared using a univariate regression model. The posterior probability of the weighted dispersal from genetic studies exceeding the weighted dispersal from CMR and telemetry studies was >95%. Similarly, the posterior probability of the weighted dispersal from telemetry studies exceeding that from CMR studies was 95%. For passerines (e.g., sparrows and finches), log-scale weighted dispersal estimates from CMR studies (0.56 ± 0.32), telemetry studies (1.71 ± 0.74), and genetic studies (2.40 ± 0.42) were compared using a univariate regression model. The posterior probability of the weighted dispersal from genetic studies exceeding the weighted dispersal from telemetry and CMR studies was >95%. Similarly, the posterior probability of the weighted dispersal from telemetry studies exceeding that from CMR studies was >95%.
Diversity 17 00163 g004
Figure 5. Log-transformed weighted dispersal estimates of Carnivora (A), Chiroptera (B), and primates (C) from demographic and genetic studies. We display carnivores, bats, and primates on the y-axis and log-transformed weighted dispersal on the x-axis. In carnivores (e.g., seals, bears, and wolves), log-scale weighted dispersal estimates from telemetry (1.36 ± 0.40) and genetic studies (2.77 ± 0.62) were compared using a univariate regression model. The posterior probability of the weighted dispersal from genetic studies exceeding the weighted dispersal from CMR and telemetry studies was >95%. For chiropterans (i.e., bats), log-scale weighted dispersal estimates from telemetry studies (1.01 ± 0.36) and genetic studies (2.75 ± 0.52) were compared using a univariate regression model. The posterior probability of the weighted dispersal from genetic studies exceeding the weighted dispersal from telemetry and CMR studies was >95%. For primates, (e.g., lemurs and monkeys), log-scale weighted dispersal estimates from CMR (1.74 ± 0.56), telemetry (1.46 ± 0.33), and genetic studies (2.31 ± 0.31) were compared using a univariate regression model. The posterior probability of the weighted dispersal exceeding that from telemetry and CMR studies was 99% and 85% respectively. The posterior probability of the weighted dispersal from CMR studies exceeding that from telemetry studies was 95%.
Diversity 17 00163 g005
Disclaimer/Publisher’s Note: The statements, opinions and data contained in all publications are solely those of the individual author(s) and contributor(s) and not of MDPI and/or the editor(s). MDPI and/or the editor(s) disclaim responsibility for any injury to people or property resulting from any ideas, methods, instructions or products referred to in the content.

