Article

Decoding the Mitogenome of Takydromus intermedius: Insights into the Comparative Mitogenomics and Phylogenetic Relationships of Takydromus Lizards

1
The Conservation of Endangered Wildlife Key Laboratory of Sichuan Province, Chengdu Research Base of Giant Panda Breeding, Chengdu 510081, China
2
Sichuan Meigu Dafengding National Nature Reserve Administration, Meigu 616450, China
*
Author to whom correspondence should be addressed.
Diversity 2025, 17(12), 813; https://doi.org/10.3390/d17120813
Submission received: 25 October 2025 / Revised: 21 November 2025 / Accepted: 22 November 2025 / Published: 25 November 2025
(This article belongs to the Collection Feature Papers in Phylogeny and Evolution)

Abstract

The genus Takydromus (grass lizards) represents a diverse and ecologically significant group of lacertid lizards widely distributed across East and Southeast Asia. However, phylogenetic relationships within the genus remain contentious, primarily due to limited molecular data and inconsistent results from previous studies based on single or few mitochondrial genes. This study aimed to (1) sequence and characterize the complete mitogenome of T. intermedius; (2) perform a comparative analysis of mitogenomic features across the genus; and (3) reconstruct a robust phylogeny to clarify intra-generic evolutionary relationships. The mitogenome of T. intermedius was 18,770 bp in size and contained the typical set of 37 genes. Comparative analyses revealed characteristic features including AT-richness, strand asymmetry, and considerable length variation in the control region attributable to tandem repeats. The ATP8 gene showed the highest nucleotide diversity, and all protein-coding genes were found to be under strong purifying selection. Phylogenetic trees were reconstructed from a concatenated dataset of 13 protein-coding genes and two rRNA genes using both maximum likelihood and Bayesian inference methods. The resulting phylogeny strongly supported the monophyly of Takydromus and resolved several species relationships; however, it did not support the recognition of Platyplacopus as a distinct subgenus. Moreover, our mitogenomic analysis strongly validates the forest-grassland ecological speciation hypothesis and the southern–northern lineage division in Takydromus. Our study provides valuable mitogenomic resources and underscores the utility of complete mitochondrial genomes in elucidating phylogenetic relationships within Takydromus. These findings lay a solid foundation for future taxonomic and evolutionary studies, although expanded species sampling is needed to fully understand the genus’s diversification history.

1. Introduction

The grass lizards, genus Takydromus Daudin, 1802 (Squamata: Lacertidae), represent an early-diverging lacertid lineage distributed across the Palearctic and Oriental realms [1,2]. They are characterized by slender bodies, exceptionally long tails, and agile locomotion [3]. It exhibits considerable species diversity, with 25 recognized species to date [4]. China, situated at the center of the genus’ distribution, represents a major diversity hotspot, as evidenced by the recent description of several new species with narrow ranges [5,6,7]. These discoveries have brought the total number of Takydromus species recorded in China to 16 [7,8]. Most Takydromus species inhabit open grassland habitats, while some species inhabit broadleaf forests [9]. Sympatry is common within the genus. For example, in southeastern China, T. septentrionalis Günther, 1864 is sympatric with T. sexlineatus Daudin, 1802; in southwestern China, it coexists with T. intermedius Stejneger, 1924; and in eastern China, its range overlaps with T. wolteri Fischer, 1885 [9,10]. Similarly, T. sexlineatus is sympatric with T. kuehnei Van Denburgh, 1909 in southern China. Furthermore, the newly described, narrow-ranging species T. guilinensis Guo, Hu, Chen, Zhong & Ji, 2024 is sympatric with four congeners: T. septentrionalis, T. kuehnei, T. sexlineatus, and T. intermedius [7].
The genus Takydromus has been a focal group in reptile systematics due to its high species diversity, great morphological similarity, widespread sympatric distribution, and geographic population differentiation. Despite extensive research using morphological and molecular data, interspecific relationships and evolutionary history remain debated. Following its establishment with T. sexlineatus as the type species, Boulenger split some of its species into the new genera Apeltonotus Boulenger, 1917 and Platyplacopus Boulenger, 1917 [11]. Pope later abolished the genus Apeltonotus and reclassified all its species under Platyplacopus [12]. Arnold subsequently proposed merging Platyplacopus into Takydromus [13] but further suggested dividing Takydromus into two subgenera (Takydromus and Platyplacopus) [2] based on morphological phylogenetic analyses. Mitochondrial-based phylogenies (rrnS, rrnL, CYTB) have supported merging Platyplacopus into Takydromus, but not the aforementioned subgeneric division [1,14,15,16].
The mitochondrial genome (mitogenome), characterized by maternal inheritance, relative structural conservation, absence of recombination, and a faster evolutionary rate compared to nuclear DNA [17,18], has become a cornerstone molecular marker for studies in molecular evolution [19,20], species identification [6,7], population genetics [21,22], and molecular phylogenetics [1,20]. The typical metazoan mitogenome is a circular double-stranded molecule approximately 15–20 kb in length, usually encoding 37 genes: 13 protein-coding genes (PCGs), 2 ribosomal RNA genes (rRNAs), and 22 transfer RNA genes (tRNAs) [18,23,24]. Although increasing number of Takydromus mitogenomes have reported [19,25,26,27,28,29,30,31,32], a comprehensive analysis of their characteristics—such as nucleotide composition, nucleotide diversity, and selection pressure—is still lacking. This gap limits our understanding of the molecular evolutionary mechanisms within this ecologically significant group. Recent mitogenomes analyses have improved resolution but yielded inconsistent results [19,20,31,33], partly due to variations in gene selection (e.g., exclusion of ND6 or rRNA genes) and analytical methods.
In this study, we (1) sequence, assemble, and annotate the complete mitogenome of T. intermedius; (2) analyze its genomic structure, base composition, and codon usage bias in PCGs; (3) perform a genus-level comparative genomic analysis by integrating the newly sequenced mitogenome herein with all publicly available Takydromus mitogenomes to elucidate their evolutionary patterns; (4) reconstruct the phylogeny of Takydromus; and (5) test the ecological speciation hypothesis by examining the phylogeny-habitat correlation. Our results provide new insights into mitogenome evolution and phylogenetic relationships among grass lizards.

2. Materials and Methods

2.1. Materials

On 11 May 2017, a road-killed lizard specimen (Sex: male; Snout-vent length: 46 mm) was collected in Dujiangyan City, Sichuan Province, China (30°57′ N, 103°34′ E; elevation: 799 m). The specimen was identified as T. intermedius based on morphological characteristics and mitochondrial CYTB gene sequence alignment. It was preserved in 75% ethanol and deposited at the Chengdu Research Base of Giant Panda Breeding with the voucher number PB2017002. Genomic DNA was extracted from muscle tissue taken from the hind limb using the Dzup Genomic DNA Extraction Kit (Sangon Biotech Co., Ltd., Shanghai, China).

2.2. Methods

2.2.1. Mitogenome Sequencing, Assembly and Annotation

With technical support from Sangon Biotech Co., Ltd. (Shanghai, China), the mitochondrial genome of T. intermedius was sequenced using high-throughput sequencing technology. Library preparation, sequencing, and assembly of the mitochondrial genome were performed following the protocol previously established by our research team [34]. For the assembly, we used the reference genome NC_077637, and 98.793% of the total reads were successfully utilized in the assembly process. Genome annotation was conducted using the online tools MitoAnnotator (http://mitofish.aori.u-tokyo.ac.jp/annotation/input/; accessed on 20 May 2024) [35] and MITOS2 (https://usegalaxy.eu/; accessed on 20 May 2024) [36]. The mitochondrial genome was visualized using the Chloroplot online tool (https://irscope.shinyapps.io/Chloroplot/; accessed on 13 August 2025) [37].

2.2.2. NCBI Database Sequence Acquisition

Mitogenomes of Takydromus species were retrieved from the NCBI database using PhyloSuite v1.2.3 [38] with the following search query: Takydromus[ORGN] AND (mitochondrial[TITL] OR mitochondrion[TITL]) AND 10000:40000[SLEN]. As of 6 June 2025, this initial search yielded 19 records. Each of these records was manually examined in the GenBank database (https://www.ncbi.nlm.nih.gov/genbank/; accessed on 6 August 2025) [39] to remove duplicate NCBI reference sequences. Finally, 14 mitogenome sequences were retained for subsequent analysis (Table 1). These selected sequences were downloaded via PhyloSuite v1.2.3 [38].

2.2.3. Analysis of Mitogenomic Characteristics

(1)
Repetitive Sequence Analysis
Simple sequence repeats (SSRs) were detected across all mitogenomes using Krait v1.3.3 [40] with the following thresholds: mononucleotide repeats ≥ 10, dinucleotide repeats ≥ 5, trinucleotide repeats ≥ 4, and tetra-, penta-, and hexanucleotide repeats ≥ 3. Tandem repeats (TDRs) were identified using the Tandem Repeats Finder online tool v4.09 (https://tandem.bu.edu/trf/trf.html; accessed on 12 August 2025) [41] with parameters set to: 2 7 7 80 10 50 500.
(2)
Nucleotide Composition and Divergence Analysis
Multiple sequence alignment of rRNAs (and whole mitogenomes) was performed using MAFFT v7.505 [42] under the “--auto” strategy with default settings. PCGs were aligned using MACSE v2.06 [43], which preserves reading frames and accounts for potential sequencing errors or frameshifts. Nucleotide composition and variable sites were calculated using MEGA v11.0.9 [44]. Nucleotide composition skewness was assessed using the formulas: AT-skew = (A − T)/(A + T) and GC-skew = (G − C)/(G + C) [45]. Conserved regions within alignments were identified with trimAl v1.2rev57 [46], and nucleotide diversity (Pi) was estimated using DnaSP v6.12.03 [47]. Data visualization was performed using the CNSknowall online platform (https://cnsknowall.com/; accessed on 12 August 2025).
(3)
Protein-Coding Gene Analysis
Relative synonymous codon usage (RSCU) value for PCGs was computed with MEGA v11.0.9 [44]. An RSCU value > 1, <1, and =1 indicates a positive codon usage bias, a negative bias, and no bias, respectively. Start and stop codon usage was compared within and across species. After removing stop codons from the aligned PCG sequences, non-synonymous (Ka) and synonymous (Ks) substitution rates were estimated with DnaSP v6.12.03 [47]. The Ka/Ks ratio was used to assess selective pressure, where ratio > 1, <1, and =1 suggests positive selection, purifying selection, and neutral evolution, respectively. Data were visualized via the CNSknowall online platform (https://cnsknowall.com/; accessed on 28 August 2025).
(4)
Genetic Distance Analysis
Aligned sequences were trimmed using trimAl v1.2rev57 [46] with the “-automated1” option. The 13 PCGs and two rRNAs were concatenated into a supermatrix using PhyloSuite v1.2.3 [38]. The genetic distances among Takydromus species for the concatenated 13PCGs + 2rRNAs were computed under the Tamura 3-parameter model [48] in MEGA v11.0.9 [44], with parallel analyses performed on the COX1 gene, a commonly used DNA barcoding marker, using the Kimura 2-parameter model [49]. Results were visualized using the CNSknowall platform (https://cnsknowall.com/; accessed on 10 August 2025).

2.2.4. Molecular Phylogenetic Analysis

The phylogenetic relationships within the genus Takydromus were reconstructed based on 15 mitogenomes (Table 1). Gallotia atlantica (Squamata: Lacertidae), following previous studies [20,33], was selected as the outgroup.
PCGs and rRNAs were aligned separately using MACSE v2.06 [43] and MAFFT v7.505 [42], under default parameters. The resulting alignments were trimmed using trimAl v1.2rev57 [46] with the “-automated1” option. All trimmed sequences were concatenated into a supermatrix comprising 13 PCGs and 2 rRNAs using PhyloSuite v1.2.3 [38,50].
Phylogenetic reconstruction was performed using both maximum likelihood (ML) and Bayesian inference (BI) methods based on the concatenated supermatrix. The best-fit partitioning scheme and substitution models (edge-linked) were determined using ModelFinder v2.2.0 [51] under the Bayesian Information Criterion, which was applied as the default selection criterion in the PhyloSuite workflow. These results are summarized in Supplementary Table S1. ML analysis was conducted with IQ-TREE v2.2.0 [52] under the edge-linked-proportional partition model with separate substitution models and separate rates across sites (the default configuration in PhyloSuite), along with 100,000 ultrafast bootstrap replicates [53]. BI was performed using MrBayes v3.2.7a [54] under the selected partition model, running two independent Markov chain Monte Carlo analyses for 10 million generations, sampling every 1000 generations. The first 25% of samples were discarded as burn-in.
Phylogenetic trees were visualized using FigTree v1.4.4 (http://tree.bio.ed.ac.uk/software/figtree/; accessed on 10 September 2025).

3. Results

3.1. Characteristics of the Mitogenome of Takydromus intermedius

The complete mitogenome of T. intermedius measured 18,770 bp (Figure 1A). It contained 13 PCGs, two rRNAs (rrnL and rrnS), 22 tRNAs, and one control region (D-loop). Among these, the ND6 gene and eight tRNA genes (trnQ, trnA, trnN, trnC, trnY, trnS(uga), trnE, and trnP) were encoded on the light strand, while the remaining genes were located on the heavy strand (Figure 1A).
The overall nucleotide composition was as follows: T = 28.61%, C = 26.95%, A = 30.79%, and G = 13.64%, with an A + T content of 59.40%. The AT-skew and GC-skew values were 0.04 and −0.33, respectively, indicating a slight predominance of A over T and a strong bias toward C over G. The complete mitochondrial genome sequence has been deposited in GenBank under accession number PX101964.
The 13 PCGs in the mitochondrial genome of T. intermedius had a total length of 11,365 bp, encompassing 3792 codons—including 6 types of stop codons (TAG, TAA, TA, T, AGG, AGA)—which encoded 3779 amino acids belonging to 20 different types. Each amino acid was encoded by at least 2 and up to 6 synonymous codons.
A total of 60 sense codons were identified, among which 30 exhibited an RSCU value greater than 1. Notably, the codons UCA (Ser), CCA (Pro), and CGA (Arg) showed the strongest preference, with RSCU values of 2.28, 2.23, and 2.08, respectively (Figure 1B), indicating a higher usage frequency compared to their synonymous alternatives. Furthermore, codon usage in T. intermedius mitogenome displayed a strong bias against guanine (G) at the third codon position (Figure 1B).

3.2. Nucleotide Composition and Skewness of the Mitogenomes Within the Genus Takydromus

The average size of the 15 analyzed Takydromus mitogenomes was 17,945 bp, ranging from 17,224 bp (T. kuehnei, MZ435950) to 18,943 bp (T. sexlineatus, KF425529). This considerable variation in genome size was primarily attributed to differences in the size of the D-loop region, which ranged from 1813 to 3562 bp.
TDRs were identified in all 15 mitochondrial genomes, with each containing 1–3 repeat units located exclusively within the D-loop region (Supplementary Table S2). These repeats exhibited considerable variation in unit length and copy number. The shortest repeat unit (20 bp) was found in T. amurensis (KU641018 and PQ177902), while the longest (111 bp) occurred in T. kuehnei (MZ435950). The shortest tandem repeat fragment spanned 40 bp, formed by two tandem copies of a 20 bp unit in T. amurensis (KU641018 and PQ177902), whereas the longest reached 2083 bp, consisting of 30 tandem repeats of a 68 bp unit in T. sexlineatus (KF425529). Additionally, SSRs were also detected in these mitogenomes (Supplementary Table S3), except in T. amurensis (KU641018, PQ177901, PQ177902). These microsatellites also varied in composition and length: mononucleotide repeats were rare, limited to poly-C tracts with 10–11 repeats; dinucleotide repeats consisted solely of AT/TA motifs repeated 5–8 times; trinucleotide repeats included TTA, CTT, and AAC motifs with 4–5 repeats; tetranucleotide repeats comprised CAAC, TTTG, TTAT, and ATTT, primarily with 3 repeats (occasionally 5); a single pentanucleotide motif (ATTTT) was found with 3 repeats; no hexanucleotide repeats were identified.
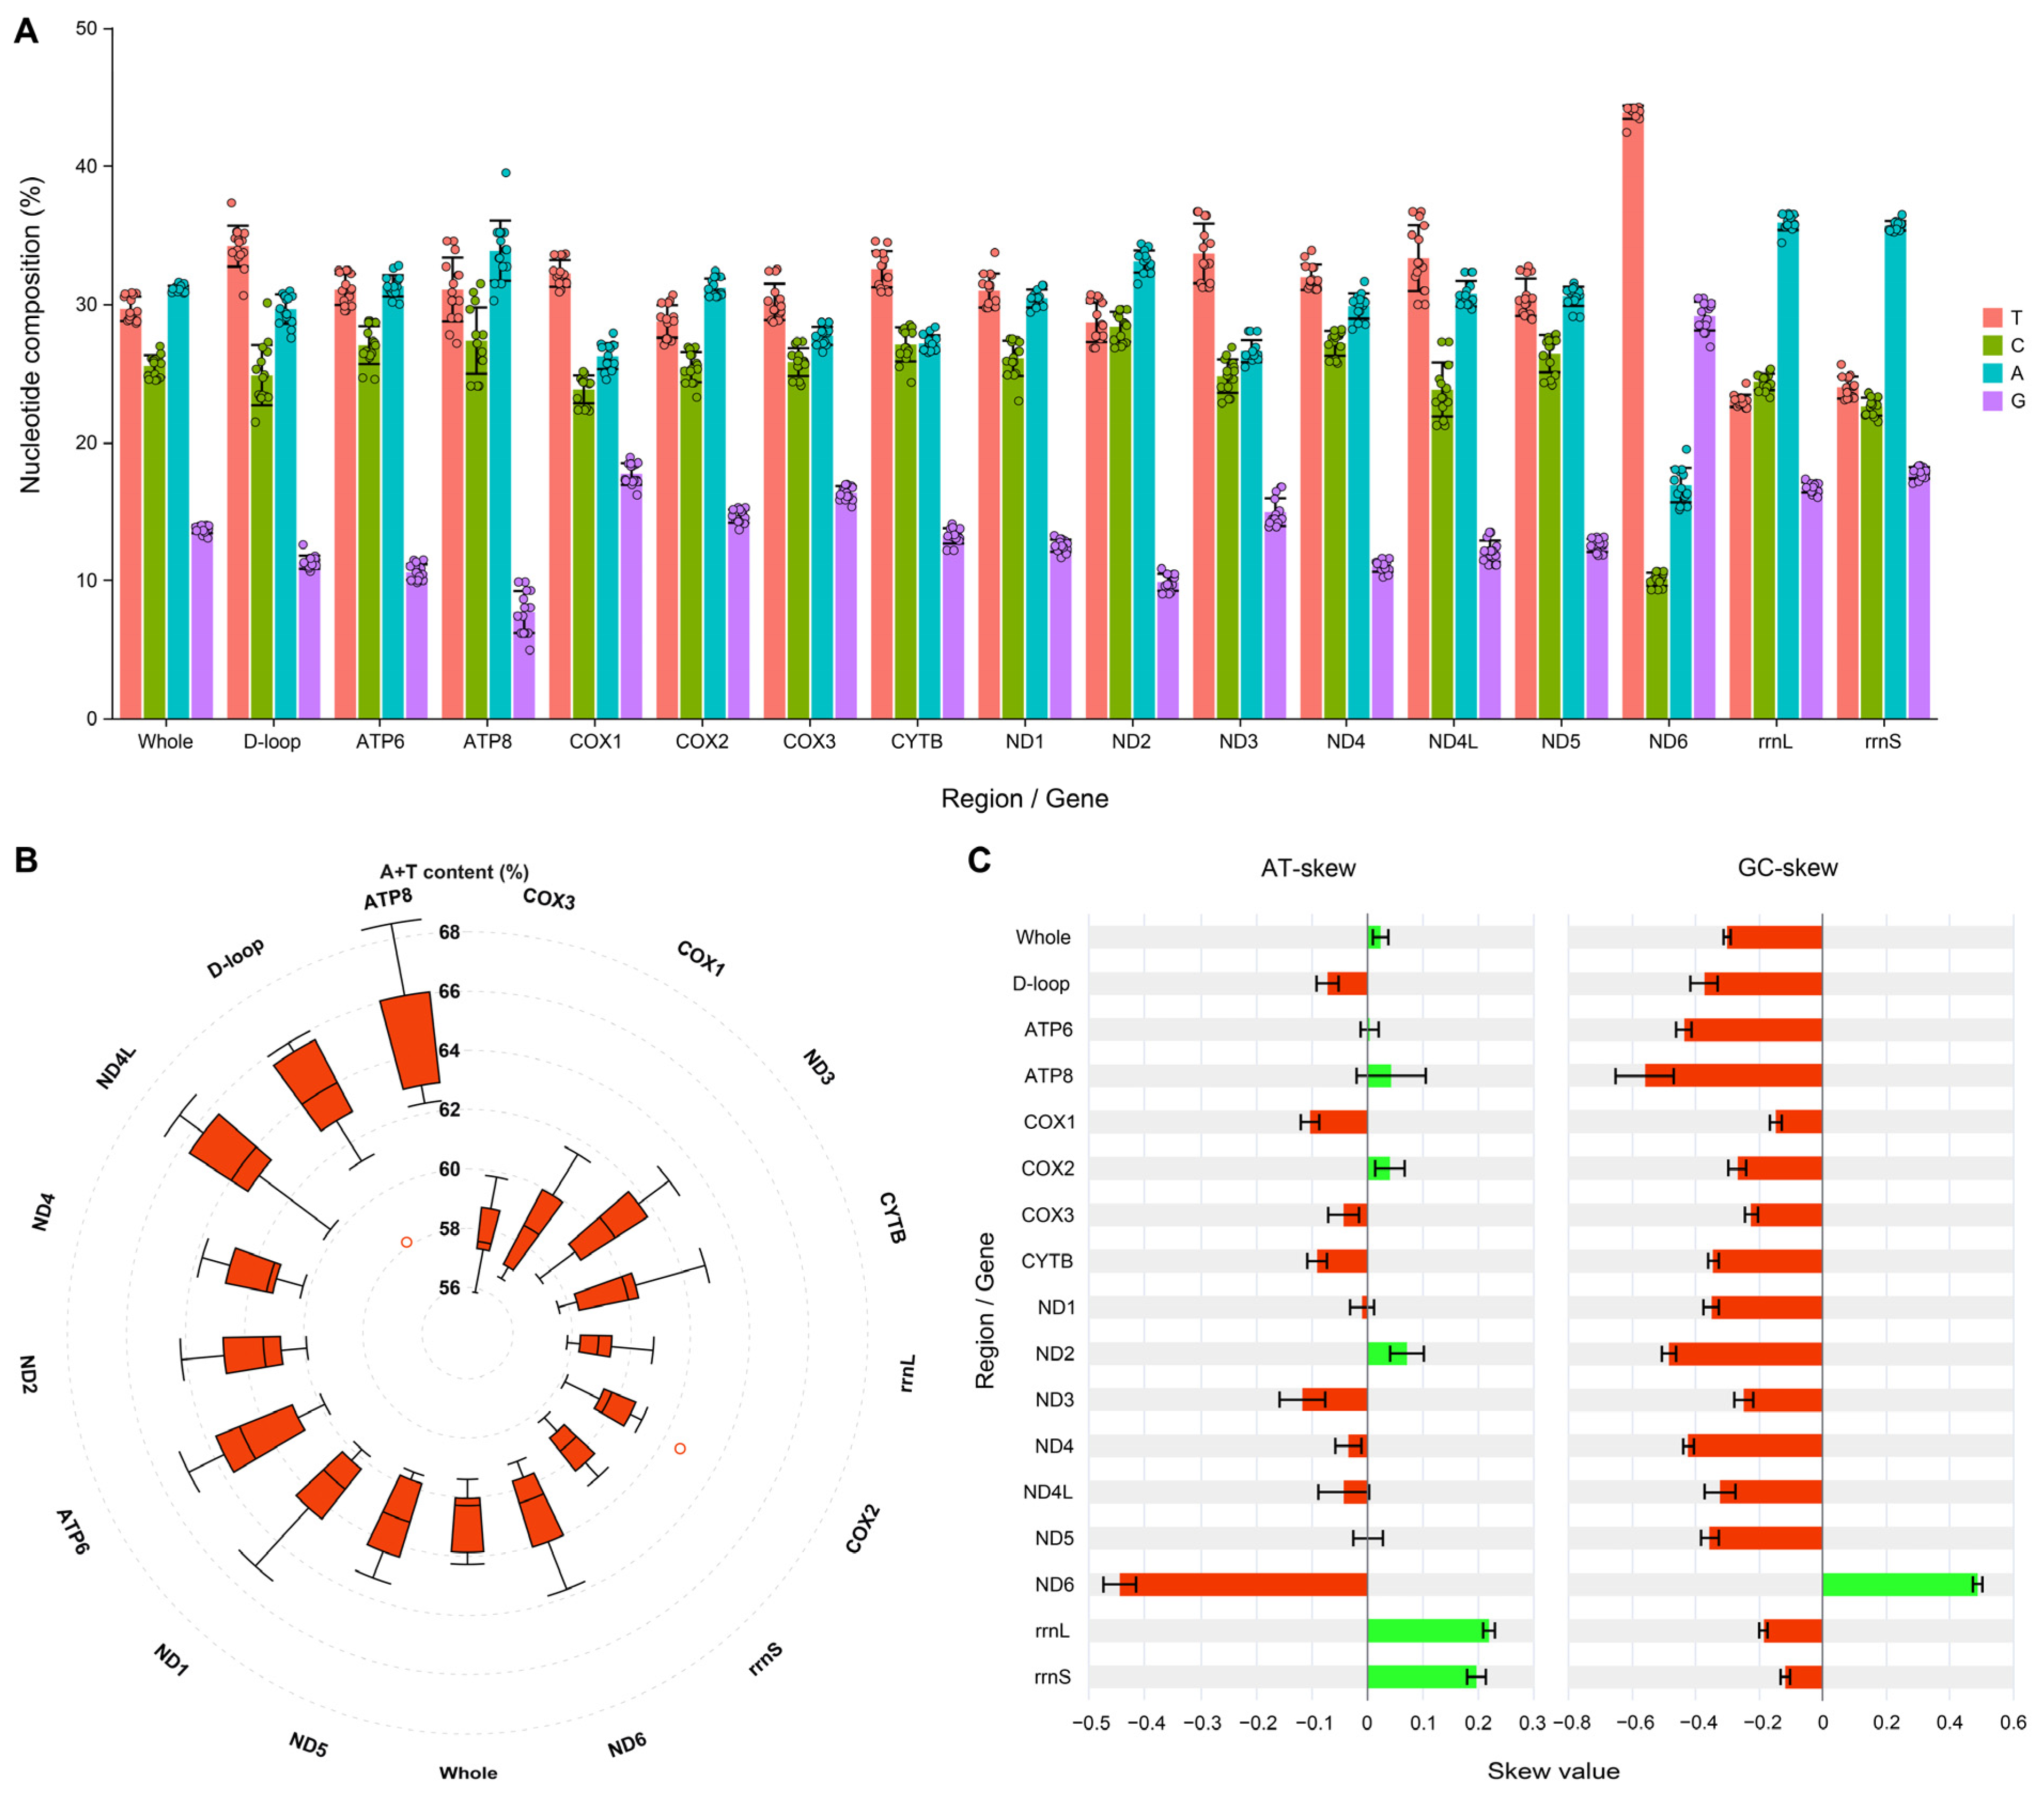
Regarding nucleotide composition (Figure 2A), the overall averages for the 15 mitochondrial genomes were: A = 31.12%, T = 29.67%, C = 25.51%, and G = 13.69%. Although composition varied among genomic regions, guanine (G) was consistently the least abundant nucleotide. Notably, the ND6 gene—encoded on the light strand—exhibited a distinct composition: T = 43.89%, G = 29.13%, A = 16.89%, and C = 10.08%, with cytosine (C) being the least frequent, consistent with its unique encoding strand.
The A + T content across all regions exceeded 50% (Figure 2B). The complete mitogenomes had an average A + T content of 60.78%. Among functional regions, ATP8 showed the highest A + T content (mean = 64.94%, median = 66.05%), while COX3 had the lowest (mean = 57.87%, median = 57.58%), indicating overall AT-richness throughout the genome.
Analysis of nucleotide skewness (Figure 2C) revealed slightly positive AT-skew and distinctly negative GC-skew values for the complete mitogenomes, indicating a compositional bias toward adenine (A) and cytosine (C). The ND6 gene again was exceptional, displaying positive GC-skew and strongly negative AT-skew, consistent with its light-strand encoding characteristics.

3.3. Nucleotide Variation and Diversity of the Mitogenomes Within the Genus Takydromus

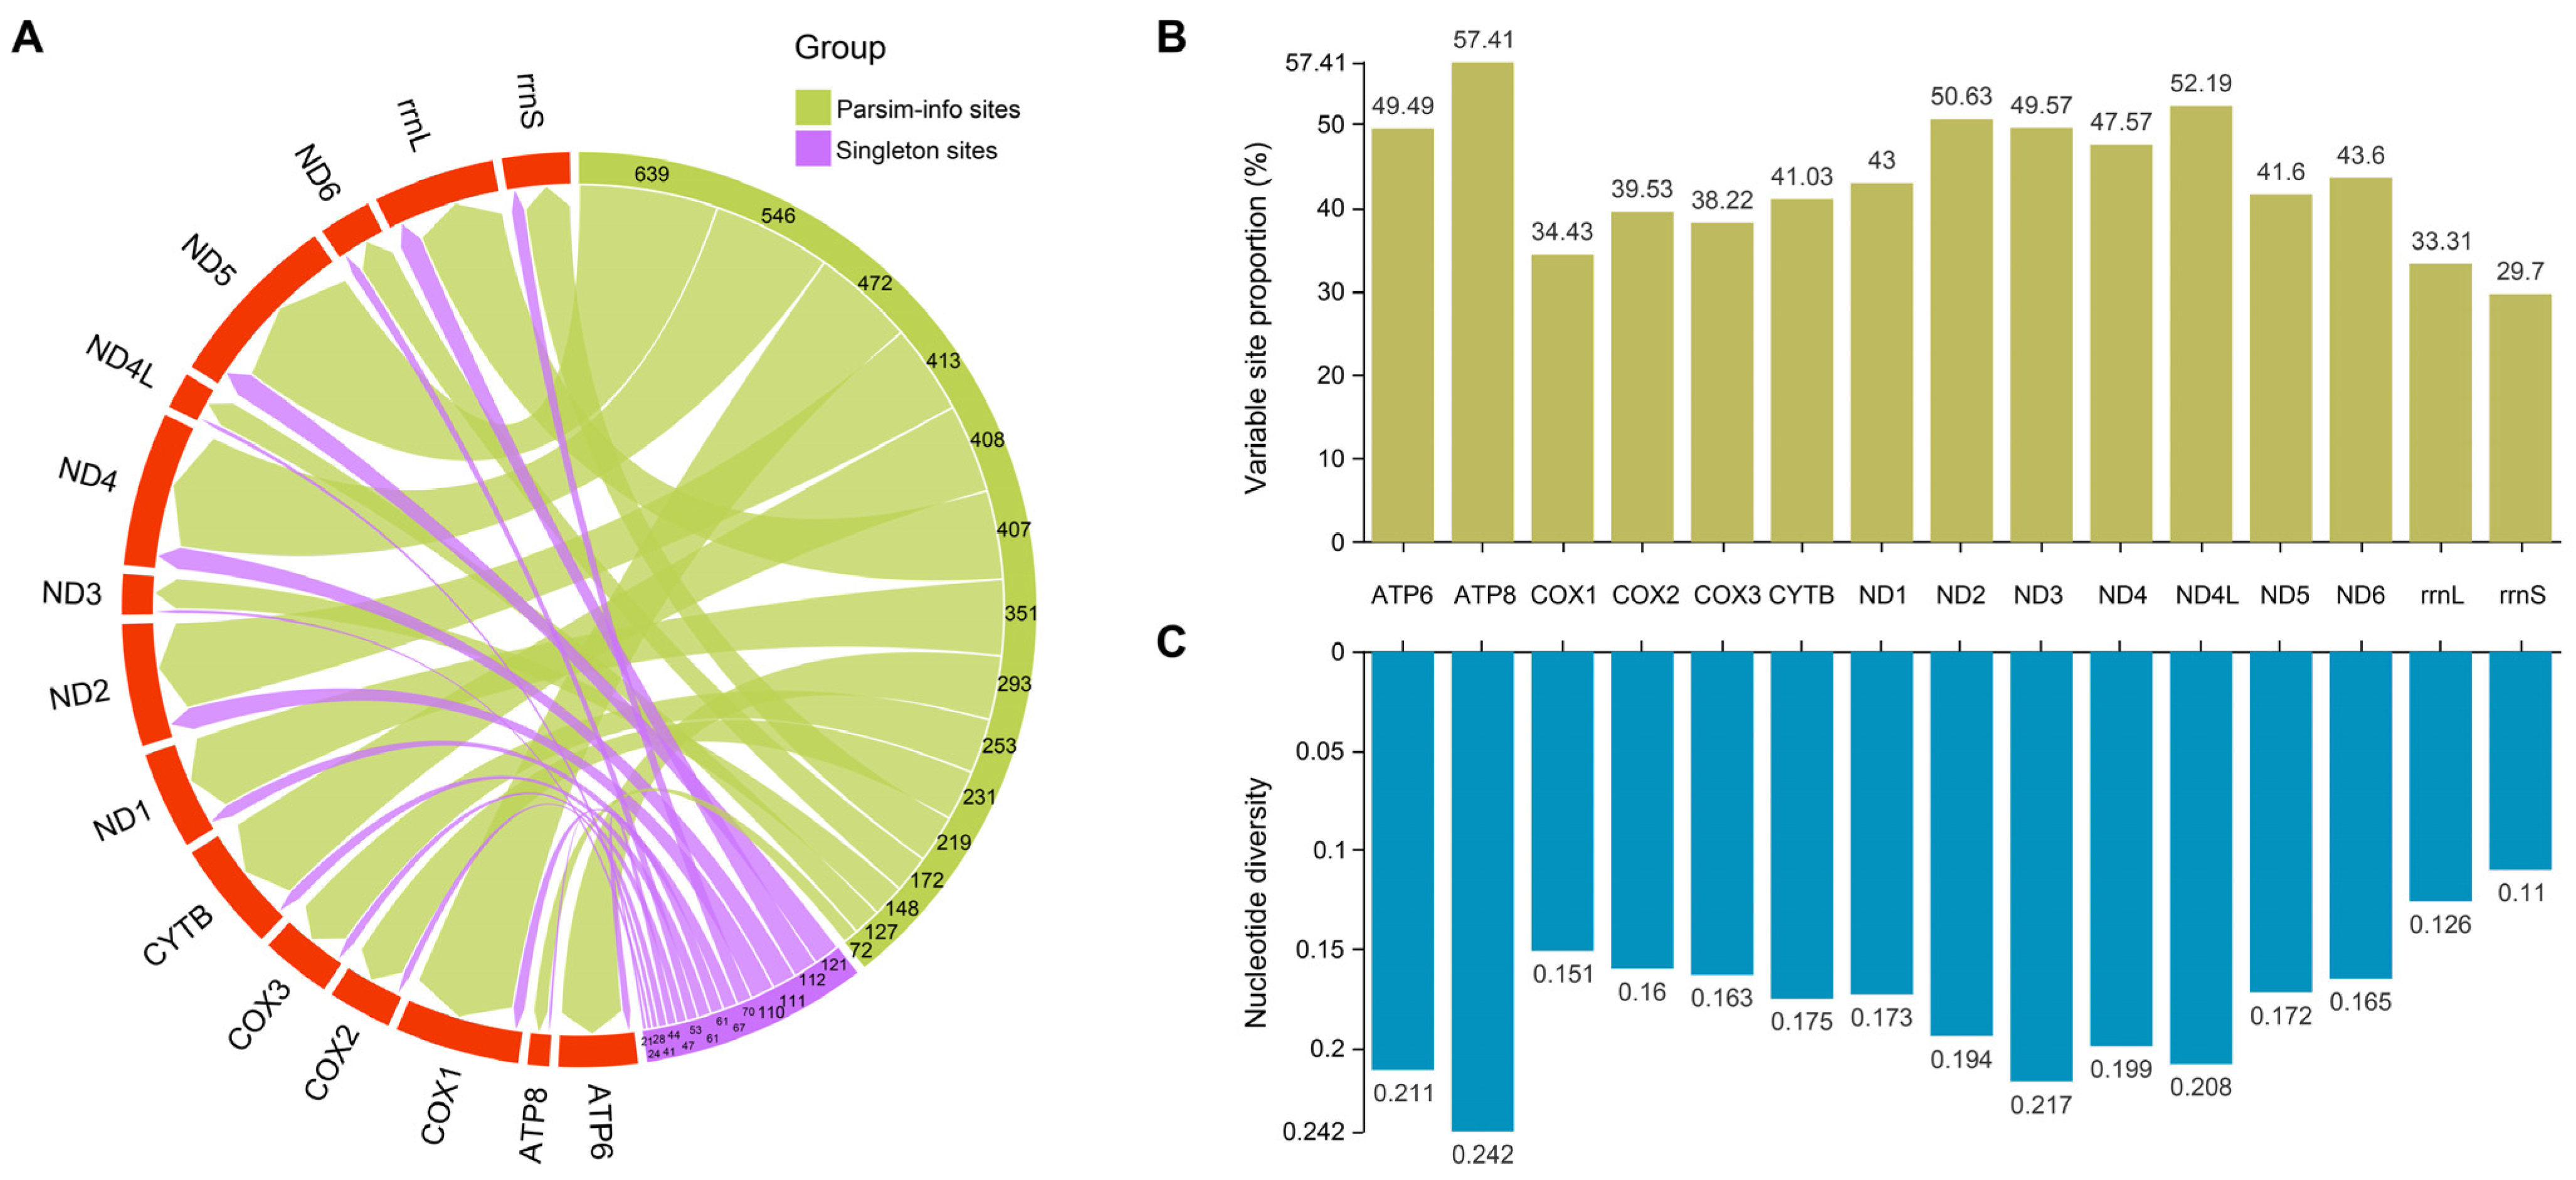
A comparative analysis of the PCGs and rRNAs from 15 Takydromus mitogenomes revealed extensive nucleotide variation. Across all genes, parsimony-informative sites predominated, while singleton variable sites were less frequent.
Comparative analysis of the 15 Takydromus mitogenomes revealed abundant variable sites across all PCGs and rRNAs, with parsimony-informative sites predominating over singleton variable sites. Among these genes, ND5 contained the highest number of variable sites (760), while ATP8 had the fewest (93) (Figure 3A). However, after normalizing for gene length, ATP8 exhibited the highest proportion of variable sites (57.41%), whereas ND5 ranked in the middle (41.60%) (Figure 3B). Notably, nucleotide diversity was also highest in ATP8 (Pi = 0.242) and ATP6 (Pi = 0.211), but lowest in rrnS (Pi = 0.110) and rrnL (Pi = 0.126) (Figure 3C).

3.4. Evolutionary Pressure and Codon Usage of Mitochondrial Protein-Coding Genes Within the Genus Takydromus

The Ka/Ks ratios for all PCGs in the Takydromus mitochondrial genome were found to be less than 1 (Figure 4A), indicating strong purifying selection across these genes. ATP8 showed the highest Ka/Ks ratio (mean = 0.192, median = 0.182), followed by ND6, ND2, ND3, ATP6, and ND4 (mean values of 0.140, 0.114, 0.098, 0.094, and 0.088, respectively). In contrast, genes of complex IV (COX1, COX2, and COX3) and complex III (CYTB) exhibited relatively low Ka/Ks ratios, suggesting particularly strong functional constraints.
We also analyzed the start and stop codon usage across the 15 Takydromus mitogenomes. Notably, we identified and corrected several misannotated stop codons in the original NCBI records through manual re-annotation (Table 2). As summarized in Figure 4B, three types of start codons were used: ATG, ATA, and GTG. ATG was the most common, present in all PCGs. GTG was occasionally used in ATP6, COX1, and ND5, while ATA was only observed in ND5. Stop codon usage was more diverse, with six types identified. Incomplete stop codon T and the complete stop codon TAA were the most frequent. The codons AGG (found in COX1 and ND6), TA (in ATP6), AGA (in ND6), and TAG (in CYTB and ND1) were less common.

3.5. Interspecific Genetic Distances Within the Genus Takydromus

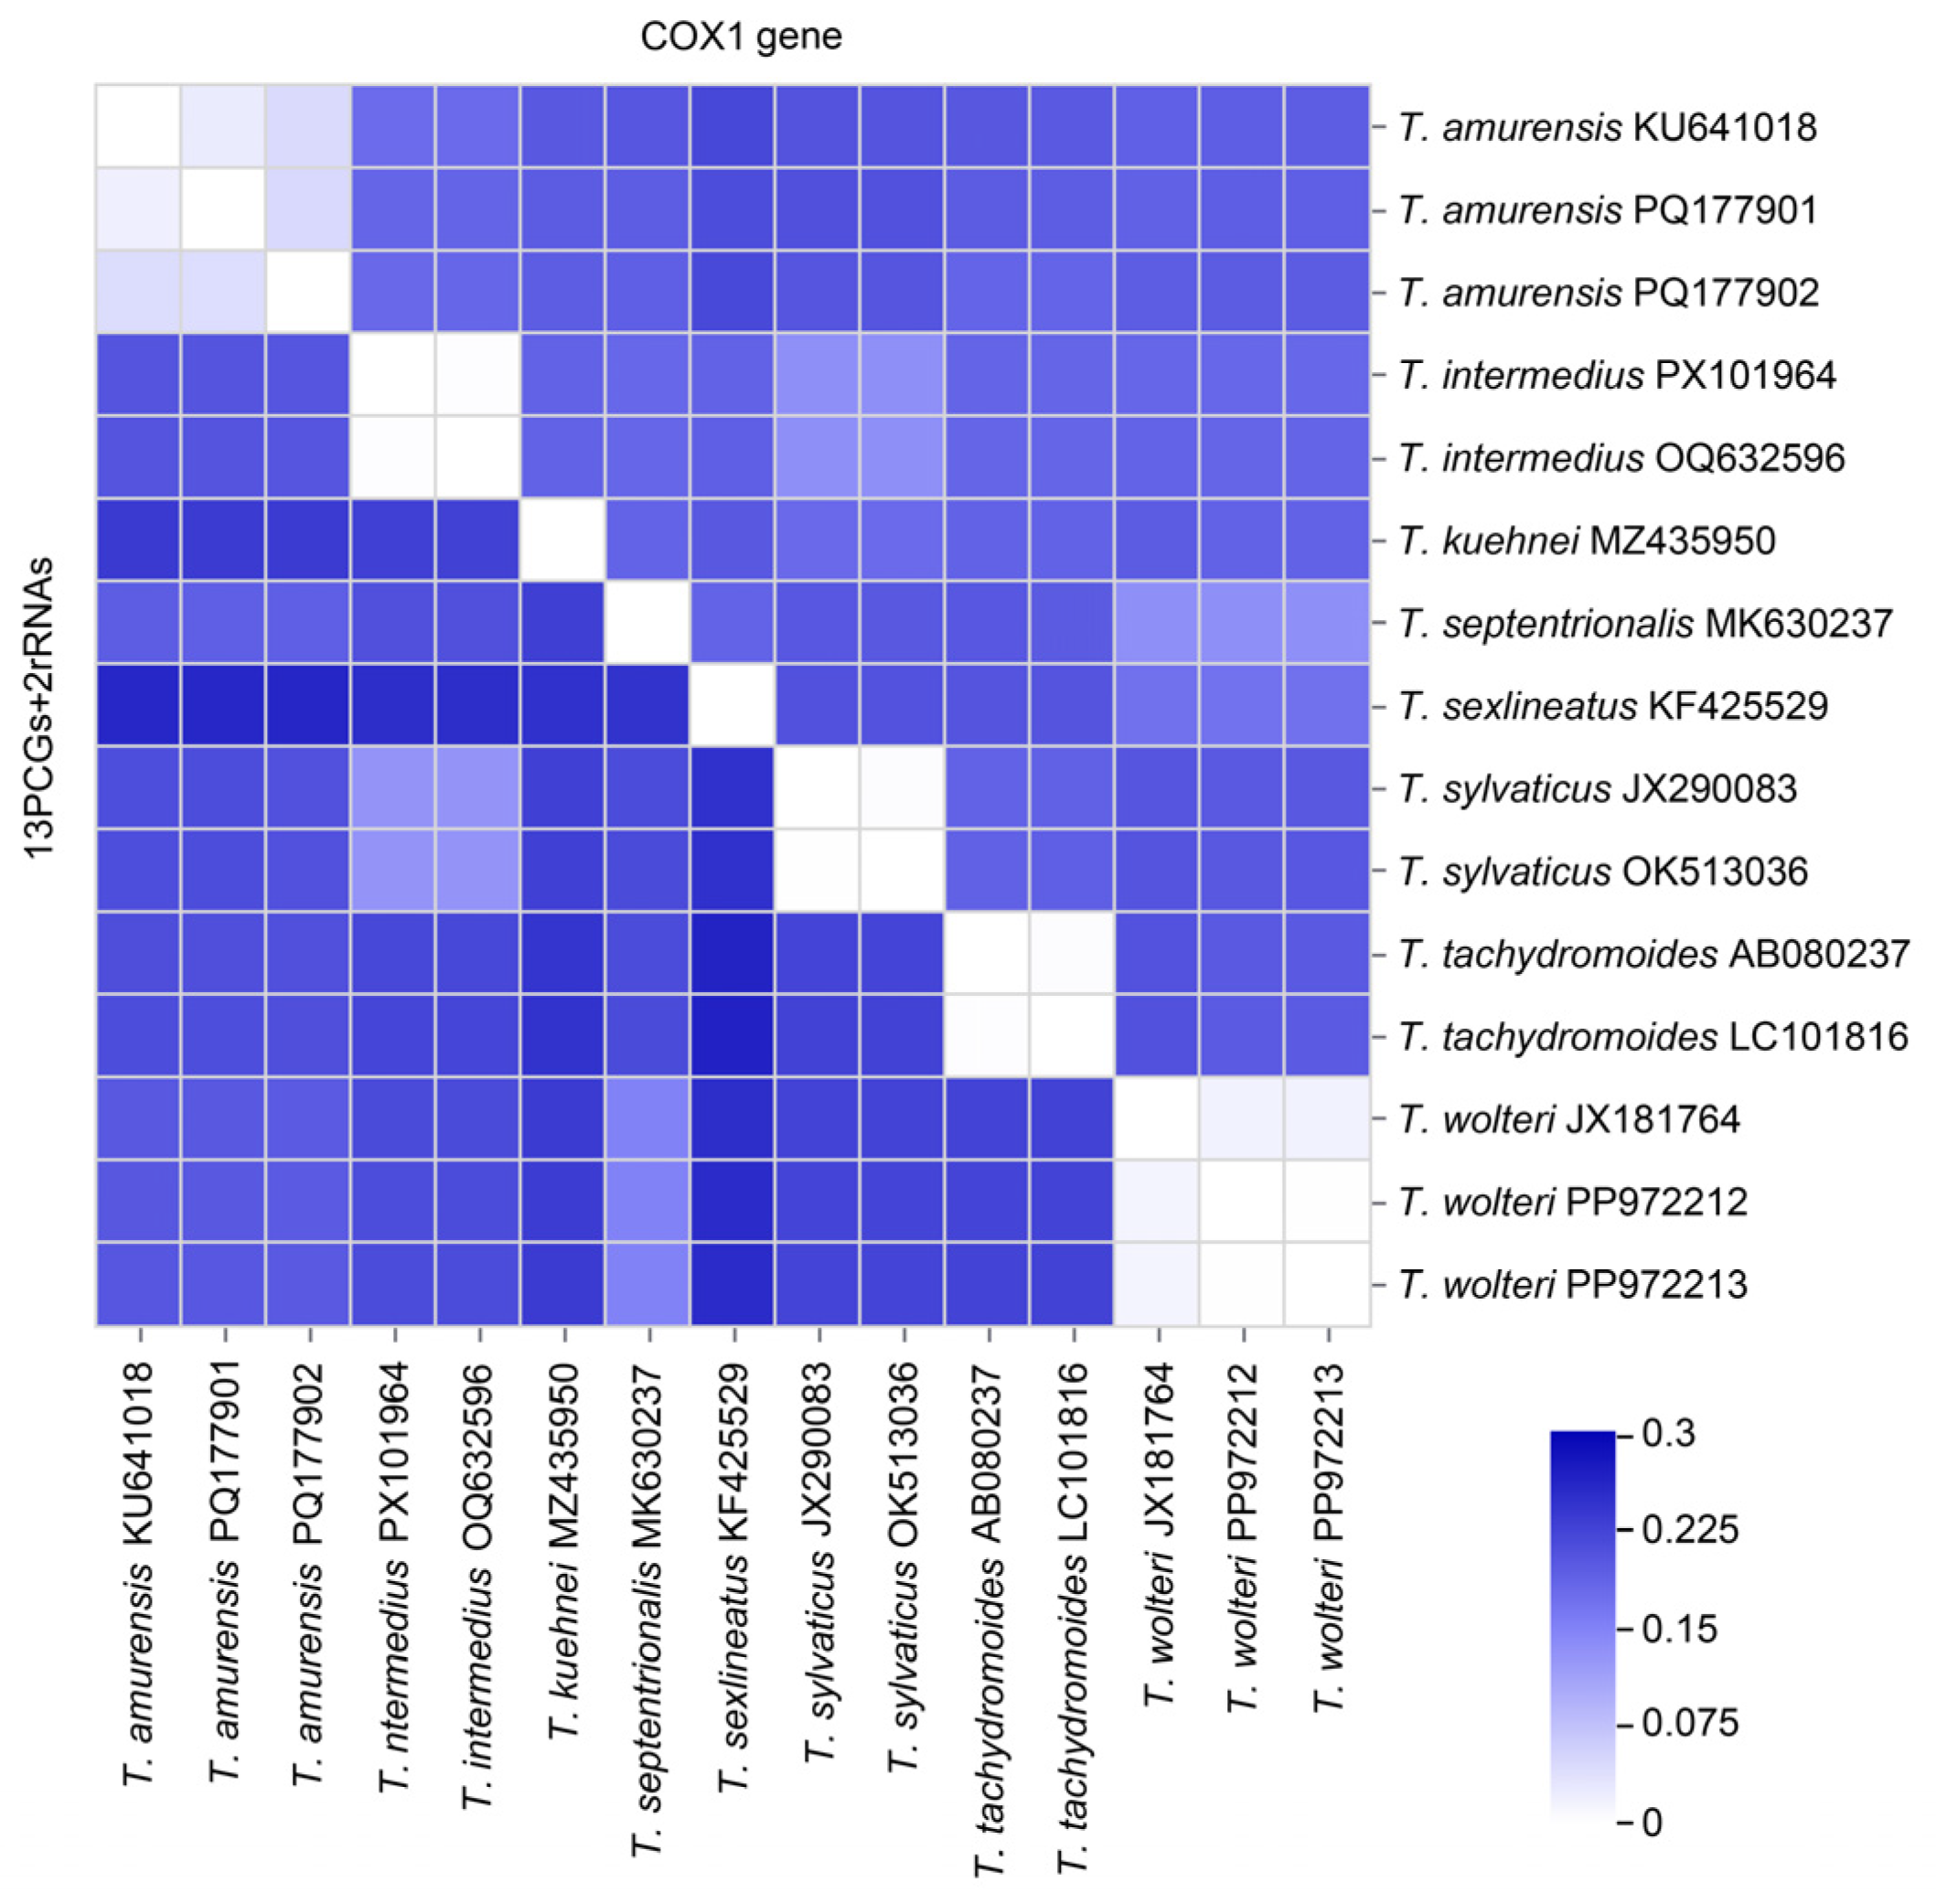
Intraspecific genetic distances, based on two molecular markers (concatenated 13 PCGs + 2 rRNAs and single COX1 gene), were uniformly low (Figure 5), confirming species-level monophyly. The distances were 0.002 (concatenated) and 0.002 (COX1) between the two T. intermedius samples; 0.001 and 0.004 for T. sylvaticus; and 0.003 and 0.004 for T. tachydromoides. Among the three T. amurensis samples, distances ranged from 0.020 to 0.042 (concatenated) and 0.024 to 0.045 (COX1), while for T. wolteri, they ranged from 0.002 to 0.014 and 0.001 to 0.016, respectively.
In contrast, interspecific distances were markedly higher. The largest divergence was observed between T. amurensis and T. sexlineatus, with distances of 0.259–0.261 (concatenated) and 0.213–0.220 (COX1), indicating significant genetic differentiation. Notably, the distance between T. septentrionalis and T. wolteri was 0.149–0.150 (concatenated) and 0.133–0.134 (COX1), suggesting a close phylogenetic relationship. However, these values still exceed typical intraspecific variation, supporting their status as distinct yet closely related species. Furthermore, the distance between T. intermedius and T. sylvaticus was relatively low (0.128–0.129 for concatenated sequences and 0.133 for COX1), which is substantially smaller than other interspecific comparisons and warrants further investigation into their phylogenetic relationship.

3.6. Phylogenetic Relationships Within the Genus Takydromus

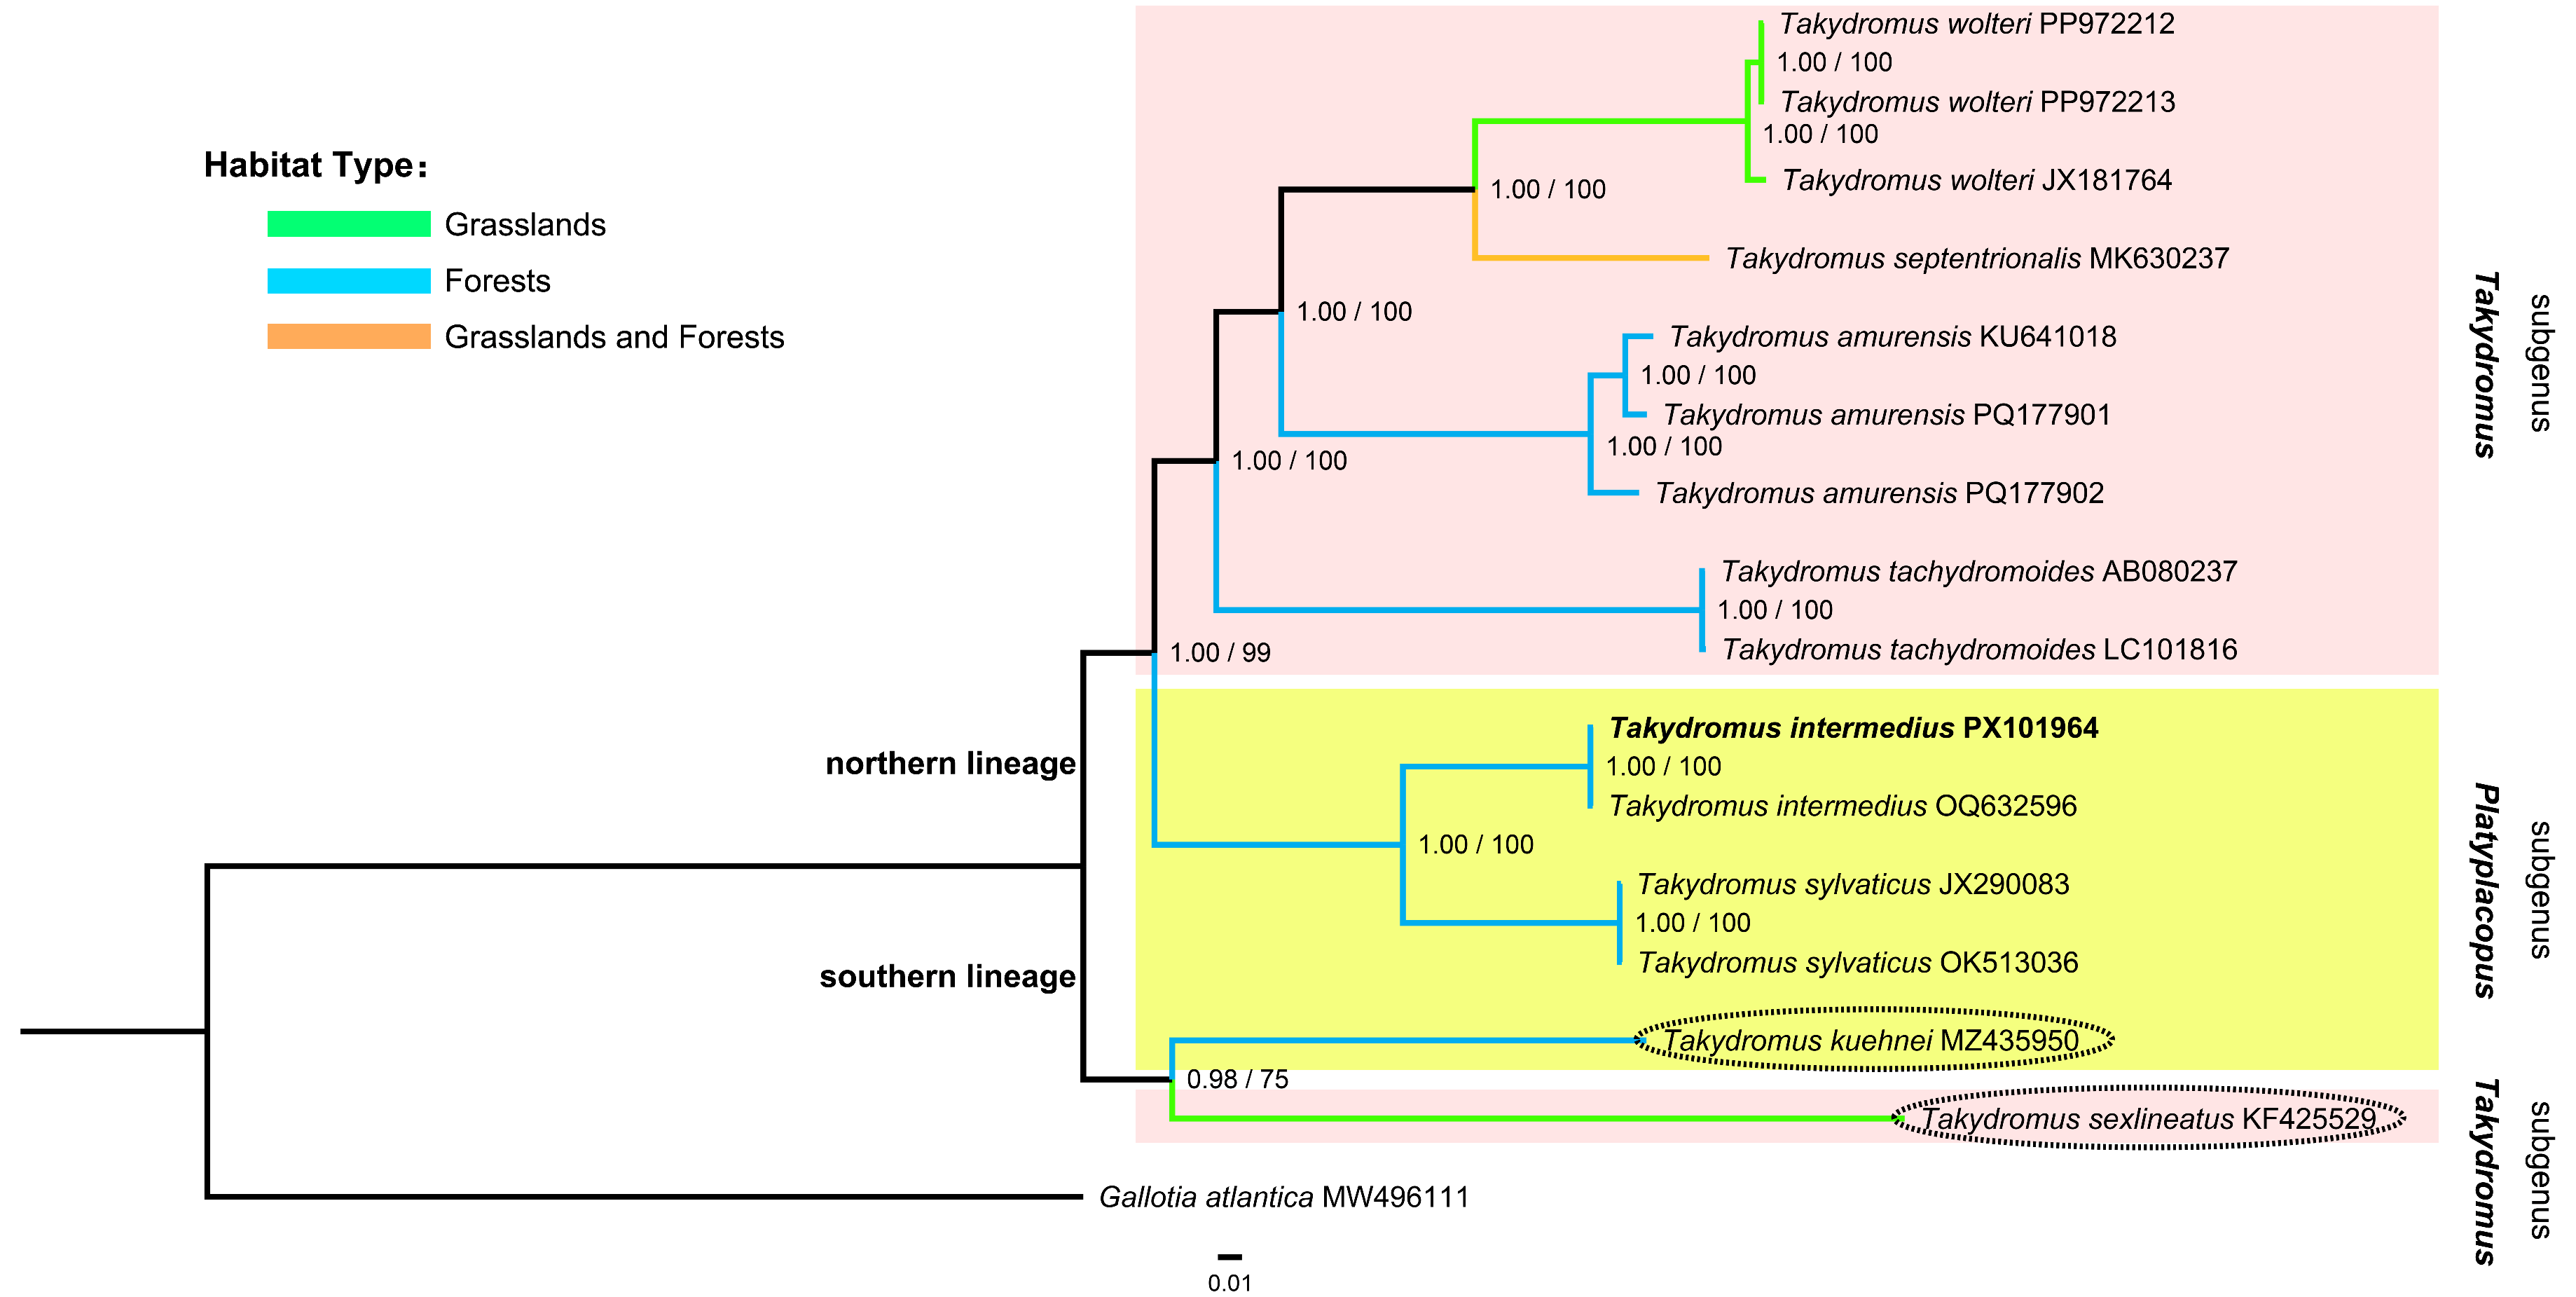
Phylogenetic trees reconstructed from the concatenated dataset of 13 mitochondrial PCGs and two rRNAs using both ML and BI methods yielded well-resolved relationships among the studied taxa of Takydromus (Figure 6).
The phylogenetic reconstruction divided the genus Takydromus into two major lineages, which, based on their geographic distributions (Supplementary Table S4), are termed the northern lineage and the southern lineage. Within the genus, all major branches received maximum nodal support (BI BPP ≥ 0.98, ML UBP ≥ 75), indicating a robust phylogenetic framework. All specimens clustered according to their respective species, each forming a distinct, highly supported monophyletic group. Specifically, the three samples of T. wolteri (PP972212, PP972213, and JX181764) and the three samples of T. amurensis (KU641018, PQ177901, and PQ177902) formed fully supported species-specific clades (BI BPP = 1.00, ML UBP = 100). Similarly, all samples of T. tachydromoides, T. intermedius, and T. sylvaticus also formed their own strongly supported monophyletic clades (BI BPP = 1.00, ML UBP = 100).
The phylogeny further revealed several close interspecific relationships. Takydromus intermedius and T. sylvaticus were identified as sister species. Takydromus septentrionalis was most closely related to T. wolteri, while T. sexlineaus showed the closest phylogenetic affinity to T. kuehnei.

4. Discussion

4.1. Structural and Evolutionary Features of the Takydromus Mitogenome

In this study, we sequenced, assembled, and annotated the complete mitogenome of T. intermedius and conducted a comparative genomic analysis across eight congeneric species. The resulting mitogenome exhibits a typical circular structure, encoding the standard 13 PCGs, 22 tRNAs, and two rRNAs [18,55]. Its gene order is consistent with the ancestral pattern, namely, the vertebrate-typical gene arrangement [56], which is shared by all other Takydromus species [26,27,28,31] and most other vertebrate species [57,58]. The overall A + T content (59.40%) is comparable to that of other Takydromus species [26,27,28,29,31,32], reinforcing the AT-rich nature of lacertid mitogenomes [59,60]. The negative GC-skew (−0.33) and slightly positive AT-skew (+0.04) are consistent with strand-specific mutation pressures commonly observed in reptilian mitogenomes [55].
Notably, the D-loop region exhibited the greatest length variation among the species studied. This high level of variation is driven by differences in tandem repeat units, which are common in vertebrate control regions [61,62,63] and may originate from DNA slippage events in the absence of strong selective pressure [64,65]. Additionally, the presence of species-specific repeat motifs suggests that these structural variations could serve as useful markers for population-level studies or species identification within the genus.

4.2. Nucleotide Diversity and Selective Pressure of the Takydromus Mitogenome

Our analysis revealed marked differences in the percentage of variable sites and nucleotide diversity among mitochondrial genes. The ATP8 gene exhibited the highest proportion of variable sites (57.41%) and the highest Pi value (0.242), consistent with patterns observed in other iguanian lizards [23], suggesting its potential utility as a molecular marker for resolving recent divergence events within Takydromus. In contrast, the rRNA genes (rrnS and rrnL) showed the lowest levels of variability, indicating strong evolutionary conservation and their suitability as markers for phylogenetic reconstruction at higher taxonomic levels.
All PCGs displayed Ka/Ks ratios significantly less than 1, with the lowest values observed for COX1, COX2, COX3, and CYTB. This indicates that these genes have undergone strong purifying selection, particularly those encoding subunits of complex IV and complex III, a pattern also documented in other vertebrates [66] and invertebrates [67]. These findings are consistent with the crucial functional roles of mitochondrial proteins in oxidative phosphorylation and cellular energy metabolism.

4.3. Phylogenetic Relationships Among the Takydromus Lizards

The phylogenetic tree reconstructed in this study from the concatenated mitochondrial dataset (13 PCGs + 2 rRNAs) received strong nodal support, providing robust molecular evidence for clarifying the phylogenetic relationships among several species within the genus Takydromus. Following Arnold’s taxonomic framework, the genus Takydromus has been historically divided into two subgenera: Takydromus and Platyplacopus [13]. However, our phylogenetic results clearly demonstrate that neither of these two putative subgenera constitutes a monophyletic group. This finding is particularly significant given that phylogenetic analysis confirmed the strong monophyly of the genus Takydromus as a whole, which is consistent with previous studies based on single mitochondrial genes [1,14,16]. All examined individuals clustered according to their respective species, supporting species-level monophyly and aligning with the traditional morphology-based classification framework. However, species previously assigned to the genus PlatyplacopusP. intermedius (=T. intermedius), P. sylvaticus (=T. sylvaticus), and P. kuehnei (=T. kuehnei)—did not form a distinct clade in our analysis. Instead, they were interspersed among other Takydromus species. This result does not support the subgeneric classification proposed by Arnold [2] and further corroborates that Platyplacopus should not be recognized as a distinct subgenus or genus [15,16].
Our phylogenetic inferences are in agreement with several earlier mitogenomic studies, including the ML tree based on complete mitogenomes [31] and the ML and BI trees based on 13 PCGs and 2 rRNAs [19,33]. This consistency indicates that the concatenated dataset used here contains sufficient phylogenetic signal and interspecific variation to resolve evolutionary relationships among closely related species.
Collectively, these findings underscore the utility of complete mitochondrial genome data in resolving shallow phylogenetic nodes where single-gene markers typically yield low support values [6,15,16].

4.4. Taxonomic Implications for the Genus Takydromus

The genetic distances observed between species are largely consistent with current taxonomic boundaries. However, the relatively small distance between T. intermedius and T. sylvaticus (0.128–0.133) warrants further investigation. While these values exceed typical intraspecific variation, they are lower than those between other recognized species pairs. This may indicate incomplete lineage sorting, recent hybridization, or the need for integrative taxonomic reassessment using nuclear markers and morphological data.

4.5. Ecological Implications for the Genus Takydromus

Sheremetyeva and Popova reconstructed a phylogenetic network for the genus Takydromus using the mitochondrial CYTB gene as a single marker, clearly delineating 18 species into four distinct phylogenetic lineages: the southern grassland, northern grassland, southern forest, and northern forest lineages [9]. In the present study, although the analysis included a relatively limited number of Takydromus species, the same four major lineages were unambiguously recovered. Notably, the fundamental divergence between forest and grassland ecotypes, as well as the pronounced north–south biogeographical differentiation among the eight included species (Figure 6), was clearly reproduced. The high degree of consistency between these results, derived from fundamentally distinct datasets, substantially reinforces the robustness of this evolutionary framework.
Sheremetyeva and Popova proposed that ecological speciation—specifically the forest-versus-grassland differentiation—constitutes a major driver of speciation within the genus Takydromus [9]. Our results provide direct evidence in support of this hypothesis. The phylogenetic tree reconstructed from the concatenated 13 PCGs + 2 rRNAs demonstrates a strong correlation between habitat type and phylogenetic grouping, rather than a random distribution. This indicates that the phylogenetic relationships among species—i.e., which taxa are most closely related—are largely determined by their ecological niches (forest-dwelling versus grassland-adapted). The confirmation of this pattern using a more comprehensive mitochondrial genomic dataset effectively minimizes the potential for stochastic error or bias inherent in single-gene analyses, thereby providing stronger support for the conclusion that ecological speciation has been a key process in the diversification of Takydromus.
Consequently, our study represents not merely a replication of prior findings, but a significant independent validation and refinement of the existing evolutionary hypothesis.

4.6. Limitations

This study has a significant limitation regarding the comprehensiveness of species sampling. Although the genus Takydromus comprises 25 recognized species, our phylogenetic analysis based on mitochondrial genomes only includes eight of these. This sampling constraint arises from the current scarcity of available data in public databases, which inevitably impacts the comprehensiveness of the phylogenetic framework. Consequently, the inferred relationships may not fully reflect the evolutionary history of this genus, potentially omitting key lineages and underestimating its overall diversity.
Although the primary aim of this study was not to reconstruct a comprehensive genus-level phylogeny, the present results provide a solid foundation for future investigations into the phylogenetic relationships within Takydromus. Future efforts should therefore prioritize sequencing the mitochondrial genomes of underrepresented species. Such data will be crucial for constructing a more robust and complete phylogeny, thereby pinpointing the precise phylogenetic positions of individual lineages and their sister-group relationships within Takydromus.

5. Conclusions

This study presents the complete mitogenome of T. intermedius and conducts a comparative mitogenomic analysis within the genus Takydromus. The results reveal that the mitogenomes of Takydromus lizards are highly conserved in structure and gene order, consistent with the ancestral vertebrate pattern. Notable variations were observed in the length and repetitive motifs of the control region, which may serve as potential molecular markers for population genetics. Evolutionary analyses indicated that all protein-coding genes are under strong purifying selection, with ATP8 exhibiting the highest nucleotide diversity, suggesting its utility for resolving recent divergences. Phylogenetic reconstructions strongly support the monophyly of Takydromus but do not validate the previously proposed subgeneric classification based on Platyplacopus. Furthermore, our independent analysis, based on more comprehensive mitochondrial genome data, provides robust support for the hypothesis of ecological speciation (forest-grassland divergence) and the primary phylogenetic division (southern–northern lineages) within the genus Takydromus. However, the limited taxonomic sampling highlights the need for additional mitogenomic data to fully elucidate the evolutionary history of this genus. This study provides essential genomic resources and insights into the molecular evolution and phylogeny of Takydromus.

Supplementary Materials

The following supporting information can be downloaded at https://www.mdpi.com/article/10.3390/d17120813/s1, Supplementary Table S1: The partition and best-fit partition models used in this study; Supplementary Table S2: Details on the distribution of tandem repeats (TDRs) in the mitogenomes of Takydromus species; Supplementary Table S3: Details on the distribution of simple sequence repeats (SSRs) in the mitogenomes of Takydromus species; Supplementary Table S4: Comparative table of the geographic distributions of Takydromus species.

Author Contributions

Conceptualization, J.L.; methodology, J.Y.; software, J.Y.; validation, W.W.; formal analysis, J.Y.; resources, M.C., B.S. and D.Y.; data curation, J.Y.; writing—original draft preparation, J.Y.; writing—review and editing, M.C., B.S., D.Y., W.W. and J.L.; visualization, J.Y.; supervision, J.L.; project administration, W.W.; funding acquisition, J.L. All authors have read and agreed to the published version of the manuscript.

Funding

This research was funded by Sichuan Meigu Dafengding National Nature Reserve Administration (grant number N5134362024000114) and Chengdu Research Base of Giant Panda Breeding (grant number 2024CPB-B06).

Institutional Review Board Statement

Ethical review and approval were waived for this study due to the material used in this study was a road-killed lizard specimen.

Informed Consent Statement

Not applicable.

Data Availability Statement

The complete mitogenomes of T. intermedius was submitted to NCBI database (GenBank accession number PX101964).

Acknowledgments

We acknowledge the CNSknowall platform (https://cnsknowall.com) for providing data visualization services.

Conflicts of Interest

The authors declare no conflicts of interest.

References

  1. Ota, H.; Honda, M.; Chen, S.-L.; Hikida, T.; Panha, S.; Oh, H.-S.; Matsui, M. Phylogenetic relationships, taxonomy, character evolution and biogeography of the lacertid lizards of the genus Takydromus (Reptilia: Squamata): A molecular perspective. Biol. J. Linn. Soc. 2002, 76, 493–509. [Google Scholar] [CrossRef]
  2. Arnold, E.N. Interrelationships and evolution of the east Asian grass lizards, Takydromus (Squamata: Lacertidae). Zool. J. Linn. Soc. 1997, 119, 267–296. [Google Scholar] [CrossRef]
  3. Arnold, E.N.; Arribas, O.; Carranza, S. Systematics of the Palaearctic and Oriental lizard tribe Lacertini (Squamata: Lacertidae: Lacertinae), with descriptions of eight new genera. Zootaxa 2007, 1430, 1–86. [Google Scholar] [CrossRef]
  4. Uetz, P.; Freed, P.; Aguilar, R.; Reyes, F.; Kudera, J.; Hošek, J. The Reptile Database. Available online: http://www.reptile-database.org (accessed on 20 September 2025).
  5. Wang, Y.-Y.; Gong, S.-P.; Liu, P.; Wang, X. A new species of the genus Takydromus (Squamata: Lacertidae) from Tianjingshan Forestry Station, northern Guangdong, China. Zootaxa 2017, 4338, 441–458. [Google Scholar] [CrossRef]
  6. Wang, J.; Lyu, Z.-T.; Yang, C.-Y.; Li, Y.-L.; Wang, Y.-Y. A new species of the genus Takydromus (Squamata, Lacertidae) from southwestern Guangdong, China. Zookeys 2019, 871, 119–139. [Google Scholar] [CrossRef] [PubMed]
  7. Guo, K.; Hu, Y.-H.; Chen, J.; Zhong, J.; Ji, X. A new species of the genus Takydromus (Squamata: Lacertidae) from northeastern Guangxi, China. Animals 2024, 14, 1402. [Google Scholar] [CrossRef] [PubMed]
  8. Cai, B.; Ji, X.; Wang, Y.; Rao, D.; Huang, S.; Wang, Y.; Song, Z.; Guo, X.; Jiang, J. An annotated list of lizards (Sauria: Squamata) recorded from the People’s Republic of China. Asian Herpetol. Res. 2022, 13, 64–74. [Google Scholar]
  9. Sheremetyeva, I.N.; Popova, A.A. Evolution of East Asian forest kingdom has increased the number of Asian grass lizard (Takydromus) species. Biol. Bull. 2025, 52, 188. [Google Scholar] [CrossRef]
  10. Guo, K.; Zhong, J.; Xie, F.; Zhu, L.; Qu, Y.-F.; Ji, X. Climate warming will increase chances of hybridization and introgression between two Takydromus lizards (Lacertidae). Ecol. Evol. 2021, 11, 8573–8584. [Google Scholar] [CrossRef]
  11. Boulenger, G.A. A revision of the lizards of the genus Tachydromus. Mem. Asiat. Soc. Bengal 1917, 5, 207–235. [Google Scholar]
  12. Pope, C.H. The Reptiles of China: Turtles, Crocodilians, Snakes, Lizards; American Museum of Natural History: New York, NY, USA, 1935. [Google Scholar]
  13. Arnold, E.N. Towards a phylogeny and biogeography of the Lacertidae: Relationships within an Old-World family of lizards derived from morphology. Bull. Br. Mus. Nat. Hist. (Zool.) 1989, 55, 209–257. [Google Scholar]
  14. Lin, S.-M.; Chen, C.A.; Lue, K.-Y. Molecular phylogeny and biogeography of the grass lizards genus Takydromus (Reptilia: Lacertidae) of East Asia. Mol. Phylogenetics Evol. 2002, 22, 276–288. [Google Scholar] [CrossRef] [PubMed]
  15. Tang, X.; Chen, Q. On the taxonomic status of Platyplacous sylvaticus based on 12S rRNA gene. Acta Zootaxonomica Sin. 2006, 31, 475–479. [Google Scholar]
  16. Chen, Q.-L.; Tang, X.-S.; Yao, W.-J.; Lu, S.-Q. Bioinformatics analysis the complete sequences of cytochrome b of Takydromus sylvaticus and modeling the tertiary structure of encoded protein. Int. J. Biol. Sci. 2009, 5, 596–602. [Google Scholar] [CrossRef] [PubMed]
  17. Yu, J.; Yu, X.; Bi, W.; Li, Z.; Zhou, Y.; Ma, R.; Feng, F.; Huang, C.; Gu, J.; Wu, W.; et al. Mitogenome diversity and phylogeny of Felidae species. Diversity 2025, 17, 634. [Google Scholar] [CrossRef]
  18. Lavrov, D.V.; Pett, W. Animal mitochondrial DNA as we do not know it: Mt-genome organization and evolution in nonbilaterian lineages. Genome Biol. Evol. 2016, 8, 2896–2913. [Google Scholar] [CrossRef]
  19. Zhang, X.; Chen, J.; Luo, H.-Y.; Chen, X.; Zhong, J.; Ji, X. Climate-driven mitochondrial selection in lacertid lizards. Ecol. Evol. 2024, 14, e11176. [Google Scholar] [CrossRef]
  20. Zhan, L.; Chen, Y.; He, J.; Guo, Z.; Wu, L.; Storey, K.B.; Zhang, J.; Yu, D. The phylogenetic relationships of major lizard families using mitochondrial genomes and selection pressure analyses in Anguimorpha. Int. J. Mol. Sci. 2024, 25, 8464. [Google Scholar] [CrossRef]
  21. Cai, Y.; Yan, J.; Xu, X.-F.; Lin, Z.-H.; Ji, X. Mitochondrial DNA phylogeography reveals a west–east division of the northern grass lizard (Takydromus septentrionalis) endemic to China. J. Zool. Syst. Evol. Res. 2012, 50, 137–144. [Google Scholar] [CrossRef]
  22. Sheremetyeva, I.N.; Popova, A.A.; Gorobeyko, U.V.; Maslova, I.V. Genetic variability of the mtDNA cytochrome b gene of the Amur grass lizard Takydromus amurensis Peters, 1881 in the south of the Russian Far East. Russ. J. Genet. 2025, 61, 966–973. [Google Scholar] [CrossRef]
  23. Liu, J.; Yu, J.; Zhou, M.; Yang, J. Complete mitochondrial genome of Japalura flaviceps: Deep insights into the phylogeny and gene rearrangements of Agamidae species. Int. J. Biol. Macromol. 2019, 125, 423–431. [Google Scholar] [CrossRef]
  24. Lan, G.; Yu, J.; Liu, J.; Zhang, Y.; Ma, R.; Zhou, Y.; Zhu, B.; Wei, W.; Liu, J.; Qi, G. Complete mitochondrial genome and phylogenetic analysis of Tarsiger indicus (Aves: Passeriformes: Muscicapidae). Genes 2024, 15, 90. [Google Scholar] [CrossRef] [PubMed]
  25. Kumazawa, Y. Mitochondrial genomes from major lizard families suggest their phylogenetic relationships and ancient radiations. Gene 2007, 388, 19–26. [Google Scholar] [CrossRef] [PubMed]
  26. Yu, D.-N.; Ji, X. The complete mitochondrial genome of Takydromus wolteri (Squamata: Lacertidae). Mitochondrial DNA 2013, 24, 3–5. [Google Scholar] [CrossRef] [PubMed]
  27. Tang, X.; Chen, J.; Huang, S. Mitochondrial genome of the Chung-an ground lizard Takydromus sylvaticus (Reptilia: Lacertidae). Mitochondrial DNA 2014, 25, 319–320. [Google Scholar] [CrossRef]
  28. Qin, P.; Zeng, D.; Hou, L.; Yang, X.; Qin, X. Complete mitochondrial genome of Takydromus sexlineatus (Squamata, Lacertidae). Mitochondrial DNA 2015, 26, 465–466. [Google Scholar] [CrossRef]
  29. Ma, W.; Liu, H.; Zhao, W.; Liu, P. The complete mitochondrial genome of Takydromus amurensis (Squamata: Lacertidae). Mitochondrial DNA Part B 2016, 1, 214–215. [Google Scholar] [CrossRef]
  30. Sun, Y.; Kurisaki, M.; Hashiguchi, Y.; Kumazawa, Y. Variation and evolution of polyadenylation profiles in sauropsid mitochondrial mRNAs as deduced from the high-throughput RNA sequencing. BMC Genom. 2017, 18, 665. [Google Scholar] [CrossRef]
  31. Hu, J.; Peng, L.; Tang, X.; Huang, S. The complete mitochondrial genome of Takydromus septentrionalis (Reptilia: Lacertidae). Mitochondrial DNA Part B 2019, 4, 2193–2194. [Google Scholar] [CrossRef]
  32. Wu, L.-X.; Luo, K.-N.; Ding, G.-H. Complete mitochondrial genome of Takydromus kuehnei (Squamata: Takydromus) and its phylogenetic analysis. Mitochondrial DNA Part B 2022, 7, 764–765. [Google Scholar] [CrossRef]
  33. Kirchhof, S.; Lyra, M.L.; Rodríguez, A.; Ineich, I.; Müller, J.; Rödel, M.-O.; Trape, J.-F.; Vences, M.; Boissinot, S. Mitogenome analyses elucidate the evolutionary relationships of a probable Eocene wet tropics relic in the xerophilic lizard genus Acanthodactylus. Sci. Rep. 2021, 11, 4858. [Google Scholar] [CrossRef]
  34. Liu, J.; Yu, J.; Yu, X.; Bi, W.; Yang, H.; Xue, F.; Zhang, G.; Zhang, J.; Yi, D.; Ma, R.; et al. Complete mitogenomes of ticks Ixodes acutitarsus and Ixodes ovatus parasitizing giant panda: Deep insights into the comparative mitogenomic and phylogenetic relationship of Ixodidae species. Genes 2022, 13, 2049. [Google Scholar] [CrossRef]
  35. Zhu, T.; Sato, Y.; Sado, T.; Miya, M.; Iwasaki, W. MitoFish, MitoAnnotator, and MiFish Pipeline: Updates in 10 Years. Mol. Biol. Evol. 2023, 40, msad035. [Google Scholar] [CrossRef] [PubMed]
  36. Donath, A.; Jühling, F.; Al-Arab, M.; Bernhart, S.H.; Reinhardt, F.; Stadler, P.F.; Middendorf, M.; Bernt, M. Improved annotation of protein-coding genes boundaries in metazoan mitochondrial genomes. Nucleic Acids Res. 2019, 47, 10543–10552. [Google Scholar] [CrossRef] [PubMed]
  37. Zheng, S.; Poczai, P.; Hyvönen, J.; Tang, J.; Amiryousefi, A. Chloroplot: An online program for the versatile plotting of organelle genomes. Front. Genet. 2020, 11, 576124. [Google Scholar] [CrossRef]
  38. Xiang, C.; Gao, F.; Jakovlić, I.; Lei, H.; Hu, Y.; Zhang, H.; Zou, H.; Wang, G.; Zhang, D. Using PhyloSuite for molecular phylogeny and tree-based analyses. iMeta 2023, 2, e87. [Google Scholar] [CrossRef]
  39. Benson, D.A.; Cavanaugh, M.; Clark, K.; Karsch-Mizrachi, I.; Lipman, D.J.; Ostell, J.; Sayers, E.W. GenBank. Nucleic Acids Res. 2013, 41, D36–D42. [Google Scholar] [CrossRef]
  40. Du, L.; Zhang, C.; Liu, Q.; Zhang, X.; Yue, B. Krait: An ultrafast tool for genome-wide survey of microsatellites and primer design. Bioinformatics 2018, 34, 681–683. [Google Scholar] [CrossRef]
  41. Benson, G. Tandem repeats finder: A program to analyze DNA sequences. Nucleic Acids Res. 1999, 27, 573–580. [Google Scholar] [CrossRef]
  42. Katoh, K.; Rozewicki, J.; Yamada, K.D. MAFFT online service: Multiple sequence alignment, interactive sequence choice and visualization. Brief. Bioinform. 2019, 20, 1160–1166. [Google Scholar] [CrossRef]
  43. Ranwez, V.; Douzery, E.J.P.; Cambon, C.; Chantret, N.; Delsuc, F. MACSE v2: Toolkit for the alignment of coding sequences accounting for frameshifts and stop codons. Mol. Biol. Evol. 2018, 35, 2582–2584. [Google Scholar] [CrossRef]
  44. Tamura, K.; Stecher, G.; Kumar, S. MEGA11: Molecular Evolutionary Genetics Analysis version 11. Mol. Biol. Evol. 2021, 38, 3022–3027. [Google Scholar] [CrossRef]
  45. Perna, N.T.; Kocher, T.D. Patterns of nucleotide composition at fourfold degenerate sites of animal mitochondrial genomes. J. Mol. Evol. 1995, 41, 353–358. [Google Scholar] [CrossRef]
  46. Capella-Gutiérrez, S.; Silla-Martínez, J.M.; Gabaldón, T. trimAl: A tool for automated alignment trimming in large-scale phylogenetic analyses. Bioinformatics 2009, 25, 1972–1973. [Google Scholar] [CrossRef] [PubMed]
  47. Rozas, J.; Ferrer-Mata, A.; Sánchez-DelBarrio, J.C.; Guirao-Rico, S.; Librado, P.; Ramos-Onsins, S.E.; Sánchez-Gracia, A. DnaSP 6: DNA sequence polymorphism analysis of large data sets. Mol. Biol. Evol. 2017, 34, 3299–3302. [Google Scholar] [CrossRef] [PubMed]
  48. Tamura, K. Estimation of the number of nucleotide substitutions when there are strong transition-transversion and G+C-content biases. Mol. Biol. Evol. 1992, 9, 678–687. [Google Scholar] [PubMed]
  49. Kimura, M. A simple method for estimating evolutionary rates of base substitutions through comparative studies of nucleotide sequences. J. Mol. Evol. 1980, 16, 111–120. [Google Scholar] [CrossRef]
  50. Zhang, D.; Gao, F.; Jakovlić, I.; Zou, H.; Zhang, J.; Li, W.X.; Wang, G.T. PhyloSuite: An integrated and scalable desktop platform for streamlined molecular sequence data management and evolutionary phylogenetics studies. Mol. Ecol. Resour. 2020, 20, 348–355. [Google Scholar] [CrossRef]
  51. Kalyaanamoorthy, S.; Minh, B.Q.; Wong, T.K.F.; von Haeseler, A.; Jermiin, L.S. ModelFinder: Fast model selection for accurate phylogenetic estimates. Nat. Methods 2017, 14, 587–589. [Google Scholar] [CrossRef]
  52. Minh, B.Q.; Schmidt, H.A.; Chernomor, O.; Schrempf, D.; Woodhams, M.D.; von Haeseler, A.; Lanfear, R. IQ-TREE 2: New models and efficient methods for phylogenetic inference in the genomic era. Mol. Biol. Evol. 2020, 37, 1530–1534. [Google Scholar] [CrossRef]
  53. Minh, B.Q.; Nguyen, M.A.T.; von Haeseler, A. Ultrafast approximation for phylogenetic bootstrap. Mol. Biol. Evol. 2013, 30, 1188–1195. [Google Scholar] [CrossRef] [PubMed]
  54. Ronquist, F.; Teslenko, M.; van der Mark, P.; Ayres, D.L.; Darling, A.; Höhna, S.; Larget, B.; Liu, L.; Suchard, M.A.; Huelsenbeck, J.P. MrBayes 3.2: Efficient Bayesian phylogenetic inference and model choice across a large model space. Syst. Biol. 2012, 61, 539–542. [Google Scholar] [CrossRef] [PubMed]
  55. Bernt, M.; Braband, A.; Schierwater, B.; Stadler, P.F. Genetic aspects of mitochondrial genome evolution. Mol. Phylogenetics Evol. 2013, 69, 328–338. [Google Scholar] [CrossRef] [PubMed]
  56. Boore, J.L. Animal mitochondrial genomes. Nucleic Acids Res. 1999, 27, 1767–1780. [Google Scholar] [CrossRef]
  57. Kumazawa, Y.; Miura, S.; Yamada, C.; Hashiguchi, Y. Gene rearrangements in gekkonid mitochondrial genomes with shuffling, loss, and reassignment of tRNA genes. BMC Genom. 2014, 15, 930. [Google Scholar] [CrossRef]
  58. Lü, Z.; Zhu, K.; Jiang, H.; Lu, X.; Liu, B.; Ye, Y.; Jiang, L.; Liu, L.; Gong, L. Complete mitochondrial genome of Ophichthus brevicaudatus reveals novel gene order and phylogenetic relationships of Anguilliformes. Int. J. Biol. Macromol. 2019, 135, 609–618. [Google Scholar] [CrossRef]
  59. Podnar, M.; Pinsker, W.; Mayer, W. Complete mitochondrial genomes of three lizard species and the systematic position of the Lacertidae (Squamata). J. Zool. Syst. Evol. Res. 2009, 47, 35–41. [Google Scholar] [CrossRef]
  60. Murtskhvaladze, M.; Tarkhnishvili, D.; Anderson, C.L.; Kotorashvili, A. Phylogeny of caucasian rock lizards (Darevskia) and other true lizards based on mitogenome analysis: Optimisation of the algorithms and gene selection. PLoS ONE 2020, 15, e0233680. [Google Scholar] [CrossRef]
  61. Omote, K.; Nishida, C.; Dick, M.H.; Masuda, R. Limited phylogenetic distribution of a long tandem-repeat cluster in the mitochondrial control region in Bubo (Aves, Strigidae) and cluster variation in Blakiston’s fish owl (Bubo blakistoni). Mol. Phylogenetics Evol. 2013, 66, 889–897. [Google Scholar] [CrossRef]
  62. Komissarov, A.; Korchagin, V.; Kliver, S.; Dobrynin, P.; Semyenova, S.; Vergun, A.; O’Brien, S.; Ryskov, A. The complete mitochondrial genome of the parthenogenetic Caucasian rock lizard Darevskia unisexualis (Squamata: Lacertidae) contains long tandem repeat formed by 59 bp monomer. Mitochondrial DNA Part B 2016, 1, 875–877. [Google Scholar] [CrossRef]
  63. Huang, A.; Liu, S.; Li, H.; Luo, H.; Ni, Q.; Yao, Y.; Xu, H.; Zeng, B.; Li, Y.; Wei, Z.; et al. The revised complete mitogenome sequence of the tree frog Polypedates megacephalus (Anura, Rhacophoridae) by next-generation sequencing and phylogenetic analysis. PeerJ 2019, 7, e7415. [Google Scholar] [CrossRef]
  64. Tensen, L.; Jansen van Vuuren, B.; Groom, R.; du Plessis, C.; Fischer, K. Little variation, lots of repetition: Mitogenomic diversity in African wild dogs. Mitochondrial DNA Part A 2025, 35, 197–206. [Google Scholar] [CrossRef]
  65. Juen, L.; Koroiva, R.; Geraldo de Carvalho, F.; Mendoza-Penagos, C.C.; Brito, J.D.; Calvão, L.B.; Ferreira, V.R.; Ribeiro-dos-Santos, Â.; Silva, C.S.; Guerreiro, S.; et al. The first mitochondrial genome of an Odonata endemic to South America, Chalcopteryx rutilans (Rambur, 1842) (Odonata: Polythoridae), and its implications for the phylogeny of the Zygoptera. Diversity 2023, 15, 908. [Google Scholar] [CrossRef]
  66. Zhou, Q.; Xiang, H.-M.; Zhang, M.-Y.; Liu, Y.; Gu, Z.-R.; Lan, X.-Y.; Wang, J.-X.; Jiang, W.-S. Two complete mitochondrial genomes of Leptobrachium (Anura: Megophryidae: Leptobrachiinae): Characteristics, population divergences, and phylogenetic implications. Genes 2023, 14, 768. [Google Scholar] [CrossRef]
  67. Hu, Y.-J.; Jia, F.-F.; Hu, L.; Wu, C.; Tian, T.; Li, T.-J.; Chen, B. Comparative mitogenome research revealed the phylogenetics and evolution of the superfamily Tenebrionoidea (Coleoptera: Polyphage). Ecol. Evol. 2024, 14, e11520. [Google Scholar] [CrossRef]
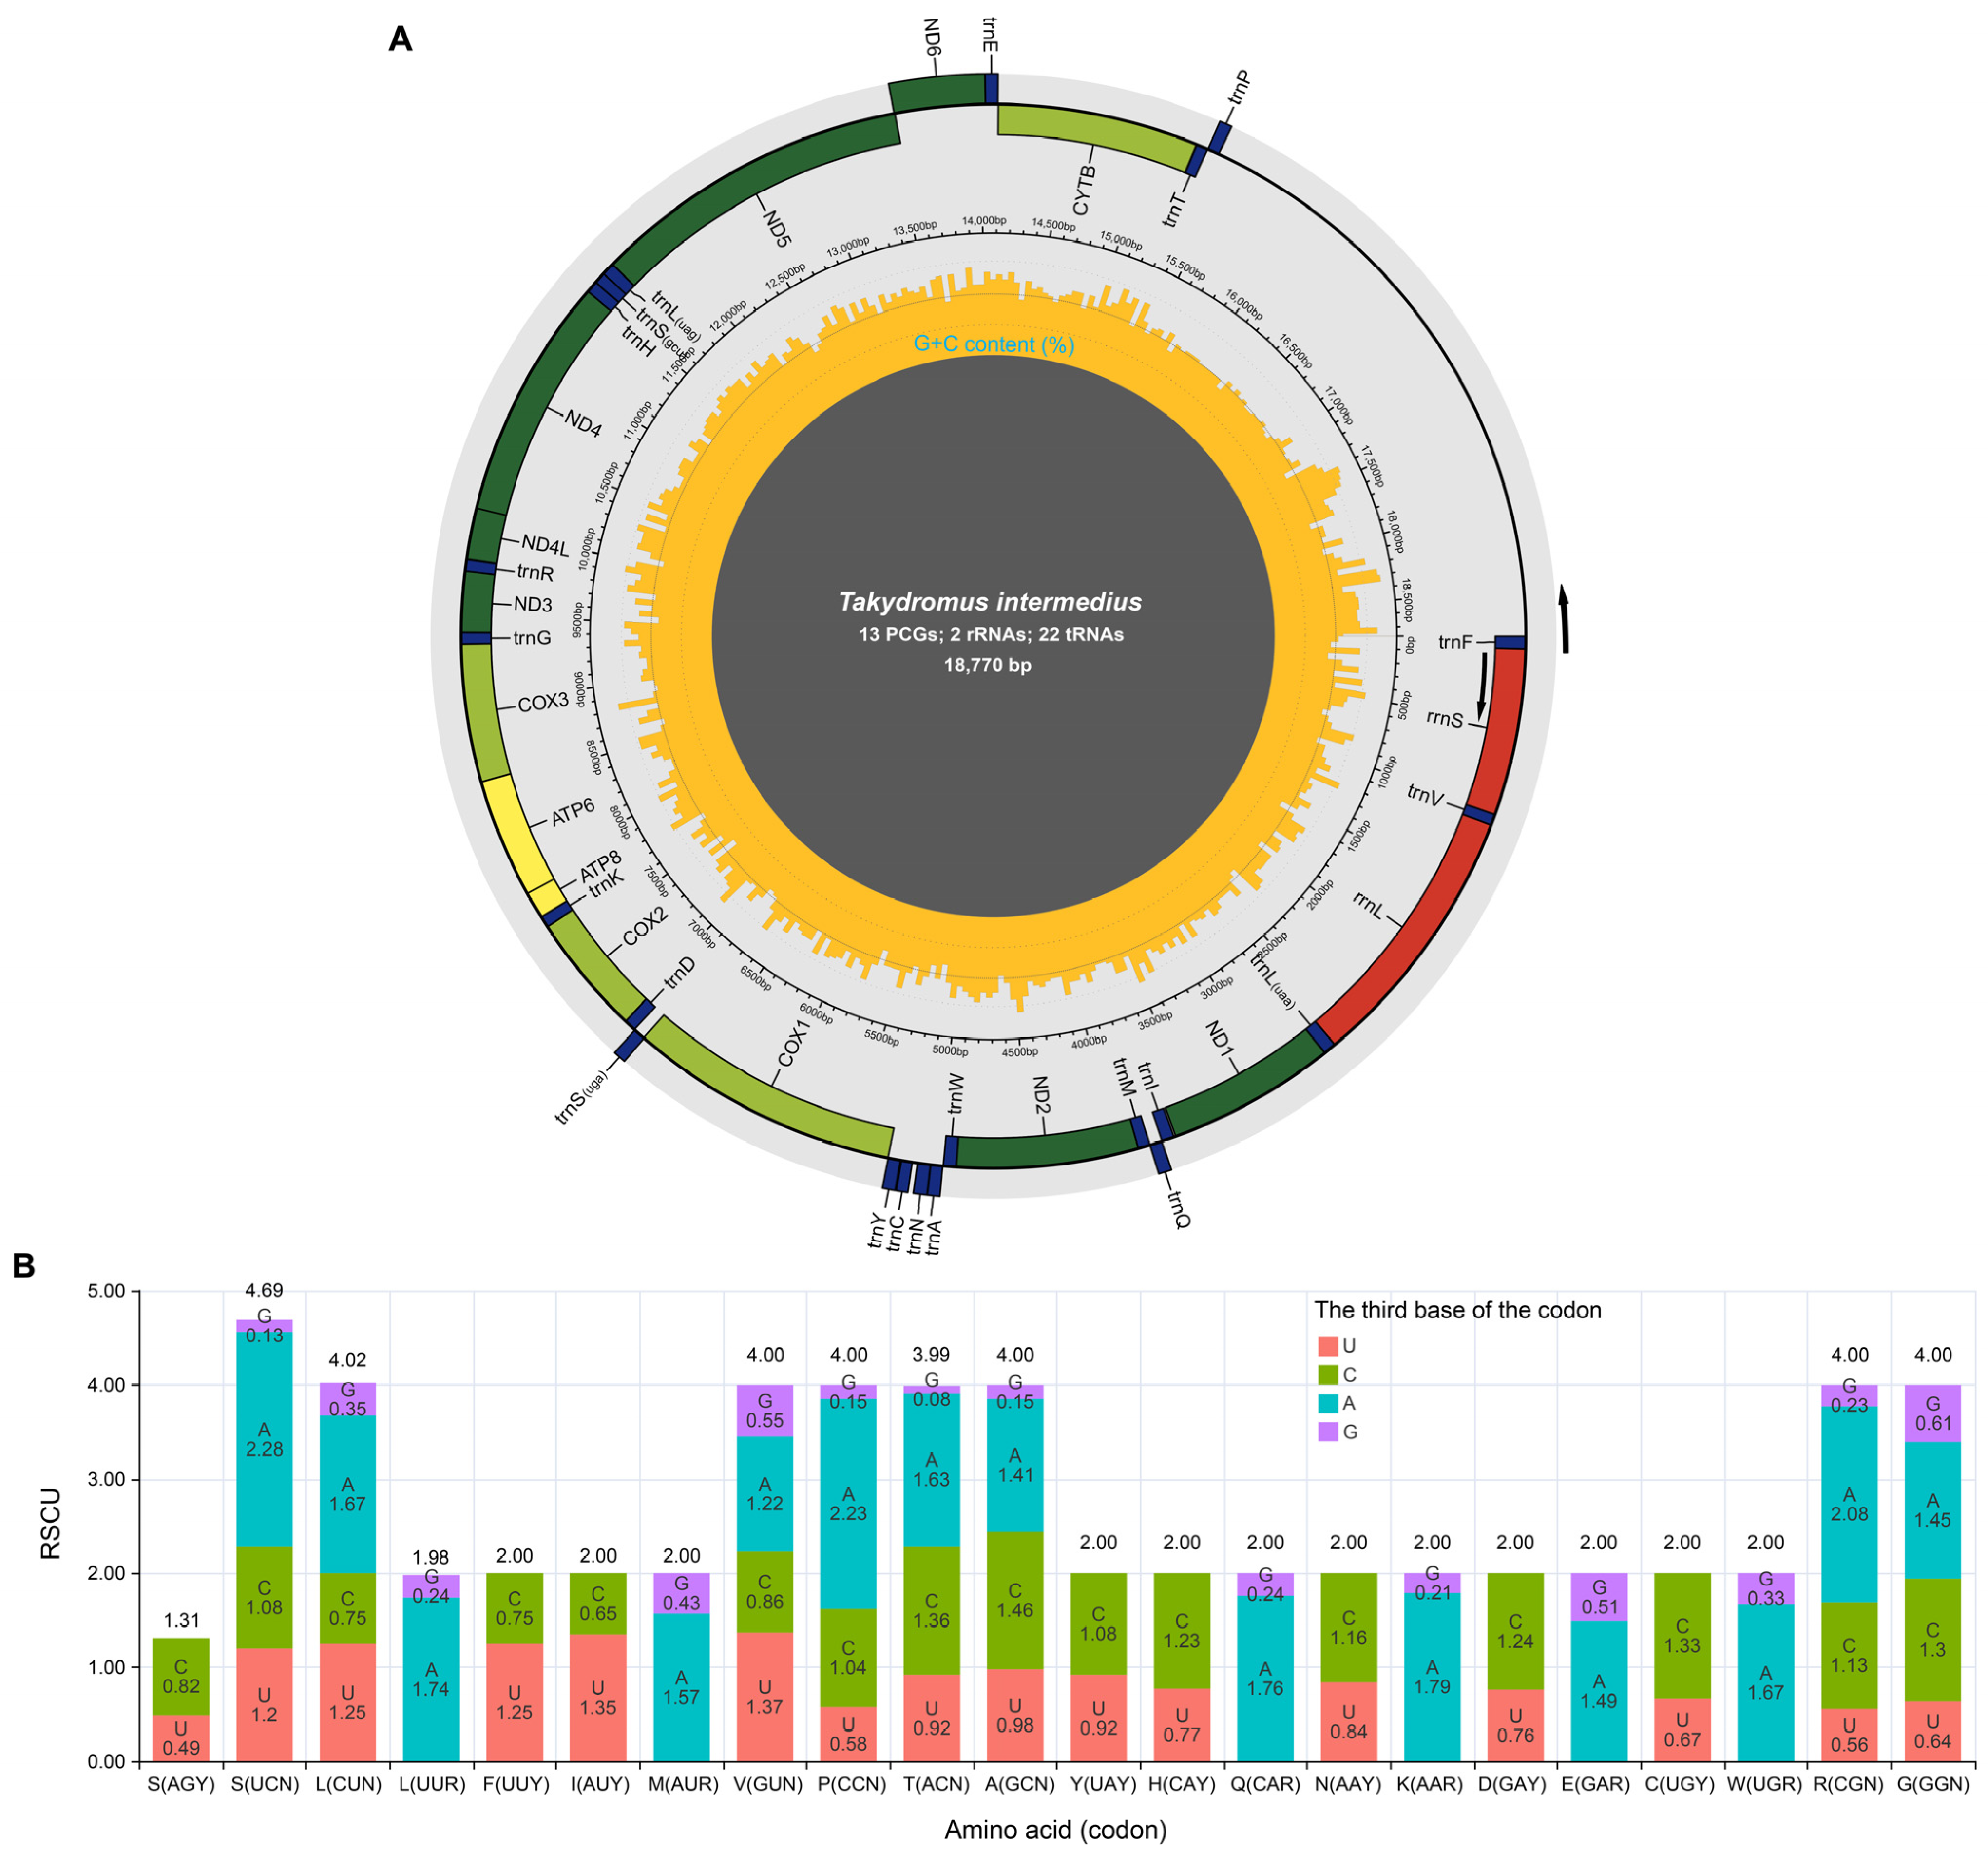
Figure 1. Circular representation and relative synonymous codon usage (RSCU) of Takydromus intermedius mitogenome. Arrows indicate the orientation of gene transcription. (A) Mitogenome map; (B) RSCU of protein-coding genes.
Diversity 17 00813 g001
Figure 2. Nucleotide composition and skewness of the mitogenome among Takydromus species. (A) Nucleotide composition; (B) A + T content; (C) AT-skew and GC-skew.
Diversity 17 00813 g002
Figure 3. Nucleotide variations and diversity of the mitogenome among Takydromus species. (A) Counts of parsimony-informative and singleton sites; (B) Proportion of variable sites; (C) Nucleotide diversity levels.
Diversity 17 00813 g003
Figure 4. Evolutionary rate and codon characteristics of mitochondrial protein-coding genes among Takydromus species. (A) The Ka/Ks ratio; (B) The start and stop codon usage.
Diversity 17 00813 g004
Figure 5. Intraspecific and interspecific genetic distances among Takydromus species.
Diversity 17 00813 g005
Figure 6. Mitogenome-based (13PCGs + 2rRNAs) phylogenetic relationships among Takydromus species. Values at the nodes indicate Bayesian posterior probabilities (BPP; before the slash) and ultrafast bootstrap percentages (UBP; after the slash). The name in bold represents the species sequenced in this study. The names circled represent the type species of the Takydromus and Platyplacopus subgenera. The GenBank accession number for each species is listed after its name.
Diversity 17 00813 g006
Table 1. Mitogenome sequences of nine lizard species used in this study.
SpeciesGenBank Accession No.LocalityMitogenome Size
(bp)
References
Takydromus amurensis Peters, 1881KU641018/NC_030209Changbai Mountai, Jilin, China17,333[29]
PQ177901South Korea17,334Direct submission
PQ177902South Korea17,327Direct submission
Takydromus intermedius Stejneger, 1924OQ632596/NC_077637Bashu, Chongqing, China17,713[19]
PX101964Dujiangyan, Sichuan, China18,770This study
Takydromus kuehnei Van Denbugeh, 1909MZ435950Quzhou, Zhejiang, China17,224[32]
Takydromus septentrionalis Günther, 1864MK630237Huangshan, Anhui, China18,304[31]
Takydromus sexlineatus Daudin, 1802KF425529/NC_022703Guangxi, China18,943[28]
Takydromus sylvaticus (Pope, 1928)JX290083Chung-an, Fujian, China17,838[27]
OK513036/NC_067055Suichang, Zhejiang, China17,518Direct submission
Takydromus tachydromoides (Schlegel, 1838)AB080237Nagoya University campus, Japan18,245[25]
LC101816Unknown17,923[30]
Takydromus wolteri Fischer, 1885JX181764/NC_018777China18,236[26]
PP972212South Korea18,237Direct submission
PP972213South Korea18,242Direct submission
Gallotia atlantica (Peters & Doria, 1882)MW496111/NC_059771 15,552[33]
Table 2. Usage of start codons and stop codons of mitochondrial protein-coding genes among Takydromus species.
SpeciesAccession IDATP6ATP8COX1COX2COX3CYTBNAD1
T. amurensisKU641018ATG/TA- 1ATG/TAAATG/AGGATG/T--ATG/T--ATG/TAAATG/TAA
PQ177901ATG/TA- 1ATG/TAAATG/AGGATG/T--ATG/T--ATG/TAAATG/TAA
PQ177902ATG/TA- 1ATG/TAAATG/AGGATG/T--ATG/T--ATG/TAAATG/TAA
T. intermediusOQ632596ATG/TA- 1ATG/TAAATG/AGG 2ATG/T--ATG/T--ATG/TAGATG/TAA
PX101964ATG/TA-ATG/TAAATG/AGGATG/T--ATG/T--ATG/TAGATG/TAA
T. kuehneiMZ435950GTG/TA- 1ATG/TAAATG/AGGATG/T--ATG/T--ATG/TAAATG/TAA
T. septentrionalisMK630237ATG/TA- 1ATG/TAAATG/AGGATG/T--ATG/T--ATG/TAAATG/TAA
T. sexlineatusKF425529ATG/TA-ATG/TAAGTG/AGGATG/T--ATG/T--ATG/TAAATG/TAG
T. sylvaticusJX290083ATG/TA- 1ATG/TAAATG/AGGATG/T--ATG/T--ATG/TAAATG/TAG
OK513036ATG/TA- 1ATG/TAAATG/AGGATG/T--ATG/T-- 4ATG/TAAATG/TAG
T. tachydromoidesAB080237ATG/TA-ATG/TAAGTG/AGGATG/T--ATG/T--ATG/TAAATG/TAA
LC101816ATG/TA-ATG/TAAGTG/AGGATG/T--ATG/T--ATG/TAAATG/TAA
T. wolteriJX181764ATG/TA- 1ATG/TAAATG/AGGATG/T--ATG/T--ATG/TAAATG/TAA
PP972212ATG/TA- 1ATG/TAAATG/AGGATG/T--ATG/T--ATG/TAAATG/TAA
PP972213ATG/TA- 1ATG/TAAATG/AGGATG/T--ATG/T--ATG/TAAATG/TAA
SpeciesAccession IDNAD2NAD3NAD4NAD4LNAD5NAD6
T. amurensisKU641018ATG/T--ATG/T--ATG/T--ATG/TAAATG/TAAATG/AGA
PQ177901ATG/T--ATG/T--ATG/T--ATG/TAAATG/TAAATG/AGA
PQ177902ATG/T--ATG/T--ATG/T--ATG/TAAATG/TAAATG/AGA
T. intermediusOQ632596ATG/T--ATG/T--ATG/T--ATG/TAAATG/TAAATG/AGA
PX101964ATG/T--ATG/T--ATG/T--ATG/TAAATG/TAAATG/AGA
T. kuehneiMZ435950ATG/T--ATG/T--ATG/T--ATG/TAAATG/TAAATG/AGG
T. septentrionalisMK630237ATG/T--ATG/T--ATG/T--ATG/TAAATG/TAAATG/AGA
T. sexlineatusKF425529ATG/T--ATG/T--ATG/T--ATG/TAAATG/TAAATG/AGA
T. sylvaticusJX290083ATG/T--ATG/T-- 3ATG/T--ATG/TAAATA/TAAATG/AGA
OK513036ATG/T--ATG/T--ATG/T--ATG/TAAGTG/TAAATG/AGA
T. tachydromoidesAB080237ATG/T--ATG/T--ATG/T--ATG/TAAATA/TAAATG/AGG
LC101816ATG/T--ATG/T--ATG/T--ATG/TAAATA/TAAATG/AGG
T. wolteriJX181764ATG/T--ATG/T--ATG/T--ATG/TAAATG/TAAATG/AGA
PP972212ATG/T--ATG/T--ATG/T--ATG/TAAATG/TAAATG/AGA
PP972213ATG/T--ATG/T--ATG/T--ATG/TAAATG/TAAATG/AGA
Notes: Red highlights indicate codons that differ among species. Blue highlights indicate codons that were re-annotated in this study: 1 TAA (NCBI annotation) → TA- (our annotation); 2 T-- → AGG; 3 TG- → T--; 4 TA- → T--.
Disclaimer/Publisher’s Note: The statements, opinions and data contained in all publications are solely those of the individual author(s) and contributor(s) and not of MDPI and/or the editor(s). MDPI and/or the editor(s) disclaim responsibility for any injury to people or property resulting from any ideas, methods, instructions or products referred to in the content.