Article

Unveiling Zooplankton Diversity Patterns: The Differential Influence of Macrophyte Belts on Species and Functional Metrics

1
Department of Ecology, Institute of Biology and Biomedicine, National Research Lobachevsky State University of Nizhny Novgorod, 603022 Nizhny Novgorod, Russia
2
Faculty of Biology, Shenzhen MSU-BIT University, Shenzhen 518172, China
*
Author to whom correspondence should be addressed.
Diversity 2025, 17(12), 812; https://doi.org/10.3390/d17120812
Submission received: 2 November 2025 / Revised: 19 November 2025 / Accepted: 21 November 2025 / Published: 24 November 2025

Abstract

Species and functional diversity are essential frameworks for analyzing changes in planktonic communities. In lakes and rivers, macrophytes within the coastal zone are a primary determinant of zooplankton community structure and function. This study investigated the influence of various macrophyte beds in the littoral zones of lakes and river estuaries on the species and functional diversity of zooplankton communities. Our analysis revealed that among the species diversity metrics, only zooplankton species richness notably demonstrated a clear relationship with macrophyte type and their projective coverage. The highest richness was observed in mixed and submerged macrophytes due to the peculiarities of their morphological structure. Functional diversity indices—functional richness, functional evenness, and functional divergence—had a strong association with diverse macrophyte belts. The extent of these differences in zooplankton species and functional diversity is further amplified by a greater representation of diverse macrophyte belt types within the littoral zone. Macrophyte thickets consistently demonstrated increased species richness, functional richness, and functional divergence in zooplankton communities compared to open water zones, with mixed and submerged macrophytes exerting the most pronounced impact on diversity. These results underscore that the diverse structures of macrophytes contribute significantly to variation in zooplankton diversity in coastal areas. Consequently, functional diversity indices prove to be more effective tools than traditional species diversity indices for assessing changes in planktonic communities along spatial gradients.

1. Introduction

Biodiversity is a fundamental property of communities and is directly linked to ecosystem functioning and the essential services they provide to humans [1]. Community diversity is assessed through species and functional metrics. Species diversity, which reflects species richness and evenness, is commonly used to characterize communities. However, it does not fully account for the ecological functions species perform within an ecosystem [2,3]. Functional diversity, based on species traits, offers a more useful approach, replacing species identity with a combination of traits that reflect different resource utilization strategies [4]. Metrics of functional diversity are also more sensitive indicators of processes that drive community changes [5]. The most widely used indices—functional richness (FRic), functional evenness (FEve), and functional divergence (FDiv)—are calculated from the species’ functional traits and provide a complex description of community functional diversity [6].
Freshwater ecosystems deliver various services to society and contribute significantly to global biodiversity [7]. Zooplankton plays a pivotal role in these ecosystems, acting as a link between primary producers and higher trophic levels, and contributing to water self-purification [8,9,10]. Habitat structure and predation are key factors influencing the distribution of zooplankton species and functional groups [11]. In the coastal zones of lakes and rivers, macrophytes are the primary structuring element [12,13,14]. The environmental heterogeneity created by macrophytes is a crucial factor contributing to high zooplankton species richness and density in aquatic coastal zones [15,16].
Plant architecture is a key factor in zooplankton distribution within coastal aquatic ecosystems [15,17,18,19,20,21]. Structurally complex habitats offer zooplankton more potential food resources, thereby increasing species diversity [13,21]. Macrophytes of different forms can influence the resources available to zooplankton, leading to varied effects on functional groups [22,23]. Submerged macrophytes, with branched structures, enhance the physical complexity of the aquatic environment to a larger extent, creating more favorable conditions for zooplankton than plants with simpler structures [15,19,24,25]. An increase in submerged macrophytes leads to an increase in the number of benthic species, fostering more predatory and omnivorous crustacean species [4] and augmenting the community’s functional richness. The food and habitat complexity provided by macrophytes are vital in shaping zooplankton community composition [11].
The spatial heterogeneity of vegetation belts is shown in spatial differences in zooplankton community composition [26]. The habitat structure created by macrophytes can mediate complex trophic interactions and provides an excellent system for analyzing site-to-site variation [27,28]. Previous studies have shown that macrophyte thickets in lakes change the spatial distribution of zooplankton communities, similar to an ecocline [29]. However, the influence of macrophytes has never been analyzed in terms of spatial patterns of zooplankton functional diversity in coastal zones. In the present study, we aimed to analyze changes in the species and functional diversity of zooplankton communities under the influence of different types of macrophyte thickets in the littoral zone of lakes and river estuaries. We hypothesized that plants forming different types of macrophyte belts in the coastal zone alter the species and functional diversity of zooplankton communities.

2. Materials and Methods

2.1. Study Area and Sample Collection

We investigated zooplankton communities in the coastal zones of several water bodies within the Middle Volga basin. These included three estuarine areas of tributaries to the Cheboksary Reservoir (the Kerzhenets River, the Sura River, and the Vetluga River), the karst Lake Charskoe, the suffosion Lake Golovkovskoe (all located in the Nizhny Novgorod Region), and two floodplain lakes, as well as the flowing ponds of the Chernaya River, the Vyunitsa River, and the Shuvalov Canal, all situated within the city of Nizhny Novgorod. All of the studied water bodies belong to the Middle Volga basin (Table 1).
Zooplankton sampling was carried out during the summer low-water period from 2022 to 2024. We specifically investigated the estuarine areas of tributary rivers during periods of hydrological stability, ensuring no significant water releases or increased flow from hydroelectric power stations. Studies were performed during the peak development of macrophytes, under optimal weather conditions, and exclusively during daylight hours.
In all water bodies, sampling was carried out in the coastal zone using the transect method. A 10 m transect was established along the coastline of each lake and river. Zooplankton samples were collected every 2 m along a cross-sectional profile, extending from the helophyte belt towards the open water boundary. Five samples were taken within each distinct macrophyte belt and at the border with the open water zone (Figure 1).
Samples were collected using a measuring bucket, filtering 25 L of water through a plankton net (70 µm mesh diameter). The sampling depth at the sampling points was 0.5 m. A total of 155 samples were obtained. Samples were preserved with 40% formalin to a final concentration of 4% and subsequently stored in the collection of the Laboratory of Water Ecosystems, Department of Ecology, Institute of Biology and Biomedicine, Lobachevsky State University (Nizhny Novgorod, Russia).

2.2. Species Identification

Samples were analyzed using light microscopy to identify, count, and measure organisms and determine the zooplankton density and calculate the dry-weight biomass. Zooplankton specimens were examined using a Zeiss Stemi 2000C stereomicroscope (Carl Zeiss Microscopy, Munich, Germany), and a detailed morphological analysis was performed using an Olympus CX43 light microscope (Olympus Corporation, Tokyo, Japan). For specifying the taxonomic affiliation of zooplankton, we utilized appropriate manuals and guides [30,31,32].

2.3. Environmental Variables

Environmental variables were measured at all zooplankton sampling sites. The concentration of chlorophyll-a (Chl_a) was measured using a YSI ProDSS hydrochemical probe (YSI Inc., Yellow Springs, OH, USA) and Aquared (Aquaread Ltd., United Kingdom) multiparameter probe; dissolved oxygen content was measured by a YSI ProODO hydrochemical probe (YSI Inc., Yellow Springs, OH, USA) and MARK 303 (Vzor, Nizhny Novgorod Russia); and the pH, temperature, and electrical conductivity of water were measured using a YSI Pro1030 hydrochemical probe (YSI Inc., Yellow Springs, OH, USA) and Aquared (UK) multiparameter probe. Water transparency was determined using a Secchi disk. The projective cover of macrophytes was assessed using a generally accepted method [33].
The trophic state index (TSI) was calculated based on chlorophyll (Chl_a) using the relationships described in [34]:
T S I = 9.81 × l n ( C h l _ a ) + 30.6
In accordance with Carlson [34], waters with TSI < 40 were considered oligotrophic, those with 40–50 were considered mesotrophic, those with 50–70 were eutrophic, and those with TSI > 70 were hypertrophic.

2.4. Data Analysis

Species diversity was assessed using indices of species richness, diversity, evenness, and dominance. Species richness was represented as the number of species. Diversity, evenness, and dominance were analyzed using the Shannon (H), the Pielou (E), and Simpson indices (C) correspondingly [35]:
H = i = 1 R p i × l n ( p i )
E = H l n S
C = i = 1 R p i 2
where pi is the proportion of individuals of i-th species in a whole community; S is the total number of species.
Functional diversity indices were calculated using a database of freshwater zooplankton functional traits from the Middle Volga basin [36]. We chose one quantitative trait—the body size—and three qualitative traits: trophic group (two categories: predator, nonpredator), feeding type (six categories: capture, primary filtration, secondary filtration, vertication, suction, gathering), and type of locomotion (three categories: swimming, crawling, attachment) (Table S2). The choice of traits was determined by their belonging to three taxonomic groups of zooplankton. The selected functional diversity indices included functional richness, functional evenness, and functional divergence [6]. Functional space was derived using principal coordinate analysis, applied to functional distances among species calculated with the Gower distance index. Functional richness (FRic) quantifies the overall volume of functional space covered by species in a particular community and reflects the degree of spatial resource utilization. It is calculated as a multidimensional convex hull volume.
The functional evenness index (FEve) estimates how evenly species are distributed in functional space, taking into account their abundances:
F E v e = l = 1 S 1 min ( P E W l , 1 S 1 ) 1 S 1 1 1 S 1
where P E W l are the normalized evenness values calculated as P E W l = d i l / ( p i + p j ) l = 1 S 1 d i l / ( p i + p j ) , where d i l is the branch length (Euclidean distance between species i and j connected by this branch), p i is the relative abundance of species i, and S is the number of species.
The functional divergence index (FDiv) measures how strongly the distribution of abundances is shifted towards the outer zones of the functional space:
F D i v = d + d G ¯ d ¯ + d G ¯
where d is the weighted sum of deviations from the mean distance, d ¯ is the sum of the absolute values of the corresponding deviations, and d G ¯ is the mean distance to the centroid.
The Shapiro–Wilk, Anderson–Darling, and Lilliefors tests were used to detect deviations from a normal distribution. Homogeneity of variances was assessed using the Levene test. To determine significant differences in the analyzed parameters, the Wilcoxon test, Welch t-test, and Tukey test with Westfall–Young correction were applied. Correlation analysis (Pearson or Spearman, based on data distribution) was used to assess the relationships between functional diversity indices (FRic, FEve, FDiv). Multivariate regression analysis was performed to assess the dependence of functional diversity indices on environmental factors [35]. All analyses were performed using R open-source software (version 4.5.2) (packages “nortest”, “car”, “multcomp”, “mvtnorm”, “vegan”, “FD”) [37].

3. Results

3.1. Species and Functional Diversity

All water bodies had a fairly high overall species richness of zooplankton. Rotifers were the leading taxon in all water bodies (Table 2). A general list of zooplankton species for each zone of the water body is presented in Supplementary Table S1.
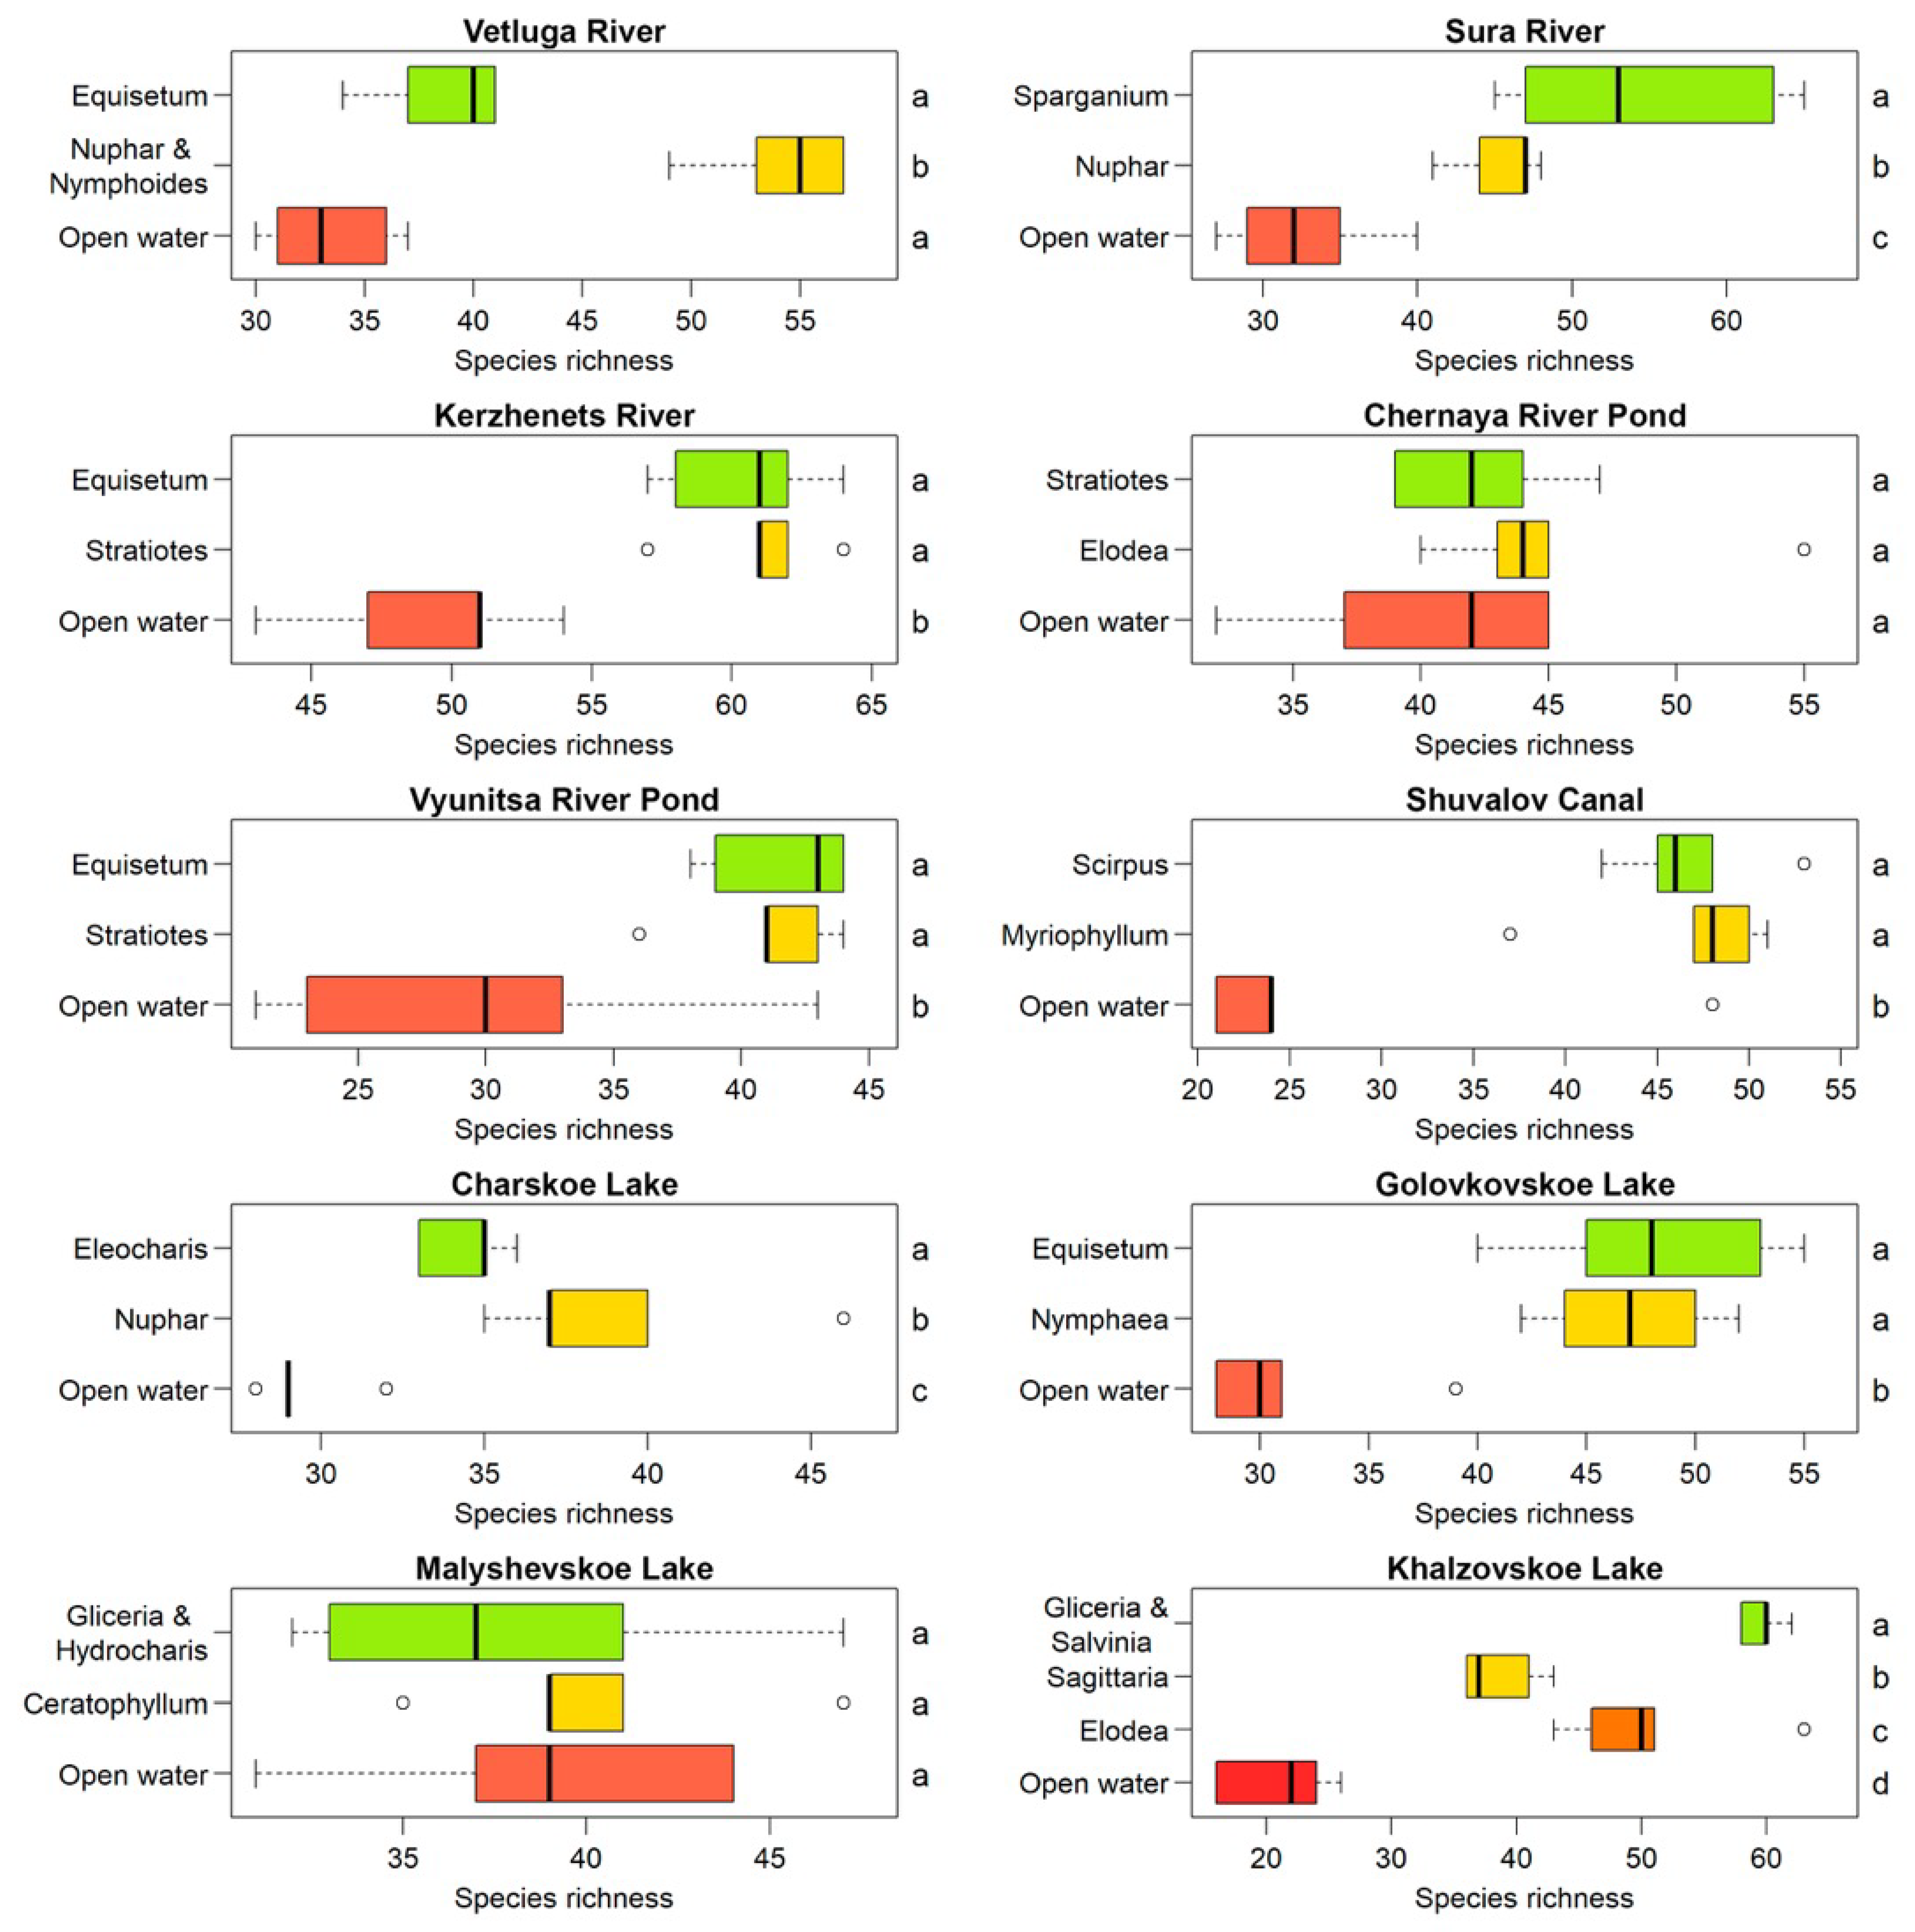
All studied water bodies exhibited the lowest zooplankton species richness in the open water zone at the edge of the macrophyte thickets. The only exceptions were Malyshevskoe Lake and the pond on the Chernaya River, where no significant differences in species richness were found between the macrophyte thickets and the open water zone (Figure 2). The most pronounced differences in zooplankton species richness were observed in the highly heterogeneous macrophyte thickets of Khaltzovskoe Lake. Maximum species richness was observed near the coast in mixed thickets of Glyceria and Salvinia. Subsequently, as we moved towards the open water zone within the arrowhead thickets, there was a decrease in species richness, followed by a further increase in dense thickets of Elodea. In the Vetluga River, the greatest species richness was also observed in mixed thickets of Nuphar and Nymphoides.
No consistent pattern was observed in the distribution of Shannon’s species diversity index. In Golovkovskoe Lake, Charskoe Lake, and the Shuvalov Canal pond, no statistically significant differences in the index were found between different zones. In Khaltzovskoe Lake and the Vyunitsa River pond, the lowest index values were in the open water zone, whereas in Vetluga River and Malyshevskoe Lake, they were near the coast (Figure S1). In the Chernaya River, the lowest diversity was observed in Elodea thickets located near the open water zone, while in the Kerzhenets and Sura Rivers, the highest diversity was observed in thickets of Stratiotes and Nuphar.
The distribution of the Pielou evenness almost completely coincided with the Shannon index, confirming their interdependence. High diversity was associated with a high evenness of zooplankton. Significant differences were observed only in Khaltzovskoe Lake, where differences in zooplankton evenness were found between Sagittaria thickets and mixed thickets of Glyceria and Salvinia, and no differences were found between Sagittaria thickets and the open water zone (Figure S2).
The Simpson dominance index reflected an inverse relationship with the Shannon index: higher dominance corresponded to lower diversity. Only in the Sura River were no significant differences found in the Simpson index between Sparganium and Nuphar thickets (Figure S3).
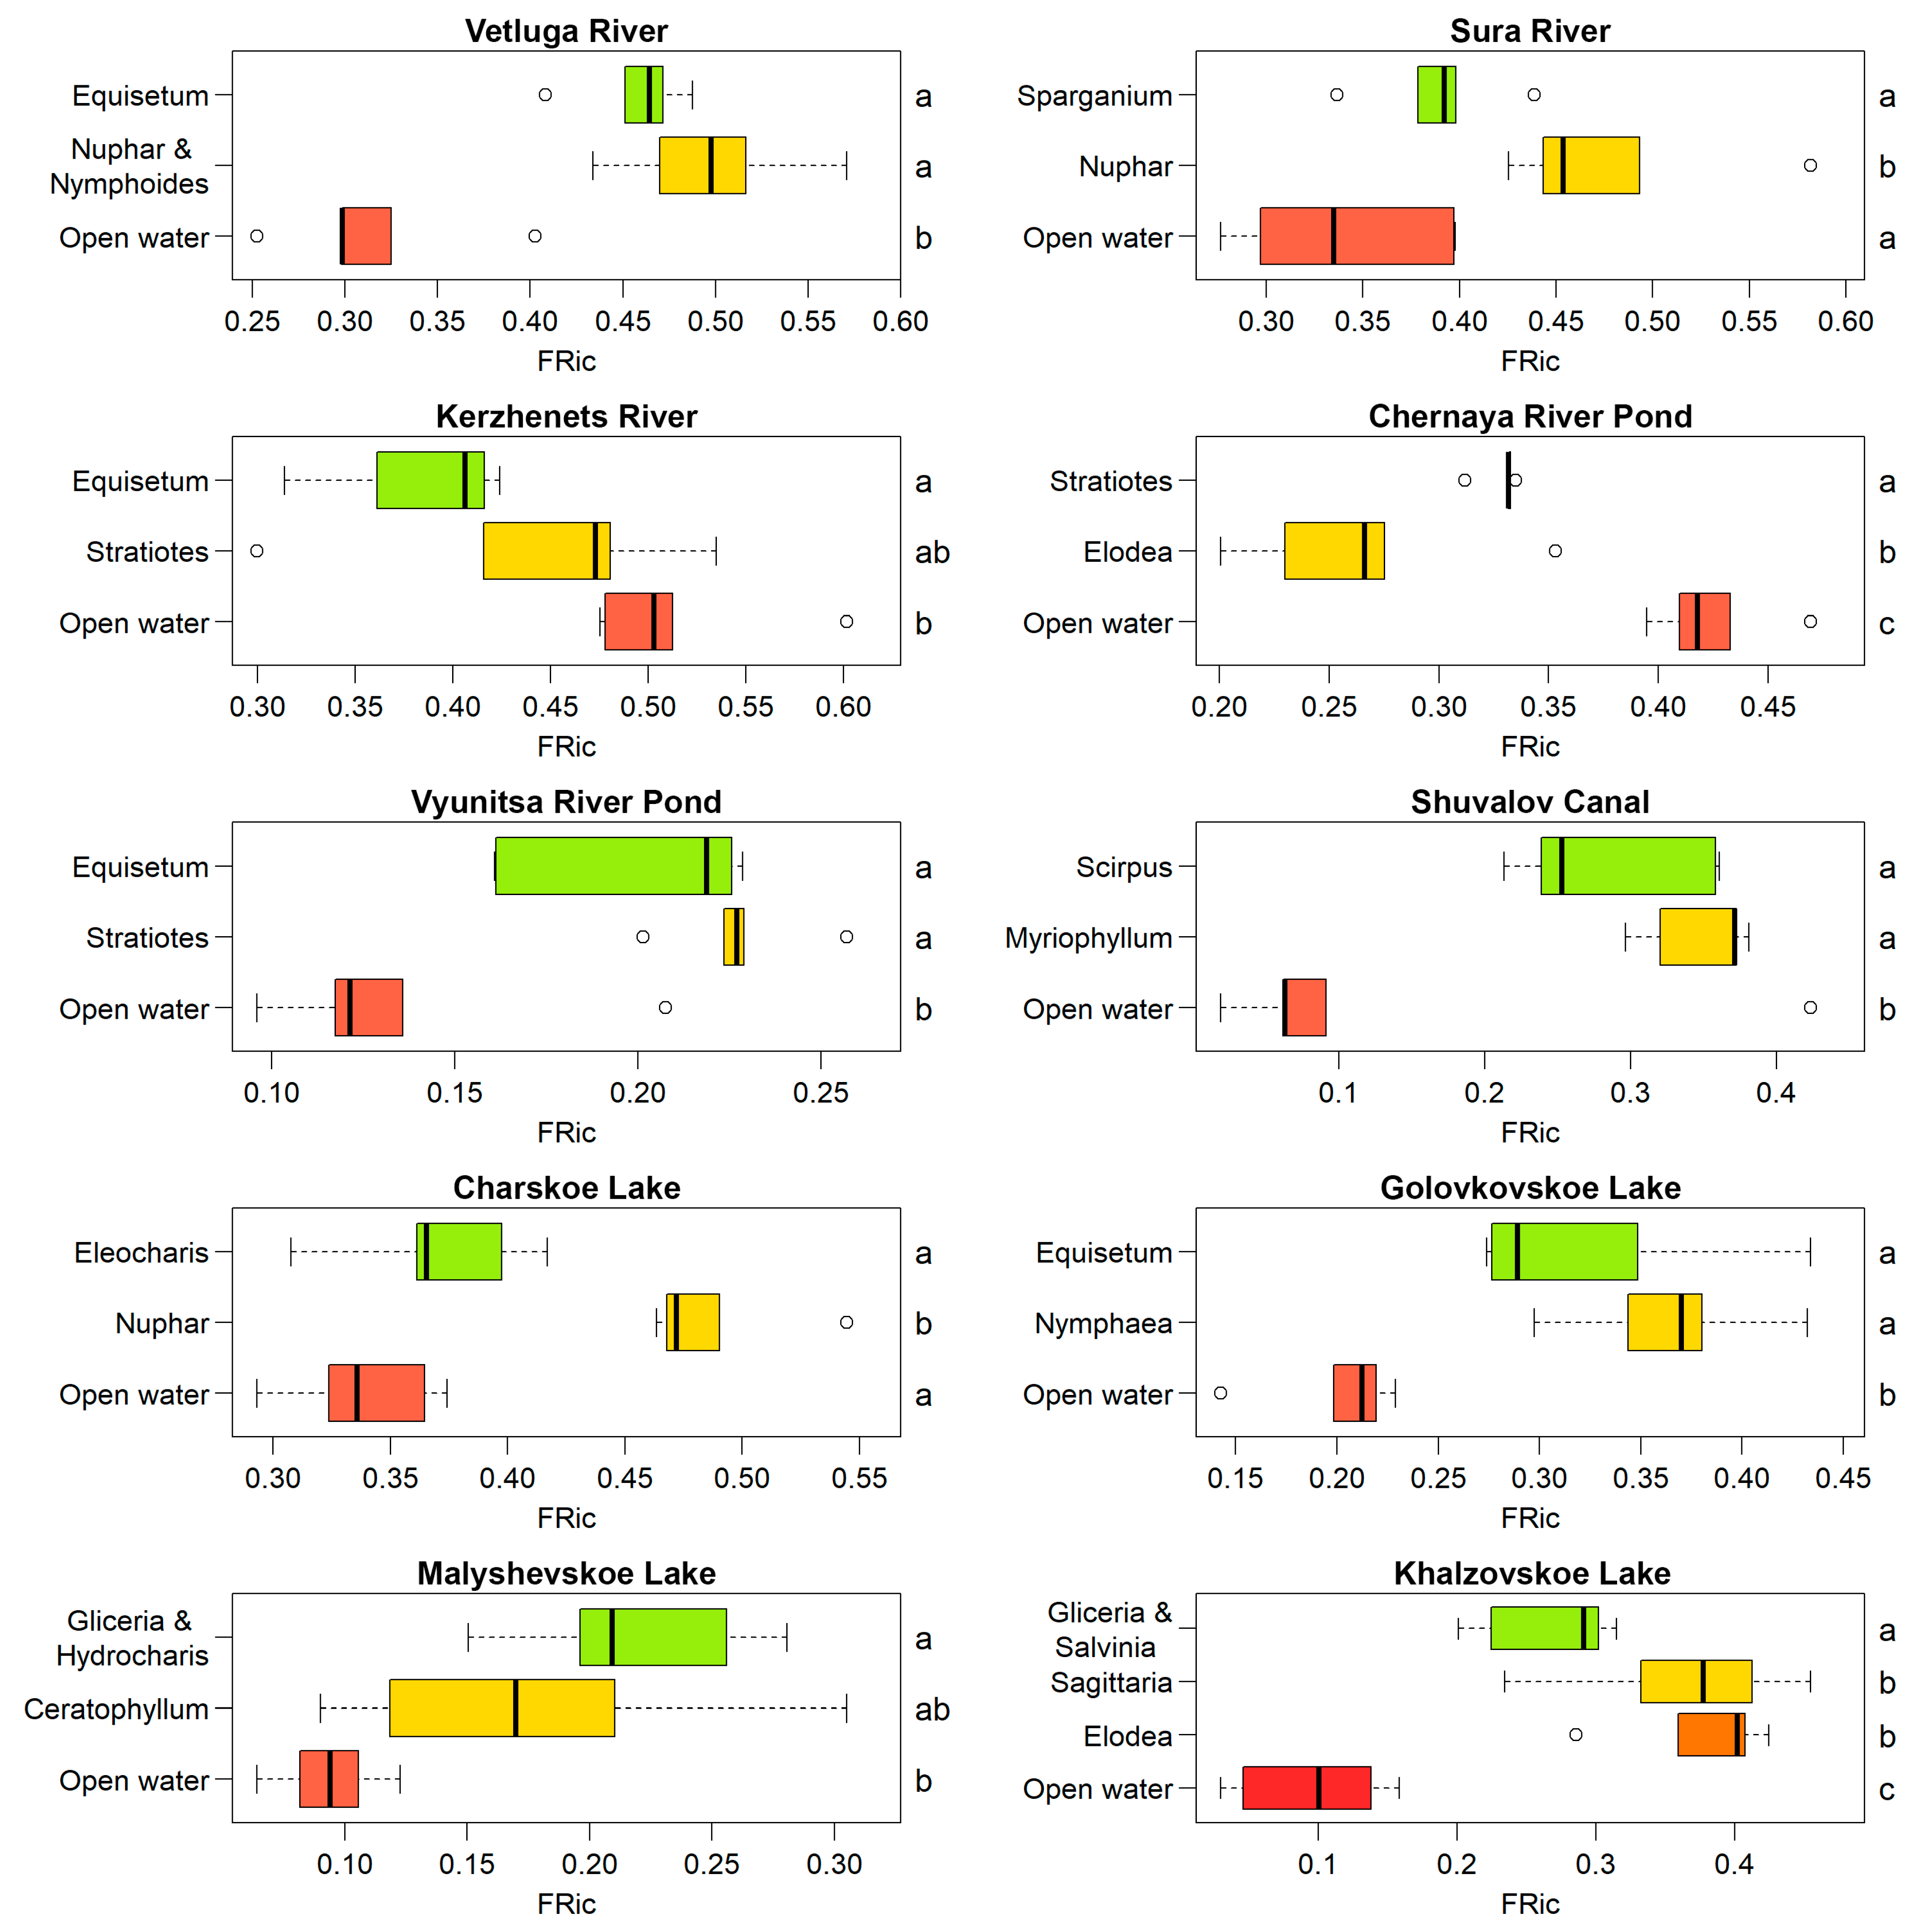
In contrast to the taxonomic diversity indices, differences in the functional richness index were found in all water bodies except for the Shuvalov Canal (Figure 3). In almost all water bodies, FRic was significantly lower at the edge of the thickets in the open water zone compared to the macrophyte thickets. The exceptions were the Kerzhenets River and the Chernaya River pond, where the highest FRic was observed in the open water zone. In the Sura River and Charskoe Lake, the highest FRic was observed in the Nuphar thickets located near the open water zone. In the Chernaya River pond, the lowest FRic was recorded in the Elodea thickets.
Unlike FRic, functional evenness differed significantly in only three water bodies: Khaltzovskoe Lake, the Chernaya River pond, and the Shuvalov Canal (Figure S4). In these water bodies, the highest FEve was observed in the open water zone. In Khaltzovskoe Lake, a higher FEve value was recorded in the Sagittaria thickets compared to the adjacent Glyceria-Salvinia and Elodea thickets. In the Shuvalov Canal and the Chernaya River pond, an increase in FEve was observed from the coast towards the open water zone.
In a number of water bodies, a significant decrease in functional divergence was observed from the coast to the open water zone. However, in Malyshevskoe Lake, the highest FDiv was observed in the open water zone. In Vetluga River, the highest FDiv was in the mixed thickets of Nuphar and Nymphoides, and the lowest in the thickets of Equisetum near the coast. In Kerzhenets River and Shuvalov Canal, no statistically significant differences in FDiv were found (Figure S5).
Establishing a connection between functional indices showed that functional richness and functional evenness do not depend on functional divergence. These two metrics are also independent of each other (Figure S6).

3.2. Diversity and Environmental Variables

We analyzed the dependence of species diversity indices and functional diversity indices on abiotic factors (temperature, pH, electrical conductivity, oxygen content), the Trophic State Index, and macrophyte projective cover. The greatest positive relationship was found between the species richness and macrophyte projective cover. A negative relationship was found with the temperature and pH of water (Table 3). The general model of multivariate regression was (Adj. R2 = 0.364, F(6, 133) = 14.250, p-value < 0.001).
The Shannon index (Adj. R2 = 0.171, F(6, 133) = 5.778, p-value < 0.001) and Pielou index (Adj. R2 = 0.154, F(6, 133) = 5.224, p-value < 0.001) showed a negative relationship with water temperature and oxygen content. The Simpson index had a positive relationship only with water temperature (Adj. R2 = 0.107, F(6, 133) = 3.765, p-value = 0.002).
Functional richness (Adj. R2 = 0.460, F(6, 133) = 20.780, p-value < 0.001) was found to be directly dependent on dissolved oxygen content and projective cover, and inversely dependent on pH. For functional evenness (Adj. R2 = 0.0618, F(6, 133) = 2.527, p-value = 0.023), only an inverse relationship with macrophyte projective cover was established. For functional divergence (Adj. R2 = 0.171, F(6, 133) = 5.786, p-value < 0.001), a direct relationship with macrophyte projective cover was shown.

4. Discussion

In our study, we showed that macrophytes change the indices of species and functional diversity of zooplankton communities in the coastal zone. This is achieved through the presence of diverse macrophyte belts in the coastal zone.

4.1. Distribution of Species and Functional Diversity

Among the species diversity indices, only zooplankton species richness showed clear changes along the habitat gradient. The lowest number of zooplankton species was almost always found in the open water zone at the edge of macrophyte thickets. This is attributed to the fact that macrophytes create environmental heterogeneity and serve as a refuge for zooplankton [38,39,40]. Conversely, the greatest species richness was observed in mixed and submerged macrophytes, as these habitats modify the aquatic environment to the greatest extent [15,19,24,41,42]. Thickets of plants with simpler structures modify the environment to a lesser extent, which leads to a decrease in zooplankton species richness. Variation in the Shannon, Pielou, and Simpson indices was higher, without a clear link to ecological macrophyte groups.
As we hypothesized, the functional diversity indices of zooplankton communities responded more clearly to the different-type of macrophyte belts. The lowest FRic values in the open water zone can be explained by the homogeneity of conditions and the associated limited feeding and movement opportunities for zooplankton. The high FRic values in the Nuphar thickets, located between the helophyte thickets and the open water zone, can be attributed to a transition zone effect. Due to their morphological structure, these thickets provide favorable conditions for both phytophilic species with floating, crawling, and attached lifestyles and diverse nutritional strategies, as well as pelagic species with filtration (e.g., Bosmina, Moina), sedimentation feeding (Polyarthra), and active predation (Thermocyclops, Mesocyclops). The increase in FRic in mixed and submerged thickets is explained by the high heterogeneity of the habitat. Such thickets enhance the availability of resources for rotifers and microcrustaceans, leading to an increase in zooplankton functional groups [4,22,23,43].
High FRic values in the open water zone can also be explained by competition avoidance due to the high dominance of macrophytes in the thickets. For instance, in the Elodea thickets of the Chernaya River pond, 70% of the zooplankton community consisted of the nauplii and copepodite stages of Cyclopoida, while at the edge of the thickets, their share decreased to 25%. This could have contributed to the migration of different zooplankton species to the open water zone.
FEve did not show significant variability, unlike FDiv. In three water bodies, the highest FEve was observed in the open water zone. A number of studies have also shown that FEve is negatively associated with habitat heterogeneity [22,44]. In most water bodies, FDiv was higher in macrophyte thickets than in the open water zone. The number of species with extreme characteristics (e.g., larger cladocerans or copepods) increases in macrophyte thickets, leading to increased functional divergence of zooplankton communities. The increase in the abundance of large crustacean plankton in macrophyte thickets may contribute to the dominance of small rotifers at the edge of the thickets in the open water zone due to competition for food resources.
The decline in FRic and FDiv may also be influenced by the pressure of planktivorous fish, which increases at the edge of the thickets [39,45]. The consumption of cladocerans and large copepods leads to a decrease in species richness and an increase in the proportion of rotifers in the zooplankton. This, in turn, leads to a decrease in the size of zooplankton and a reduction in feeding types, as zooplankton mainly consist of rotifers with sedimentary feeding (Polyarthra, Keratella, Brachionus, Filinia) and nauplii stages of copepods with filter feeding.

4.2. The Influence of Environmental Variables on Species and Functional Diversity

Of all the species diversity indices, only species richness was highly correlated with macrophyte projective cover. The greater the development of the submerged part of a macrophyte, the more ecological niches are created for zooplankton, which leads to reduced competition and increased species richness.
The highest values were found for the dependence of functional richness on pH and macrophyte projective cover. The dependence on pH is directly related to eutrophication; as eutrophication increases, the water becomes more alkaline and the pH rises. Our study did not include acidic lakes, where zooplankton species richness is typically low. Eutrophication results in the massive development of algae and cyanobacteria, and accordingly, an increase in Chl-a concentration and the primary production of ecosystems. It was demonstrated that FRic increases with Chl-a growth [5]. The productivity of the aquatic ecosystem is the main factor in habitats where herbivorous Cladocera form the basis of this relationship [46]. However, with increasing eutrophication, changes occur in phytoplankton, leading to the dominance of cyanobacteria. This results in a decrease in the availability of phytoplankton as food for zooplankton [47,48] and a reduction in functional richness. With eutrophication, small rotifers that feed mainly on bacteria and detritus begin to dominate the plankton [49,50,51]. It is likely that an increase in the proportion of this functional group reduces the functional richness of the entire zooplankton community.
It is known that increased mineralization leads to a decrease in the functional diversity of zooplankton communities [52,53,54]. In our study, the multivariate regression model did not reveal any statistical influence of water conductivity on functional indices. The studied water bodies were within a narrow range of water conductivity, which apparently affected the low relationship with functional indices.
An increase in the projective cover of macrophytes increased functional richness and functional divergence and reduced the functional evenness of zooplankton communities. Moreover, this relationship was strongest for FRic. Denser macrophyte thickets create greater environmental heterogeneity, which contributes to an increase in the range of niches and available resources for species [4]. When food is available, larger species with a competitive advantage invest in population growth [55]. This can lead to the increased functional divergence of zooplankton.

5. Conclusions

This study revealed that macrophytes in the coastal zone significantly alter the species and functional diversity of zooplankton communities. Morphologically diverse macrophytes create distinct patterns of diversity along the longitudinal profile of the coastal zone, which can be effectively utilized in environmental protection and restoration activities within aquatic ecosystems. We observed that macrophyte thickets, in comparison to open water zones, consistently support increased species richness, functional richness, and functional divergence in zooplankton communities. Notably, mixed and submerged macrophytes exhibited the greatest impact on enhancing diversity. The extent of these differences in zooplankton species and functional diversity is further amplified by a greater representation of diverse macrophyte belt types within the littoral zone. Furthermore, the presence of submerged macrophytes bordering the open water zone enhances differences in zooplankton diversity across various littoral biotopes. Among the species diversity indices, species richness notably demonstrated a clear relationship with macrophyte type and their projective coverage. Functional diversity indices were found to be more responsive to various vegetation belt types than traditional species diversity indices, thereby recommending them as valuable tools for assessing changes in planktonic communities.

Supplementary Materials

The following supporting information can be downloaded at: https://www.mdpi.com/article/10.3390/d17120812/s1, Figure S1: Boxplots of the Shannon index of zooplankton communities in the studied biotopes. Compact letter designations were added to indicate significant differences; Figure S2: Boxplots of the Pielou index of zooplankton communities in the studied biotopes. Compact letter designations were added to indicate significant differences; Figure S3: Boxplots of the Simpson dominant index of zooplankton communities in the studied biotopes. Compact letter designations were added to indicate significant differences; Figure S4: Boxplots of the functional evenness (FEve) of zooplankton communities in the studied biotopes. Compact letter designations were added to indicate significant differences; Figure S5: Boxplots of the functional divergence (FDiv) of zooplankton communities in the studied biotopes. Compact letter designations were added to indicate significant differences; Figure S6: The correlations between functional richness (FRic), functional evenness (FEve) and functional divergence (FDiv). Pearson’s coefficients of correlation and levels of significance are shown in the panels; Table S1: Species composition of zooplankton in the studied water bodies; Table S2: Database of functional traits of zooplankton.

Author Contributions

D.G., V.B., A.S. and B.Y. substantially contributed to the study’s conception, data acquisition, and analysis; D.G., V.B. and B.Y. performed statistical analysis and translation of the manuscript; A.S., V.Z. and T.Z. substantially contributed to data acquisition and processing; B.Y. contributed to the translation of the manuscript. All authors have read and agreed to the published version of the manuscript.

Funding

The study is supported by the Russian Science Foundation (grant No. 24-74-00016).

Institutional Review Board Statement

Not applicable.

Data Availability Statement

The datasets generated and/or analyzed during the current study are available from the corresponding author upon request.

Conflicts of Interest

The authors declare no conflicts of interest.

References

  1. Gagic, V.; Bartomeus, I.; Jonsson, T.; Taylor, A.; Winqvist, C.; Fischer, C.; Slade, E.M.; Steffan-Dewenter, I.; Emmerson, M.; Potts, S.G.; et al. Functional identity and diversity of animals predict ecosystem functioning better than species-based indices. Proc. R. Soc. B Biol. Sci. 2015, 282, 20142620. [Google Scholar] [CrossRef]
  2. Lavorel, S.; Storkey, J.; Bardgett, R.D.; De Bello, F.; Berg, M.P.; Le Roux, X.; Moretti, M.; Mulder, C.; Pakeman, R.J.; Díaz, S.; et al. A novel framework for linking functional diversity of plants with other trophic levels for the quantification of ecosystem services. J. Veg. Sci. 2013, 24, 942–948. [Google Scholar] [CrossRef]
  3. Mouillot, D.; Graham, N.A.J.; Villéger, S.; Mason, N.W.H.; Bellwood, D.R. A functional approach reveals community responses to disturbances. Trends Ecol. Evol. 2013, 28, 167–177. [Google Scholar] [CrossRef]
  4. Stephan, L.R.; Beisner, B.E.; Oliveira, S.G.M.; Castilho-Noll, M.S.M. Influence of Eichhornia crassipes (Mart) solms on a tropical microcrustacean community based on taxonomic and functional trait diversity. Water 2019, 11, 2423. [Google Scholar] [CrossRef]
  5. Braghin, L.d.S.M.; Dias, J.D.; Simões, N.R.; Bonecker, C.C. Food availability, depth, and turbidity drive zooplankton functional diversity over time in a Neotropical floodplain. Aquat. Sci. 2021, 83, 10. [Google Scholar] [CrossRef]
  6. Villéger, S.; Mason, N.W.H.; Mouillot, D. New Multidimensional Functional Diversity Indices for a Multifaceted Framework in Functional Ecology. Ecology 2008, 89, 2290–2301. [Google Scholar] [CrossRef]
  7. Junka, W.J.; Piedade, M.T.F.; Lourival, R.; Wittmann, F.; Kandus, P.; Lacerda, L.D.; Bozelli, R.L.; Esteves, F.A.; Nunes da Cunha, C.; Maltchik, L.; et al. Brazilian wetlands: Their definition, delineation, and classification for research, sustainable management, and protection. Aquat. Conserv. 2013, 24, 5–22. [Google Scholar] [CrossRef]
  8. Moss, B.; Kornijow, R.; Measey, G.J. The effects of nymphaeid (Nuphar lutea) density and predation by perch (Perca fluviatilis) on the zooplankton communities in a shallow lake. Freshw. Biol. 1998, 39, 689–697. [Google Scholar] [CrossRef]
  9. Scheffer, M. Ecology of Shallow Lakes; Springer Science & Business Media: New York, NY, USA, 2004; 457p. [Google Scholar]
  10. Litchman, E.; Ohman, M.D.; Kiorboe, T. Trait-based approaches to zooplankton communities. J. Plankton Res. 2013, 35, 473–484. [Google Scholar] [CrossRef]
  11. Deosti, S.; Bomfim, F.d.F.; Lansac-Tôha, F.M.; Quirino, B.A.; Bonecker, C.C.; Lansac-Tôha, F.A. Zooplankton taxonomic and functional structure is determined by macrophytes and fish predation in a Neotropical River. Hydrobiologia 2021, 848, 1475–1490. [Google Scholar] [CrossRef]
  12. Lauridsen, T.L.; Jeppesen, E.; Søndergaard, M.; Lodge, D. Horizontal migration of zooplankton: Predator-mediated use of macrophyte habitat. In The Structuring Role of Submerged Macrophytes in Lakes; Springer: New York, NY, USA, 1998; pp. 233–239. [Google Scholar]
  13. Lucena-Moya, P.; Duggan, I.C. Macrophyte architecture affects the abundance and diversity of littoral microfauna. Aquat. Ecol. 2011, 45, 279–287. [Google Scholar] [CrossRef]
  14. Choi, J.Y.; Jeong, K.S.; La, G.H.; Chang, K.H.; Joo, G.J. The influence of aquatic macrophytes on the distribution and feeding habits of two Asplanchna species (A. priodonta and A. herrickii) in shallow wetlands in South Korea. J. Limnol. 2015, 74, 1–11. [Google Scholar] [CrossRef]
  15. Kuczynska-Kippen, N. Zooplankton structure in architecturally differentiated macrophyte habitats of shallow lakes in the Wielkopolska Region, Poland. Int. J. Ocean. Hyd. 2006, 35, 179–191. [Google Scholar]
  16. Kurbatova, S.A.; Lapteva, N.A.; Bykova, S.N.; Yershov, I.Y. Aquatic plants as a factor that changes trophic relations and the structure of zooplankton and microperiphytone communities. Biol. Bull. 2019, 46, 284–293. [Google Scholar] [CrossRef]
  17. Walsh, E.J. Habitat-specific predation susceptibilities of a littoral rotifer to two invertebrate predators. Hydrobiologia 1995, 313, 205–211. [Google Scholar] [CrossRef]
  18. Kuczynska-Kippen, N.; Nagengast, B. The impact of the architecture of macrophytes on the spatial structure of zooplankton of the Wielkowiejskie lake. Rocz. AR Pozn. CCCLIV 2003, 6, 121–129. [Google Scholar]
  19. Choi, J.Y.; Jeong, K.S.; La, G.H.; Joo, G.J. Effect of removal of free-floating macrophytes on zooplankton habitat in shallow wetland. Knowl. Manag. Aquat. Ecos. 2014, 414, 11. [Google Scholar] [CrossRef]
  20. Jeong, K.S.; Choi, J.Y.; Jeong, K.S. Influence of aquatic macrophytes on the interactions among aquatic organisms in shallow wetlands (Upo Wetland, South Korea). J. Ecol. Environ. 2014, 37, 185–194. [Google Scholar] [CrossRef]
  21. Choi, J.Y.; Jeong, K.S.; Kim, S.K.; La, G.H.; Chang, K.H.; Joo, G.J. Role of macrophytes as microhabitats for zooplankton community in lentic freshwater ecosystems of South Korea. Ecol. Inform. 2014, 24, 177–185. [Google Scholar] [CrossRef]
  22. Bolduc, P.; Bertolo, A.; Pinel-Alloul, B. Does submerged aquatic vegetation shape zooplankton community structure and functional diversity? A test with a shallow fluvial lake system. Hydrobiologia 2016, 778, 151–165. [Google Scholar] [CrossRef]
  23. Grzybkowska, M.; Dukowska, M.; Leszczyn’ska, J.; Lik, J.; Szczerkowska-Majchrzak, E.; Przybylski, M. The food resources exploitation by small-sized fish in a riverine macrophyte habitat. Ecol. Indic. 2018, 90, 206–214. [Google Scholar] [CrossRef]
  24. Manatunge, J.; Asaeda, T.; Priyadarshana, T. The influence of structural complexity on fish-zooplankton interactions: A study using artificial submerged macrophytes. Environ. Biol. Fishes 2000, 58, 425–438. [Google Scholar] [CrossRef]
  25. Celewicz-Goldyn, S.; Kuczynska-Kippen, N. Ecological value of macrophyte cover in creating habitat for microalgae (diatoms) and zooplankton (rotifers and crustaceans) in small field and forest water bodies. PLoS ONE 2017, 12, e0177317. [Google Scholar] [CrossRef] [PubMed]
  26. Zeng, L.; Liu, B.; Dai, Z.; Zhou, Q.; Kong, L.; Zhang, Y.; He, F.; Wu, Z. Analyzing the effects of four submerged macrophytes with two contrasting architectures on zooplankton: A mesocosm experiment. J. Limnol. 2017, 76, 581–590. [Google Scholar] [CrossRef]
  27. Meerhoff, M.; Iglesias, C.; De Mello, F.T.; Clemente, J.M.; Jensen, E.; Lauridsen, T.L.; Jeppesen, E. Effects of habitat complexity on community structure and predator avoidance behaviour of littoral zooplankton in temperate versus subtropical shallow lakes. Freshw. Biol. 2007, 52, 1009–1021. [Google Scholar] [CrossRef]
  28. Carniatto, N.; Cunha, E.R.; Thomaz, S.M.; Quirino, B.A.; Fugi, R. Feeding of fish inhabiting native and non-native macrophyte stands in a Neotropical reservoir. Hydrobiologia 2020, 847, 1553–1563. [Google Scholar] [CrossRef]
  29. Gavrilko, D.E.; Bubnov, V.A.; Sarapkin, A.Y.; Zhikharev, V.S. Spatial distribution of zooplankton communities in the littoral zone in small lakes of Nizhny Novgorod Region (European Russia). Limnol. Freshw. Biol. 2025, 4, 659–680. [Google Scholar] [CrossRef]
  30. Błędzki, L.A.; Rybak, J.I. Freshwater Crustacean Zooplankton of Europe: Cladocera & Copepoda (Calanoida, Cyclopoida) Key to Species Identification, with Notes on Ecology, Distribution, Methods and Introduction to Data Analysis; Springer: Cham, Switzerland, 2016; p. 918. [Google Scholar]
  31. Rogers, D.C.; Thorp, J.H. Keys to Palaearctic Fauna. Thorp and Covichʹs Freshwater. Invertebrates; Academic Press: Oxford, UK, 2019; Volume IV, p. 920. [Google Scholar]
  32. Korovchinsky, N.M.; Kotov, A.A.; Sinev, A.Y.; Neretina, A.N.; Garibyan, P.G. Cladocera (Crustacea: Cladocera) of Northern Eurasia; KMK Scientific Press Ltd.: Moscow, Russia, 2021; Volume II, p. 544. [Google Scholar]
  33. Papchenkov, V.G. Vegetation Cover of Reservoirs and Watercourses of the Middle Volga Region; SMR MUBiNT: Yaroslavl, Russia, 2001. (In Russian) [Google Scholar]
  34. Carlson, R.E. A trophic state index for lakes. Limnol. Oceanogr. 1977, 22, 361–369. [Google Scholar] [CrossRef]
  35. Legendre, P.; Legendre, L. Numerical Ecology; Elsevier: Oxford, UK, 2012; p. 990. [Google Scholar]
  36. Gavrilko, D.E.; Shurganova, G.V.; Kudrin, I.A.; Yakimov, B.N. Identification of Freshwater Zooplankton Functional Groups Based on the Functional Traits of Species. Biol. Bull. 2021, 48, 1849–1856. [Google Scholar] [CrossRef]
  37. R Core Team. R: A Language and Environment for Statistical Computing. 2020. Available online: http://www.R--project.org/ (accessed on 26 October 2025).
  38. Lauridsen, T.L.; Lodge, D. Avoidance by Daphnia magna of fish and macrophytes: Chemical cues and predator-mediated use of macrophytes habitat. Limnol. Oceanogr. 1996, 41, 794–798. [Google Scholar] [CrossRef]
  39. Jeppesen, E.; Jensen, J.P.; Sondergaard, M.; Lauridsen, T.; Pedersen, L.J.; Jensen, L. Top-down control in freshwater lakes: The role of nutrient status, submerged macrophytes and water depth. Hydrobiologia 1997, 342/343, 151–164. [Google Scholar] [CrossRef]
  40. Karpowicz, M.; Ejsmont-Karabin, J.; Strzalek, M. Biodiversity of zooplankton (Rotifera and Crustacea) in water soldier (Stratiotes aloides) habitats. Biologia 2016, 71, 563–569. [Google Scholar] [CrossRef]
  41. Kuczynska-Kippen, N. The Impact of the macrophyte substratum and season on crustacean zooplankton communities of three shallow and macrophyte-dominated lakes. J. Freshw. Ecol. 2009, 24, 375–382. [Google Scholar] [CrossRef]
  42. Semenchenko, V.P.; Razlutsky, V.I. Factors determining the daily distribution and movements of zooplankton in the littoral zone of freshwater lakes. J. Sib. Fed. Univ. Ser. Biol. 2009, 2, 191–225. (In Russian) [Google Scholar]
  43. Barnett, A.J.; Beisner, B.E. Zooplankton biodiversity and lake trophic state: Explanations invoking resource abundance and distribution. Ecology 2007, 88, 1675–1686. [Google Scholar] [CrossRef] [PubMed]
  44. Massicotte, P.; Frenette, J.-J.; Proulx, R.; Pinel-Alloul, B.; Bertolo, A. Riverscape heterogeneity explains spatial variation in zooplankton functional evenness and biomass in a large river ecosystem. Landsc. Ecol. 2014, 29, 67–79. [Google Scholar] [CrossRef]
  45. Gliwicz, Z.M. Between Hazards of Starvation and Risk of Predation: The Ecology of Offshore Animals; International ecology institute: Oldendorf/Luhe, Germany, 2003; 377p. [Google Scholar]
  46. Vogt, R.J.; Peres-Neto, P.R.; Beisner, B.E. Using functional traits to investigate the determinants of crustacean zooplankton community structure. Oikos 2013, 122, 1700–1709. [Google Scholar] [CrossRef]
  47. Webster, K.E.; Peters, R.H. Some size dependent inhibition of larger cladocerans filter in filamentous suspensions. Limnol. Oceanogr. 1978, 23, 1238–1245. [Google Scholar] [CrossRef]
  48. Gliwicz, M.Z.; Lampert, W. Food thresholds in Daphnia in the absence and presence of blue-green filaments. Ecology 1990, 71, 691–702. [Google Scholar] [CrossRef]
  49. Ejsmont-Karabin, J. The usefulness of zooplankton as lake ecosystem indicators: Rotifer trophic state index. Pol. J. Ecol. 2012, 60, 339–350. [Google Scholar]
  50. Karpowicz, M.; Ejsmont-Karabin, J. Diversity and structure of pelagic zooplankton (Crustacea, Rotifera) in NE Poland. Water 2021, 13, 456. [Google Scholar] [CrossRef]
  51. Ochocka, A. Zooplankton index for shallow lakes assessment: Elaboration of a new classification method for Polish lakes. Water 2024, 16, 2730. [Google Scholar] [CrossRef]
  52. Afonina, E.Y.; Tashlykova, N.A. Structural and functional diversity of plankton communities along lake salinity gradients. Aquat. Ecol. 2024, 58, 717–740. [Google Scholar] [CrossRef]
  53. Afonina, E.; Tashlykova, N.; Borzenko, S. Saline lakes of Transbaikalia (Russia): Limnology and diversity of plankton communities. Limnology 2025, 26, 333–348. [Google Scholar] [CrossRef]
  54. Gutierrez, M.F.; Tavşanoğlu, Ű.N.; Vidal, N.; Yu, J.; Teixeira de Mello, F.; Cakiroglu, A.; He, H.; Liu, Z.; Jeppesen, E. Salinity shapes zooplankton communities and functional diversity and has complex effects on size structure in lakes. Hydrobiologia 2018, 813, 237–255. [Google Scholar] [CrossRef]
  55. Simões, N.R.; Dias, J.D.; Leal, C.M.; Braghin, L.S.M.; Lansac-Tôha, F.A.; Bonecker, C.C. Floods control the influence of environmental gradients on the diversity of zooplankton communities in a Neotropical floodplain. Aquat. Sci. 2013, 75, 607–617. [Google Scholar] [CrossRef]
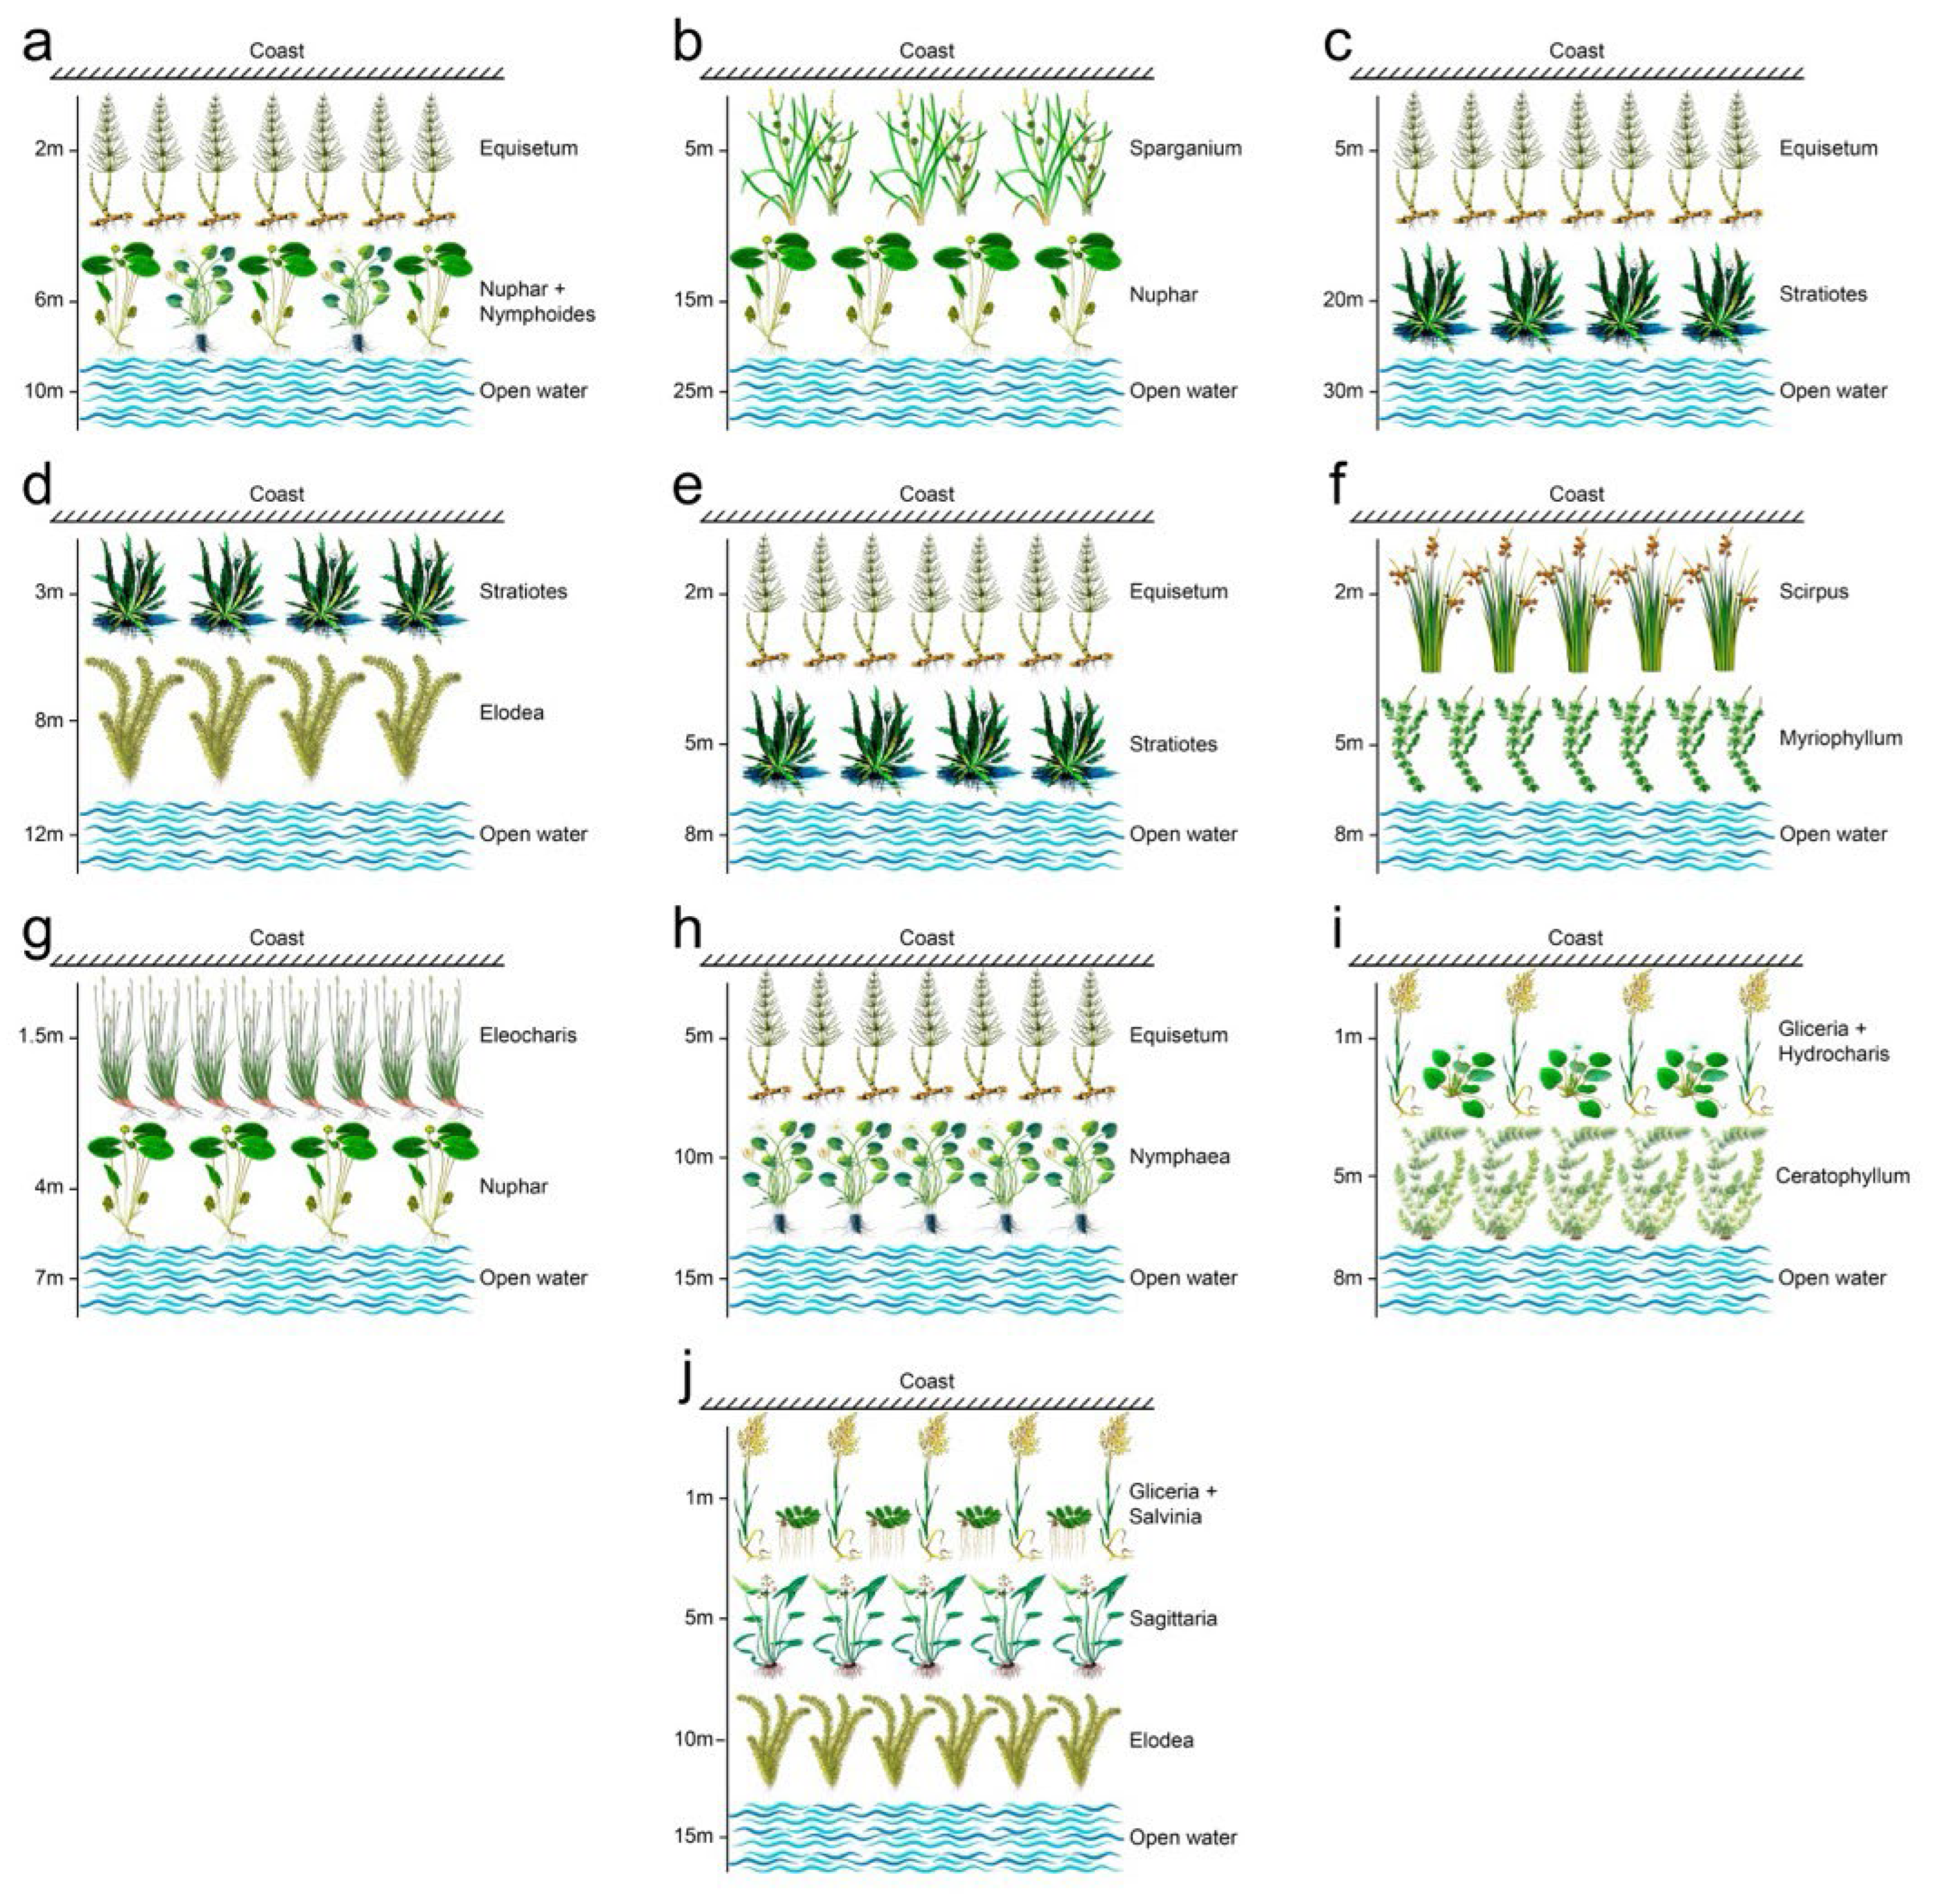
Figure 1. Location map of the studied biotopes: the Vetluga (a), Sura (b), Kerzenets (c) Rivers, Vyunitsa River Pond (d), Chernaya River Pond (e), Shuvalov Canal (f) of Lakes Charskoe (g), Golovkovskoe (h), Malyshevskoe (i), and Khaltzovskoe (j). The numbers on the left indicate the distance from the shore.
Diversity 17 00812 g001
Figure 2. Boxplots of the species richness of zooplankton communities in the studied biotopes. Biotopes are described as in Figure 1. Compact letter designations were added to indicate significant differences.
Diversity 17 00812 g002
Figure 3. Boxplots of the functional richness (FRic) of zooplankton communities in the studied biotopes. Compact letter designations were added to indicate significant differences.
Diversity 17 00812 g003
Table 1. Coordinates of surveyed water bodies.
Water BodyYearCoordinates (N, E)
Vetluga River202256°42′32″, 46°27′31″
Sura River56°11′43″, 46°00′62″
Kerzhenets River202356°08′95″, 44°96′86″
Charskoe Lake202455°51′84″, 43°18′69″
Golovkovskoe Lake56°33′28″, 43°70′54″
Malyshevskoe Lake56°20′27″, 43°82′81″
Khaltzovskoe Lake56°38′43″, 43°86′02″
Pond of the Vyunitsa River56°24′97″, 43°74′21″
Pond of the Chernaya River56°39′56″, 43°77′25″
Shuvalov Canal56°28′16″, 43°86′76″
Table 2. Species richness of zooplankton in the studied water bodies.
Water BodyTotalRotiferaCladoceraCopepoda
Vetluga River105503916
Sura River100493714
Kerzhenets River156845121
Charskoe Lake74372611
Golovkovskoe Lake8555219
Malyshevskoe Lake102632613
Khaltzovskoe Lake114614013
Pond the Vyunitsa River89433214
Pond of the Chernaya River107523817
Shuvalov Canal94522814
Table 3. Results of multivariate regression between diversity indices and environmental parameters.
PredictorStatisticsSpecies RichnessFRicFEveFDivShannon IndexPielou IndexSimpson Index
Water temperatureEst.Coef−1.720−0.0010.0005−0.009−0.135−0.0200.021
Std.Error0.4890.0060.0040.0050.0330.0060.007
p-value<0.0010.8020.8960.057<0.0010.0020.002
pHEst.Coef−5.453−0.110−0.012−0.0090.1730.055−0.040
Std.Error1.5220.0170.0110.0140.1020.0190.020
p-value<0.001<0.0010.2830.5330.0910.0050.051
Electrical conductivityEst.Coef0.008−0.00008−0.000005−0.000030.0010.00009−0.00001
Std.Error0.0050.000050.000040.000050.00030.000060.00006
p-value0.1070.1590.8830.4490.0600.1290.875
Oxygen contentEst.Coef0.9790.0310.001−0.0004−0.063−0.0170.010
Std.Error0.4150.0050.0030.0040.0280.0050.006
p-value0.020<0.0010.6870.9270.0240.0020.065
TSIEst.Coef0.188−0.003−0.0020.0030.0090.001−0.003
Std.Error0.1360.0020.0010.0010.0090.0020.002
p-value0.1680.0470.1390.0540.3330.6910.130
Projective covering of macrophytesEst.Coef14.3700.103−0.0310.0700.214−0.023−0.021
Std.Error1.8920.0210.0140.0180.1260.0240.025
p-value<0.001<0.0010.029<0.0010.0920.3480.403
Disclaimer/Publisher’s Note: The statements, opinions and data contained in all publications are solely those of the individual author(s) and contributor(s) and not of MDPI and/or the editor(s). MDPI and/or the editor(s) disclaim responsibility for any injury to people or property resulting from any ideas, methods, instructions or products referred to in the content.