Article

DNA Barcoding Applications in Ants (Hymenoptera: Formicidae)

1
Key Laboratory of Ecology of Rare & Endangered Species & Environmental Protection, Ministry of Education, Guangxi Normal University, Guilin 541006, China
2
Guangxi Key Laboratory of Rare & Endangered Animal Ecology, Guangxi Normal University, Guilin 541006, China
3
College of Life Science, Guangxi Normal University, Guilin 541006, China
*
Author to whom correspondence should be addressed.
Diversity 2025, 17(11), 783; https://doi.org/10.3390/d17110783
Submission received: 15 July 2025 / Revised: 31 October 2025 / Accepted: 4 November 2025 / Published: 7 November 2025
(This article belongs to the Special Issue Systematics, Evolution and Diversity in Ants)

Abstract

Taxonomy is fundamental to all organismic research. Therefore, the integration of molecular and morphological data is increasingly encouraged for more accurate species identification. However, the emphasis on and application of DNA barcoding methods appear to vary across different taxonomic groups. Ants, among the most prominent invertebrate groups, seem to have their taxonomic research primarily focused on morphological characteristics, with studies incorporating molecular species identification remaining relatively underrepresented. Thus, understanding the application profile of DNA barcoding in ants can provide guidance for future taxonomic research. By downloading and analyzing 350,686 sequences of eight gene fragments from the NCBI and BOLD databases, it was found that COI remains the most prevalent molecular marker, yet sequences vary in length. Only 190,880 sequences (67%) meet or exceed the standard length (658 bp), covering 15 subfamilies, 273 genera, and 3226 species (<23.00%). Among COI sequences, 32,444 sequences (9.60%) are unidentified species, spanning 12 subfamilies and 175 genera; sequences from Europe and America dominate (60%), while those from China are exceptionally scarce (0.35%). DNA barcoding analysis of representative sequences revealed inconsistencies with annotated species for some entries. These findings demonstrate that molecular data for ants are extremely limited, and existing data exhibit significant spatial and taxonomic biases. Moving forward, enhancing systematic taxonomic studies of Chinese ants—particularly accumulating DNA barcoding databases—is essential to uncover greater ant diversity, monitor invasive species, and inform conservation strategies.

1. Introduction

Taxonomy, which aims to achieve scientific species delineation and provide precise species data and information, is fundamentally a discipline dedicated to the systematic classification of organisms [1,2]. More broadly, phylogenetics and evolutionary studies that rely on classical taxonomy collectively constitute the research domain of systematics [3]. Undoubtedly, taxonomy is a fundamental and critically important scientific discipline, essential to all organismic research [4].
Broadly speaking, taxonomy is a highly comprehensive discipline encompassing morphology, ecology, biogeography, molecular biology, and beyond, which has given rise to diverse methodological approaches [5]. Among these, traditional classical taxonomy relies heavily on the extensive experience of taxonomists, involving time-intensive training and often entailing subjectivity [6]. Since its proposal in 2003, DNA barcoding technology—a method for species delineation based on genetic sequence variation—has garnered widespread attention from taxonomists due to its objectivity, speed, accuracy, and high applicability [7]. Certainly, this approach often entails additional experimental and sequencing costs. Currently, integrating morphological and molecular data, alongside other data types, is increasingly encouraged for more accurate species identification [8], especially in insects.
The enormous species richness and minute body size of insects substantially increase the workload of morphological classification [9]. Meanwhile, the larval–adult morphological disjunction in holometabolous groups, sexual selection-driven sexual dimorphism, environmentally induced phenotypic plasticity, and morphological adaptive convergence due to convergent evolution collectively weaken the correlation between morphological traits and phylogeny [10,11,12]. Consequently, traditional taxonomy faces risks of misidentifying cryptic species or erroneously merging sister taxa [9,13,14]. It is noteworthy that DNA barcoding technology, which relies on molecular data, can partially overcome the aforementioned challenges and has been widely applied in insect taxonomy [15,16]. However, the emphasis on and application of DNA barcoding methods appear to vary across different taxonomic groups, such as ants.
Although ants (Hymenoptera: Formicidae) constitute one of the most intensively studied and taxonomically well-represented groups among invertebrates, with over 14,000 described species [17], taxonomic research has been primarily focused on morphological characteristics, with studies incorporating molecular species identification remaining relatively underrepresented [18,19]. Furthermore, the unique biological characteristics of ants pose significant challenges to classical taxonomic research in this group. For instance, the polymorphism observed in ant populations leads to distinct castes such as reproductive individuals and workers, which exhibit substantial morphological disparities between them. Even within the same caste, morphological variations may occur—such as the size differentiation commonly seen among workers in many ant species—posing considerable obstacles to traditional morphology-based identification using dichotomous keys. Additionally, the widespread presence of cryptic species within Formicidae—and across insect taxa more broadly—further complicates classical morphological species delineation, underscoring the necessity of employing molecular tools such as DNA barcoding. Therefore, this study systematically collected and compiled molecular markers of ants to profile the application of DNA barcoding within this taxon, thereby providing guidance for future taxonomic research on Formicidae.

2. Materials and Methods

2.1. Data Collection

After conducting a literature search using keywords such as “ant,” “taxonomy,” and “DNA barcoding” on Web of Science and carefully reviewing the relevant publications [20,21,22,23,24,25], eight commonly used target molecular markers were ultimately identified for investigation, including three mitochondrial gene sequences, cytochrome c oxidase subunit I (COI), cytochrome c oxidase subunit II (COII), and cytochrome b (Cytb), and five nuclear gene sequences, 18S ribosomal RNA (18S rRNA), 28S ribosomal RNA (28S rRNA), arginine kinase (ArgK), elongation factor 1-alpha (EF-1α), and long-wavelength rhodopsin (LWRh).
Based on the R “refdb” and “bold” package [26], molecular sequences (in FASTA format) for all Formicidae species were downloaded from the National Center for Biotechnology Information (NCBI, https://www.ncbi.nlm.nih.gov/ (accessed on 19 November 2023)) and Barcode of Life Data Systems (BOLD, https://boldsystems.org/ (accessed on 30 July 2025)) databases. For detailed code, see Appendix A. This included metadata such as information of species, collection locality, sequence length, submitting institution, and date for each sequence, providing high-quality data support for subsequent sequence alignment and statistical analysis. Then, data cleaning was performed to remove invalid sequences that did not belong to the family Formicidae or were not associated with the target genetic markers. Ultimately, 350,686 valid sequences were retained for subsequent analysis.

2.2. Statistical Analysis

Annual submission volumes for each molecular marker were statistically analyzed to identify temporal trends and growth patterns. Length distribution analysis for all sequence types, with a special focus on COI sequences being compared against the standard 658-bp benchmark, was conducted to assess its quality. Collection site coordinates (latitude/longitude) were projected onto the world map by fishnet (2 × 2 arc min) or country using an equal-area projection to clarify the distribution pattern. Species annotation information was categorized at subfamily, genus, and species level (including undetermined species labeled as “sp.”) to determine corresponding species counts. Lastly, research collaboration network analysis among the first three authors, research institutes, and corresponding countries was conducted.

2.3. Barcoding Analysis

COI sequences (1–2 per species) were filtered based on length proximity to the standard reference (658 bp). A total of 3311 high-quality target sequences were retained. The maximum likelihood (ML) phylogenetic tree was constructed using IQ-TREE software (version 2.3.6) [27]. The optimal substitution model was automatically selected via -m MFP. A total of 1000 Bootstrap replicates (-bb 1000) were performed, with support values ≥70% considered reliable. DNA barcoding was conducted using the ASAP (https://bioinfo.mnhn.fr/abi/public/asap/) [28], with genetic distance set as the K2P (Kimura 2-parameter) model and the maximum intraspecific divergence threshold set as 0.05–0.10, with 1000 bootstrap replicates to validate partition stability. Lastly, based on the above partition result, iTOL-compatible annotation files were obtained using the R “itol.toolkit” package [29] and then uploaded to the iTOL (https://itol.embl.de/login.cgi) platform for visualization [30].

3. Results

COI exhibited the largest sample size, with 337,887 sequences spanning 4317 species, 270 genera, and 15 subfamilies. Notably, 9.60% of these sequences (n = 32,444) were classified as undetermined species (sp.). Among other genetic markers, 28S rRNA ranked second, with 4560 sequences covering 304 genera and 1396 species; Cytb followed, with 3509 sequences from 73 genera and 623 species; and EF-1α had the smallest dataset, with only 112 sequences from 11 genera and 78 species (Table 1).

3.1. Temporal Trend of Sequence Development

From 1996 to 2023, the annual submission volumes of each genetic marker consistently exhibited a sustained growth trend. Among these, the submission volumes of COI, 28S rRNA, and Cytb genes increased most significantly, establishing them as the three most frequently utilized molecular markers in ant taxonomic studies (Figure 1). Considering the universality and representativeness of COI sequences (with the largest quantity and broadest species coverage), subsequent analyses were primarily based on the COI dataset.

3.2. Sequence Length Distribution

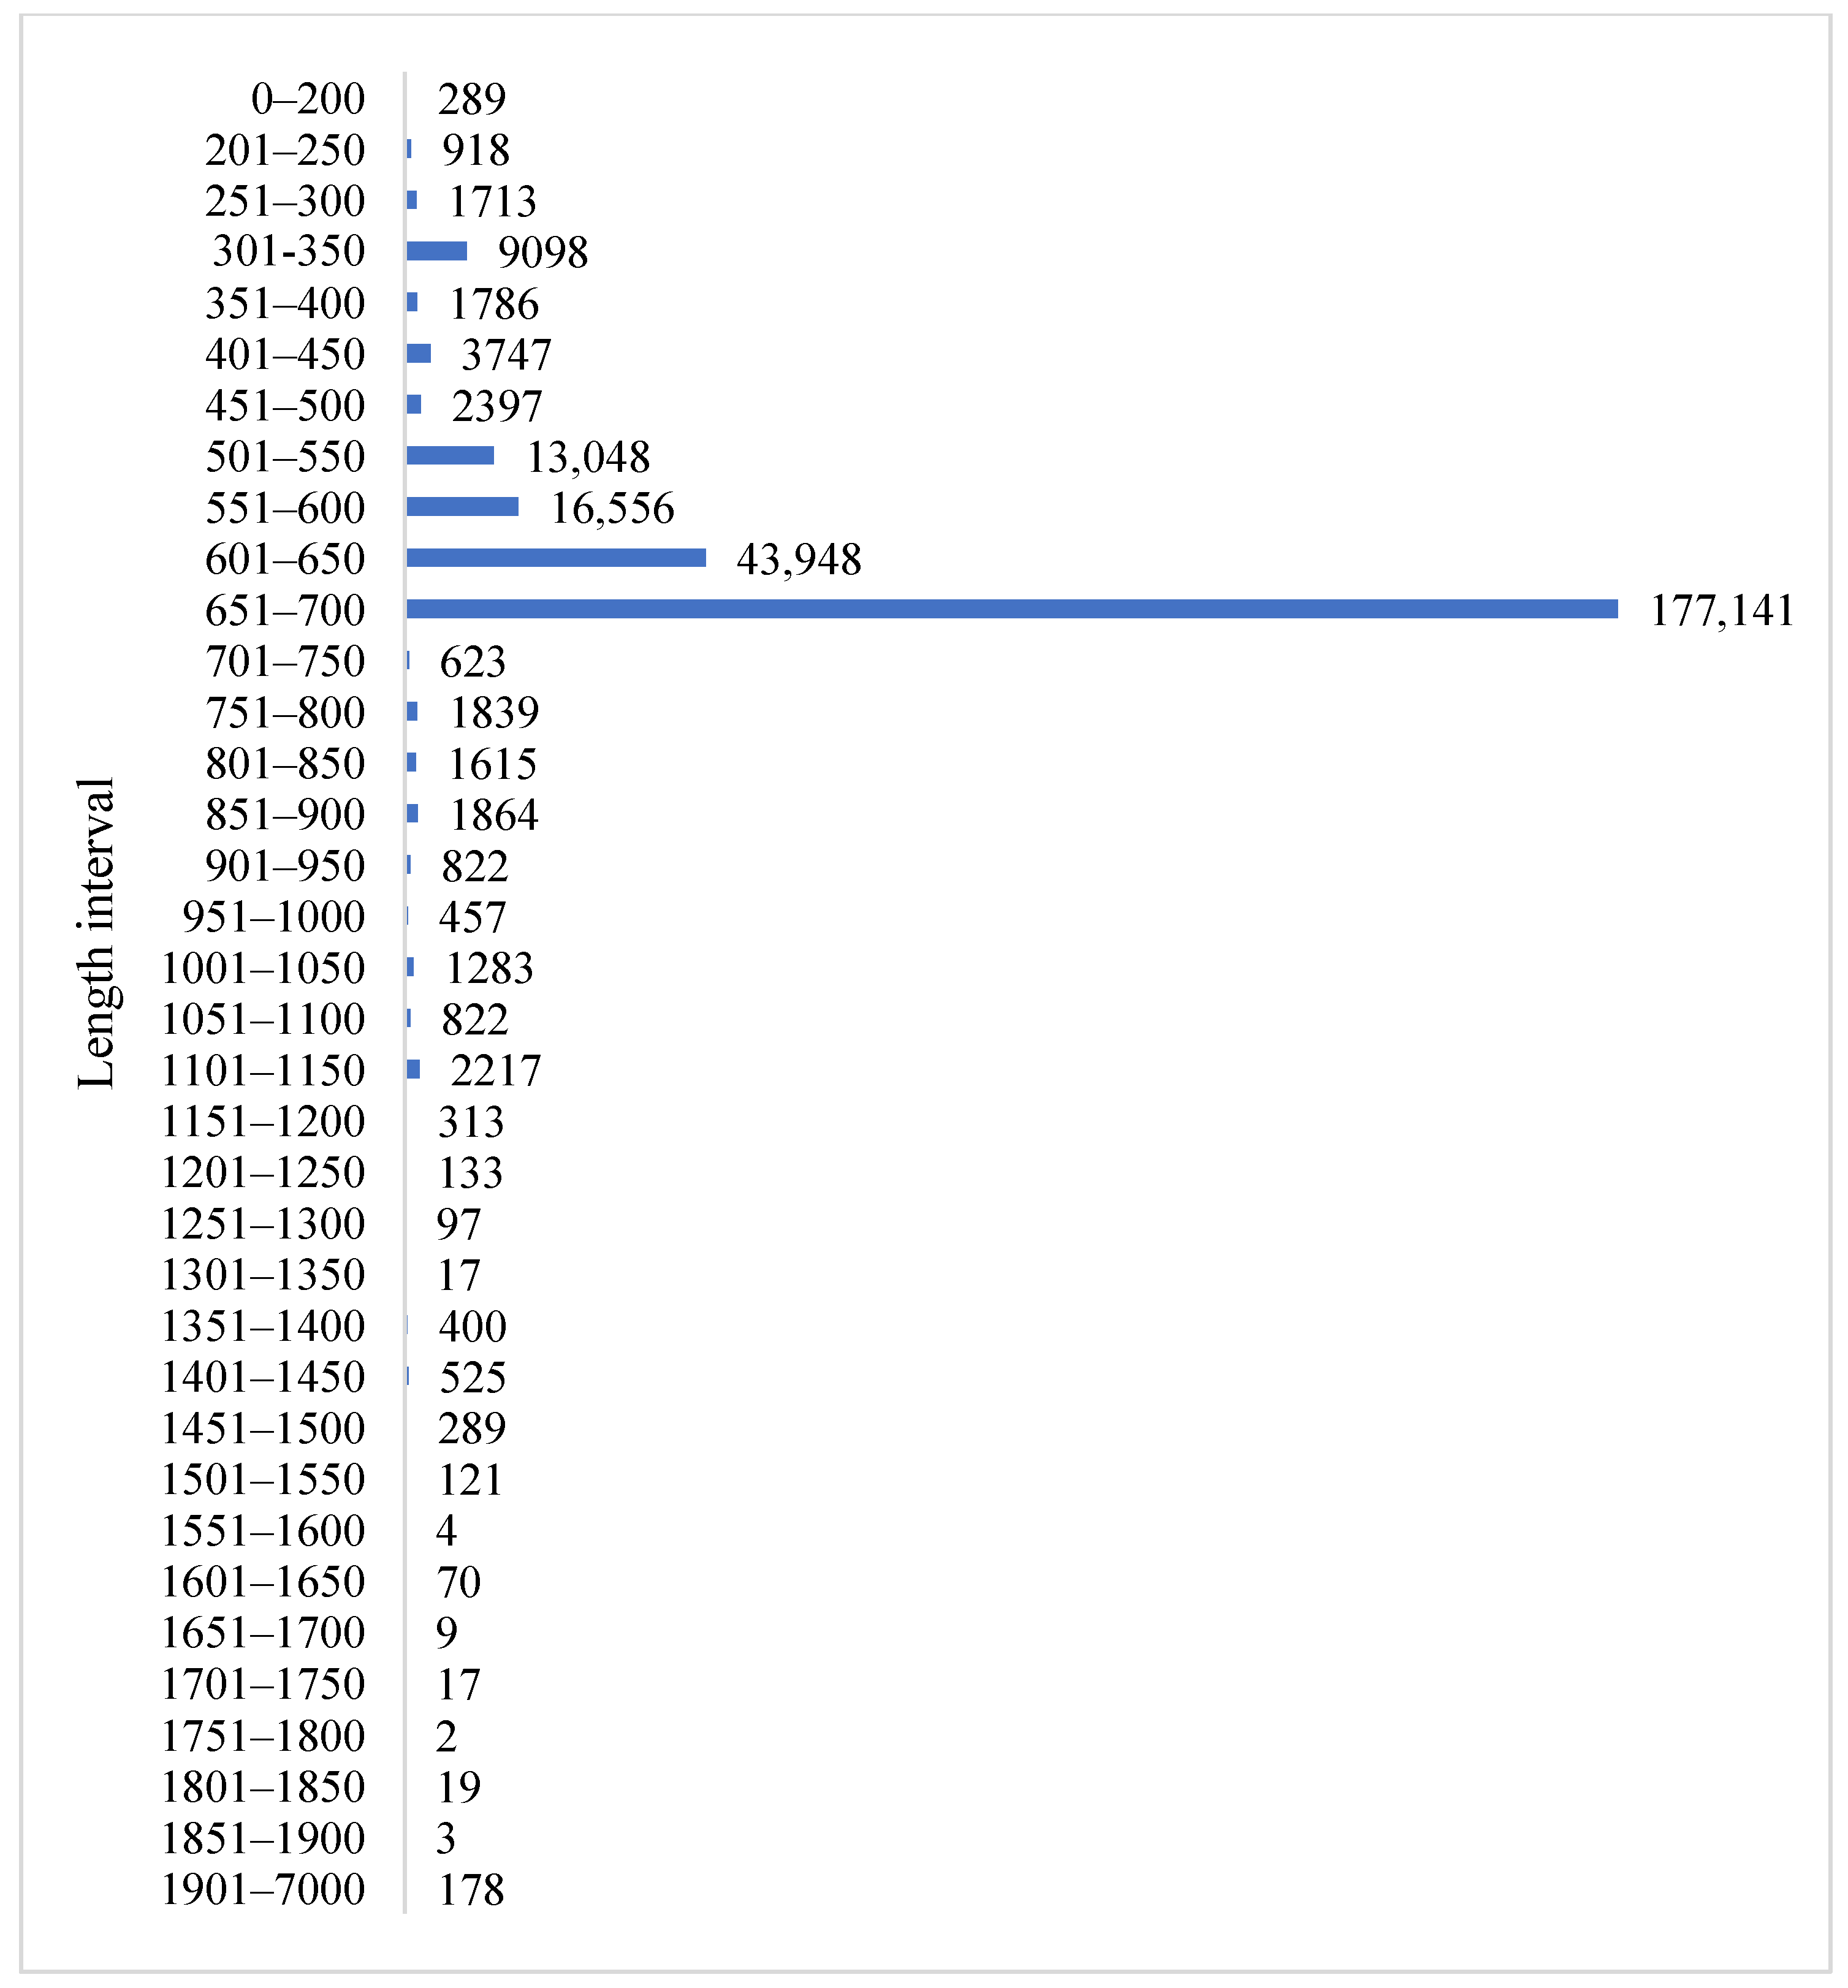
COI sequences exhibit an extensive length range (72–6883 bp), with apparent variations in submission volumes across different length intervals (Figure 2). Sequences including the standard length (658 bp) range (651–700 bp) totaled 177,141 submissions, representing the predominant category. Among these, standard length (658 bp) accounted for 173,315 submissions (98.0% of this interval), establishing this single-length fragment as the core component and the most submitted COI gene length overall. Sequences exceeding the standard length (658 bp) comprised approximately 20,881 submissions, constituting 7.30% of the total COI dataset.

3.3. Spatial Distribution Pattern

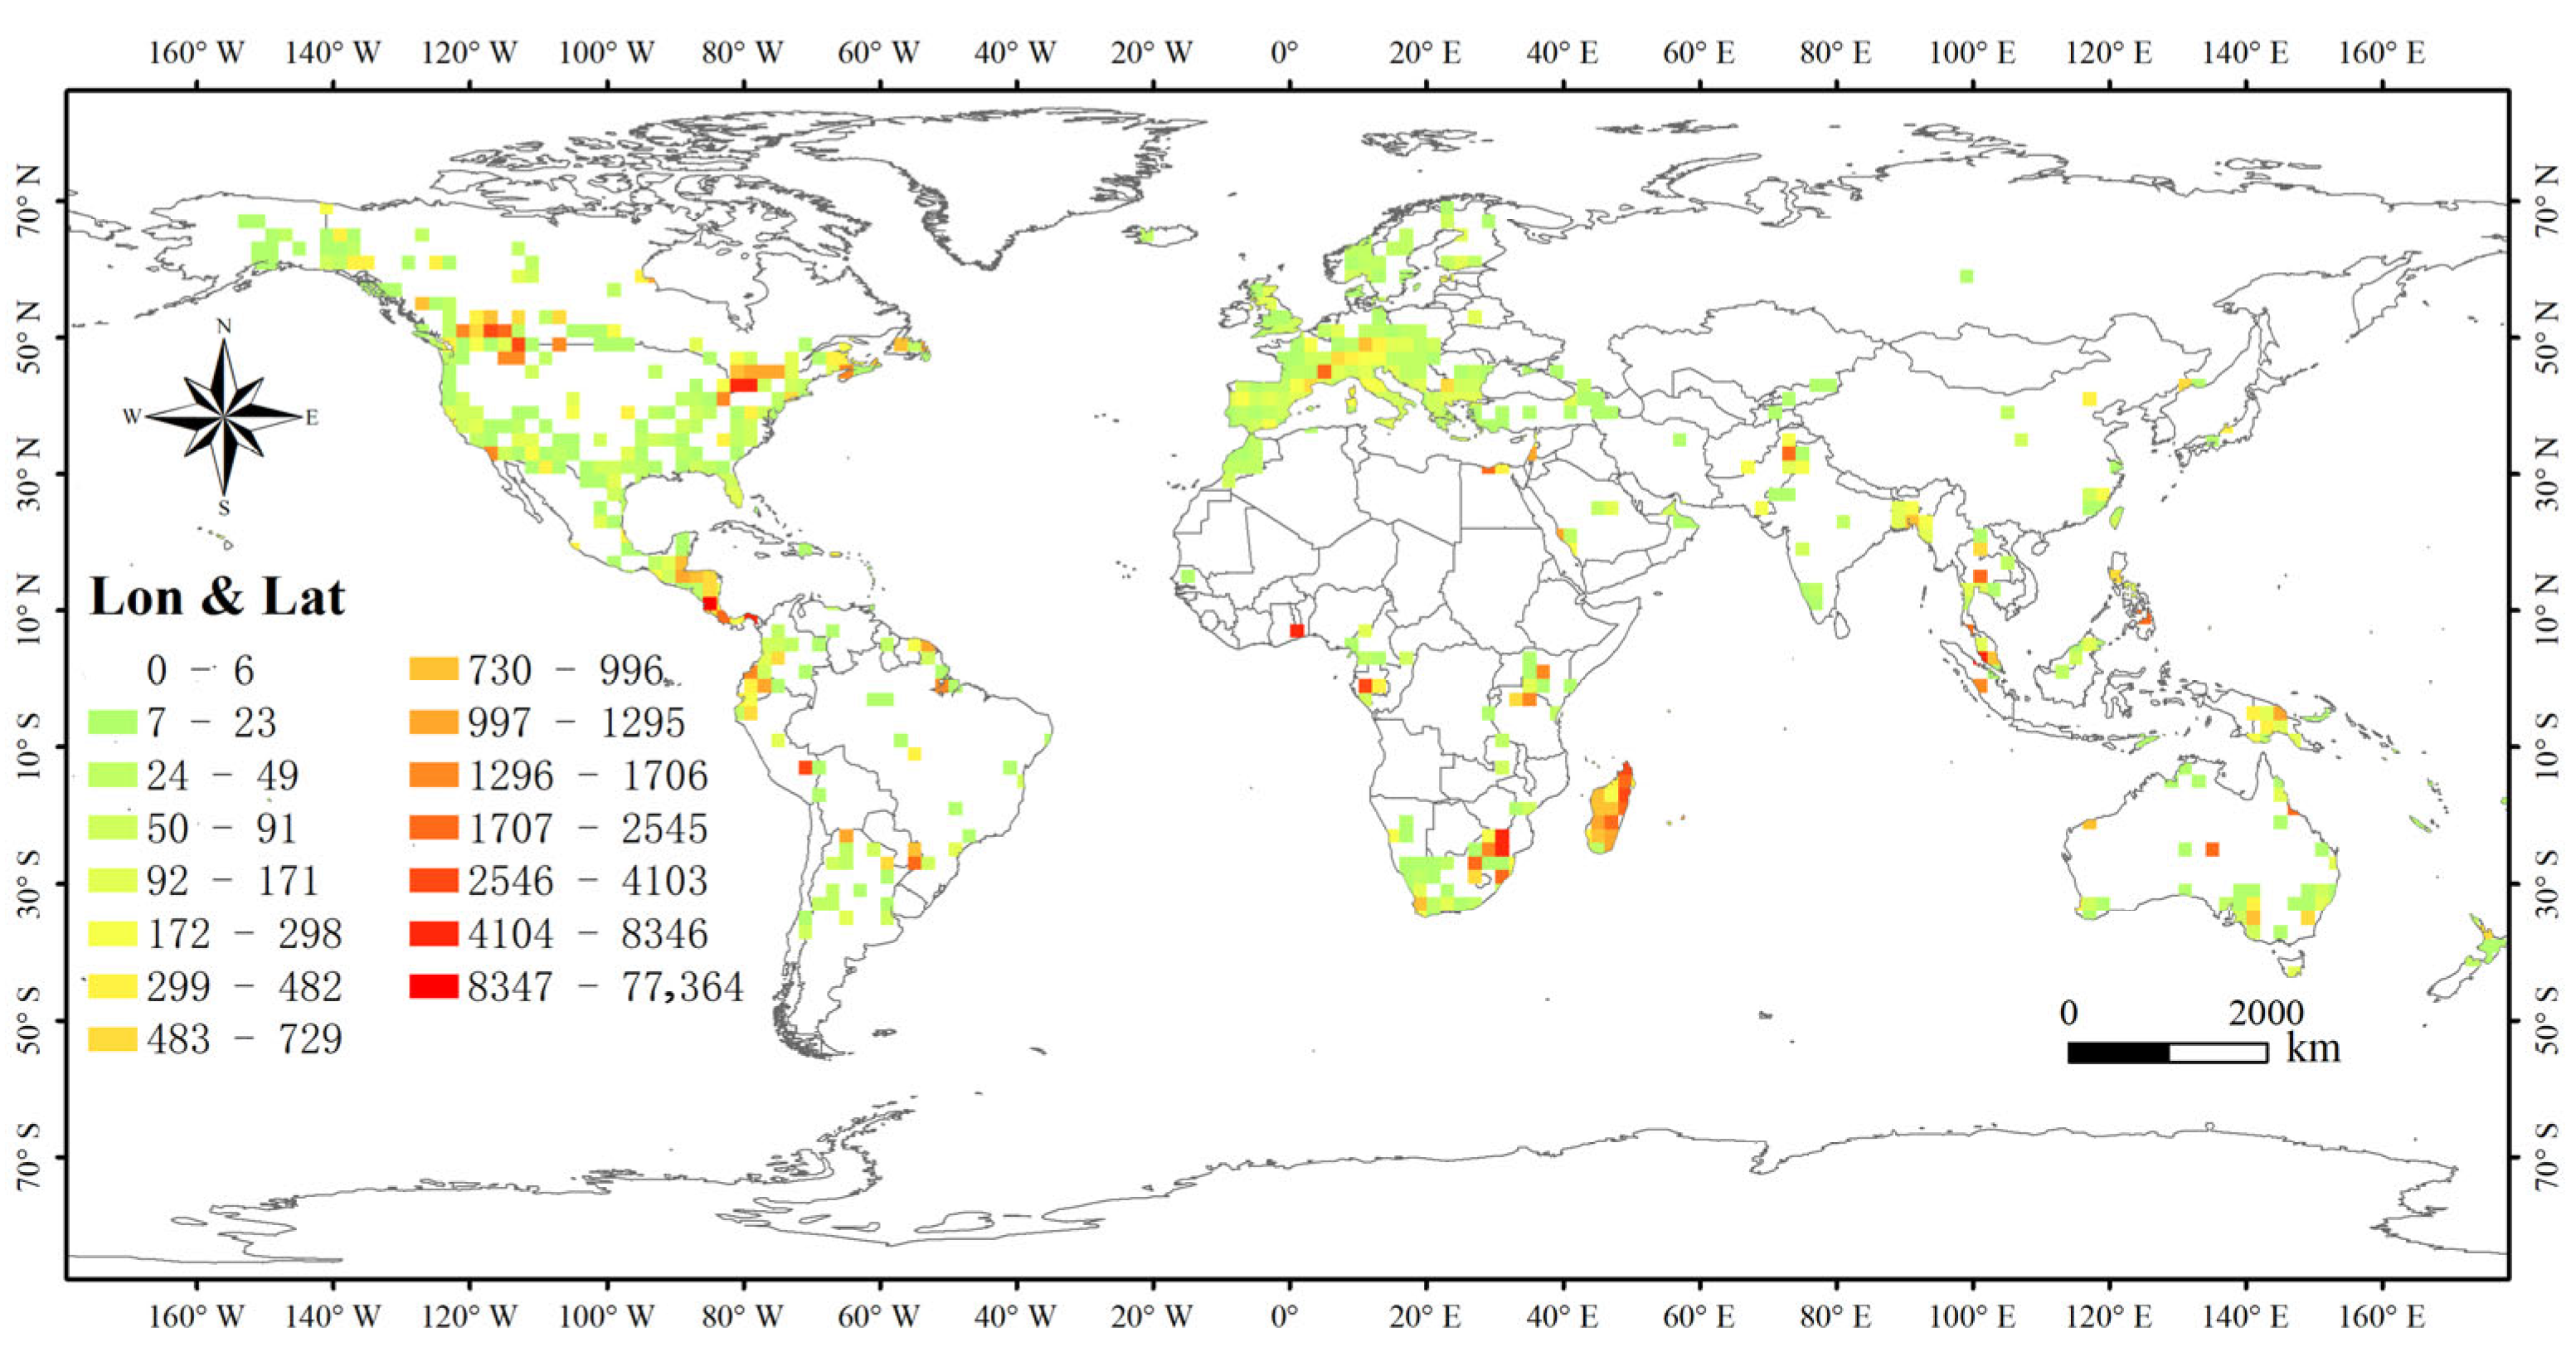
The spatial distribution of COI sequence sampling sites exhibits significant heterogeneity (Figure 3). Eastern North America and Europe (particularly Central and Western Europe) are the most densely sampled regions, followed by tropical America (e.g., the Amazon Basin), Madagascar in southeastern Africa, and some islands in Southeast Asia. In contrast, sampling coverage is sparse in Central Asia, Russia, parts of South America, and most of Oceania.
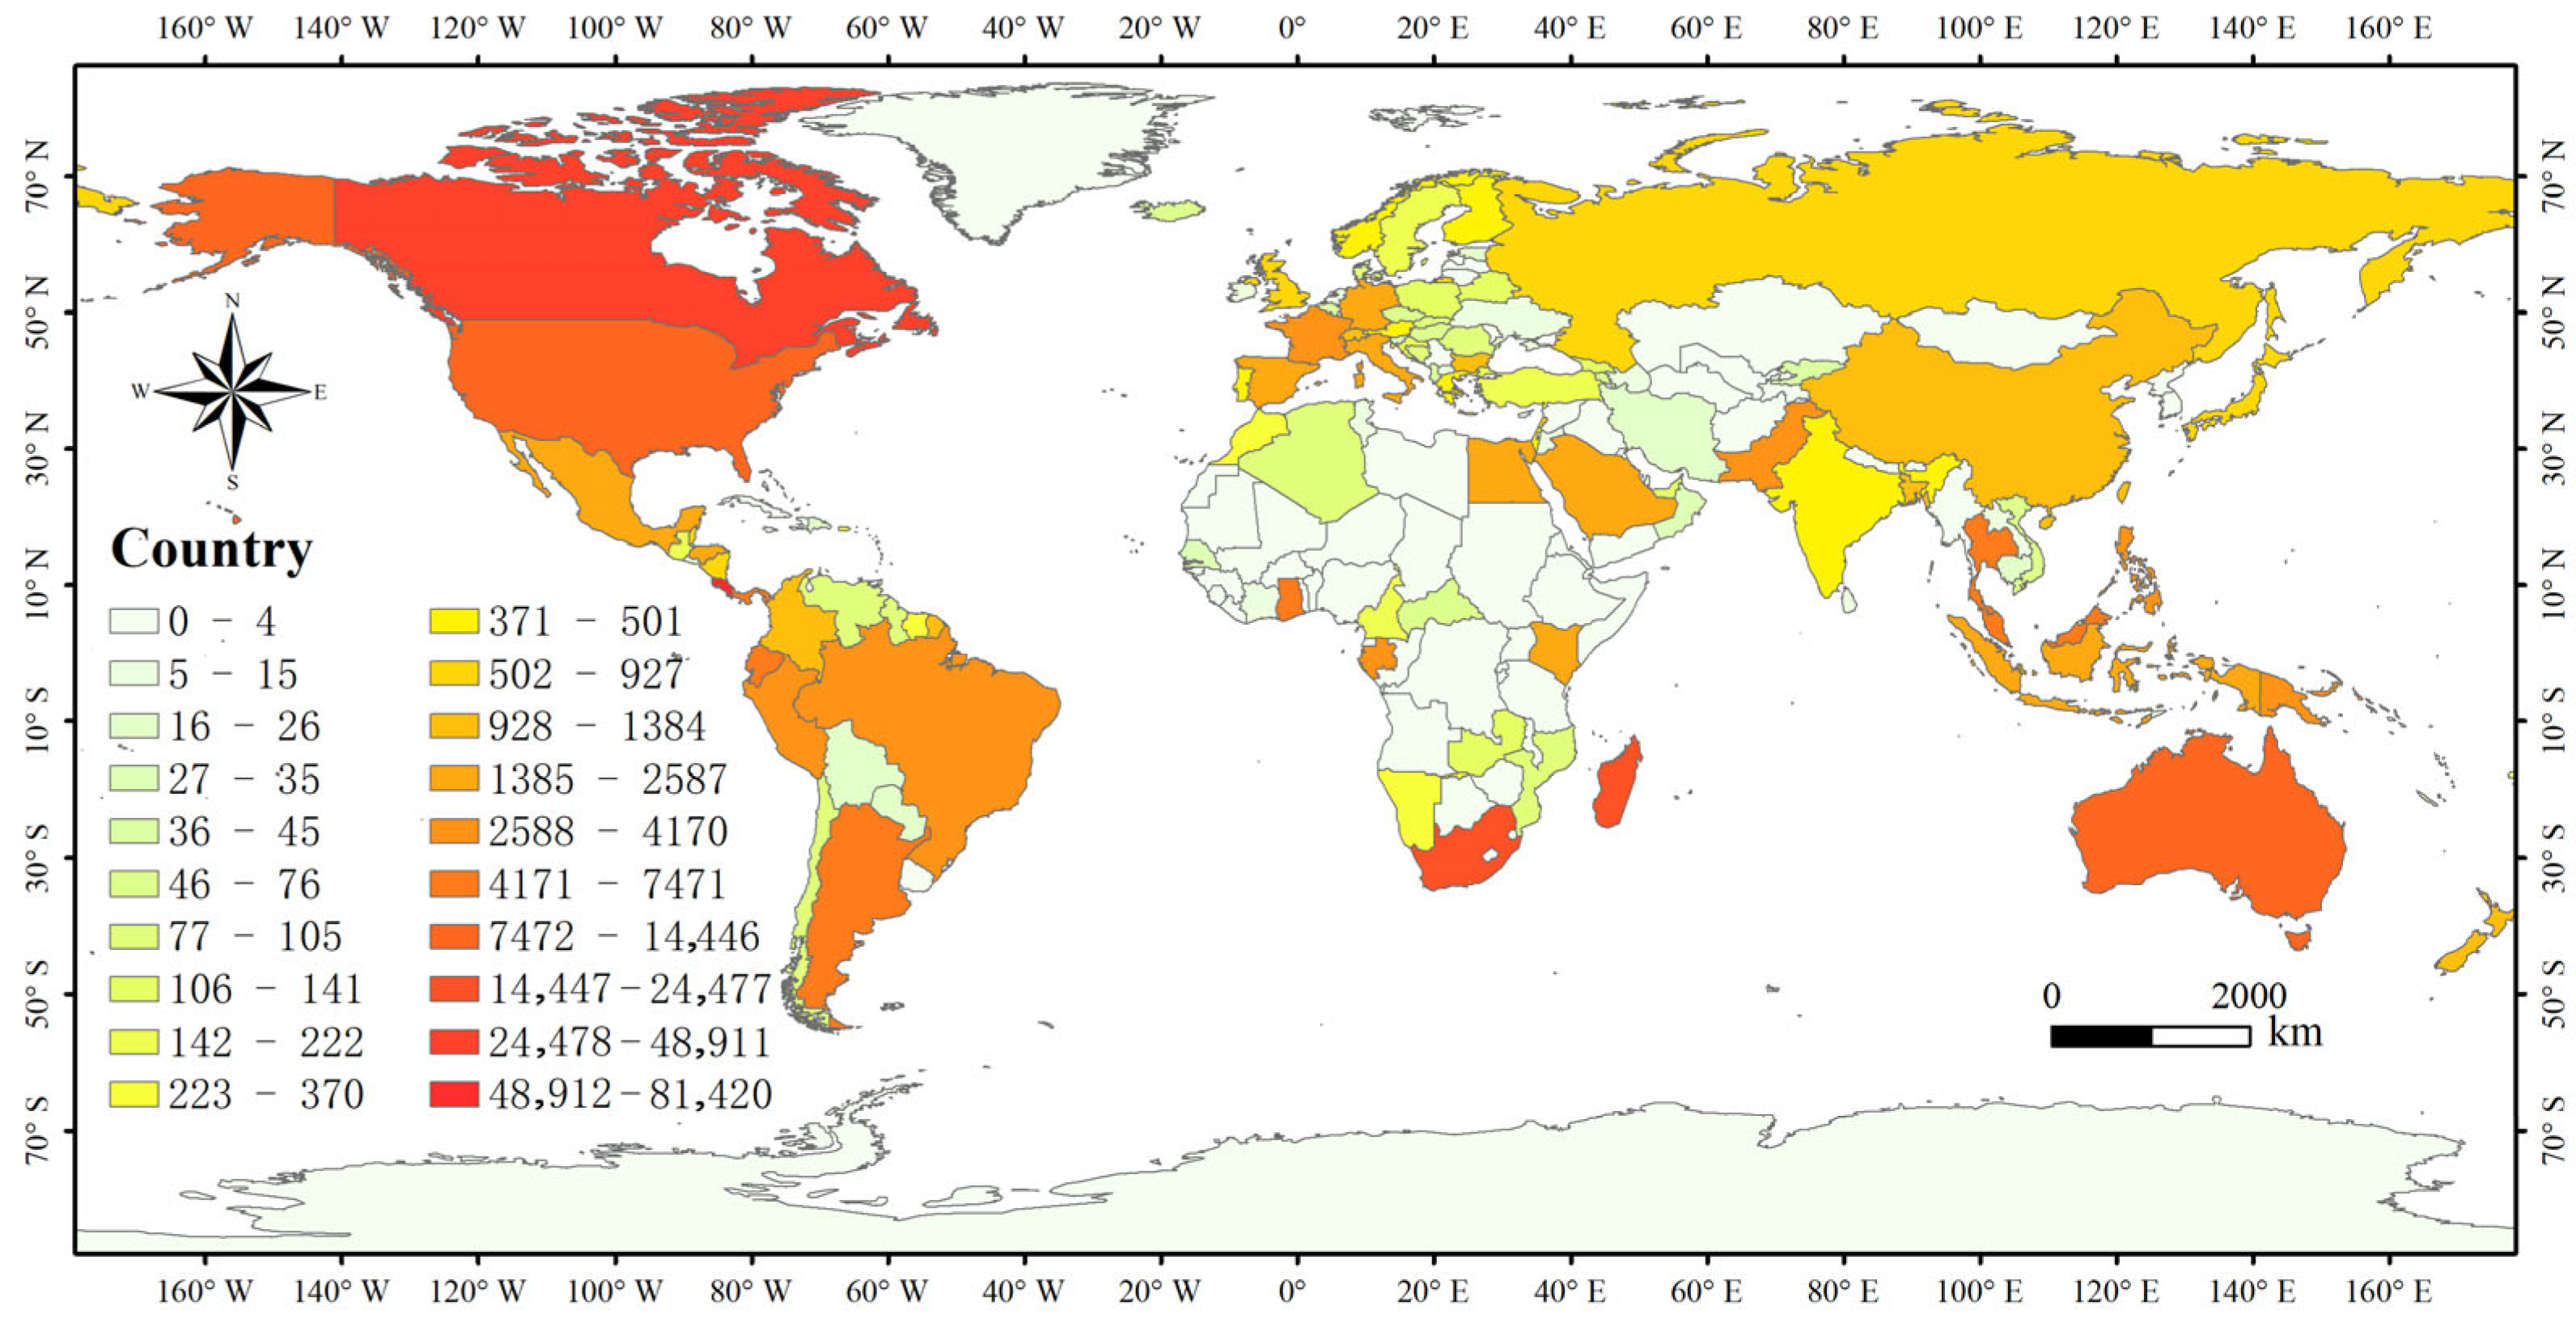
At the national level, COI sequence data for Formicidae ants were submitted by 153 countries (Figure 4). The top ten countries are predominantly concentrated in the Americas and Europe, with Costa Rica, Canada, Madagascar, the United States, Australia, Panama, Malaysia, Argentina, France, and Thailand leading the submissions. China contributed only 1123 sequences (0.35%). Inland Africa, parts of South America (e.g., Bolivia), and Oceania (e.g., Guam) show minimal sampling, with countries like Liberia, Bolivia, and Guam each submitting only one record. Additionally, approximately 65,002 COI sequences lack country/region information, highlighting prevalent issues of incomplete metadata annotation during data submission.

3.4. Species Composition

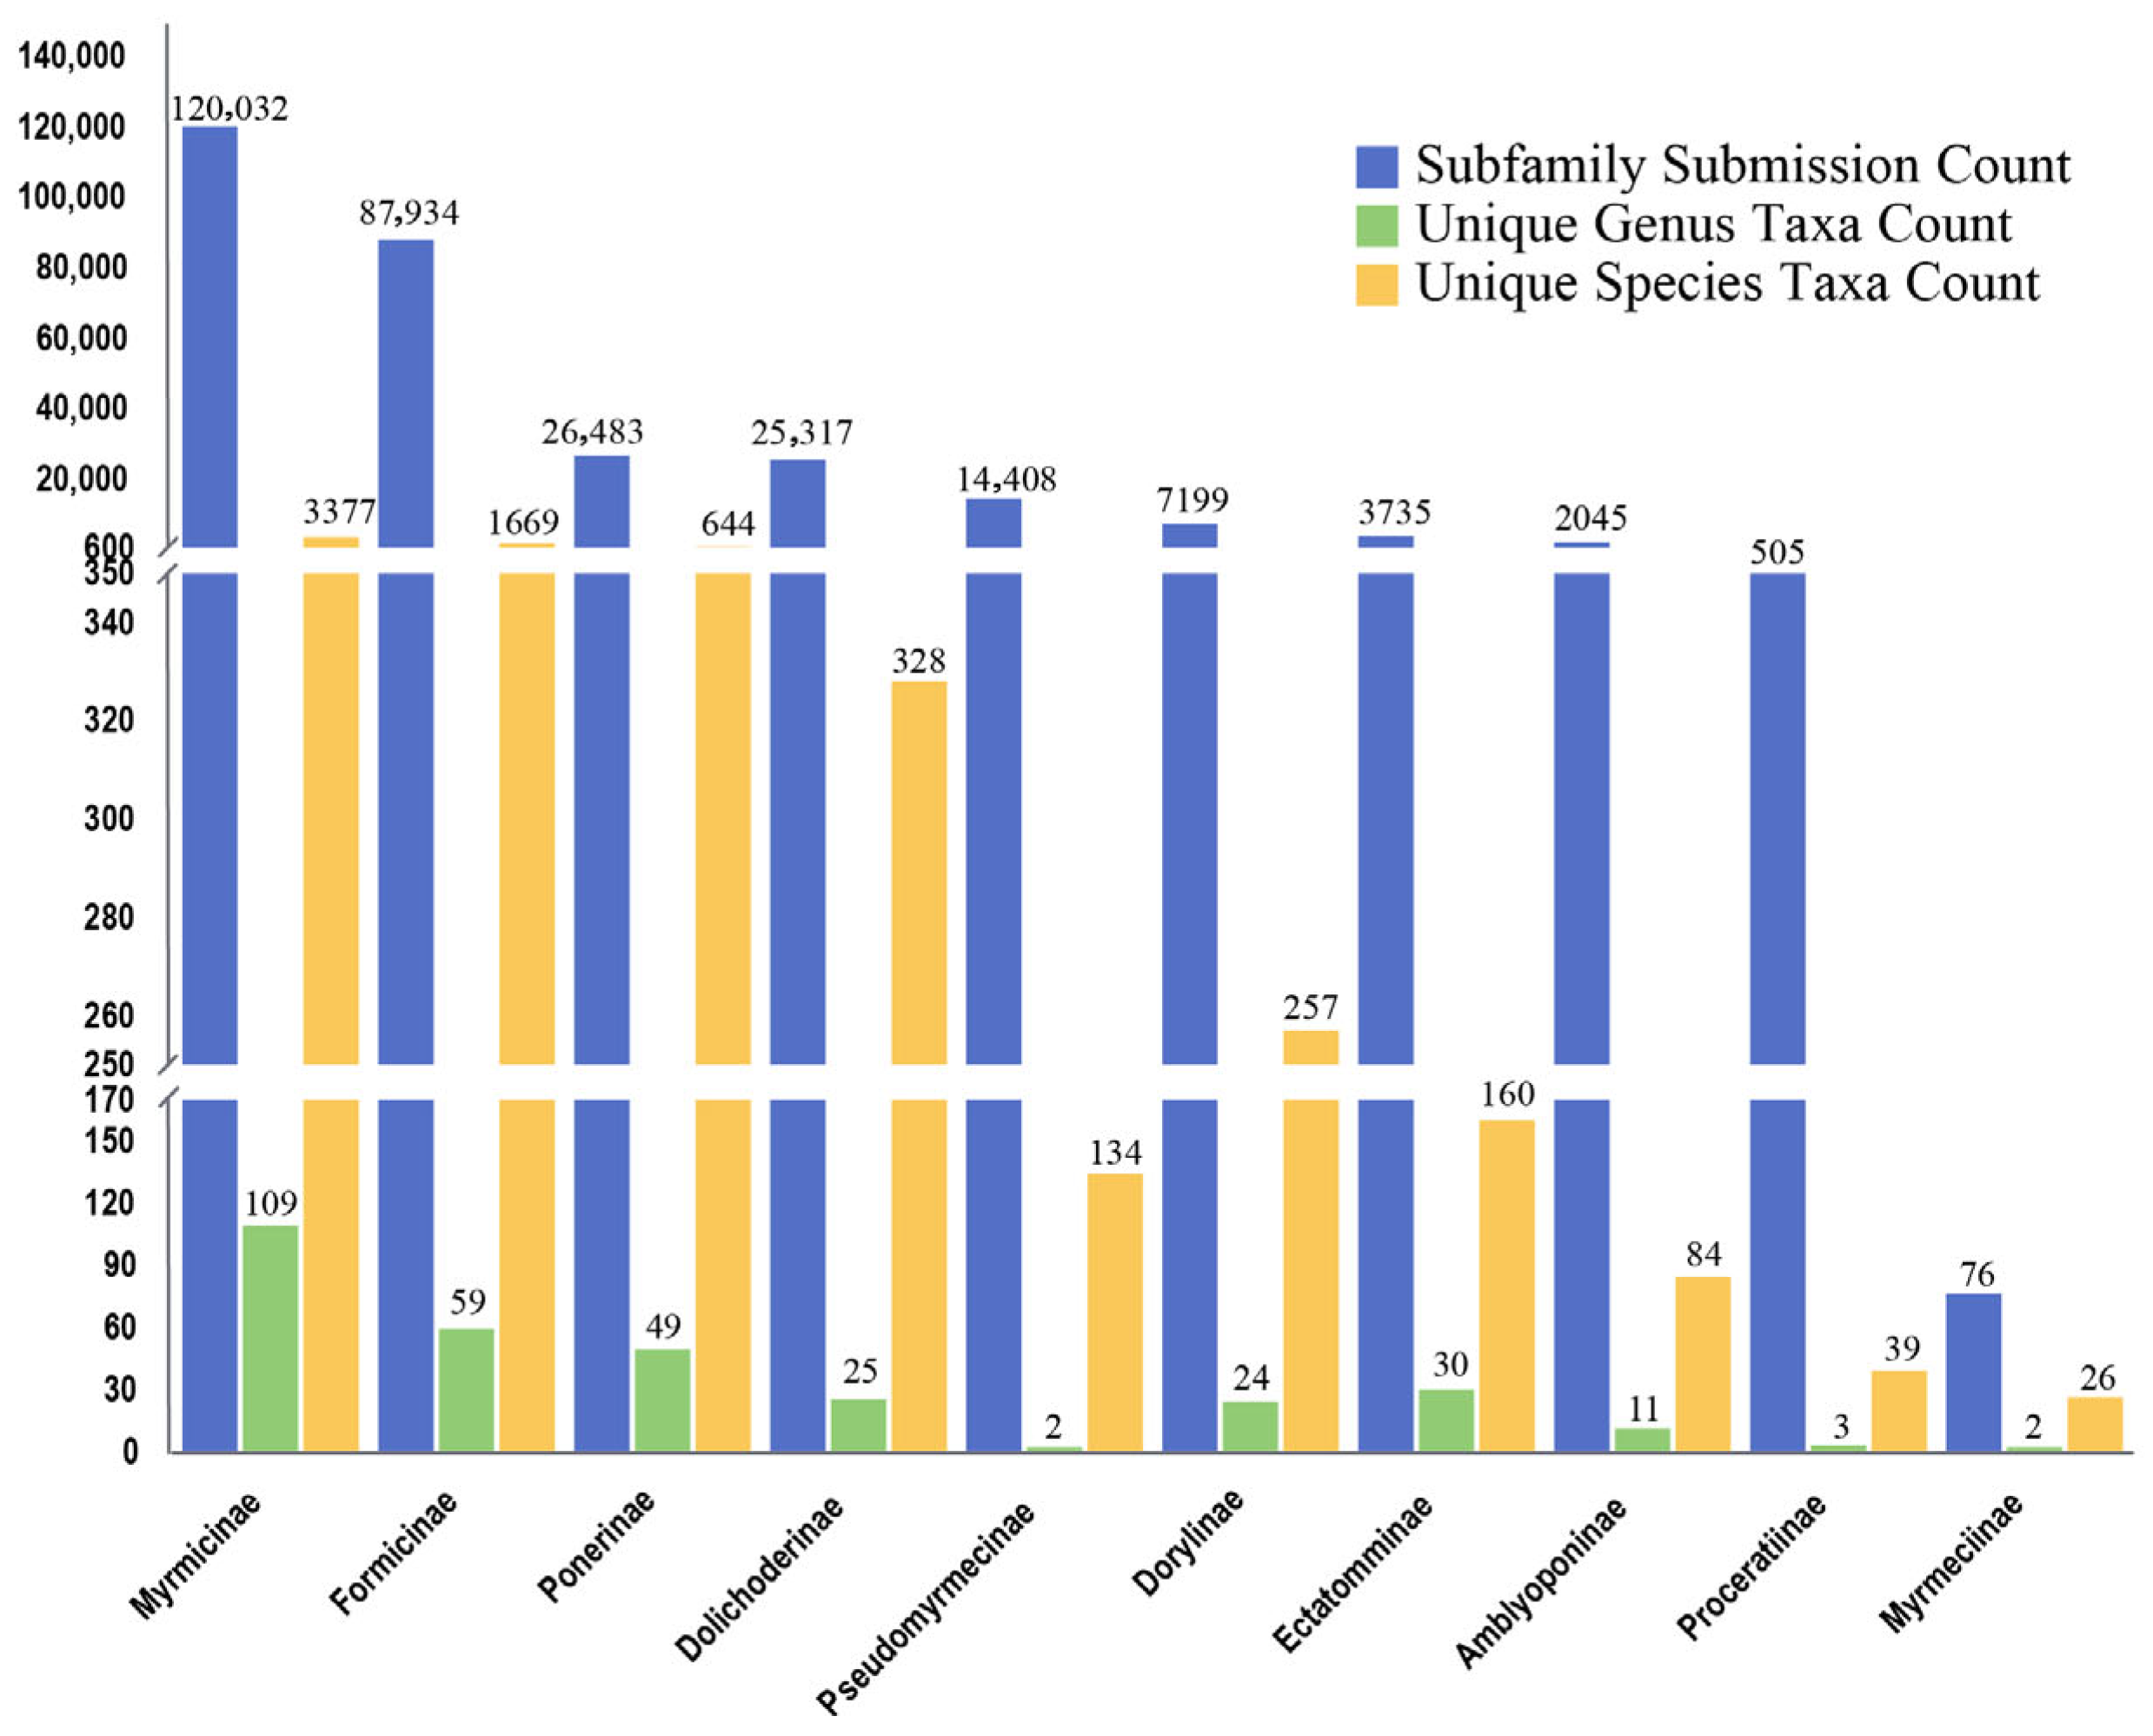
At the subfamily level, sequence submissions are concentrated in three dominant groups: Myrmicinae, Formicinae, and Ponerinae ants. Myrmicinae, the largest subfamily within Formicidae, contributed the highest volume of COI barcode records (120,032 sequences), spanning 3377 species across 109 genera. This accounts for 35.52% of the total COI data. Formicinae ranked second, with 87,934 sequences representing 1669 species from 59 genera. Ponerinae submitted 26,483 sequences, covering 644 species in 49 genera (Figure 5). Other subfamilies—such as Aneuretinae and Apomyrminae—have minimal representation, with almost all contributing ≤2 records.
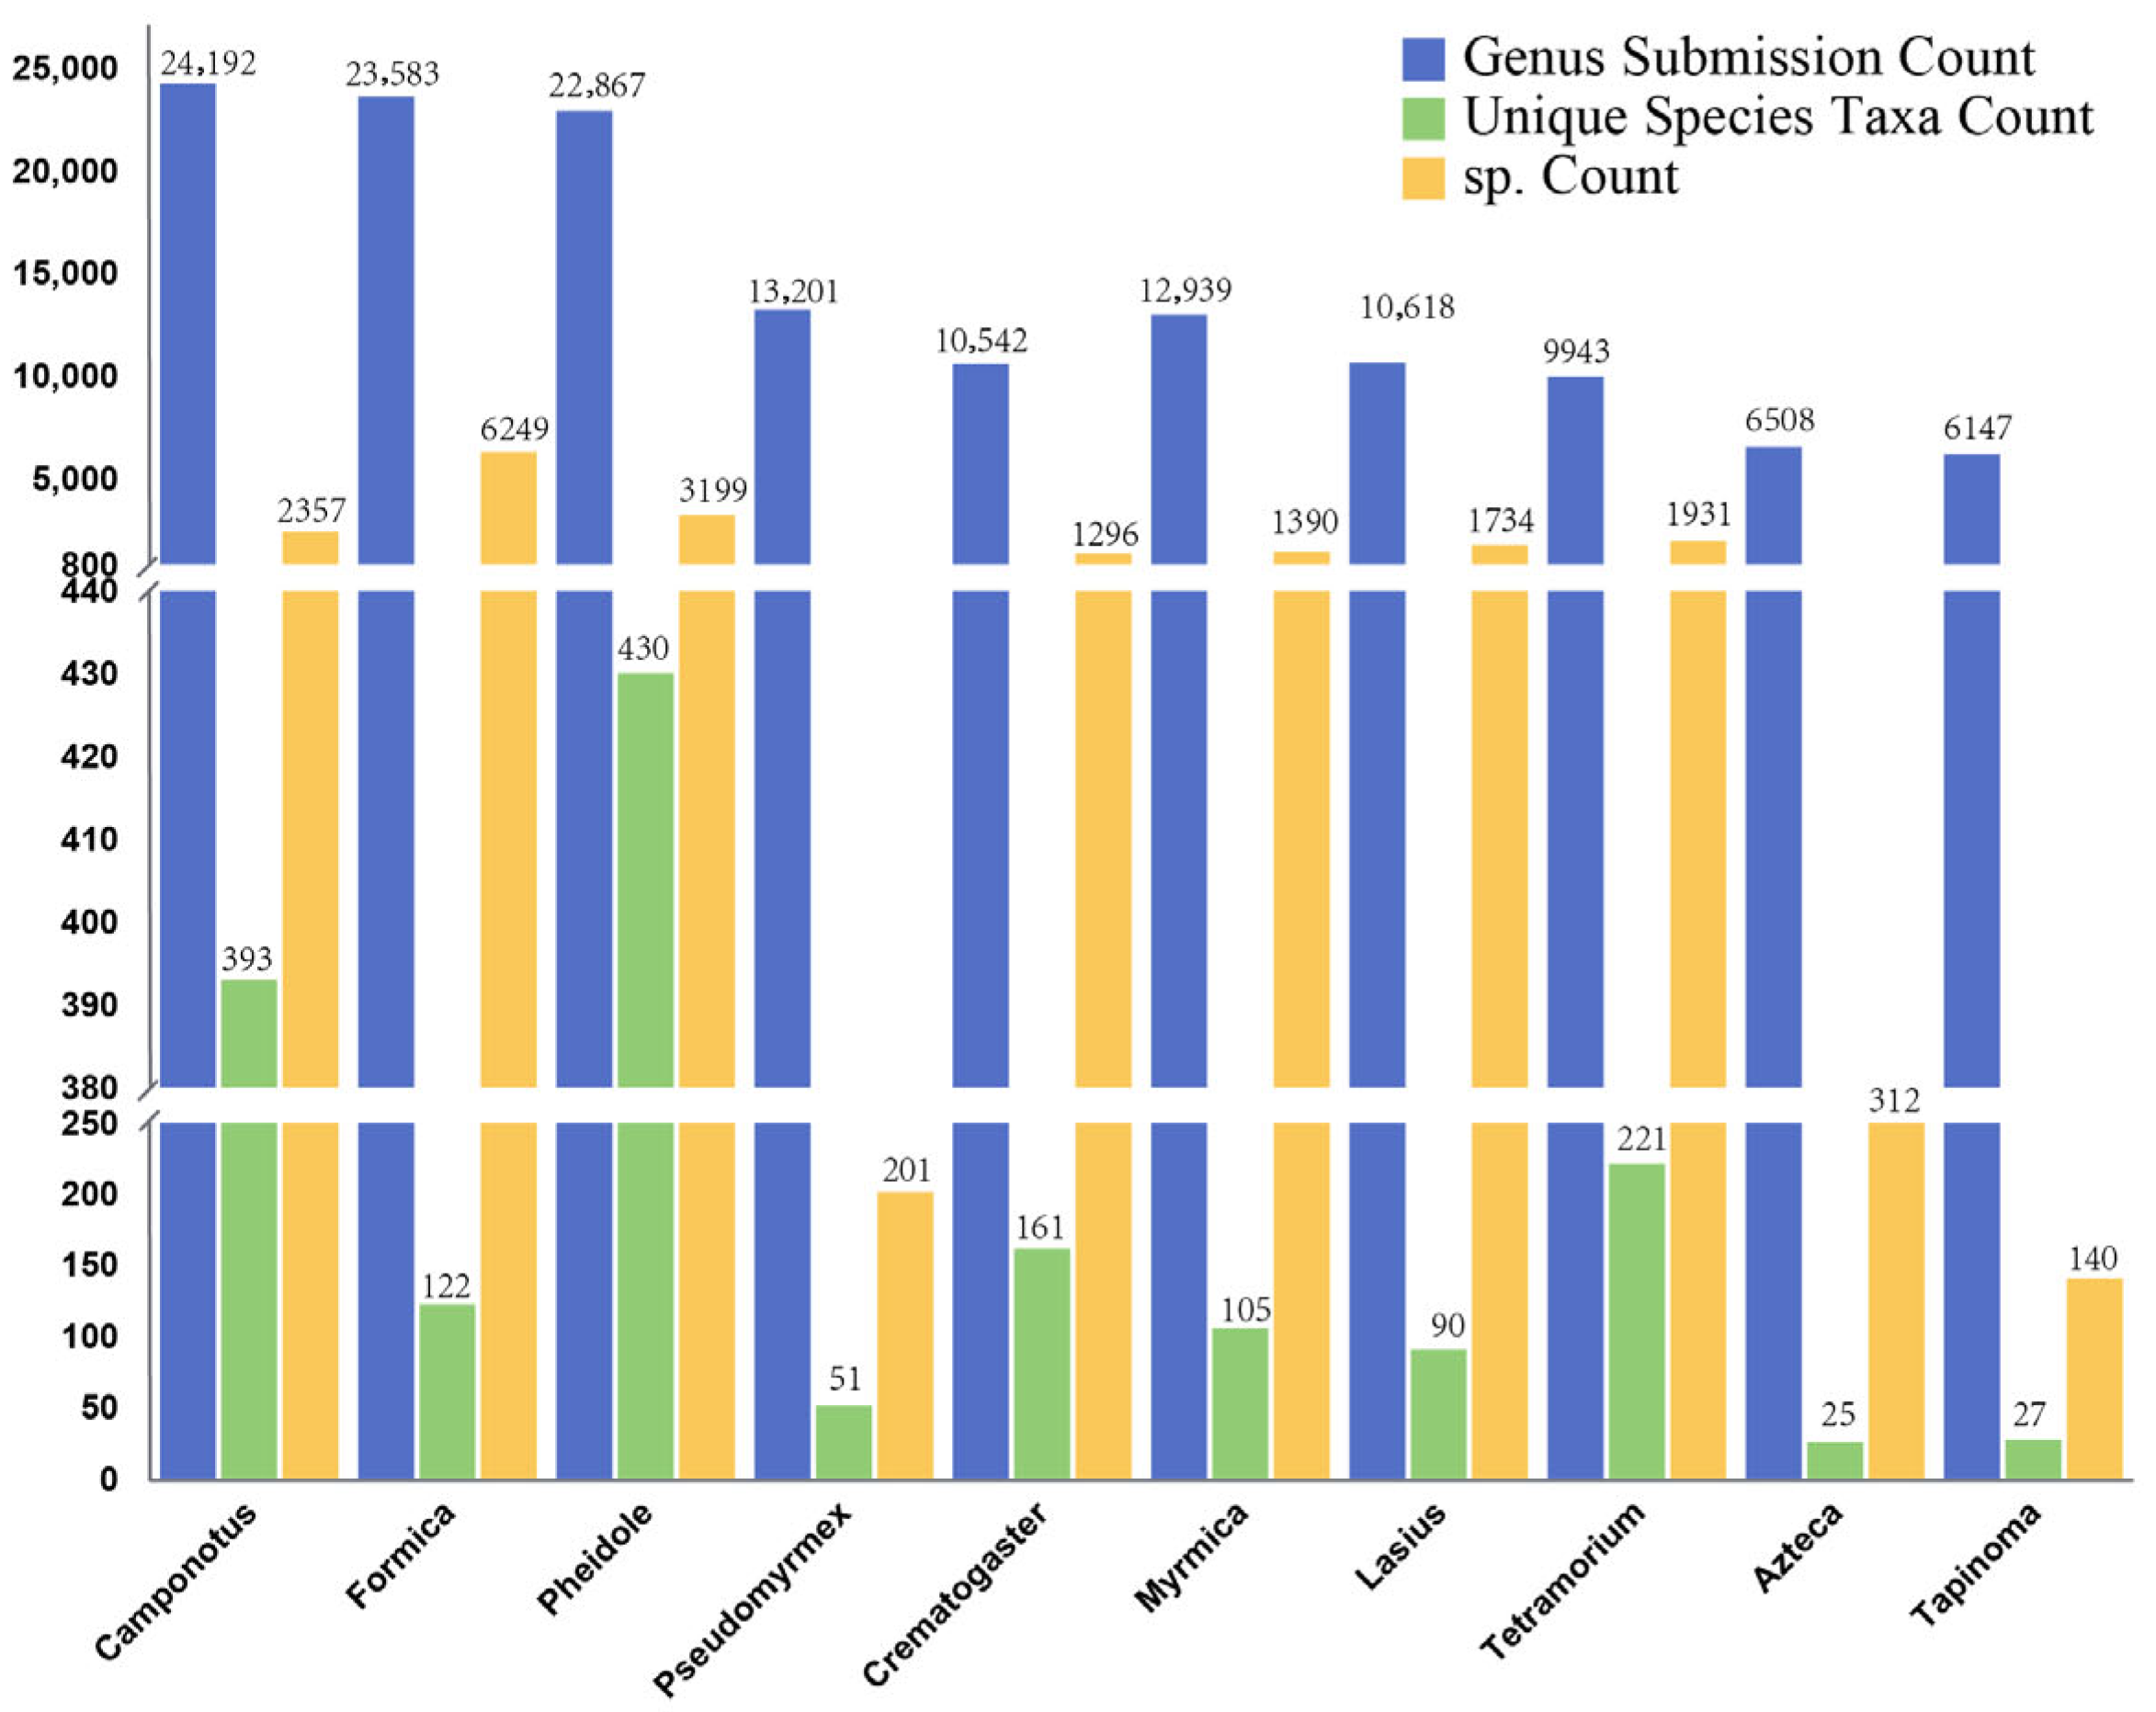
At the genus level, the top ten genera by COI sequence volume are Camponotus, Formica, Pheidole, Pseudomyrmex, Crematogaster, Myrmica, Lasius, Tetramorium, Azteca, and Tapinoma. Among these, Camponotus contains 24,192 sequences (393 identified species), with 2357 sequences (9.7%) from unidentified species; Formica has 23,583 sequences (122 species), including 6249 sequences (26%) from unidentified species; and Pheidole comprises 22,867 sequences (430 species), with 3199 sequences (14%) unidentified. At the species level, Pheidole (430 species), Camponotus (393 species), and Tetramorium (221 species) exhibit the highest species richness (Figure 6).

3.5. Collaboration Network

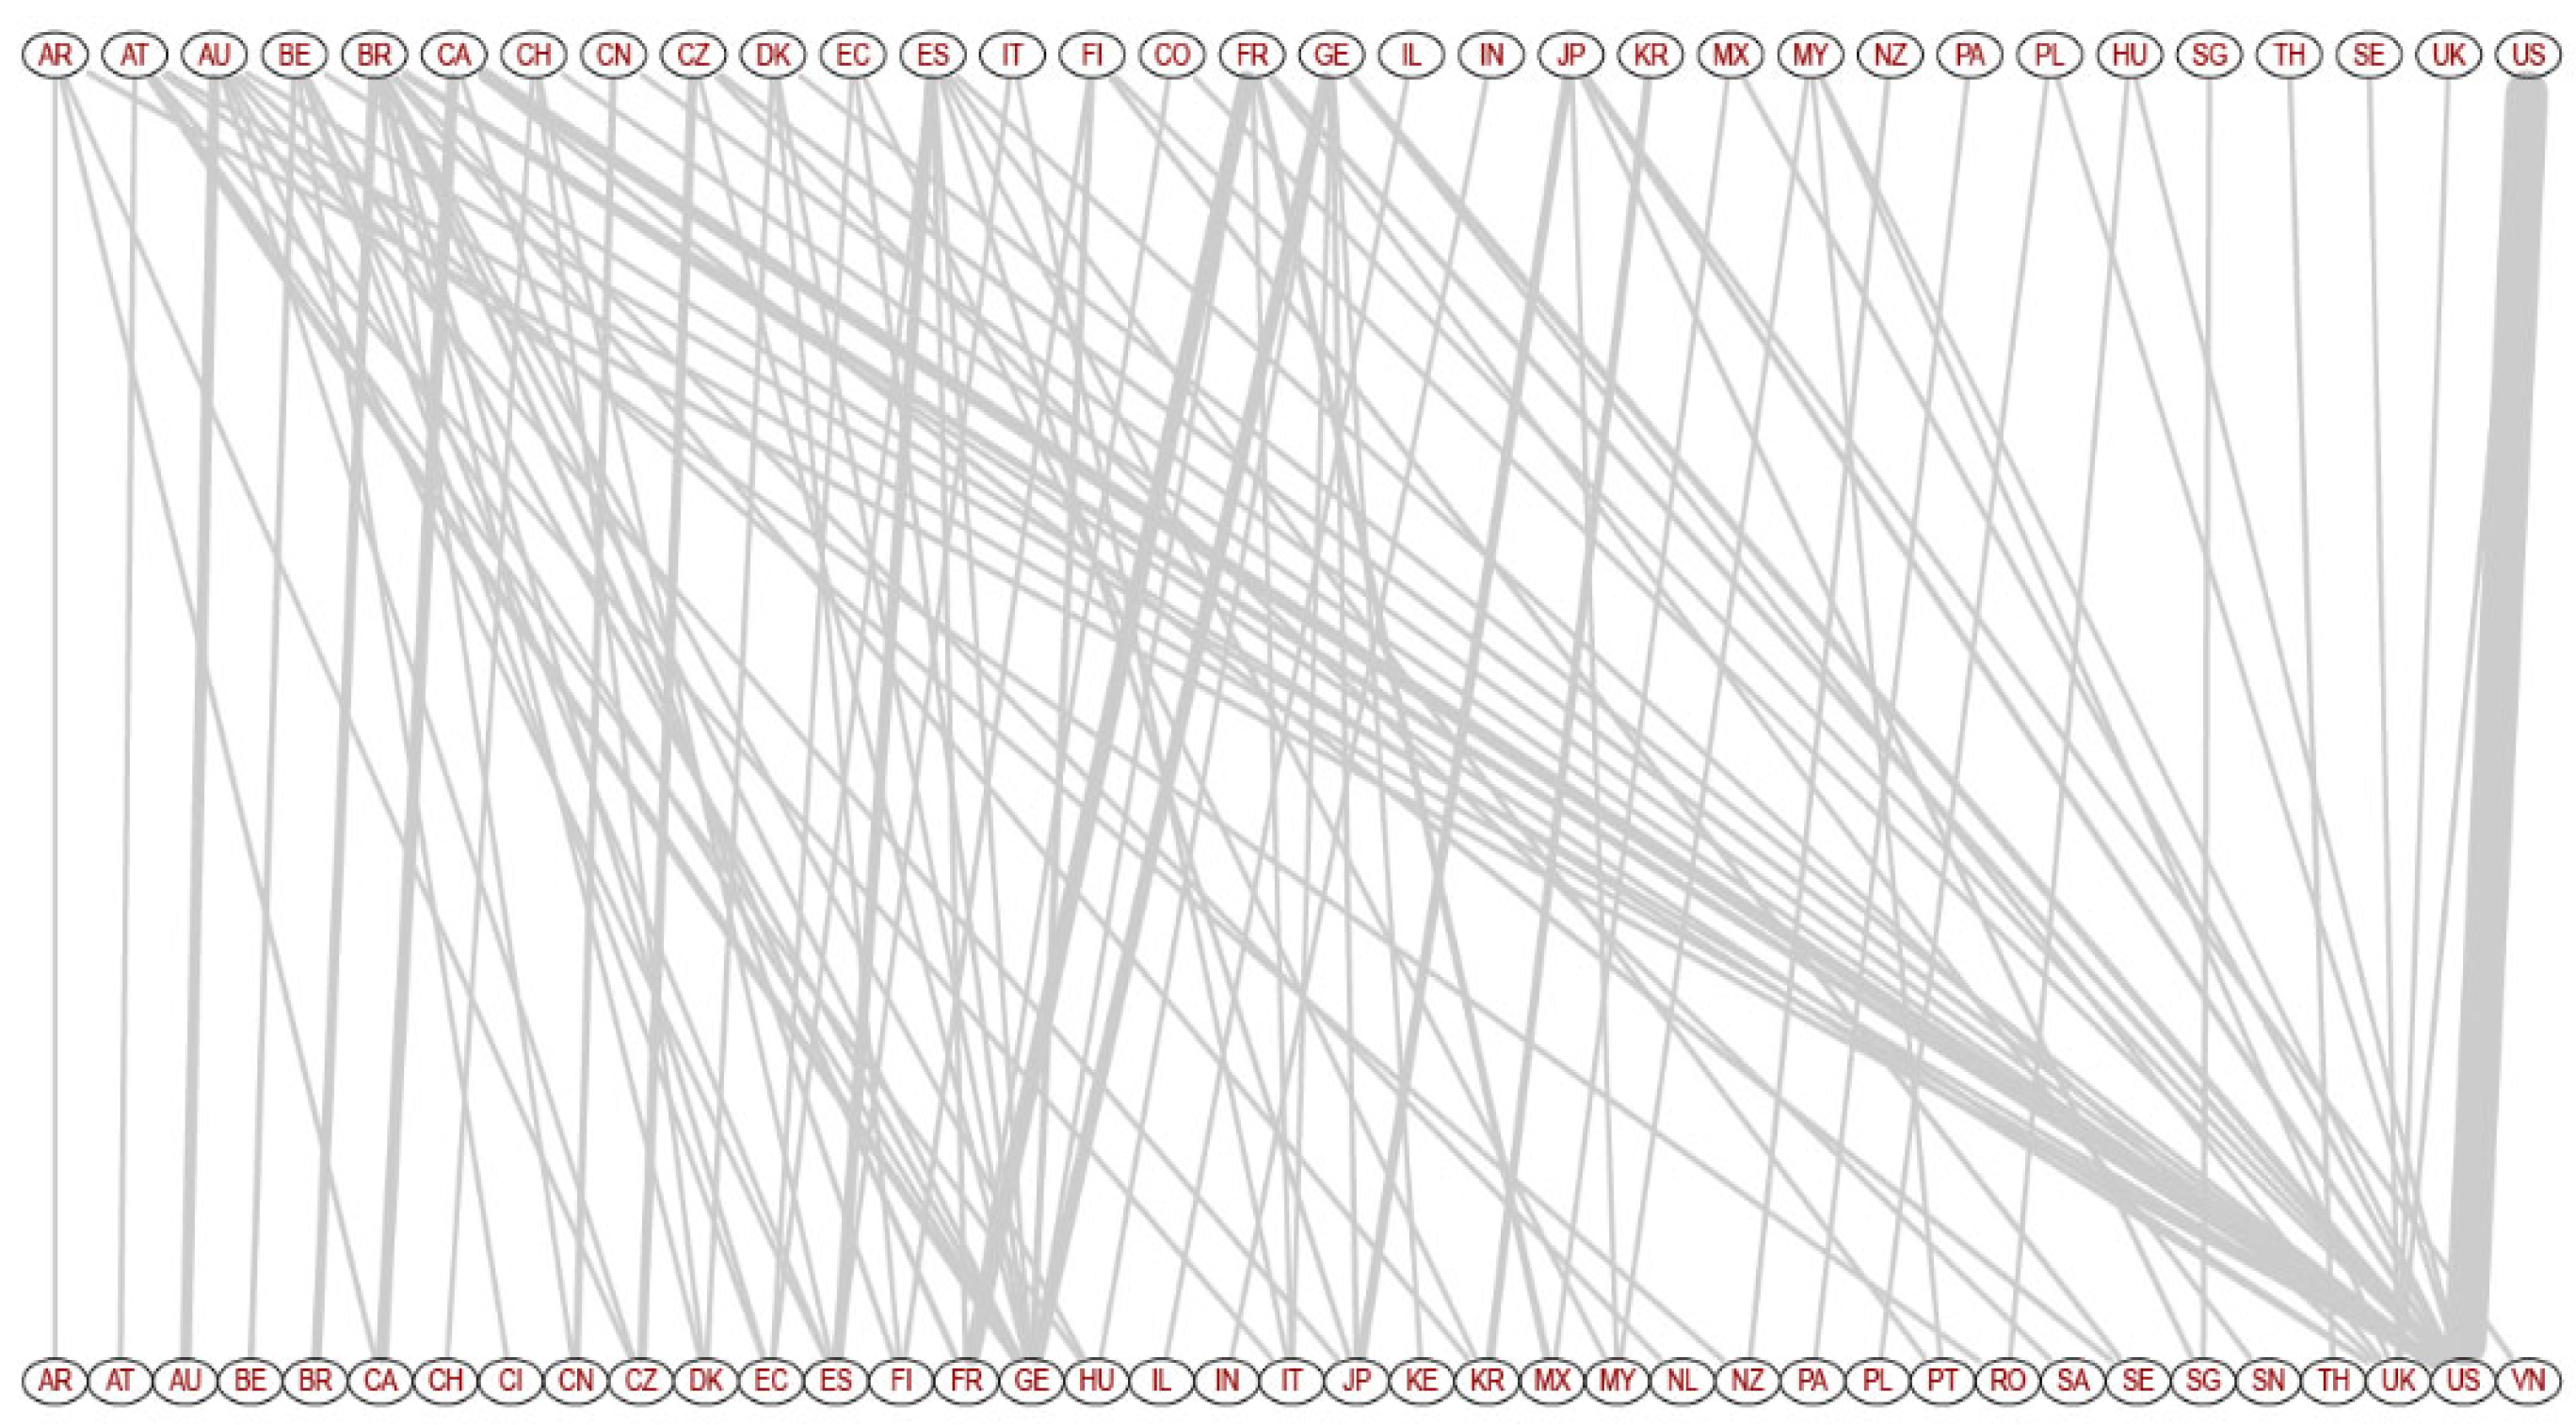
Researchers in European and North American countries maintain the strongest connections. Collaborative efforts are particularly frequent among research teams from the United States, Canada, France, and Germany. U.S. researchers exhibit especially high activity, engaging in collaborations with 18 countries, including Canada (Figure 7). Nevertheless, a predominant preference for domestic collaboration persists across most nations.

3.6. Barcoding Analysis

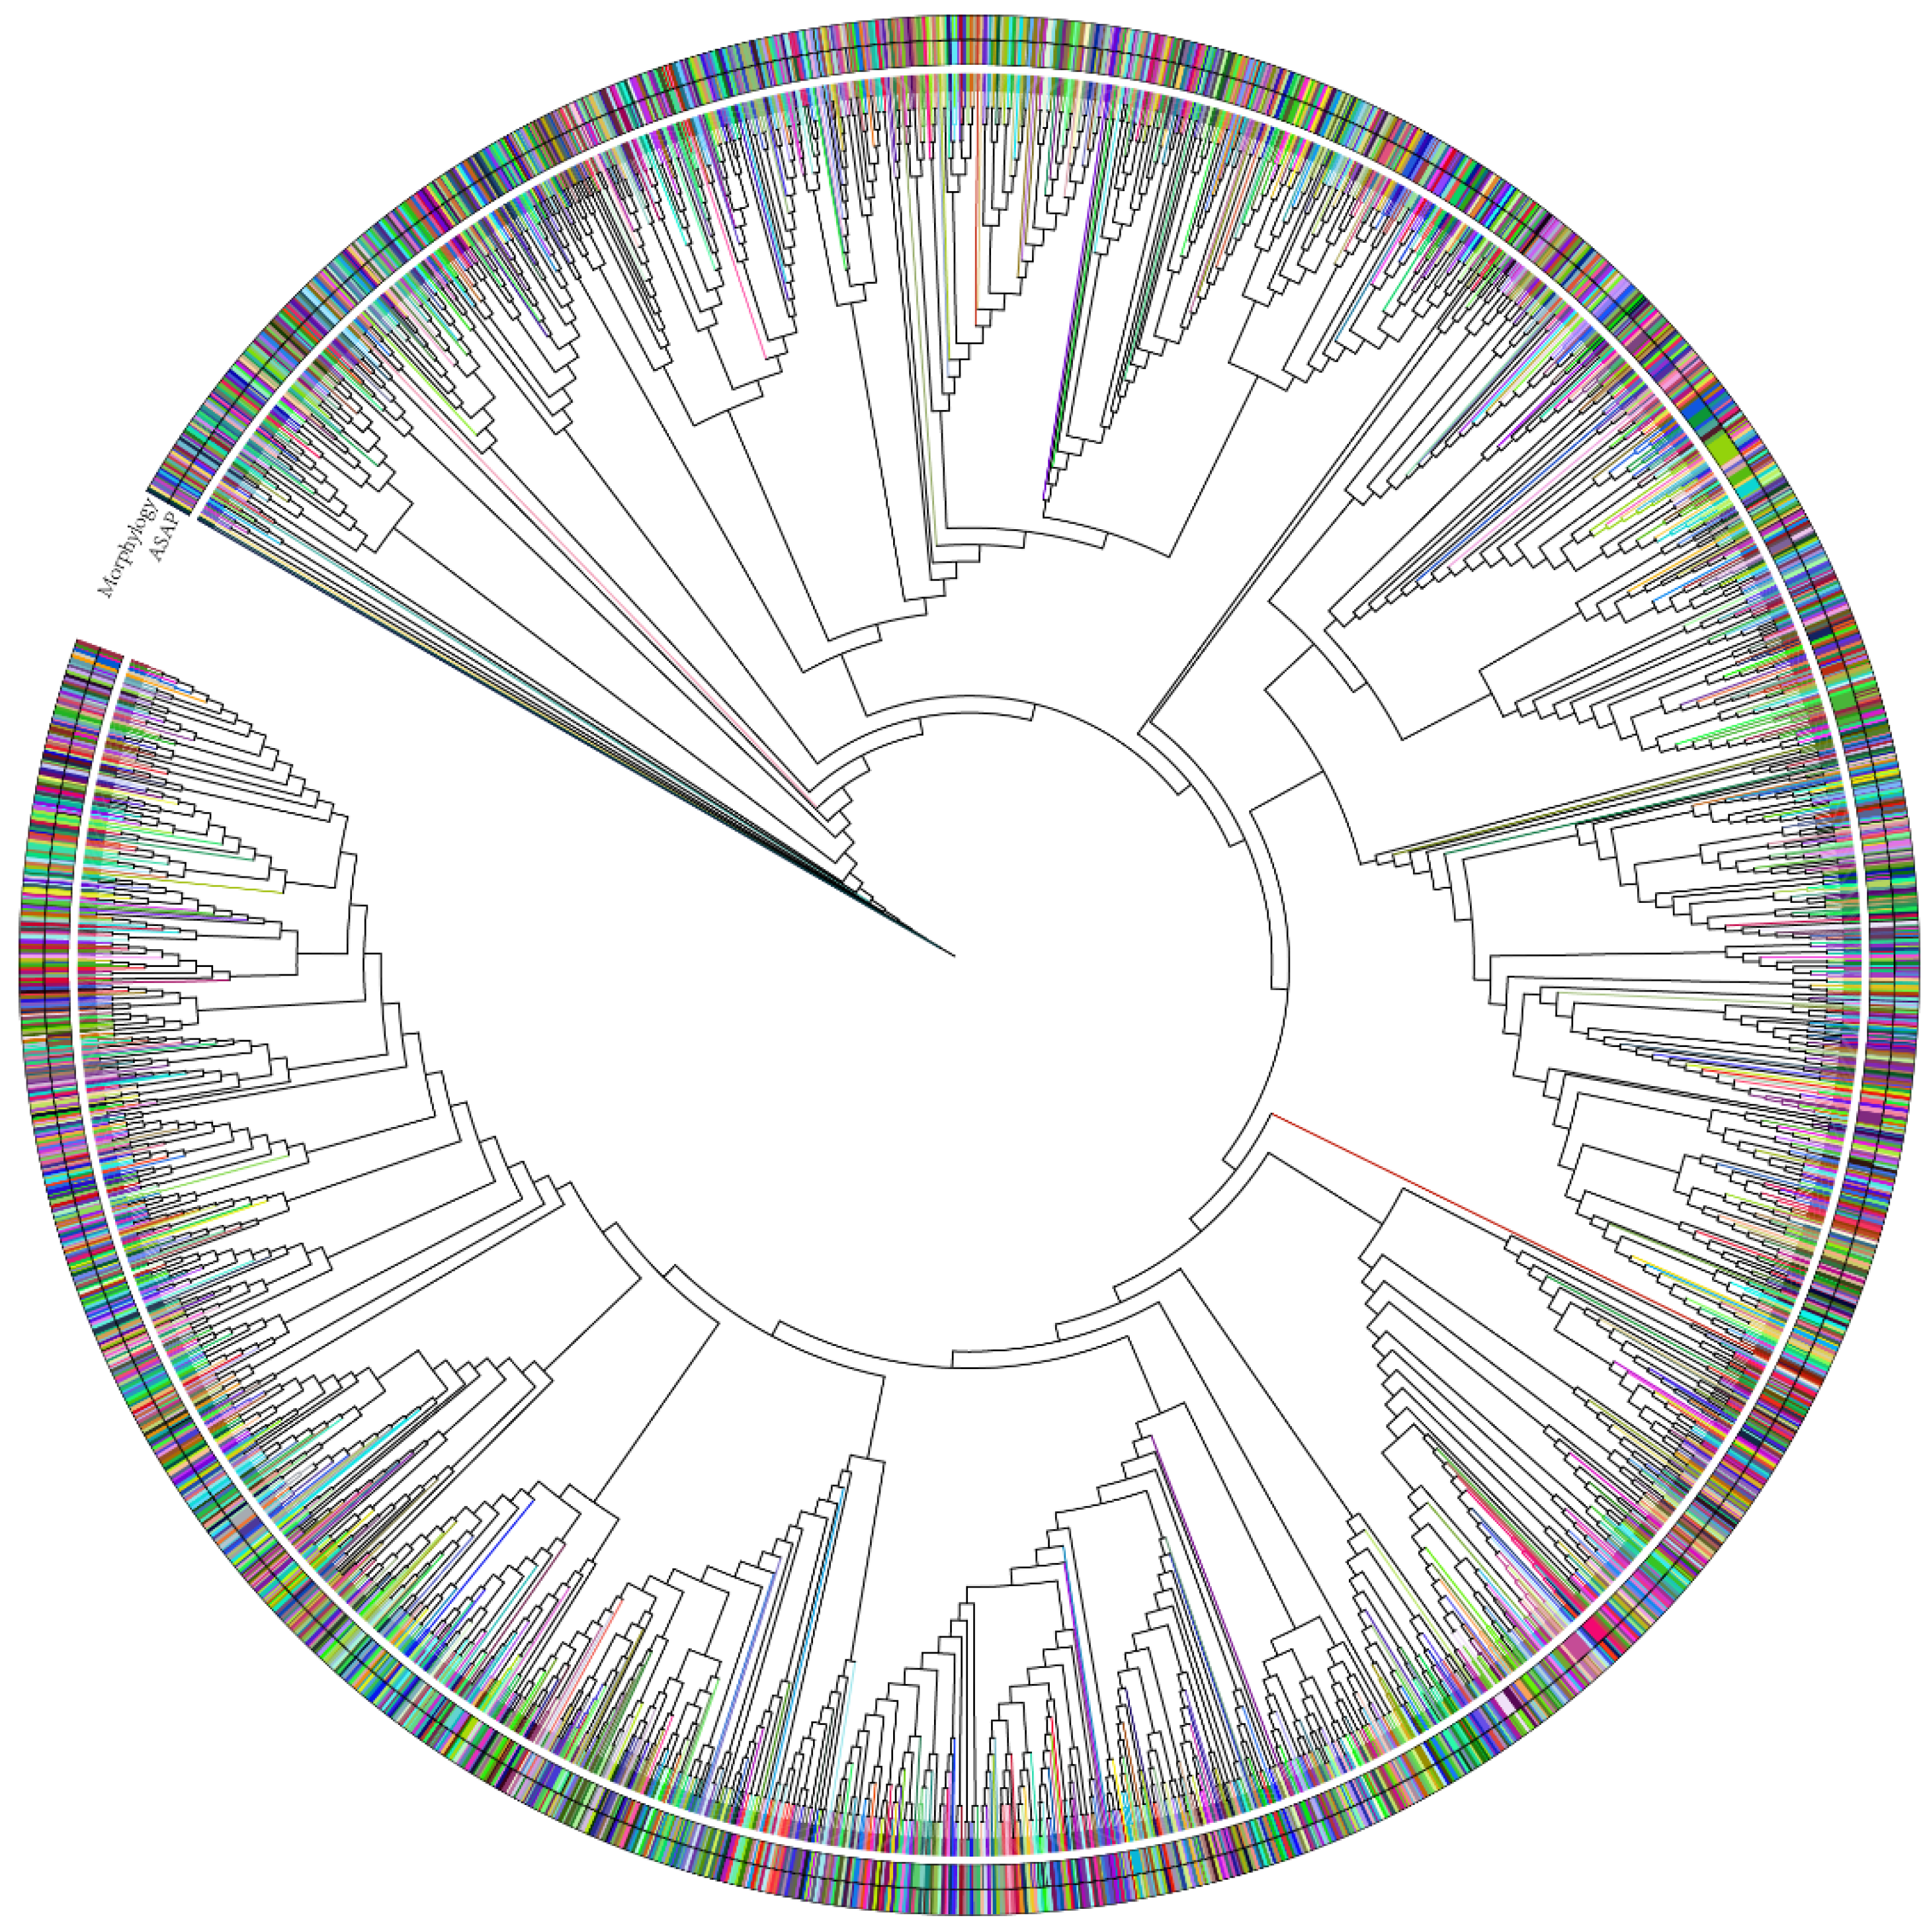
Among the 3331 COI sequences analyzed, 2034 species were identified based on sequence annotations. The ASAP method delineated this dataset into 2288 molecular operational taxonomic units (MOTUs). Visualization revealed significant discrepancies between these classifications: 246 distinct species were lumped into the same MOTU, spanning 5 subfamilies and 45 genera, and 399 species were split into multiple MOTUs, involving 11 subfamilies and 96 genera (Figure 8, Table 2).

4. Discussion

Through the systematic collection and organization of sequence quantities, publication timelines, sequence lengths, species identities, and collection localities for different molecular markers in ants, a comprehensive understanding of the application landscape of DNA barcoding in this taxon has been achieved. This work simultaneously reveals the key issues and challenges in contemporary ant taxonomy regarding the process of molecular species delimitation based on short gene fragments.
Regarding the annual publication volumes of different molecular markers, an overall continuous growth trend is evident (Figure 1). In the 1980s, molecular biology was introduced into the broader field of taxonomy, including the study of phylogeny and evolution, giving rise to molecular systematics [5]. This period saw the emergence of diverse molecular data. By 2003, the advent of DNA barcoding technology—lauded for its numerous advantages—further catalyzed widespread application in taxonomy, driving an explosive surge in molecular data production [7]. Over the past three decades, these advancements have propelled transformative progress in systematics and evolutionary biology [5].
Among various molecular markers, COI sequences exhibit the highest abundance—a phenomenon directly linked to their universality in molecular species delimitation. COI holds an absolute advantage as the DNA barcode for insects: its terminal sequences are highly conserved, facilitating the design of universal PCR primers [31,32]. Furthermore, the COI gene displays remarkable intra-specific consistency while showing significant inter-specific divergence, granting it exceptional taxonomic resolution for species identification [33]. This universality not only streamlines sample amplification and sequence alignment workflows but also establishes a consistent and standardized operational framework [34]. Additionally, as a mitochondrial gene, COI is maternally inherited and undergoes minimal recombination, ensuring sequence homogeneity within species and effectively reducing identification errors caused by genetic admixture [35,36]. However, it is important to note that despite the abundance of COI markers, their taxonomic coverage is extremely limited [37,38]. These sequences exhibit high heterogeneity in length, and a substantial proportion (26,815 entries, 43%) lack species-level identification. This indicates that while current molecular systematics research generates vast molecular data, the quality is highly uneven, and only a minimal fraction is practically utilized in taxonomy. The current state of ant taxonomy starkly reflects this dilemma: new species descriptions still predominantly rely on morphological characteristics [39,40,41,42], with only a handful of studies integrating molecular data for integrative taxonomy [43,44]. Given the subjectivity inherent in morphological taxonomy—where different taxonomists assign varying weights to diagnostic traits—this overreliance may precipitate an era of perpetual ‘revisions’ in future ant classification. However, it should be clearly understood that species identification based on morphological characteristics remains the most fundamental approach in taxonomy. Although DNA barcoding methods utilizing short gene fragments offer many unique advantages, they still require support from classical taxonomy. The primary goal of taxonomy is accurate species identification. Therefore, despite the distinct strengths and focuses of different methods, integrative taxonomy—which combines multiple approaches—is more likely to achieve the objectives of taxonomic research.
From the perspective of the spatial and national distribution patterns of molecular markers, COI sequences exhibit pronounced spatial heterogeneity (Figure 3, Figure 4 and Figure 7). Hotspots of sequence abundance occur in north–central North America, central–western Europe, Madagascar, southern Central America, and parts of South America, while other regions show notably lower representation (Figure 3). Contrasting this with the global distribution of ant species diversity (https://antmaps.org/) [45] reveals a striking discrepancy: regions with exceptionally high ant diversity—such as southern East Asia (including southern China and Southeast Asia), Australia, and parts of Africa—display disproportionately low COI sequence numbers. Two key factors likely contribute to this mismatch. First, economic constraints in some regions may limit scientific capacity, hindering molecular sampling efforts [46,47]. Second, the current taxonomic practices in ant systematics have yet to prioritize integrative taxonomy—combining molecular data with traditional morphology [48,49]. Notably, Kass et al. (2022) identified southern East Asia and much of Southeast Asia as centers of rarity for ants, representing a ‘treasure map’ of hidden diversity [45]. If a region exhibits high species diversity, relatively developed economic conditions, and a considerable number of researchers working on ant taxonomy, yet has very few COI sequences, it may indicate that the region primarily emphasizes morphology-based classical taxonomy and has not yet fully integrated newer methods and approaches such as molecular species identification. Therefore, accurate species discovery in these understudied regions, especially in China, necessitates robust taxonomic frameworks, underscoring the urgent need for comprehensive ant classification studies.
Despite existing collaborative exchanges among nations, these are predominantly concentrated among developed countries—such as the United States, Canada, France, and Germany—whose research teams frequently collaborate, with U.S. researchers exhibiting particularly high activity (Figure 7). Intra-national collaborations remain more prevalent compared to international partnerships [50,51]. This trend aligns with prior research: Virola-V. et al. [52] observed that international collaborations in ant research are largely dominated by high-income nations (Europe and North America), with the United States leading global publication output. These findings indicate that while ant taxonomy possesses significant transnational collaborative potential, actual partnerships remain centered in developed regions, with limited participation from teams in other areas. Moving forward, breaking down these collaborative barriers to engage broader global participation is essential for achieving authentic scientific globalization.
The inconsistency between molecular species delimitation results and sequence-annotated species (Figure 8) highlights a critical challenge in contemporary ant taxonomy: how to achieve more accurate taxonomic research. Just as species concepts vary across disciplines—each emphasizing different criteria and yielding divergent delimitation outcomes [8,53] —current taxonomy advocates interdisciplinary integration [54]. It emphasizes the use of multiple methodologies and the principles of integrative taxonomy to reveal species boundaries from multidimensional perspectives [55,56,57]. Unfortunately, current ant taxonomy remains predominantly morphology-centric, often failing to detect issues such as cryptic species. Our findings, along with published studies [10], demonstrate that cryptic species complexes are widespread in ants—a phenomenon equally prevalent in other taxa [58,59,60]. To address these challenges, future ant taxonomy must transcend the inertia of relying solely on morphological traits. Instead, it should embrace integrative approaches that combine molecular species delimitation with biogeographic, statistical, and other data streams.

5. Conclusions

Through systematic compilation of molecular marker data across ant species, this study synthesizes the current state of DNA barcoding research, identifies key challenges in ant taxonomy, and outlines future research imperatives. Overall, while molecular data for ants are abundant, they exhibit high heterogeneity and uneven quality, with the majority generated for molecular phylogenetic studies rather than taxonomic applications. Contemporary ant classification remains predominantly rooted in classical morphological approaches, leading to widespread issues such as undetected cryptic species. Future advancements in ant taxonomy must transcend the historical reliance on morphological traits alone. Instead, integrative approaches should be adopted—combining molecular species delimitation with biogeographic, statistical, and other multidisciplinary frameworks—to establish a robust system of integrative taxonomy.

Author Contributions

Conceptualization, C.D.; methodology, C.D.; software, C.D.; validation, C.D. and Z.C.; formal analysis, J.W. and D.L.; investigation, J.W. and D.L.; writing—original draft preparation, J.W.; writing—review and editing, C.D. and Z.C.; visualization, J.W. and D.L.; supervision, C.D. and Z.C.; project administration, C.D. and Z.C.; funding acquisition, C.D. and Z.C. All authors have read and agreed to the published version of the manuscript.

Funding

This research was funded by the National Natural Science Foundation of China (No. 32360127) and Guangxi Natural Science Foundation (No. 2025GXNSFBA069504).

Data Availability Statement

The data generated during this study are reported in the manuscript.

Acknowledgments

During the preparation of this manuscript/study, the authors used DeepSeek for the purposes of language editing. The authors have reviewed and edited the output and take full responsibility for the content of this publication. We thank the editor and reviewers for their insightful comments and valuable recommendations, which have significantly enhanced the quality of our work.

Conflicts of Interest

The authors declare no conflicts of interest.

Abbreviations

The following abbreviations are used in this manuscript:
DNADeoxyribonucleic Acid
NCBINational Center for Biotechnology Information
BOLDBarcode of Life Data System
MLMaximum Likelihood
K2PKimura 2-parameter
MOTUMolecular Operational Taxonomic Unit
PCRPolymerase Chain Reaction
ASAPAssemble Species by Automatic Partitioning
iTOLInteractive Tree of Life

Appendix A

  • ###1. R package bold (version 1.3.0)|download the molecular data of Formicidae from BOLD
  • library(bold)
  • formicidae = bold_seq(taxon = ‘Formicidae’)
  • formicidae_data = bold_specimens(taxon = ‘Formicidae’)
  • write.csv(formicidae, “formicidae_sequences.csv”, row.names = FALSE)
  • write.csv(formicidae_data, “formicidae_specimens.csv”, row.names = FALSE)
  • ###2. R package refdb (version 0.1.1)|download the molecular data of Formicidae from NCBI.
  • install.packages(“refdb”)###The package calls rentrez to retrieve information from the NCBI, and also uses the bioseq package processing sequence.
  • install.packages(“rentrez”)
  • rm(list = ls())
  • library(refdb)
  • library(dplyr)
  • library(stringr)
  •   library(rentrez)
  • ###Download NCBI Nucleotide data
  • ###Search and download data from NCBI Nucleotide database. In addition, the NCBI Taxonomy database will be called to obtain the classification.
  • Formicidae_ncbi <- refdb_import_NCBI(query = “Formicidae COI”, ###Search sequence.
  •              full = TRUE, ###Whether to get complete information. If FALSE, only columns of important information are obtained.
  •              max_seq_length = 100,00,
  •              seq_bin = 200, ###Number of articles downloaded at one time. Does not affect the final result.
  •              verbose = TRUE ### Whether to display download prompt information
  • )
  • write.csv(Formicidae_ncbi, ’Formicidae_COI.csv’)
  • ###Environmental preparation
  • library(tidyr)
  • library(readr)
  •   library(magrittr)
  • ###Extract columns ID, Sequence, Categories, Genus, Family, Super Family, Order, Gene, Length, Latitude and Longitude from Solenopsis_ncbi data frame.
  • ###Rename the data frame formed by the extracted target column as Solenopsis_seq_1, and then output the bit csv table.
  • Formicidae_seq_1 <- Formicidae_ncbi % > % dplyr::select(id,sequence,species,genus,family,superfamily,order,gene,length,latitude,longitude)
  • write.csv(Formicidae_seq_1, file = “Formicidae.csv”)###Save some column output in Solenopsis_ncbi data frame.
  • ###In the target column to be extracted, ID and sequence are used as fasta information to be output. The first two columns are the necessary fasta id and fasta sequences, respectively. Here we combine the following columns as the description part of fasta. Description is listed as an optional part.
  • ### Prepare the sequence to be written in data frame format. The first column is id, the second column is Sequence, and the third column is description. Rename it as Solenopsis_seq_2.
  • ###Here, the contents of two columns, Categories and length, are merged as the description part.
  • Formicidae_seq_2_COI <- Formicidae_ncbi % > % dplyr::select(id,sequence,species,genus,family,superfamily,order,gene,length,latitude,longitude) % > % tidyr::unite(col = “description”,species,length,genus,family,superfamily,order,gene,latitude,longitude,sep = “ “,remove = TRUE, na.rm = FALSE)### Unite the columns of a merged data frame.
  • write.csv(Formicidae_seq_2_COI, file = “Formicidae_seq_2_COI.csv”)###Save some column output in Solenopsis_ncbi data frame.
  • ###Define fasta sequence to write function: write_bio_fasta()
  • write_bio_fasta <- function(data, file, width = 60, append = FALSE){
  •  ### check data
  •  stopifnot(is.data.frame(data)) ###Must be in data frame format.
  •  n_col <- ncol(data)
  •  if(n_col! = 2 & n_col! = 3){
  •   stop(“‘data’: the input must be a data frame with 2 or 3 columns!”)
  •  }
  •  ### prepare the list for ‘write_lines()’
  •  fa <- list() # Define in advance
  •  ###width = 60 # Width of the output sequence
  •  for (i in seq(nrow(data))){
  •  n = length(fa) + 1 # Add to fa list the nth element, that is, the number of lines in the fasta sequence file. if(n_col == 2){
  •    id <- data[i,1] % > % stringr::str_replace(pattern = “^”, “>”) %>% as.character()
  •    fa[[n]] <- id
  •   } else {
  •    id <- data[i,1] % > % stringr::str_replace(pattern = “^”, “>”) %>% as.character()
  •    description <- data[i,3] % > % as.character()
  •    fa[[n]] <- paste(id,description,sep = “ “)
  •   }seq <- data[i,2] % > % as.character() ###The seq column in the result of refdb is not a simple vector. Turn it around.
  •   kz <- ceiling(stringr::str_length(seq)/width)
  •   if(is.finite(kz)){
  •   for (x in seq(ceiling(stringr::str_length(seq)/width))) {
  •    fa[[n + 1]] <- stringr::str_sub(seq,start = ((x − 1)*width + 1), end = x*width)
  •    n = length(fa)
  •   }
  •    }
  •  }
  •  ### Write the sequence and set append and num_threads.
  •  readr::write_lines(fa,file = file, sep = “\n”, append = FALSE) ###List or vector is required. If it is a list, write the list content, excluding name.
  • }
  • ###Based on the write_bio_fasta function defined above, Solenopsis_seq_2 is output as a file in fas format.
  • write_bio_fasta(data = Formicidae_seq_2_COI, file = “Formicidae_COI.fas”,width = 70)

References

  1. Henke, W.; Tattersall, I.; Hardt, T. Handbook of Paleoanthropology; Reference; Springer: Berlin/Heidelberg, Germany, 2007; ISBN 978-3-540-32474-4. [Google Scholar]
  2. Wilson, E.O. Taxonomy as a Fundamental Discipline. Philos. Trans. R. Soc. London Ser. B Biol. Sci. 2004, 359, 739. [Google Scholar] [CrossRef]
  3. Hong, D.Y. World Peonies and Herbaceous Peonies Research: With Discussion on the Fundamental Principles of Taxonomy; Science Press: Beijing, China, 2024. [Google Scholar]
  4. Löbl, I. The Silent Extinction of Species and Taxonomists—An Appeal to Science Policymakers and Legislators. Diversity 2023, 15, 1053. [Google Scholar] [CrossRef]
  5. Deyuan, H. A Brief Discussion on Methodology in Taxonomy. Biodivers. Sci. 2025, 33, 24541. [Google Scholar] [CrossRef]
  6. Godfray, H.C.J. Challenges for Taxonomy. Nature 2002, 417, 17–19. [Google Scholar] [CrossRef] [PubMed]
  7. Hebert, P.D.N.; Cywinska, A.; Ball, S.L.; deWaard, J.R. Biological Identifications through DNA Barcodes. Proc. R. Soc. London Ser. B Biol. Sci. 2003, 270, 313–321. [Google Scholar] [CrossRef] [PubMed]
  8. Karbstein, K.; Kösters, L.; Hodač, L.; Hofmann, M.; Hörandl, E.; Tomasello, S.; Wagner, N.D.; Emerson, B.C.; Albach, D.C.; Scheu, S.; et al. Species Delimitation 4.0: Integrative Taxonomy Meets Artificial Intelligence. Trends Ecol. Evol. 2024, 39, 771–784. [Google Scholar] [CrossRef] [PubMed]
  9. Bickford, D.; Lohman, D.J.; Sodhi, N.S.; Ng, P.K.L.; Meier, R.; Winker, K.; Ingram, K.K.; Das, I. Cryptic Species as a Window on Diversity and Conservation. Trends Ecol. Evol. 2007, 22, 148–155. [Google Scholar] [CrossRef]
  10. Wu, Y.-L.; Wang, H.-H.; He, L.-L.; Hua, B.-Z. Postembryonic Development and Morphological Variations of Larval Instars in the Scorpionfly Panorpa liui Hua (Mecoptera: Panorpidae). Arthropod Struct. Dev. 2025, 85, 101414. [Google Scholar] [CrossRef]
  11. Punzalan, D.; Hosken, D.J. Sexual Dimorphism: Why the Sexes Are (and Are Not) Different. Curr. Biol. 2010, 20, R972–R973. [Google Scholar] [CrossRef]
  12. Vinton, A.C.; Gascoigne, S.J.L.; Sepil, I.; Salguero-Gómez, R. Plasticity’s Role in Adaptive Evolution Depends on Environmental Change Components. Trends Ecol. Evol. 2022, 37, 1067–1078. [Google Scholar] [CrossRef]
  13. Adams, M.; Raadik, T.A.; Burridge, C.P.; Georges, A. Global Biodiversity Assessment and Hyper-Cryptic Species Complexes: More Than One Species of Elephant in the Room? Syst. Biol. 2014, 63, 518–533. [Google Scholar] [CrossRef]
  14. de León, G.P.-P.; Nadler, S.A. What We Don’t Recognize Can Hurt Us: A Plea for Awareness About Cryptic Species. J. Parasitol. 2010, 96, 453–464. [Google Scholar] [CrossRef] [PubMed]
  15. Jinbo, U.; Kato, T.; Ito, M. Current Progress in DNA Barcoding and Future Implications for Entomology. Entomol. Sci. 2011, 14, 107–124. [Google Scholar] [CrossRef]
  16. Watanabe, S.; Masamura, N.; Satoh, S.; Hirao, T. Investigating the Efficiency of DNA Barcoding in Insect Classification: A Review Study. Entomol. Appl. Sci. Lett. 2024, 11, 15–23. [Google Scholar] [CrossRef]
  17. Narváez-Vásquez, A.; Gaviria, J.; Vergara-Navarro, E.V.; Rivera-Pedroza, L.; Löhr, B. Ant (Hymenoptera: Formicidae) Species Diversity in Secondary Forest and Three Agricultural Land Uses of the Colombian Pacific Coast. Rev. Chil. De Entomol. 2021, 47, 441–458. [Google Scholar] [CrossRef]
  18. Arredondo, B.S.; Guerrero, R.J. The Ant Genus Nesomyrmex Wheeler (Formicidae, Myrmicinae) from the Threatened Colombian Tropical Dry Forest: Three New Species, a New Synonymy, and New Distributional Data. Zookeys 2025, 1232, 131–172. [Google Scholar] [CrossRef] [PubMed]
  19. Chen, C.; Chen, Z.; Xu, Z.; Fu, Q.; Fu, L. Two New Ant Species of the Genus Leptogenys (Hymenoptera, Formicidae) from Hainan, China, with a Key to the Known Chinese Species. Zookeys 2024, 1195, 199–217. [Google Scholar] [CrossRef]
  20. Fisher, B.L.; Smith, M.A. A Revision of Malagasy Species of Anochetus Mayr and Odontomachus Latreille (Hymenoptera: Formicidae). PLoS ONE 2008, 3, e1787. [Google Scholar] [CrossRef]
  21. Siddiqui, J.A.; Chen, Z.; Li, Q.; Deng, J.; Lin, X.; Huang, X. DNA Barcoding of Aphid-Associated Ants (Hymenoptera, Formicidae) in a Subtropical Area of Southern China. Zookeys 2019, 879, 117–136. [Google Scholar] [CrossRef]
  22. Chesnokova, S.V.; Vaulin, O.V.; Zhigulskaya, Z.A.; Novgorodova, T.A. Formica gagatoides Ruzsky, 1904, and Siberian F. kozlovi Dlussky, 1965 (Hymenoptera: Formicidae); Two or One Species? Diversity 2023, 15, 686. [Google Scholar] [CrossRef]
  23. Cardenas, C.R.; Luo, A.R.; Jones, T.H.; Schultz, T.R.; Adams, R.M.M. Using an Integrative Taxonomic Approach to Delimit a Sibling Species, Mycetomoellerius mikromelanos Sp. Nov. (Formicidae: Attini: Attina). PeerJ 2021, 9, e11622. [Google Scholar] [CrossRef] [PubMed]
  24. Klimeš, P.; Drescher, J.; Buchori, D.; Hidayat, P.; Nazarreta, R.; Potocký, P.; Rimandai, M.; Scheu, S.; Matos-Maraví, P. Uncovering Cryptic Diversity in the Enigmatic Ant Genus Overbeckia and Insights into the Phylogeny of Camponotini (Hymenoptera: Formicidae: Formicinae). Invertebr. Syst. 2022, 36, 557–579. [Google Scholar] [CrossRef]
  25. Ouellette, G.D.; Fisher, B.L.; Girman, D.J. Molecular Systematics of Basal Subfamilies of Ants Using 28S rRNA (Hymenoptera: Formicidae). Mol. Phylogenetics Evol. 2006, 40, 359–369. [Google Scholar] [CrossRef] [PubMed]
  26. Keck, F.; Altermatt, F. Management of DNA Reference Libraries for Barcoding and Metabarcoding Studies with the R Package Refdb. Mol. Ecol. Resour. 2023, 23, 511–518. [Google Scholar] [CrossRef] [PubMed]
  27. Nguyen, L.-T.; Schmidt, H.A.; von Haeseler, A.; Minh, B.Q. IQ-TREE: A Fast and Effective Stochastic Algorithm for Estimating Maximum-Likelihood Phylogenies. Mol. Biol. Evol. 2015, 32, 268–274. [Google Scholar] [CrossRef]
  28. Puillandre, N.; Brouillet, S.; Achaz, G. ASAP: Assemble Species by Automatic Partitioning. Mol. Ecol. Resour. 2021, 21, 609–620. [Google Scholar] [CrossRef]
  29. Zhou, T.; Xu, K.; Zhao, F.; Liu, W.; Li, L.; Hua, Z.; Zhou, X. Itol.Toolkit Accelerates Working with iTOL (Interactive Tree of Life) by an Automated Generation of Annotation Files. Bioinformatics 2023, 39, btad339. [Google Scholar] [CrossRef]
  30. Letunic, I.; Bork, P. Interactive Tree Of Life (iTOL) v5: An Online Tool for Phylogenetic Tree Display and Annotation. Nucleic Acids Res. 2021, 49, W293–W296. [Google Scholar] [CrossRef]
  31. Zhang, D.-X.; Hewitt, G.M. Assessment of the Universality and Utility of a Set of Conserved Mitochondrial COI Primers in Insects. Insect Mol. Biol. 1997, 6, 143–150. [Google Scholar] [CrossRef]
  32. Timm, V.F.; Gonçalves, L.T.; Valente, V.L.D.S.; Deprá, M. The Efficiency of the COI Gene as a DNA Barcode and an Overview of Orthoptera (Caelifera and Ensifera) Sequences in the BOLD System. Can. J. Zool. 2022, 100, 710–718. [Google Scholar] [CrossRef]
  33. Hebert, P.D.N.; Ratnasingham, S.; De Waard, J.R. Barcoding Animal Life: Cytochrome c Oxidase Subunit 1 Divergences among Closely Related Species. Proc. R. Soc. London Ser. B Biol. Sci. 2003, 270. [Google Scholar] [CrossRef] [PubMed]
  34. Twyford, A.D.; Beasley, J.; Barnes, I.; Allen, H.; Azzopardi, F.; Bell, D.; Blaxter, M.L.; Broad, G.; Campos-Dominguez, L.; Choonea, D.; et al. A DNA Barcoding Framework for Taxonomic Verification in the Darwin Tree of Life Project. Wellcome Open Res. 2024, 9, 339. [Google Scholar] [CrossRef] [PubMed]
  35. Folmer, O.; Black, M.; Hoeh, W.; Lutz, R.; Vrijenhoek, R. DNA Primers for Amplification of Mitochondrial Cytochrome c Oxidase Subunit I from Diverse Metazoan Invertebrates. Mol. Mar. Biol. Biotechnol. 1994, 3, 294–299. [Google Scholar] [PubMed]
  36. Zhang, H.; Bu, W. Exploring Large-Scale Patterns of Genetic Variation in the COI Gene among Insecta: Implications for DNA Barcoding and Threshold-Based Species Delimitation Studies. Insects 2022, 13, 425. [Google Scholar] [CrossRef] [PubMed]
  37. Rubinoff, D.; Cameron, S.; Will, K. A Genomic Perspective on the Shortcomings of Mitochondrial DNA for “Barcoding” Identification. J. Hered. 2006, 97, 581–594. [Google Scholar] [CrossRef] [PubMed]
  38. Deagle, B.E.; Jarman, S.N.; Coissac, E.; Pompanon, F.; Taberlet, P. DNA Metabarcoding and the Cytochrome c Oxidase Subunit I Marker: Not a Perfect Match. Biol. Lett. 2014, 10, 20140562. [Google Scholar] [CrossRef]
  39. Rasoamanana, N.; Fisher, B.L. A Taxonomic Revision of the Malagasy Endemic Subgenus Mayria of the Genus Camponotus (Hymenoptera, Formicidae) Based on Qualitative Morphology and Quantitative Morphometric Analyses. Zookeys 2022, 1081, 137–231. [Google Scholar] [CrossRef]
  40. Varela-Hernández, F.; Riquelme, F.; Guerrero, R.J. New Genus and Species of Ponerine Ant (Hymenoptera: Formicidae) from Mexican Amber. Hist. Biol. 2024, 37, 1134–1140. [Google Scholar] [CrossRef]
  41. Dos Santos-Neto, E.A.; Chaul, J.C.M.; Delabie, J.H.C. New Species and New Records of Strumigenys Smith, 1860 (Formicidae: Myrmicinae) from the Neotropical Schulzi Species Group. Taxonomy 2024, 4, 633–648. [Google Scholar] [CrossRef]
  42. Andersen, A.N.; Brassard, F.; Hoffmann, B.D. Unrecognised Ant Megadiversity in the Australian Monsoonal Tropics: The Melophorus hirsutipes Heterick, Castelanelli & Shattuck Species Group. Diversity 2023, 15, 892. [Google Scholar] [CrossRef]
  43. Csősz, S.; Alicata, A.; Báthori, F.; Galkowski, C.; Schifani, E.; Yusupov, Z.; Herczeg, G.; Prebus, M.M. Integrative Taxonomy Reveals Inflated Biodiversity in the European Temnothorax unifasciatus Complex (Hymenoptera: Formicidae). Zool. Scr. 2025, 54, 33–49. [Google Scholar] [CrossRef]
  44. Hazarika, H.N.; Khanikor, B. Integration of Morphological and Molecular Taxonomic Characters for Identification of Odontoponera denticulata (Hymenoptera: Formicidae: Ponerinae) with the Description of the Antennal Sensilla. Zool. Anz. 2021, 293, 89–100. [Google Scholar] [CrossRef]
  45. Kass, J.M.; Guénard, B.; Dudley, K.L.; Jenkins, C.N.; Azuma, F.; Fisher, B.L.; Parr, C.L.; Gibb, H.; Longino, J.T.; Ward, P.S.; et al. The Global Distribution of Known and Undiscovered Ant Biodiversity. Sci. Adv. 2022, 8, eabp9908. [Google Scholar] [CrossRef] [PubMed]
  46. Titley, M.A.; Snaddon, J.L.; Turner, E.C. Scientific Research on Animal Biodiversity Is Systematically Biased towards Vertebrates and Temperate Regions. PLoS ONE 2017, 12, e0189577. [Google Scholar] [CrossRef] [PubMed]
  47. Stocks, G.; Seales, L.; Paniagua, F.; Maehr, E.; Bruna, E.M. The Geographical and Institutional Distribution of Ecological Research in the Tropics. Biotropica 2008, 40, 397–404. [Google Scholar] [CrossRef]
  48. Zamani, A.; Pos, D.D.; Fric, Z.F.; Orfinger, A.B.; Scherz, M.D.; Bartoňová, A.S.; Gante, H.F. The Future of Zoological Taxonomy Is Integrative, Not Minimalist. Syst. Biodivers. 2022, 20, 1–14. [Google Scholar] [CrossRef]
  49. Ward, P.S. The Phylogeny and Evolution of Ants. Annu. Rev. Ecol. Evol. Syst. 2014, 45, 23–43. [Google Scholar] [CrossRef]
  50. Gui, Q.; Liu, C.; Du, D. Globalization of Science and International Scientific Collaboration: A Network Perspective. Geoforum 2019, 105, 1–12. [Google Scholar] [CrossRef]
  51. Hennemann, S.; Rybski, D.; Liefner, I. The Myth of Global Science Collaboration—Collaboration Patterns in Epistemic Communities. J. Informetr. 2012, 6, 217–225. [Google Scholar] [CrossRef]
  52. Virola-V, B.S.; Abrego, J.; Castillo, D.; Bonilla, E.; Gálvez, D. Who Is Working on Ant Physiology? There Is Room to Improve International Collaborations. Myrmecol. News 2022, 32, 115–125. [Google Scholar] [CrossRef]
  53. Zachos, F.E. (New) Species Concepts, Species Delimitation and the Inherent Limitations of Taxonomy. J. Genet. 2018, 97, 811–815. [Google Scholar] [CrossRef] [PubMed]
  54. Dayrat, B. Towards Integrative Taxonomy. Biol. J. Linn. Soc. 2005, 85, 407–415. [Google Scholar] [CrossRef]
  55. Mera-Rodríguez, D.; Fernández-Marín, H.; Rabeling, C. Phylogenomic Approach to Integrative Taxonomy Resolves a Century-old Taxonomic Puzzle and the Evolutionary History of the Acromyrmex octospinosus Species Complex. Syst. Entomol. 2025, 50, 469–494. [Google Scholar] [CrossRef]
  56. Wang, Y.; Nansen, C.; Zhang, Y. Integrative Insect Taxonomy Based on Morphology, Mitochondrial DNA, and Hyperspectral Reflectance Profiling: Integrative Insect Taxonomy of Bundera. Zool. J. Linn. Soc. 2016, 177, 378–394. [Google Scholar] [CrossRef]
  57. Schlick-Steiner, B.C.; Steiner, F.M.; Seifert, B.; Stauffer, C.; Christian, E.; Crozier, R.H. Integrative Taxonomy: A Multisource Approach to Exploring Biodiversity. Annu. Rev. Entomol. 2010, 55, 421–438. [Google Scholar] [CrossRef]
  58. Mayr, A.V.; Keller, A.; Peters, M.K.; Grimmer, G.; Krischke, B.; Geyer, M.; Schmitt, T.; Steffan-Dewenter, I. Cryptic Species and Hidden Ecological Interactions of Halictine Bees along an Elevational Gradient. Ecol. Evol. 2021, 11, 7700–7712. [Google Scholar] [CrossRef]
  59. LeMay, G.A.; Johnson, A.J.; Hulcr, J. Integrative Taxonomy Sheds Light on Species Boundaries and Relationships in the Inbred Haplodiploid Ambrosia Beetle Genus Xyleborus. Insect Syst. Evol. 2024, 56, 47–63. [Google Scholar] [CrossRef]
  60. Hew, Y.X.; Ya’cob, Z.; Adler, P.H.; Chen, C.D.; Lau, K.W.; Sofian-Azirun, M.; Muhammad-Rasul, A.H.; Putt, Q.Y.; Izwan-Anas, N.; Hadi, U.K.; et al. DNA Barcoding of Black Flies (Diptera: Simuliidae) in Indonesia. Parasites Vectors 2023, 16, 248. [Google Scholar] [CrossRef]
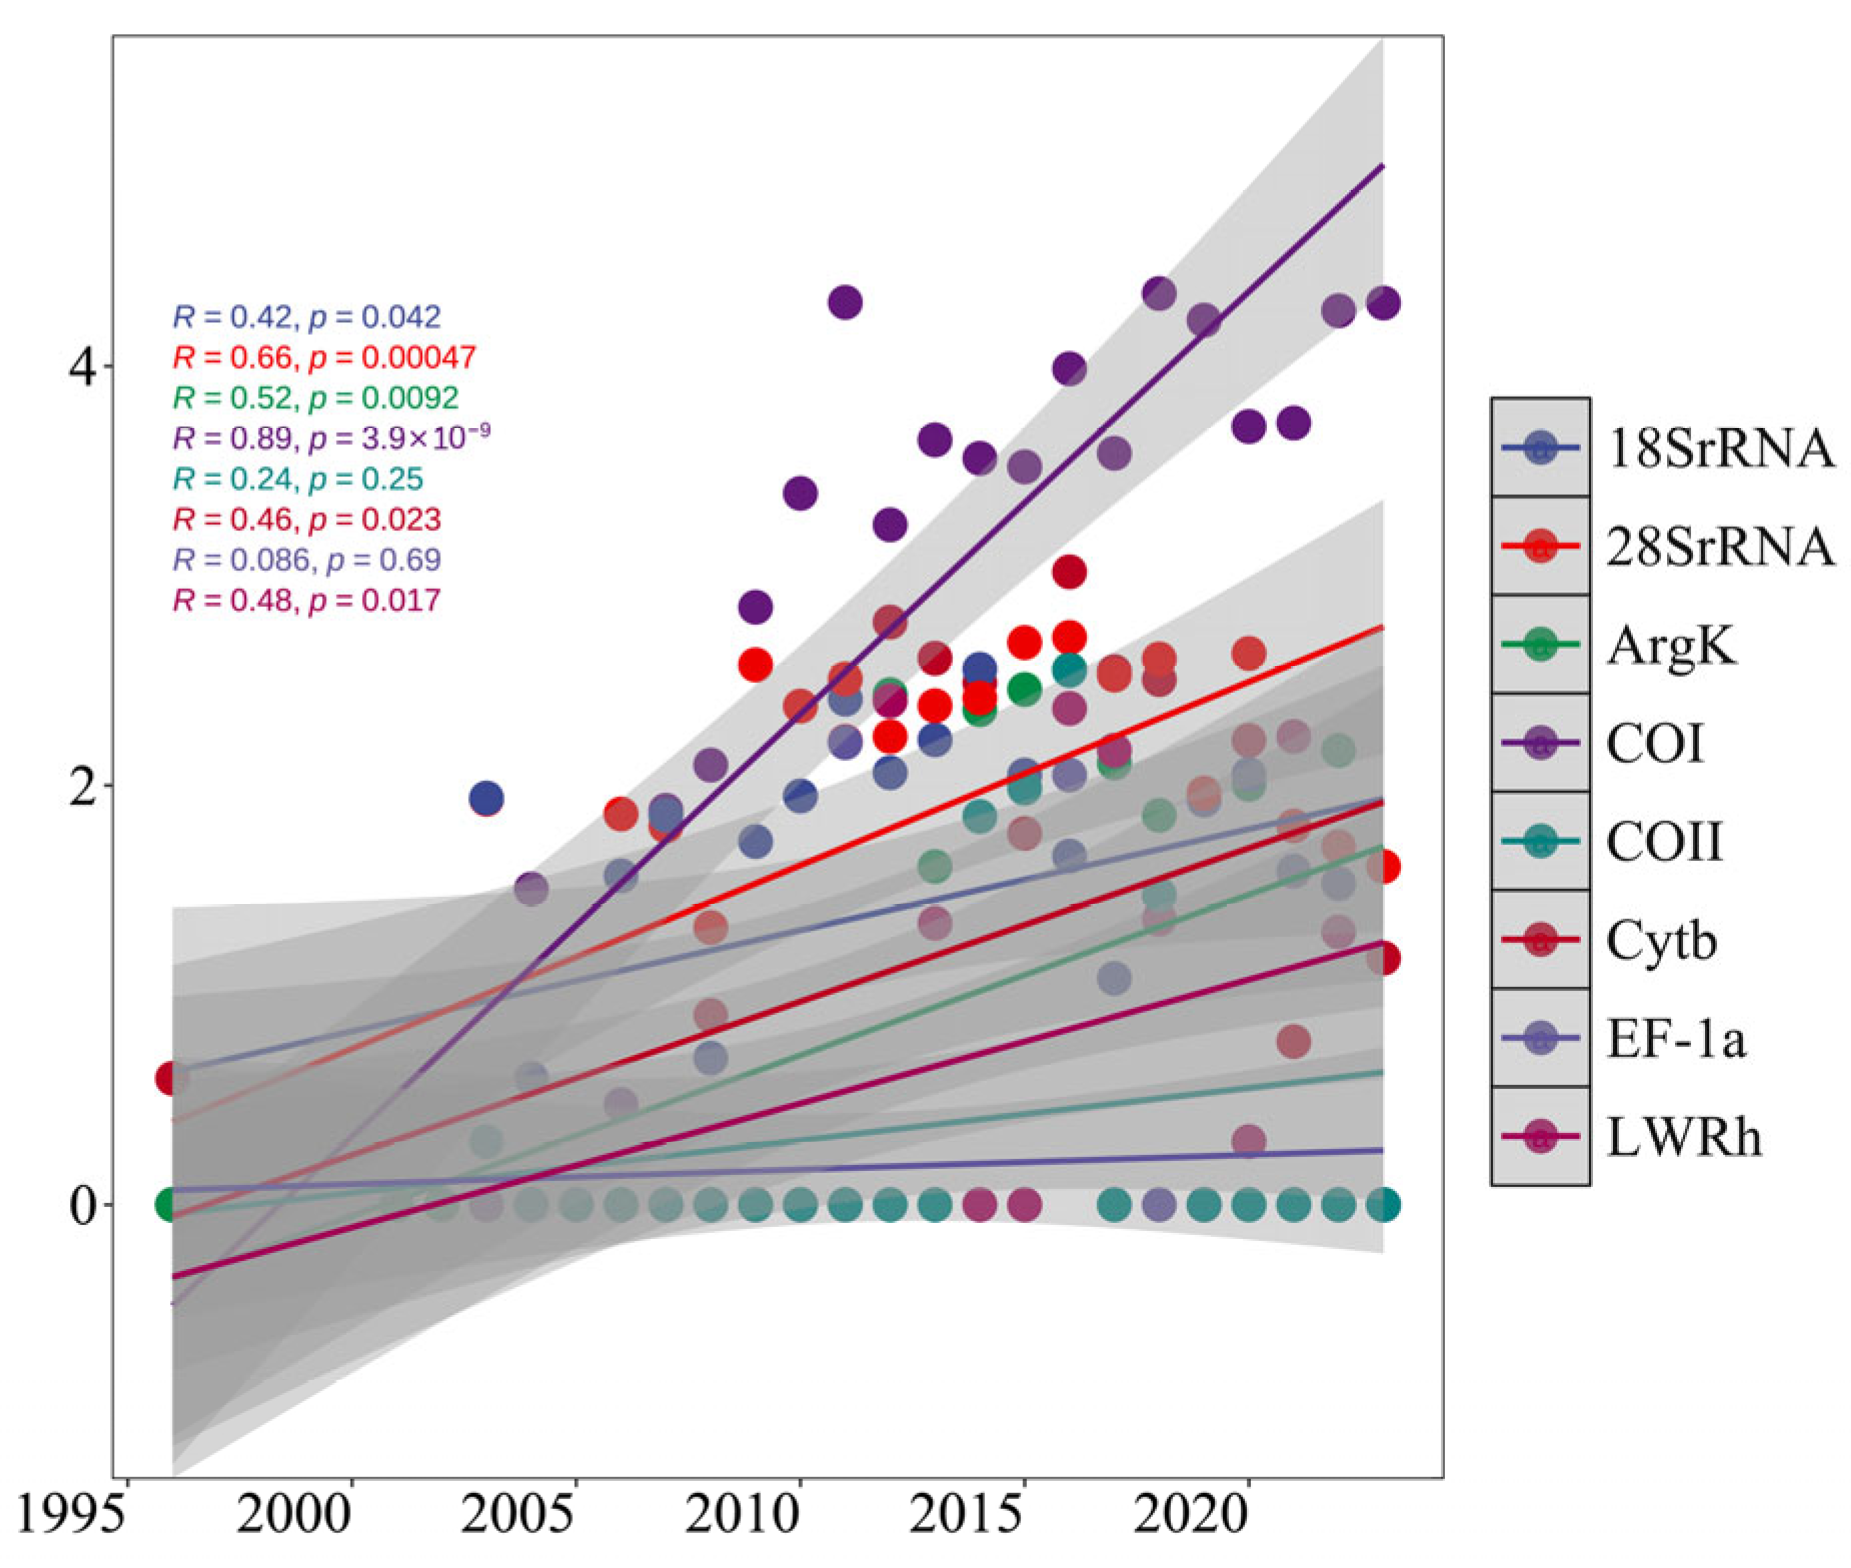
Figure 1. Temporal Trend of DNA Barcoding Gene Sequence Submissions for Formicidae Insects (1996–2023). Scatter points represent annual submission volumes for different genes. The solid line denotes the linear regression fit curve. The gray shaded area indicates the 95% confidence interval.
Diversity 17 00783 g001
Figure 2. Distribution of COI Gene Sequence Length. Horizontal bars represent the number of sequence submissions for each length interval.
Diversity 17 00783 g002
Figure 3. Spatial Distribution Pattern of COI Sequence Sampling Sites.
Diversity 17 00783 g003
Figure 4. National Distribution Pattern of COI Sequence Submission Volumes.
Diversity 17 00783 g004
Figure 5. COI sequences involving the top 10 subfamilies and their corresponding numbers of genera and species.
Diversity 17 00783 g005
Figure 6. COI sequences involving the top 10 genera and their corresponding numbers of species.
Diversity 17 00783 g006
Figure 7. The global collaboration network among countries in ant research. The thickness of the line connecting two countries corresponds to the level of cooperation between the countries to which the author belongs. Country codes: AR: Argentina, AT: Austria, AU: Australia, BE: Belgium, BR: Brazil, CA: Canada, CH: Switzerland, CI: Ivory Coast, CN: China, CO: Republic of Colombia, CZ: Czech Republic, DK: Denmark, EC: Ecuador, ES: Spain, FI: Finland, FR: France, GE: Georgia, HU: Hungary, IL: Israel, IN: India, IT: Italy, JP: Japan, KE: Republic of Kenya, KR: Korea, MX: Mexico, MY: Malaysia, NL: The Netherlands, NZ: New Zealand, PA: Panama, PL: Poland, PT: Portugal, RO: Romania, SA: Saudi Arabia, SE: Sweden, SG: Singapore, SN: Republic of Senegal, TH: Thailand, UK: United Kingdom, US: United States, and VN: Vietnam.
Diversity 17 00783 g007
Figure 8. Comparison of MOTU division of the COI sequence in Formicidae between traditional morphology and the ASAP method. consecutive identical colors represent the same MOTU defined based on COI sequences and morphological char-acteristics.
Diversity 17 00783 g008
Table 1. The number of each gene fragment and its distribution across genera, species, and undetermined (sp.) species.
GeneSequence No.Genus No.Species No.sp. No.
COI337,887270431732,444
28S rRNA45603041396784
Cytb350973623270
ArgK16352891004324
18S rRNA1357289961221
LWRh106134245162
COII5652716581
EF-1α112117828
Table 2. Species morphologically classified as the same MOTU were divided into different groups using the ASAP method.
SubfamilyGenus
MyrmicinaeAcromyrmex, Adelomyrmex, Aphaenogaster, Apterostigma, Atta, Cardiocondyla, Carebara, Cataulacus, Cephalotes, Crematogaster, Daceton, Eurhopalothrix, Hylomyrma, Lachnomyrmex, Leptothorax, Melissotarsus, Meranoplus, Messor, Monomorium, Mycetarotes, Mycocepurus, Myrmica, Myrmicaria, Myrmicocrypta, Nesomyrmex, Octostruma, Paratrachymyrmex, Pheidole, Pogonomyrmex, Rhopalothrix, Rogeria, Royidris, Sericomyrmex, Solenopsis, Stegomyrmex, Stenamma, Strumigenys, Syllophopsis, Temnothorax, Terataner, Tetramorium, Trachymyrmex, Trichomyrmex, Wasmannia
FormicinaeAcropyga, Brachymyrmex, Camponotus, Cataglyphis, Formica, Lasius, Myrmecocystus, Notostigma, Nylanderia, Opisthopsis, Paraparatrechina, Plagiolepis, Polyrhachis, Proformica, Pseudolasius
PonerinaeAnochetus, Dinoponera, Euponera, Hypoponera, Leptogenys, Neoponera, Odontomachus, Odontoponera, Pachycondyla, Platythyrea, Ponera
DolichoderinaeAzteca, Dolichoderus, Forelius, Iridomyrmex, Leptomyrmex, Linepithema, Tapinoma, Technomyrmex
DorylinaeDorylus, Eciton, Neivamyrmex, Nomamyrmex, Ooceraea,
EctatomminaeBoltonia, Ectatomma, Holcoponera, Poneracantha
AmblyoponinaeAmblyopone, Mystrium, Stigmatomma
MyrmeciinaeMyrmecia, Myrmecina
PrionopeltaPrionopelta
ProceratiinaeProceratium
PseudomyrmecinaePseudomyrmex
Disclaimer/Publisher’s Note: The statements, opinions and data contained in all publications are solely those of the individual author(s) and contributor(s) and not of MDPI and/or the editor(s). MDPI and/or the editor(s) disclaim responsibility for any injury to people or property resulting from any ideas, methods, instructions or products referred to in the content.